th place east, suite 350 st paul mn 55101-2147 enbridge
TRANSCRIPT

BEFORE THE MINNESOTA OFFICE OF ADMINISTRATIVE HEARINGS 600 North Robert Street
St. Paul MN 55101
FOR THE MINNESOTA PUBLIC UTILITIES COMMISSION 121 7th Place East, Suite 350
St Paul MN 55101-2147
IN THE MATTER OF THE APPLICATION OF ENBRIDGE ENERGY, LIMITED PARTERNSHIP FOR A CERTIFICATE OF NEED FOR THE LINE 3 REPLACEMENT PROJECT IN MINNESOTA FROM THE NORTH DAKOTA BORDER TO THE WISCONSIN BORDER
Docket No. PL9/CN-14-916 OAH Docket No. 65-2500-32764
DIRECT TESTIMONY OF DR. MARIE FAGAN
ON BEHALF OF
MINNESOTA DEPARTMENT OF COMMERCE DIVISION OF ENERGY RESOURCES
SEPTEMBER 11, 2017

DIRECT TESTIMONY OF DR. MARIE FAGAN IN THE MATTER OF THE APPLICATION OF ENBRIDGE ENERGY, LIMITED PARTERNSHIP FOR A CERTIFICATE OF NEED FOR THE LINE 3 REPLACEMENT PROJECT IN MINNESOTA FROM THE NORTH DAKOTA BORDER TO THE WISCONSIN BORDER MPUC Docket No. PL9/CN-14-916 OAH Docket No. 65-2500-32764 TABLE OF CONTENTS
I. INTRODUCTION AND QUALIFICATIONS ..............................................................................1
II. PURPOSE AND SCOPE .........................................................................................................1
III. REPORT ................................................................................................................................2

Fagan Direct / 1
I. INTRODUCTION AND QUALIFICATIONS 1
Q. Please state your name, occupation, and business address. 2
A. My name is Dr. Marie Fagan. I am Managing Consultant and Lead Economist at London 3
Economics International, LLC (LEI). My business address is 717 Atlantic Avenue, Suite 4
1A, Boston, MA 02111. 5
6
Q. What is your educational and professional background? 7
A. I completed a PhD in Economics from American University, in Washington, D.C., in 1995. 8
I graduated with a Bachelor of Science in Business Administration (Finance) in 1984 from 9
the University of Connecticut. I have over 25 years of experience in research and 10
consulting for the energy sector. Prior to 1996, I was employed as an economist with 11
the United States Energy Information Administration (EIA). From 1996 to 2014, I was 12
employed by Cambridge Energy Research Associates (CERA, now part of IHS, Inc.). Since 13
2014, I have been employed by LEI. My complete curriculum vitae is attached at DER Ex. 14
___ at MF-1 (Fagan Direct). 15
16
II. PURPOSE AND SCOPE 17
Q. What is the purpose of your testimony? 18
A. LEI was engaged to supplement DER’s expertise in broad oil market issues and support 19
DER’s review of Enbridge’s CN. LEI’s task was not to create an independent empirical 20
analysis or a stand-alone report that covers every issue relevant to the project, nor was 21
it to address every issue regarding crude oil and refined products in the region. Rather, 22

Fagan Direct / 2
LEI was tasked with providing a critical review of two expert reports filed in the docket 1
in support of Enbridge’s CN application. These reports are “Enbridge Line 3 2
Replacement Program Market Analysis” filed as Schedule 2 in “Direct Testimony of Neil 3
Earnest” in MPUC Docket No. PL9/CN-14-916, OAH Docket No. 65-2500-32764, January 4
31, 2017 and “Report on the Impact of Crude-by-Rail and the “No-Action” Scenario for 5
the Line 3 Project in Minnesota” filed as “Direct testimony of William Rennicke” 6
Schedule 2 in MPUC Docket No. PL9/CN-14-916, OAH Docket No. 65-2500-32764, 7
January 31, 2017. 8
9
III. REPORT 10
Q. Please provide the report you prepared for the Department. 11
A. My report is attached testimony as DER Ex. ___ at MF-1 (Fagan Direct), and, together, 12
comprise my Direct Testimony. 13
14
Q. Does this conclude your Direct Testimony? 15
A. Yes. 16
***Confidential work product, subject to attorney/client privilege ***
London Economics International LLC 1 contact: 717 Atlantic Avenue, Suite 1A Marie Fagan Boston, MA 02111 617-933-7205 www.londoneconomics.com [email protected]
Analysis of expert reports in Enbridge New Line 3 application for Certificate of Need
prepared for the Minnesota Department of Commerce by London Economics International LLC
September 8, 2017
London Economics International LLC (“LEI”) has been engaged to assist the Minnesota Department of Commerce, Division of Energy Resources (“DER”) in evaluating the application of Enbridge Energy, Limited Partnership (“Enbridge”) for a Certificate of Need (“CN”) for its New Line 3 project (Docket No. PL-9/CN-14-916, OAH Docket No. 65-2500-32764).
LEI was engaged to supplement DER’s expertise in broad oil market issues and support DER’s review of Enbridge’s CN. LEI’s task was not to create an independent empirical analysis or a stand-alone report that covers every issue relevant to the project, nor was it to address every issue regarding crude oil and refined products in the region. Rather, LEI was tasked with providing a critical review of two expert reports filed in the docket in support of Enbridge’s CN application. These reports are “Enbridge Line 3 Replacement Program Market Analysis” filed as Schedule 2 in “Direct Testimony of Neil Earnest” in MPUC Docket No. PL9/CN-14-916, OAH Docket No. 65-2500-32764, January 31, 2017 (referred to for brevity as the “Muse Stancil Report”); and ”Report on the Impact of Crude-by-Rail and the “No-Action” Scenario for the Line 3 Project in Minnesota” filed as “Direct testimony of William Rennicke” Schedule 2 in MPUC Docket No. PL9/CN-14-916, OAH Docket No. 65-2500-32764, January 31, 2017 (referred to for brevity as the “Oliver Wyman Report”). LEI’s review focused on topics within the two reports that relate to oil and refined product supply and demand, as well as pipeline infrastructure forecast assumptions. These issues are a subset of the multi-dimensional issues related to the DER’s recommendation on determination of need for the project.
Both the expert reports LEI examined made simplifying assumptions, some of which were unrealistic. For example, both reports assumed no new oil pipeline expansions from Western Canada would occur after 2021. Because of simplifying assumptions such as this, LEI cannot conclude with confidence that the forecasts in the reports are realistic. To the extent that the forecasts predict a dramatically lower use of rail transport for crude oil if the Enbridge Line 3 project goes forward, it is likely this is overstated. The reduced demand for rail transport could appear, but on a smaller scale than forecasted by the two expert reports. As to patterns of pipeline utilization, the forecast provided by the Muse Stancil Report could be one possible future, but Muse Stancil provided no other realistic scenarios to bracket the outlook.
Table of contents
1 EXECUTIVE SUMMARY ................................................................................................................................ 4
1.1 FORECASTS SHOULD ALLOW FOR A RANGE OF FUTURE OUTCOMES ............................................................... 4 1.2 LIMITATIONS OF EXPERT REPORTS FILED IN THE DOCKET .............................................................................. 4 1.3 IMPLICATIONS ............................................................................................................................................... 5
2 INTRODUCTION............................................................................................................................................. 7
2.1 THE ENBRIDGE LINE 3 PROJECT AND ITS PURPOSE ........................................................................................ 7

***Confidential work product, subject to attorney/client privilege ***
London Economics International LLC 2 contact: 717 Atlantic Avenue, Suite 1A Marie Fagan Boston, MA 02111 617-933-7205 www.londoneconomics.com [email protected]
2.2 LEI’S ROLE AND TASK .................................................................................................................................. 8
3 MINNESOTA AND THE ENBRIDGE LINE 3 PROJECT IN CONTEXT ............................................ 10
3.1 CRUDE OIL MARKETS ARE GLOBAL ............................................................................................................. 10 3.2 GLOBAL OIL PRICES INFLUENCE LOCAL OIL PRODUCTION ........................................................................... 11 3.3 REFINED PRODUCT MARKETS ARE CONTINENTAL ........................................................................................ 13 3.4 MINNESOTA AREA REFINERIES OPERATE AT HIGH LEVELS OF UTILIZATION ................................................. 14 3.5 EXPORTS INCREASINGLY LINK THE US TO GLOBAL REFINED PRODUCTS MARKETS ..................................... 15
4 EVALUATION OF EXPERT REPORTS ..................................................................................................... 17
4.1 MUSE STANCIL REPORT ASSUMPTIONS AND INPUTS .................................................................................... 17 4.1.1 Crude oil supply ..................................................................................................................................... 17 4.1.2 Refined product demand ........................................................................................................................ 17 4.1.3 Refinery capacity and crude oil demand ................................................................................................ 18 4.1.4 Transportation infrastructure ................................................................................................................ 18 4.1.5 Costs and prices ..................................................................................................................................... 19 4.1.6 Methodology behind the Muse Crude Oil Market Optimization Model ................................................. 19 4.1.7 Model results and key conclusions ........................................................................................................ 20
4.1.7.1 Projected rail shipments from Canada .......................................................................................................... 20 4.1.7.2 Implications for use of rail cars and trains .................................................................................................... 21 4.1.7.3 Projected utilization of the Enbridge Line 3 project ...................................................................................... 22
4.2 LIMITATIONS OF MUSE STANCIL REPORT ................................................................................................... 22 4.2.1 Oil supply assumptions and outlook ...................................................................................................... 22
4.2.1.1 A statement which is portrayed as a conclusion is really an assumption ...................................................... 22 4.2.1.2 Muse Stancil’s conclusions rely on a single supply outlook ......................................................................... 23
4.2.2 Demand assumptions and outlook ......................................................................................................... 25 4.2.2.1 The Muse Stancil refined product model does not impact the results ........................................................... 25
4.2.3 Bracketing the outlook for refined product demand .............................................................................. 26 4.2.3.1 Range of potential impact on gasoline consumption ..................................................................................... 28 4.2.3.2 Muse Stancil assumptions exclude the possibility of gluts ........................................................................... 30
4.2.4 Infrastructure assumptions .................................................................................................................... 30 4.2.5 Cost and price assumptions ................................................................................................................... 32
4.3 OLIVER WYMAN REPORT ASSUMPTIONS AND INPUTS ................................................................................. 32 4.3.1 Supply of crude oil and demand for refined products ............................................................................ 32 4.3.2 Demand by other commodities for rail service ...................................................................................... 33 4.3.3 Rail and other transport capacity .......................................................................................................... 33 4.3.4 Methodology .......................................................................................................................................... 33 4.3.5 Results and key conclusions ................................................................................................................... 34
4.4 LIMITATIONS OF OLIVER WYMAN REPORT ................................................................................................. 36 4.4.1 Supply, demand, and infrastructure assumptions face same limitations as Muse Stancil ..................... 36 4.4.2 Pipeline and rail may not be perfect substitutes .................................................................................... 36
5 IMPLICATIONS GIVEN LIMITATIONS OF EXPERT REPORTS ...................................................... 38
5.1 OIL SUPPLY OUTLOOKS SHOULD DEFINE RANGES, RATHER THAN SPECIFIC POINTS ..................................... 38 5.2 REFINED PRODUCT DEMAND PROJECTIONS SHOULD DEFINE RANGES .......................................................... 38 5.3 INFRASTRUCTURE ASSUMPTIONS SHOULD DEFINE RANGES ......................................................................... 39 5.4 THE IMPACT OF THE REPORTS’ LIMITATIONS ON FORECASTED USE OF RAIL ................................................ 39 5.5 THE IMPACT OF THE LIMITATIONS ON FORECASTED PIPELINE UTILIZATION ................................................. 39 5.6 CONCLUSION .............................................................................................................................................. 39
6 APPENDIX 1: OIL PRODUCTION AND GLOBAL OIL PRICE DRIVERS ....................................... 40
6.1 GEOPOLITICAL DRIVERS OF OIL PRICES ....................................................................................................... 41 6.2 RECENT POLICY CHANGES IN NORTH AMERICA .......................................................................................... 42
7 APPENDIX 2: CONSULTANT BACKGROUND AND EXPERIENCE ............................................... 44
***Confidential work product, subject to attorney/client privilege ***
London Economics International LLC 3 contact: 717 Atlantic Avenue, Suite 1A Marie Fagan Boston, MA 02111 617-933-7205 www.londoneconomics.com [email protected]
Table of figures
FIGURE 1. HIGH-LEVEL MAP OF ENBRIDGE LINE 3 PROJECT IN MINNESOTA .............................................................. 7 FIGURE 2. CRITERIA TO BE USED BY THE COMMISSION AND EVALUATED BY COMMERCE-DER FOR A PIPELINE
CERTIFICATE OF NEED, PART A (7853.0130 CRITERIA). ..................................................................................... 9 FIGURE 3. MAJOR OIL TRADE MOVEMENTS, 2016 (MILLION TONNES) ....................................................................... 11 FIGURE 4. NORTH DAKOTA WILLISTON BASIN OIL PRODUCTION AND OIL PRICES ................................................... 12 FIGURE 5. WESTERN CANADA OIL PRODUCTION AND OIL PRICE .............................................................................. 12 FIGURE 6. UNITED STATES PETROLEUM ADMINISTRATION FOR DEFENSE DISTRICTS (PADD) ............................... 13 FIGURE 7. WHOLESALE GASOLINE PRICES .................................................................................................................. 14 FIGURE 8. REFINERY UTILIZATION RATES ................................................................................................................... 14 FIGURE 9. US REFINED PRODUCT AND CRUDE OIL EXPORTS ...................................................................................... 15 FIGURE 10. US CRUDE OIL AND REFINED PRODUCT EXPORTS IN 2016, TOP 10 DESTINATIONS ................................. 16 FIGURE 11. MUSE STANCIL ASSUMPTIONS FOR WESTERN CANADIAN OIL PIPELINE CAPACITY ............................... 19 FIGURE 12. MUSE STANCIL OUTLOOKS FOR CANADIAN CRUDE OIL DELIVERIES TO US PADDS, AND HISTORICAL
EIA DATA ........................................................................................................................................................... 21 FIGURE 13. IMPLIED NUMBER OF LOADED TRAINS DAILY FROM CANADA IMPLIED BY MUSE STANCIL OUTLOOKS,
AND EIA HISTORY .............................................................................................................................................. 22 FIGURE 14. CAPP’S OUTLOOKS FOR WESTERN CANADIAN OIL, BY VINTAGE OF OUTLOOK .................................... 23 FIGURE 15. THREE NEB SCENARIOS FOR BRENT OIL PRICES, AND THE THREE CORRESPONDING OUTLOOKS FOR
WESTERN CANADIAN CRUDE OIL PRODUCTION ............................................................................................... 24 FIGURE 16. THREE EIA SCENARIOS FOR WTI OIL PRICES, AND THE THREE CORRESPONDING OUTLOOKS FOR
DAKOTAS AND ROCKIES OIL PRODUCTION ....................................................................................................... 25 FIGURE 17. CUMULATIVE SALES OF ELECTRIC VEHICLES (HEV AND PEV) IN THE US ............................................... 27 FIGURE 18. TARGET SALES OF ZERO-EMISSIONS VEHICLES BY STATES WITH MANDATES........................................... 27 FIGURE 19. THREE EIA OUTLOOKS FOR ALTERNATIVE-FUELED VEHICLES AND US GASOLINE CONSUMPTION ....... 28 FIGURE 20. IMPLIED OUTLOOK FOR GASOLINE DEMAND IN EIA’S THREE SCENARIOS .............................................. 29 FIGURE 21. PADD 2 REFINERS DO NOT HAVE MUCH ROOM TO REDUCE GASOLINE IMPORTS FROM PADD 3 ......... 30 FIGURE 22. CRUDE OIL PIPELINE CAPACITY ASSUMPTIONS IN MUSE STANCIL REPORT ............................................ 31 FIGURE 23. OLIVER WYMAN REPORT EXHIBIT II-2: WESTERN CANADIAN CRUDE OIL THAT WOULD MOVE
THROUGH MINNESOTA BY RAIL IN THE ABSENCE OF THE ENBRIDGE LINE 3 PROJECT (THOUSAND B/D) ....... 34 FIGURE 24. OLIVER WYMAN REPORT EXHIBIT II-3: ADDITIONAL CRUDE OIL TRAINS TRAVERSING MINNESOTA, IN
THE ABSENCE OF THE ENBRIDGE LINE 3 PROJECT .............................................................................................. 35 FIGURE 25. UNITED STATES AND SAUDI ARABIA OIL PRODUCTION .......................................................................... 40 FIGURE 26. US AND CHINA OIL IMPORTS ................................................................................................................... 41 FIGURE 27. MONTHLY PETROLEUM LIQUIDS PRODUCTION 2014-2017, SELECTED PRODUCERS ............................... 42

***Confidential work product, subject to attorney/client privilege ***
London Economics International LLC 4 contact: 717 Atlantic Avenue, Suite 1A Marie Fagan Boston, MA 02111 617-933-7205 www.londoneconomics.com [email protected]
1 Executive summary
A crude oil pipeline is a long-lived infrastructure asset. Decisions to move forward with such a project are determined not only by current supply and demand for crude oil and refined products, but also by expected future supply and demand as well. The “accuracy of forecasts of demand” used in the certificate of need (“CN”) application is a specific component of the criteria for evaluation of the CN application for an oil pipeline project in Minnesota.1
It is, by definition, not possible to determine in advance if an applicant’s forecast is accurate—accuracy can only be measured in retrospect. However, an applicant’s forecast can be evaluated as to whether it accounts for key uncertainties and reflects important underlying trends. If an applicant’s forecast encompasses a range of outcomes depending on how key uncertainties unfold, it could provide a useful set of “bookends” to frame the outcome of a pipeline expansion decision. If an applicant’s forecast depends on a narrow range of views of possible futures, or ignores important trends or drivers, it is less useful.
1.1 Forecasts should allow for a range of future outcomes
Investors in long-lived infrastructure, such as an oil pipeline, often use a range of outlooks for long-term planning. The purpose of creating a range of outcomes or “scenarios” is not to try to identify a future world which is the most likely, but to provide a range of future market conditions against which to test an investment decision. In the oil market, a key uncertainty is the future price of crude oil and its impact on oil supply. If a new or expanded oil pipeline is projected to be fully utilized in both a “high oil supply case” and a “low oil supply case” that would be a stronger argument in favor of moving forward with the investment than if it were projected to be fully utilized in only one of those cases.
1.2 Limitations of expert reports filed in the docket
Two expert reports were filed on behalf of Enbridge as part of the application.2 The first report, “Enbridge Line 3 Replacement Program Market Analysis” was provided by Neil Earnest, President of Muse Stancil, as Schedule 2 of Mr. Earnest’s direct testimony (we refer to this as the “Muse Stancil Report”). The second report, “Report on the Impact of Crude-by-Rail and the “No-Action” Scenario for the Line 3 Project in Minnesota” was provided by William Rennicke, Partner in Oliver Wyman, Inc as Mr. Rennicke’s direct testimony (we refer to this as the “Oliver Wyman
1 The Office of the Revisor of Statues, State of Minnesota. Public Utilities Commission. Chapter 7853. Part 7853.0130. <https://www.revisor.mn.gov/rules/?id=7853.0130>
2 Earnest, Neil. “Direct Testimony of Neil Earnest.” MPUC Docket No. PL9/CN-14-916, OAH Docket No. 65-2500-32764. Schedule 2: Muse Stancil “Enbridge Line 3 Replacement Program Market Analysis.” January 31, 2017; and Rennicke, William. Oliver Wyman, Inc. “Direct testimony of William Rennicke.” Schedule 2. MPUC Docket No. PL9/CN-14-916, OAH Docket No. 65-2500-32764. ”Report on the Impact of Crude-by-Rail and the “No-Action” Scenario for the Line 3 Project in Minnesota.” January 31, 2017.

***Confidential work product, subject to attorney/client privilege ***
London Economics International LLC 5 contact: 717 Atlantic Avenue, Suite 1A Marie Fagan Boston, MA 02111 617-933-7205 www.londoneconomics.com [email protected]
Report”). The conclusions of the Oliver Wyman Report are based on the results reported in the Muse Stancil Report, as discussed clearly in the Oliver Wyman Report.3
Both reports contain forecasts (also referred to as “outlooks” or “projections”), and both have limitations. Neither of the two reports considers more than one potential future for oil supply, demand, or infrastructure. Both reports rely on a single outlook for annual crude oil supply and no specific outlook at all for refined product demand. Neither report allows for more than one potential future for infrastructure development; for example, they both assume that there will be no pipeline expansions for 14 years (from 2021 to 2035) in Canada, which is inconsistent with historical records of expansions.
Neither report recognizes the potential for a dynamic relationship over time between transportation and supply, in spite of the lengthy time-frame (2019-2035) of the outlooks. Adding more capacity (such as the Enbridge Line 3 project) could allow more oil supply to be developed profitably at any given global oil price. This means that oil production and supply from Canada could increase, and the projected reduction in rail transport of crude oil forecasted by both reports may not materialize. Neither report allowed for this possibility.
1.3 Implications
Both reports make the same assumption that there will be no pipeline expansions out of Western Canada for 14 years. This assumption probably overstates the forecasted need for crude-by-rail. While the additional pipeline capacity represented by the Enbridge Line 3 project could result in less need for rail, the assumptions used in the expert reports may overestimate the future crude-by-rail shipments in the event that the project does not go forward, and thus overstate the avoidance of crude-by-rail if the project does go forward.
The implications of the reports’ assumptions for supply, demand, and pipeline capacity, and the forecasted utilization of the Enbridge Line 3 project, are not as conclusive in terms of their support for “need” for the project, for two important reasons:
• Minnesota district (Minnesota, North Dakota, South Dakota, and Wisconsin) refineries as a group have been operating at high levels of utilization, which indicates that they are not short of physical supplies of crude oil, and also that they have little room to increase total crude runs. Thus, the whole proposed incremental increase in capacity of 370 thousand barrels per day (“b/d”) for the Enbridge Line 3 project is not likely to be used in Minnesota.
• Minnesota demand for refined products appears unlikely to increase in the long term, based on outlooks we will show in Section 4. Minnesota and its neighbors are generally not short of physical supplies of refined products, and are not likely to be short of supplies in the future (except for temporary interruptions). Again, this implies the incremental pipeline capacity would not be wholly used to meet local refined product demand.
3 Oliver Wyman Report. Pp. 10-11.

***Confidential work product, subject to attorney/client privilege ***
London Economics International LLC 6 contact: 717 Atlantic Avenue, Suite 1A Marie Fagan Boston, MA 02111 617-933-7205 www.londoneconomics.com [email protected]
However, the Enbridge Line 3 project could make it easier and perhaps less expensive (i.e., more “efficient”) for Minnesota district refineries to access attractive grades of crude oil, all other things equal. Also, refined product markets are highly integrated across the US, and crude oil markets are integrated globally. Thus additional crude pipeline capacity such as the Enbridge Line 3 project could contribute to slightly wider availability of crude oil and therefore somewhat lower prices of crude oil and refined products (all other things equal) generally across the US, and by implication, for Minnesota and its neighbors.

***Confidential work product, subject to attorney/client privilege ***
London Economics International LLC 7 contact: 717 Atlantic Avenue, Suite 1A Marie Fagan Boston, MA 02111 617-933-7205 www.londoneconomics.com [email protected]
2 Introduction
2.1 The Enbridge Line 3 project and its purpose
The Enbridge Line 3 project is an interstate crude oil pipeline which would cross Minnesota, partly on a greenfield route and partly on an existing right of way. The pipeline is intended to replace and expand the existing Line 3, which would be de-activated. The existing Line 3 has been running below its initial design capacity, owing to physical issues with the line. Enbridge has said the project will have an annual average capacity of about 760 thousand b/d, compared to the 390 thousand b/d that can be transported by the line in its current condition. Enbridge notes that the project will be engineered to carry both heavy and light crude oil, to service the Bakken region in North Dakota, and to transport heavy oil from Alberta (see Figure 1).
Figure 1. High-level map of Enbridge Line 3 project in Minnesota
Source: Enbridge
More specifically, as Paul Eberth’s testimony for Enbridge Energy notes, “[t]he Line 3 Replacement Program…will replace the existing Line 3 pipeline from Alberta, Canada, to Superior, Wisconsin…This includes the replacement of approximately 282 miles of the existing 34-inch diameter Line 3 pipeline with approximately 340 miles of 36-inch diameter pipeline and associated facilities between the North Dakota/Minnesota border and the Minnesota/Wisconsin border…The proposed replacement pipeline will serve the same purpose and need as the existing Line 3, which is the transportation of crude oil from the US and Canada to Enbridge’s Clearbrook Terminal near Clearbrook, Minnesota, and to the Superior Terminal Facility near Superior,

***Confidential work product, subject to attorney/client privilege ***
London Economics International LLC 8 contact: 717 Atlantic Avenue, Suite 1A Marie Fagan Boston, MA 02111 617-933-7205 www.londoneconomics.com [email protected]
Wisconsin. The replacement pipeline serves the same markets and transports the same products as the existing Line 3 has done throughout its operating history.”4
2.2 LEI’s role and task
LEI was engaged in this case to examine issues related to oil markets. LEI’s overall task was not to create an independent empirical analysis, or a stand-alone report that covers every issue relevant to the project and its potential impacts on wide aspects of Minnesota’s economy, nor for every issue regarding crude oil and refined products in the region.
Rather, LEI was tasked with providing a critical review of two expert reports (and related information provided in response to data requests) filed on behalf of Enbridge, with a focus on high-level issues related to supply and demand for oil and petroleum products in Minnesota and related regions. LEI was not asked to examine the impacts of detailed aspects of the project, such as alternative routes, or alternative technical specifications of the proposed project.
LEI’s analysis relates to point A(1) of the criteria to be used by the Commission to evaluate a pipeline CN application (see Figure 2). DER considers the impact on the applicant, the applicant’s customers, the people of Minnesota and those of neighboring states, in the context of the adequacy, reliability, and efficiency of energy supply. LEI interprets the terms “adequacy” and “reliability” to refer to quantities and deliverability to customers of crude oil, refined products, or transportation. LEI interprets “efficiency” to refer to prices or costs for oil, refined products, or transportation. LEI understands that all three criteria are important to DER’s decision.
The two expert reports LEI reviewed and which are discussed in this report are:
1) Muse Stancil Report: Neil Earnest, “Enbridge Line 3 Replacement Program Market Analysis” filed as Schedule 2 in “Direct Testimony of Neil Earnest” in MPUC Docket No. PL9/CN-14-916, OAH Docket No. 65-2500-32764, January 31, 2017; and
2) Oliver Wyman Report: William Rennicke, “Report on the Impact of Crude-by-Rail and the “No-Action” Scenario for the Line 3 Project in Minnesota,” filed as “Direct Testimony of William Rennicke” Schedule 2, in MPUC Docket No. PL9/CN-14-916, OAH Docket No. 65-2500-32764, January 31, 2017.
LEI’s discussion and analysis focuses on the reports’ forecasts for oil supply, oil demand, and pipeline infrastructure, and the implications of these forecasts.
4 Eberth, Paul. “Direct testimony of Paul Eberth on behalf of Enbridge Energy.” MPUC Docket No. PL9/CN-14-916 and PPL-15-137, OAH Docket No. 65-2500-32764 and 65-2500-33377. January 31, 2017.

***Confidential work product, subject to attorney/client privilege ***
London Economics International LLC 9 contact: 717 Atlantic Avenue, Suite 1A Marie Fagan Boston, MA 02111 617-933-7205 www.londoneconomics.com [email protected]
Figure 2. Criteria to be used by the Commission and evaluated by Commerce-DER for a pipeline Certificate of Need, Part A (7853.0130 Criteria).5
A certificate of need shall be granted to the applicant if it is determined that:
A. the probable result of denial would adversely affect the future adequacy, reliability, or
efficiency of energy supply to the applicant, to the applicant's customers, or to the people of
Minnesota and neighboring states, considering:
(1) the accuracy of the applicant's forecast of demand for the type of energy that would
be supplied by the proposed facility;
(2) the effects of the applicant's existing or expected conservation programs and state
and federal conservation programs;
(3) the effects of the applicant's promotional practices that may have given rise to the
increase in the energy demand, particularly promotional practices that have occurred since
1974;
(4) the ability of current facilities and planned facilities not requiring certificates of need,
and to which the applicant has access, to meet the future demand; and
(5) the effect of the proposed facility, or a suitable modification of it, in making efficient
use of resources; (sic)
5 The Office of the Revisor of Statues, State of Minnesota. Public Utilities Commission. Chapter 7853. Part 7853.0130. <https://www.revisor.mn.gov/rules/?id=7853.0130>

***Confidential work product, subject to attorney/client privilege ***
London Economics International LLC 10 contact: 717 Atlantic Avenue, Suite 1A Marie Fagan Boston, MA 02111 617-933-7205 www.londoneconomics.com [email protected]
3 Minnesota and the Enbridge Line 3 project in context
At a proposed 760 thousand b/d, the Enbridge Line 3 project includes 370 thousand b/d which is incremental to existing capacity. This increment amounts to about 4% of US crude oil production of 8.8 million b/d in year 2016.6 The proposed project is a fairly small component of a large and integrated crude oil and downstream product supply system—not just the system owned by Enbridge, but the whole oil production and refining complex in North America and beyond. Global and continental trends, as well as local issues such as nearby supply, demand, and availability of transportation can impact prices of crude oil to refineries, and prices of refined products to customers.
3.1 Crude oil markets are global
Compared to its value, crude oil is cheap and easy to transport by tanker ships. Even if shipped thousands of miles, imported crude oil remains economically competitive. This economic competitiveness is evident in the very high share of global trade in crude oil compared to oil consumption. In 2016, global trade in crude oil reached 42.4 million b/d, or 2,117 million tonnes (see Figure 3). This global trade accounted for 44% of total global consumption of crude oil of 96.5 million b/d in 2016.7
Because the oil market is integrated globally, events that impact supply or demand in one part of the world impact crude oil prices all over the world. This was evident most recently in 2014/15, when surging oil production from the US caused global oil prices to collapse from about $100 per barrel (“bbl”) in the summer of 2014 to below $40 per bbl in early 2016 (see Appendix 1 for more discussion on drivers of global oil prices).8
6 Energy Information Administration (“EIA”). “Petroleum and other liquids.” <https://www.eia.gov/dnav/pet/PET_CRD_CRPDN_ADC_MBBLPD_A.htm>. The 8.8 million b/d is crude oil only (it excludes lease condensate and other liquids).
7 BP Statistical Review of World Energy, 2017. <http://www.bp.com/en/global/corporate/energy-economics/statistical-review-of-world-energy/oil/oil-trade-movements.html>
8 EIA. “Petroleum and other liquids.” <https://www.eia.gov/dnav/pet/hist/LeafHandler.ashx?n=PET&s=RWTC&f=D>

***Confidential work product, subject to attorney/client privilege ***
London Economics International LLC 11 contact: 717 Atlantic Avenue, Suite 1A Marie Fagan Boston, MA 02111 617-933-7205 www.londoneconomics.com [email protected]
Figure 3. Major oil trade movements, 2016 (million tonnes)
Source: BP Statistical Review of World Energy 2017. “Oil Trade 2015 and 2016.” <http://www.bp.com/en/global/corporate/energy-economics/statistical-review-of-world-energy/oil/oil-trade-movements.html> Note: One (metric) tonne is equal to about 7.33 barrels of oil.
3.2 Global oil prices influence local oil production
Crude oil production from both the Bakken shale in North Dakota and from Canada is a significant component of the demand for pipeline and rail transportation through Minnesota. Both these regions have reacted to changes in global oil prices.
North Dakota production declined in the wake of the 2015 oil price collapse. Production from the Williston Basin (the location of the Bakken shale) had reached 1,184 thousand b/d in 2015. After the steep decline in oil prices, the average for 2017 (through May 2017) has been about 1,039 thousand b/d (see Figure 4).

***Confidential work product, subject to attorney/client privilege ***
London Economics International LLC 12 contact: 717 Atlantic Avenue, Suite 1A Marie Fagan Boston, MA 02111 617-933-7205 www.londoneconomics.com [email protected]
Figure 4. North Dakota Williston basin oil production and oil prices
Source: North Dakota Pipeline Authority. <https://northdakotapipelines.com/us-williston-basin-oil-production> and EIA, domestic crude oil first purchase prices by Area, and EIA spot prices for crude oil and petroleum products. Note: “WTI” is West Texas Intermediate crude, a global benchmark crude oil price, priced at Cushing, Oklahoma.
Western Canadian oil production did not decline with the collapse in oil prices, but its rate of growth slowed compared with previous years (see Figure 5).
Figure 5. Western Canada oil production and oil price
Source: Alberta Economic Dashboard. <http://economicdashboard.alberta.ca/OilPrice/>; National Energy Board. Canada's Energy Future 2016: Energy Supply and Demand. Note: “WCS” is Western Canadian Select, a heavy oil blend comprised of bitumen, conventional oil, synthetic crude oil and diluent, priced at Hardisty, Alberta.
With lower oil prices, oil producers have lower cash flows and usually cut back investment in response. The Canadian Association of Petroleum Producers (“CAPP”) reported that capital

***Confidential work product, subject to attorney/client privilege ***
London Economics International LLC 13 contact: 717 Atlantic Avenue, Suite 1A Marie Fagan Boston, MA 02111 617-933-7205 www.londoneconomics.com [email protected]
investment in the oil sands declined dramatically, from CAD 34 billion in 2014 to CAD 17 billion in 2016.9 If producers expect that prices will stay low, then fewer new wells or new mining development projects will be viewed as economically attractive, and future investment plans will be cut back, even if current cash flows might be adequate. This reduces the amount of oil that will be available in the future.
3.3 Refined product markets are continental
The markets for refined products are well-integrated across North America. By integrated, we mean that, like crude oil, refined products can flow freely from one location to another in response to price signals. In the US, refined product regions which are commonly used are the “Petroleum Administration for Defense Districts” (“PADDs”) (see Figure 6). PADDs are an administrative concept, developed by the federal government during World War II to help manage fuel rationing. Thus, PADDs do not represent physical boundaries between markets, and the price data shows that, for the most part, the US is a single, integrated market for refined products such as gasoline. This is evident in looking at the price of refined products across US PAD Districts. Wholesale gasoline prices in PADD 1, PADD 2, PADD 3, and PADD 4, track one another closely (see Figure 7).
Figure 6. United States Petroleum Administration for Defense Districts (PADD)
Source: EIA
The exception is PADD 5, the West Coast region, which includes California which has specific rules for gasoline that make it more expensive than other markets. The wholesale price of gasoline tracks closely within PADD 2, too, averaging only 4% lower in Minnesota than in Illinois. This close tracking of prices indicates that PADD 2 is internally a single, integrated market. In such markets, when a local price spike occurs – for example, if a
9 Canadian Association of Petroleum Producers. Crude Oil Forecast, Markets and Transportation. 2017. P. 2.

***Confidential work product, subject to attorney/client privilege ***
London Economics International LLC 14 contact: 717 Atlantic Avenue, Suite 1A Marie Fagan Boston, MA 02111 617-933-7205 www.londoneconomics.com [email protected]
refinery or pipeline is unavailable — the spike will be short-lived because supplies can be brought in from alternative refineries or using other transportation modes.
Figure 7. Wholesale gasoline prices
Source: EIA
3.4 Minnesota area refineries operate at high levels of utilization
Within PADD 2, the Energy Information Administration (“EIA”) defines a refining district that includes Minnesota, North Dakota, South Dakota, and Wisconsin as the “Minnesota district.” The Minnesota district tends to run at higher levels of refinery utilization – close to 100% for the past few years – than the rest of PADD 2 or the US on average (see Figure 8). Capacity utilization levels near 100% demonstrate that refiners are not only operating efficiently, they are processing all the crude they possibly can (though there could be room to adjust the crude oil diet to change the mix various grades of crude). This implies that crude oil for the Minnesota district has not been in short supply compared to refining capacity, though the mix of crude oil supplies might not be perfectly optimal.
Figure 8. Refinery utilization rates
Source: EIA

***Confidential work product, subject to attorney/client privilege ***
London Economics International LLC 15 contact: 717 Atlantic Avenue, Suite 1A Marie Fagan Boston, MA 02111 617-933-7205 www.londoneconomics.com [email protected]
3.5 Exports increasingly link the US to global refined products markets
The US exports refined products, and these exports have risen over time, which means the US is increasingly linked to the global refined products market. US exports of refined products have been growing dramatically since about 2004/05 when domestic demand levelled off (see Figure 9). US refined product exports have been much higher than crude oil exports, which had been banned (except to Canada) until the end of 2015.
Figure 9. US refined product and crude oil exports
Source: EIA Note: 2017 is monthly average through May 2017.
The US exports crude oil and refined products to a variety of countries (see Figure 10). Most US oil and product exports have been destined for North America, including Mexico. This supports the continental integration of oil and refined product markets.

***Confidential work product, subject to attorney/client privilege ***
London Economics International LLC 16 contact: 717 Atlantic Avenue, Suite 1A Marie Fagan Boston, MA 02111 617-933-7205 www.londoneconomics.com [email protected]
Figure 10. US crude oil and refined product exports in 2016, top 10 destinations
Crude oil exports Refined product exports
Source: EIA
With this broad perspective, we turn to evaluation of the two expert reports.

***Confidential work product, subject to attorney/client privilege ***
London Economics International LLC 17 contact: 717 Atlantic Avenue, Suite 1A Marie Fagan Boston, MA 02111 617-933-7205 www.londoneconomics.com [email protected]
4 Evaluation of expert reports
4.1 Muse Stancil report assumptions and inputs
The purpose of the Muse Stancil Report was to forecast the utilization of the Enbridge Mainline System “to help determine if there is sufficient need for the restored pipeline capacity to support construction of the L3R (Enbridge Line 3) project.”10
4.1.1 Crude oil supply
The Muse Stancil analysis relied on the Canadian Association of Petroleum Producer 2016 outlook (referred to here as “CAPP vintage 2016” for brevity) for the forecasted supply of oil. The Muse Stancil Report notes that CAPP distinguishes between production and supply, in that “[a] production forecast provides the volume of oil expected to be extracted from the underground crude oil reservoirs, whereas a supply forecast is projecting the volume of crude oil that will be supplied to the market.”11 In Western Canada, the Muse Stancil Report explains, for a number of reasons the volumes of individual grades of crude oil (light versus heavy, sweet versus sour) produced can differ from the volumes of individual grades supplied to the market. Based on this, the Muse Stancil Report made the distinction between “oil production” and “oil supply.” Oil production comes out of the ground; supply is what gets delivered to the market.
This supply outlook (for 2016-2035) is shown in Figures 11 and 55 of the Muse Stancil Report, with the supporting data on page 105. The outlook for heavy and light crude oil supply is shown net of crude assumed to be consumed in refineries in Western Canada.
The Report notes that inputs for US supply by “major production area” are based on EIA’s latest Annual Energy Outlook (“AEO”) production forecast,12 except for North Dakota for which Muse Stancil relied on “the most recent forecast from the North Dakota Pipeline Authority (“NDPA”).”
4.1.2 Refined product demand
An outlook for demand for refined products by end-users (in Minnesota, PADD II, or at any other level of aggregation) is not an element of the Muse Stancil analysis. Nothing in the assumptions or the model allows consumer demand for refined products to increase or decrease. Thus, it appears that the analysis implicitly assumes that demand for any individual refined product and for refined products as a whole is unchanged from current trends, despite the long time scale of the forecast (2019-2035). The model seems to allow unconstrained exports of refined products from PADD 2, and from the US overall.
10 Earnest, Neil. “Direct Testimony of Neil Earnest.” MPUC Docket No. PL9/CN-14-916, OAH Docket No. 65-2500-32764. January 31, 2017. P. 3
11 Muse Stancil. P. 42.
12 Muse Stancil. P. 61.

***Confidential work product, subject to attorney/client privilege ***
London Economics International LLC 18 contact: 717 Atlantic Avenue, Suite 1A Marie Fagan Boston, MA 02111 617-933-7205 www.londoneconomics.com [email protected]
4.1.3 Refinery capacity and crude oil demand
Rather than demand for refined products, the model is driven by demand for crude oil by refineries, which is used as an input for the forecast. For the US, explicit assumptions for refinery capacity are shown on pages 48-55 of the Muse Stancil Report. The assumptions allow for crude oil exports, as the model can allocate crude to modelled refineries in Northeast Asia, Europe, and India (as well as Canada and the US).13 It does not appear to include potential crude exports to refineries in Mexico or Latin America.
4.1.4 Transportation infrastructure
The Muse Stancil model relies on infrastructure data that describes the capacity of pipelines, barge routes, and rail infrastructure.14 It specifies pipeline, rail loading and unloading capacity, barge, and refinery constraints. It assumes oil tanker car capacities of 660 bbls for Canadian light crude, 540 bbls for Canadian heavy crude, and 700 bbls for Bakken crude.15 For potential exports from the US Gulf Coast, the model incorporates costs and capacity for tanker ships.16
Muse Stancil models the US crude oil pipeline network “which exists today, plus all non-Enbridge pipelines in development that are reasonably expected, by Muse, to proceed to completion.”17 The total assumed pipeline capacity out of Western Canada is provided numerically for two outlooks (one assuming the Enbridge Line 3 project goes forward, and one assuming it does not) on pages 105 and 133 of the Muse Stancil Report. LEI used the data provided on those pages to create Figure 11 below, for the convenience of seeing both assumptions for pipeline capacity in one figure. The difference between the assumptions is based on Muse Stancil’s assumed incremental capacity of 370 thousand b/d for the Enbridge Line 3 project, adjusted by an assumed 92% utilization rate (provided by Enbridge) for the project, to arrive at 340 thousand b/d.18
13 Muse Stancil. P. 59.
14 Muse Stancil. P. 60.
15 Muse Stancil. P. 67.
16 Muse Stancil. P. 67.
17 Muse Stancil. P. 61.
18 Muse Stancil. P. 63.

***Confidential work product, subject to attorney/client privilege ***
London Economics International LLC 19 contact: 717 Atlantic Avenue, Suite 1A Marie Fagan Boston, MA 02111 617-933-7205 www.londoneconomics.com [email protected]
Figure 11. Muse Stancil assumptions for Western Canadian oil pipeline capacity
Source: Muse Stancil. P. 105, 133
The 590 thousand b/d increase capacity in 2021 in both outlooks is the Kinder Morgan Trans Mountain Expansion project from Alberta to British Columbia. Other potential expansions out of Western Canada, namely Northern Gateway (from Alberta to BC), Keystone XL (Alberta to Cushing, OK), and Energy East (Alberta to New Brunswick) are assumed by Muse Stancil not to go forward—they are excluded from the outlook.19 The model also includes existing pipeline capacity and capacity expansions downstream of Minnesota.20
4.1.5 Costs and prices
Transportation costs and price assumptions include pipeline toll rates, other transport costs, and volume commitments.
4.1.6 Methodology behind the Muse Crude Oil Market Optimization Model
The Muse Stancil “Crude Oil Market Optimization Model” is used to project future crude oil pipeline usage. LEI’s understanding of the model is that it is designed to predict the flow of crude oil (not refined products) to various markets.21 In turn, these markets are represented by refineries in North America and the other countries noted previously. The crude flows are arrived at using
19 Muse Stancil. P. 68.
20 Muse Stancil. P. 64.
21 Muse Stancil, P. 59.

***Confidential work product, subject to attorney/client privilege ***
London Economics International LLC 20 contact: 717 Atlantic Avenue, Suite 1A Marie Fagan Boston, MA 02111 617-933-7205 www.londoneconomics.com [email protected]
a set of mathematical equations that are designed to optimize (i.e., maximize) the price of crude oil for the crude oil producer. The model solves for the highest price of crude at each supply region, given transportation costs, transport infrastructure constraints, and the “refining value” of the crude oil (the price a refiner is willing to pay for crude).
The refining value of crude oil is a key driver of the model. The Muse Stancil Report explains that the refining value of various crude oil grades at the refinery gate is “expressed as a function of crude input” using the AspenTech PIMS ® refinery modeling system.22 The input crude oil prices represent a variety of crudes: Louisiana Light Sweet, Maya (Mexican heavy crude) delivered to the Gulf Coast; Tapis (Malaysian light crude) delivered to Singapore; and Arab Heavy delivered to Singapore.23
The Muse Stancil model does not incorporate a wellhead cost of oil production, or a full-cycle cost (production plus exploration, development, and return on investment) of crude oil.
4.1.7 Model results and key conclusions
4.1.7.1 Projected rail shipments from Canada
An important result of the Muse Stancil analysis is that rail shipments from Canada would be avoided if the Enbridge Line 3 project goes forward. The Muse Stancil Report forecasts that Canadian rail shipments (of a low of about 110 thousand b/d in 2021, and high of 510 thousand b/d in 2031) to PADDs 1, 2, and 3 would be avoided if the Enbridge Line 3 project goes forward. These rail shipments do not include all crude by rail from North Dakota, only the projected 189 thousand b/d of Bakken crude that would otherwise have been shipped by pipeline through Gretna, ND.24
The Muse Stancil Report shows projections for total avoided rail shipments from Canada by market destination in Figure 61 of the report. For clarity, LEI broke out the data behind Figure 61, to separately illustrate the outlook without the Enbridge Line 3 project and with Enbridge Line 3 project; and LEI added EIA historical data for rail shipments for 2012-2016 to provide context (see Figure 12). With the Enbridge Line 3 project, Muse Stancil forecasts that rail shipments from Canada ultimately destined for PADD 2 would be essentially nil.
22 Muse Stancil. P. 70.
23 Muse Stancil. Interrogatory Response (“IR”) 118.
24 Muse Stancil. P. 105.

***Confidential work product, subject to attorney/client privilege ***
London Economics International LLC 21 contact: 717 Atlantic Avenue, Suite 1A Marie Fagan Boston, MA 02111 617-933-7205 www.londoneconomics.com [email protected]
Figure 12. Muse Stancil outlooks for Canadian crude oil deliveries to US PADDs, and historical EIA data
No Enbridge Line 3 project With Enbridge Line 3 project
Source: EIA (2012-2016 shipments from Canada to US PADDs), Muse Stancil (outlook, IR 270B)
Subtracting the results with the Enbridge Line 3 project from those without the project results in avoided rail shipments from Canada, which is shown in Figure 61 as mentioned above. Muse Stancil’s assumptions and methodology result in an annual average of about 360 thousand b/d of avoided shipments of crude by rail from 2019-2035. The Muse Stancil Report states that much of the avoided rail shipments would be expected to have had to transit through Minnesota.25
4.1.7.2 Implications for use of rail cars and trains
The Muse Stancil Report does not provide an estimate of the number of trains implied by the forecast for crude oil shipments, but it does provide all the information necessary to make the calculations. Using the Muse Stancil assumptions about tank car capacity and number of cars per train noted above, LEI calculated the number of (loaded) trains daily from Canada which would be needed to transport the outlook in Figure 12 above. The implied avoided number of 110-car crude oil trains would reach 10 loaded trains per day (see Figure 13).
25 Muse Stancil. P. 82.

***Confidential work product, subject to attorney/client privilege ***
London Economics International LLC 22 contact: 717 Atlantic Avenue, Suite 1A Marie Fagan Boston, MA 02111 617-933-7205 www.londoneconomics.com [email protected]
Figure 13. Implied number of loaded trains daily from Canada implied by Muse Stancil outlooks, and EIA history
Source: EIA (2012-2016 rail shipments from Canada to US PADDs), Muse Stancil (2019-2035) IR 270B, and Muse Stancil assumptions for rail car capacity and train size (used to generate the historical estimates and the outlook in this figure)
4.1.7.3 Projected utilization of the Enbridge Line 3 project
The forecasted utilization of Enbridge Line 3 in Minnesota is an output of the Muse Stancil Crude Oil Market Optimization model and assumptions. The Muse Stancil results provide oil flows from Gretna, ND to Clearbrook, MN; from Clearbrook, MN to Superior, WI; and on other pipelines. The forecasts show that the Enbridge Line 3 project will be fully utilized through Minnesota, supplying both heavy and light crude oil.
4.2 Limitations of Muse Stancil Report
4.2.1 Oil supply assumptions and outlook
4.2.1.1 A statement which is portrayed as a conclusion is really an assumption
The Muse Stancil Report asserts in its “Analytical Conclusions” section that “The L3R Program (Enbridge Line 3 project) will not change the supply volume of Western Canadian or Bakken crude oil. It acts only to influence the transportation modes used by and the distribution patterns of North American crude oil.”26 However, this statement is not a conclusion of the analysis. Rather, it is an assumption: the oil supply outlook is an input to the analysis. The model does not have any feedback loop in which transportation costs or patterns could influence the oil supply
26 Muse Stancil. P. 88.

***Confidential work product, subject to attorney/client privilege ***
London Economics International LLC 23 contact: 717 Atlantic Avenue, Suite 1A Marie Fagan Boston, MA 02111 617-933-7205 www.londoneconomics.com [email protected]
outlook. Therefore, this statement belongs in the description of assumptions—it is not an analytical conclusion.
4.2.1.2 Muse Stancil’s conclusions rely on a single supply outlook
A major limitation of the Muse Stancil Report is the reliance on a single annual outlook for crude oil supply, the CAPP vintage 2016 outlook. This outlook drives the need for crude oil transportation from Western Canada, so it is important to the Muse Stancil forecasts for the utilization of the Enbridge Line 3 project and for rail shipments.
Using a single outlook for annual oil production can mask the potential for a wide variety of future outcomes. This can be seen by comparing CAPP’s outlooks for Western Canadian production before and after the 2015 oil price collapse. After the collapse in oil prices in 2015, CAPP’s outlooks have been about 5,000 thousand b/d for 2030, compared with about 6,500 thousand b/d before the price collapse (see Figure 14).
Figure 14. CAPP’s outlooks for Western Canadian oil, by vintage of outlook
Source: CAPP press releases (for vintage 2013-2015 outlooks), Muse Stancil (P. 122 for vintage 2016 outlook), CAPP (Crude Oil Forecast, Markets and Transportation 2017 for vintage 2017 outlook). Note: CAPP 2015 outlook for the years 2020 and 2025 is currently not available.
It is widely recognized that current oil prices, as well as expectations for oil prices, drive future crude oil supply. This wide recognition is why many energy forecasting organizations, such as the National Energy Board (“NEB”) in Canada and the EIA in the United States, provide forecasts for oil supply based on a range of oil price assumptions. In NEB’s and EIA’s outlooks, crude oil prices are assumptions, they are not generated by the internal relationships of their model (in economics terms, crude oil prices are “exogenous”). The NEB’s “low oil price” outlook assumes a recovery to oil prices of USD $75/bbl (Brent crude, an international crude benchmark price) in real terms by 2034, and projects a long-term increase in production to about 4,600 thousand b/d

***Confidential work product, subject to attorney/client privilege ***
London Economics International LLC 24 contact: 717 Atlantic Avenue, Suite 1A Marie Fagan Boston, MA 02111 617-933-7205 www.londoneconomics.com [email protected]
(4.6 million b/d). The “high oil price” scenario projects a substantial increase in production to 6,400 thousand b/d (6.4 million b/d) (see Figure 15).
Figure 15. Three NEB scenarios for Brent oil prices, and the three corresponding outlooks for Western Canadian crude oil production
Oil prices Production
Source: NEB Canada’s Energy Future 2016: Energy Supply and Demand Projections to 2040.
The EIA outlook for global oil prices represented by West Texas Intermediate (“WTI”) crude results in a correspondingly wide outlook for oil production from the Bakken and Rockies region (see Figure 16). Note that the term “low oil price” means different things to the Canadian agency and the US agency. For NEB “low oil prices” recover steadily, but for EIA “low oil prices” stay below $50 per bbl for the entire outlook.

***Confidential work product, subject to attorney/client privilege ***
London Economics International LLC 25 contact: 717 Atlantic Avenue, Suite 1A Marie Fagan Boston, MA 02111 617-933-7205 www.londoneconomics.com [email protected]
Figure 16. Three EIA scenarios for WTI oil prices, and the three corresponding outlooks for Dakotas and Rockies oil production
Oil prices Production
Source: EIA. AEO 2017. “International Petroleum and Other Liquids Supply, Disposition, and Prices.”
<https://www.eia.gov/outlooks/aeo/data/browser/#/?id=19-AEO2017®ion=0-0&cases=ref2017~highmacro~lowmacro~highprice~lowprice&start=2015&end=2030&f=A&sourcekey=0>
4.2.2 Demand assumptions and outlook
Another limitation of the Muse Stancil model is that a forecast for demand for refined products by end-users plays no role in the outlook, and is barely touched upon in the report. The only discussions or details about refined product demand are backward-looking, illustrated by historical data from EIA.27 This is in spite of the statement in the Muse Stancil Report noting that “Muse has been asked to…[d]escribe the historical and projected refined product demand in Minnesota…[and] [d]escribe the historical and projected refined product demand in the states that neighbor Minnesota…” (emphasis added).28 In spite of what Muse Stancil was asked to do, there are no outlooks for refined product demand anywhere in the report.
4.2.2.1 The Muse Stancil refined product model does not impact the results
The Report discusses Muse Stancil’s “North American Refined Product Distribution Model,” which it notes is used for estimating the refined product flows into and out of each individual
27 Muse Stancil. Figures 15, 16, 20.
28 Muse Stancil. P. 5.

***Confidential work product, subject to attorney/client privilege ***
London Economics International LLC 26 contact: 717 Atlantic Avenue, Suite 1A Marie Fagan Boston, MA 02111 617-933-7205 www.londoneconomics.com [email protected]
state and each region of the US and Eastern Canada.29 This model incorporates assumptions about refined product yield of refineries, state-level demand for refined products, cost and capacities of pipelines, and barge and tanker routes. The Report invokes this model to demonstrate the interconnectedness of the US refined product network.30 But this model did not play a role in the forecasts leading to the conclusions about the use of crude-by-rail or the utilization of the Enbridge Line 3 project.31
Thus, it appears that the Muse Crude Oil Market Optimization Model implicitly assumes that consumer demand for refined products would be unchanged for the entire forecast period. It also, implicitly, takes for granted that the level of crude oil demand (and by implication refined product demand) by refiners in North America and export countries will automatically absorb any change in crude oil production. The Muse Stancil Report seems to dismiss the issue with the comment “(a)n increase of throughput on crude oil pipelines, such as the Enbridge Mainline System, is not limited to just the amount required to satisfy an increase in regional or national refined product demand.”32 In other words, any extra crude oil can be exported.
4.2.3 Bracketing the outlook for refined product demand
If demand for refined products were different than the Muse Stancil Report assumed, would there be an impact on the need for pipeline capacity? The Minnesota Department of Commerce specifically asked LEI to consider the potential impact of electric vehicles on gasoline demand. This section outlines the key drivers and develops a range of outlooks for demand.
The uptake of hybrid electric vehicles (“HEVs”) and plug-in electric vehicles (“PEVs”) in the United States is growing dramatically (see Figure 17). Alternative-fueled vehicles currently amount to about 10% of new car sales. At the Federal level, the US offers a potentially significant subsidy—a federal income tax credit of up to $7,500—for all-electric and plug-in hybrid cars purchased during or after 2010. The initial credit amount varies based on the capacity of the battery used to power the vehicle.33 The credit begins to phase out after the manufacturer has sold 200,000 eligible vehicles in the United States as counted from January 1, 2010. The IRS is tasked with counting the vehicles, announcing when a manufacturer exceeds this production, and announcing the subsequent phase out of the credit.34
29 Muse Stancil. P. 27.
30 Muse Stancil. P. 28-30.
31 Muse Stancil. IR 121.
32 Muse Stancil. P. 58.
33 US Department of Energy. Office of Energy Efficiency and Renewable Energy. “Federal Tax Credits for All-Electric and Plug-in Hybrid Vehicles.” <https://www.fueleconomy.gov/feg/taxevb.shtml>
34 Internal Revenue Service. “IRC 30D – Plug-In Electric Drive Motor Vehicle Credit Quarterly Sales.” <https://www.irs.gov/businesses/irc-30d-plug-in-electric-drive-motor-vehicle-credit-quarterly-sales>

***Confidential work product, subject to attorney/client privilege ***
London Economics International LLC 27 contact: 717 Atlantic Avenue, Suite 1A Marie Fagan Boston, MA 02111 617-933-7205 www.londoneconomics.com [email protected]
Figure 17. Cumulative sales of electric vehicles (HEV and PEV) in the US
Source: Alternative Fuels Data Center. US Department of Energy. US HEV Sales by Model, 2016. <http://www.afdc.energy.gov/data/10301>
Ten states in the US have zero-emission vehicle (“ZEV”) mandates (ZEVs include EVs and fuel cell vehicles), as shown in Figure 18. State and local government fleets in ZEV states will be a source of sales to meet these targets. Of all the states, the biggest impact on EV adoption will likely be from California, as it has the highest near-term target.35
Figure 18. Target sales of zero-emissions vehicles by states with mandates
Source: Alliance of Automobile Manufacturers. ZEV Mandate, 2016. <http://www.zevfacts.com/zev-mandate.html>
35 Alternative Fuels Data Center. California Laws and Incentives. US Department of Energy. September 2016. Web. 19 January 2017. <http://www.afdc.energy.gov/laws/state_summary?state=CA>

***Confidential work product, subject to attorney/client privilege ***
London Economics International LLC 28 contact: 717 Atlantic Avenue, Suite 1A Marie Fagan Boston, MA 02111 617-933-7205 www.londoneconomics.com [email protected]
4.2.3.1 Range of potential impact on gasoline consumption
What could be the impact of electric vehicle adoption on gasoline consumption? LEI developed a high-level outlook for Minnesota and its neighbors based on the EIA analysis contained in the AEO 2017. EIA provides a projection of the market penetration rate for alternative vehicles in each of its scenarios. EIA defines this projection as the percent of alternative fueled vehicles in new car sales each year, and in their outlooks it is driven by zero-emissions vehicle (“ZEV”) mandates, corporate average fuel economy (“CAFE”) standards, relative fuel prices, and income.
In EIA’s three different oil price scenarios, US gasoline consumption projections range from as low as about 5 million b/d to as high as 8 million b/d by 2030 (see Figure 19). All three of these outlooks are lower than current gasoline consumption. Note that the range of outlooks for gasoline consumption is driven by the range of oil prices as well as the levels of alternative vehicle adoption.
Figure 19. Three EIA outlooks for alternative-fueled vehicles and US gasoline consumption
Alternative vehicles’ share of new car sales Light-duty vehicle gasoline consumption*
Source: EIA, AEO 2017. *Gasoline excludes E-85; light-duty vehicles accounted for 91% of US total gasoline consumption in 2016. Note: In the Low oil price case there are relatively more light trucks and fewer cars purchased each year than in the Reference case. Thus, though the total number of alternative fueled cars is lower in the Low oil price case, the percentage that alternative vehicles make up of total cars sold is higher in some years.36
If gasoline consumption in the Five-State area (Minnesota, Iowa, North Dakota, South Dakota, and Wisconsin) were to behave in the same way as the EIA outlook for the US overall, then the
36 Email from EIA, Melissa Lynes, Industry Economist. August 4, 2017.

***Confidential work product, subject to attorney/client privilege ***
London Economics International LLC 29 contact: 717 Atlantic Avenue, Suite 1A Marie Fagan Boston, MA 02111 617-933-7205 www.londoneconomics.com [email protected]
EIA Reference case and high oil price and low oil price scenarios would imply a similar range in the future demand for gasoline (see Figure 20). For Minnesota alone, gasoline consumption was 164 thousand b/d in 2014; at implied EIA decline rates, Minnesota’s demand for gasoline could fall as low as 100 thousand b/d by 2030. These outlooks compare to gasoline net production of about 250 thousand b/d for the Five-State area in 2015.37
Figure 20. Implied outlook for gasoline demand in EIA’s three scenarios
Five-State area Minnesota
Source: EIA SEDS (2015 data), EIA AEO 2017 (demand growth rates) and LEI (2016-2030) calculations
These EIA scenarios imply that the Five-State area could see a slight decline in gasoline demand, or even a significant decline in gasoline demand. This would imply that expansions of refined product supply, crude oil supply, and infrastructure such as pipelines would not be required to meet growing demand, because demand would not be growing.
However, this analysis also shows that, even in the high oil price (low product demand) case, the Five-State area would probably continue to need gasoline from outside the Five-State area, and Minnesota would need gasoline from the Five-state area. Thus, in all three scenarios, the Minnesota refined products market would remain integrated with the Five-state area, PADD 2, and by implication the rest of the US refined product market. Because the local markets would remain integrated with the larger US market, events that impact the oil market in Minnesota could reverberate into the US market, and vice-versa, even in the low demand scenario.
37 Muse Stancil. P. 115.

***Confidential work product, subject to attorney/client privilege ***
London Economics International LLC 30 contact: 717 Atlantic Avenue, Suite 1A Marie Fagan Boston, MA 02111 617-933-7205 www.londoneconomics.com [email protected]
4.2.3.2 Muse Stancil assumptions exclude the possibility of gluts
The Muse Stancil Report notes that, historically, PADD 2 refinery crude runs have been less than PADD 2 demand for light refined products.38 Thus, it argues, even if refined product demand in PADD 2 declines, PADD 2 refiners will not have to export gasoline or other light products to PADD 3 or elsewhere increase or maintain their volume of crude runs, they will only have to cut back imports.
However, there is not much more room for cutting back gasoline imports in PADD 2 from PADD 3 (see Figure 21). Therefore, it is possible in the future that PADD 2 refineries would have to export gasoline to increase their runs, even though they have not had to do so in the past. LEI does not feel this in and of itself is a serious shortcoming of the Muse Stancil model because options exist to move gasoline out of PADD 2. Furthermore, gasoline can also be exported outside of the US.
Figure 21. PADD 2 refiners do not have much room to reduce gasoline imports from PADD 3
Source: EIA. “Movements by Pipeline, Tanker, Barge and Rail between PAD Districts.” <https://www.eia.gov/dnav/pet/pet_move_ptb_a_EPM0F_TNR_mbbl_a.htm>
A larger problem would be if demand for refined products was weak across the US and could not easily be exported, as might occur if there were a simultaneous glut of refined products globally. This would result in lower prices for refined products and lower refinery profit margins, and perhaps result in the closure of less-efficient refineries, with potentially less need for crude oil from Canada and/or the Bakken region. This creates a problem for the Muse Stancil results if it reduces demand for transportation of crude oil from Canada on the Enbridge system.
4.2.4 Infrastructure assumptions
As shown in Figures 11 and 46 of the Muse Stancil Report, the analysis assumes no new crude oil pipelines would be built from Western Canada after 2021 in both the forecast in which the
38 Muse Stancil. P. 57.

***Confidential work product, subject to attorney/client privilege ***
London Economics International LLC 31 contact: 717 Atlantic Avenue, Suite 1A Marie Fagan Boston, MA 02111 617-933-7205 www.londoneconomics.com [email protected]
Enbridge Line 3 project goes forward and the one in which it does not (see Figure 22). This is a long period—14 years—to assume a complete lack of pipeline construction.
Figure 22. Crude oil pipeline capacity assumptions in Muse Stancil Report
Source: Muse Stancil. P. 12, 75.
In contrast, actual experience in Canada shows pipelines have been expanded or added every few years, as long as oil production is increasing. Enbridge’s Line 4 was installed in 2002, to transport heavy crude from Edmonton; Line 67 was added in 2009 creating an additional connection between Alberta and Enbridge’s US mainline.39 TransCanada’s Keystone Pipeline System began operation in 2010.40
39Enbridge. “Service Levels on the Enbridge Liquids Pipeline Mainline Network.” June 2015. <http://www.enbridge.com/~/media/www/Site%20Documents/Delivering%20Energy/LiquidsPipelines/Pipeline%20Configuration%20Map_%20Q1%202014.pdf>
40 TransCanada. Operations Maps. <https://www.transcanada.com/en/operations/operations-map/>

***Confidential work product, subject to attorney/client privilege ***
London Economics International LLC 32 contact: 717 Atlantic Avenue, Suite 1A Marie Fagan Boston, MA 02111 617-933-7205 www.londoneconomics.com [email protected]
It is true that developing, permitting, and building major pipelines can take years, and some projects do not eventually go forward at all. However, others do, and they do not necessarily take 14 years. For example, Energy Transfer Partners (“ET”) publicly announced their intentions to build the 450-570 thousand b/d Dakota Access crude oil pipeline from North Dakota to Illinois in June 201441 and though it faced well-publicized opposition, it eventually went into service in June 2017.42 ET doubtless prepared many internal studies before the 2014 announcement, including testing the market to ensure there would be shippers for the line. Assuming that ET started the process internally in about 2008, just as Bakken region crude oil production started to increase substantially, the longest that Dakota Access could have taken from its conception to completion was probably nine years.
So, Muse Stancil’s implied assumption that Canadian crude oil producers looking forward to a potential additional 1.5 million b/d of crude oil production by 2035 (if the producers utilize the latest CAPP outlook) would not be successful in supporting pipeline development is not realistic. These producers would presumably be aware that rail transport would likely be an expensive alternative to pipelines for most purposes. And the related assumption that Canadian pipeline companies would not be successful at moving forward with any proposed projects to take advantage of the opportunity to serve strong growth in oil supply is also unrealistic.
4.2.5 Cost and price assumptions
The Muse Stancil model solves for the highest price for crude at the supply location, but this does not guarantee that the solution price is high enough to incentivize actual long-term production of crude oil.
4.3 Oliver Wyman Report assumptions and inputs
The purpose of the Oliver Wyman Report included describing the transportation network in Minnesota, assessing the implications of new federal rail regulations on crude oil transport, and assessing the impact on Minnesota rail users and Minnesota residents of a potential scenario resulting from denying the CN application.43 LEI reviewed the entire report; in this section, LEI evaluates the portions of the Report that touch on energy market and high-level rail transit issues.
4.3.1 Supply of crude oil and demand for refined products
In the Oliver Wyman Report section on “Demand for Western Canadian Crude oil” it actually cites supply projections not demand projections, referring to the Muse Stancil report.44 The Oliver
41 Energy Transfer Partners. “Energy Transfer Announces Crude Oil Pipeline Project Connecting Bakken Supplies to Patoka, Illinois and to Gulf Coast Markets.” Press Release. June 25, 2014. <http://ir.energytransfer.com/phoenix.zhtml?c=106094&p=irol-newsArticle&ID=1942689>
42 Energy Transfer Partners. “Dakota Access Pipeline.” <http://landowners.daplpipelinefacts.com/>
43 Oliver Wyman. P. 4-5.
44 Oliver Wyman. P. 10.

***Confidential work product, subject to attorney/client privilege ***
London Economics International LLC 33 contact: 717 Atlantic Avenue, Suite 1A Marie Fagan Boston, MA 02111 617-933-7205 www.londoneconomics.com [email protected]
Wyman Report relies on no current or forward-looking assumptions about demand for refined products.
4.3.2 Demand by other commodities for rail service
There are no forward-looking assumptions (quantitative or qualitative) about demand by other commodities for rail capacity. The Report cites Minnesota state planning documents in the context of a discussion about the potential lack of rail surge capacity and congestion by 2040.45 But the Minnesota state outlooks do not have a quantitative role in the Oliver Wyman forecast for overall rail transport avoided if the Enbridge Line 3 project goes forward. The Oliver Wyman Report cites outlooks for total rail tonnage and for crude by rail at the national level by US Department of Transportation (“DOT”) but does not explicitly use them in its forecast as far as LEI can discern.46
4.3.3 Rail and other transport capacity
The Oliver Wyman Report does not calculate or project total shipments for crude by rail. Instead, it relies the results of the Muse Stancil report, from Muse Stancil, Figure 61.47
4.3.4 Methodology
The Oliver Wyman analysis relies on the Muse Stancil estimate of total crude transported by rail, as noted above, and does not use a formal model of its own to project total future rail use.48 The Oliver Wyman forecast for rail use is based on the Muse Stancil results, except the Oliver Wyman analysis excluded shipments to PADDs 4 and 5 as those would not traverse Minnesota (see Figure 23).
The Oliver Wyman Report also does not use a formal model for projecting the detailed rail routes described in Section V (“Profile of rail routes used under the Line 3 “No action” alternative”) of the report. The author starts with the top-line estimates of crude to the six destinations from Muse Stancil, and relies on his “own knowledge and the experience of Oliver Wyman’s Senior Rail Specialists” to determine the detailed rail routes.49 The Oliver Wyman Report forecasts that shipments to Houston in PADD 3 will grow strongly and by 2029 will account for nearly all the crude moving by rail through Minnesota.
45 Oliver Wyman. P. 6.
46 Oliver Wyman. P. 15-17.
47 Oliver Wyman. P. 11.
48 Oliver Wyman. P. 10.
49 Oliver Wyman. IR 275.
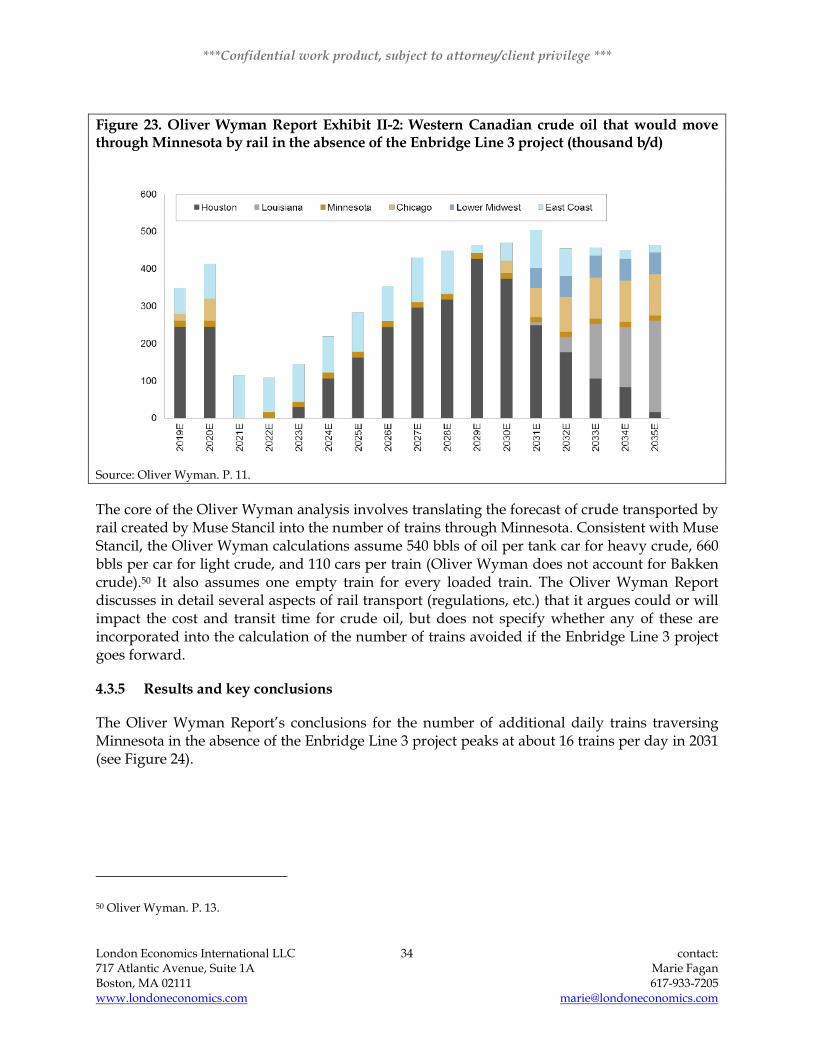
***Confidential work product, subject to attorney/client privilege ***
London Economics International LLC 34 contact: 717 Atlantic Avenue, Suite 1A Marie Fagan Boston, MA 02111 617-933-7205 www.londoneconomics.com [email protected]
Figure 23. Oliver Wyman Report Exhibit II-2: Western Canadian crude oil that would move through Minnesota by rail in the absence of the Enbridge Line 3 project (thousand b/d)
Source: Oliver Wyman. P. 11.
The core of the Oliver Wyman analysis involves translating the forecast of crude transported by rail created by Muse Stancil into the number of trains through Minnesota. Consistent with Muse Stancil, the Oliver Wyman calculations assume 540 bbls of oil per tank car for heavy crude, 660 bbls per car for light crude, and 110 cars per train (Oliver Wyman does not account for Bakken crude).50 It also assumes one empty train for every loaded train. The Oliver Wyman Report discusses in detail several aspects of rail transport (regulations, etc.) that it argues could or will impact the cost and transit time for crude oil, but does not specify whether any of these are incorporated into the calculation of the number of trains avoided if the Enbridge Line 3 project goes forward.
4.3.5 Results and key conclusions
The Oliver Wyman Report’s conclusions for the number of additional daily trains traversing Minnesota in the absence of the Enbridge Line 3 project peaks at about 16 trains per day in 2031 (see Figure 24).
50 Oliver Wyman. P. 13.
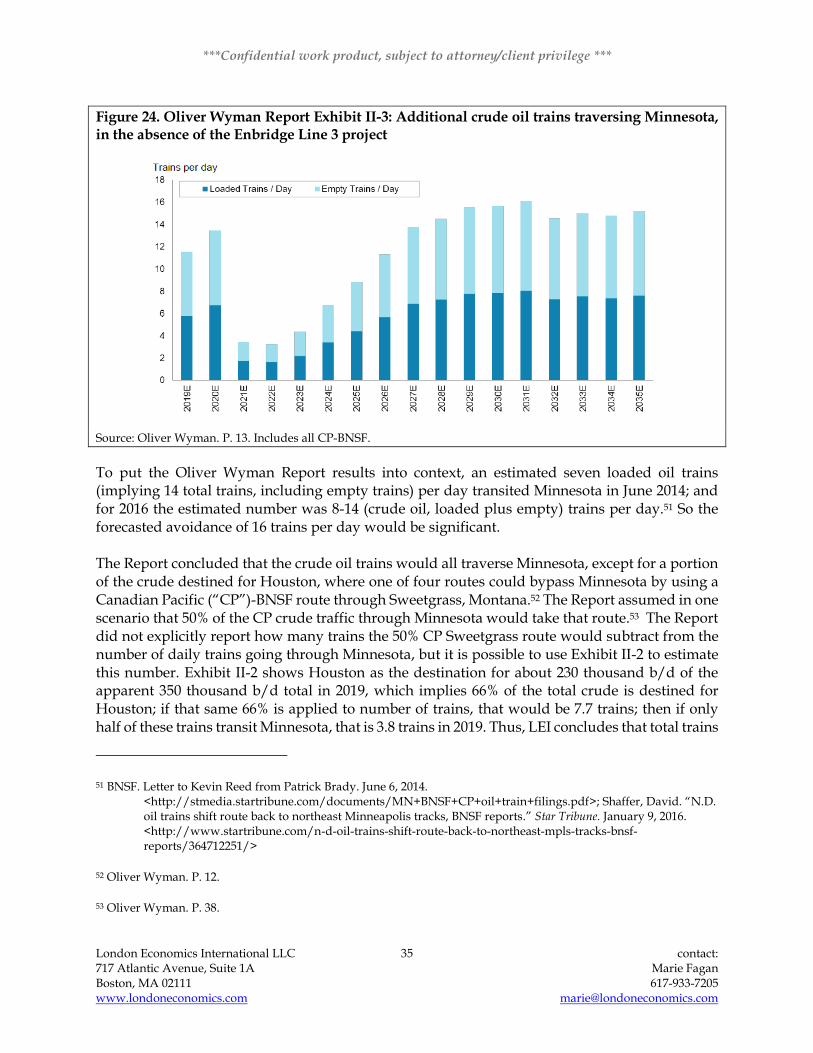
***Confidential work product, subject to attorney/client privilege ***
London Economics International LLC 35 contact: 717 Atlantic Avenue, Suite 1A Marie Fagan Boston, MA 02111 617-933-7205 www.londoneconomics.com [email protected]
Figure 24. Oliver Wyman Report Exhibit II-3: Additional crude oil trains traversing Minnesota, in the absence of the Enbridge Line 3 project
Source: Oliver Wyman. P. 13. Includes all CP-BNSF.
To put the Oliver Wyman Report results into context, an estimated seven loaded oil trains (implying 14 total trains, including empty trains) per day transited Minnesota in June 2014; and for 2016 the estimated number was 8-14 (crude oil, loaded plus empty) trains per day.51 So the forecasted avoidance of 16 trains per day would be significant. The Report concluded that the crude oil trains would all traverse Minnesota, except for a portion of the crude destined for Houston, where one of four routes could bypass Minnesota by using a Canadian Pacific (“CP”)-BNSF route through Sweetgrass, Montana.52 The Report assumed in one scenario that 50% of the CP crude traffic through Minnesota would take that route.53 The Report did not explicitly report how many trains the 50% CP Sweetgrass route would subtract from the number of daily trains going through Minnesota, but it is possible to use Exhibit II-2 to estimate this number. Exhibit II-2 shows Houston as the destination for about 230 thousand b/d of the apparent 350 thousand b/d total in 2019, which implies 66% of the total crude is destined for Houston; if that same 66% is applied to number of trains, that would be 7.7 trains; then if only half of these trains transit Minnesota, that is 3.8 trains in 2019. Thus, LEI concludes that total trains
51 BNSF. Letter to Kevin Reed from Patrick Brady. June 6, 2014. <http://stmedia.startribune.com/documents/MN+BNSF+CP+oil+train+filings.pdf>; Shaffer, David. “N.D. oil trains shift route back to northeast Minneapolis tracks, BNSF reports.” Star Tribune. January 9, 2016. <http://www.startribune.com/n-d-oil-trains-shift-route-back-to-northeast-mpls-tracks-bnsf-reports/364712251/>
52 Oliver Wyman. P. 12.
53 Oliver Wyman. P. 38.

***Confidential work product, subject to attorney/client privilege ***
London Economics International LLC 36 contact: 717 Atlantic Avenue, Suite 1A Marie Fagan Boston, MA 02111 617-933-7205 www.londoneconomics.com [email protected]
through Minnesota would be three to four fewer in the case of 50% of CP traffic using the Sweetgrass route to Houston.
4.4 Limitations of Oliver Wyman Report
4.4.1 Supply, demand, and infrastructure assumptions face same limitations as Muse Stancil
The Oliver Wyman analysis takes the supply of crude oil and demand for crude oil for granted – it simply refers to the Muse Stancil Report. LEI’s critiques of the Muse Stancil Report, including its assumptions of lack of pipeline capacity additions after 2021, therefore all also apply to the Oliver Wyman Report.
4.4.2 Pipeline and rail may not be perfect substitutes
Both reports assume rail and pipelines are necessarily substitutes, when in practice they could be complements. Pipelines are, in general, considered more cost-effective than rail to transport oil, with a cost of $5 per barrel by pipeline compared to $10 to $15 on rail.54 However, rail has some advantages. It offers more flexible destinations and shorter-term contracts than pipelines.55 It is also faster than pipelines; the trip from the Bakken region to Gulf Coast refineries takes five to seven days by rail, compared to 40 days by pipeline. It can respond more quickly to short-term changes in supply and demand than a pipeline. When there is need to transport oil from a new production location, railway companies can quickly extend their track and build a terminal to connect the new location to the railway network, while a pipeline usually takes years to plan and construct.56 Sometimes crude is transported from the field to the refinery using a combination of pipeline and rail. So, it is an oversimplification to assume pipeline and rail are strictly substitutes for transporting oil. As one BNSF vice president noted: “You might think of pipelines as our competitor, and they are, but they’re also becoming our customers.”57 This means that pipelines and rail probably would not substitute for one another on a perfectly one-to-one basis as seems to be assumed by Muse Stancil and Oliver Wyman.
There is another potential dynamic which further undermines this one-to-one assumption. Because pipeline capacity is generally cheaper than rail, adding more pipeline capacity could allow marginally more-expensive oil supply to become profitable at any given global oil price. The increase in marginally higher-cost production might take up the new pipeline capacity, leaving the previous production to use rail, as it had been before. Neither the Muse Stancil model
54 Frittelli, J., Parfomak, P. W., Ramseur, J. L., Andrews, A., Pirog, R., & Ratner, M. U.S. Rail Transportation of Crude Oil: Background and Issues for Congress. Congressional Research Service. May 5, 2014. Retrieved October 9, 2014. <http://fas.org/sgp/crs/misc/R43390.pdf>
55 Ibid.
56 Philips, M. “Amid U.S. Oil Boom, Railroads Are Beating Pipelines in Crude Transport.” Bloomberg. June 13, 2013. <http://www.businessweek.com/articles/2013-06-13/amid-u-dot-s-dot-oil-boom-railroads-are-beating-pipelines-in-crude-transport>
57 Ibid.

***Confidential work product, subject to attorney/client privilege ***
London Economics International LLC 37 contact: 717 Atlantic Avenue, Suite 1A Marie Fagan Boston, MA 02111 617-933-7205 www.londoneconomics.com [email protected]
nor the Oliver Wyman analysis allow for this possibility. Though the Muse Stancil model forecasts a rise in crude oil prices for Canadian producers as a result of the addition of new pipeline capacity,58 the Muse Stancil model does not allow this to result in higher crude oil production.
58 Muse Stancil. IR 272. Attachment 272B.

***Confidential work product, subject to attorney/client privilege ***
London Economics International LLC 38 contact: 717 Atlantic Avenue, Suite 1A Marie Fagan Boston, MA 02111 617-933-7205 www.londoneconomics.com [email protected]
5 Implications given limitations of expert reports
5.1 Oil supply outlooks should define ranges, rather than specific points
The discussion in Section 4 (and expanded upon in Appendix 1) demonstrated that the outlook for oil supply in the long term can vary widely, and will depend on expected global oil prices. Global oil prices, in turn, depend on geopolitics, the decisions of key producing countries, and other policy and economic drivers. Projections of future oil production can have a large impact on the projected need for new infrastructure. For example, with the decline in Bakken production from 2014 to 2017, rail exports from North Dakota declined from about 800 thousand b/d in 2014 to 300 thousand b/d by the beginning of 2017— even before the Dakota Access pipeline went into service.59 Future production from the North Dakota Bakken region and Canada will likely continue to vary with oil prices, with implications for the need for rail and pipelines.
The fact that the Muse Stancil Report relied on an outlook (CAPP vintage 2016) that reflected post-price collapse oil prices and thus lower Canadian crude production than earlier vintages gives some confidence that the supply assumptions have less chance of over-stating the need for pipeline capacity. However, it also highlights the risk of referring to a single outlook—two years earlier, the CAPP outlook for 2035 would have been about 1.5 million b/d higher. Using a range of outlooks rather than a single outlook for supply would have provided more insight to test the range of potential utilization of a long-lived asset such as an oil pipeline.
5.2 Refined product demand projections should define ranges
Just as for supply outlooks, demand outlooks should reflect that the future could unfold in a variety of ways. In the case of refined products markets, trends in demand across the US can be as important as trends in demand in Minnesota or PADD 2, because the markets are well-integrated. Ideally, as for supply, the outlook for demand should provide a high/low set of assumptions.
A range of outlooks for demand could help provide insight as to where the physical oil and refined products might be used. A low refined product demand outlook could imply that expanded crude pipeline capacity would not be needed to provide additional physical crude oil to refineries in the Minnesota district for consumption by Minnesota residents.60
59 Production data provided by Justin Kringstad, Director of the North Dakota Pipeline Authority. Rail Export Estimates from the North Dakota Pipeline Authority. For additional information, refer to https://northdakotapipelines.com/rail-transportation.
60 However, expanded capacity could still be attractive for the refineries in Minnesota in that it might provide crude to Minnesota refiners (and to other PADD 2 refineries) at a lower transport cost. Expanded crude pipeline capacity from Canada that can reach the US Gulf Coast can add to global supplies of crude oil, which could reduce prices to refineries and ultimately to consumers, though it may not be needed to support crude oil availability in Minnesota itself.

***Confidential work product, subject to attorney/client privilege ***
London Economics International LLC 39 contact: 717 Atlantic Avenue, Suite 1A Marie Fagan Boston, MA 02111 617-933-7205 www.londoneconomics.com [email protected]
5.3 Infrastructure assumptions should define ranges
Just as for supply and demand assumptions, infrastructure assumptions should define a range of plausible futures. At least one of the ranges should include assumptions that are consistent with historical trends and with oil producers’ and pipeline companies’ incentives.
5.4 The impact of the reports’ limitations on forecasted use of rail
The assumption that no new pipeline capacity will be built for 14 years, while crude oil suppliers continue to increase production, guarantees a forecast in which the use of rail increases dramatically as oil production increases. This will likely overstate the actual future need for rail in the case in which no new pipeline capacity is added.
Two other assumptions lead to understatement of the future need for rail transport in the alternative case in which new pipeline capacity is added. First is the that additional pipeline capacity might not replace a perfectly equivalent amount of crude by rail. Second is the lack of any kind of feedback loop that recognizes that cheaper transport (more pipeline capacity) could increase the supply of crude that is economic to produce, with potentially less reduction in use of rail cars.
The bottom line for the single assumption for future pipeline capacity employed by the two reports is probably significant over-forecasting of crude transportation by rail if the Enbridge Line 3 project is not completed, and a smaller under-forecasting of the need for rail if it is completed.
5.5 The impact of the limitations on forecasted pipeline utilization
The bottom line for impact of the single outlook assumptions for crude oil and products is more nuanced. Minnesota’s own use of refined products could decline rather than remain static as assumed by both reports. In that case, local refiners could still demand the same amount of crude oil, because refined products could be shipped to other PADD 2 states, other US regions, or exported. But if demand falls across the US, refined products prices would likely decline, and refinery profit margins would be squeezed. If crude oil and refined products could not easily be exported (if global demand were also weak, for example) some refineries could close. This possibility is not considered in either report. However, unless there were a global crude oil or refined product glut, and/or unless Canadian crude oil became un-economic to produce, it is possible that the increment of the proposed Enbridge Line 3 project would be utilized, though the entire capacity would not be used to meet refined product demand in Minnesota directly.
5.6 Conclusion
Both the expert reports made fairly simplistic – and in the case of pipeline capacity, unrealistic – forecast assumptions for supply, demand, and infrastructure. Because of these assumptions, LEI cannot conclude with confidence that the experts’ forecasts for rail use are realistic. As to patterns of pipeline utilization, the forecast provided by Muse Stancil could be one possible future; but Muse Stancil provided no other realistic scenarios to bracket the outlook.
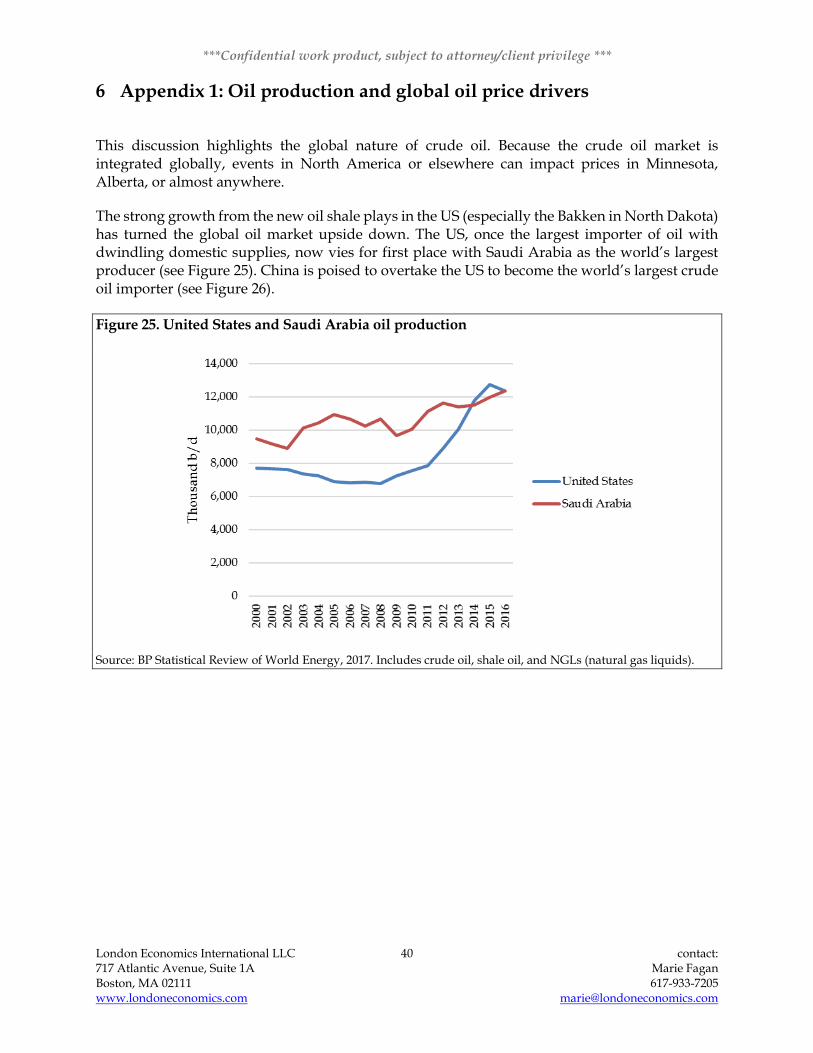
***Confidential work product, subject to attorney/client privilege ***
London Economics International LLC 40 contact: 717 Atlantic Avenue, Suite 1A Marie Fagan Boston, MA 02111 617-933-7205 www.londoneconomics.com [email protected]
6 Appendix 1: Oil production and global oil price drivers
This discussion highlights the global nature of crude oil. Because the crude oil market is integrated globally, events in North America or elsewhere can impact prices in Minnesota, Alberta, or almost anywhere.
The strong growth from the new oil shale plays in the US (especially the Bakken in North Dakota) has turned the global oil market upside down. The US, once the largest importer of oil with dwindling domestic supplies, now vies for first place with Saudi Arabia as the world’s largest producer (see Figure 25). China is poised to overtake the US to become the world’s largest crude oil importer (see Figure 26).
Figure 25. United States and Saudi Arabia oil production
Source: BP Statistical Review of World Energy, 2017. Includes crude oil, shale oil, and NGLs (natural gas liquids).
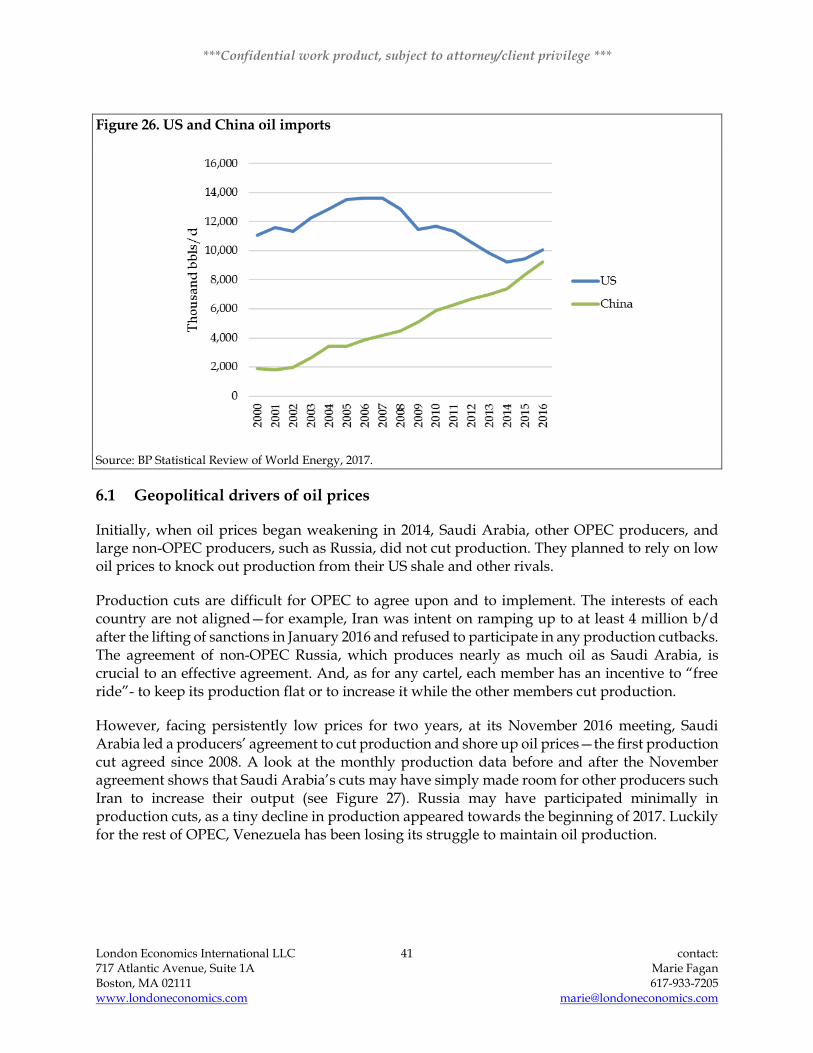
***Confidential work product, subject to attorney/client privilege ***
London Economics International LLC 41 contact: 717 Atlantic Avenue, Suite 1A Marie Fagan Boston, MA 02111 617-933-7205 www.londoneconomics.com [email protected]
Figure 26. US and China oil imports
Source: BP Statistical Review of World Energy, 2017.
6.1 Geopolitical drivers of oil prices
Initially, when oil prices began weakening in 2014, Saudi Arabia, other OPEC producers, and large non-OPEC producers, such as Russia, did not cut production. They planned to rely on low oil prices to knock out production from their US shale and other rivals.
Production cuts are difficult for OPEC to agree upon and to implement. The interests of each country are not aligned—for example, Iran was intent on ramping up to at least 4 million b/d after the lifting of sanctions in January 2016 and refused to participate in any production cutbacks. The agreement of non-OPEC Russia, which produces nearly as much oil as Saudi Arabia, is crucial to an effective agreement. And, as for any cartel, each member has an incentive to “free ride”- to keep its production flat or to increase it while the other members cut production.
However, facing persistently low prices for two years, at its November 2016 meeting, Saudi Arabia led a producers’ agreement to cut production and shore up oil prices—the first production cut agreed since 2008. A look at the monthly production data before and after the November agreement shows that Saudi Arabia’s cuts may have simply made room for other producers such Iran to increase their output (see Figure 27). Russia may have participated minimally in production cuts, as a tiny decline in production appeared towards the beginning of 2017. Luckily for the rest of OPEC, Venezuela has been losing its struggle to maintain oil production.

***Confidential work product, subject to attorney/client privilege ***
London Economics International LLC 42 contact: 717 Atlantic Avenue, Suite 1A Marie Fagan Boston, MA 02111 617-933-7205 www.londoneconomics.com [email protected]
Figure 27. Monthly petroleum liquids production 2014-2017, selected producers
Source: EIA. Petroleum liquids include crude oil (including lease condensate), natural gas plant liquids, other liquids, and refinery processing gain. Other liquids include biodiesel, ethanol, liquids produced from coal, gas, and oil shale, and other hydrocarbons.
6.2 Recent policy changes in North America
In December 2015, the US Congress lifted the ban on crude oil exports from the United States.61 Crude oil exports began creeping up before the lifting of the ban, but these exports were mostly to Canada, which was excluded from the previous restrictions.62 The lifting of the export ban at the end of 2015 boosted exports to countries other than Canada, and crude oil exports surged, as shown in Figure 9 previously. This lifting of the ban allows access to a larger export market for US suppliers. It adds to global supplies, and thus could keep global crude oil prices lower than otherwise, and make it harder for OPEC to support prices. The lifting of the ban will likely provide opportunities for oil producers in the US than they would have had if US did not allow exports. Finally, the lifting of the ban provides impetus for more pipeline capacity to be built in North America to reach export locations such as the US Gulf Coast.
A potential US boycott of oil imports from Venezuela was averted recently when US President Trump decided to not to follow through with a threat in June 2017 to boycott Venezuelan oil
61 The Wall Street Journal. “Congressional Leaders Agree to Lift 40-Year Ban on Oil Exports.” December 16, 2015.
62 EIA. “Today in Energy.” August 16, 2016. https://www.eia.gov/todayinenergy/detail.php?id=27532

***Confidential work product, subject to attorney/client privilege ***
London Economics International LLC 43 contact: 717 Atlantic Avenue, Suite 1A Marie Fagan Boston, MA 02111 617-933-7205 www.londoneconomics.com [email protected]
imports as part of a package of sanctions.63 Key Republican senators did not support the potential boycott.64 The US imported 796 thousand b/d of typically heavy crude oil and refined products from Venezuela in 2016.65 This was down substantially from the 1,773 thousand b/d peak level of US imports from that country in 1993. The potential boycott of about 700 thousand b/d of Venezuelan crude (the 2016 average, excluding refined products) had US refiners looking for other sources of crude oil, including lighter grades such as those produced in the US.66 If such a boycott were to be imposed for the long term, it might provide a longer-term opportunity for oil producers in the US and Canada, and could increase the demand for crude oil pipeline capacity to refineries located at the US Gulf Coast.
In Canada, Alberta’s Climate Leadership Act came into effect in January 2017.67 However, oil sands producers, conventional oil producers, and natural gas producers are allowed exemptions to minimize the impact of the regulations. Projections show only a small impact on oil production over the near term, of a modest 0.05 million b/d in lost oil production by 2025, assuming that the total emissions from the oil sector remains under the 100 million metric tonne threshold required by the Act; but in the longer term, lost production could reach 0.96 million b/d 2040, if the emissions cap is exceeded in 2026.68
63 The Economist. “Politics” September 2, 2017.
64 The Hill. http://thehill.com/policy/finance/346080-gop-senators-ask-trump-not-to-target-venezuelan-oil-with-sanctions
65 EIA. “Petroleum and other liquids.” https://www.eia.gov/dnav/pet/pet_move_impcus_d_nus_NVE_mbblpd_a.htm
66 Reuters. https://www.reuters.com/article/us-usa-refiners-venezuela/u-s-oil-refiners-pare-exposure-to-venezuelan-crude-imports-idUSKBN1AC36M
67 Province of Alberta. Alberta Energy. Alberta Revenues: Historical (1970 to latest) and Budget ($ Millions). http://www.energy.alberta.ca/Org/docs/Revenueworkbook.xls
68 Fraser Institute. How Alberta’s Carbon Emission Cap Will Reduce Oil Sands Growth. August 2016. https://www.fraserinstitute.org/sites/default/files/how-albertas-carbon-emission-cap-will-reduce-oil-sands-growth.pdf

***Confidential work product, subject to attorney/client privilege ***
London Economics International LLC 44 contact: 717 Atlantic Avenue, Suite 1A Marie Fagan Boston, MA 02111 617-933-7205 www.londoneconomics.com [email protected]
7 Appendix 2: Consultant background and experience
Marie N. Fagan, PhD
Managing Consultant and Lead Economist, London Economics International, LLC
KEY QUALIFICATIONS:
Marie Fagan is Managing Consultant and Lead Economist at London Economics International,
LLC, based in Boston, Massachusetts. With over 25 years of experience in research and consulting
for the energy sector, Marie’s career has spanned international upstream and downstream oil and
gas, global coal, North American gas markets, and North American power markets. She has
advised C-suite industry clients, buy-side and sell-side financial clients, as well as legislators and
regulators; she has served as an expert witness. At LEI, Marie’s expertise across electricity
markets and fuels provides integrated perspectives and supports sound strategic advice for
clients.
Marie leads LEI’s engagements related to oil and natural gas market analysis. She directs gas
pipeline modeling efforts based on a sophisticated network model, supporting outlooks for
natural gas prices and basis, and analysis of flows on North American interstate pipelines. She
provides in-depth expert testimony on issues such as basis differentials, pipeline capacity and
utilization in key regions, and LNG import and export supply and demand. Recent projects for
LEI have included serving as independent market expert for the Maine Public Utilities
Commission, in the evaluation of the costs and benefits of new natural gas pipelines into New
England.
Marie directs LEI’s research of the Electric Reliability Council of Texas (“ERCOT”) electric power
market. Recent projects have included examination of the political, legislative, and economic
drivers the led to creation of ERCOT’s Competitive Renewable Energy Zones (“CREZ”), and
assessment of the potential for state-level support for further expansion of CREZ transmission
lines.
Marie draws on her long-time experience across fuels and regions to ensure clients benefit from
an integrated understanding of market rules and practices. Recent projects have included
providing expertise related to the design of capacity markets in the electric power sector. Marie
is experienced in the use of scenario analysis, an approach which helps clients identify potential
turning points and arrive at decisions that are robust given the uncertainties inherent in any
future set of market conditions.
From 1996-2014, she was with Cambridge Energy Research Associates (“CERA,” now part of IHS,
Inc.). She served as an Associate, then Associate Director for CERA’s Global Oil research practice,

***Confidential work product, subject to attorney/client privilege ***
London Economics International LLC 45 contact: 717 Atlantic Avenue, Suite 1A Marie Fagan Boston, MA 02111 617-933-7205 www.londoneconomics.com [email protected]
as Director for the North American Gas research practice; she founded the CERAView
Institutional Investor Service and co-founded CERA’s Global Steam Coal service; she served as
Senior Director for CERA’s North American Electric Power service and of IHS CERA’s Upstream
Strategy service. Before joining CERA, Marie served as an economist with the United States
Energy Information Administration (“EIA”), conducting analysis and modeling supporting the
Annual Energy Outlook (“AEO”), and conducting analysis of energy company financial
performance.
Marie is the author of original research with publications in academic and industry journals. She holds a PhD in Economics from the American University in Washington, DC.
EDUCATION:
Institution American University, Washington DC
Date: 1995
Degree(s) or Diploma(s) obtained: PhD in Economics. Dissertation: “Measuring Cost and Efficiency
in US Crude Oil Resource Development, 1977-1990: A Frontier
Translog Cost Function Approach”
Institution University of Connecticut
Date: 1984
Degree(s) or Diploma(s) obtained: Bachelor of Science, Business Administration (Finance)
EMPLOYMENT RECORD:
Date: 2014-present
Location: Boston, MA
Company: London Economics International LLC (“LEI”)
Position: Managing Consultant and Lead Economist
Date: 2003-2014
Location: Cambridge, MA
Company: IHS (formerly Cambridge Energy Research Associates (“CERA”))

***Confidential work product, subject to attorney/client privilege ***
London Economics International LLC 46 contact: 717 Atlantic Avenue, Suite 1A Marie Fagan Boston, MA 02111 617-933-7205 www.londoneconomics.com [email protected]
Position:
Senior director, Upstream Strategy Advisory service (2012-2014).
• Responsible for the re-vamp of research services and development of new
research services focused on the needs of oil and gas exploration and production
companies. Defined product architecture, defined deliverables, and generated
research, as well as managed the delivery of research. Responsible for marketing
plans and focus, conducting presentations to Board of Directors meetings and
other C-suite client groups. Keynote speaker at IHS CERA events such as
CERAWeek and other industry events and conferences
Senior director, North American Gas, Power, and Renewables group (2007-2011).
• Responsible for thought leadership, development, and delivery of research for
IHS CERA’s North American Electric Power Advisory Service and North
American Gas and Power Scenarios Service. Led client engagements, as well as
wrote and published research. Provided oversight and direction of the launch
of a new research service, the IHS CERA Global Steam Coal Advisory Service
Director/Senior director, CERAView Institutional Investor Service (2004-2007)
• Created, launched and directed IHS CERA’s first research service encompassing
the oil, gas, and power sectors to serve a targeted client community. Developed
a new IHS CERA research publication, Investors’ Energy Monthly, and served as
publication’s executive editor. In this role, won the IHS Circle of Excellence
Award in 2005
Director, North American Gas Advisory service (2003-2004)
• Responsible for rapid re-construction and turnaround of one of CERA’s largest
research advisory services. She contributed to and helped define the research
agenda, and was responsible for the editorial content and publication of major
research and analytical reports related to gas infrastructure and markets in
North America. She advised senior executive clients, including leading
discussions of sensitive client-related issues.
Date: 2001-2002
Location: Boston, MA
Company: International Human Resources Development Corporation (“IHRDC”)
Position:
Director, International Gas Program
• Developed and implemented management training programs for middle and
senior energy company managers, designed interactive presentations and
teaching materials, and served as instructor. Marie taught principles of project
development and financial analysis of energy company operations.
Date: 1996-2001
Location: Cambridge, MA
Company: CERA

***Confidential work product, subject to attorney/client privilege ***
London Economics International LLC 47 contact: 717 Atlantic Avenue, Suite 1A Marie Fagan Boston, MA 02111 617-933-7205 www.londoneconomics.com [email protected]
Position:
Associate director, Global Oil advisory service (1999-2001)
• Authored original research reports, responsible for client presentations and the
management, execution, and delivery of consulting projects.
Associate, Global Oil advisory service (1996-1998)
• Developed and maintained IHS CERA’s expertise in exploration and
production costs, technology, and financial factors affecting the upstream oil
and gas industry.
Date: 1994-1996
Location: Washington, DC
Company: US Department of Energy, Energy Information Administration
Position:
Economist
• Conducted financial analysis of upstream and integrated oil and gas companies;
evaluated and implemented conceptual approaches to analysis of energy
markets and market incentives, and wrote and published original research
reports.
Date: 1989-1994
Location: Vienna, Virginia
Company: Decision Analysis Corporation of Virginia (DAC)
Position:
Research associate/Associate
• Performed economic and econometric analysis, modeling, and forecasting to
support the Energy Information Administration energy end-use models.
Designed the National Energy Modeling System’s Commercial Energy Demand
Model; conducted financial analysis of energy companies.
Date: 1988
Location: Washington DC
Company: US Department of Energy, Office of Policy, Planning and Analysis
Position:
Intern
• Researched waste-to-energy potential in the United States; constructed a
database, developed econometric models, analyzed results and produced
written reports.

***Confidential work product, subject to attorney/client privilege ***
London Economics International LLC 48 contact: 717 Atlantic Avenue, Suite 1A Marie Fagan Boston, MA 02111 617-933-7205 www.londoneconomics.com [email protected]
RECENT PROJECT EXPERIENCE:
Date: June 2017
Location: United States, MISO
Company: Mississippi Public Service Commission
Description:
Marie led an LEI team conducting a management audit of the activities of a major vertically-integrated utility in the MISO RTO. LEI assessed the utility's practices for purchase and use of fuel and electric energy, assessed relevant fuel and energy contract terms, investigated the operations of the utility's coal and nuclear generation units, and reviewed the prudency of coal inventory levels and inventory control procedures (Docket No. 2017-AD-042).
Date: April, May 2017
Location: United States and Canada
Company: Private client
Description:
For a private equity client, Marie led an extensive project reviewing all investable energy sectors in the United States and Canada (except oil and gas exploration and production). The sectors included: electricity generation (natural gas, wind, solar, hydro), AMI, distributed resources, demand response, retail energy, gas LDCs, gas storage, gas pipeline transportation, LNG-related infrastructure, vertically-integrated utilities, electric distribution utilities, and water utilities. LEI assessed the investment potential of each sector for the next five years, and proposed a methodology to screen and identify investment opportunities and execute on these opportunities.
Date: March 2017
Location: Alberta, Canada
Company: Private client
Description:
LEI was engaged to provide global perspectives on the detailed mechanisms that make up capacity markets, so that eventual capacity market design in Alberta will be workable and efficient, with minimal unintended consequences. Marie led research and delivered a detailed report on market power mitigation mechanisms and their potential impacts on capacity market performance.
Date: February 2017
Location: North America
Company: Provider of services to vehicle fleet industry
Description:
Developed scenario outlook for electric vehicle (“EV”) market penetration in the United States; examined the role of electric utilities (and their emerging EV-related business models) as potential partners versus competitors to the downstream transportation industry; identified activities and strategic positioning of upstream and downstream industry participants; led discussion of implications of “electrification of transportation” for fleet service companies, convenience stores, and other downstream industry participants. Presented material to company’s partner advisory board.
Date: December 2016

***Confidential work product, subject to attorney/client privilege ***
London Economics International LLC 49 contact: 717 Atlantic Avenue, Suite 1A Marie Fagan Boston, MA 02111 617-933-7205 www.londoneconomics.com [email protected]
Location: Alberta, Canada
Company: Private client
Description:
To support Board-level understanding of the implications of potential capacity market designs in Alberta, Marie prepared a detailed review and comparison of capacity markets across international and North American jurisdictions. Report concluded “the devil is in the details” of capacity market design. Market design details with potentially large impacts on the client were resource eligibility definitions, price setting mechanism, demand curve design, performance requirements, and market power mitigation rules.
Date: September 2016
Location: Northeast United States
Company: Private client
Description:
For a client performing due diligence related to a potential investment in business-to-business behind-the-meter solar in the Northeast United States, Marie led a project examining US federal and state incentives for solar adoption, and assessing business models used for targeting commercial, institutional, and industrial sectors. For each business model, LEI assessed the competitive environment—who is operating in the sector, what is their go-to-market strategy, and in general how these models have been performing. Marie’s team also provided a 10-year outlook for solar renewable energy credits (“SRECs”) for certain jurisdictions. Finally, LEI developed key questions the client should ask as part of its evaluation of potential transactions in the behind-the-meter solar sector.
Date: October/November 2016
Location: California, Kansas
Company: Law firm
Description:
Marie prepared an expert report in support of litigation in Case 15CV-04225 in the District Court of Johnson County, Kansas. LEI was retained by counsel to examine the value of the green attributes of landfill gas (“LFG”) produced by a project in Kansas City and sold under long-term contract to the Sacramento Municipal Utility District ("SMUD"). Marie’s report demonstrated several flaws in the opposing counsel's expert's methodology. Marie proposed an alternative, more appropriate methodology for valuing the green attributes of LFG, based on market fundamentals driven by the California RPS requirements. Marie was deposed in preparation for trial.
Date: August-October 2016
Location: Maine
Company: Maine Public Utilities Commission
Description:
Marie led an engagement to estimate the macroeconomic impact of biomass generation within the state of Maine (Maine PUC Docket No. 2016-00084). This included direct, indirect, and induced impacts on: permanent direct jobs, payments to municipalities, payments for fuel harvested in the State, payments for in-state resource access, in-state purchases of goods and services, and construction-related jobs and purchases. Marie used the macroeconomic model known as IMPLAN to capture the economic impacts on industries including logging, sawmills, and other forestry-related industries and well as on state and local taxes.

***Confidential work product, subject to attorney/client privilege ***
London Economics International LLC 50 contact: 717 Atlantic Avenue, Suite 1A Marie Fagan Boston, MA 02111 617-933-7205 www.londoneconomics.com [email protected]
Date: May 2016
Location: ERCOT/Texas
Company: Private client
Description:
Marie conducted a case study assessing the current ancillary services (“CAS”) market in ERCOT, outlining the structure of ERCOT’s proposed Future Ancillary Services Nodal Protocol Revision Request (“FAS-NPRR”), and examining the implications of ERCOT’s experience so far for the Alberta electricity market. This involved examining the drivers of ancillary services supply and demand in ERCOT, the price-setting mechanisms and procurement processes, and the technical requirements of the various ancillary services in ERCOT. Findings included the following: While it was widely expected that the addition of large amounts of wind (and other non-synchronous generation) on the ERCOT system would significantly increase the need for ancillary services, by 2015, ERCOT’s procurement of CAS products had not increased compared with 2011. However, the need for synchronous inertial response (“SIR”) which is not part of CAS did increase somewhat over the time period, though ERCOT did not include SIR in its FAS-NPRR.
Date: April/May 2016
Location: ERCOT/Texas
Company: Renewable power investor
Description:
LEI was hired to perform due diligence for an investor interested in wind assets in ERCOT. Marie examined the political, legislative, and economic drivers of ERCOT’s Competitive Renewable Energy Zones (“CREZ”) and provided an assessment of state-level support for further expansion of CREZ transmission lines. She also provided assessment of and outlook for ERCOT’s and the Public Utility Commission of Texas’s views of the “system cost” of wind (the potential increased need for ancillary services and firm capacity on the system).
Date: June 2014-April 2016
Location: Maine
Company: Maine Public Utilities Commission
Description:
Marie served as project manager, independent market expert, and expert witness for the Maine Public Utilities Commission, in the evaluation of the costs and benefits of alternatives for expansion of natural gas supply into Maine pursuant to the Maine Energy Cost Reduction Act (MPUC Docket #2015-00071). Marie reviewed and evaluated proposals for firm natural gas transportation service by pipeline developers. These evaluations included LEI’s review of commercial terms include in the pipeline Precedent Agreements that underpin capacity expansion projects; review of contract provisions for Firm Transportation Agreements and Negotiated Rate Agreements; and evaluation of the status of the FERC and state-level permitting process for each pipeline proposal. Marie provided expertise in upstream natural gas (exploration and production), midstream natural gas (interstate pipelines) and global energy markets including oil and LNG markets, to provide a solid grounding for LEI’s long-term outlook for New England natural gas prices. Marie directed the natural gas network modeling (using GPCM, an industry-standard network model of the North American natural gas system) and power simulation modeling (using LEI's proprietary POOLMod model) to arrive at a quantitative cost-benefit analysis of proposals. She authored reports provided to the Commission; responded to discovery from other parties; prepared discovery questions and cross-examined witnesses; reviewed

***Confidential work product, subject to attorney/client privilege ***
London Economics International LLC 51 contact: 717 Atlantic Avenue, Suite 1A Marie Fagan Boston, MA 02111 617-933-7205 www.londoneconomics.com [email protected]
testimony by other parties and provided assessments of the issues presented; and she served as an expert witness in the proceedings.
Date: November-December 2015
Location: US Northeast
Company: Renewable power developer
Description:
LEI was hired by a wind developer to provide a quantitative assessment, based on an economic dispatch model, of congestion/curtailment risk for a wind asset in Maine. LEI used its proprietary dispatch model, PoolMod, to provide an outlook from 2016 through 2020 of hourly LMPs, as well as the components of LMP (energy, losses, and congestion). We incorporated information from the interconnection impact study to examine system limits for the plants in question. LEI also provided an assessment of risk of outages based on NERC outage data for NPCC. Marie led the project
Date: October-November 2015
Location: ERCOT/ Texas
Company: Private equity company
Description:
LEI was hired to forecast the potential energy revenues of two wind farms in Texas, using
its proprietary dispatch model, PoolMod. Marie led the project, and also examined the
implications of the PPA related to the two wind farms.
Date: July 2015
Location: North America/United Kingdom
Company: UK Department of Energy and Climate Change
Description:
Marie participated in a review of auction design for the UK DECC. The UK market regulator was interested in whether US power markets evaluate generation bids based on criteria other than the price bid, specifically, if the length of contract had a role in the auctions. LEI reviewed capacity market rules for PJM, ISO-New England and the New York ISO. Marie examined whether and for how long a "lock-in" option for the first year capacity price is offered to new generation assets bidding into the auctions. She also reviewed international spectrum auctions, North American gas transmission open season rules, and international auctions for toll roads to examine whether and how duration or length of contract is incorporated into bidding.
Date: May 2015
Location: Connecticut; Virginia
Company: Private equity company
Description:
Marie evaluated contracts for firm gas transportation capacity for gas-fired plants in Virginia and Connecticut.
Date: April 2015
Location: Connecticut; New Jersey
Company: Private equity company

***Confidential work product, subject to attorney/client privilege ***
London Economics International LLC 52 contact: 717 Atlantic Avenue, Suite 1A Marie Fagan Boston, MA 02111 617-933-7205 www.londoneconomics.com [email protected]
Description:
LEI was retained to forecast delivered gas prices in New England (Connecticut) and PJM (New Jersey) and locational marginal prices as well as retail electricity prices in Connecticut. Marie led the gas market analysis.
Date: August 2014 - January 2015
Location: North America
Company: Private client
Description:
LEI was engaged to support an energy company’s Regulatory Group in its administering of the company’s compliance program. The purpose of the engagement was to ensure that client’s transactional and business groups were made aware of market rules and regulatory risks. This involved creating and delivering a monthly report covering developments by regional market and traded products which included: energy, capacity, long-term transmission service, FTR auctions, ancillary services, diesel oil, PRB coal, natural gas commodity, transmission, and storage, RECS, and CO2. Marie served as project manager and executive editor of the monthly report and monthly conference call, and provided the research and insight on US gas, oil, and coal markets, and FERC activities.
Date: October 2014
Location: New England
Company: Private equity company
Description:
To support potential acquisition of hydropower assets, Marie provided analysis of ISO-New England’s Locational Forward Reserves Market (“LFRM”).
Date: April-June 2014
Location: US Midwest
Company: Private equity company
Description:
LEI was engaged by an investment firm in association with due diligence related to a district cooling system in the Midwest. Marie reviewed contracts and developed a model for projecting revenues and gross margins for the asset. Marie provided insight by identifying the potential for lower customer contract prices at renewal (in contrast to the seller's assumptions) and other areas of revenue risk.
Date: June 2014
Location: North America
Company: Law firm
Description:
LEI was engaged by a law firm on behalf of a Canadian energy company to provide market advisory for an investigation related to the timing of outage scheduling under PPAs. Marie provided research and expertise covering FERC practices related to monitoring, enforcement, and definition and prosecution of alleged market manipulation.
Date: April-May 2014
Location: Nova Scotia
Company: Government of Nova Scotia
Description:
LEI was retained by the Nova Scotia Department of Energy to perform analysis of the organization and governance of electricity systems both cross-jurisdictionally and within the province of Nova Scotia. Marie provided a detailed overview of the Nova Scotia gas

***Confidential work product, subject to attorney/client privilege ***
London Economics International LLC 53 contact: 717 Atlantic Avenue, Suite 1A Marie Fagan Boston, MA 02111 617-933-7205 www.londoneconomics.com [email protected]
and power sectors, including governing institutions, the legal and regulatory framework, recent developments and challenges, and SWOT analysis.
PUBLICATIONS:
Technical/Academic
“New England Oil, Gas, and Power Markets” guest lecture, University of Massachusetts, Boston, MA,
October 2005, with Lawrence Makovich.
“The Disappearing Middle Class: Economies of Scale in Exploration and Development,” presented at the
International Association for Energy Economics, 26th annual conference, Aberdeen, June 2002.
“The Key Role of Technology in Reducing Offshore Finding and Development Costs,” Fundamentals of the
Global Offshore Industry, The Petroleum Economist Ltd., London, September 2001.
“The US Oil and Gas Supply Situation: How Did We Get Here?” guest lecture, Clark University, Worcester,
MA, October 2000.
“The Technology Revolution and Upstream Costs,” The Leading Edge (Journal of the Society of Exploration
Geophysicists), June 2000.
Review of Exploration, Development, and Production—Texas Oil and Gas 1970-1995, for the Journal of Economic
Literature, 1999.
“Resource Depletion and Technical Change: Effects on US Crude Oil Finding Costs from 1977 to 1994,” The
Energy Journal, 1997.
“Inter-jurisdictional Competition, Resource Rents, Tax Exporting, and Oil and Gas Severance Taxes,” The
Journal of Energy Finance and Development, 1997, with Kevin Forbes.
“Fiscal Illusion and Fiscal Sclerosis: The Case of Oil and Gas Severance Taxes,” presented at the US
Association for Energy Economics/International Association for Energy Economics conference, Boston,
MA October 1996.
“Prices, Depletion, and Technical Change 1977-1990: The Declining Cost of Crude Oil,” presented at the
Allied Social Science Association Annual Meeting, American Economic Association/International
Association for Energy Economics session, San Francisco, CA, January 1996.
“Technical Change and Scale Economies in US Onshore Oil and Gas Exploration 1977-1990,” presented at
the Southern Economic Association meeting, New Orleans, LA, November 1993.
US Department of Energy
State Energy Severance Taxes, DOE/EIA-TR/0599, Washington, DC, 1995.
Oil and Gas Development in the United States in the Early 1990s: An Expanded Role for Independent Producers,
DOE/EIA-0600, Washington, DC, 1995, with Jon Rasmussen.

***Confidential work product, subject to attorney/client privilege ***
London Economics International LLC 54 contact: 717 Atlantic Avenue, Suite 1A Marie Fagan Boston, MA 02111 617-933-7205 www.londoneconomics.com [email protected]
“Trash to Energy: A Burning Issue,” 1988 Selected Papers and Presentations by DOE’s Policy Integration Staff,
US Department of Energy, Office of Policy, Planning and Analysis, Office of Policy Integration,
Washington, DC, December 1988, with Peggy Podolak.
IHS/CERA Publications
Global Prospects for Shale Gas: Assessing Above-ground Risks and Enablers IHS CERA Private Report 2013
The Impact of Technology on US Offshore Finding and Development Costs IHS CERA Private Report 2013
The Next E&P Hotspots: What are the Leading Indicators? IHS CERA Decision Brief 2012
Taking the Shale Gale International: Lessons from North America IHS CERA Decision Brief 2012
Prospects for Shale Gas in Europe: Insights from CERAWeek IHS CERA Insight 2012
Envisioning a Long-term Future for Coal IHS CERA Insight 2011
North American Power Industry Landscape 2011 IHS CERA Decision Brief 2011
Common Ground? CERAWeek Perspectives on US Electric Power Transmission IHS CERA Insight 2010
North American Power Industry Landscape 2010 IHS CERA Decision Brief 2010
Mexico’s Road to Renewable Power: The Cost of a Range of Targets and Options IHS CERA Decision Brief 2009
Competitive Bidding: A Key Tool for Capital Formation in the US Power Sector IHS CERA Decision Brief 2009
Financing the Global Power Business: Insights from CERAWeek IHS CERA Insight 2009
Concentrating Solar Power: US Demand Heats Up IHS CERA Decision Brief 2008
US CO2 Policy Quandary: Near-term Reductions Imply a High Carbon Price IHS CERA Private Report 2008
The US Energy Act of 2007: Addressing the Demand Side of Electric Power IHS CERA Insight 2008
Investors’ Energy Monthly December 2004 – November 2007
Some Sail, Some Fail: Utility M&A after PUHCA IHS CERA Decision Brief 2006
Another Decade of Rising Upstream Costs? IHS CERA Decision Brief 2006
Merchant Power’s Recovery: Four Dimensions of Value IHS CERA Private Report 2006
PUHCA Repeal and Utility M&A: One Big Obstacle Down, Many Remain IHS CERA Decision Brief 2005
North American Gas Monthly Briefing January 2003 - June 2004
Costs are Up for North American Natural Gas IHS CERA Decision Brief 2004
Bottom Line: A New Long-term Floor for North American Gas Prices IHS CERA Private Report 2004
Upstream Gas Costs and North American E&P Strategy: Avoiding the Edge IHS CERA Decision Brief 2004
Can We Drill Our Way Out of the (Natural Gas) Supply Shortage? IHS CERA Decision Brief 2003
Cost-effective Deepwater Development: Seeing the Forest from the “Trees” IHS CERA Private Report 2001
Optimization and the Role of R&D IHS CERA Decision Brief 2001
Upstream Spending Plans: Inflation in the Pipeline IHS CERA Alert 2001
Upstream Technology on the Horizon IHS CERA Decision Brief 2000
Upstream Costs--Why the Gap will widen IHS CERA Decision Brief 1999
The Impact of Falling Oil Prices on Upstream Operations IHS CERA Decision Brief 1998
The Technology Revolution and Upstream Costs IHS CERA Private Report 1998
Managing the Rig Shortage IHS CERA Decision Brief 1997
SPEAKING ENGAGEMENTS:
News Media
“Upstream oil costs on the rise” (excerpts from Another Decade of Rising Upstream Costs? IHS CERA Decision
Brief 2006), The Wall Street Journal Morning Brief, June 28, 2006.
“Unnatural Gas Prices,” live television interview for CNN-FN, December 23, 2003.

***Confidential work product, subject to attorney/client privilege ***
London Economics International LLC 55 contact: 717 Atlantic Avenue, Suite 1A Marie Fagan Boston, MA 02111 617-933-7205 www.londoneconomics.com [email protected]
IHS/CERA CERAWeek Roles
Chairman, Coal Plenary Envisioning a Long-term Role for Coal, March 10, 2011
Chairman, Strategy Session Financing the Power Future, March 10, 2011
Chairman, Expert Dialog North American Gas and Power Scenarios Wildcards, March 9, 2011
Chairman, Strategy Session Financing a North American Power Sector in Transition, March 12, 2010
Panelist, CERA Insights Global Power Outlook, March 12, 2010
Chairman, Strategy Session US Electric Power Transmission: the Battle of the Jurisdictions, March 11, 2010
Chairman, Critical Issue Forum, Financing the Power Sector in a Turbulent Economy, February 12, 2009
Chairman, Critical Issue Forum Power Sector Investment: Global Capital, Local Strategies February 15, 2008
Panelist, Leadership Circle Global Power Outlook February 14, 2008
Chairman, Critical Issue Forum Rising Costs and the Outlook for North American Gas, February 14, 2007
Host and Commentator, Reception for Institutional Investors February 13, 2007
Panelist, Critical Issue Forum Oil Sector Finance: the Cliff behind the Clouds? February 13, 2007
Host and Commentator, Reception for Institutional Investors February 7, 2006
Chairman, Critical Issue Forum Financing the Oil Future: A Three-Trillion Dollar Dilemma February 7, 2006
Host and Commentator, Reception for Institutional Investors February 15, 2005
Chairman, Critical Issue Forum North American Natural Gas: E&P in a Mature Region February 11, 2004
Chairman, Expert Briefing North American Gas E&P Strategy: Getting off the Treadmill? February 12, 2003
Panelist, Expert Briefing Bracing for a Wild Ride: North American Gas Market Outlook February 11, 2003