th quarter and full year fy17 results - acmkentico-prd.s3 ... · through targeted marketing and...
TRANSCRIPT

4th Quarter and Full Year FY17 Results
28th March 2017

This document contains certain forward-looking statements with respect to Astro Malaysia Holdings Berhad’s (“Astro”) financial condition,
results of operations and business, and management’s strategy, plans and objectives for Astro. These statements include, without
limitation, those that express forecasts, expectations and projections such as forecasts, expectations and projections in relation to new
products and services, revenue, profit, cash flow, operational metrics etc.
These statements (and all other forward-looking statements contained in this document) are not guarantees of future performance and are
subject to risks, uncertainties and other factors, some of which are beyond Astro’s control, are difficult to predict and could cause actual
results to differ materially from those expressed or implied or forecast in the forward-looking statements. These factors include, but are
not limited to, the fact that Astro operates in a competitive environment that is subject to rapid change, the effects of laws and
government regulation upon Astro’s activities, its reliance on technology which is subject to risk of failure, change and development, the
fact that Astro is reliant on encryption and other technologies to restrict unauthorised access to its services, failure of key suppliers, risks
inherent in the implementation of large-scale capital expenditure projects, and the fact that Astro relies on intellectual property and
proprietary rights which may not be adequately protected under current laws or which may be subject to unauthorised use.
All forward-looking statements in this presentation are based on information known to Astro on the date hereof. Astro undertakes no
obligation publicly to update or revise any forward-looking statements, whether as a result of new information, future events or otherwise.
This presentation has been prepared by Astro. The information in this presentation, including forward-looking statements, has not been
independently verified. Without limiting any of the foregoing in this disclaimer, no representation or warranty, express or implied, is made
as to, and no reliance should be placed on, the fairness, accuracy or completeness of such information. Astro and its subsidiaries,
affiliates, representatives and advisers shall have no liability whatsoever (whether in negligence or otherwise) for any loss, damage, costs
or expenses howsoever arising out of or in connection with this presentation.
Disclaimer
1 | 4QFY17 results

• Go Shop grew revenue 38% YoY
• 70% to 73% Radex share
• 35% to 38% TV Adex share
• 4.8mn to 5.1mn customers
• 67% to 71% HH penetration
• 1.3mn to 1.7mn NJOI customers
• Content IPs/verticals
• Digitalisation & customer experience
• Operational efficiencies
• Reach & scale
Revenue +2%RM5.48bn → RM5.61bn
FCF of RM1.3bn +3%211% of PATAMI
Adex +10%RM640mn → RM705mn
GROW
MONETISE
LEAD
INVEST
PATAMI +1%RM615mn → RM624mn
Key highlights of FY17 performance
• 95% on B.yond STBs
• Vernacular content drives viewership
• 76% to 77% share of TV viewership
• 15.6mn radio listenership
• 912k Go Shop customers
2 | 4QFY17 results
EBITDA -6%RM1.94bn → RM1.82bn

Pay Premium
Pay
Pay-lite
Freemium
Serving households and individuals; multi-screens
SIGNATURE VERNACULAR IPs
SPORTS
BEST OF ON-DEMAND AND DAY/DATE(own all windows and screens)
• Exclusive content and box sets
• Premium window content
• Content portability
Households Individuals
• Repurpose for digital and millennials
• Best of linear, premium
live sports
• eSports for millennials
CinemaAstro First
Astro Best
On-DemandCatch-up
SVOD
TVOD
ESTBox-sets
PAYG
LINEAR EXCLUSIVES
Winning Malaysian consumers…
3 | 4QFY17 results

MAT churn (%)
9.4% 9.5% 10.0%10.9%
3QFY16 4QFY16 1QFY17 2QFY17 3QFY17 4QFY17
12.4%
…and serving 5.1mn households and 21mn individuals,
including 1mn Tribe registered users, across the region
3,534 3,550 3,504 3,493 3,443 3,467
1,163 1,268 1,395 1,481 1,579 1,654
3QFY16 4QFY16 1QFY17 2QFY17 3QFY17 4QFY17
Pay-TV NJOI
Households (000s)
11.9%
4 | 4QFY17 results
71%67% 69% 69% 70%66%
Household Penetration
OTT (Registered Users) (mn)
1.1
1.0
4QFY17 4QFY17
Astro GO Tribe

23%
77%
Viewership Share
(47%)
3:51 3:55
2:01 2:01
FY16 FY17
Avg. Time Spent/Day
13.8 13.9
8.6 8.1
FY16 FY17
Avg. Daily Viewers (mn)
Astro FTA
Increase in viewership share, daily viewers & time spent…
+1pp
188channels
Pay-TV72
Astro-branded
channels
60HD channels
NJOI
28channels
NB (1) Number of channels as at 31 January
(2) Target Audience: Kantar Media, Dynamic TV Audience Measurement (DTAM). All Astro viewers.
Period: FY16 vs FY175 | 4QFY17 results

Ready to scale regionally
.com.my
#1Leading local
online media on
Comscore
Best for
reaching Malay
audiences
Best for reaching
millennials &
digital natives
#1
#1
Local No. 1
…with growing flagship digital brands & services
6 | 4QFY17 results

93.2
96.0
99.099.3
100.4
FY13 FY14 FY15 FY16 FY17
ARPU (RM)
Gaining a higher share of the consumer wallet
7 | 4QFY17 results

NB (1) As a % of customers with B.yond STB
Upselling of value-added products and services remains a
key priority
Multiroom
409 406 405
3QFY16 4QFY16 1QFY17 2QFY17 3QFY17 4QFY17
412411 413
(000s)
960 964 968 958 928 909
372 400 418 429 442 454
3QFY16 4QFY16 1QFY17 2QFY17 3QFY17 4QFY17
Superpack/Superpack Plus Valuepack
(000s)VALUEPACK
1,890 1,938 1,939 1,924 1,902 1,961
3QFY16 4QFY16 1QFY17 2QFY17 3QFY17 4QFY17
(000s)
Penetration(1)
59%58% 59% 59% 59%831 877
3QFY16 4QFY16 1QFY17 2QFY17 3QFY17 4QFY17
(000s)
903 908 92555 59
3QFY16 4QFY16 1QFY17 2QFY17 3QFY17 4QFY17
62
(000s)
6262
1,781 2,132 2,307
3QFY16 4QFY16 1QFY17 2QFY17 3QFY17 4QFY17
(000s)downloads
2,633 2,870
96660% 62
3,139
8 | 4QFY17 results

3mnApp
downloads
203%Increase of
daily activities
in Android
• Migrated to new OTT platform with new enhanced user
interface
• Personalised recommendations, deep linking, enhanced user
experience, social share and overall app performance uplift
• Increase of daily active users by 35% on iOS and 203% on
Android
Astro GO: Entertaining fans anytime, anywhere
9 | 4QFY17 results
179mins
Average Weekly Consumption
14%+
vs FY16
2.3mnSessions
14.5mnScreen views
23kVOD titles,
16k hours of
VOD, 71 linear
channels

5.2mn 4.9mn
5.0mn
2.9mn
2.0mn
318k
210k
10 | 4QFY17 results
Breaking viewership records with our diverse IPs

MOST WATCHED SHOW
5.2mn VIEWERSHIP
MOST TALKED ABOUT SHOW
1mn CONVERSATIONS
Suri Hati Mr. Pilot, our highest-rated show of all time
#1MOST GOOGLED
DRAMA
4.6mnTOTAL DIGITAL VIEWS
46mnSOCIAL MEDIA
REACH
SOLD OUTGSC MEET & GREET
11 | 4QFY17 results
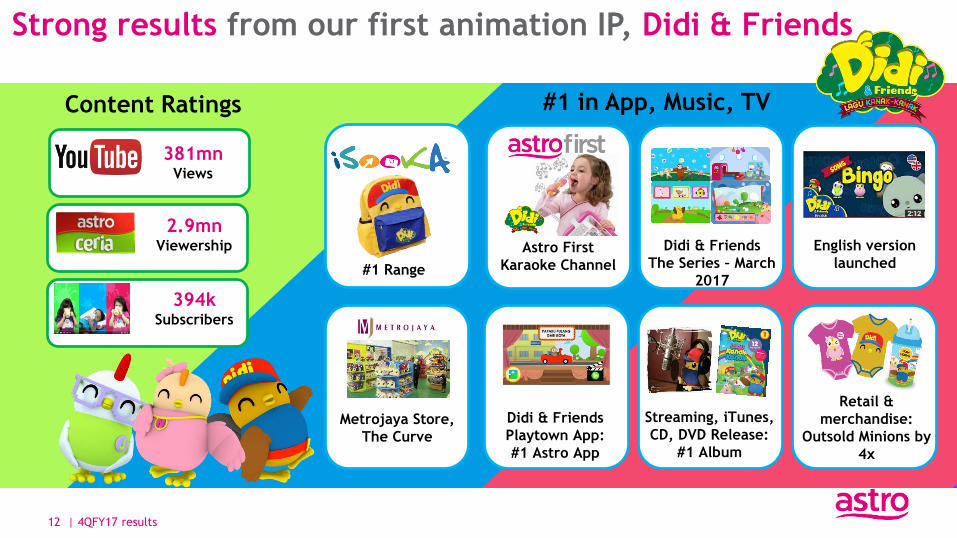
Didi & Friends
The Series – March
2017
— !
Didi & Friends
Playtown App:
#1 Astro App
Streaming, iTunes,
CD, DVD Release:
#1 Album
Retail &
merchandise:
Outsold Minions by
4x
English version
launchedAstro First
Karaoke Channel
Metrojaya Store,
The Curve
#1 in App, Music, TVContent Ratings
381mn Views
2.9mnViewership
394kSubscribers
#1 Range
Strong results from our first animation IP, Didi & Friends
12 | 4QFY17 results

Develop a collaborative & innovative culture
Organisation People Processes Technology
Inculcate mindset & skills to foster innovation
Design Astro-optimisedproducts & capabilities
Adopt cloud, advanced analytics & agile model
To be a Digital-First, Cloud-First, Mobile-First Entertainment & Lifestyle company that delivers exceptional customer experiences
Innovate & Diversify Revenue Streams
Expand Platform & Monetise
Capabilities
Agile Operating Model for Higher
Efficiency
Build New Digital Capabilities
Achieve
We are transforming our core business…
↓ Cost of Delivery - IT↑ Customer Acquisition
↑ Customer Satisfaction ↑Cross Selling ↑Speed to Market ↓Cost of Experimentation
↑ Automation
13 | 4QFY17 results

TV
NextGen TVIoT/Smart Homes
Content
Wholesale
AdexDigital
Homes and individuals
Mobile
Discretionary• TVOD/PPV
• Event passes
• P2P
• Digital tokens
• Gifting
Multi-PlayHome Connectivity
…and well-positioned to capture growth opportunities across
the industry
14 | 4QFY17 results

An integrated shopping platform with Malaysia’s first 24-hour Malay (Ch.
118) and Chinese language (Ch. 318) home shopping channels, phone, e-
commerce and m-commerce
In November 2016, Go Shop Singapore, a Mandarin-channel was
launched in partnership with Starhub on StarHub Channel 110
Go Shop Singapore will leverage on StarHub’s deep insight
into consumers’ media consumption and purchasing habits
to serve the sophisticated and affluent Singaporean market
Go Shop: Continued growth across Malaysia and Singapore,
revenues up 38% YoY
15 | 4QFY17 results
Go Shop is set to develop its own IP for Islamic
lifestyle products in FY18 as an example of its
product and branding differentiation strategy

PHILIPPINES
INDONESIA
16 | 4QFY17 results
Our OTT service, Tribe, strengthens our regional proposition
Through targeted marketing and strong partnerships across both the Philippines and Indonesia, Tribe has
reached close to 1 million registered users since launch
• Strong OOH branding efforts, targeted
digital marketing, and engaging on-ground
activities
• Tribe is actively exploring partnerships
with telcos to further enhance growth in
Indonesia
Strategic partnership with telco giant, Globe
Telecom, provides Tribe with access to:
• Distribution and brand presence in over 70
Globe retail stores nationwide
• Globe’s digital channels and social media
Both parties are actively exploring content
collaborations to further enhance proposition
to end users

17 | 4QFY17 results
Highlights FY16 FY17 Growth
TV households (000s)(1) 7,143 7,207 1%
TV household penetration(2) 67% 71% 4pp
TV household penetration (000s) 4,818 5,121 6%
Pay TV households (000s) 3,550 3,467 (2%)
NJOI households (000s) 1,268 1,654 30%
Pay TV gross adds (000s) 373 330 (12%)
MAT churn 10% 12% 2pp
Net adds (000s) 389 302 (22%)
Pay TV households (000s) 40 (83) (308%)
NJOI households (000s) 349 386 11%
B.yond STB penetration 93% 95% 2pp
ARPU (RM) 99.3 100.4 1%
Astro TV viewership share(3) 76% 77% 1pp
Radio listenership (mn)(4) 12.8 15.6 22%
Adex (RM mn) 640 705 10%
Revenue (RM mn) 5,475 5,613 2%
EBITDA (RM mn) 1,941 1,817 (6%)
EBITDA margin 35% 32% (3pp)
PATAMI (RM mn) 615 624 1%
FCF (RM mn) 1,276 1,317 3%
EPS (RM sen) 11.8 12.0 2%
NB
(1) TV household data sourced from the
Department of Statistics Malaysia and
Media Partners Asia
(2) Household penetration includes both
residential Pay-TV customers and NJOI
customers
(3) Viewership share is based on DTAM
deployed by Kantar Media as of FY17.
Comparatives in FY16 are updated
accordingly
(4) There is a change in audience
measurement partner for the radio
industry in Malaysia commencing
H2FY17. The ratings prior to the change
was provided by Nielsen whereas it is
now being provided by GfK. Share of
radex is based on internal estimates
(5) Data presented are for the 12 months
ended 31 January
(6) Numbers may not add up due to
rounding differences
FY17 snapshot

YoY revenue growth underpinned by Go Shop and Adex
1,087 1,094 1,083 1,096 1,076 1,095 1,090 1,094
75 87 86 96 78
99 105 95 62
81 75 78
72 87 83 86 37
38 52 63
64
74 62 61 70 69 77
68 72
72 84 62 1,330 1,369 1,374
1,402 1,363
1,428 1,424 1,397
1QFY16 2QFY16 3QFY16 4QFY16 1QFY17 2QFY17 3QFY17 4QFY17
Other
Go Shop
Radio
TV adex
TV subscription
(RM mn)
2%
11%
10%
0%
Total revenue YoY growth(2)
NB
(1) Other revenue includes licensing income, publications adex, programme sales, NJOI revenue and theatrical revenue
(2) YoY refers to FY17 vs. FY16
(3) Numbers may not add up due to rounding differences
38%
(1)
18 | 4QFY17 results
2%

73 86 84
93 77
99 104 95
62
81 75
78
72
87 83 86 2
2 2
2
1
1 1 0
136
168 161
174
150
186 188 181
1QFY16 2QFY16 3QFY16 4QFY16 1QFY17 2QFY17 3QFY17 4QFY17
TV Radio Publications
4QFY16 4QFY17
Advertising income consistently outperforming the industry
Advertising income (RM mn) YoY growth(2)
(66)%
11%
12%
(1)
Total Malaysia
gross ADEX YoY
growth
OVERALL ADEX
(2%)
RADIO
5%
TV
2%
(2)(5)70%
73%
4QFY16 4QFY17
Share of Radex
35%38%
4QFY16 4QFY17
Share of TV adex
Radio listeners (mn)
76% 77%
4QFY16 4QFY17
Astro TV
viewership share
(3)
(4)
NB
(1) Advertising income is net of commissions and discounts
(2) YoY refers to FY17 vs. FY16
(3) There is a change in audience measurement partner for the radio
industry in Malaysia commencing H2FY17. The ratings prior to the
change was provided by Nielsen whereas it is now being provided
by GfK. Share of radex is based on internal estimates
(4) Viewership share is based on DTAM deployed by Kantar Media as
of FY17, comparatives in FY16 are updated accordingly. Share of
TV adex is based on Astro and Group M’s estimates
(5) Malaysia gross adex figures are based on Nielsen and Group M’s
data
(6) Numbers may not add up due to rounding differences
12.8
19 | 4QFY17 results
15.610%

Cost optimisation success despite global rise in content cost
and USD strength
397 411 427 420 406 492 469 430
417 428 440 436 427 406 415 417
124 124 141 139 117 121 120 136
131 131 114 118 135 166 133 147
1,070 1,095 1,121 1,113 1,085 1,184 1,136 1,129
1QFY16 2QFY16 3QFY16 4QFY16 1QFY17 2QFY17 3QFY17 4QFY17
Content costs Operating expenses
Marketing & distribution costs Administrative expenses
Content cost as %
of TV revenue
(RM mn)
33% 39%
Total operating expenditure
34% 33% 37%
NB
(1) Content costs and operating expenses are jointly disclosed as cost of sales in our financial statements
(2) Operating expenses include STB installation and smartcard costs, depreciation and amortisation, as well as maintenance costs
(3) Numbers may not add up due to rounding differences
(1) (2)
20 | 4QFY17 results
34%33%32%

150
57
122
106
32
83
FY16 FY17
Revenue Growth Digitalisation Capital Maintenance
NB
(1) Data presented are for the 12 months ended 31 January
(2) Numbers may not add up due to rounding differences
Applying ROI discipline in capex spend
6% 4%as % of
revenue
(RM mn)
316 163
FY16 FY17
6% 3%as % of
revenue
(RM mn)
Key capex investments in FY17 include:
Product and service upgrading
Technology infrastructure
Customer experience
Cash capex Capitalised capex
STBs/ODUs are owned by Astro, and are capitalised
STBs/ODUs are conservatively amortised over 3 years;
note that actual useful life is typically greater than 5
years
Discretionary 36 month bullet payment vendor
financing is available for Astro for STB/ODU purchases
RM801mn of vendor financing recorded in payables, of
which RM311mn is current and RM490mn is non-
current
246
304
21 | 4QFY17 results

Strong cash generation significantly exceeds PATAMI…
1,944 1,888
668 572
1,276 1,317
Cash fromoperations
Cash frominvesting
Free cash flow Cash fromoperations
Cash frominvesting
Free cash flow(2) (3) (3)(2)
207% 211%as % of PATAMI
(RM mn)
FY16 FY17
Free cash flow
…enabling significant flexibility on capital management and dividend policy
NB
(1) Data presented are for the 12 months ended 31 January
(2) Excludes investments, disposals and maturities of unit trust and money market funds
(3) Excludes repayments of vendor financing and payments of finance leases, which are categorised as cash from financing
to be consistent with Bursa disclosure
(4) Numbers may not add up due to rounding differences
22 | 4QFY17 results

Leveraging on invested capital, AMH continues to be highly cash generative
The Board of Directors of AMH has declared a quarterly dividend of 3.00 sen per share for 4QFY17
and a final dividend of 0.50 sen per share, subject to shareholders’ approval at the upcoming AGM
in June 2017
Quarterly dividend entitlement and payment dates: 12th April 2017 and 27th April 2017,
respectively
Quarterly dividend announcement
23 | 4QFY17 results

Appendix

(RM mn) FY16 FY17
EBITDA 1,941 1,817
Margin % 35% 32%
Depreciation and amortisation (826) (721)
EBIT 1,115 1,095
Margin % 20% 20%
Finance income 53 35
Finance cost (346) (272)
Share of post tax results from investments 8 2
Impairment of investments accounted for using the equity
method- (15)
PBT 829 846
Tax expense (221) (229)
Tax rate % 27% 27%
PAT 608 617
PATAMI 615 624
Margin % 11% 11%
Normalised PATAMI 662 648
Margin % 12% 12%
NB
(1) Depreciation and amortisation
excludes the amortisation of film
library and programme rights which is
expensed as part of content costs (cost
of sales)
(2) Normalised PATAMI excludes post-tax
impact of unrealised forex loss
(RM33.7m) due to revaluation of M3B
transponder lease liability
(3) Numbers may not add up due to
rounding differences
(2)
PAT reconciliation
(1)
25 | 4QFY17 results

(RM mn) FY16 FY17
Non-current assets 4,813 4,559
Property, plant and equipment 2,129 1,818
Other non-current assets 2,683 2,741
Current assets 2,088 1,707
Receivables and prepayments 955 859
Cash and bank balances(1) 979 647
Other current assets 154 202
6,901 6,266
(RM mn) FY16 FY17
Non-current liabilities 4,006 3,356
Payables 626 490
Borrowings 3,286 2,776
Other non-current liabilities 94 90
Current liabilities 2,281 2,280
Payables 1,658 1,627
Borrowings 520 629
Other current liabilities 104 24
Shareholders’ equity 614 630
6,901 6,266
Net debt / LTM EBITDA: 1.5x
NB
(1) Includes money market unit trusts
(2) Data presented are as at 31 January
(3) Numbers may not add up due to rounding differences
Group Balance Sheet overview
26 | 4QFY17 results

1,066
1,363
990
FY17
Finance lease RM term loan USD term loan
USD term
loan
RM term
loan
Finance lease
(primarily
satellite
transponders)
Finance lease related to lease of Ku-band transponders on MEASAT-3,
MEASAT-3A and MEASAT-3B. Payment arrangement for the remaining
contractual years for M3 and M3A have been redenominated into Ringgit
at USD/RM3.0445 w.e.f. 21 May 2013. The unhedged portion of the
finance lease related to M3B is USD122.0m
Effective interest rate: 6.2%, 12.5% and 5.6% p.a. for M3, M3A and M3B
respectively
Average life: 15 years
3,406
(RM mn)Total borrowings Details of borrowings
Total borrowings is net of debt
issuance costs (RM13.5 mn)
As at 31 January 2017, outstanding principal US dollar term loan stood at
US$222.75mn. The eighth principal repayment of USD24.75mn
(RM74.72mn) is scheduled to be paid on 8 June 2017
Fully hedged via cross currency interest rate swap at an exchange rate of
USD/RM3.0189 and an all-in interest rate of 4.19% p.a.
Back ended amortisation schedule. With first drawdown date of 8 June
2011, average life is 7 years with final maturity date of 8 June 2021
As at 31 January 2017, total outstanding principal RM term loan stood at
RM1,350mn. The eighth principal repayment of RM150mn is scheduled to
be paid on 19 May 2017
All-in interest rate (post-hedging) for the hedged portion of
RM1,012.5mn is 5.4467% while balance unhedged of RM337.5mn stood at
4.8200% (variable floating rate based on cost of funds)
Back ended amortisation schedule. With first drawdown date of 19 May
2011, average life is 7 years with final maturity date of 19 May 2021
Debt profile
27 | 4QFY17 results

Thank you