thai oil public company limited · thai oil public company limited ... thaioil power (tp) 3-on-1...
TRANSCRIPT
Thai Oil Public Company Limited
Presentation to Investors
“PTT Corporate Day”arranged by Deutsche Bank
23-24 January 2006

2CONFIDENTIAL – NOT FOR DISTRIBUTION, NOT AN OFFER OF SECURITIES
Disclaimer:
The information contained in this presentation is intended solely for your personal reference only. Please do not circulate this material. If you are not an intended recipient, you must not read, disclose, copy, retain, distribute or take any action in reliance upon it.
3
Content
I) Highlights
II) Business & Operations Update
III) Consolidated Financial Results
IV) Investment Projects
V) Conclusion

4
I) Highlights

5
9%55%
Thaioil GroupThaioil Group
Thaioil Power Thaioil Power (TP)(TP)
3-on-1 Combined cycleElectricity 118 MWSteam 168 T/hr
Independent Independent Power (Thailand) Power (Thailand)
(IPT)(IPT)PTT 20%
Thaioil 24%
2-on-1 Gas-fired,Combined cycleElectricity 700 MWRelated Business &
Income Stability
Thai Paraxylene Thai Paraxylene (TPX)(TPX)
Thai Lube Base Thai Lube Base (TLB)(TLB)
Capacity: Current: 348 Kt/y (PX)Mid 07: 853 Kt/y total
408 Kt/y (PX)160 Kt/y (Bz)136 Kt/y (To) 149 Kt/y (MX)
Value Enhancement
Capacity: Lube Base oil: 270 Kt/y
Thaioil Marine Thaioil Marine (TM)(TM)
A fleet of 5 oil & petrochemical vessels with int’l classificationsTotal capacity: approx 30,000 DWT
ThapplineThappline
Multi-product Pipeline Capacity: 26,000 mn Litres/Y.
Product Marketing Support
100%
56%
100% 100%
Capacity: Current: 220 KbdMid 07: 270 Kbd
Utility Supply to Group
Thaioil Thaioil (TOP)(TOP)
RefineryRefineryPetrochemPetrochem//
Lube Base Lube Base OIlOIl PowerPower TransportationTransportation
TOP Info:# of shares: 2,040 mnMkt Cap: ~US$ 3.4bn Mkt Cap Ranking: 7
Shareholder structurePTT 49.54%Free float 43.28%Others 7.18%
PTT 26% JPOWER 19%
Core Refining Operations 5

6
(Bt Mn) 9M/05 9M/04 +/- 9M/04 FY04
1. Sales Rev. 182,030 130,317 +40% 184,801
2. EBITDA 24,201 18,364 +32% 25,494
3. Profit Bef. Tax 16,633 11,063 +50% 18,040
4.Tax (3,157) (1,014) +211% (2,967)
5. Net Profit 13,476 10,049 +34% 15,073
6. EPS (Bht/share) 6.61 5.29 +25% 7.82
Financial Highlights

7
1%
Significant Increased Contributions from SubsidiariesSignificant Increased Contributions from Subsidiaries
+40%Sales RevenueSales Revenue
+34%
99%Net ProfitNet Profit
Remark: % is based on total amount
Before deducting inter-company transaction.
Refinery
Power 4% Transportation
95%
9M’04
Refinery
Power 1%
9M’05
* acquired 100% in Oct’04 Transportation
68%
27%
1%
Refinery
TransportationPetrochem/Lube Base*
81%
15%Refinery
Power 4%
Power 4%
Bt. 182 Bt. 182 bnbn..
Bt. 13 Bt. 13 bnbn..
Bt. 130 Bt. 130 bnbn..
Bt. 10 Bt. 10 bnbn..
Petrochem/Lube Base*
0%
8
II) Business & Operations Update
9
CDU-1CDU-2
CDU-3
TCU19,300
HCU-1
FCCU10,300
CCR-1
HDT-1
KMT2,400
HDS-1
LPG
ULG 95
JET
KEROSENE
GAS OIL
ULG 91
HCU-247,600
CCR-250,000
HVU-1HVU-2
HVU-395,000
HDT-2
HDT-374,900
205,000
FUEL OIL
HDS-2HDS-374,000
MXMX*34,300
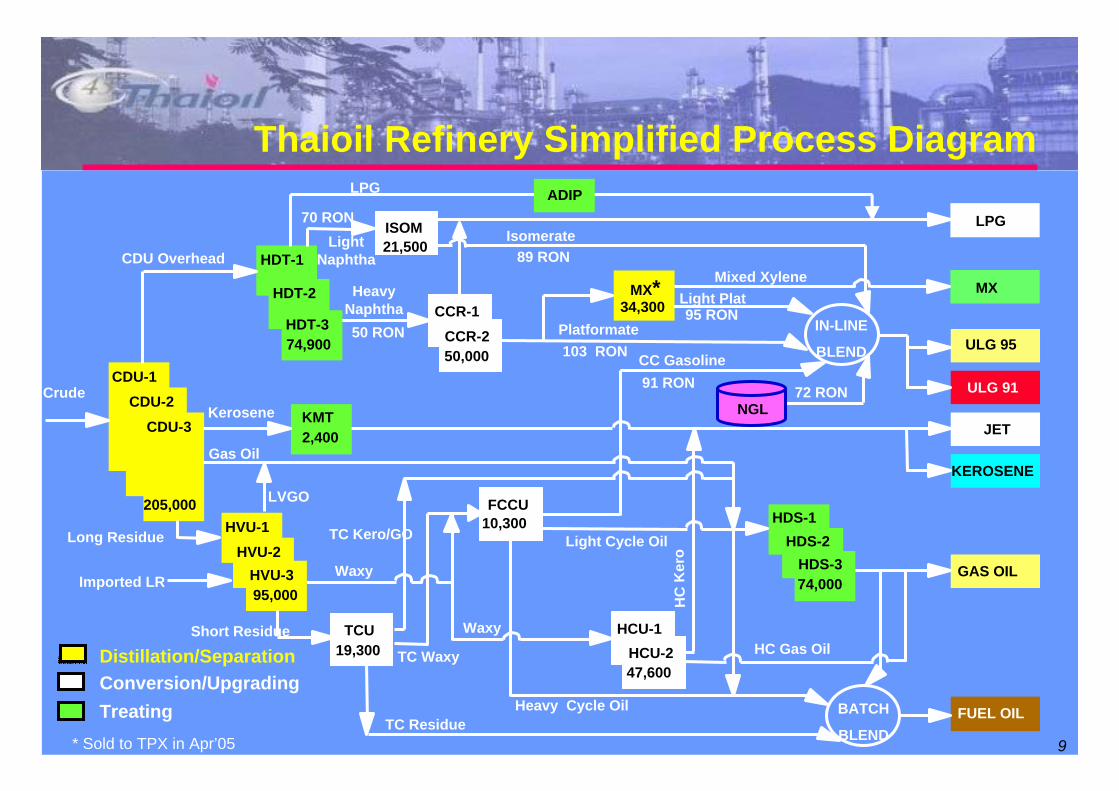
Thaioil Refinery Simplified Process Diagram
Crude
Distillation/SeparationConversion/UpgradingTreating
Long Residue
LVGO
Gas Oil
Kerosene
CDU Overhead
Short Residue
TC Residue
TC Waxy
Heavy Cycle Oil
HC Gas Oil
HeavyNaphtha
Platformate
LPG
Light Plat
Light Cycle Oil
HC
Ker
o
Waxy
CC Gasoline
ADIP
Isomerate
NGL72 RON
Mixed Xylene
50 RON
70 RONISOM21,500
Waxy
IN-LINE
BLEND
BATCH
BLEND
LightNaphtha
Imported LR
TC Kero/GO
95 RON
103 RON
89 RON
91 RON
* Sold to TPX in Apr’05 9
10
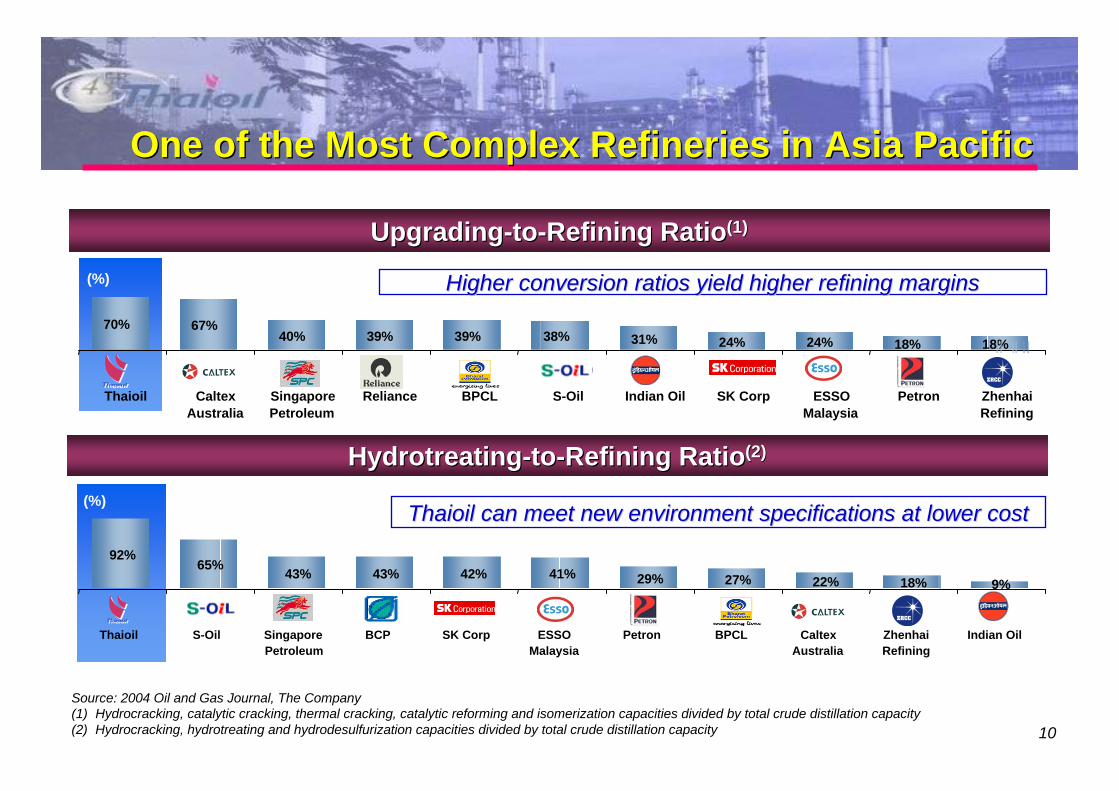
70% 67%40% 39% 39% 38% 31% 24% 24% 18% 18%
Thaioil CaltexAustralia
SingaporePetroleum
Reliance BPCL S-Oil Indian Oil SK Corp ESSOMalaysia
Petron ZhenhaiRefining
One of the Most Complex Refineries in Asia PacificOne of the Most Complex Refineries in Asia Pacific
(%)
Thaioil can meet new environment specifications at lower costThaioil can meet new environment specifications at lower cost
UpgradingUpgrading--toto--Refining RatioRefining Ratio(1)(1)
Source: 2004 Oil and Gas Journal, The Company(1) Hydrocracking, catalytic cracking, thermal cracking, catalytic reforming and isomerization capacities divided by total crude distillation capacity(2) Hydrocracking, hydrotreating and hydrodesulfurization capacities divided by total crude distillation capacity
HydrotreatingHydrotreating--toto--Refining RatioRefining Ratio(2)(2)
(%)
Higher conversion ratios yield higher refining marginsHigher conversion ratios yield higher refining margins(%)
92%65% 43% 43% 42% 41% 29% 27% 22% 18% 9%
Thaioil S-Oil SingaporePetroleum
BCP SK Corp ESSOMalaysia
Petron BPCL CaltexAustralia
ZhenhaiRefining
Indian Oil

11
Operating Cost Index
AnnualizedMaintenance
Costs
Maintenance Effort(Based on Headcounts)
Avg. Personnel Cost
Shell Personnel Index (Based on Headcounts)
CEL
Corrected Energy Loss
Utilization
OperationalAvailability
2003 2004
One of the Best Performing Refineries in the WorldShell Worldwide Annual Benchmarking
High maintenance effort and Personnel Index is offset by
low labor costs.
11
12
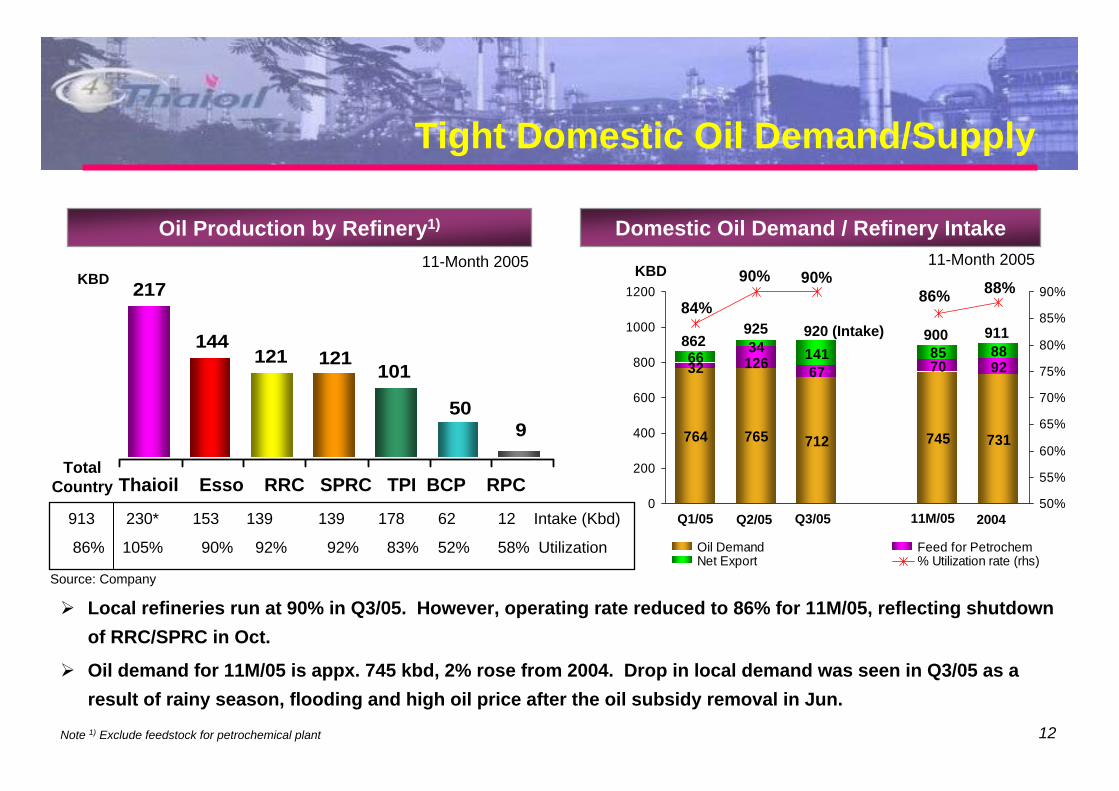
913 230* 153 139 139 178 62 12 Intake (Kbd)
86% 105% 90% 92% 92% 83% 52% 58% Utilization
950
101121121
144
217KBD
Oil Production by Refinery1)
Local refineries run at 90% in Q3/05. However, operating rate reduced to 86% for 11M/05, reflecting shutdown of RRC/SPRC in Oct.
Oil demand for 11M/05 is appx. 745 kbd, 2% rose from 2004. Drop in local demand was seen in Q3/05 as a result of rainy season, flooding and high oil price after the oil subsidy removal in Jun.
Note 1) Exclude feedstock for petrochemical plant
Tight Domestic Oil Demand/Supply
Domestic Oil Demand / Refinery Intake
Thaioil Esso RRC SPRC TPI BCP RPC
Source: Company
764 765 712 745 731
67 70 92141 85 88
32 1266634
86%90%
84%88%90%
0
200
400
600
800
1000
1200
50%
55%
60%
65%
70%
75%
80%
85%
90%
Oil Demand Feed for PetrochemNet Export % Utilization rate (rhs)
KBD
Q1/05 Q2/05 Q3/05 200411M/05
862 900925 920 (Intake) 911
11-Month 2005 11-Month 2005
TotalCountry

13
30
40
50
60
J200
4 M M J S N
J'05 M M J S N
With multiple cracking and treating facilities, Thaioil has flexibility to select most economical crude capitalizing on the favorable sweet and sour differential to optimize refinery operation. 2005 Average Oil Prices
Upto 80% of crude from Middle East (whose prices are more attractive than Far East sweet grade) are normally processed.
LR purchased from BCP during the first 9 months was about 9 kbd on average.
Thaioil could process higher Far East and local crude due to better quality when price differential between M/E-F/E became narrow (i.e. in Q3/05).
Middle distillate was produced to meet local demand (represents about 50% of Country's demand).
Refinery Intake and Production
ThaioilThaioil’’ss Crude Mix and Product YieldCrude Mix and Product Yield
US$/bblTapis
Dubai
8.588.58
TPTP--DBDB
40.3140.3164.0364.0362.1062.1057.9057.9049.3249.32
Fuel OilFuel OilDieselDieselULG 95ULG 95TapisTapisDubaiDubai
80% 75%
6%6%
14% 19%
16%
53%56%
56%
38%28%
9% 11%
33%
ThaioilThaioil’’ss Crude Mix and Product YieldCrude Mix and Product Yield
Middle East
Far East
Heavy
Light
Distillate
Middle
2005
Others
2004
Crude Mix Product Yield Domestic Demand
11M05

14
BCP 4%
TPX 11%
Shell/Caltex,14%
PTT, 49%
Export, 14%
OtherIndependent
domestic,15%
39
49
59
69
79
Jul'0
4 A S O N D
J'05 F M A M J J A S
Refinery Customers BreakdownRefinery Customers Breakdown
FY 05
Including 7% export of PTT
Appx 49% of products was sold to PTT at the market prices. (Domestic 42% and Export 7%).
About 14% of products was sold to Shell and Caltex (Marketing). While Sales to other customers was 15%.
Although the export in Q3/05 increased due to rainy season and slow domestic demand growth, overall export for 2005 was only 14% (compared with country export of 17%).
When export, Thaioil switched to produce more Jet fuel at the expense of diesel due to its more favorable price.
Jet
Diesel
US$/bbl

15
20
30
40
50
60
70
80
Jan' 0
4 M M J S NJa
n' 05 M M J S N
Oil Prices Movement and GRMOil Prices Movement
Strong demand and tight supply supported high oil prices during the first 9M.
Hurricanes in US and slow recoveries of US refineries fueled gasoline, diesel and other oil prices in Q3.
Delayed and warmer winter in The States, coupled with high stock pile post Katrina weakened prices in Q4/05.
Dipped in Thaioil’s GRM in Q2/05 was due to softening product price in May (high US inventory).
GRM in Q3/05 rebounded as a result of Katrina.
Regional GRM was pressured In Q4/04, due to warmer weather, stock up in US, prompt high VLCC freight as well as lackluster demand from high oil price (after subsidy reduction/removal in certain countries).
Thaioil’s GRM (incl. MX)
* Transfer MX to TPX as from April 1 2005* Transfer MX to TPX as from April 1 2005
US$/bbl
Diesel
Gasoline
Tapis
OmanFuel Oil
US$/bbl
0
2
4
6
8
10
Q1/05 Q2/05 Q3/05 FY/04 9M05
8.756.55+1
8.52+1
7.50
7.9+0.7
16
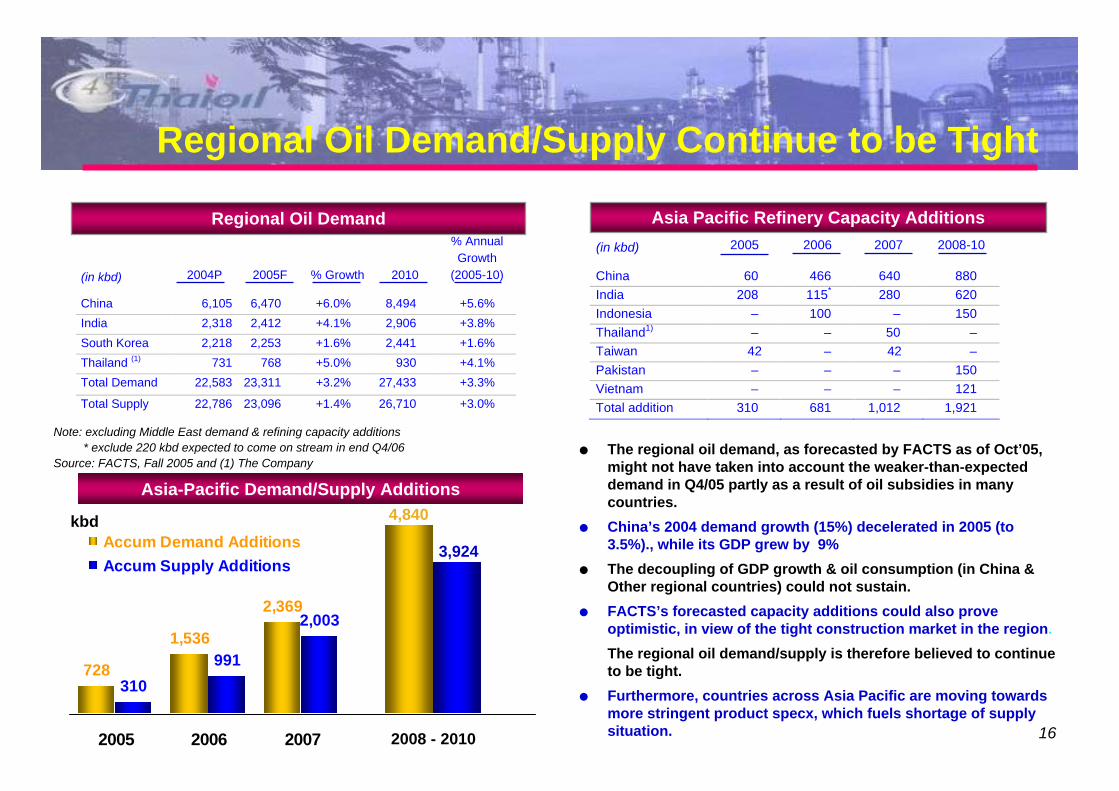
(in kbd) 2005 2006 2007 2008-10
China 60 466 640 880 India 208 115* 280 620 Indonesia – 100 – 150 Thailand1) – – 50 – Taiwan 42 – 42 – Pakistan – – – 150 Vietnam – – – 121 Total addition 310 681 1,012 1,921
(in kbd) 2004P 2005F % Growth 2010
% Annual Growth
(2005-10)
China 6,105 6,470 +6.0% 8,494 +5.6% India 2,318 2,412 +4.1% 2,906 +3.8% South Korea 2,218 2,253 +1.6% 2,441 +1.6% Thailand (1) 731 768 +5.0% 930 +4.1% Total Demand 22,583 23,311 +3.2% 27,433 +3.3%
Total Supply 22,786 23,096 +1.4% 26,710 +3.0%
Regional Oil Demand/Supply Continue to be Tight
Note: excluding Middle East demand & refining capacity additions* exclude 220 kbd expected to come on stream in end Q4/06
Source: FACTS, Fall 2005 and (1) The Company
Asia Pacific Refinery Capacity AdditionsRegional Oil Demand
Asia-Pacific Demand/Supply Additions
728
1,536
2,369
310991
2,003
2005 2006 2007
kbdAccum Demand AdditionsAccum Supply Additions
4,840
3,924
2008 - 2010
The regional oil demand, as forecasted by FACTS as of Oct’05, might not have taken into account the weaker-than-expected demand in Q4/05 partly as a result of oil subsidies in many countries.China’s 2004 demand growth (15%) decelerated in 2005 (to 3.5%)., while its GDP grew by 9%The decoupling of GDP growth & oil consumption (in China & Other regional countries) could not sustain.FACTS’s forecasted capacity additions could also prove optimistic, in view of the tight construction market in the region.The regional oil demand/supply is therefore believed to continueto be tight.Furthermore, countries across Asia Pacific are moving towards more stringent product specx, which fuels shortage of supply situation.
kbd
17
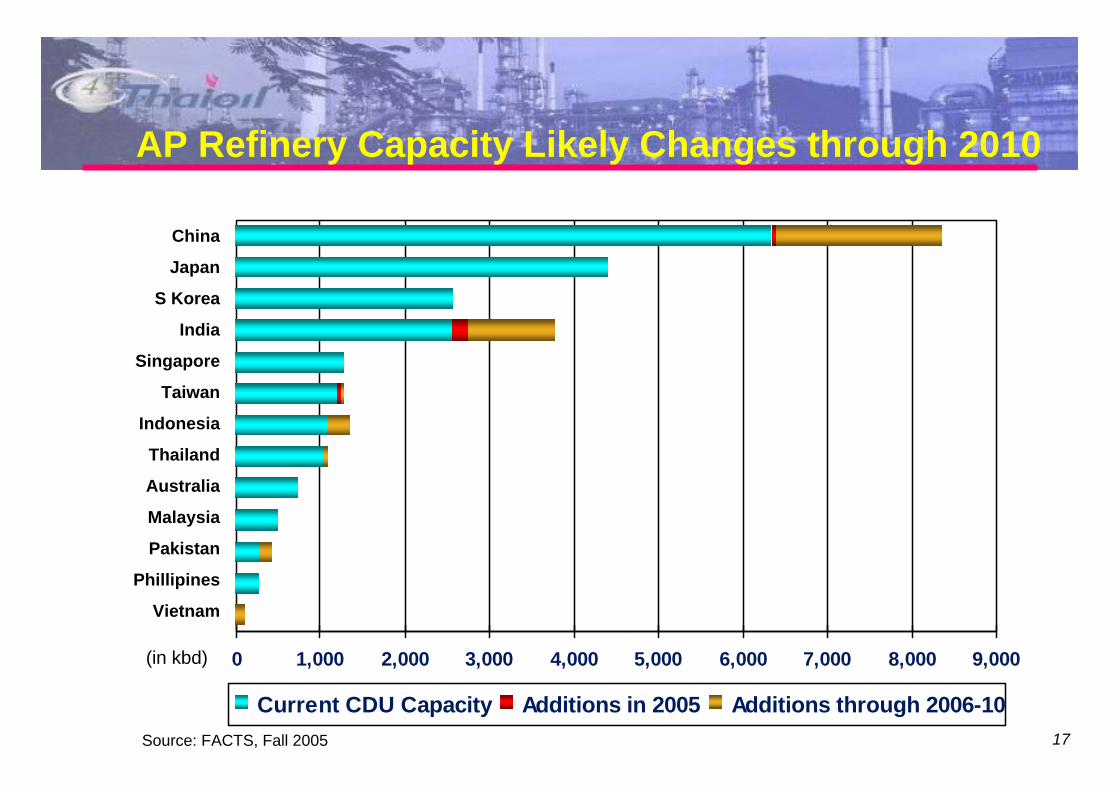
AP Refinery Capacity Likely Changes through 2010
0 1,000 2,000 3,000 4,000 5,000 6,000 7,000 8,000 9,000
Current CDU Capacity Additions in 2005 Additions through 2006-10
China
Japan
S Korea
India
Singapore
Taiwan
Indonesia
Thailand
Australia
Malaysia
Pakistan
Phillipines
Vietnam
(in kbd)
Source: FACTS, Fall 2005 17

18
TPX’s Business
Jan04 M M J S N
Jan' 0
5 M M J S NPlat
PX, MX and Platformate Spot Prices
PX
MX
US$/Ton
* Transfer MX to TPX as from April 1 2005
PX-PlatPX-MX
BackgroundAfter years of liquidity and profitability problems, TOP acquired 100% shares in Oct’04.In Jan’05, TPX invested US$ 5 M. to change catalyst and effectively increase PX output to 348 KTA (a 21% increase).In Apr’05, transfer MX unit was transfer to TPX.
2004 9M05Gross Margin (US$ M.) 20 80(Equivalent to $/bbl) 0.25 1.00
Net Profit (Baht M.) 115 2,371
PX Market
Other
S.E.Asia
N.E.Asia
Europe
North America
Utilization (rhs)Capacity (rhs)
South America
Source Company
World Production by Region
1,000
800
600
400
200
0
A utilization rate of more than 80% would trigger investment in new capacity. Regional PX demand grows at 6%, outpacing the supply growth of 2%, mainly driven by China.Thailand PX market 2005 2006
Demand - Tuntex 295 362- SMPC 714 965- Indorama -0- 429
Supply - ATC 495 455- Exxon 445 485- TPX 340 340
Surplus / (Deficit)
1,009
1,280
1,756
1,387
271 (476)

19
TLB’s Business
Background
Strong lube base oil price is supported by growing regional demand, tight supply (after closures of plants in Asia) and strong diesel price.
Lube base - HSFO spread widened from 280 US$/Ton in 2004 and 380 US$/ton in 2005.
9M/05 saw a 83% (full capacity utilization of lube base production unit). Net profit has gone up by 186%, as compared to 2004, to 1,352 Baht M.
Prior to TOP acquisition, TLB had experienced financial problems as a result of Baht devaluation and depressed lube base oil market.In Oct 04, TOP acquired 100% shares of TLB and fully integrated it with the refinery.TOP has commissioned a team to study and has identified 15 synergy projects with the refinery.TLB LT debt was reduced to zero.
Higher MPU’s Utilization / Profitability
Lube Base Market
Jan/04 M M J S N
Jan'0
5 M M J S N
US$/Ton
HSFO
500SN
20370 331
1,4351,352
-422
83%70%
60%
-500
0
500
1000
1500
2000
2003 2004 9M05-20%-10%0%10%20%30%40%50%60%70%80%90%
EBITDA Net Profit % MPU Utilization (Lube Production Unit)
Baht M.
Lube Base - HSFO800
600
400
200
0
% Utilization

20
IPT BusinessIPT Business
Plant Availability Improved Financial Performance
IPP IndustryBackground• Established in 1995 as a JV of TOP, Westinghouse and
Unocal. • During first IPP bidding in 1995, IPT won the mandate to
build the power plant to EGAT as the first ranked bid proposal among 32 bidders.
• IPT experienced technical problems with Westinghouse GTs which were later replaced with Siemens GTs in 2003 and 2005, respectively, at Siemens and Insurance expenses.
• With the new 2 GTs, IPT declared full availability of 700 MW as from Jun’05.
• Steady revenue nature, as PPA allow IPP to pass through variable cost to EGAT. IPP will get availability payment (AP) which covers fixed cost, debt service and return.
• Thailand electricity demand grows inline with GDP. Therefore EGAT plan to announce new round IPP in end 2006 / H107.
• TOP is ready for the 2nd IPP bidding (700-1400 MW),
(Baht M.) 9M/05 9M/04 +/(-)
• EBITDA 1,099 577 522
• Profit bef. FX/Extra Exp. 613 (200) 813
• FX/Extra. Expense (444) (269) (175)
• Net Profit 169 (469) 638
77%70%78%
57%48%
41%
0%
10%
20%
30%
40%
50%
60%
70%
80%
90%
100%
2000 2001 2002 2003 2004 2005
700 MW from Jun’05
* In year 2001, IPT report net profit of 813 Baht M.

21
III) Consolidated Financial Results
22
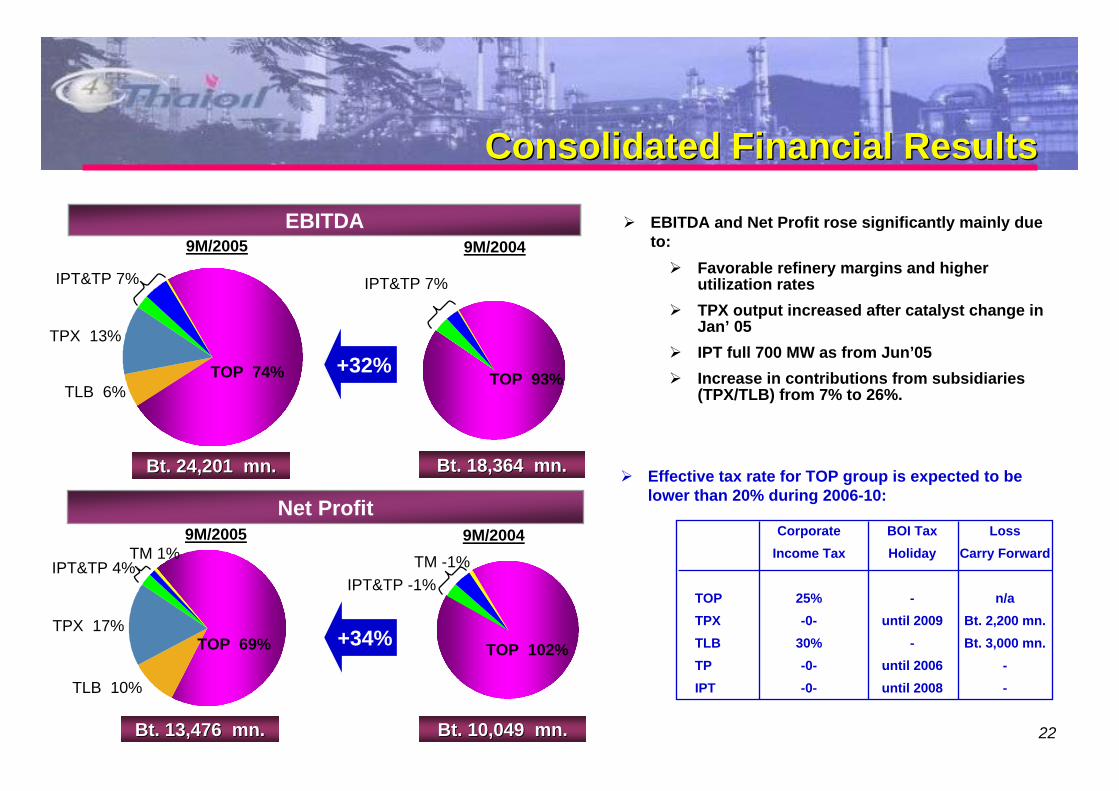
Consolidated Financial ResultsConsolidated Financial Results
EBITDA
TOP 74%TLB 6%
TPX 13%
IPT&TP 7%
EBITDA
TOP 69%
TLB 10%
TPX 17%
IPT&TP 4%
Net Profit
TM 1%
TOP 93%
IPT&TP 7%
TOP 102%
IPT&TP -1%TM -1%
Bt. 24,201 Bt. 24,201 mnmn.. Bt. 18,364 Bt. 18,364 mnmn..
Bt. 13,476 Bt. 13,476 mnmn.. Bt. 10,049 Bt. 10,049 mnmn..
9M/2005 9M/2004
9M/2005 9M/2004
EBITDA and Net Profit rose significantly mainly due to:
Favorable refinery margins and higher utilization ratesTPX output increased after catalyst change in Jan’ 05 IPT full 700 MW as from Jun’05 Increase in contributions from subsidiaries (TPX/TLB) from 7% to 26%.
Effective tax rate for TOP group is expected to be lower than 20% during 2006-10:
Corporate BOI Tax LossIncome Tax Holiday Carry Forward
TOP 25% - n/aTPX -0- until 2009 Bt. 2,200 mn.TLB 30% - Bt. 3,000 mn.TP -0- until 2006 -IPT -0- until 2008 -
+32%
+34%

23
Financial Strength
Balance Sheet
2,486
2,957
Dec ’02 Dec ’04
Current Assets
Fixed Assets
OtherLiabilities
TotalEquities
US$ mn 2,816
Sep ’05
2,462
Dec ’03
Long-term Debts
1,564 1,279
982 874
Note: Convert by 41 Baht/US$
Since 2002,- Total Assets: up ~Bt 20 bn (+20%)- Total Debt: down ~Bt 28 bn (-44%)- Total Equities: up ~Bt 26 bn (+70%)
Key Financial Ratios
3.04.8
11.2
15.06.5
2.2
1.4 0.7 0.6
3.5
1.31.0
0.01.02.03.04.05.06.07.0
2002 2003 2004 20050.02.04.06.08.010.012.014.016.0
ICR LT Debt/Equity Debt/EBITDA
Interest Coverage
LT Debt / Equity
Net Debt/EBITDA

24
Group Debt Structure
Dividend policy is at least 25% of net profit after legal reserve. (pay at Bt1.80/share in May’05 (3.27% dividend yield or 13.09% annualized).
Dividend Policy
Consolidated Repayment ProfileConsolidated Repayment Profile10-Year Bullet Bond US$ 350 M. @ coupon 5.1%. (Moody’s Baa1 / S&P’s BBB)
5-Year revolving US$ Loan: US$ 200 M.
6-Year syndicated onshore loan (US$ 65 M. + THB 2,600 M.)
Consolidated Long Term Debt Profile
• Total LT Loan is 83% in USD to match with USD-linked revenue.
• Total fixed interest is appx. 50% of total borrowing.
• Average cost of debt is appx. 6% p.a. (before corporate tax)
TOP 72%
($629M)
TLB & TM 0%
IPT 18% ($156M)
TP 3% ($27M)
TPX 7% ($62M)
112
324 377
59
0
100
200
300
400
1 Yr 2-4 Yr 5-7 Yr 8-10 Yr
US$ M.

25
IV) Investment Projects

26
Updated CAPEX Requirements
US$ Mn 2005 F 2006 F 2007 F Total In 2005-07
CDU-3 Debottlenecking1) 54 110 54 218
Mercury Removal Units 6 2 0 8
SBM Expansion 20 75 55 150
Power Projects2) 11 21 11 43
Maintenance Projects 15 15 15 45
TPX (Expansion) 10 50 55 115
TLB (Synergy Project) 5 5 0 10
Thaioil Marine 6 6 0 12
Total 127 284 190 601
US$ Mn

27
US$ Mn Total In 2005-07
CDU-3 Debottlenecking 218
Mercury Removal Units 8
SBM Expansion 150
Power Projects 43
Maintenance Projects 45
TPX (Expansion) 115
TLB (Synergy Projects) 10
Thaioil Marine 12
Total 601
Updated CAPEX Requirements
Size: 50 kbd (additional 23%)EPC: ABB PMC: Foster WheelerInvestment Cost: US$ 4,000 /bblExpected C.O.D : Mid 2007IRR: ~ 20% based on 4.5 US$/bbl GRM
Size: 52”diameter * 14.5 km long pipelineEPC: SAIPEM PMC: Bechtel Expected C.O.D : Mid 2007Benefit: Freight saving
Size: 500,000 T/Yr (additional)Cost: US$ 115 M. est. Expected C.O.D : Mid 2007Benefit: Margin base on aromatics (BTX) over
ULG95 and able to supply oil product
For example, TLB/TOP Hot Oil ExchangeCost: US$ 3 mnBenefit: Enhance CDU-1 feed by 5 kbdExpected C.O.D : Mid 2006
28
0
0.5
1
1.5
2
2.5
3
3.5
2011 2012 2013 2014 2015
'000 MW
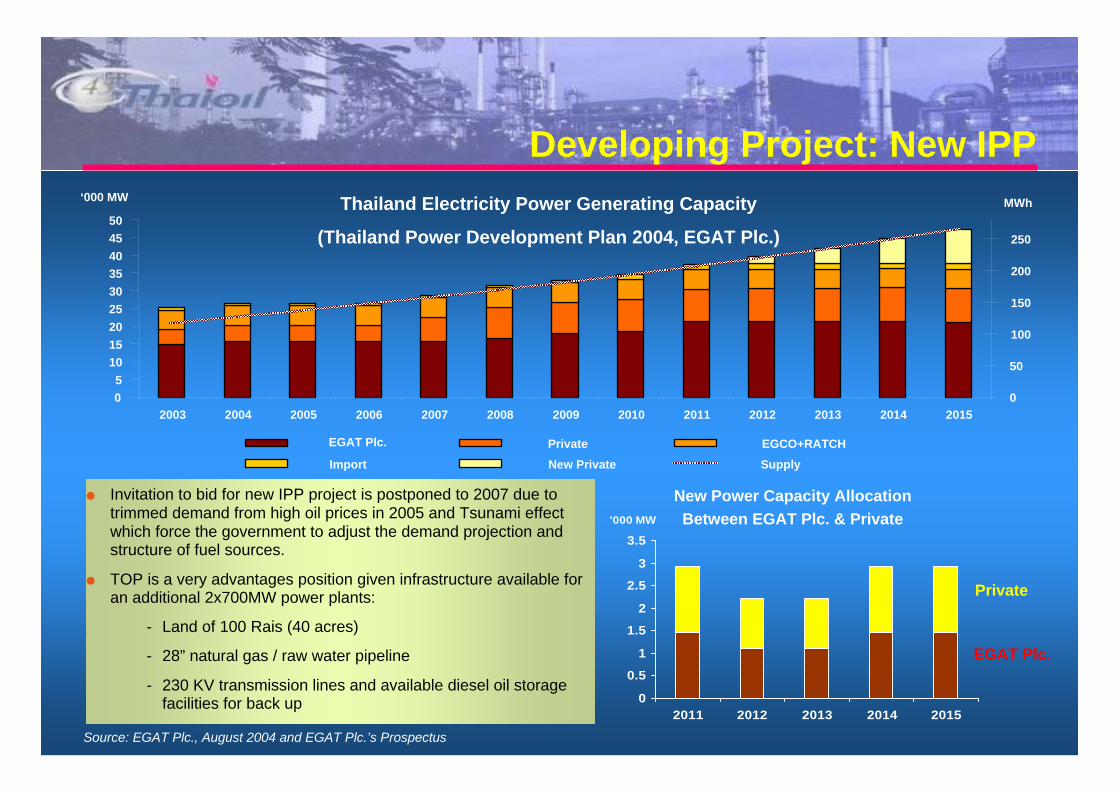
Developing Project: New IPP
Invitation to bid for new IPP project is postponed to 2007 due to trimmed demand from high oil prices in 2005 and Tsunami effect which force the government to adjust the demand projection and structure of fuel sources.
TOP is a very advantages position given infrastructure available for an additional 2x700MW power plants:
- Land of 100 Rais (40 acres)
- 28” natural gas / raw water pipeline
- 230 KV transmission lines and available diesel oil storage facilities for back up
Thailand Electricity Power Generating Capacity
(Thailand Power Development Plan 2004, EGAT Plc.)
Source: EGAT Plc., August 2004 and EGAT Plc.’s Prospectus
New Power Capacity AllocationBetween EGAT Plc. & Private
EGAT Plc.
Private
05
101520253035404550
2003 2004 2005 2006 2007 2008 2009 2010 2011 2012 2013 2014 2015
‘000 MW
0
50
100
150
200
250
MWh
EGAT Plc. Private EGCO+RATCHImport New Private Supply

29
V) Conclusion
30
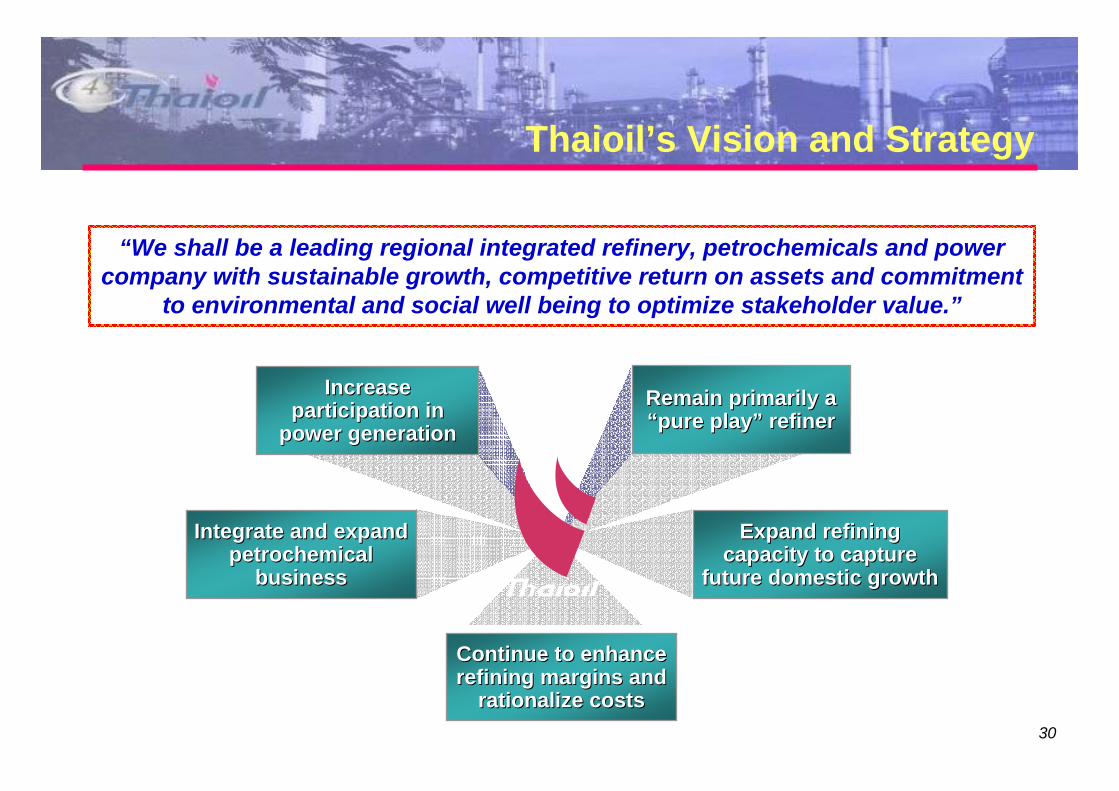
Thaioil’s Vision and Strategy
Remain primarily a Remain primarily a ““pure playpure play”” refinerrefiner
Increase Increase participation in participation in
power generationpower generation
Expand refining Expand refining capacity to capture capacity to capture
future domestic growthfuture domestic growth
Integrate and expand Integrate and expand petrochemical petrochemical
businessbusiness
Continue to enhance Continue to enhance refining margins and refining margins and
rationalize costsrationalize costs
“We shall be a leading regional integrated refinery, petrochemicals and power company with sustainable growth, competitive return on assets and commitment
to environmental and social well being to optimize stakeholder value.”

31
Conclusion
One of the most complex, cost-efficientand modern refinery in the region;
Favorable oil & petrochemical industries - inability of supply to keep up with continuously growing demand;
Investment strengths: High barrier to entry due to investment cost, limited new supplied, prospect demand and captive market.
Significant increased contributions from subsidiaries, as a result of business restructuring & synergy within the group;
Strong financial position post-completion of the refinancing exercise;
Effective project development enhances investment returns & ensures growth;
2004
Best Equity Deal, Best IPO, BestPrivatization and Best Thailand Deal for the Year 2004
Best Deal of the Year for IPO inThailand in 2004
Thai Capital Market Deal in 2004
Asia’s Best Equity Deal in 2004
Best IPO Deals in 2004
Best Newly Listed Companyof the Year 2004
2005
Best Newly Listed Company in Asia
Most Improved Companies in Asia
32
THANK YOU
Any further questions, please contact Investor Relations Dept. Tel: (662) 299-0124Fax: (662) 617-8295
email: [email protected]: www.thaioil.co.th
33
Appendix
34
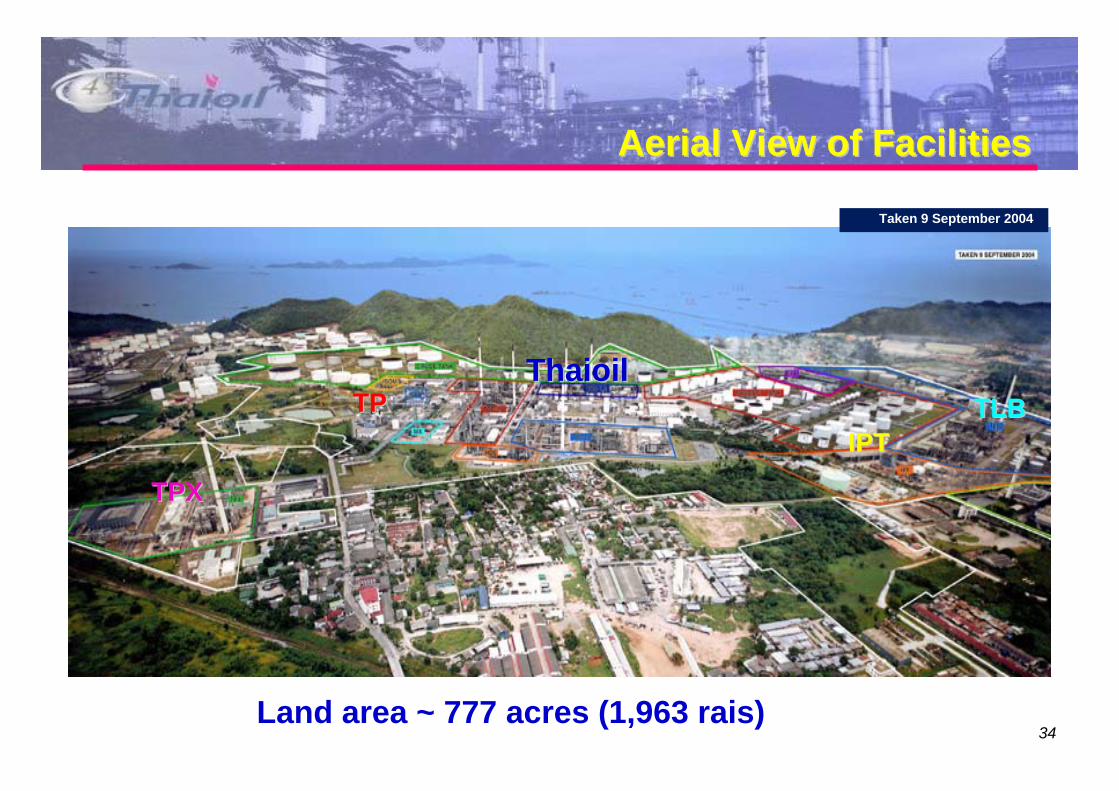
Aerial View of FacilitiesAerial View of FacilitiesAerial View of Facilities
Land area ~ 777 acres (1,963 rais)
TPXTPX
IPTIPTTLBTLBTPTP
Taken 9 September 2004
ThaioilThaioil

35
Strategic LocationStrategic LocationStrategic Location
The site is in the Eastern region, 124 km from BangkokHas 2 mooring facilities for crude receiving and product exportClose to market by connecting to multi-product pipelineHas space available for future expansion
Source: Ministry of Energy 2003
9%
10%
59%11%
11%
SARABURI
LUMLUKKADONMUANG
SUVARNABHUMI
Esso
GULF OF THAILAND
Shell (RRC)Caltex (SPRC)
MAP TA PHUT
SRIRACHA
Ø24”, 134 km
Ø18”, 38 km
Ø10”, 29 km
Ø18”, 92 km
Main Line Expansion Pipeline
SBM Facility
Domestic demand
distribution THAIOIL
Bangchak
TPI
SBM
36
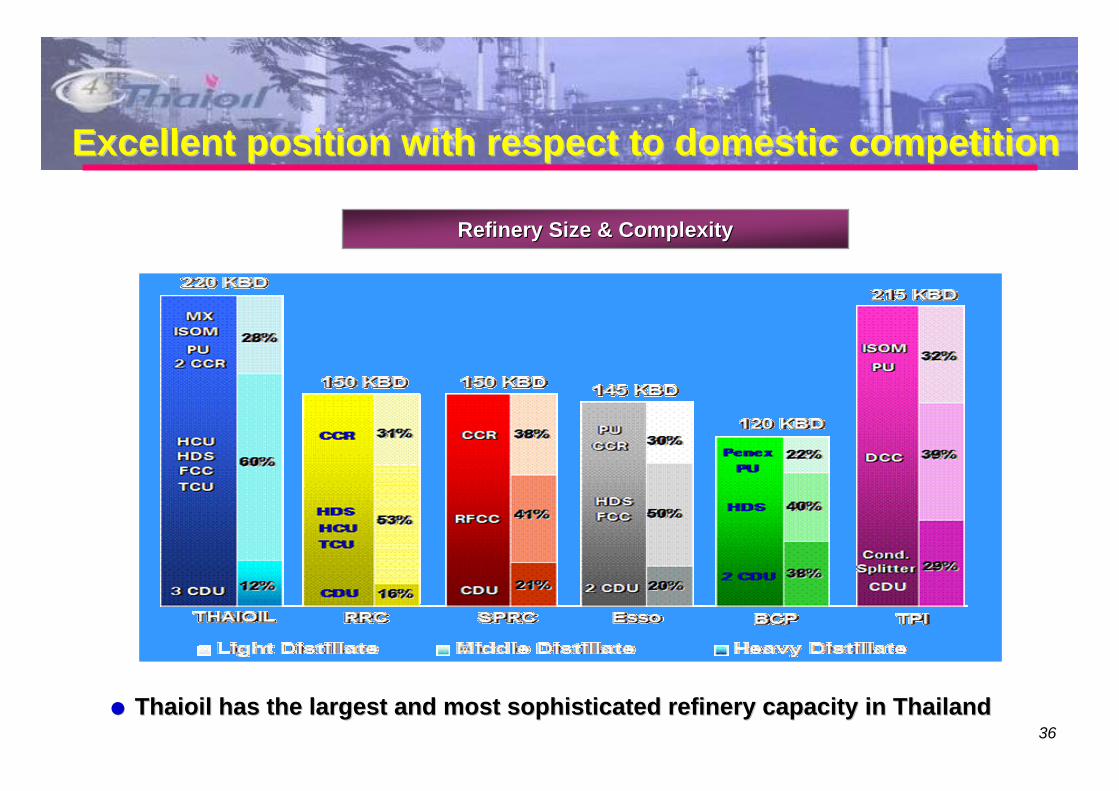
Excellent position with respect to domestic competitionExcellent position with respect to domestic competitionExcellent position with respect to domestic competition
Refinery Size & ComplexityRefinery Size & Complexity
Thaioil has the largest and most sophisticated refinery capacityThaioil has the largest and most sophisticated refinery capacity in Thailandin Thailand
37
16% 14% 19% 19%34%
56%57% 41%
47% 47%
47%
28%45%
34% 34%18%
11%10%
75%
14%33%
ThaiDemand
Thaioil Esso RRC SPRC TPI Bangchak
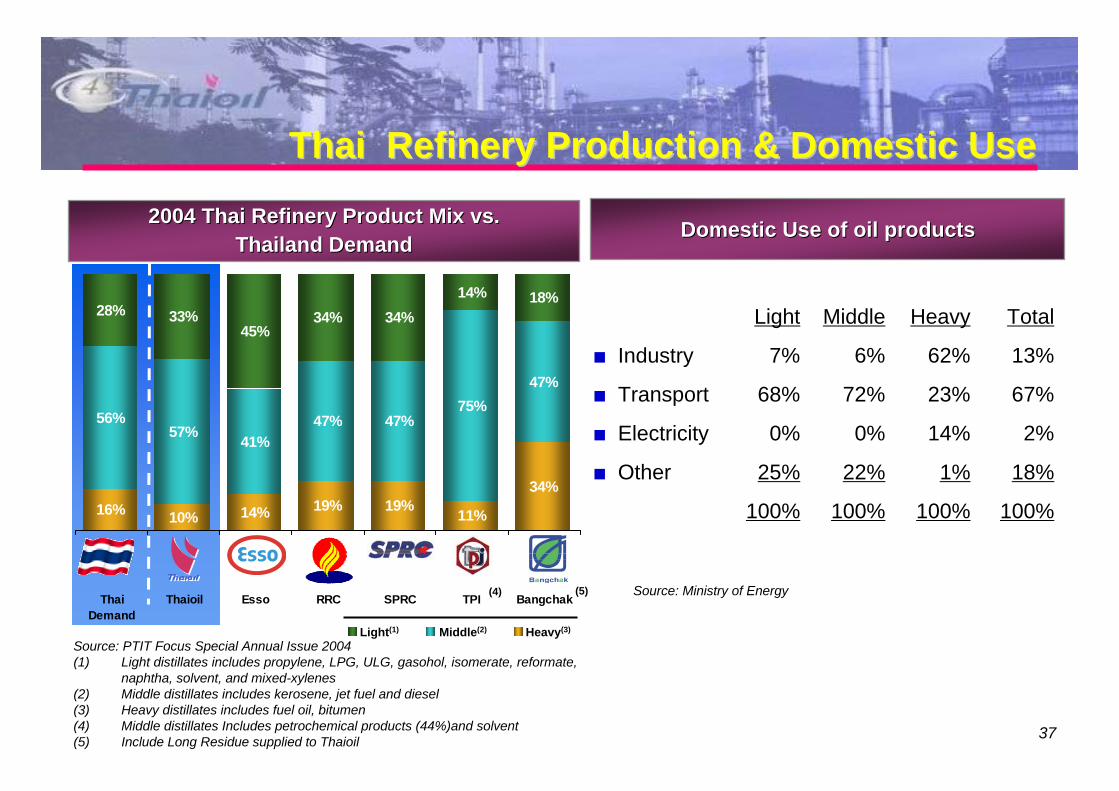
Thai Refinery Production & Domestic UseThai Refinery Production & Domestic UseThai Refinery Production & Domestic Use
2004 Thai Refinery Product Mix vs.2004 Thai Refinery Product Mix vs.Thailand DemandThailand Demand
Source: PTIT Focus Special Annual Issue 2004(1) Light distillates includes propylene, LPG, ULG, gasohol, isomerate, reformate,
naphtha, solvent, and mixed-xylenes(2) Middle distillates includes kerosene, jet fuel and diesel(3) Heavy distillates includes fuel oil, bitumen(4) Middle distillates Includes petrochemical products (44%)and solvent (5) Include Long Residue supplied to Thaioil
Middle(2) Heavy(3)Light(1)
(4) (5)
Light Middle Heavy Total
Industry 7% 6% 62% 13%
Transport 68% 72% 23% 67%
Electricity 0% 0% 14% 2%
Other 25% 22% 1% 18%
100% 100% 100% 100%
Source: Ministry of Energy
Domestic Use of oil productsDomestic Use of oil products
38
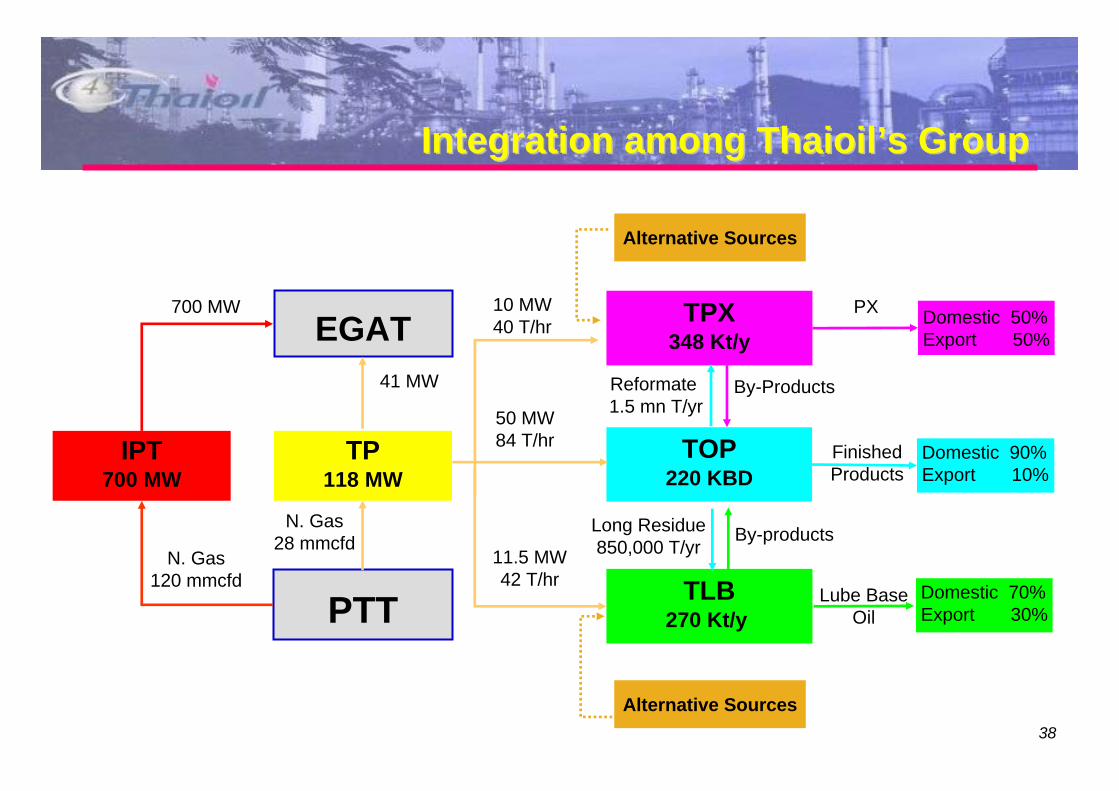
PTT
TOP220 KBD
EGAT
IPT700 MW
TPX348 Kt/y
TLB270 Kt/y
Integration among Thaioil’s GroupInIntetegrationgration amongamong ThaioilThaioil’’ss GroupGroup
Alternative Sources
Alternative Sources
Long Residue 850,000 T/yr
By-products
TP118 MW
N. Gas28 mmcfd
N. Gas120 mmcfd
Reformate1.5 mn T/yr
By-Products
Domestic 90%Export 10%
Domestic 70%Export 30%
Lube Base Oil
41 MW
50 MW84 T/hr
10 MW40 T/hr
11.5 MW42 T/hr
Domestic 50%Export 50%
700 MW
Finished Products
PX

39
Rationales
Ethanol ProjectBackground
• Government plans to phase out MTBE by 2007 and use Ethanol as high octane component instead for environmental concern/import reduction/agricultural support.
• There is insufficient domestic ethanol supply as only 3 licensees (from 24 licensees) is currently in operation for 300,000 L/Day.
• Abundant feedstock as Thailand exports Tapioca chips more than 3 mn Tons/Yr (1 mnL/Day of Ethanol requires about 0.9 mn Ton/Yr of Tapioca Chips).
New Developing Project: Ethanol
• Ethanol Plant Capacity 1 – 2 Mn L/Day
• Feedstocks: Tapioca Chips 1 – 2 Mn T/Yr
• Estimated Investment Cost 150 – 250 Mn USD
• Site Location under consideration
Economy of Scale
• Government promotion• Supply of raw material is abundant because Thailand is largest exporter• Raw material price and availability is less volatile, compared with Molasses• Low cost produces due to economy of scale