thai plaspac april 2016 public company limited (‘tpac’)
TRANSCRIPT

April 2016THAI PLASPAC
PUBLIC COMPANY LIMITED
(‘TPAC’)
Opportunity Day
Stock Exchange of Thailand
Bangkok, Thailand
15th August, 2016

2
KothariGroup CFO
• 7 MONTHS
AT TPAC
• 3+ DECADES
INDUSTRIAL
FINANCE
EXPERIENCE
Team TPAC, Presenting Today
Anong,
CFO TPAC
• 1 YEAR AT
TPAC
• 20 YEARS
ACCOUNTING &
FINANCE
EXPERIENCE
Theerawit,
M.D.
Kevin,
CEO
• 10 MONTHS AT
TPAC
• 10 YEARS
BANKING AND
PRIVATE EQUITY
EXPERIENCE
Passionate, Complementary, Experienced, Learning Everyday
• 32 YEARS AT
TPAC
• 3+ DECADES OF
RIGID PLASTIC
SOLUTION
EXPERIENCE

3
Overview1
Packaging Market2
Production Statistics 3
Introduction
Factory New Developments4
Financial Performance5

Overview1

5
Key Highlights
• Thailand's leading supplier of consumer rigid
plastic packaging solutions across the food &
beverage, personal & pharma care and
homecare markets with 30+ years track record
• Trusted long-term qualified partner to the
worlds leading consumer brands
• 3 world class manufacturing facilities in
Bangkok
• World class dedicated R&D product platform
• Robust and transparent financial position
• Long serving, 30+ years, experienced, and
passionate management team
• Lohia family as new controlling shareholder,
with a proven track record of creating globally
competitive manufacturing companies
- a new era of growth for TPAC.
World-Class Production Platform
TPAC – Thailand's leading consumer packaging company
Capacity: 21,000 tpa
Bangkok, Thailand

6
Accreditations
All factories, ISO, GMP and SEDEX compliant
ISO 9001:2008
Management SystemsGMP
Good Manufacturing PracticesUKAS
Quality Management

7
Injection-Blow Molding
The injection molding
process requires the use
of an injection molding
machine, raw plastic
material, and a mold
Used to create hollow
plastic parts by inflating a
heated plastic tube until it
fills a mold and forms the desired shape
For PET products, the
Injection blow molding
process produces
bottles of superior visual and dimensional quality
8,000 tons 9,000 tons 4,000 tons
94 58 16
Injection Molding Blow Molding
Capacity
Number of
Machines
Advance
Production
Line
Description
World-Class Manufacturing FacilitiesManufacturing in A Clean GMP Environment

8
Quality and Cleanliness uncompromised
World class quality control lab and processes in place

9
GMP PET dedicated facility

10
Established Track Record, 33 years track recordListed company for past 12 years
19831987
1997 2003 20052010
2015
• Established
Year
• Start TPAC 1
• Start TPAC 2
• Good
Manufacturing
Practice
Certificate
• Listed on
Thailand
Stock
Exchange
(MAI)
• Start TPAC 3
• Lohia family
acquires
equity stake
Strategic Family Ownership to
launch our next chapter of growth5
m/c
58 m/c
113 m/c
168m/c
2016
• Start TPAC 4
• New
purpose built
logistics
warehouse
online

11
Governance StructuresProtecting the reputation and interests of all Stakeholders
Audit
committee
Board of
Directors
Shareholders
• Lohia Family @ 60%
• K.Theerawit [M.D.] @ 4.0%
3 esteemed individuals as Non
Executive Independent Directors
as our Internal Auditor
as our external auditor
Board Composition:
3 independent non-executives directors,
2 Lohia family non executive directors,
3 executive directors

12
Long Term Partners to global brands
Our relationships span decades

13
Customer Recognition in 2016
Johnson & Johnson

14
Customer Recognition in 2016
Nestle
TPAC Achieved 100% performance for past quarter ..
“A fantastic result… true partnership spirit”
Nestle

15
CAMBODIA
PHILIPPINESTHAILAND
VIETNAM
MALAYSIA
SINGAPORE
LAOS
BURMA
INDONESIA
Strategy
Growth alongisde our customers
• Global Consumer Brand focused
• Focused on plastics. Focused on
serving our customers further in and
beyond Thailand.
• Export our strong brand of
operational excellence &
governance.
• Further geographically build on our
teams expertise across 3 rigid
plastic processes (injection, EBM,
ISBM)
• Serious about “Solutions”: intensely
focused on rigid plastic R&D
encouraging innovation [product
design, material engineering, the
right manufacturing technologies]
*Consolidate further
in Thailand

Packaging Dynamics2

17
Global Rigid Containers Demand by Packaging Material (million units)
Plastics the largest market share
New low oil price world likely to increase plastic market share even further !
• Plastic market share in
total packaging material
has increased from 36%
to 44% (over 15 years)
• Consumer good industry
focus on resources and
supply-chain
optimization, plastic is
the most affordable
packaging material,
greater design capability
and sustainable
packaging choice
Source: Industry Data, TPAC Analysis, 2016 estimated.

18
Plastics the largest market share….
And the fastest growing !
Source: Industry Data, TPAC Analysis

19
Thailand Rigid Containers Market
Plastics present a huge market opportunity in Thailand
Source: Industry Data excludes Beverages, TPAC Analysis
• Solid growth opportunity
for TPAC in Thailand even
in the Liquid Carton
space.
• Liquid cartons are
increasingly adopting
plastic closures.
• 2 largest liquid carton
players in the world use
TPAC made closures.
Total market (excluding beverages)
- 15,700 million pieces

Production Statistics3
21
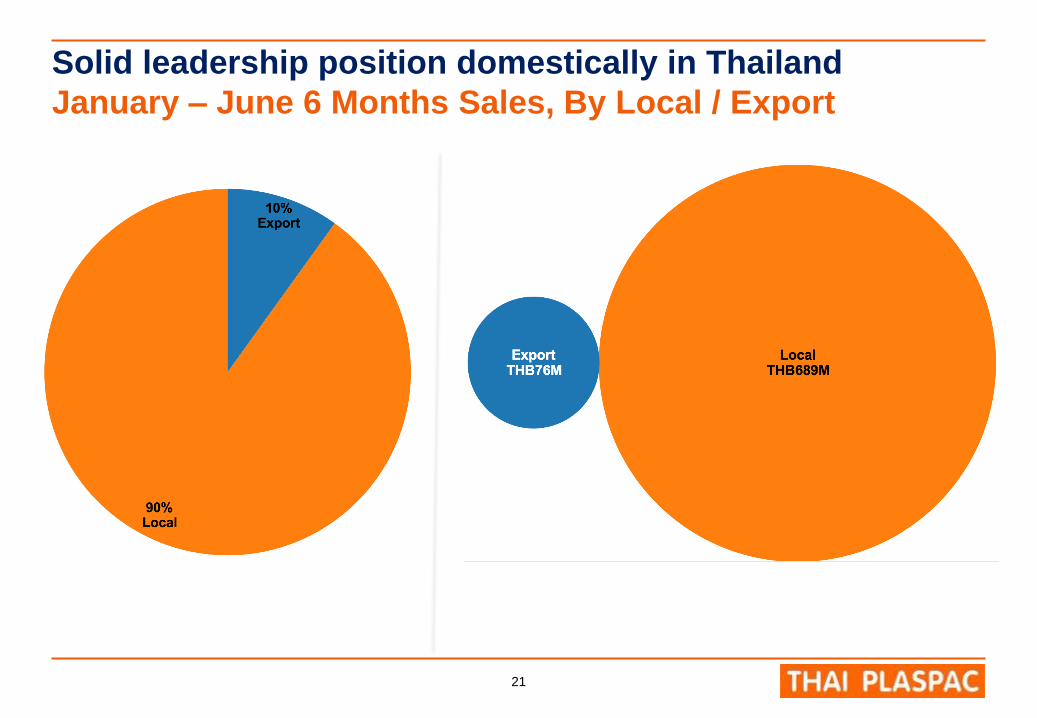
Solid leadership position domestically in Thailand
January – June 6 Months Sales, By Local / Export

22
Diversified and with strong foothold across consumer sectors
January – June 6 Months Sales, By Sector

23
Customized Rigid Plastic Consumer PackagingFood & Beverage, Pharmaceutical & Personal, Home Care and Precision tools
24
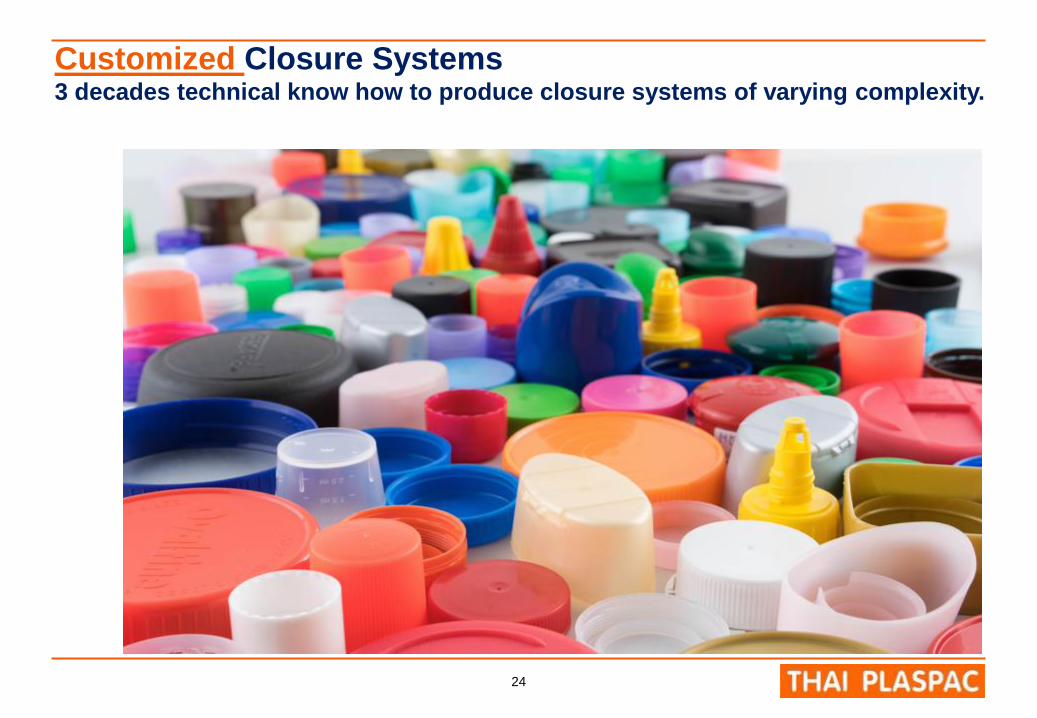
Customized Closure Systems3 decades technical know how to produce closure systems of varying complexity.

25
Highly Diversified Customer Base
January – June ’16 Individual Customer SalesStrategic Risk
Management:
No individual
customer should
represent more
than 25% of our
revenue.

26
Sales: > currently over 1000 active individual product SKU’s
January – June ’16 SKU’s by Sales Value
Highly Diversified
customer base
complimented by a
even further diversified
product mix.
The complexity and
diversification of
TPACs manufacturing
operation makes us a
unique and hard to
replicate business.

27
Long experience of working with a diverse range of plastics
January – June 6 Months Sales, By Plastic Type

28
Technical ability to work with diverse range of plastic processes
January – June 6 Months Sales, By Process

29
Sales (Number of Pieces) by major product group

30
January – June 6 Months Closure Number of Pieces,
By Plastic Type

31
January – June 6 Months Bottles Number of Pieces,
By Plastic Type

32
• Delivering tangible results
• Collaborative cross functional
approach between us and our
customers [see case studies].
TPAC & SustainabilityResponsible Converting
Lightweighting
Energy
ManufacturingCulture
• Hydraulic to Electric machine
transition
• Resulting in further improved
energy consumption
• Completed program to
change lights to energy
efficient 14.5W & 18 W
LED
• Studying captive roof
solar scheme
• Doing the little things better.
• Strict about printing only the
necessities, turning off lights.
• Our newly ordered inter
factory transport vehicle is
now also solar powered !
TPAC management is seriously embracing sustainability programmes alongside ourcustomers

33
Light weighting: Leveraging our 33 years of rigid plastic R&D Cross Functional Collaboration Case Studies
TPAC, Delivering Results
Products Previous
weight
Reduced
weight
Dairy product 400 ml bottle 23 g. 18 g.
Dairy product 800 ml bottle 36 g. 33 g.
Toilet Cleaner 450 ml bottle 35 g. 28 g.
Toilet Cleaner 900 ml bottle 55 g. 45 g.

Factory New Developments4

35
Supply Chain Infrastructure2016 newly constructed 3,300 sqm finished good warehouse

36
Supply Chain Infrastructure
2016 newly constructed 3,300 sqm finished good warehouse

37
Newly Extended Mold Shop Mold maintenance processes in accordance with our partners world class standards

38
Committed to investing in the latest rigid plastic technologies2016 invested Blow Molding reciprocating screw machine from USA to further
grow our HDPE bottle business

39
Robotics & AutomationProject marks the start of robotic systems for TPAC
VIDEO

Financial Performance5

41
Sales -4.9% 377.2 396.6 -6.5% 755.2 808.0
Cost of sales -7.1% 314.3 338.3 -6.9% 629.9 676.5
Gross Profit 7.9% 62.9 58.3 -4.7% 125.3 131.5
Gross Profit Margin % 2.0% 16.7% 14.7% 0.3% 16.6% 16.3%
SG&A 8.9% 34.1 31.3 8.7% 67.5 62.1
Other income -46.9% 1.37 2.6 5.3% 5.2 5.0
EBITDA 5.0% 61.6 58.7 -8.9% 126.2 138.5
EBITDA Margin % 1.5% 16.3% 14.8% -0.4% 16.7% 17.1%
Depreciation and
amortization8.1% 31.5 29.2 -1.6% 63.1 64.2
EBIT 2.1% 30.1 29.5 -15.2% 63.0 74.3
EBIT Margin % 0.5% 8.0% 7.4% -0.8% 8.3% 9.2%
Interest expense -89.8% 0.2 2.4 -64.3% 1.9 5.3
Profit Before Tax 10.2% 29.9 27.1 -11.4% 61.2 69.1
Income tax expense 8.2% 6.2 5.7 -15.8% 12.0 14.2
Net profit 10.7% 23.7 21.4 -10.3% 49.2 54.8
Net Profit Margin % 0.9% 6.3% 5.4% -0.3% 6.5% 6.8%
2016-6 M 2015-6 M
฿
million% Δ
'16 vs '15Q2'16 Q2'15
% Δ
'16 vs '15
Note: SG&A is selling, general and administrative expenses. EBIT is earnings before interest and tax. EBITDA is earnings before
interest, tax and depreciation and amortization.
Profit & Loss
TPAC in Q2’16 reports double
digit earnings growth against
the same period last year.
Net Profit of ฿23.7 MM, 11%
increase over the same period
last year.
o Net Profit margin 6.3%, 90
basis points increase over
same period last year
Gross Profit and EBITDA were
also both higher in Q2’16 against
same period last year.
Gross Profit ฿62.9MM, an 8%
increase to same period last year.
o Gross Profit margin
16.7%, 200 basis points
margin improvement to
same period last year.
EBITDA ฿61.6MM, a 5%
increase to same period last year.
o EBITDA margin 16.3%,
150 basis points margin
improvement to same
period last year.

42
As at As at
30-Jun-16 31-Dec-15
Cash and cash equivalents 137.0% 8.8 3.7
Trade and other receivables 7.2% 383.0 357.3
Inventories -0.3% 89.8 90.0
Other current assets 89.4% 4.2 2.2
Total current assets 7.2% 485.7 453.2
Property, plant and equipment -2.6% 533.9 548.0
Advance for purchase of molds -38.4% 45.1 73.3
Other assets 10.7% 92.9 84.0
Total assets -0.1% 1,157.7 1,158.5
Short term loans -100.0% 0.0 51.2
Trade and other payables -24.8% 152.3 202.4
Current portion of loans -100.0% 0.0 37.3
Other current liabilities -47.0% 6.3 11.9
Total current liabilities -47.6% 158.6 302.9
Non-current portion of loans -100.0% 0.0 73.8
Other liabilities 31.9% 18.4 14.0
Total liabilities -54.7% 177.1 390.7
Registered share capital 0.0% 255.0 255.0
Issued and paid-up capital 21.6% 253.8 208.8
Retained earnings -2.9% 398.4 410.5
Other reserves 121.1% 328.4 148.5
Total shareholders’ equity 27.7% 980.6 767.8
Total liabilities and shareholders’ equity -0.1% 1,157.7 1,158.5
฿
million % Δ
'16 vs '15
Balance Sheet
TPAC financial position remains
robust.
Balance Sheet is well positioned for
management to move swiftly to
capitalize on growth opportunities as
they present themselves.
TPAC strong free cash flow generation
in combination with successful warrant
subscription program has enabled a full
pay down of bank debt.
Total pay down of bank debt over past
6 months equal to ฿ 162.3MM
Net debt to equity now negative due to
zero bank debt and a small positive
cash balance.
Current ratio has increased from 1.7
times to 3.1 times
TPAC warrant, TPAC-W1, program now
complete with 97.6% of the warrants
successfully exercised

43
Cash Flow
TPAC continues to generate steady and
positive cash flow from operations.
Cash flow from operating activities ฿
128.6 million is sufficient to fund net
cash outflow for working capital and
corporate tax ฿101.6 million and net
cash outflow for investing activities ฿
23.0 million. Free cash flow remains
positive.
Managements commitment to investing
into world class rigid plastic
technologies firm, and for the first 6
months of this year ฿23 MM incurred
on new machines.
The company has a cash balance at the
end of June-2016 at ฿8.8 MM.
2 Other adjustments include other non-cash items
such as gain on sale of equipment, foreign exchange
movements, inventory revaluations, long-term
employee benefits and interest income & expenses.
Period Beginning From 01-Jan-16
Up To Period Ending 30th June 2016
Cash and Cash Equivalents - Beginning period Balance 3,693
Cash flow from Operating Activities
Profit Before Tax 61,172
Adjustments: Depreciation and Amortisation 63,147
Adjustments: Other adjustments(2)
4,253
Profit from operating activities before changes to working capital 128,572
Net changes to Working Capital -81,558
Cash flows from Operating Activities 47,014
Cash paid for corporate income tax -20,100
Net Cash Flows from Operating Activities 26,914
Cash flow from Investing Activities
Acquisition of Machinery -23,088
Interest income 25
Proceeds from equipment sales 22
Net Cash Flow used in Investing Activities -23,041
Cash flow from Financing Activities
Cash from Warrants 224,923
Repayment in long-term loans -110,789
Dividend Paid Out -59,418
Decrease in short-term bank loans -51,185
Interest Expense -1,989
Repayment of finance lease payments -357
Net Cash Flow from Financing Activities 1,185
Increase in Cash and Cash Equivalents 5,058
Cash and Cash equivalents - Closing Period Balance 8,751

44
IssuedExercise Price
(Baht)
Exercised before
2016
Exercised on
31/3/2016
Exercised on
19/5/2016
Total
Exercised in
2016
Unexercised
TPAC-W1 50,000,000 5.0 4,099,919 28,638,900 16,078,876 44,717,776 1,182,305
% exercised 8.2% 57.3% 32.2% 89.4% 2.4%
Cash from Warrants (Baht) 20,499,595 143,194,500 80,394,380 223,588,880 5,911,525
TPAC ESOP 5,000,000 4.0 4,666,500 264,500 69,000 333,500 0
% exercised 93.3% 5.3% 1.4% 6.7% 0.0%
Cash from ESOP (Baht) 18,666,000 1,058,000 276,000 1,334,000 0
1 TPAC-W1 with ฿ 5.00 strike and optional maturity dates 21st May-2016. 44,717,776 number of TPAC-W1 warrants were exercised in H1-
2016 with total value of ฿223.59MM Baht .TPAC ESOP with ฿ 4.00 strike and optional maturity dates of 21st May-2016. 333,500 number of
TPAC-W1 warrants were exercised in H1-2016 with total value of ฿1.33MM Baht.
Warrant Exercised

45
Liquidity Ratio Q2'16 Q2'15
Current Ratio 3.1 1.7
Leverage Ratio Q2'16 Q2'15
Net Debt / Equity -0.01 0.6
Interest Bearing Debt / Equity 0.0 0.3
Interest Coverage Ratio 123.0x 12.3x
Debt Service Coverage Ratio 251.6x 2.6x
Ratios
TPAC balance sheet debt free with healthy free cash flows being
generated from operations.
Financing ratios robust and further strengthened this quarter.
As the company is debt free, Board of Directors agree to pay
interim dividend at 0.10 Baht/share. Payout will be 8th
September 2016

46
Thailand's Leading Consumer Packaging Company
Robust and Transparent Financial Position
• Listed and publicly traded on the Stock Exchange
of Thailand
• Strong Balance sheet well prepared to swiftly
capitalize on growth opportunities
Governance
• Strong governance structures in place
• 3 independent highly accredited non-executive
directors
• Audited financials by Ernst & Young, Internal audit
by Deloitte.
World Class in-house R&D
• Trusted multi decade long partner to the worlds
leading FMCG companies
• In house R&D product innovation teams
• Moving into robotic systems
Experienced and professional leadership
• Dedicated, passionate and experienced
management team
• Various members of management team have 30+
years experience within the rigid plastic packaging
industry

Thank Youwww.thaiplaspac.com