than contingent valuation ? a systematic review in...
TRANSCRIPT

Is choice experiment becoming more popular
than contingent valuation ? A systematic review in agriculture,
environment and health
Pierre-Alexandre Mahieu - Henrik Andersson - Olivier Beaumais - Romain Crastes - François-Charles Wolff
WP 2014.12
Suggested citation: P-A Mahieu, H Andersson, O Beaumais, R Crastes, F-C Wolff (2014). Is choice experiment becoming more popular than contingent valuation ? A systematic review in agriculture, environment and health. FAERE Working Paper, 2014.12.
ISSN number:
http://faere.fr/working-papers/

1
Is choice experiment becoming more popular than contingent valuation? A systematic review in agriculture, environment and health
Pierre-Alexandre Mahieu*, Henrik Andersson**, Olivier Beaumais***, Romain Crastes****, François-Charles Wolff*****
September 2014 Abstract: This paper provides a systematic review based on a large sample of articles published between 2004 and 2013 in economic journals and listed in ISI Web of Science. Results from descriptive statistics and regression models show that choice experiment (CE) is becoming more popular than contingent valuation (CV) in terms of number of publications and citations. Also, journals related to health economics and agricultural economics are more CE oriented than journals related to environmental economics. Finally, divergences across economic journals are found when comparing recent CE articles in terms of questionnaire design, econometric procedure, administration of questionnaire and type of participants. In particular, it is more standard to allow for unobserved taste heterogeneity in environmental journals than in health or agricultural journals. Keywords: Contingent valuation; choice experiment; systematic review; environment; health; agriculture JEL classification: Q18 ; Q51; I10
* Corresponding author. LEMNA, University of Nantes, France. Email: [email protected] ** LERNA, Toulouse of School of Economics, France. Email: Henrik.Andersson@ tse-fr.eu *** LISA, University of Corsica Pasquale Paoli, Corte, France Email: [email protected] **** ESITPA, AGRI’TERR, Rouen, France. Email: [email protected] ***** LEMNA, University of Nantes and INED, Paris, France. E-mail: [email protected] http://ideas.repec.org/e/pwo132.html
2
1. Introduction Resources are scarce and policy makers need guidance to secure an efficient resource allocation. A powerful tool to guide allocation is benefit-cost analysis (BCA) in which social benefits of policies or investments are compared with their costs. The use of BCA requires a common metric for the benefits and costs and money acts as this common metric. However, many non-market goods such as environmental effects and health improvements do not have easily available market prices. For those goods non-market valuation techniques have to be used. These are usually broadly classified as either revealed (RP) or stated-preference (SP) techniques. The former refer to techniques where decisions of individuals in actual markets are used to elicit their preferences for the good of interest. The latter refer to techniques where individuals are asked to state their preferences in hypothetical market situations. In this review, we focus on two SP techniques. The two most popular SP approaches are the contingent valuation (CV) and the choice experiment (CE). The CV involves asking respondents for their willingness to pay (WTP) or willingness to accept for a clearly defined good in a direct way, either using an open question such as “what is your maximum WTP?”, or a referendum style question such as “would you be willing to pay €X?”. The CE provides the respondents with choice alternatives where the different goods or programs are defined by their attributes, the cost of the good/program being one of them. Information about the WTP of respondents is then obtained by observing the choices made1. CE presents several advantages over CV. First, it provides more information since it allows estimating not only the mean WTP, but also the implicit price or marginal WTP for the different attributes (Hoyos 2010). Second, CE may mitigate ethical protesting according to Hanley et al. (2001, p 451): “CE might reduce the incidence of ethical protesting as the choice context can be less “stark” than direct elicitation of willingness to pay”. Third, CE can give the opportunity to elicit a deeper understanding of the trade-offs between different attributes (Adamowicz et al. 1998). At the same time, CE might place a higher cognitive burden on the participants, especially if the number of alternatives and attributes in the choice set is high, or if the number of repeated choices to be made is large (Swait and Adamowicz 2001, Hoyos 2010). Adamowicz (2004) examined the potential directions environmental valuation could take. According to Adamowicz, the most significant advances would be to focus on choices rather than values (p. 433): “The most significant advance in environmental valuation may be to move away from a focus on value and focus instead on choice behaviour and data that generate information on choices. Advances in resource allocation are most likely to arise from better understanding of preferences and choice, rather than the generation of more value estimates and catalogues of these measures. The continued synthesis of research from marketing, psychology, decision sciences, transportation research, environmental economics and other fields of social science research will also improve our understanding of and ability to model choice behavior”. Hence, it is of interest to examine whether SP studies have moved in the direction where more information about what drives choice can be obtained. 1 For a more comprehensive description of these techniques, see for instance Bateman et al. (2002).

3
In this contribution, we explore the increasing popularity of CE. In addition to examining trends in publication or citation rates, we investigate the determinants of the choice between CV and CE using a regression framework. To do so, we perform a systematic review of SP studies that were published between 2004 and 2013 in ISI (Institute for Scientific Information) journals related to economics, our independent variables being related to year of publication, authors’ country affiliation and journal field. We compare the popularity of CE versus CV method essentially between three journal fields: agriculture, environment and health. The limited number of articles published in other fields (art, culture, education, transport), as shown by our review, prevents us from conducting a more detailed analysis. In addition to exploring trends in publications or citations, we compare recent CE studies across journals in agriculture, environment and health using a selection of studies from our systematic review. To do so, we browse the most recent CE articles published between 2011 and 2013 and collect additional information like econometric procedures, questionnaire administration and number of choices or alternatives. We only focus on recent articles because the state of the art in SP is evolving and can be perceived as a “moving target” (Louviere and Lancsar 2009). One of the purposes of a systematic literature review is to allow for both replications and possible extensions of our analysis in the future by including new SP studies or new types of studies like RP studies. To this end, we explain in detail how we selected the various references included in our database. For replication purpose, we make our data available online along with the STATA codes necessary to reproduce our various figures and tables. Both the data and the codes are publicly available at the following address: https://drive.google.com/folderview?id=0B6-aWRdEl74JVGRDeWxnbk9iVjg&usp=sharing.
The remainder of this article is organized as follows. Section 2 provides a brief review of the past surveys dealing with non-market valuation. Section 3 describes the construction of the database. Section 4 provides some descriptive statistics. Section 5 presents regression results. Section 6 compares recent CE studies. Finally, a discussion and a conclusion are given in section 7. 2. Past review studies Most of the past review studies have focused on a given good, bias/anomaly, country and/or journal. For instance, Lindhjem (2007) reviewed the literature on non-timber forest benefits in three countries (Norway, Sweden and Finland). Laurans et al. (2013) collected studies related to ecosystems. Whitty et al. (2014) reviewed studies reporting public preferences for healthcare priority setting. Murphy et al. (2005) explored the determinants of the hypothetical bias. Mahieu et al. (2014) surveyed valuation studies involving authors affiliated in French institutions. Crastes and Mahieu (2014) collected information on the time for publication acceptance based on articles published in three environmental journals. Smith (2000) explored whether the “Journal of Environmental Economics and Management” had an impact on the development of non-market valuation. De Bekker-Grob et al. (2012) provided a review of CE in the field of health economics. Lindhjem et al. (2011) focused on mortality risk reductions for environmental, transport and health risk. Meyerhoff et al. (2014) investigated the sources of protest behavior.

4
To the best of our knowledge, only two articles have attempted to collect all the existing CV and CE studies, regardless of the good being valued, the nationality of the authors and/or the journal in which the studies were published2. Carson (2012) aimed to collect all the SP articles that were written up to 20073. In addition to published articles, the author collected the grey literature such as book chapters, conference papers and government reports. In total, Carson reported references of 7,500 articles but did not provide any statistical analysis. Furthermore, Carson showed the overall trend in the production of CV literature between 1989 and 2007 by using ISI web of knowledge. Adamowicz (2004) provided insights into environmental valuation research using a systematic review of ISI articles that were published between 1975 and 2003. The author considered several methods (including CV, CE, travel cost and hedonic pricing) and found that the number of CE studies was “on the rise” while the number of CV rapidly increased after the occurrence of the Exxon Valdez Oil Spill in 19894. 3. Construction of the data In this paper, we provide a systematic review of SP articles using ISI Web of Science data to construct our database5. In doing so, we follow some of the systematic review studies that were published over the last years (Adamowicz 2004, Carson 2012, Costanza and Kubiszewski 2012, Laurans et al. 2013, Mahieu et al. 2014). We collected data on publications from 2004 to 2013. We choose not to consider papers published prior to 2004 for the two following reasons. First, most of the older SP papers have already been included in the various surveys of literature mentioned before. Second, the ISI database is not fully reliable when looking at long run trends because some of the old references are missing or incomplete. For instance, articles in the 1980s and early 1990s often lack abstracts in the ISI database (Carson 2012). The data were collected in February 2014. First, we used four criteria in the ISI search tool: (1) “topic” = contingent valuation or choice experiment 6, (2) “document type” = article, (3) “year published” = 2004 - 2013 and (4) “ISI citation database” = Science Citation Index (SCI), Social Science Citation Index (SSCI) or Arts & Humanities Citation Index (AHCI). We obtained 2,541 references as a result of these different selection criteria. Second, we added a fifth criteria because many of the references were not or little related to non-market valuation: (5) “web of knowledge category” = economics. The sample size decreased to 1,369. However, even in this restricted sample, we discovered that a few studies were still not related to non-market valuation. We noticed that the “keyword plus” option was mainly responsible for it7. Thus, we discarded the list of “keywords plus” and only
2 See also the post written by Whitehead (2011) in a blog: http://www.env-econ.net/2011/06/contingent-valuation-vs-choice-experiments-1989-2011.html 3 Carson (2012) refers to “contingent valuation” but this expression is to be understood in a broad sense since it includes “choice experiment”. 4 Alternative surveys of the literature can also be found in Sach et al. (2007), Olsen and Smith (2001), Bateman et al. (2002) and Alberini and Kahn (2009). 5 http://wokinfo.com/ 6 In (1), ISI checks if the chosen expressions (here “contingent valuation” and “choice experiment”) appears either in the title, abstract, list of keywords and/or list of “keyword plus”. The list of “keywords plus” is generated by ISI to broaden the search. KeyWords Plus reviews the titles of all references and includes keywords that were not listed by the authors. 7 http://interest.science.thomsonreuters.com/content/WOKUserTips-201010-SEA

5
kept the articles in which the expression “contingent valuation” and/or “choice experiment” appeared in the title/abstract/keyword list after importing all the references. The sample size became 990. In addition, we removed 13 additional articles to exclude RP studies8. Overall, our final sample comprises 977 references. In our data set, one line corresponds to one reference. To assess the quality of our data, we decided to select one observation for every 30 references and then browsed the 33 selected articles. We found only one mismatch: the reference of Johnson (2013) includes the expression “contingent valuation” in the abstract without explicit reference to the CE approach although the study corresponds to a CE study. We also found that the vast majority of the CV/CE articles reported a case study. Among the few articles that did not report a case study, some of them were theory oriented (e.g., Amiran and Hagen 2010). In Table 1, we present the list of the main variables that we created. A few of them are related to the method. In our data set, 54.5% of the references deal with CV and 49.1% with CE. The total exceeds 100% because a few references (3.6% exactly) characterized by the “mixed” dummy variable include both the expressions “contingent valuation “and “choice experiment” in the title/ abstract/keyword list. Most of them either compare CV and CE or combine them (Meyerhoff and Liebe 2008, Christie and Azevedo 2009, Ryan and Watson 2009, Adamowicz et al. 2011, Bijlenga et al. 2011, Hynes et al. 2011, Bennett and Balcombe 2012).
8 We wanted to exclude RP studies that use travel cost choice experiment. We found 13 studies in which “travel cost” and “choice experiment” appear in the title, abstract or list of the author’s keywords.

6
Table 1. Description of the main variables of the sample Variables Description Mean St.
dev. Method CV 1 if “contingent valuation” appears in the title/abstract/keyword list;
0 otherwise 0.545 0.498
CE 1 if “choice experiment” appears in the title/abstract/keyword list; 0 otherwise
0.491 0.500
Mixed 1 if both “choice experiment” and “contingent valuation” appear in the title/abstract/keyword list; 0 otherwise
0.036 0.186
Test 1 if the reference is browsed to assess the data quality; 0 otherwise 0.035 0.183 Year of publication 2004 1 if the article is published in 2004; 0 otherwise 0.061 0.240 2005 1 if the article is published in 2005; 0 otherwise 0.069 0.253 2006 1 if the article is published in 2006; 0 otherwise 0.080 0.271 2007 1 if the article is published in 2007; 0 otherwise 0.104 0.306 2008 1 if the article is published in 2008; 0 otherwise 0.097 0.296 2009 1 if the article is published in 2009; 0 otherwise 0.124 0.330 2010 1 if the article is published in 2010; 0 otherwise 0.100 0.301 2011 1 if the article is published in 2011; 0 otherwise 0.118 0.322 2012 1 if the article is published in 2012; 0 otherwise 0.126 0.322 2013 1 if the article is published in 2013; 0 otherwise 0.121 0.326 Type of journal Agriculture 1 if at least one of the following expressions appears in the journal
title: agriculture: agricultur(al), food; 0 otherwise 0.162 0.368
Environment 1 if at least one of the following expressions appears in the journal title: environment(al), ecologic(al) ; 0 otherwise
0.297 0.457
Health 1 if at least one of the following expressions appears in the journal title: health(y), food; 0 otherwise
0.156 0.362
Other 1 if the following expressions do not appear in the journal title: agricultur(al), food, environment(al), ecologic(al), health(y), food; 0 otherwise
0.386 0.487
Sport 1 if the following expression appears in the journal title: sport; 0 otherwise
0.003 0.055
Transport 1 if the following expression appears in the journal title: transport(ation) ; 0 otherwise
0.041 0.198
Education 1 if the following expression appears in the journal title: education; 0 otherwise
0.003 0.055
Culture 1 if the following expression appears in the journal title: cultur(al); 0 otherwise
0.001 0.032
Number of authors Number of authors 2.918 1.480 Country of authors Australia 1 if “Australia” appears in the (co-)affiliation address of at least one
author; 0 otherwise 0.125 0.331
Canada 1 if “Canada” appears in the (co-)affiliation address of at least one author; 0 otherwise
0.048 0.214
England 1 if “England” appears in the (co-)affiliation address of at least one author; 0 otherwise
0.160 0.366
France 1 if “France” appears in the (co-)affiliation address of at least one author; 0 otherwise
0.044 0.205
Germany 1 if “Germany” appears in the (co-)affiliation address of at least one author; 0 otherwise
0.062 0.242
Netherlands 1 if “Netherlands” appears in the (co-)affiliation address of at least one author; 0 otherwise
0.062 0.242
Scotland 1 if “Scotland” appears in the (co-)affiliation address of at least one author; 0 otherwise
0.059 0.236
Spain 1 if “Spain” appears in the (co-)affiliation address of at least one author; 0 otherwise
0.090 0.286
Sweden 1 if “Sweden” appears in the (co-)affiliation address of at least one author; 0 otherwise
0.058 0.234
USA 1 if “USA” appears in the (co-)affiliation address of at least one author; 0 otherwise
0.321 0.467
Other 1 if “Australia”, “Canada”, “England”, “France”, “Germany”, “Netherlands”, “Scotland”, “Spain”, “Sweden” and “USA” do not appear in the (co-)affiliation of at least one author; 0 otherwise
0.189 0.392
Note: The database contains 977 articles.

7
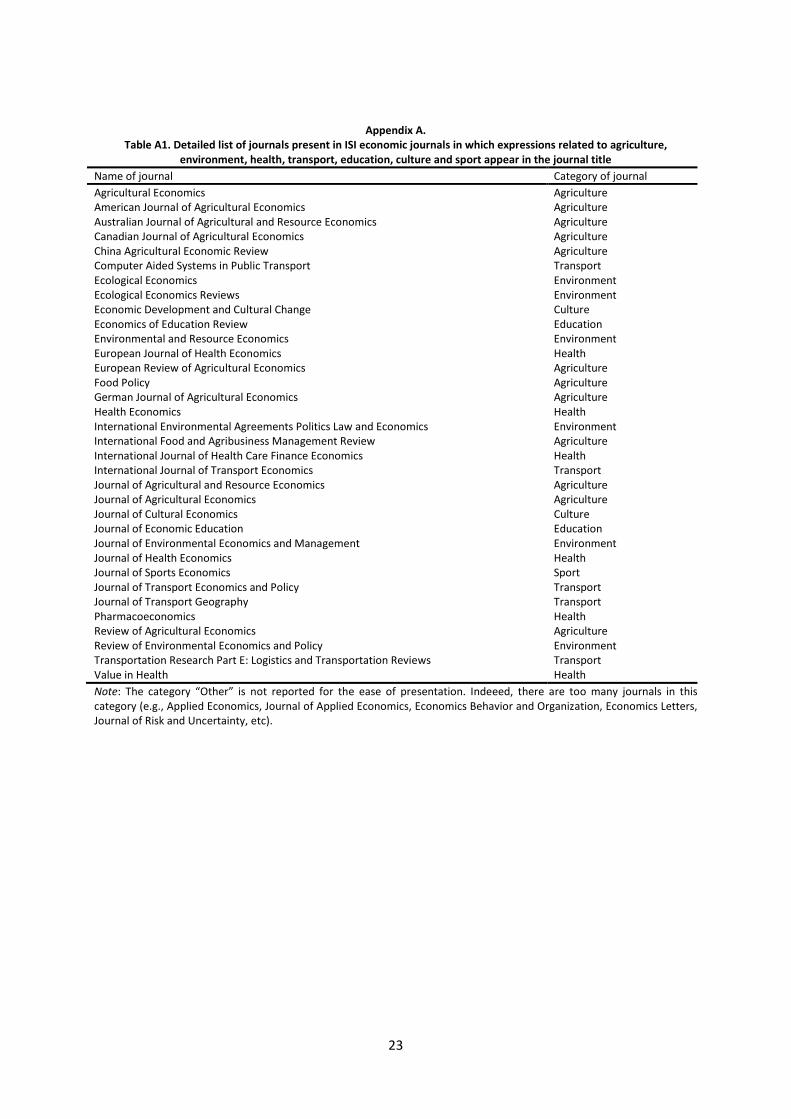
Another set of variables is related to the type of journal (agriculture, environment, etc….) in which the paper was published, the detailed list of ISI economic journals related to agriculture, environment and health being provided in Appendix A. For instance, the dummy variable “Agriculture” takes value one if the journal title includes “Agricultur(al)” and/or “Food” such as “Agricultural Economics”, “American Journal of Agricultural Economics” and “Australian Journal of Agricultural and Resource Economics”. In our database, 16.2% of the articles were published in a journal related to agriculture. The variable “Other” includes journals which are not related to health, agriculture or environment, such as journals with a broader scope like “Journal of Risk and Uncertainty”, “Journal of Applied Economics” or “Journal of Economic Behavior and Organization”, or journals which are more specific such as those dealing with transport (“International Journal of Transport Economics”), education (“Journal of Economic Education”) or culture (“Journal of Cultural Economics”). Finally, some variables relate to the number of authors as well as their academic affiliations9. On average, there are three co-authors per article and one author (or more) is (co-)affiliated in a US institution in 33.2% of the references. 4. A characterization of the CV versus CE references Type of field In Figure 1 and Figure 2, we present the number and proportion of SP articles by field. In our database, there are many more SP references in economic journals related to agriculture, environment and health than in economic journals dealing with other fields like culture, education, sport and transportation. The environmental journals published the highest SP number of articles with 288 SP articles between 2004 and 2013, followed by agriculture (158 articles) and health (152 articles)10. In environment for instance, these references represent 7.5% of the total publication in these journals during the ten years period (Figure 2). By comparison, the proportion of CV articles published in journals related to health and agricultural economics was equal to 3.8% and 3.1%, respectively.
9 We created dummy variables for each of the affiliation countries publishing the most. 10 It should be kept in mind that this is a conservative number in the sense that there are probably missing references, e.g. CV and CE articles in which the expression “contingent valuation” or “choice experiment” does not appear in the title/abstract/list of key words (these references not being included in our database by construction).

8
Figure 1. Number of SP articles 2004-2013
Figure 2. Proportion of SP articles 2004-2013
0 100 200 300Number of publications
Culture
Education
Sport
Transport
Health
Agriculture
Environment
0 2 4 6 8Proportion of publications (in %)
Culture
Education
Sport
Transport
Health
Agriculture
Environment
9
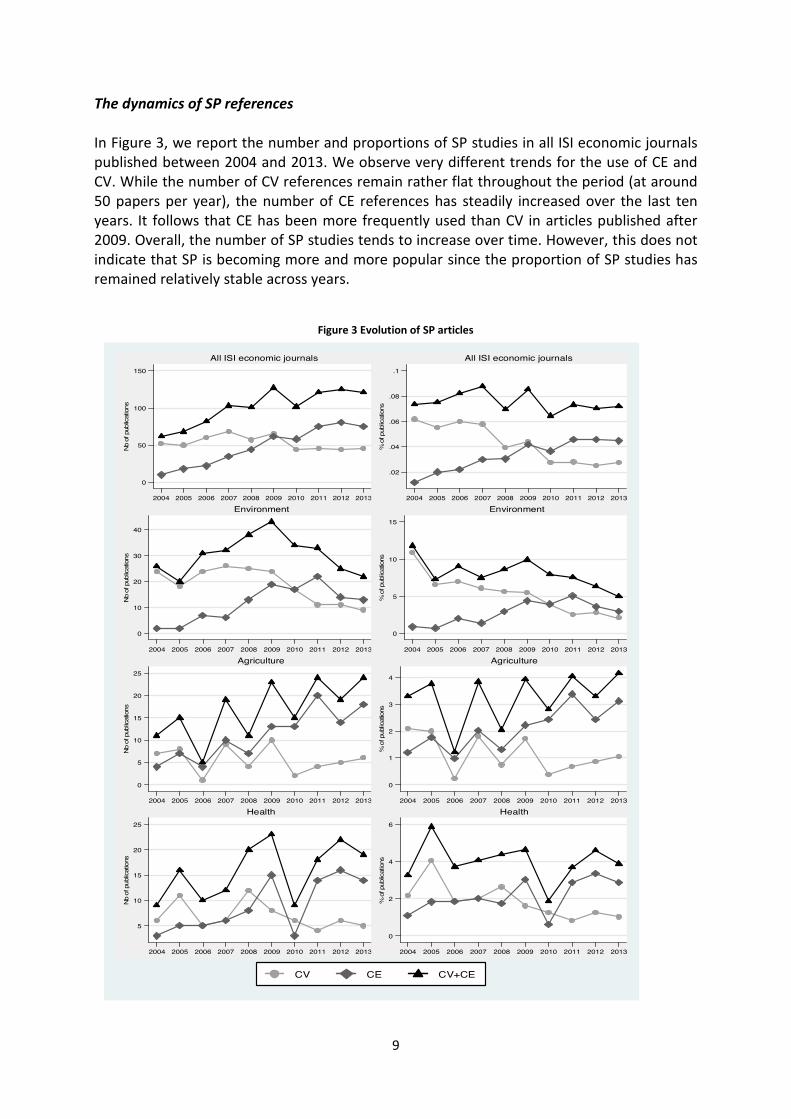
The dynamics of SP references In Figure 3, we report the number and proportions of SP studies in all ISI economic journals published between 2004 and 2013. We observe very different trends for the use of CE and CV. While the number of CV references remain rather flat throughout the period (at around 50 papers per year), the number of CE references has steadily increased over the last ten years. It follows that CE has been more frequently used than CV in articles published after 2009. Overall, the number of SP studies tends to increase over time. However, this does not indicate that SP is becoming more and more popular since the proportion of SP studies has remained relatively stable across years.
Figure 3 Evolution of SP articles
0
50
100
150
Nb o
f pub
licat
ions
2004 2005 2006 2007 2008 2009 2010 2011 2012 2013
All ISI economic journals
.02
.04
.06
.08
.1%
of p
ublic
atio
ns
2004 2005 2006 2007 2008 2009 2010 2011 2012 2013
All ISI economic journals
0
10
20
30
40
Nb
of p
ublic
atio
ns
2004 2005 2006 2007 2008 2009 2010 2011 2012 2013
Environment
0
5
10
15
% o
f pub
licat
ions
2004 2005 2006 2007 2008 2009 2010 2011 2012 2013
Environment
0
5
10
15
20
25
Nb
of p
ublic
atio
ns
2004 2005 2006 2007 2008 2009 2010 2011 2012 2013
Agriculture
0
1
2
3
4
% o
f pub
licat
ions
2004 2005 2006 2007 2008 2009 2010 2011 2012 2013
Agriculture
5
10
15
20
25
Nb o
f pub
licat
ions
2004 2005 2006 2007 2008 2009 2010 2011 2012 2013
Health
0
2
4
6
% o
f pub
licat
ions
2004 2005 2006 2007 2008 2009 2010 2011 2012 2013
Health
CV CE CV+CE

10
Figure 3 also reports the same information for the three following fields: agriculture, environment and health. We find mixed results with an increasing trend for the proportion of SP studies in journals related to agricultural economics, while the opposite pattern is observed for journals related to environmental economics. The trend is relatively stable in journals related to health economics. Quotation of the most influential articles In Figure 4, we compare the most quoted CV and CE articles that were published in 2004 (CV: Alberini et al. 2004, CE: Lusk and Schroeder 2004), 2005 (CE: Bech and Gyrd-Hansen 2005, CV: Murphy et al. 2005), 2006 (CV: Bateman et al. 2006, CE: Birol et al. 2006), 2007 (CV: Carson and Groves 2007, CE: Ferrini and Scarpa 2007), 2008 (CV: Blumenschein et al. 2008, CE: Scarpa and Rose 2008), 2009 (CV: Richardson and Loomis 2009, CE: Scarpa et al. 2009), 2010 (CE: Hoyos 2010, CV: Nocella et al. 2010), 2011 (CE: Bridges et al. 2011, CV: Carson and Louviere 2011), 2012 (CV: Botzen and van den Bergh 2012, CE: Coast et al. 2012) and 2013 (CE: Greene and Hensher 2013, CV: Krishna et al. 2013). We also perform the same comparisons by only considering the journals related to agriculture, environment and health.
Figure 4. Number of citations for the most frequently quoted CV and CE articles
0
50
100
150
Nb o
f cita
tions
2004 2005 2006 2007 2008 2009 2010 2011 2012 2013
All the journals of our database
0
50
100
150
Nb o
f cita
tions
2004 2005 2006 2007 2008 2009 2010 2011 2012 2013
Environment
0
50
100
150
Nb
of c
itatio
ns
2004 2005 2006 2007 2008 2009 2010 2011 2012 2013
Agriculture
0
20
40
60
80
Nb
of c
itatio
ns
2004 2005 2006 2007 2008 2009 2010 2011 2012 2013
Health
CV CE

11
When considering all ISI economic journals, the number of citations is higher for the most frequently quoted CV article compared to the most frequently quoted CE article in 2005, 2007 and 2009. The reverse pattern is found from 2010, which suggests that influential articles tend nowadays to use CE rather than CV11. This tendency is even more salient when restricting the analysis to journals related to health economics. The most-cited CV article is more quoted than the most-cited CE article in 2010 only. For instance, among the papers that were published in 2011, the most quoted CV receives only one quote between 2011 and 2014 whereas the most quoted CE, Bridges et al. (2011), receives 48 quotes between 2011 and 2014. Table 2 displays the 20 most influential SP papers using two different types of ranking. The first ranking is based on the total number of citations between the year of publication and February 2014, while the second ranking considers the average number of citations between the year of publication and February 2014. According to the first ranking (total number of citations), the most influential article is the meta-analysis on hypothetical bias written by Murphy et al. (2005), which was quoted 160 times in ISI journals. When considering the number of citations per year, the most frequently quoted article is the one on incentive compatibility written by Carson and Groves (2007), which was quoted 20 times per year on average in ISI journals12.
Table 2. Rankings of the most influential 20 articles References Total number
of ISI citations References
Number of ISI citations on average per year
Murphy et al. (2005) 160 Carson and Groves (2007) 20.71 Carson and Groves (2007) 145 Murphy et al. (2005) 17.78 Lusk and Schroeder (2004) 137 Bridges et al. (2011) 16.00 Kahneman and Sugden (2005) 103 Ferrini and Scarpa (2007) 14.71 Ferrini and Scarpa (2007) 103 Lusk and Schroeder (2004) 13.70 Poe et al. (2005) 96 Scarpa and Rose (2008) 11.67 Alberini et al. (2004) 87 Blumenschein et al. (2008) 11.67 Birol et al. (2006) 79 Kahneman and Sugden (2005) 11.44 Loureiro and Umberger (2007) 78 Loureiro and Umberger (2007) 11.14 Flynn et al. (2007) 76 Flynn et al. (2007) 10.86 Christie et al. (2006) 74 Hoyos (2010) 10.75 Bateman et al. (2006) 74 Poe et al. (2005) 10.67 Blumenschein et al. (2008) 70 Scarpa and Willis (2010) 10.50 Scarpa and Rose (2008) 70 Birol et al. (2006) 9.88 Wiser (2007) 64 Christie et al. (2006) 9.25 Bech and Gyrd-Hansen (2005) 62 Bateman et al. (2006) 9.25 Alfnes (2004) 59 Wiser (2007) 9.14 Bateman et al. (2004) 55 Richardson and Loomis (2009) 9.00 Lusk and Norwood (2005) 55 Scarpa et al. (2009) 8.80 Carlsson et al. (2007) 55 Alberini et al. (2004) 8.70 Note: The database contains 977 articles.
11 The number of quotations for recent articles is relatively low, which renders comparisons between CV and CE for each field difficult. 12 It is worth noting that studies more recent than 2012 have probably not been cited in yet accepted and published papers.
12
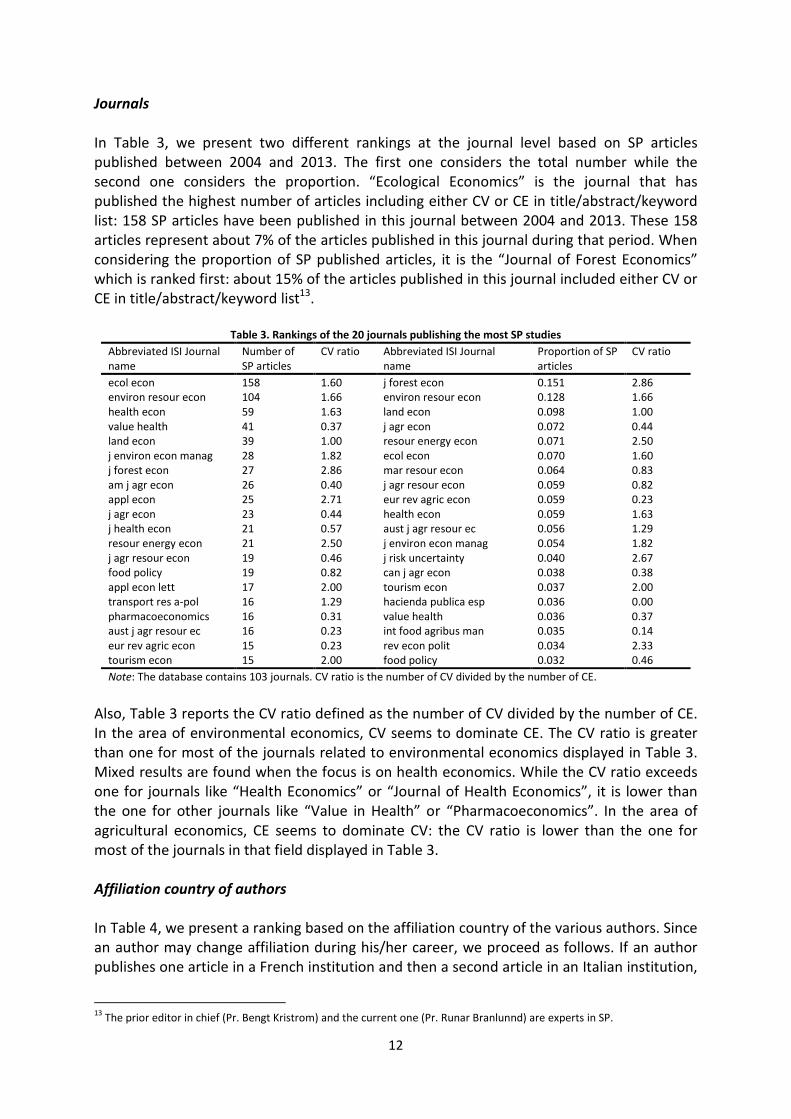
Journals In Table 3, we present two different rankings at the journal level based on SP articles published between 2004 and 2013. The first one considers the total number while the second one considers the proportion. “Ecological Economics” is the journal that has published the highest number of articles including either CV or CE in title/abstract/keyword list: 158 SP articles have been published in this journal between 2004 and 2013. These 158 articles represent about 7% of the articles published in this journal during that period. When considering the proportion of SP published articles, it is the “Journal of Forest Economics” which is ranked first: about 15% of the articles published in this journal included either CV or CE in title/abstract/keyword list13.
Table 3. Rankings of the 20 journals publishing the most SP studies Abbreviated ISI Journal name
Number of SP articles
CV ratio Abbreviated ISI Journal name
Proportion of SP articles
CV ratio
ecol econ 158 1.60 j forest econ 0.151 2.86 environ resour econ 104 1.66 environ resour econ 0.128 1.66 health econ 59 1.63 land econ 0.098 1.00 value health 41 0.37 j agr econ 0.072 0.44 land econ 39 1.00 resour energy econ 0.071 2.50 j environ econ manag 28 1.82 ecol econ 0.070 1.60 j forest econ 27 2.86 mar resour econ 0.064 0.83 am j agr econ 26 0.40 j agr resour econ 0.059 0.82 appl econ 25 2.71 eur rev agric econ 0.059 0.23 j agr econ 23 0.44 health econ 0.059 1.63 j health econ 21 0.57 aust j agr resour ec 0.056 1.29 resour energy econ 21 2.50 j environ econ manag 0.054 1.82 j agr resour econ 19 0.46 j risk uncertainty 0.040 2.67 food policy 19 0.82 can j agr econ 0.038 0.38 appl econ lett 17 2.00 tourism econ 0.037 2.00 transport res a-pol 16 1.29 hacienda publica esp 0.036 0.00 pharmacoeconomics 16 0.31 value health 0.036 0.37 aust j agr resour ec 16 0.23 int food agribus man 0.035 0.14 eur rev agric econ 15 0.23 rev econ polit 0.034 2.33 tourism econ 15 2.00 food policy 0.032 0.46 Note: The database contains 103 journals. CV ratio is the number of CV divided by the number of CE.
Also, Table 3 reports the CV ratio defined as the number of CV divided by the number of CE. In the area of environmental economics, CV seems to dominate CE. The CV ratio is greater than one for most of the journals related to environmental economics displayed in Table 3. Mixed results are found when the focus is on health economics. While the CV ratio exceeds one for journals like “Health Economics” or “Journal of Health Economics”, it is lower than the one for other journals like “Value in Health” or “Pharmacoeconomics”. In the area of agricultural economics, CE seems to dominate CV: the CV ratio is lower than the one for most of the journals in that field displayed in Table 3. Affiliation country of authors In Table 4, we present a ranking based on the affiliation country of the various authors. Since an author may change affiliation during his/her career, we proceed as follows. If an author publishes one article in a French institution and then a second article in an Italian institution,
13 The prior editor in chief (Pr. Bengt Kristrom) and the current one (Pr. Runar Branlunnd) are experts in SP.
13
we consider that “France” = 1 for the first reference and “Italy” = 1 for the second one. If a paper is written by two authors, with one affiliated to a French institution and the other one affiliated to a German institution and co-affiliated to a Swedish institution, three different institutions are considered for the same observation (“France”= 1, “Germany”= 1; “Sweden” = 1).
Table 4. Ranking by affiliation country Total number of
SP articles per country affiliations
Proportion of SP articles Method Type of journal
Country CV CE Mixed Agriculture Environment
Health Other
US 314 0.65 0.38 0.03 0.22 0.31 0.07 0.40 England 156 0.44 0.60 0.04 0.10 0.29 0.31 0.30 Australia 122 0.27 0.76 0.03 0.18 0.26 0.25 0.31 Spain 88 0.51 0.53 0.05 0.18 0.35 0.06 0.41 Germany 61 0.49 0.54 0.03 0.33 0.25 0.08 0.34 Netherlands 61 0.43 0.62 0.05 0.03 0.21 0.34 0.42 Scotland 58 0.41 0.71 0.12 0.17 0.38 0.26 0.19 Sweden 57 0.46 0.54 0.00 0.09 0.28 0.09 0.54 Canada 47 0.45 0.60 0.04 0.15 0.26 0.30 0.29 France 43 0.67 0.33 0.00 0.02 0.23 0.23 0.52 Other 185 0.62 0.43 0.05 0.14 0.32 0.12 0.41 Note: The database contains 72 affiliation countries.
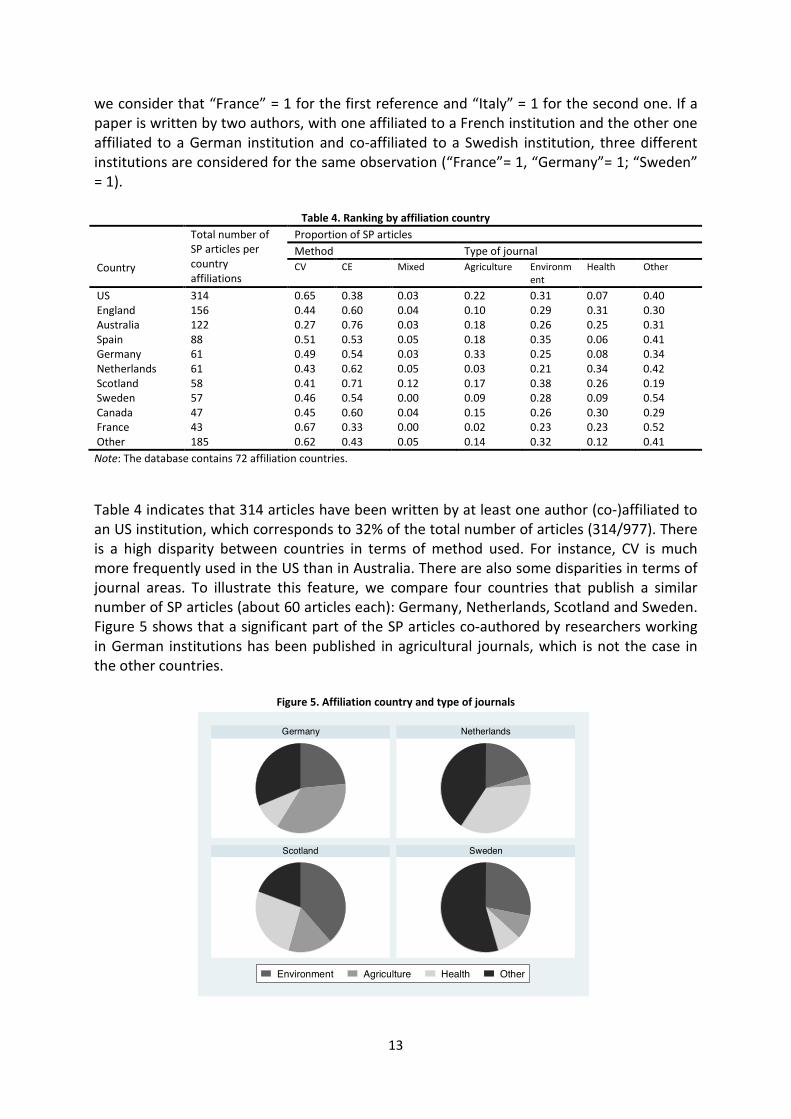
Table 4 indicates that 314 articles have been written by at least one author (co-)affiliated to an US institution, which corresponds to 32% of the total number of articles (314/977). There is a high disparity between countries in terms of method used. For instance, CV is much more frequently used in the US than in Australia. There are also some disparities in terms of journal areas. To illustrate this feature, we compare four countries that publish a similar number of SP articles (about 60 articles each): Germany, Netherlands, Scotland and Sweden. Figure 5 shows that a significant part of the SP articles co-authored by researchers working in German institutions has been published in agricultural journals, which is not the case in the other countries.
Figure 5. Affiliation country and type of journals
Germany Netherlands
Scotland Sweden
Environment Agriculture Health Other

14
Authors involved in SP studies Table 5 provides some information at the author level, with a focus on complementarity versus substitutability in the CE-CV methods. After having identified 1715 different authors, we counted the number of CV, CE and mixed articles published by each of these authors. For that purpose, we coded each observation (each observation corresponding to one author) as follows: (j+e;k+e), where j corresponds to the number of CV articles, k to the number of CE articles and e to the number of mixed articles. For example, (1;1) corresponds to the case where a respondent has co-authored one CV and one CE, or has co-authored one mixed. As a final step, we calculated the number of occurrences for the various combinations.
Table 5. Number of authors conducting CV or/and CE studies
CV
0 1 2 3 4 5 6 7 8 9 10 13 14 15 16 Total
0 0 608 94 38 13 6 1 0 1 1 1 0 1 0 0 764
1 617 48 10 2 2 0 1 1 1 0 0 0 0 0 0 682
2 94 9 20 11 4 1 1 0 2 0 0 1 0 0 0 143
3 35 3 10 4 3 0 1 0 0 0 0 0 0 0 0 56
4 9 5 8 0 4 0 1 2 1 0 0 0 0 0 0 30
5 7 0 3 1 0 1 0 1 0 1 0 0 0 0 0 14
6 1 2 0 2 0 1 0 0 0 0 0 0 0 0 0 6
7 0 1 0 3 2 0 0 0 0 0 1 0 0 0 0 7
CE 8 0 1 1 0 1 0 0 0 1 0 0 0 0 1 0 5
11 0 0 1 0 0 0 0 0 0 0 0 0 0 0 0 1
12 0 0 1 0 0 0 0 0 0 0 0 0 0 0 0 1
14 0 0 0 0 0 0 0 0 0 1 0 0 0 0 0 1
15 0 0 0 1 0 0 0 1 0 0 0 0 0 0 0 2
16 1 0 0 0 0 0 0 0 0 0 0 0 0 0 0 1
23 0 0 1 0 0 0 0 0 0 0 0 0 0 0 0 1
24 0 0 0 0 0 0 0 0 0 0 0 0 0 0 1 1
Total 764 677 149 62 29 9 5 5 6 3 2 1 1 1 1 1715 According to the results shown in Table 5, many authors published only one study. Among them, the number of people performing one single CV study is relatively close to that of people performing a CE since we have 608 (1;0) and 617 (0;1) cases. The number of respondents conducting two or three studies is much lower than those conducting only one study. Also, the distribution between CV and CE of the “one-method authors” is relatively balanced. For instance, the numbers of (2;0) and (0;2) are identical (n=94), while the numbers of (3;0) and (0;3) are very close (n=38 and n=35 respectively).
15
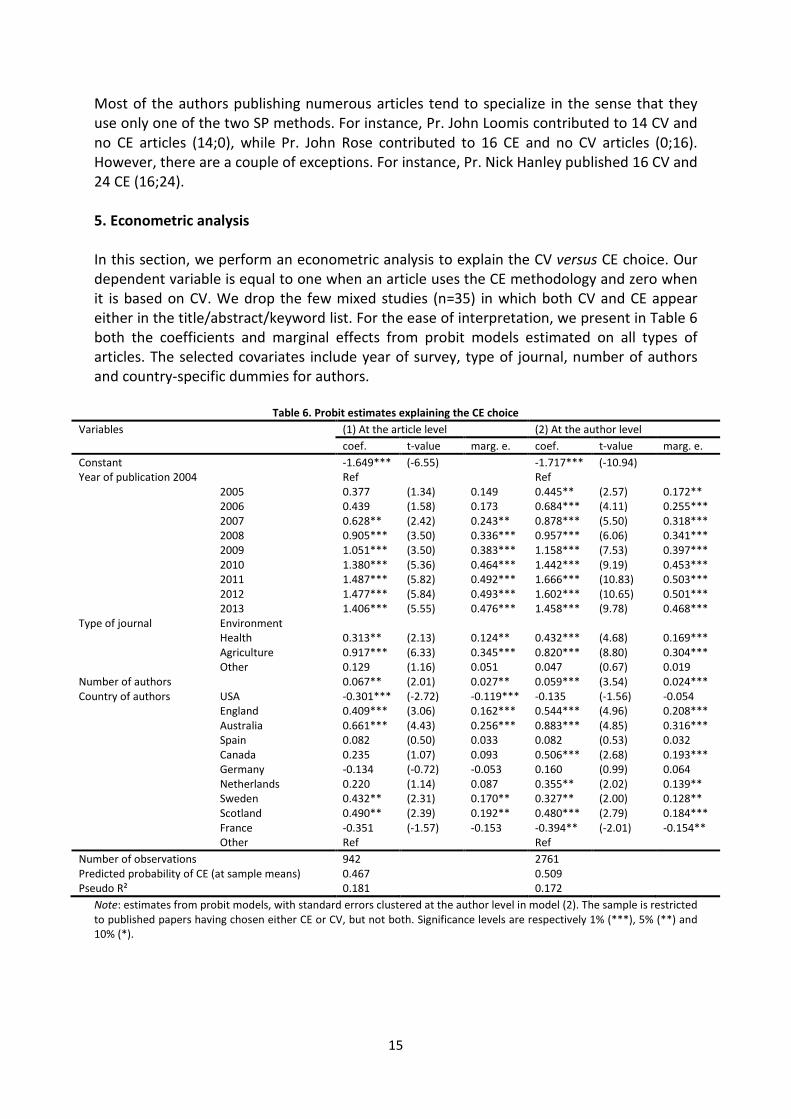
Most of the authors publishing numerous articles tend to specialize in the sense that they use only one of the two SP methods. For instance, Pr. John Loomis contributed to 14 CV and no CE articles (14;0), while Pr. John Rose contributed to 16 CE and no CV articles (0;16). However, there are a couple of exceptions. For instance, Pr. Nick Hanley published 16 CV and 24 CE (16;24). 5. Econometric analysis In this section, we perform an econometric analysis to explain the CV versus CE choice. Our dependent variable is equal to one when an article uses the CE methodology and zero when it is based on CV. We drop the few mixed studies (n=35) in which both CV and CE appear either in the title/abstract/keyword list. For the ease of interpretation, we present in Table 6 both the coefficients and marginal effects from probit models estimated on all types of articles. The selected covariates include year of survey, type of journal, number of authors and country-specific dummies for authors.
Table 6. Probit estimates explaining the CE choice Variables (1) At the article level (2) At the author level
coef. t-value marg. e. coef. t-value marg. e. Constant -1.649*** (-6.55) -1.717*** (-10.94) Year of publication 2004 Ref Ref 2005 0.377 (1.34) 0.149 0.445** (2.57) 0.172** 2006 0.439 (1.58) 0.173 0.684*** (4.11) 0.255*** 2007 0.628** (2.42) 0.243** 0.878*** (5.50) 0.318*** 2008 0.905*** (3.50) 0.336*** 0.957*** (6.06) 0.341*** 2009 1.051*** (3.50) 0.383*** 1.158*** (7.53) 0.397*** 2010 1.380*** (5.36) 0.464*** 1.442*** (9.19) 0.453*** 2011 1.487*** (5.82) 0.492*** 1.666*** (10.83) 0.503*** 2012 1.477*** (5.84) 0.493*** 1.602*** (10.65) 0.501*** 2013 1.406*** (5.55) 0.476*** 1.458*** (9.78) 0.468*** Type of journal Environment Health 0.313** (2.13) 0.124** 0.432*** (4.68) 0.169*** Agriculture 0.917*** (6.33) 0.345*** 0.820*** (8.80) 0.304*** Other 0.129 (1.16) 0.051 0.047 (0.67) 0.019 Number of authors 0.067** (2.01) 0.027** 0.059*** (3.54) 0.024*** Country of authors USA -0.301*** (-2.72) -0.119*** -0.135 (-1.56) -0.054 England 0.409*** (3.06) 0.162*** 0.544*** (4.96) 0.208*** Australia 0.661*** (4.43) 0.256*** 0.883*** (4.85) 0.316*** Spain 0.082 (0.50) 0.033 0.082 (0.53) 0.032 Canada 0.235 (1.07) 0.093 0.506*** (2.68) 0.193*** Germany -0.134 (-0.72) -0.053 0.160 (0.99) 0.064 Netherlands 0.220 (1.14) 0.087 0.355** (2.02) 0.139** Sweden 0.432** (2.31) 0.170** 0.327** (2.00) 0.128** Scotland 0.490** (2.39) 0.192** 0.480*** (2.79) 0.184*** France -0.351 (-1.57) -0.153 -0.394** (-2.01) -0.154** Other Ref Ref Number of observations 942 2761 Predicted probability of CE (at sample means) 0.467 0.509 Pseudo R² 0.181 0.172
Note: estimates from probit models, with standard errors clustered at the author level in model (2). The sample is restricted to published papers having chosen either CE or CV, but not both. Significance levels are respectively 1% (***), 5% (**) and 10% (*).

16
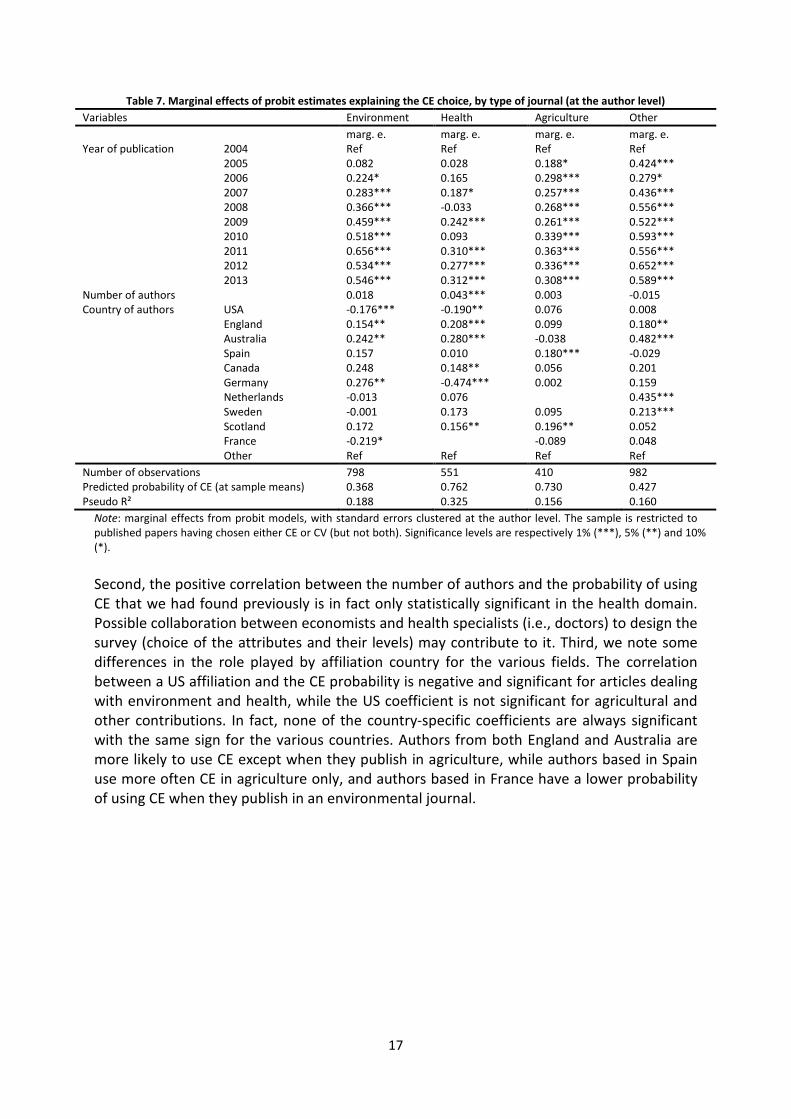
In a first specification (1), we estimate the probit regression at the article level. At the sample means, the predicted probability of an article to use CE is equal to 0.467. This probability has strongly increased over the period under consideration. Compared to 2004, the probability of a CE study was 24.3% higher in 2007, 38.3% in 2009 and around 50% in 2011. Our results show substantial differences by type of journal. Compared to papers published in environmental journals, papers published in health and agriculture are more likely to use the CE method (+12.4% and +34.5% respectively). Interestingly, we find a positive correlation between the number of authors and the probability to adopt the CE framework. A possible explanation is that it is more complex to design the survey and deal with the data when using CE rather than CV, which could encourage collaboration between researchers with different expertize. Our results also show substantial differences by affiliation country of authors. In particular, CE studies are more frequently published by authors from Australia (+25.6%), Scotland (+19.2%), Sweden (+17.0%) and England (+16.2%). Conversely, authors from USA are more likely to publish papers using CV. In a second specification (2), we estimate the same probit regression on a sample in which each author of a given article is counted as one observation. Thus, an article written by four coauthors will contribute four observations to this new sample. Since variables like year of publication, type of journal and number of authors are the same for a given article, we cluster the standard errors at the article level. Overall, we reach similar conclusions with an excess of CE publications over the more recent years and in journals related to health and agriculture. Concerning affiliation country, CE studies are more frequently published by researchers from Australia, England, Canada, Netherlands, Scotland and Sweden, while the reverse pattern is found for France. Next, we study the possibility of heterogeneous effects of the covariates. Still using a database at the author level, we explain the probability of using the CE method using probit models estimated on the following four categories: agriculture, environment, health and a residual category including the other articles. The corresponding estimates are presented in Table 7. First, regardless of the type of journal under consideration, the probability for an article to use CE rather than CV has increased since 2004. The gap is more important in environmental journals and in the residual category. Nevertheless, since 2011, we note that whatever the type of journal, the marginal effects have remained rather constant.
17
Table 7. Marginal effects of probit estimates explaining the CE choice, by type of journal (at the author level) Variables Environment Health Agriculture Other marg. e. marg. e. marg. e. marg. e. Year of publication 2004 Ref Ref Ref Ref 2005 0.082 0.028 0.188* 0.424*** 2006 0.224* 0.165 0.298*** 0.279* 2007 0.283*** 0.187* 0.257*** 0.436*** 2008 0.366*** -0.033 0.268*** 0.556*** 2009 0.459*** 0.242*** 0.261*** 0.522*** 2010 0.518*** 0.093 0.339*** 0.593*** 2011 0.656*** 0.310*** 0.363*** 0.556*** 2012 0.534*** 0.277*** 0.336*** 0.652*** 2013 0.546*** 0.312*** 0.308*** 0.589*** Number of authors 0.018 0.043*** 0.003 -0.015 Country of authors USA -0.176*** -0.190** 0.076 0.008 England 0.154** 0.208*** 0.099 0.180** Australia 0.242** 0.280*** -0.038 0.482*** Spain 0.157 0.010 0.180*** -0.029 Canada 0.248 0.148** 0.056 0.201 Germany 0.276** -0.474*** 0.002 0.159 Netherlands -0.013 0.076 0.435*** Sweden -0.001 0.173 0.095 0.213*** Scotland 0.172 0.156** 0.196** 0.052 France -0.219* -0.089 0.048 Other Ref Ref Ref Ref Number of observations 798 551 410 982 Predicted probability of CE (at sample means) 0.368 0.762 0.730 0.427 Pseudo R² 0.188 0.325 0.156 0.160
Note: marginal effects from probit models, with standard errors clustered at the author level. The sample is restricted to published papers having chosen either CE or CV (but not both). Significance levels are respectively 1% (***), 5% (**) and 10% (*). Second, the positive correlation between the number of authors and the probability of using CE that we had found previously is in fact only statistically significant in the health domain. Possible collaboration between economists and health specialists (i.e., doctors) to design the survey (choice of the attributes and their levels) may contribute to it. Third, we note some differences in the role played by affiliation country for the various fields. The correlation between a US affiliation and the CE probability is negative and significant for articles dealing with environment and health, while the US coefficient is not significant for agricultural and other contributions. In fact, none of the country-specific coefficients are always significant with the same sign for the various countries. Authors from both England and Australia are more likely to use CE except when they publish in agriculture, while authors based in Spain use more often CE in agriculture only, and authors based in France have a lower probability of using CE when they publish in an environmental journal.
18
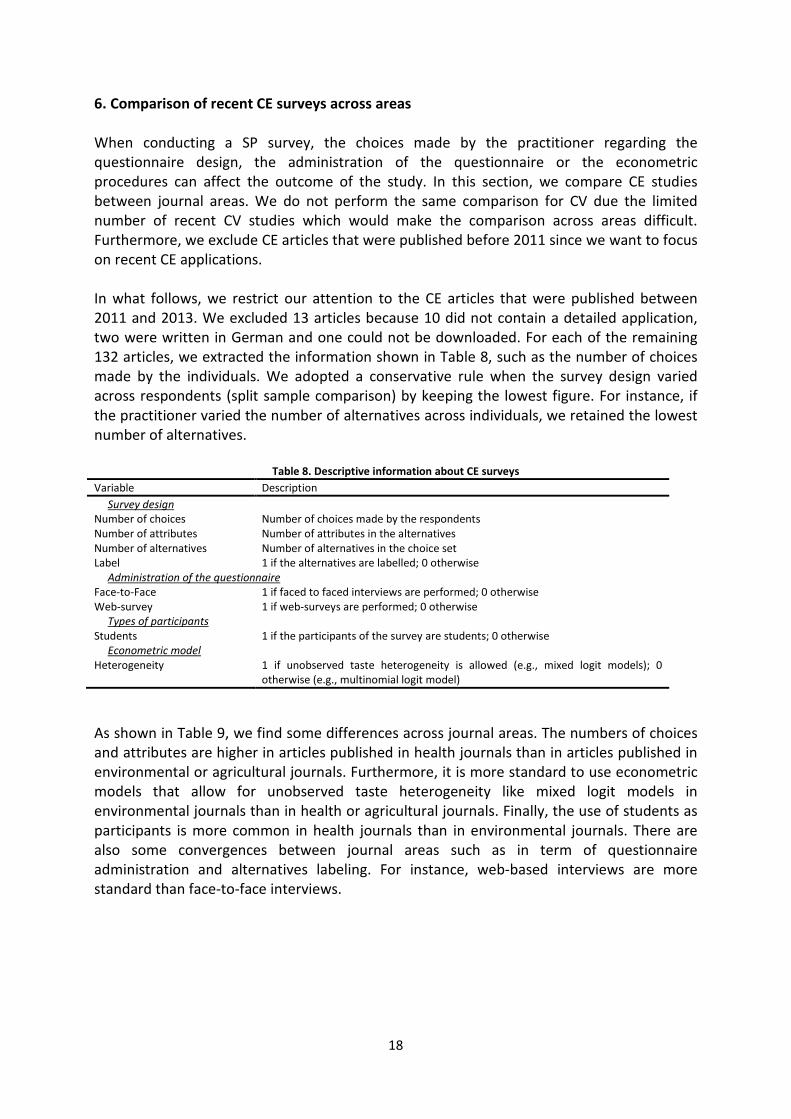
6. Comparison of recent CE surveys across areas When conducting a SP survey, the choices made by the practitioner regarding the questionnaire design, the administration of the questionnaire or the econometric procedures can affect the outcome of the study. In this section, we compare CE studies between journal areas. We do not perform the same comparison for CV due the limited number of recent CV studies which would make the comparison across areas difficult. Furthermore, we exclude CE articles that were published before 2011 since we want to focus on recent CE applications. In what follows, we restrict our attention to the CE articles that were published between 2011 and 2013. We excluded 13 articles because 10 did not contain a detailed application, two were written in German and one could not be downloaded. For each of the remaining 132 articles, we extracted the information shown in Table 8, such as the number of choices made by the individuals. We adopted a conservative rule when the survey design varied across respondents (split sample comparison) by keeping the lowest figure. For instance, if the practitioner varied the number of alternatives across individuals, we retained the lowest number of alternatives.
Table 8. Descriptive information about CE surveys Variable Description Survey design Number of choices Number of choices made by the respondents Number of attributes Number of attributes in the alternatives Number of alternatives Number of alternatives in the choice set Label 1 if the alternatives are labelled; 0 otherwise Administration of the questionnaire Face-to-Face 1 if faced to faced interviews are performed; 0 otherwise Web-survey 1 if web-surveys are performed; 0 otherwise Types of participants Students 1 if the participants of the survey are students; 0 otherwise Econometric model Heterogeneity 1 if unobserved taste heterogeneity is allowed (e.g., mixed logit models); 0
otherwise (e.g., multinomial logit model) As shown in Table 9, we find some differences across journal areas. The numbers of choices and attributes are higher in articles published in health journals than in articles published in environmental or agricultural journals. Furthermore, it is more standard to use econometric models that allow for unobserved taste heterogeneity like mixed logit models in environmental journals than in health or agricultural journals. Finally, the use of students as participants is more common in health journals than in environmental journals. There are also some convergences between journal areas such as in term of questionnaire administration and alternatives labeling. For instance, web-based interviews are more standard than face-to-face interviews.

19
Table 9. Mean comparison between type of journal using t-test Variables Mean t-student Agriculture Environ
ment Health Health
versus Environment
Health versus Agriculture
Environment versus Agriculture
Number of choices 8.71 (4.57)
5.64 (2.09)
12.17 (7.24)
5.88*** 2.68*** 4.20***
Number of attributes 4.40 (1.25)
5.13 (1.98)
5.92 (2.19)
1.73* 4.04*** 2.15**
Number of alternatives 3.27 (0.76)
3.00 (1.00)
2.49 (0.80)
2.54** 4.59*** 1.48
Label 0.11 (0.31)
0.13 (0.34)
0.14 (0.35)
0.10 0.36 0.28
Face-to-Face 0.38 (0.49)
0.38 (0.49)
0.22 (0.42)
1.65 1.58 0.08
Web-survey 0.44 (0.50)
0.40 (0.50)
0.46 (0.51)
0.50
0.20 0.32
Students 0.02 (0.14)
0.00 (0.00)
0.11 (0.31)
2.36** 1.70* 0.99
Heterogeneity 0.71 (0.46)
0.85 (0.36)
0.59 (0.50)
2.74*** 1.09 1.68*
Note: Standard deviations are in brackets. The total number of observations is 132 (37 for health, 47 for environment and 48 for agriculture). Our results give some support to Louviere and Lancsar (2009) who argue that relatively few applications in health economics have followed “best practices”. In our sample, a sizeable part of the studies published in health journals use basic models such as the multinomial logit model or the conditional logit model which assume that the coefficients in the indirect utility function are identical across individuals and that the assumption of independence of irrelevant alternatives (IIA) holds. These two assumptions are relaxed in the mixed logit models which are often used in environmental journals. Practitioners should consider the cognitive burden placed on the participants when designing the survey since the task difficulty can affect the quality of the data according to most of the user guides (e.g., Lancsar and Louviere 2008, Hoyos 2010). This could explain why the number of choices is relatively low in environmental journals. Indeed, some environmental goods are very complex to value, especially because people are not very familiar with them or because they are unaware of their role in the ecosystems. Therefore, practitioners may want to limit the cognitive burden by reducing the number of choices. 7. Discussion and concluding comments Our main result from a systematic review of the literature of SP studies published over the last ten years is that CE is becoming more popular than CV, which is consistent with the prediction made ten years ago by Adamowicz (2004). A combination of several factors may explain the increasing popularity of CE:
(a) CE extracts more information than CV; (b) Its implementation has been facilitated by the development or creation of statistical
software. For instance, the NGENE software has been created to help with the experimental design while econometric softwares such as STATA or NLOGIT have developed routines for choice models;

20
(c) Various textbooks and courses on CE have been released. For instance, Train (2009) proposed both an econometric book and a course with free access14, while the textbooks from Louviere et al. (2000) and Hensher et al. (2005) have been useful to many practitioners (i.e., survey design);
(d) New model specifications have been developed, especially new variants of the mixed logit regression;
(e) Web-based surveys, which allow presenting the choice set in a friendly manner, are becoming easy to implement and the number of connected people to the internet keeps increasing, which limits biased sampling;
(f) A series of conferences (International Conference on Choice Modeling) and a journal (Journal of Choice Modeling) have been launched on CE and other choice modeling approaches;
(g) There have been important criticisms of CV. Sensitivity to scope is one of the main concerns (Hausman 2012). CE provides a natural internal scope test due to the use of multiple responses (Hanley et al. 2001) and the use of labels in CE may mitigate the lack of sensitivity to the scope (see Czajkowski and Hanley 2009).
A second result is that the proportion of CE is found to be larger in journals related to health or agriculture than in journals related to environmental economics. A potential explanation could be that some environmental goods are very complex to value as explained in the previous section. Since CE places a larger cognitive burden on the respondents than CV (Hoyos 2010), some researchers may prefer CV to CE so as to avoid putting an extra burden on the respondents. Furthermore, the NOAA panel (Arrow and Solow 1993) has given some support to the use of CV in the field of environment. The NOAA recommendations may not be fully transposable to other fields like health as argued by Smith and Sach (2009). A third result is that the proportion of CE is relatively large in some countries, especially in Australia, while it is relatively low in others and especially in the USA. In that country, the proportion of CE might be relatively low because the NOAA panel has given support to the use of CV in court. In Australia, the Centre for the Study of Choice (CenSoC) which is directed by Pr. Jordan Louviere is a research center that that has played an important role in the diffusion of choice based approaches in that country. A fourth result is the decrease of the number of SP studies in the field of environmental economics15. Figure 6 shows the proportion of SP studies in three top journals: “Ecological Economics” (EE), “Environmental and Resource Economics” (ERE) and “Journal of Environmental Economics and Management” (JEEM). Whereas the proportion of published studies in JEEM and ERE is slightly decreasing, the proportion of studies published in EE has remained relatively stable. A possible explanation is that most of the SP articles published in ERE and JEEM are methodologically oriented, while articles in EE are more policy oriented. While it may be more and more difficult to innovate in the methodology, in particular due to the high number of past methodological articles, it might be less difficult to provide results
14 The course is available online at http://eml.berkeley.edu/~train/ec244.html. 15 A similar pattern is observed in the recent conferences of the European Association of Environmental and Resource Economists (EAERE). For instance, there were two CV sessions and five CE sessions in the 2012 edition conducted in Prague. In the 2013 edition taking place in Toulouse, only one session was organized in CV and two on CE.

21
which are of interest to policy makers, such as applications related to biodiversity or ecosystem services (see Jobstvogt et al. 2014 for a CE application on deep sea biodiversity).
Figure 6. Proportion of SP articles in “Ecological Economics” (EE), “Environmental and Resource Economics” (ERE) and “Journal of Environmental Economics and Management” (JEEM)
An open question is whether the popularity of CE will keep increasing in the future. A recent study may cast doubt on it. Luchini and Watson (2014) found in an induced value experiment that CE fails to elicit payoff maximizing choices. Another open question is whether a variant of CE called the Best-Worst Choice Experiment (BWCE) will become popular in the future. In this approach which was introduced by Louviere et al. (2004), people are faced with several goods/programs and are asked to indicate the good/program they prefer the most and the one they prefer the least. The same exercise is then performed with the remaining programs/goods. Interestingly, BWCE provides more information on preferences than CE, which can be helpful to reduce the sample size, increase the efficiency of the choice models or estimate individual level models (Louviere et al. 2008). However, it places a higher burden on the participants, which may be problematic when the good to be valued is complex. So far, the number of applications has remained relatively limited (Louviere et al. 2008, Scarpa et al. 2011, Lancsar et al. 2013, Giergiczny et al. 2014, Hess and Giergiczny 2014). However, the number of BWCE applications may rapidly increase in the near future, especially for goods/programs which are relatively easy to value, thanks to the comprehensive user guide recently provided by Lancsar et al. (2013).
0
5
10
15
20
25
% o
f pub
licat
ions
2004 2005 2006 2007 2008 2009 2010 2011 2012 2013
EE ERE JEEM

22
Acknowledgements The authors are grateful to Jordan Louviere, Pere Riera, Gildas Appéré, Muriel Travers and an anonymous referee for helpful comments.
23
Appendix A. Table A1. Detailed list of journals present in ISI economic journals in which expressions related to agriculture,
environment, health, transport, education, culture and sport appear in the journal title Name of journal Category of journal Agricultural Economics Agriculture American Journal of Agricultural Economics Agriculture Australian Journal of Agricultural and Resource Economics Agriculture Canadian Journal of Agricultural Economics Agriculture China Agricultural Economic Review Agriculture Computer Aided Systems in Public Transport Transport Ecological Economics Environment Ecological Economics Reviews Environment Economic Development and Cultural Change Culture Economics of Education Review Education Environmental and Resource Economics Environment European Journal of Health Economics Health European Review of Agricultural Economics Agriculture Food Policy Agriculture German Journal of Agricultural Economics Agriculture Health Economics Health International Environmental Agreements Politics Law and Economics Environment International Food and Agribusiness Management Review Agriculture International Journal of Health Care Finance Economics Health International Journal of Transport Economics Transport Journal of Agricultural and Resource Economics Agriculture Journal of Agricultural Economics Agriculture Journal of Cultural Economics Culture Journal of Economic Education Education Journal of Environmental Economics and Management Environment Journal of Health Economics Health Journal of Sports Economics Sport Journal of Transport Economics and Policy Transport Journal of Transport Geography Transport Pharmacoeconomics Health Review of Agricultural Economics Agriculture Review of Environmental Economics and Policy Environment Transportation Research Part E: Logistics and Transportation Reviews Transport Value in Health Health Note: The category “Other” is not reported for the ease of presentation. Indeeed, there are too many journals in this category (e.g., Applied Economics, Journal of Applied Economics, Economics Behavior and Organization, Economics Letters, Journal of Risk and Uncertainty, etc).

24
References
Adamowicz, W. 2004. What's it worth? An examination of historical trends and future directions in environmental valuation. Australian Journal of Agricultural and Resource Economics 48:419-443.
Adamowicz, W., P. Boxall, M. Williams, and J. Louviere. 1998. Stated preference approaches for measuring passive use values: Choice experiments and contingent valuation. American Journal of Agricultural Economics 80:64-75.
Adamowicz, W., D. Dupont, A. Krupnick, and J. Zhang. 2011. Valuation of cancer and microbial disease risk reductions in municipal drinking water: An analysis of risk context using multiple valuation methods. Journal of Environmental Economics and Management 61:213-226.
Alberini, A., M. Cropper, A. Krupnick, and N. Simon. 2004. Does the value of a statistical life vary with age and health status? Evidence from the US and Canada. Journal of Environmental Economics and Management 48:769-792.
Alberini, A. and J. Kahn. 2009. Handbook on contingent valuation. Edward Elgar Publishing, Cheltenham.
Alfnes, F. 2004. Stated preferences for imported and hormone-treated beef: Application of a mixed logit model. European Review of Agricultural Economics 31:19-37.
Amiran, E. and D. Hagen. 2010. The scope trials: Variation in sensitivity to scope and WTP with directionally bounded utility functions. Journal of Environmental Economics and Management 59:293-301.
Arrow, K. and R. Solow. 1993. Report of the NOAA panel on contingent valuation. National Oceanic and Atmospheric Administration Washington, DC.
Bateman, I., R. Carson, B. Day, M. Hanemann, N. Hanley, T. Hett, M. Jones-Lee, G. Loomes, S. Mourato, and E. Özdemiroglu. 2002. Economic valuation with stated preference techniques: A manual. Edward Elgar, Cheltenham.
Bateman, I., M. Cole, P. Cooper, S. Georgiou, D. Hadley, and G. Poe. 2004. On visible choice sets and scope sensitivity. Journal of Environmental Economics and Management 47:71-93.
Bateman, I., B. Day, S. Georgiou, and I. Lake. 2006. The aggregation of environmental benefit values: Welfare measures, distance decay and total WTP. Ecological Economics 60:450-460.
Bech, M. and D. Gyrd-Hansen. 2005. Effects coding in discrete choice experiments. Health Economics 14:1079-1083.
Bennett, R. and K. Balcombe. 2012. Farmers’ willingness to pay for a tuberculosis cattle vaccine. Journal of Agricultural Economics 63:408-424.
Bijlenga, D., G. Bonsel, and E. Birnie. 2011. Eliciting willingness to pay in obstetrics: Comparing a direct and an indirect valuation method for complex health outcomes. Health Economics 20:1392-1406.
Birol, E., K. Karousakis, and P. Koundouri. 2006. Using a choice experiment to account for preference heterogeneity in wetland attributes: The case of Cheimaditida wetland in Greece. Ecological Economics 60:145-156.
Blumenschein, K., G. Blomquist, M. Johannesson, N. Horn, and P. Freeman. 2008. Eliciting willingness to pay without bias: Evidence from a field experiment. The Economic Journal 118:114-137.
Botzen, W. and J. van den Bergh. 2012. Risk attitudes to low-probability climate change risks: WTP for flood insurance. Journal of Economic Behavior and Organization 82:151-166.
Bridges, J., A. Hauber, D. Marshall, A. Lloyd, L. Prosser, D. Regier, F. Johnson, and J. Mauskopf. 2011. Conjoint analysis applications in health—a checklist: A report of the ISPOR Good Research Practices for Conjoint Analysis Task Force. Value in Health 14:403-413.
Carlsson, F., P. Frykblom, and C. Lagerkvist. 2007. Consumer willingness to pay for farm animal welfare: mobile abattoirs versus transportation to slaughter. European Review of Agricultural Economics 34:321-344.
Carson, R. 2012. Contingent valuation: a comprehensive bibliography and history. Edward Elgar, Cheltenham.

25
Carson, R. and T. Groves. 2007. Incentive and informational properties of preference questions. Environmental and Resource Economics 37:181-210.
Carson, R. and J. Louviere. 2011. A common nomenclature for stated preference elicitation approaches. Environmental and Resource Economics 49:539-559.
Christie, M. and C. Azevedo. 2009. Testing the consistency between standard contingent valuation, repeated contingent valuation and choice experiments. Journal of Agricultural Economics 60:154-170.
Coast, J., H. Al-Janabi, E. Sutton, S. Horrocks, A. Vosper, D. Swancutt, and T. Flynn. 2012. Using qualitative methods for attribute development for discrete choice experiments: Issues and recommendations. Health Economics 21:730-741.
Costanza, R. and I. Kubiszewski. 2012. The authorship structure of “ecosystem services” as a transdisciplinary field of scholarship. Ecosystem Services 1:16-25.
Crastes, R. and P.-A. Mahieu. 2014. Contingent valuation versus choice experiment: A meta-analysis application exploring the determinants of the time for publication acceptance. Economics Bulletin 34:1575-1599.
Czajkowski, M. and N. Hanley. 2009. Using labels to investigate scope effects in stated preference methods. Environmental and Resource Economics 44:521-535.
De Bekker-Grob, E., M. Ryan, and K. Gerard. 2012. Discrete choice experiments in health economics: A review of the literature. Health Economics 21:145-172.
Ferrini, S. and R. Scarpa. 2007. Designs with a priori information for nonmarket valuation with choice experiments: A Monte Carlo study. Journal of Environmental Economics and Management 53:342-363.
Flynn, T., J. Louviere, T. Peters, and J. Coast. 2007. Best–worst scaling: what it can do for health care research and how to do it. Journal of Health Economics 26:171-189.
Giergiczny, M., S. Hess, T. Dekker, and P. Chintakayala. 2014. Testing the consistency (or lack thereof) between choices in best-worst surveys. Warsaw University.
Greene, W. and D. Hensher. 2013. Revealing additional dimensions of preference heterogeneity in a latent class mixed multinomial logit model. Applied Economics 45:1897-1902.
Hanley, N., S. Mourato, and R. Wright. 2001. Choice modelling approaches: A superior alternative for environmental Valuation? Journal of Economic Surveys 15:435-462.
Hausman, J. 2012. Contingent valuation: From dubious to hopeless. Journal of Economic Perspectives 26:43-56.
Hensher, D., J. Rose, and W. Greene. 2005. Applied choice analysis: A primer. Cambridge University Press, Cambridge.
Hess, S. and M. Giergiczny. 2014. Intra-respondent heterogeneity in a stated choice survey on wetland conservation in Belarus: First steps towards creating a link with uncertainty in contingent valuation. Environmental and Resource Economics:, DOI: 10.1007/s10640-10014-19769-10649.
Hoyos, D. 2010. The state of the art of environmental valuation with discrete choice experiments. Ecological Economics 69:1595-1603.
Hynes, S., D. Campbell, and P. Howley. 2011. A holistic vs. an attribute-based approach to agri-environmental policy valuation: Do welfare estimates differ? Journal of Agricultural Economics 62:305-329.
Jobstvogt, N., N. Hanley, S. Hynes, J. Kenter, and U. Witte. 2014. Twenty thousand sterling under the sea: Estimating the value of protecting deep-sea biodiversity. Ecological Economics 97:10-19.
Kahneman, D. and R. Sugden. 2005. Experienced utility as a standard of policy evaluation. Environmental and Resource Economics 32:161-181.
Krishna, V., A. Drucker, U. Pascual, P. Raghu, and E. King. 2013. Estimating compensation payments for on-farm conservation of agricultural biodiversity in developing countries. Ecological Economics 87:110-123.
Lancsar, E. and J. Louviere. 2008. Conducting discrete choice experiments to inform healthcare decision making. Pharmacoeconomics 26:661-677.

26
Lancsar, E., J. Louviere, C. Donaldson, G. Currie, and L. Burgess. 2013. Best worst discrete choice experiments in health: Methods and an application. Social Science and Medicine 76:74-82.
Laurans, Y., A. Rankovic, R. Billé, R. Pirard, and L. Mermet. 2013. Use of ecosystem services economic valuation for decision making: Questioning a literature blindspot. Journal of Environmental Management 119:208-219.
Lindhjem, H. 2007. 20 years of stated preference valuation of non-timber benefits from Fennoscandian forests: A meta-analysis. Journal of Forest Economics 12:251-277.
Lindhjem, H., S. Navrud, N. Braathen, and V. Biausque. 2011. Valuing mortality risk reductions from environmental, transport, and health policies: A global meta-analysis of stated preference studies. Risk Analysis 31:1381-1407.
Loureiro, M. and W. Umberger. 2007. A choice experiment model for beef: What US consumer responses tell us about relative preferences for food safety, country-of-origin labeling and traceability. Food policy 32:496-514.
Louviere, J., D. Hensher, and J. Swait. 2000. Stated choice methods: Analysis and applications. Cambridge University Press, Cambridge.
Louviere, J. and E. Lancsar. 2009. Choice experiments in health: The good, the bad, the ugly and toward a brighter future. Health Economics, Policy and Law 4:527-546.
Louviere, J., D. Street, L. Burgess, N. Wasi, T. Islam, and A. Marley. 2004. Modelling the choices of individual decision-makers by combining efficient experiment designs with extra preference information CenSoC, Sydney.
Louviere, J., D. Street, L. Burgess, N. Wasi, T. Islam, and A. Marley. 2008. Modeling the choices of individual decision-makers by combining efficient choice experiment designs with extra preference information. Journal of Choice Modelling 1:128-164.
Luchini, S. and V. Watson. 2014. Are choice experiments reliable? Evidence from the lab. Economics Letters 124:9-13.
Lusk, J. and F. Norwood. 2005. Effect of experimental design on choice-based conjoint valuation estimates. American Journal of Agricultural Economics 87:771-785.
Lusk, J. and T. Schroeder. 2004. Are choice experiments incentive compatible? A test with quality differentiated beef steaks. American Journal of Agricultural Economics 86:467-482.
Mahieu, P.-A., R. Crastes, B. Kristrom, and P. Riera. 2014. Non-market valuation in France. An overview of the research activity. Revue d'économie politique Forthcoming.
Meyerhoff, J. and U. Liebe. 2008. Do protest responses to a contingent valuation question and a choice experiment differ? Environmental and Resource Economics 39:433-446.
Meyerhoff, J., M. Mørkbak, and S. Olsen. 2014. A meta-study investigating the sources of protest behaviour in stated preference surveys. Environmental and Resource Economics 58:35-57.
Murphy, J., P. Allen, T. Stevens, and D. Weatherhead. 2005. A meta-analysis of hypothetical bias in stated preference valuation. Environmental and Resource Economics 30:313-325.
Nocella, G., L. Hubbard, and R. Scarpa. 2010. Farm animal welfare, consumer willingness to pay, and trust: Results of a cross-national survey. Applied Economic Perspectives and Policy 32:275-297.
Olsen, J. and R. Smith. 2001. Theory versus practice: A review of ‘willingness-to-pay’ in health and health care. Health Economics 10:39-52.
Poe, G., K. Giraud, and J. Loomis. 2005. Computational methods for measuring the difference of empirical distributions. American Journal of Agricultural Economics 87:353-365.
Richardson, L. and J. Loomis. 2009. The total economic value of threatened, endangered and rare species: An updated meta-analysis. Ecological Economics 68:1535-1548.
Ryan, M. and V. Watson. 2009. Comparing welfare estimates from payment card contingent valuation and discrete choice experiments. Health Economics 18:389-401.
Sach, T., R. Smith, and D. Whynes. 2007. A ‘league table’ of contingent valuation results for pharmaceutical interventions. Pharmacoeconomics 25:107-127.

27
Scarpa, R., T. Gilbride, D. Campbell, and D. Hensher. 2009. Modelling attribute non-attendance in choice experiments for rural landscape valuation. European Review of Agricultural Economics 36:151-174.
Scarpa, R., S. Notaro, J. Louviere, and R. Raffaelli. 2011. Exploring scale effects of best/worst rank ordered choice data to estimate benefits of tourism in alpine grazing commons. American Journal of Agricultural Economics 93:809-824.
Scarpa, R. and J. Rose. 2008. Design efficiency for non-market valuation with choice modelling: How to measure it, what to report and why. Australian Journal of Agricultural and Resource Economics 52:253-282.
Scarpa, R. and K. Willis. 2010. Willingness-to-pay for renewable energy: Primary and discretionary choice of British households' for micro-generation technologies. Energy Economics 32:129-136.
Smith, R. and T. Sach. 2009. Contingent valuation: (Still) on the road to nowhere? Health Economics 18:863-866.
Smith, V. K. 2000. JEEM and non-market valuation: 1974–1998. Journal of Environmental Economics and Management 39:351-374.
Swait, J. and W. Adamowicz. 2001. Choice environment, market complexity, and consumer behavior: A theoretical and empirical approach for incorporating decision complexity into models of consumer choice. Organizational Behavior and Human Decision Processes 86:141-167.
Whitehead, J. C. 2011. Contingent valuation versus choice experiment: 1989-2010. Blog posted on June 17, 2011.
Whitty, J., E. Lancsar, K. Rixon, X. Golenko, and J. Ratcliffe. 2014. A systematic review of stated preference studies reporting public preferences for healthcare priority setting. The Patient-Patient-Centered Outcomes Research:1-22.
Wiser, R. H. 2007. Using contingent valuation to explore willingness to pay for renewable energy: a comparison of collective and voluntary payment vehicles. Ecological Economics 62:419-432.