the 17th annual product management and marketing...
TRANSCRIPT

T h e 1 7 t h A n n u a l
pragmaticmarketing.com
It’s Pragmatic Marketing’s 17th annual industry survey where we check the pulse of today’s
product management and marketing professionals, tracking all their vitals, finding out what ails
them and looking at the overall health of their compensation. Over 3,500 individuals responded
to this year’s survey, allowing us to perform the most thorough checkup yet!
Product Management and Marketing Survey

2017 PRODUCT MANAGEMENT AND MARKETING SURVEY2
the vitals
2017 pragmatic marketing product management
and marketing survey
61% Male
Over 1000 unique
titles reported by
respondents
Only 17% had 5+ years in role
3% don’t just play
doctor on TV, they
have a PhD
22% of respondents managed 10+
products
Of the 35% who selected
department head
or executive, just
27% managed 7+ people
Product Manager/Product Marketing Manager
Name: A. Typical
Gender: Male
Age: 35-44
Occupation:
Experience in industry: 6+ years
Experience in role: 1-2 years
Education: Bachelor’s degree+
Technical skill level:
q Very technical q Somewhat technical q Not technical
Professional certificates held: 1-3
Importance of professional certificates to your career:
q Very Important q Somewhat important
q Somewhat unimportant q Very unimportant
Department role:
q Individual contributor q Department head q Executive
Number of products
managed or worked with: 3
2017 PRODUCT MANAGEMENT AND MARKETING SURVEY 3
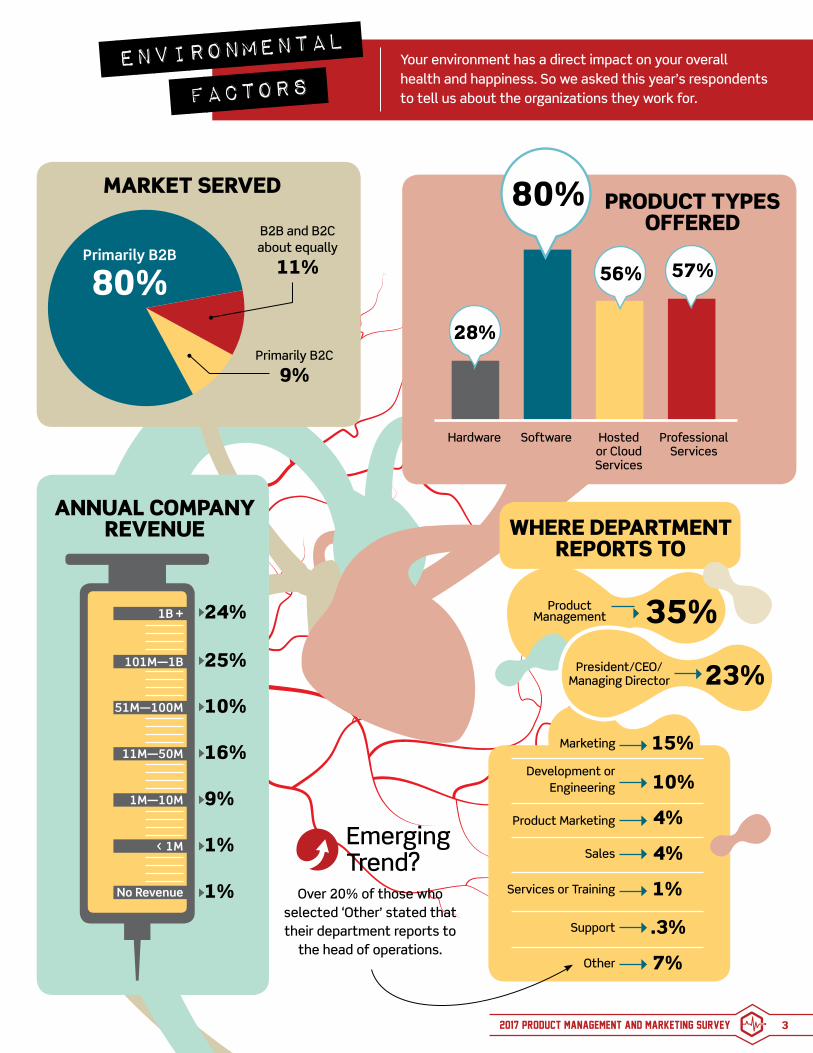
Over 20% of those who selected ‘Other’ stated that their department reports to
the head of operations.
B2B and B2C about equally
11%Primarily B2B
80%
Primarily B2C
9%
MARKET SERVED
Your environment has a direct impact on your overall health and happiness. So we asked this year’s respondents to tell us about the organizations they work for.
PRODUCT TYPESOFFERED
WHERE DEPARTMENT REPORTS TO
Hardware Software Hosted or Cloud Services
Professional Services
80%
28%
56% 57%
ANNUAL COMPANY REVENUE
24%1B +
25%101M—1B
10%51M—100M
16%11M—50M
9%1M—10M
1%< 1M
1%No Revenue
Product Management
President/CEO/Managing Director
Marketing
35%
23%
15%Development or
Engineering
Product Marketing
Sales
Services or Training
Support
Other
10%
4%
4%
1%
.3%
7%
ENVIRONMENTAL
FACTORS
Emerging Trend?

2017 PRODUCT MANAGEMENT AND MARKETING SURVEY4
Other Roles Held In CareerProduct Owner 35.40% 1208Technical/Development 32.06% 1094Sales 21.51% 734Marketing Communications 19.99% 682Trainer/Educator 19.52% 666Outside Consultant 16.09% 549Business Analyst 4.07% 139Project Manager 3.51% 120
<5 6-10 11-25 26-50 50+
27%
35%32%
22% 20% 20%16%
4% 4%
28% 23% 11% 11%
Some of our respondents knew these other roles quite intimately, having held them previously. Product
OwnerTechnical/
DevelopmentSales Marketing
CommunicationsTrainer/
EducatorOutside
ConsultantBusinessAnalyst
Project Manager
OTHER ROLES HELD IN CAREER
Engineers/Developers
Salespeople
Quality Assurance
Sales Engineers or Pre-Sales Consultants
Engineering Manager/Development Manager
Product-level Architects or Designers
Project Management
Business/Systems Analyst
Marketing Communications
UX Designers
Product Marketing
Product Owners
8.321.91.61.31.9.5.5.5.4
HOW DEPARTMENT SIZES COMPAREFor every one product manager at their company, respondents reported:
9.2
ENVIRONMENTAL
FACTORS
NUMBER OF PEOPLE IN THE DEPARTMENT
2017 PRODUCT MANAGEMENT AND MARKETING SURVEY 5
North America
Europe
Asia
Oceania
Middle East
Africa
Central America
South America
.1%
.2%
2.2%
1%
10% 2%
.1%
.4%
Number of respondents from each state
382
247
163
107
99
75
90
74
129
891627
40
76
7977
65 33
31
23
20
19
29
11
4
1
24
2
1
1
8
5
22
6
1
2
162
37
3
25
63
109
120
137
204
6
1
1
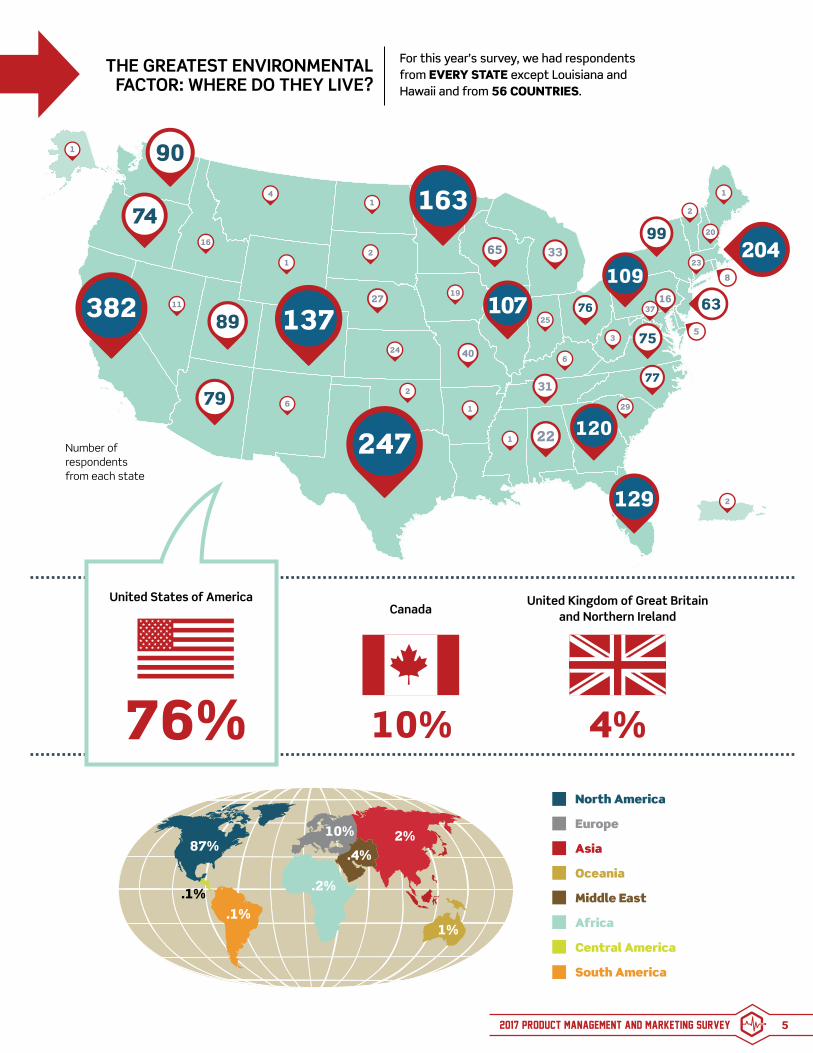
United States of America
4%
United Kingdom of Great Britain and Northern Ireland
10%
Canada
76%
THE GREATEST ENVIRONMENTAL FACTOR: WHERE DO THEY LIVE?
For this year’s survey, we had respondents from EVERY STATE except Louisiana and Hawaii and from 56 COUNTRIES.
2
87%

2017 PRODUCT MANAGEMENT AND MARKETING SURVEY6
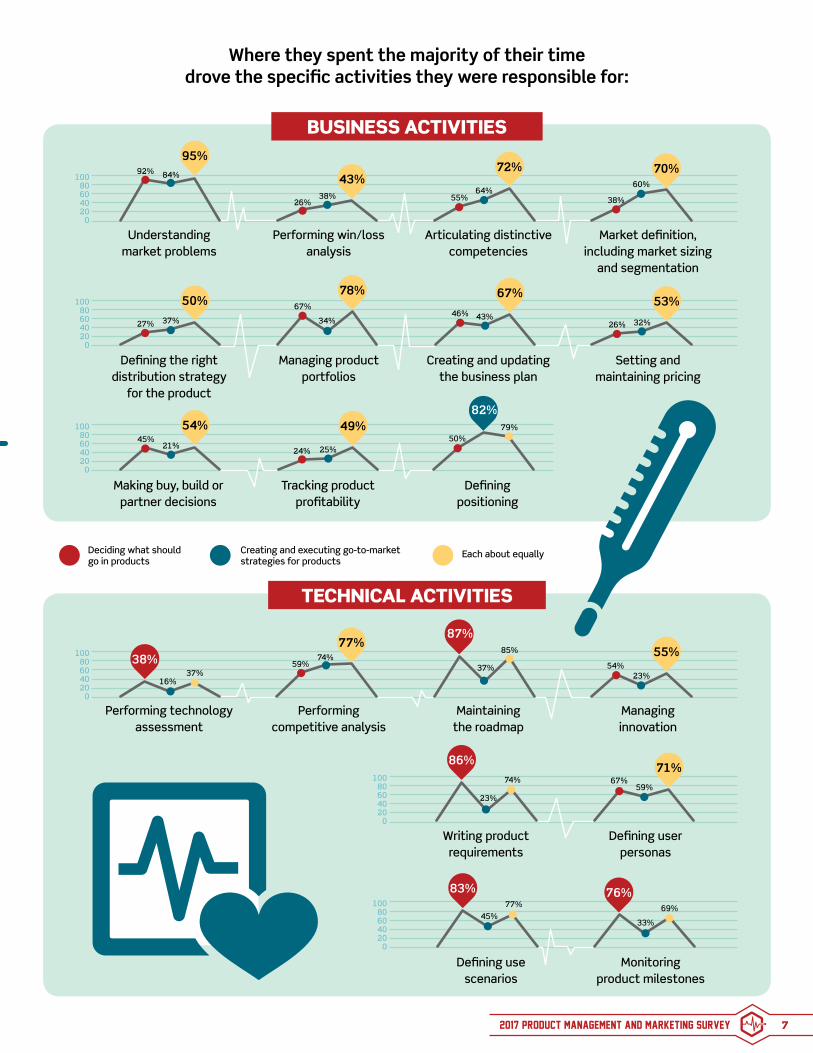
TIME SPENT ON ACTIVITIES
TACTICAL VS. STRATEGIC
AVERAGE NUMBER OF HOURS SPENT MONTHLY
48 HOURS =AVERAGE WORK WEEK
Talking to noncustomers
in non-sales situations
8 Reviewing or creating marketing materials
12
Supporting development team efforts
27
Attending meetings
40Managing
32
Assisting with specific sales deals
6Participating
in thought leadership
6
StrategicActivities
28%
TacticalActivities
72%
Talking to customers
8
WHERE THEY SPEND THE MAJORITY OF THEIR TIME
41 33Deciding what
should go in products
26Creating and executing go-to-market strategies
for products
Each about equally
We all know staying active is key to a healthy lifestyle. Let’s take a look at what kind of activities kept our respondents’ pulses racing. activitiy
levels
2017 PRODUCT MANAGEMENT AND MARKETING SURVEY 7
Where they spent the majority of their time drove the specific activities they were responsible for:
Understanding market problems
Performing technology assessment
Defining the right distribution strategy
for the product
Making buy, build or partner decisions
Performing win/loss analysis
Performing competitive analysis
Managing product portfolios
Tracking product profitability
Articulating distinctive competencies
Maintaining the roadmap
Creating and updating the business plan
Defining positioning
Market definition, including market sizing
and segmentation
Managing innovation
Setting and maintaining pricing
43%
95%
38%
50%
54%
78%
10080604020
0
84%
16%
38% 55%64%
38%
60%
92%
27%
45%21%
24% 25%50%
79%
37%
67%
34%46% 43%
26% 32%
37%
Writing product requirements
86%
23%
74%
26%
85%
23%
10080604020
0
10080604020
0
10080604020
0
10080604020
0
10080604020
0
Defining user personas
71%67%
59%
BUSINESS ACTIVITIES
72%
87%
74%59%
77%
70%
55%
67%
Defining use scenarios
77%45%
83%
Monitoring product milestones
69%
33%
76%
53%
49%82%
Deciding what should go in products
Creating and executing go-to-market strategies for products
Each about equally
37% 54%
TECHNICAL ACTIVITIES

10080604020
0
10080604020
0
10080604020
0
10080604020
0
10080604020
0
2017 PRODUCT MANAGEMENT AND MARKETING SURVEY8
Defining marketing plans
Providing sales channel training
Building customer retention plans
Going on sales calls
Thought leadership
Measuring the ROI of marketing programs
Creating customer-facing sales collateral
Launch planning
Staffing seminar and trade show events
Lead generation
Understanding the customer’s buying
process
Creating internal sales tools
Buyer personas
Answering sales questions by email or
phone
Building customer acquisition plans
Creating presentations and demos
Success stories
70%
35%64%
60%
69%
49%
86%
71%
78%
44%
84% 84%
80%
58%74%
66%
44%
61%
26%
63%
26%37%
43%
58%
68%
9%
71%
19%
49%
16%
44%
53%69%
5%19%
30%
39%58%
67%
35%
77%
50%
35%
72%
52%29%
48%
9%
36%
GO-TO-MARKET ACTIVITIES
SALES READINESS ACTIVITIES
51%70%
Deciding what should go in products
Creating and executing go-to-market strategies for products
Each about equally
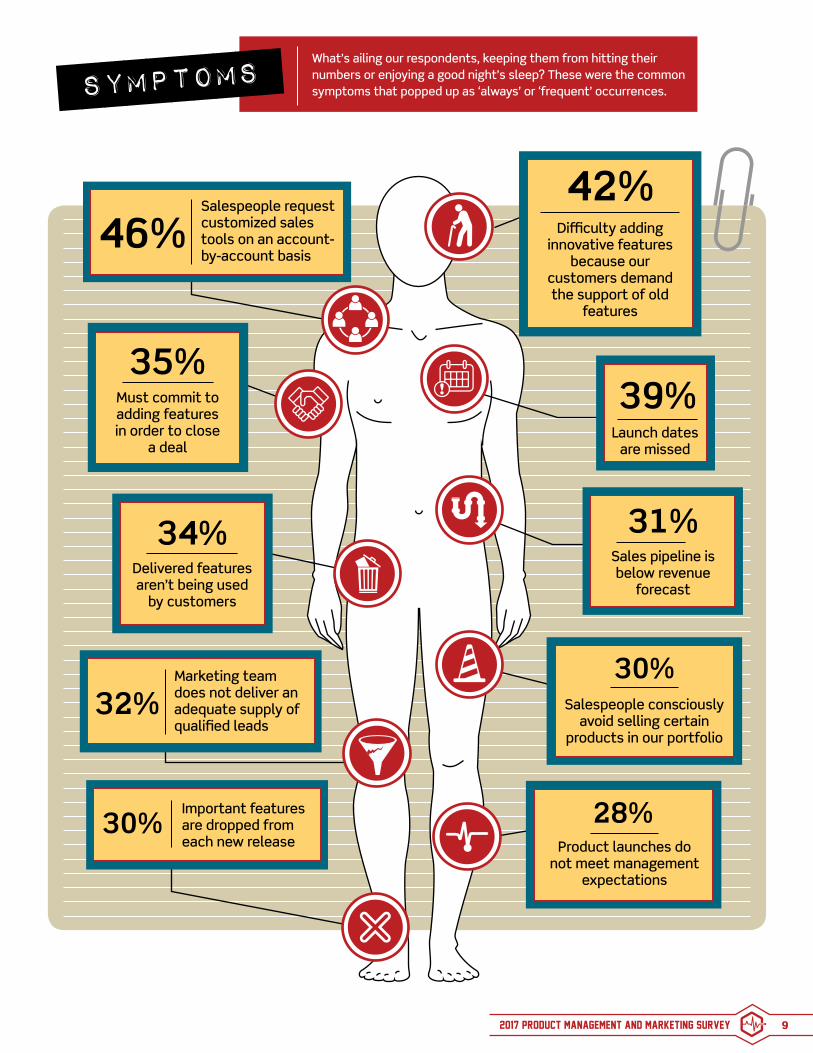
activitiy symptoms levels
2017 PRODUCT MANAGEMENT AND MARKETING SURVEY 9
What’s ailing our respondents, keeping them from hitting their numbers or enjoying a good night’s sleep? These were the common symptoms that popped up as ‘always’ or ‘frequent’ occurrences.
Must commit to adding features in order to close
a deal
35%
34%Delivered features aren’t being used
by customers
Marketing team does not deliver an adequate supply of qualified leads
32%
Important features are dropped from each new release
30%
39%
31%
Launch dates are missed
Sales pipeline is below revenue
forecast
Salespeople consciously avoid selling certain
products in our portfolio
30%
28%Product launches do
not meet management expectations
Salespeople request customized sales tools on an account-by-account basis
46% Difficulty adding innovative features
because our customers demand the support of old
features
42%
symptoms
2017 PRODUCT MANAGEMENT AND MARKETING SURVEY10
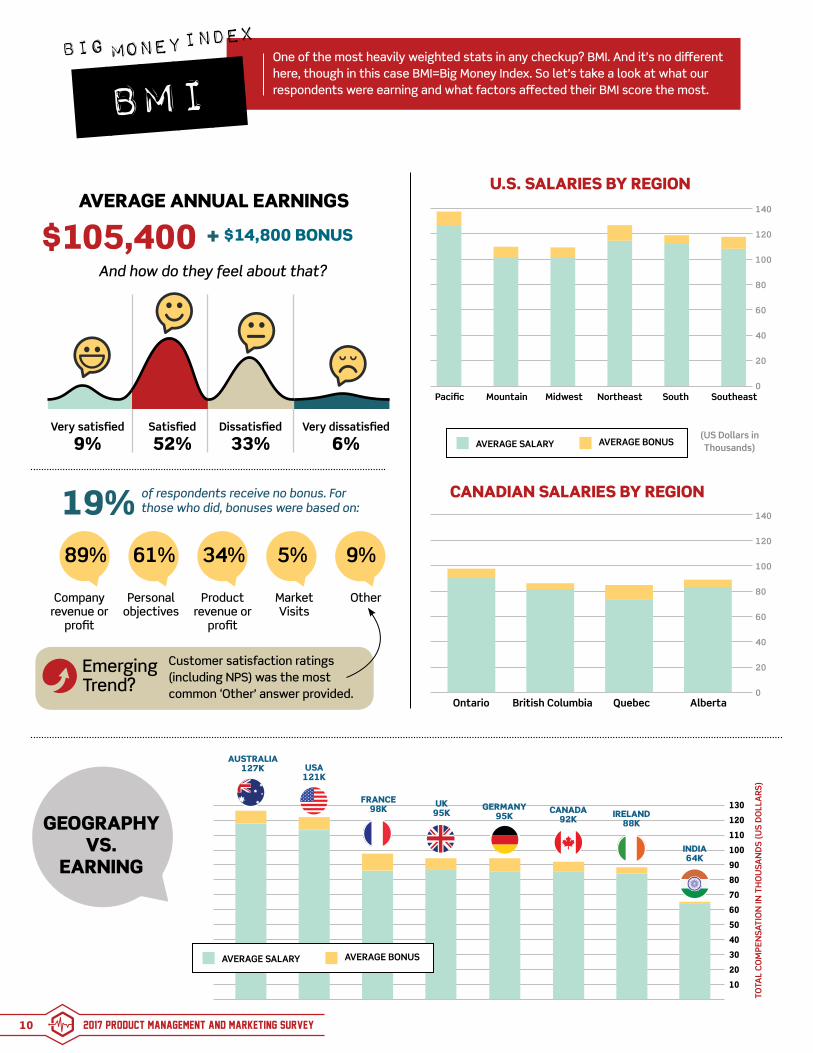
One of the most heavily weighted stats in any checkup? BMI. And it’s no different here, though in this case BMI=Big Money Index. So let’s take a look at what our respondents were earning and what factors affected their BMI score the most.
AVERAGE ANNUAL EARNINGS
CANADIAN SALARIES BY REGION
Ontario British Columbia Quebec Alberta
140
120
100
80
60
40
20
0
U.S. SALARIES BY REGION
(US Dollars in Thousands)
Pacific Mountain Midwest Northeast South Southeast
140
120
100
80
60
40
20
0
GEOGRAPHY VS.
EARNINGINDIA64K
130
120
110
100
90
80
70
60
50
40
30
20
10
TOTA
L C
OM
PEN
SAT
ION
IN T
HO
USA
ND
S (U
S D
OLL
ARS
)
IRELAND88K
AUSTRALIA127K USA
121K
CANADA92K
GERMANY95K
FRANCE98K
AVERAGE SALARY AVERAGE BONUS
UK95K
$105,400
Customer satisfaction ratings (including NPS) was the most common ‘Other’ answer provided.
Emerging Trend?
19%
AVERAGE SALARY AVERAGE BONUS
And how do they feel about that?
Very satisfied
9%Satisfied
52%Dissatisfied
33%Very dissatisfied
6%
$14,800 BONUS
of respondents receive no bonus. For those who did, bonuses were based on:
Company revenue or
profit
Personal objectives
Product revenue or
profit
Market Visits
Other
89% 61% 34% 5% 9%
BMI
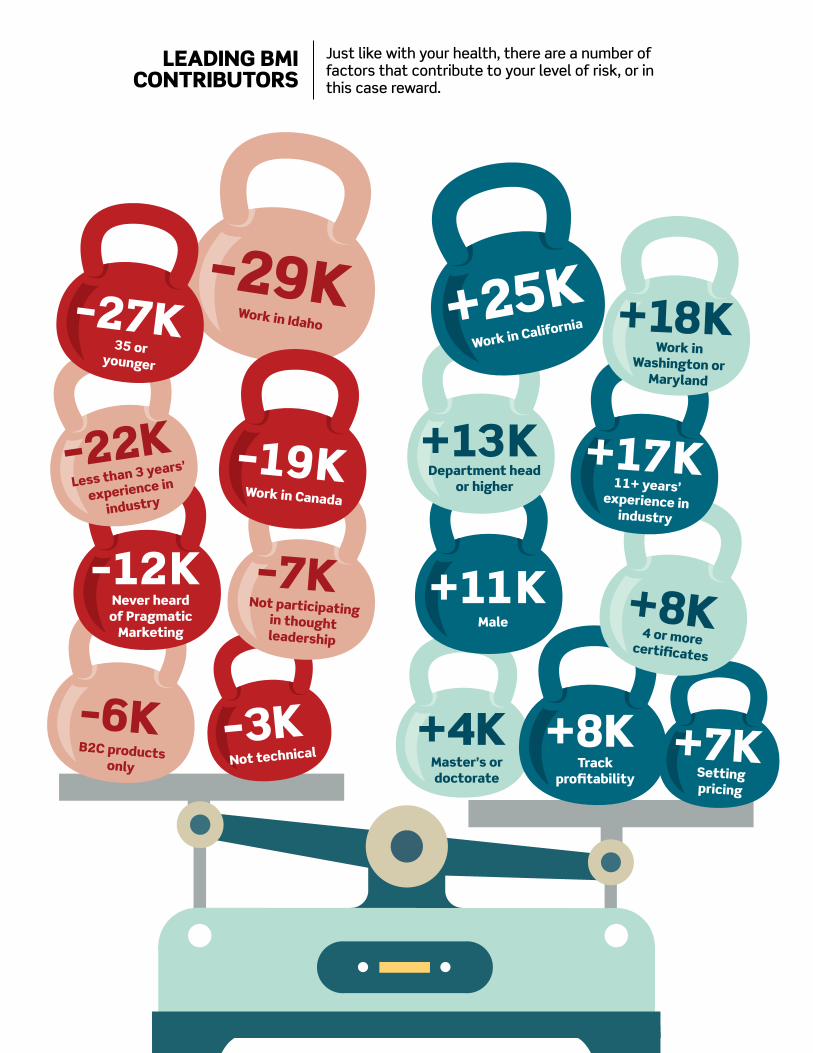
–3K Not technical
+4KMaster’s or doctorate
+7KSetting pricing
LEADING BMICONTRIBUTORS
Just like with your health, there are a number of factors that contribute to your level of risk, or in this case reward.
–6KB2C products
only
–7KNot participating
in thought leadership
+8KTrack
profitability
+13KDepartment head
or higher
–12KNever heard of Pragmatic
Marketing+8K
4 or more certificates
+17K11+ years’
experience in industry
+25KWork in California +18K
Work in Washington or
Maryland
–22KLess than 3 years’
experience in
industry
–29KWork in Idaho–27K
35 or younger
–19KWork in Canada
+11KMale
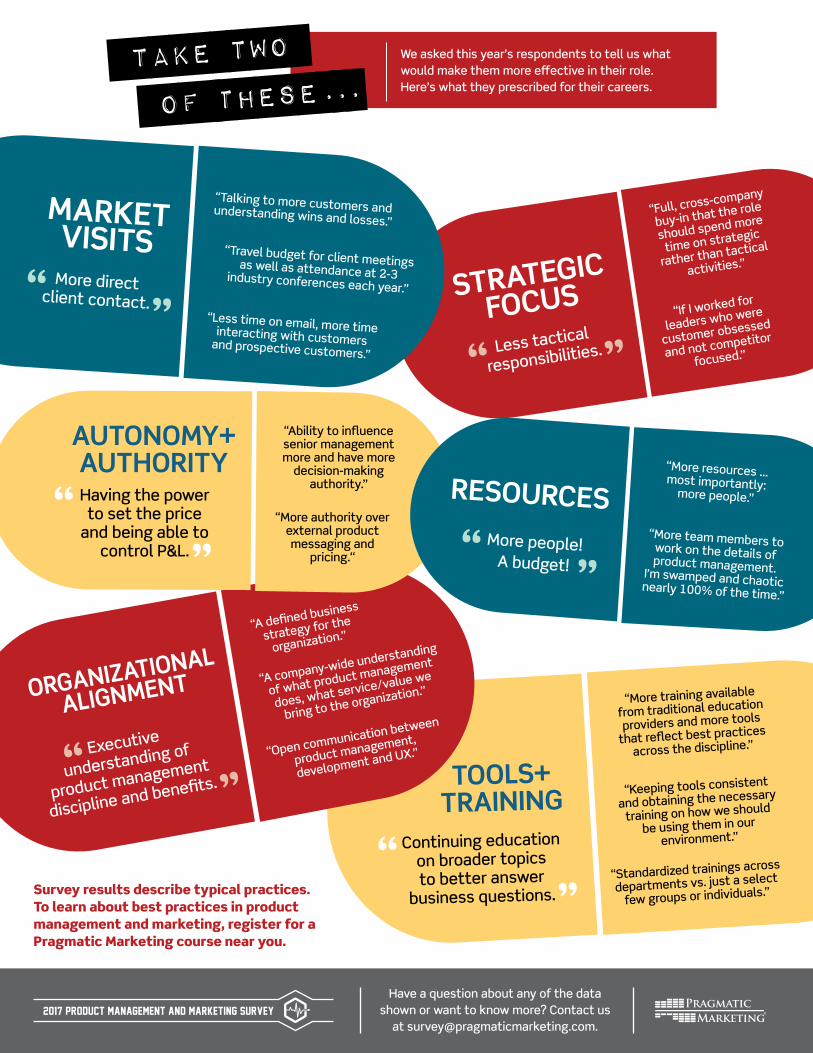
TOOLS+TRAINING “Keeping tools consistent
and obtaining the necessary
training on how we should
be using them in our
environment.”Continuing education on broader topics to better answer
business questions.“Standardized trainings across
departments vs. just a select
few groups or individuals.”
“More training available
from traditional education
providers and more tools
that reflect best practices
across the discipline.”
ORGANIZATIONAL
ALIGNMENT “A company-wide understanding
of what product management
does, what service/value we
bring to the organization.”
“A defined business
strategy for the
organization.”
“Open communication between
product management,
development and UX.”Executive
understanding of
product management
discipline and benefits.
STRATEGIC
FOCUS
Less tactical
responsibilities.
“If I worked for
leaders who were
customer obsessed
and not competitor
focused.”
“Full, cross-company
buy-in that the role
should spend more
time on strategic
rather than tactical
activities.”
Survey results describe typical practices. To learn about best practices in product management and marketing, register for a Pragmatic Marketing course near you.
Have a question about any of the data shown or want to know more? Contact us
at [email protected] PRODUCT MANAGEMENT AND MARKETING SURVEY
MARKET VISITS “Travel budget for client meetings as well as attendance at 2-3 industry conferences each year.”
“Talking to more customers and understanding wins and losses.”
“Less time on email, more time interacting with customers and prospective customers.”
More direct client contact.
AUTONOMY+ AUTHORITYHaving the power to set the price
and being able to control P&L.
“More authority over external product messaging and
pricing.“
“Ability to influence senior management more and have more
decision-making authority.” RESOURCES
“More team members to work on the details of product management. I’m swamped and chaotic nearly 100% of the time.”
“More resources ... most importantly: more people.”
More people! A budget!
We asked this year’s respondents to tell us what would make them more effective in their role. Here’s what they prescribed for their careers.
take two
of these...