the 1998 u.s. tropical tuna purse seine fishery in the
TRANSCRIPT
THE 1998 U.S. TROPICAL TUNA PURSE SEINE FISHERY IN THE CENTRAL-WESTERN PACIFIC OCEAN1
Atilio L. Coan Jr., Gary T. Sakagawa and Douglas Prescott Southwest Fisheries Science Center
National Marine Fisheries Service, NOAA La Jolla, California USA
Peter Williams
Oceanic Fisheries Program Secretariat of the Pacific Community
Noumea, New Caledonia
Gordon Yamasaki Southwest Region
National Marine Fisheries Service, NOAA Pago Pago, American Samoa
June 1999
Revised
1 Working document for the 12th Standing Committee on Tuna and Billfish, Papeete, Tahiti, June 16-23, 1999. (Document originally prepared for the annual meeting of parties to the South Pacific Regional Tuna Treaty, 24-30 March 1999, Koror, Republic of Palau.)
1
THE 1998 U.S. TROPICAL TUNA PURSE SEINE FISHERY IN THE CENTRAL-WESTERN PACIFIC OCEAN
Atilio L. Coan Jr., Gary T. Sakagawa and Douglas Prescott
Southwest Fisheries Science Center National Marine Fisheries Service, NOAA
La Jolla, California USA
Peter Williams Oceanic Fisheries Program
Secretariat of the Pacific Community Noumea, New Caledonia
Gordon Yamasaki Southwest Region
National Marine Fisheries Service, NOAA Pago Pago, American Samoa, USA
BACKGROUND
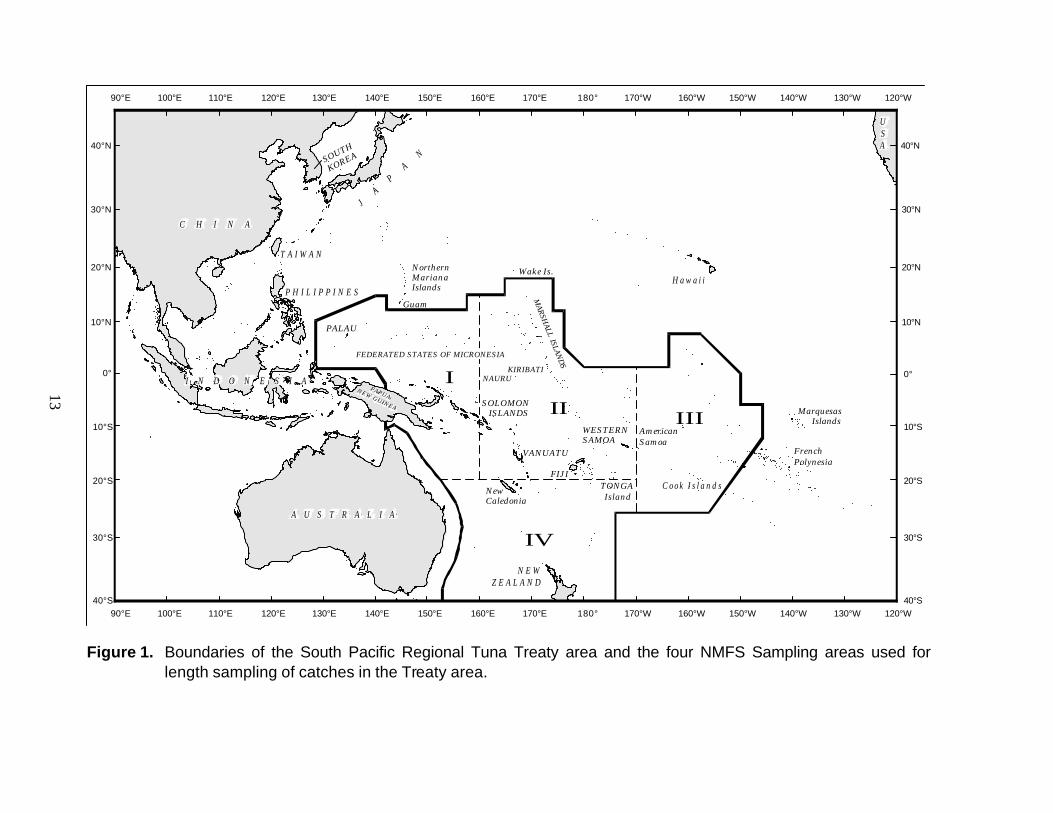
Purse seine fishing in the central-western Pacific by U.S. registered vessels began in the mid-1970s and quickly developed into a profitable year-around operation for yellowfin tuna (Thunnus albacares), skipjack tuna (Katsuwonus pelamis) and bigeye tuna (T. obesus). The most productive fishing areas were within the 200-mile exclusive economic zones (EEZs) of the Pacific island nations and required permission from the nations. In June 1988, the U.S. and 16 Pacific Island countries negotiated a South Pacific Regional Tuna Treaty (SPTT) that gave U.S. fishermen access to tuna fishing areas in the EEZs and adjoining waters, which amounted to a 26 million km2 area of the central-western Pacific (Figure 1). In exchange for access, the Pacific Island nations receive licensing and other fees and a commitment to record and report fishery information from the United States government and U.S. fishermen.
The National Marine Fisheries Service (NMFS) is responsible for administering the requirements of the SPTT for the U.S. and the Forum Fisheries Agency (FFA), for the Pacific island countries. NMFS cooperates with the FFA in executing data collection requirements. Licensed vessels are required to maintain and submit logbooks (Regional Purse Seine Logbooks), and landings data (Unloading Logs). Other information about the landed catch are also required. The NMFS operates a port sampling program to gather that information, particularly on sizes of fish landed and to verify species composition of the landings. All required data are collected computerized and submitted bimonthly by the NMFS, to the FFA. Summarized data are also made available to authorized scientists for conducting research on the fisheries and tuna stocks of the region.
Besides monitoring the fishery, the FFA administers an observer program. Trained technicians are assigned to vessels. A minimum of 20% of the fishing trips are targeted for sampling per year. The observers collect a suite of information used to monitor vessel compliance and to augment information from logbooks and other sources. Observer records
2
include information on sizes of fish caught in single sets and by-catch and discards of undersized tunas.
This report summarizes statistics and reviews data on the 1998 U. S. purse seine fishery in the central-western Pacific. At the time of this report, complete landing statistics and observer data were not available for the entire fishing season (e.g., 73% of the logbook data were available and about 50–60% of the observer data). Available logbook data were extrapolated, except for by-catch, to provide preliminary estimates for the entire season. Observer data were not extrapolated. Procedures used to summarize the data are similar to those used in previous reports (Coan et al 1997).
COLLECTION OF FISHERY DATA
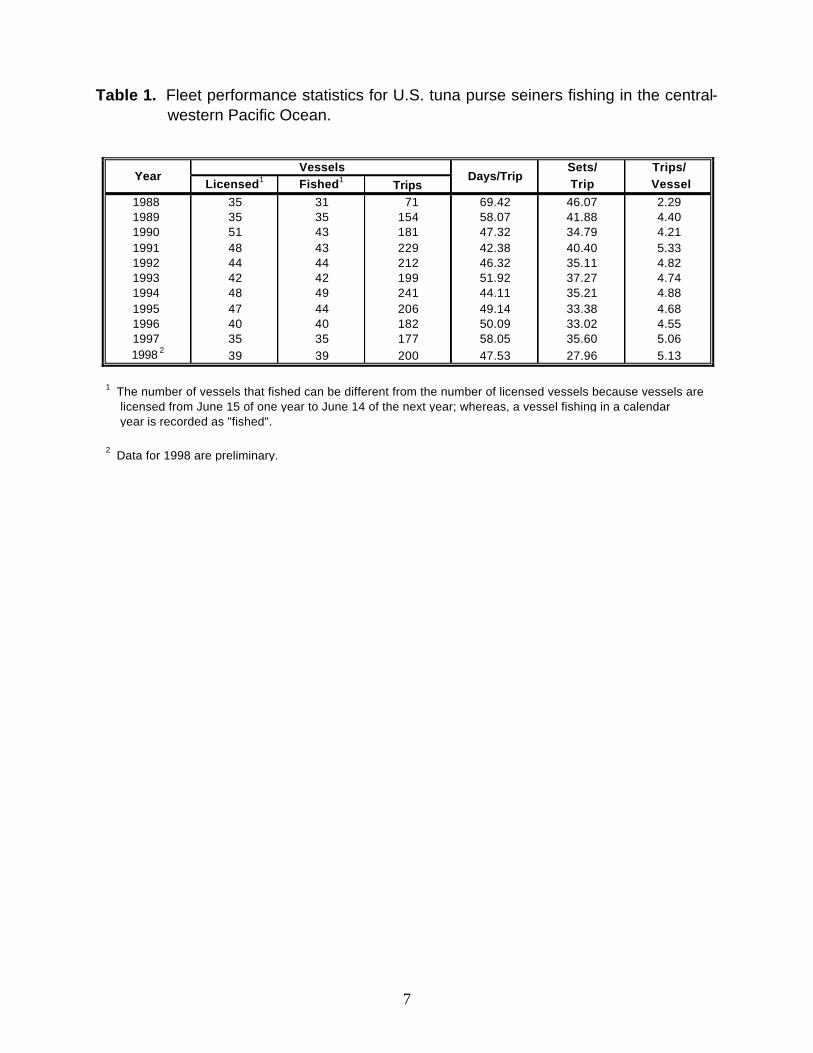
In 1998, 39 U.S. purse seiners fished in the central-western Pacific and completed 200 fishing trips (Table 1). This was four more vessels participating in the fishery than in 1997. The number of trips per vessel was approximately 5, similar to the 1997 average. The average number of days per trip was 47.5 and sets per trip, 28.0, a decrease of 18% and 21% respectively from 1997 levels.
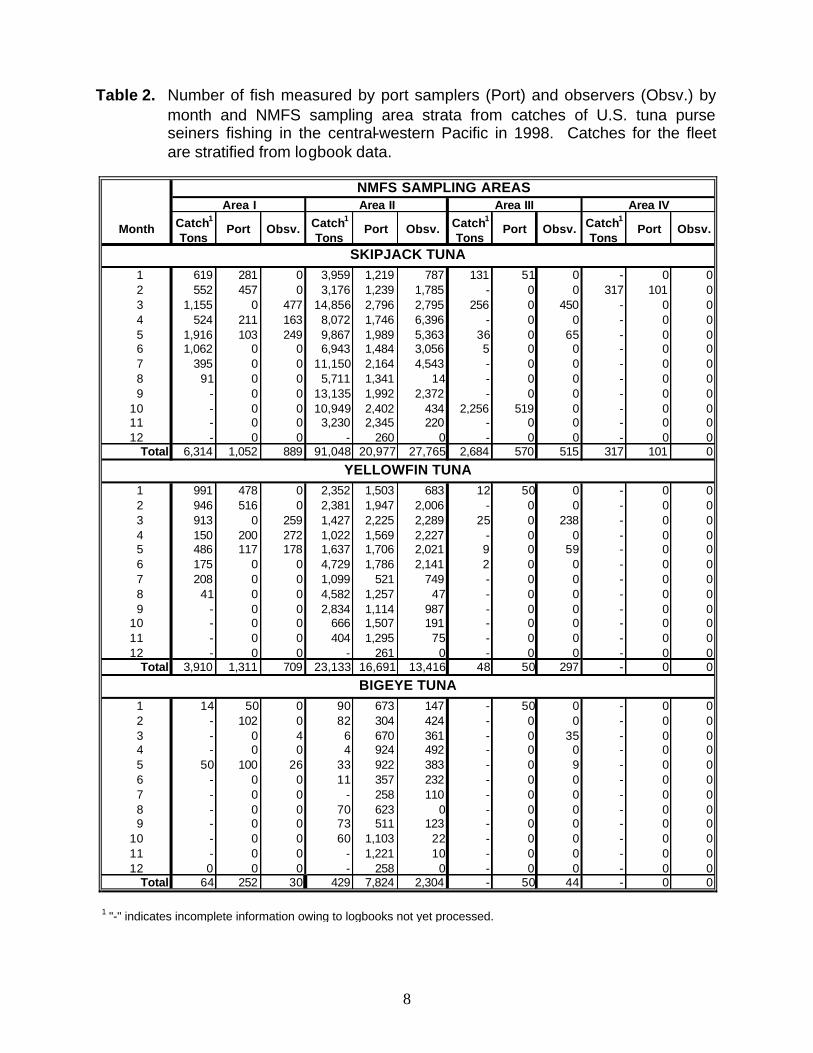
Biological sampling for size and species composition was conducted in Pago Pago, American Samoa, where approximately 89% of the 1998 catch was landed. The remainder, 11% of the catch, was landed in other locations. A stratified area-time scheme (Coan et al. 1988) was followed in sampling the 1998 landings. Strata used were NMFS sample areas and month (Figure 1). Sampling was from vessel wells at the time of unloading and with a minimum of 50-fish per sample. NMFS scientific technicians measured approximately 18,000 yellowfin tuna, 22,700 skipjack tuna and 8,100 bigeye tuna for fork length (FL) (Table 2). The number of fish sampled was 9% less than in 1997. The maximum number of fish measured in an area-time stratum was 2,796 skipjack tuna in NMFS sampling Area II in March and the minimum was 50 yellowfin tuna in Area III in December (Table 2).
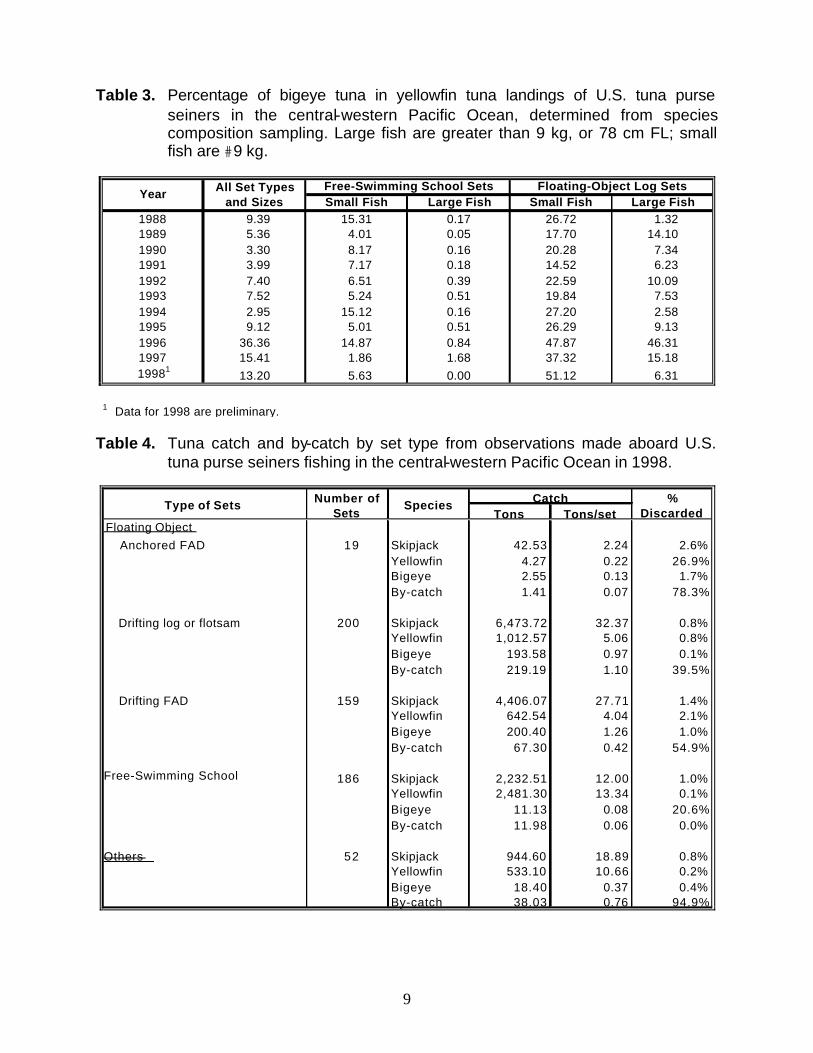
Species composition samples of 100-fish each were also collected. A total of 20,000 fish were examined for species identification. Samples were taken whenever a mixture of species was encountered while drawing fish for fork length measurements. Sampling was stratified by type of set and size of fish. In 1998, 13% of the landings labeled as yellowfin tuna were bigeye tuna (Table 3). The highest percentages of bigeye tuna were encountered in log sets of small fish. These results are similar to those for 1997 landings.
FFA observer program data were available for 35 trips made in 1998, with a total of 872 days fished. Among their duties, observers drew approximately five tuna at random from each brail of catch and measured the fish for fork length. A total of 45,969 fish were measured: 29,169 skipjack tuna, 14,422 yellowfin tuna and 2,378 bigeye tuna (Table 2). The maximum number of fish measured was 6,396 skipjack tuna in NMFS sampling Area II in April, and the minimum was 4 bigeye tuna in NMFS Area I in March (Table 2).
The FFA observers also recorded detailed information on by-catch and discards of
undersized tunas. Data were available for observations on 616 sets: 186 free-swimming school sets, 378 floating-object sets and 52 other sets (Table 4).
3
FISHING AREA AND EFFORT
In 1998, the U.S purse seine fleet spent approximately 6,400 days fishing, mainly
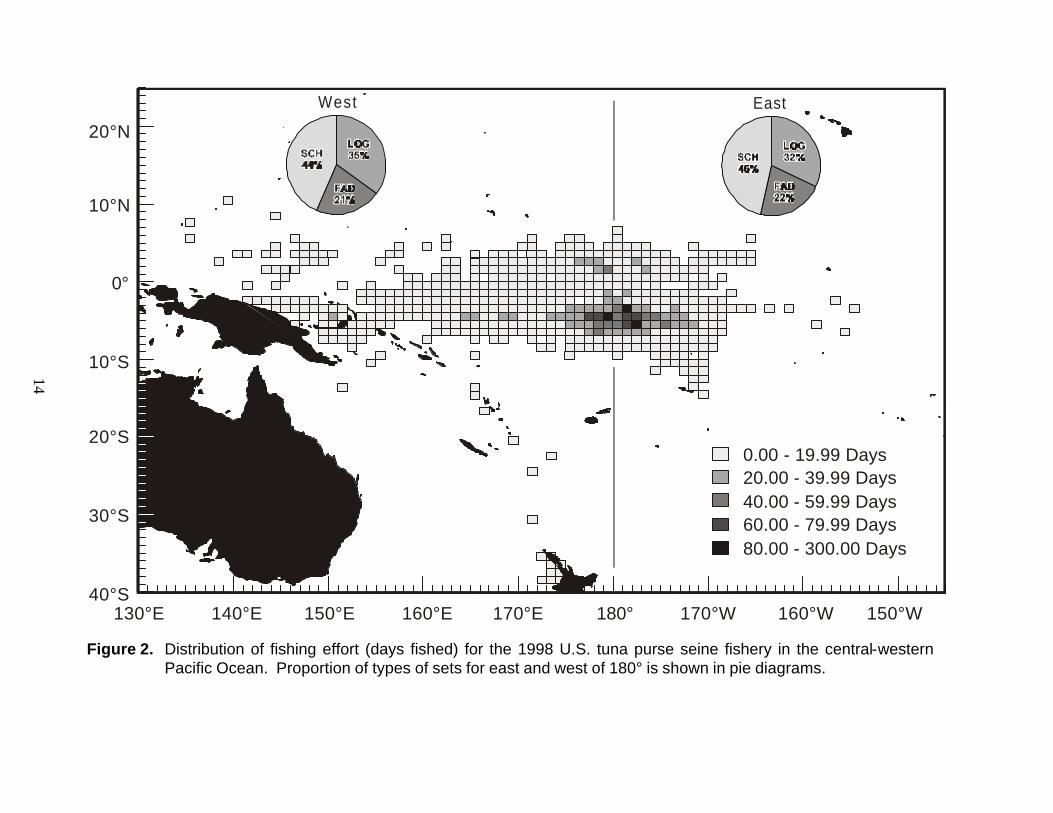
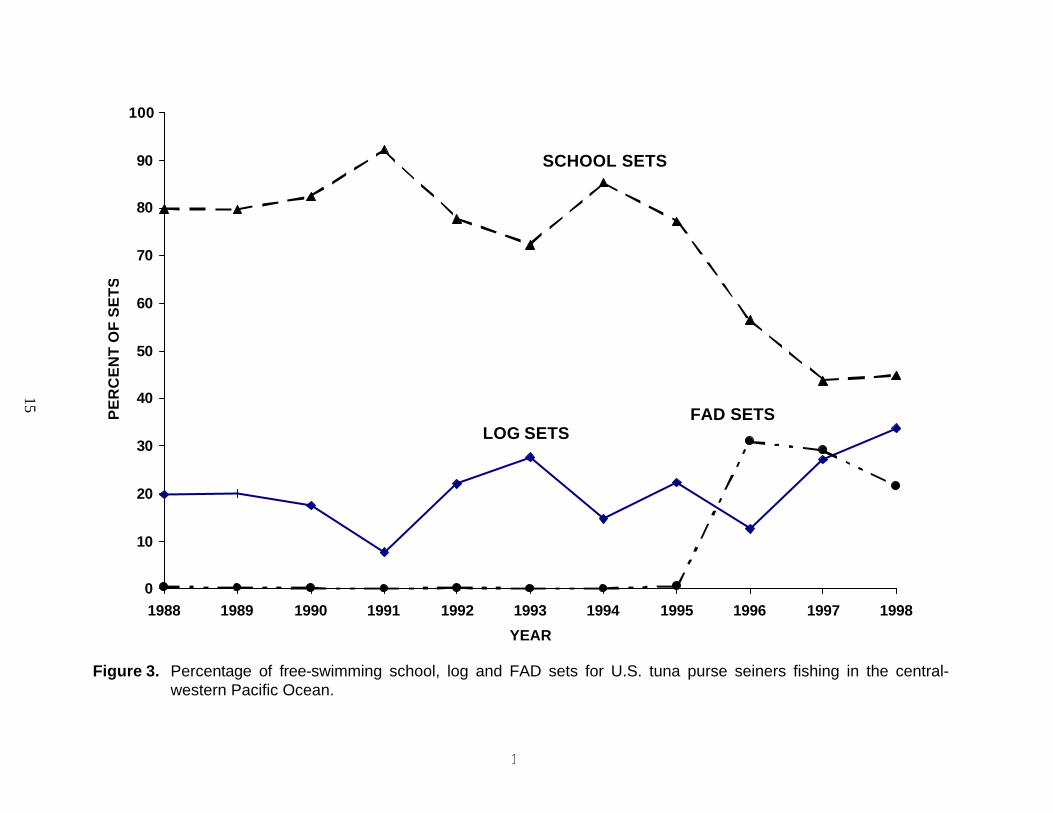
between 165°W and 155°E longitude and between 10°N and 10°S latitude (Figure 2). Approximately 58% of the effort was east of 180° longitude, mainly concentrated in the Tuvalu-Gilbert Islands, Kiribati area. Approximately 5,600 sets were made, 55% on floating objects (logs and FADs) and the remainder on free-swimming schools (Figure 3). This was the second consecutive year that floating-object sets exceeded free-swimming school sets. Approximately 39% of the sets on floating objects were on Fish Aggregation Devices (FADs) and 61% on naturally occurring logs or flotsam.
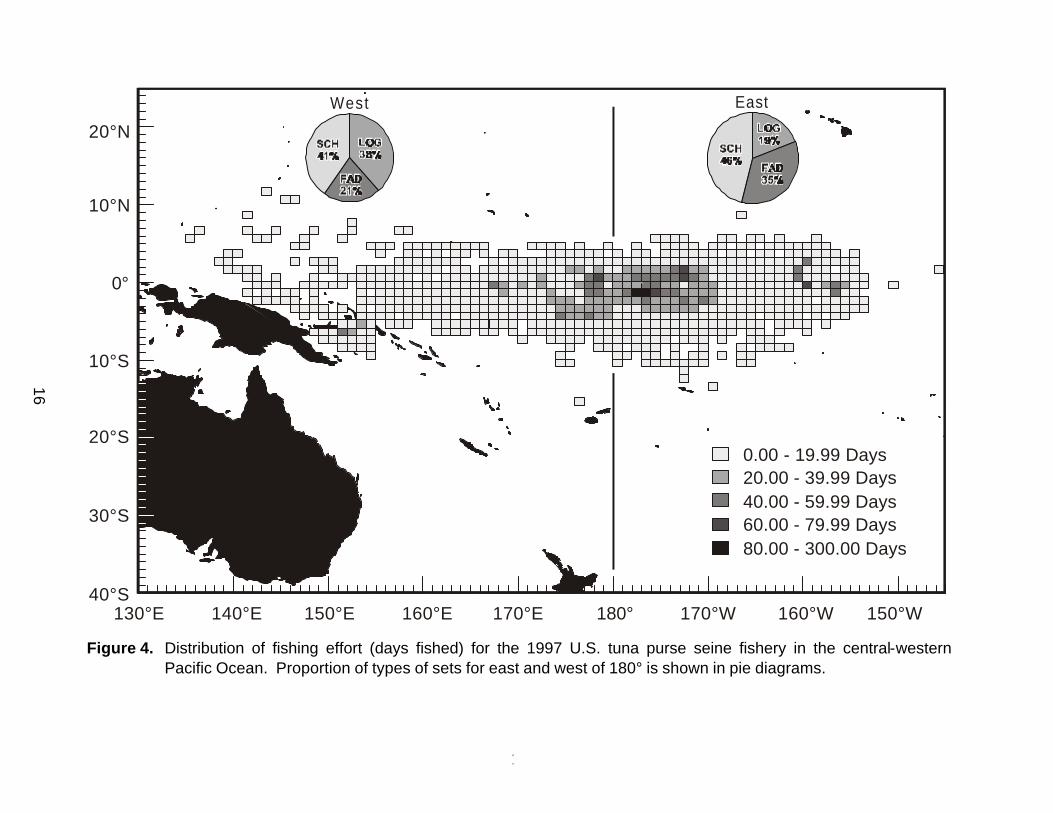
In comparison to 1997 operations (Figure 4), the 1998 operations were similar, except for a shift in the center of the fishery westward and with significantly less fishing in the area between 150°W and 170°W. Total number of sets in 1997 was 6,300, which was 12% more than in 1998. The ratio of drifting-object sets to total sets, however, was about the same: 56% in 1997 and 55% in 1998.
CATCHES AND COMPOSITION
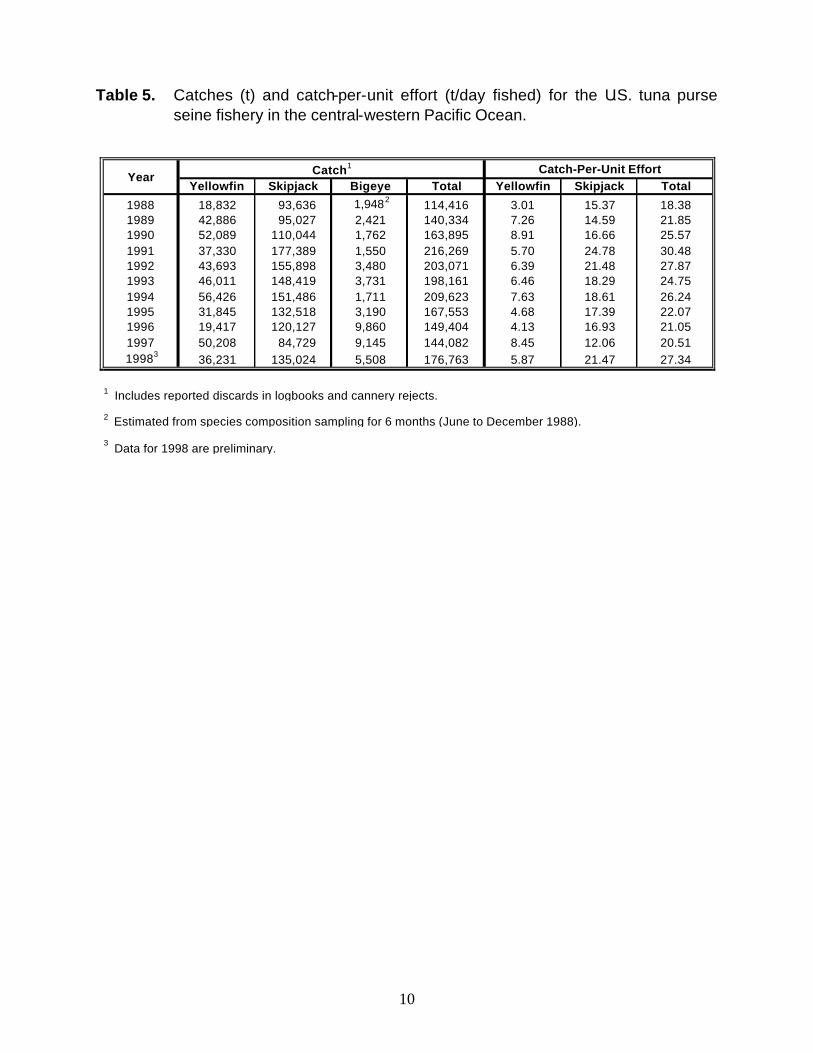
The U.S. fleet caught approximately 176,800 t of yellowfin, skipjack and bigeye tunas in 1998 (Table 5). Skipjack tuna was the dominant species and accounted for 76% of the catch. Yellowfin and bigeye tunas represented 21% and 3% of the catch respectively. The 1998 catch increased 23% over the 1997 catch, and was the highest recorded since 1994. From 1994 to 1997, catches were on a steady decline. This increase in 1998 catch is attributed mainly to an increase in skipjack tuna catch, 59%. Yellowfin tuna and bigeye tuna catches decreased 28% and 40% respectively.
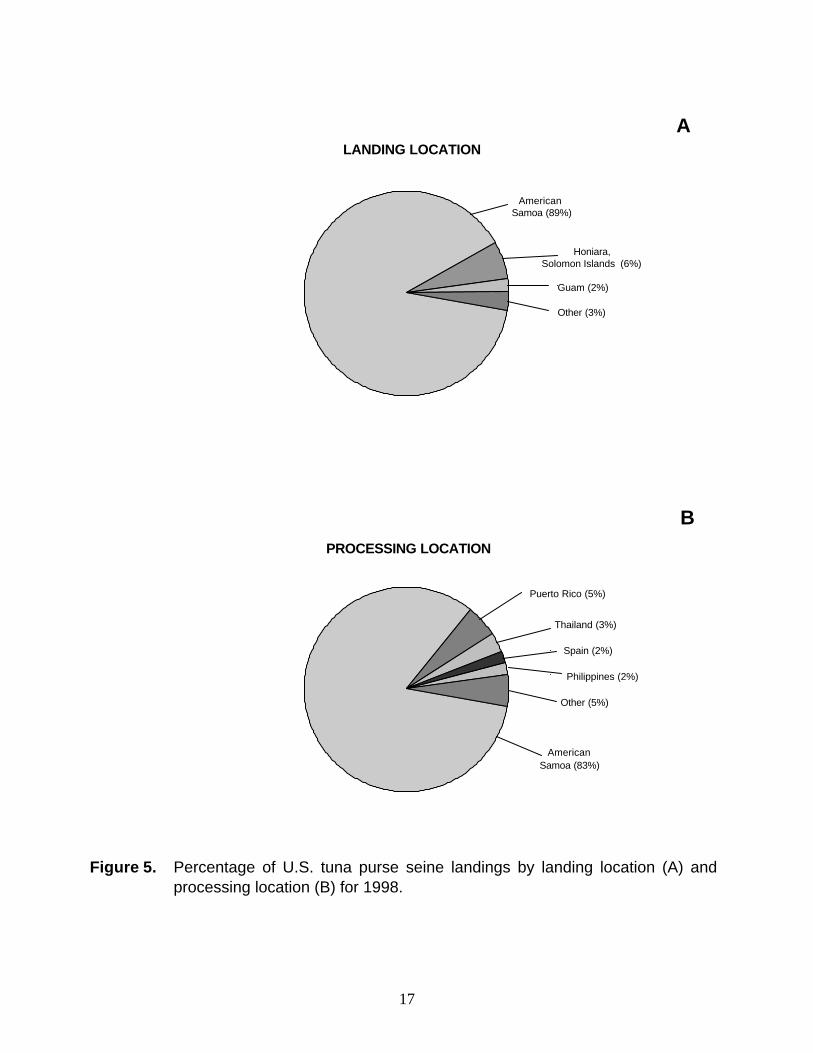
A significant portion (89%) of the catch was landed directly to canneries in American Samoa (Figure 5a). Second highest portion was landed in the Solomon Islands (6%) and transshipped to Europe and other ports in the region. Approximately 83% of the landings were utilized by canneries in American Samoa (Figure 5b) and the remainder (17%), by canneries in the Philippines, Puerto Rico (U.S.), Spain, and Thailand. By-catch and Discards
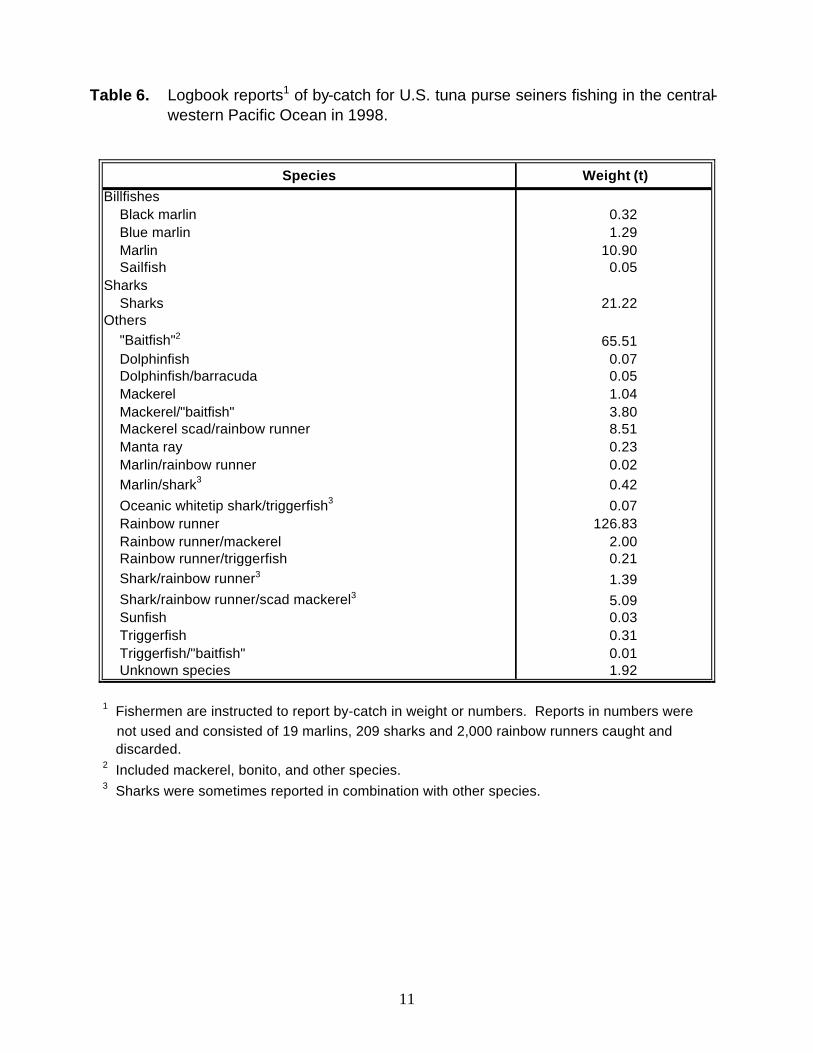
Vessel captains are required to record by-catch and discards in the Regional Purse Seine Logbook on a set-by-set basis. Seventy-two percent of 1998 trips reported by-catch in weight2 and 52% reported discards of tunas at sea. Approximately 250 t of by-catch were reported (Table 6). Most of the by-catch, along with about 840 t of tuna were discarded at sea. Skipjack tuna (745 t) was the dominant species in the tuna discards and rainbow runner (Elagatis bipinnulata), baitfish, sharks and marlin were dominant species in the discarded by-catch. The most frequent reason reported for discards of tunas was fish were too small for profitable delivery to the canneries.
2 Fishermen are instructed to report all catches in weight or numbers; however, few reported by-catches in numbers and those reports were not used.
4
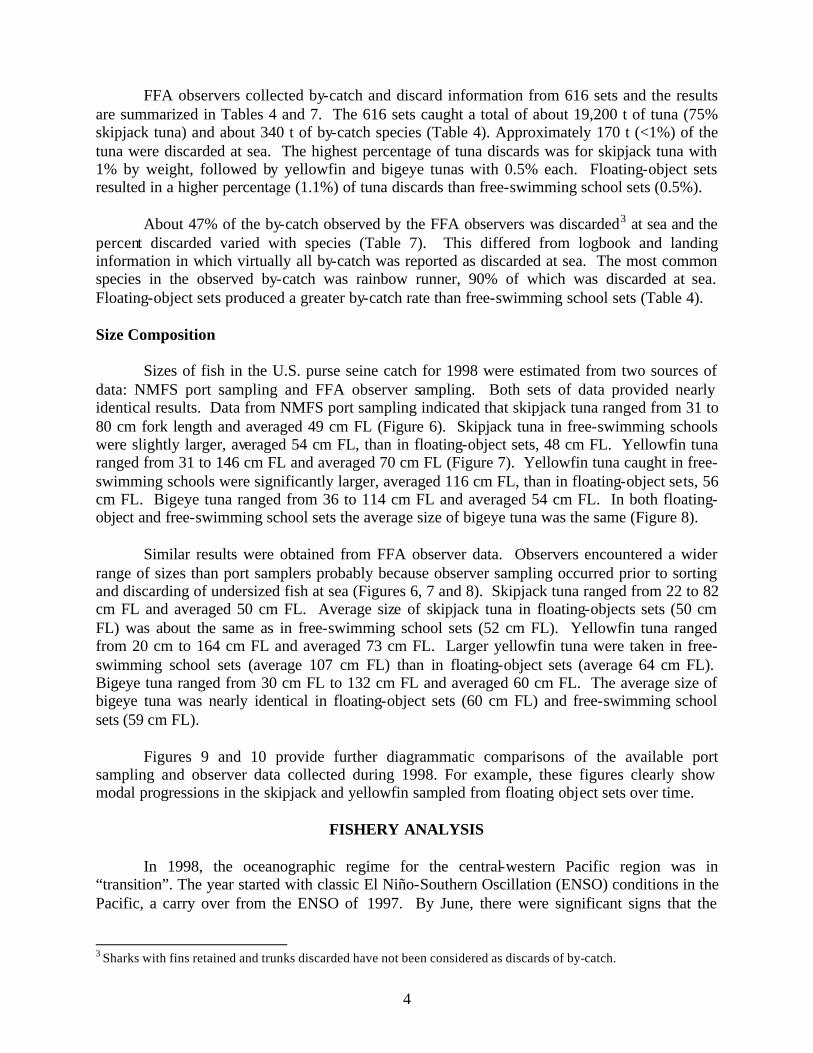
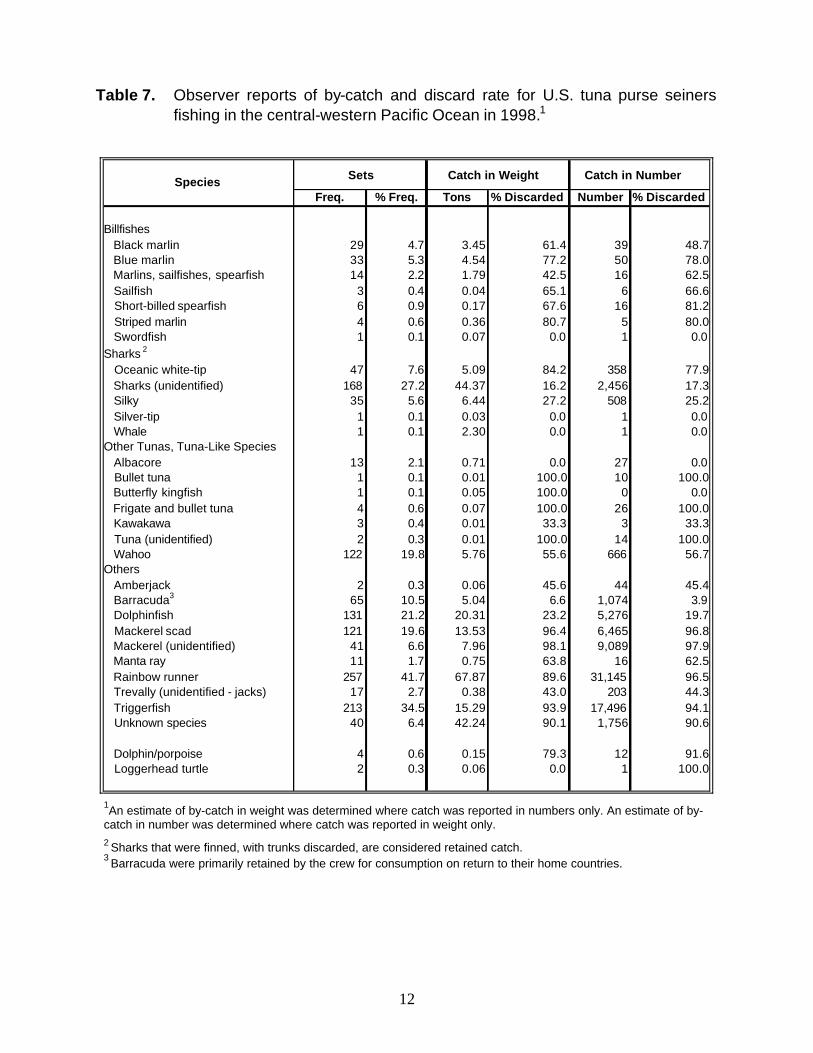
FFA observers collected by-catch and discard information from 616 sets and the results are summarized in Tables 4 and 7. The 616 sets caught a total of about 19,200 t of tuna (75% skipjack tuna) and about 340 t of by-catch species (Table 4). Approximately 170 t (<1%) of the tuna were discarded at sea. The highest percentage of tuna discards was for skipjack tuna with 1% by weight, followed by yellowfin and bigeye tunas with 0.5% each. Floating-object sets resulted in a higher percentage (1.1%) of tuna discards than free-swimming school sets (0.5%). About 47% of the by-catch observed by the FFA observers was discarded3 at sea and the percent discarded varied with species (Table 7). This differed from logbook and landing information in which virtually all by-catch was reported as discarded at sea. The most common species in the observed by-catch was rainbow runner, 90% of which was discarded at sea. Floating-object sets produced a greater by-catch rate than free-swimming school sets (Table 4). Size Composition
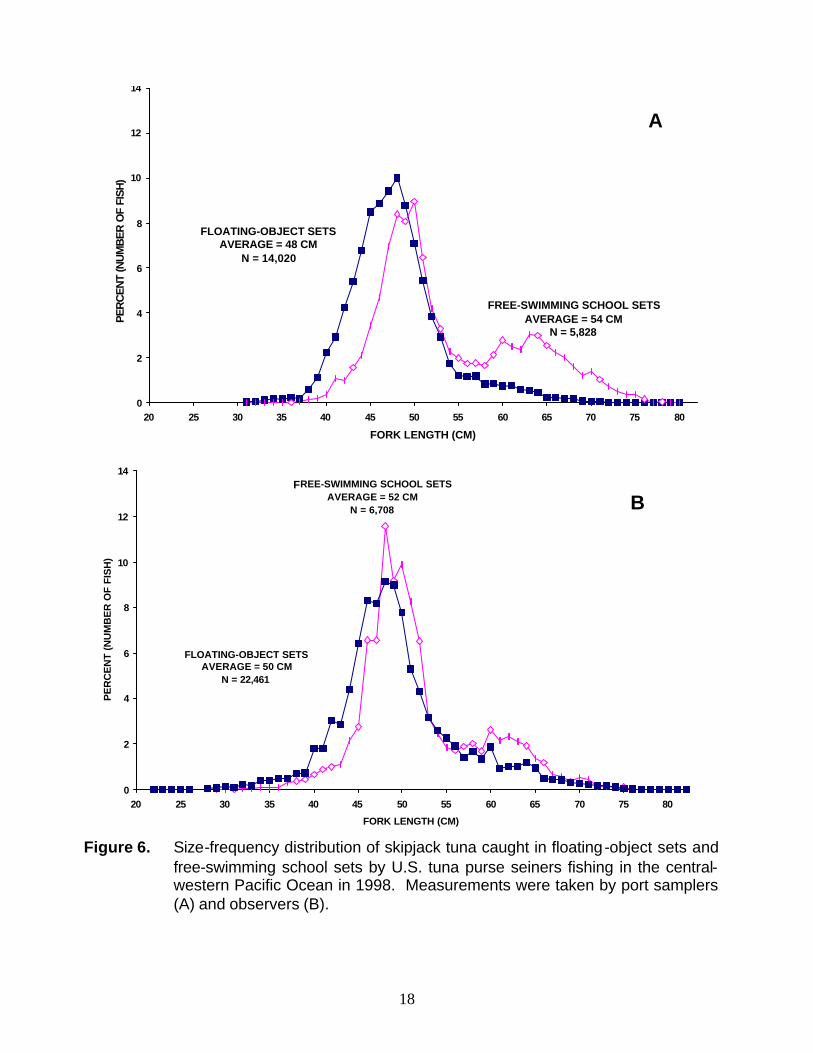
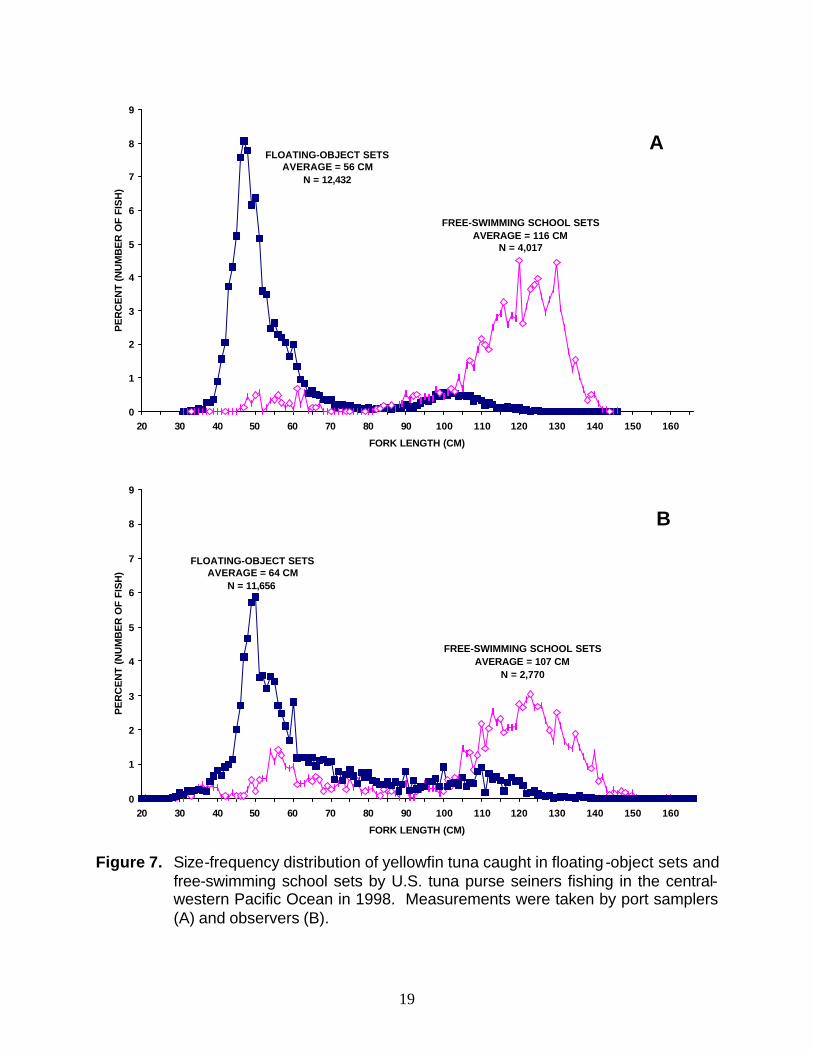
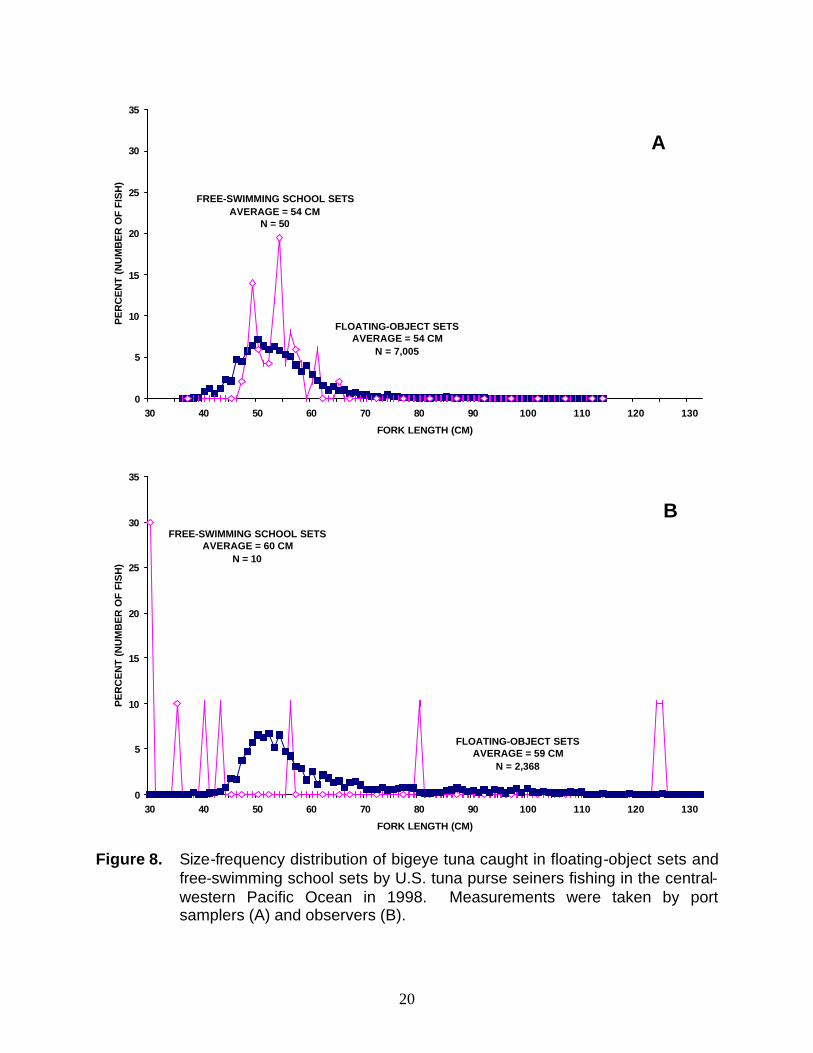
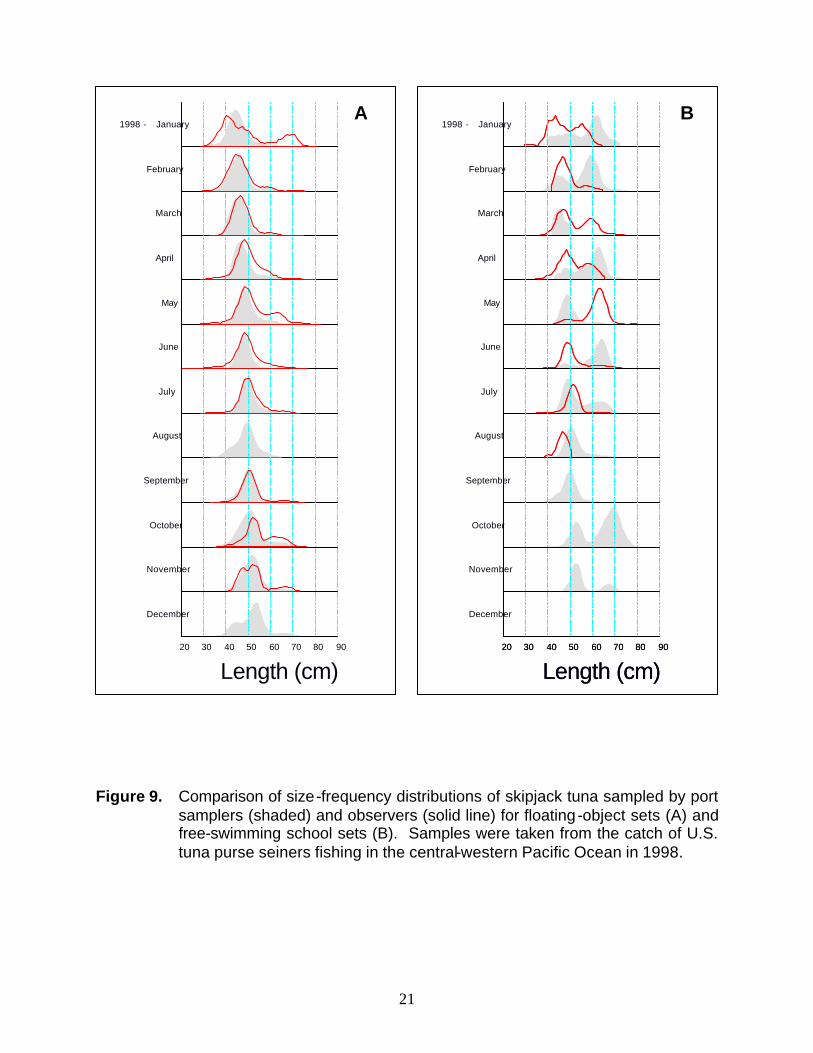
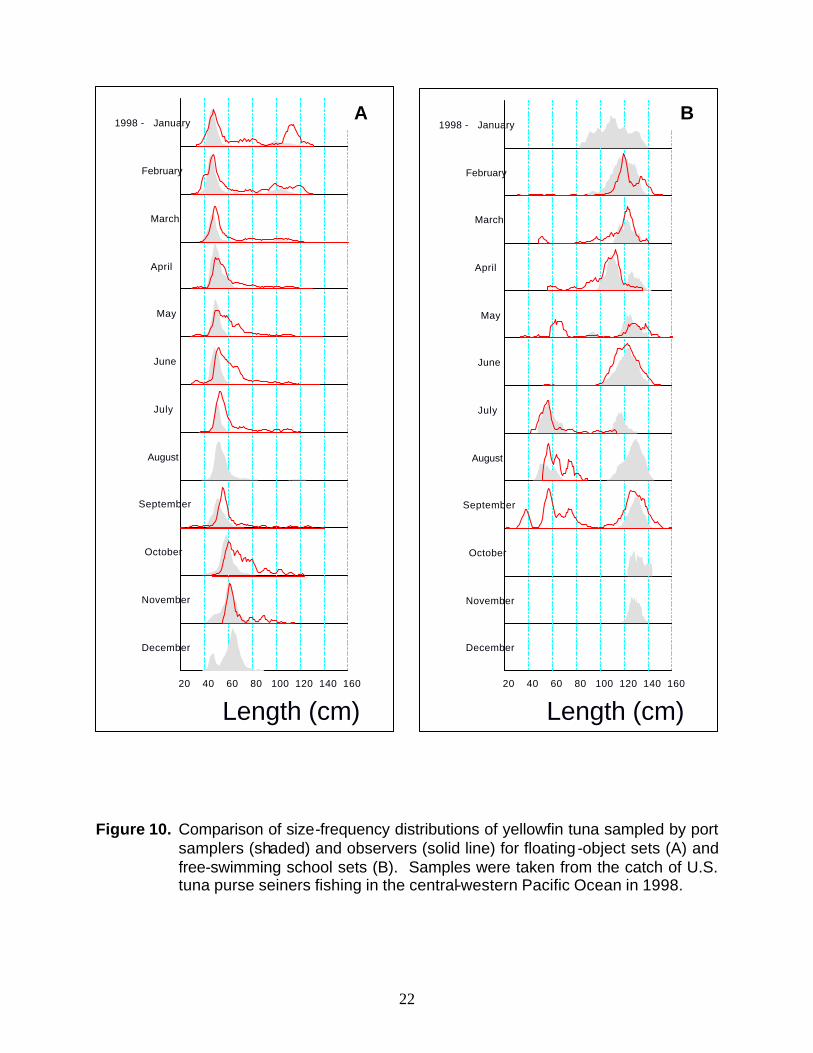
Sizes of fish in the U.S. purse seine catch for 1998 were estimated from two sources of data: NMFS port sampling and FFA observer sampling. Both sets of data provided nearly identical results. Data from NMFS port sampling indicated that skipjack tuna ranged from 31 to 80 cm fork length and averaged 49 cm FL (Figure 6). Skipjack tuna in free-swimming schools were slightly larger, averaged 54 cm FL, than in floating-object sets, 48 cm FL. Yellowfin tuna ranged from 31 to 146 cm FL and averaged 70 cm FL (Figure 7). Yellowfin tuna caught in free-swimming schools were significantly larger, averaged 116 cm FL, than in floating-object sets, 56 cm FL. Bigeye tuna ranged from 36 to 114 cm FL and averaged 54 cm FL. In both floating-object and free-swimming school sets the average size of bigeye tuna was the same (Figure 8). Similar results were obtained from FFA observer data. Observers encountered a wider range of sizes than port samplers probably because observer sampling occurred prior to sorting and discarding of undersized fish at sea (Figures 6, 7 and 8). Skipjack tuna ranged from 22 to 82 cm FL and averaged 50 cm FL. Average size of skipjack tuna in floating-objects sets (50 cm FL) was about the same as in free-swimming school sets (52 cm FL). Yellowfin tuna ranged from 20 cm to 164 cm FL and averaged 73 cm FL. Larger yellowfin tuna were taken in free-swimming school sets (average 107 cm FL) than in floating-object sets (average 64 cm FL). Bigeye tuna ranged from 30 cm FL to 132 cm FL and averaged 60 cm FL. The average size of bigeye tuna was nearly identical in floating-object sets (60 cm FL) and free-swimming school sets (59 cm FL). Figures 9 and 10 provide further diagrammatic comparisons of the available port sampling and observer data collected during 1998. For example, these figures clearly show modal progressions in the skipjack and yellowfin sampled from floating object sets over time.
FISHERY ANALYSIS
In 1998, the oceanographic regime for the central-western Pacific region was in “transition”. The year started with classic El Niño-Southern Oscillation (ENSO) conditions in the Pacific, a carry over from the ENSO of 1997. By June, there were significant signs that the
3 Sharks with fins retained and trunks discarded have not been considered as discards of by-catch.
5
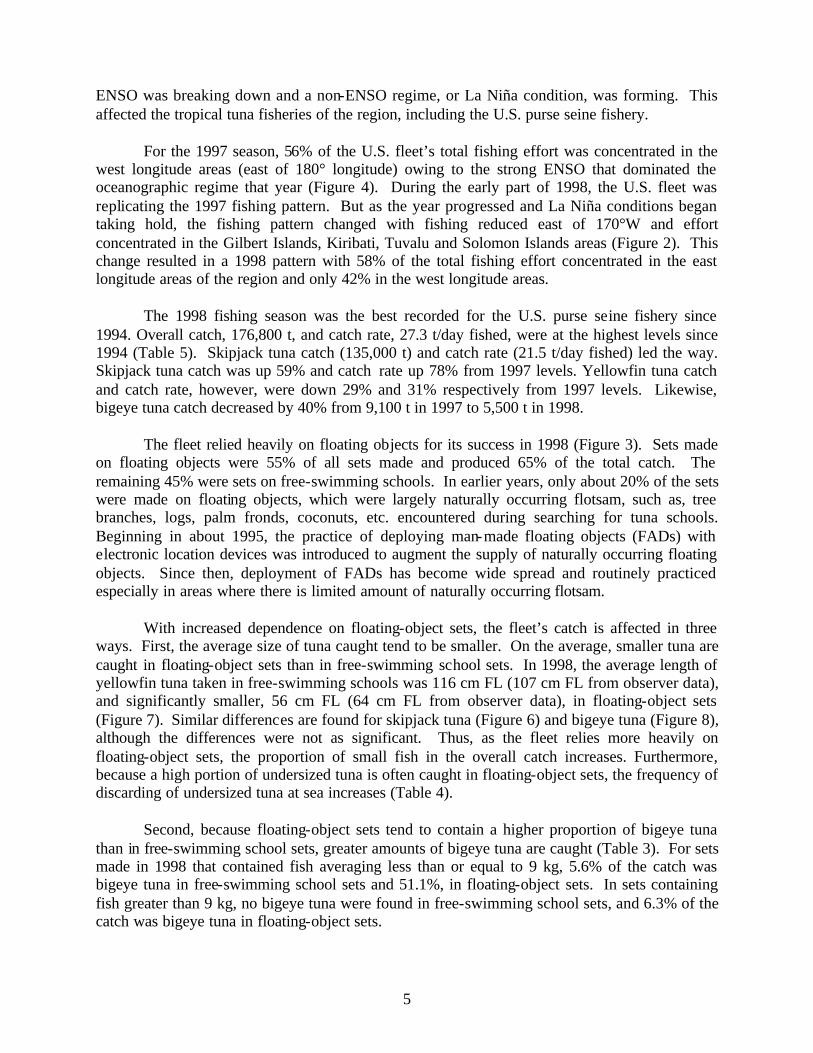
ENSO was breaking down and a non-ENSO regime, or La Niña condition, was forming. This affected the tropical tuna fisheries of the region, including the U.S. purse seine fishery.
For the 1997 season, 56% of the U.S. fleet’s total fishing effort was concentrated in the west longitude areas (east of 180° longitude) owing to the strong ENSO that dominated the oceanographic regime that year (Figure 4). During the early part of 1998, the U.S. fleet was replicating the 1997 fishing pattern. But as the year progressed and La Niña conditions began taking hold, the fishing pattern changed with fishing reduced east of 170°W and effort concentrated in the Gilbert Islands, Kiribati, Tuvalu and Solomon Islands areas (Figure 2). This change resulted in a 1998 pattern with 58% of the total fishing effort concentrated in the east longitude areas of the region and only 42% in the west longitude areas.
The 1998 fishing season was the best recorded for the U.S. purse seine fishery since 1994. Overall catch, 176,800 t, and catch rate, 27.3 t/day fished, were at the highest levels since 1994 (Table 5). Skipjack tuna catch (135,000 t) and catch rate (21.5 t/day fished) led the way. Skipjack tuna catch was up 59% and catch rate up 78% from 1997 levels. Yellowfin tuna catch and catch rate, however, were down 29% and 31% respectively from 1997 levels. Likewise, bigeye tuna catch decreased by 40% from 9,100 t in 1997 to 5,500 t in 1998.
The fleet relied heavily on floating objects for its success in 1998 (Figure 3). Sets made on floating objects were 55% of all sets made and produced 65% of the total catch. The remaining 45% were sets on free-swimming schools. In earlier years, only about 20% of the sets were made on floating objects, which were largely naturally occurring flotsam, such as, tree branches, logs, palm fronds, coconuts, etc. encountered during searching for tuna schools. Beginning in about 1995, the practice of deploying man-made floating objects (FADs) with electronic location devices was introduced to augment the supply of naturally occurring floating objects. Since then, deployment of FADs has become wide spread and routinely practiced especially in areas where there is limited amount of naturally occurring flotsam.
With increased dependence on floating-object sets, the fleet’s catch is affected in three
ways. First, the average size of tuna caught tend to be smaller. On the average, smaller tuna are caught in floating-object sets than in free-swimming school sets. In 1998, the average length of yellowfin tuna taken in free-swimming schools was 116 cm FL (107 cm FL from observer data), and significantly smaller, 56 cm FL (64 cm FL from observer data), in floating-object sets (Figure 7). Similar differences are found for skipjack tuna (Figure 6) and bigeye tuna (Figure 8), although the differences were not as significant. Thus, as the fleet relies more heavily on floating-object sets, the proportion of small fish in the overall catch increases. Furthermore, because a high portion of undersized tuna is often caught in floating-object sets, the frequency of discarding of undersized tuna at sea increases (Table 4).
Second, because floating-object sets tend to contain a higher proportion of bigeye tuna than in free-swimming school sets, greater amounts of bigeye tuna are caught (Table 3). For sets made in 1998 that contained fish averaging less than or equal to 9 kg, 5.6% of the catch was bigeye tuna in free-swimming school sets and 51.1%, in floating-object sets. In sets containing fish greater than 9 kg, no bigeye tuna were found in free-swimming school sets, and 6.3% of the catch was bigeye tuna in floating-object sets.
6
Third, because floating objects tend to aggregate a large number of species other than the target tuna species, greater numbers of by-catch species are caught in floating-object sets than in free-swimming school sets. For 1998, FFA observer data (Table 4) indicate almost a 13–fold difference in the by-catch rate between floating-object sets (0.76 t of by-catch/set) and free-swimming school sets (0.06 t of by-catch/set).
As the 1999 fishing season unfolds, preliminary data and information indicate that the fishing pattern will likely be a La Niña-type. If so, the fishing pattern would be similar to that of 1995 or 1996, La Niña years, with fishing effort concentrated in the east longitude areas of the region. For example, in 1996 about 88% of the fishing effort of the U.S. fleet was concentrated west of 180°. That year, significant catches were made in the Gilbert Islands, Kiribati and in Tuvalu and Papua New Guinea areas. Skipjack tuna was the dominant species and about 41% of the sets were on floating objects. For the 1999 season, skipjack tuna will most likely be the dominant species in the catch, and floating-object sets will likely be the dominant type of set.
ACKNOWLEDGMENTS
We thank the vessel captains and owners and fish buyers and processors for their cooperation in providing data and for providing access to vessels and cannery areas for the collection of data. Without this cooperation the high level of monitoring of this fishery would not be possible and comprehensive data for evaluating the fishery would not be available. We also thank the staffs of the NMFS/SWR Pacific Islands Area Office and the FFA who executing the plan for data collection in the field. Their adherence to the sampling guidelines and protocols is greatly appreciated and contributed to the success of our sampling efforts.
LITERATURE CITED Coan, A.L., N. Bartoo and G. Sakagawa. 1988. Plan for collection of fisheries data from U.S.
tuna purse seiners fishing in the South Pacific. Southwest Fisheries Science Center Administrative Report LJ-88-19. 19p.
Coan, A.L., Jr., G.T. Sakagawa, D. Prescott, and G. Yamasaki. 1997. The 1996 U.S. purse seine
fishery for tropical tunas in the central-western Pacific Ocean. Marine Fisheries Review 59(3):34-40.
7
Table 1. Fleet performance statistics for U.S. tuna purse seiners fishing in the central-western Pacific Ocean.
Sets/ Trips/Licensed1 Fished1 Trips Trip Vessel
1988 35 31 71 69.42 46.07 2.291989 35 35 154 58.07 41.88 4.401990 51 43 181 47.32 34.79 4.211991 48 43 229 42.38 40.40 5.331992 44 44 212 46.32 35.11 4.821993 42 42 199 51.92 37.27 4.741994 48 49 241 44.11 35.21 4.881995 47 44 206 49.14 33.38 4.681996 40 40 182 50.09 33.02 4.551997 35 35 177 58.05 35.60 5.061998 2
39 39 200 47.53 27.96 5.13
licensed from June 15 of one year to June 14 of the next year; whereas, a vessel fishing in a calendar year is recorded as "fished".
2 Data for 1998 are preliminary.
VesselsYear
1 The number of vessels that fished can be different from the number of licensed vessels because vessels are
Days/Trip
8
Table 2. Number of fish measured by port samplers (Port) and observers (Obsv.) by month and NMFS sampling area strata from catches of U.S. tuna purse seiners fishing in the central-western Pacific in 1998. Catches for the fleet are stratified from logbook data.
Month Catch1
TonsPort Obsv. Catch1
TonsPort Obsv. Catch1
TonsPort Obsv. Catch1
TonsPort Obsv.
1 619 281 0 3,959 1,219 787 131 51 0 - 0 0 2 552 457 0 3,176 1,239 1,785 - 0 0 317 101 0 3 1,155 0 477 14,856 2,796 2,795 256 0 450 - 0 0 4 524 211 163 8,072 1,746 6,396 - 0 0 - 0 0 5 1,916 103 249 9,867 1,989 5,363 36 0 65 - 0 0 6 1,062 0 0 6,943 1,484 3,056 5 0 0 - 0 0 7 395 0 0 11,150 2,164 4,543 - 0 0 - 0 0 8 91 0 0 5,711 1,341 14 - 0 0 - 0 0 9 - 0 0 13,135 1,992 2,372 - 0 0 - 0 010 - 0 0 10,949 2,402 434 2,256 519 0 - 0 011 - 0 0 3,230 2,345 220 - 0 0 - 0 012 - 0 0 - 260 0 - 0 0 - 0 0
Total 6,314 1,052 889 91,048 20,977 27,765 2,684 570 515 317 101 0
1 991 478 0 2,352 1,503 683 12 50 0 - 0 0 2 946 516 0 2,381 1,947 2,006 - 0 0 - 0 0 3 913 0 259 1,427 2,225 2,289 25 0 238 - 0 0 4 150 200 272 1,022 1,569 2,227 - 0 0 - 0 0 5 486 117 178 1,637 1,706 2,021 9 0 59 - 0 0 6 175 0 0 4,729 1,786 2,141 2 0 0 - 0 0 7 208 0 0 1,099 521 749 - 0 0 - 0 0 8 41 0 0 4,582 1,257 47 - 0 0 - 0 0 9 - 0 0 2,834 1,114 987 - 0 0 - 0 010 - 0 0 666 1,507 191 - 0 0 - 0 011 - 0 0 404 1,295 75 - 0 0 - 0 012 - 0 0 - 261 0 - 0 0 - 0 0
Total 3,910 1,311 709 23,133 16,691 13,416 48 50 297 - 0 0
1 14 50 0 90 673 147 - 50 0 - 0 0 2 - 102 0 82 304 424 - 0 0 - 0 0 3 - 0 4 6 670 361 - 0 35 - 0 0 4 - 0 0 4 924 492 - 0 0 - 0 0 5 50 100 26 33 922 383 - 0 9 - 0 0 6 - 0 0 11 357 232 - 0 0 - 0 0 7 - 0 0 - 258 110 - 0 0 - 0 0 8 - 0 0 70 623 0 - 0 0 - 0 0 9 - 0 0 73 511 123 - 0 0 - 0 010 - 0 0 60 1,103 22 - 0 0 - 0 011 - 0 0 - 1,221 10 - 0 0 - 0 012 0 0 0 - 258 0 - 0 0 - 0 0
Total 64 252 30 429 7,824 2,304 - 50 44 - 0 0
1 "-" indicates incomplete information owing to logbooks not yet processed.
NMFS SAMPLING AREASArea I Area II Area III
SKIPJACK TUNA
YELLOWFIN TUNA
BIGEYE TUNA
Area IV
9
Table 3. Percentage of bigeye tuna in yellowfin tuna landings of U.S. tuna purse seiners in the central-western Pacific Ocean, determined from species composition sampling. Large fish are greater than 9 kg, or 78 cm FL; small fish are #9 kg.
Small Fish Large Fish Small Fish Large Fish1988 9.39 15.31 0.17 26.72 1.321989 5.36 4.01 0.05 17.70 14.101990 3.30 8.17 0.16 20.28 7.341991 3.99 7.17 0.18 14.52 6.231992 7.40 6.51 0.39 22.59 10.091993 7.52 5.24 0.51 19.84 7.531994 2.95 15.12 0.16 27.20 2.581995 9.12 5.01 0.51 26.29 9.131996 36.36 14.87 0.84 47.87 46.311997 15.41 1.86 1.68 37.32 15.18
1998113.20 5.63 0.00 51.12 6.31
1 Data for 1998 are preliminary.
Year All Set Types and Sizes
Free-Swimming School Sets Floating-Object Log Sets
Table 4. Tuna catch and by-catch by set type from observations made aboard U.S.
tuna purse seiners fishing in the central-western Pacific Ocean in 1998.
Tons Tons/setFloating Object
Anchored FAD 19 Skipjack 42.53 2.24 2.6%Yellowfin 4.27 0.22 26.9%Bigeye 2.55 0.13 1.7%By-catch 1.41 0.07 78.3%
Drifting log or flotsam 200 Skipjack 6,473.72 32.37 0.8%Yellowfin 1,012.57 5.06 0.8%Bigeye 193.58 0.97 0.1%By-catch 219.19 1.10 39.5%
Drifting FAD 159 Skipjack 4,406.07 27.71 1.4%Yellowfin 642.54 4.04 2.1%Bigeye 200.40 1.26 1.0%By-catch 67.30 0.42 54.9%
Free-Swimming School 186 Skipjack 2,232.51 12.00 1.0%Yellowfin 2,481.30 13.34 0.1%Bigeye 11.13 0.08 20.6%By-catch 11.98 0.06 0.0%
Others 52 Skipjack 944.60 18.89 0.8%Yellowfin 533.10 10.66 0.2%Bigeye 18.40 0.37 0.4%By-catch 38.03 0.76 94.9%
CatchType of Sets Number ofSets
Species %Discarded
10
Table 5. Catches (t) and catch-per-unit effort (t/day fished) for the U.S. tuna purse seine fishery in the central-western Pacific Ocean.
Yellowfin Skipjack Bigeye Total Yellowfin Skipjack Total
1988 18,832 93,636 1,9482114,416 3.01 15.37 18.38
1989 42,886 95,027 2,421 140,334 7.26 14.59 21.851990 52,089 110,044 1,762 163,895 8.91 16.66 25.571991 37,330 177,389 1,550 216,269 5.70 24.78 30.481992 43,693 155,898 3,480 203,071 6.39 21.48 27.871993 46,011 148,419 3,731 198,161 6.46 18.29 24.751994 56,426 151,486 1,711 209,623 7.63 18.61 26.241995 31,845 132,518 3,190 167,553 4.68 17.39 22.071996 19,417 120,127 9,860 149,404 4.13 16.93 21.051997 50,208 84,729 9,145 144,082 8.45 12.06 20.51
1998336,231 135,024 5,508 176,763 5.87 21.47 27.34
2 Estimated from species composition sampling for 6 months (June to December 1988).
3 Data for 1998 are preliminary.
1 Includes reported discards in logbooks and cannery rejects.
Year Catch1 Catch-Per-Unit Effort
11
Table 6. Logbook reports1 of by-catch for U.S. tuna purse seiners fishing in the central-western Pacific Ocean in 1998.
Species Weight (t)
Billfishes Black marlin 0.32 Blue marlin 1.29 Marlin 10.90 Sailfish 0.05Sharks Sharks 21.22Others
"Baitfish"2 65.51 Dolphinfish 0.07 Dolphinfish/barracuda 0.05 Mackerel 1.04 Mackerel/"baitfish" 3.80 Mackerel scad/rainbow runner 8.51 Manta ray 0.23 Marlin/rainbow runner 0.02
Marlin/shark3 0.42
Oceanic whitetip shark/triggerfish3 0.07 Rainbow runner 126.83 Rainbow runner/mackerel 2.00 Rainbow runner/triggerfish 0.21
Shark/rainbow runner3 1.39
Shark/rainbow runner/scad mackerel3 5.09 Sunfish 0.03 Triggerfish 0.31 Triggerfish/"baitfish" 0.01 Unknown species 1.92
discarded.
3 Sharks were sometimes reported in combination with other species.
1 Fishermen are instructed to report by-catch in weight or numbers. Reports in numbers were
2 Included mackerel, bonito, and other species.
not used and consisted of 19 marlins, 209 sharks and 2,000 rainbow runners caught and
12
Table 7. Observer reports of by-catch and discard rate for U.S. tuna purse seiners fishing in the central-western Pacific Ocean in 1998.1
Freq. % Freq. Tons % Discarded Number % Discarded
Billfishes Black marlin 29 4.7 3.45 61.4 39 48.7 Blue marlin 33 5.3 4.54 77.2 50 78.0 Marlins, sailfishes, spearfish 14 2.2 1.79 42.5 16 62.5 Sailfish 3 0.4 0.04 65.1 6 66.6 Short-billed spearfish 6 0.9 0.17 67.6 16 81.2 Striped marlin 4 0.6 0.36 80.7 5 80.0 Swordfish 1 0.1 0.07 0.0 1 0.0
Sharks 2
Oceanic white-tip 47 7.6 5.09 84.2 358 77.9 Sharks (unidentified) 168 27.2 44.37 16.2 2,456 17.3 Silky 35 5.6 6.44 27.2 508 25.2 Silver-tip 1 0.1 0.03 0.0 1 0.0 Whale 1 0.1 2.30 0.0 1 0.0Other Tunas, Tuna-Like Species Albacore 13 2.1 0.71 0.0 27 0.0 Bullet tuna 1 0.1 0.01 100.0 10 100.0 Butterfly kingfish 1 0.1 0.05 100.0 0 0.0 Frigate and bullet tuna 4 0.6 0.07 100.0 26 100.0 Kawakawa 3 0.4 0.01 33.3 3 33.3 Tuna (unidentified) 2 0.3 0.01 100.0 14 100.0 Wahoo 122 19.8 5.76 55.6 666 56.7Others Amberjack 2 0.3 0.06 45.6 44 45.4 Barracuda3 65 10.5 5.04 6.6 1,074 3.9 Dolphinfish 131 21.2 20.31 23.2 5,276 19.7 Mackerel scad 121 19.6 13.53 96.4 6,465 96.8 Mackerel (unidentified) 41 6.6 7.96 98.1 9,089 97.9 Manta ray 11 1.7 0.75 63.8 16 62.5 Rainbow runner 257 41.7 67.87 89.6 31,145 96.5 Trevally (unidentified - jacks) 17 2.7 0.38 43.0 203 44.3 Triggerfish 213 34.5 15.29 93.9 17,496 94.1 Unknown species 40 6.4 42.24 90.1 1,756 90.6
Dolphin/porpoise 4 0.6 0.15 79.3 12 91.6 Loggerhead turtle 2 0.3 0.06 0.0 1 100.0
2 Sharks that were finned, with trunks discarded, are considered retained catch.
3 Barracuda were primarily retained by the crew for consumption on return to their home countries.
1An estimate of by-catch in weight was determined where catch was reported in numbers only. An estimate of by-
catch in number was determined where catch was reported in weight only.
Catch in Weight Catch in NumberSetsSpecies
13
40°N
30°N
20°N
10°N
0°
10°S
20°S
30°S
40°S
40°N
30°N
20°N
10°N
0°
10°S
20°S
30°S
40°S90°E 100°E 120°E 140°E 160°E 180° 160°W 140°W 120°W110°E 130°E 150°E 170°E 170°W 150°W 130°W
90°E 100°E 120°E 140°E 160°E 180° 160°W 140°W 120°W110°E 130°E 150°E 170°E 170°W 150°W 130°W
JA
PA
N
C H I N A
T A I W A N
P H I L I P P I N E S
NorthernMarianaIslands
Guam
Wake Is.
PALAU
PAPUANEW GUINEA
NAURU
MARSH
ALL ISLAND
S
KIRIBATI
Hawai i
MarquesasIslands
FrenchPolynesia
AmericanSamoa
WESTERNSAMOA
C o o k I s l a n d sTONGAIsland
FIJI
VANUATU
NewCaledonia
A U S T R A L I A
N E WZ E A L A N D
SOLOMONISLANDS
I N D O N E S I A
USA
SOUTH
KOREA
FEDERATED STATES OF MICRONESIA
III
IV
II
I
Figure 1. Boundaries of the South Pacific Regional Tuna Treaty area and the four NMFS Sampling areas used for
length sampling of catches in the Treaty area.
13
14
20°N
0°
30°S
10°N
20°S
10°S
40°S130°E 170°E150°E 170°W140°E 180°160°E 160°W 150°W
0.00 - 19.99 Days20.00 - 39.99 Days40.00 - 59.99 Days60.00 - 79.99 Days80.00 - 300.00 Days
West East
Figure 2. Distribution of fishing effort (days fished) for the 1998 U.S. tuna purse seine fishery in the central-western
Pacific Ocean. Proportion of types of sets for east and west of 180° is shown in pie diagrams.
14
15
0
10
20
30
40
50
60
70
80
90
100
1988 1989 1990 1991 1992 1993 1994 1995 1996 1997 1998
YEAR
PE
RC
EN
T O
F S
ET
S
SCHOOL SETS
LOG SETSFAD SETS
Figure 3. Percentage of free-swimming school, log and FAD sets for U.S. tuna purse seiners fishing in the central-
western Pacific Ocean.
15
16
0.00 - 19.99 Days20.00 - 39.99 Days40.00 - 59.99 Days60.00 - 79.99 Days80.00 - 300.00 Days
20°N
0°
30°S
10°N
20°S
10°S
40°S130°E 170°E150°E 170°W140°E 180°160°E 160°W 150°W
West East
Figure 4. Distribution of fishing effort (days fished) for the 1997 U.S. tuna purse seine fishery in the central-western
Pacific Ocean. Proportion of types of sets for east and west of 180° is shown in pie diagrams.
16
17
PROCESSING LOCATION
Puerto Rico (5%)
Thailand (3%)
Spain (2%)
Philippines (2%)
Other (5%)
American Samoa (83%)
B
Figure 5. Percentage of U.S. tuna purse seine landings by landing location (A) and
processing location (B) for 1998.
LANDING LOCATION
American Samoa (89%)
Other (3%)
Guam (2%)
Honiara, Solomon Islands (6%)
A
18
0
2
4
6
8
10
12
14
20 25 30 35 40 45 50 55 60 65 70 75 80
FORK LENGTH (CM)
PE
RC
EN
T (N
UM
BE
R O
F FI
SH
)
FREE-SWIMMING SCHOOL SETSAVERAGE = 54 CM
N = 5,828
FLOATING-OBJECT SETSAVERAGE = 48 CM
N = 14,020
A
0
2
4
6
8
10
12
14
20 25 30 35 40 45 50 55 60 65 70 75 80
FORK LENGTH (CM)
PE
RC
EN
T (
NU
MB
ER
OF
FIS
H)
FLOATING-OBJECT SETSAVERAGE = 50 CM
N = 22,461
FREE-SWIMMING SCHOOL SETSAVERAGE = 52 CM
N = 6,708 B
Figure 6. Size-frequency distribution of skipjack tuna caught in floating-object sets and
free-swimming school sets by U.S. tuna purse seiners fishing in the central-western Pacific Ocean in 1998. Measurements were taken by port samplers (A) and observers (B).
19
0
1
2
3
4
5
6
7
8
9
20 30 40 50 60 70 80 90 100 110 120 130 140 150 160
FORK LENGTH (CM)
PE
RC
EN
T (
NU
MB
ER
OF
FIS
H)
AFLOATING-OBJECT SETS
AVERAGE = 56 CMN = 12,432
FREE-SWIMMING SCHOOL SETSAVERAGE = 116 CM
N = 4,017
0
1
2
3
4
5
6
7
8
9
20 30 40 50 60 70 80 90 100 110 120 130 140 150 160
FORK LENGTH (CM)
PE
RC
EN
T (
NU
MB
ER
OF
FIS
H)
B
FLOATING-OBJECT SETSAVERAGE = 64 CM
N = 11,656
FREE-SWIMMING SCHOOL SETSAVERAGE = 107 CM
N = 2,770
Figure 7. Size-frequency distribution of yellowfin tuna caught in floating -object sets and
free-swimming school sets by U.S. tuna purse seiners fishing in the central-western Pacific Ocean in 1998. Measurements were taken by port samplers (A) and observers (B).
20
0
5
10
15
20
25
30
35
30 40 50 60 70 80 90 100 110 120 130
FORK LENGTH (CM)
PE
RC
EN
T (
NU
MB
ER
OF
FIS
H)
FLOATING-OBJECT SETSAVERAGE = 54 CM
N = 7,005
FREE-SWIMMING SCHOOL SETSAVERAGE = 54 CM
N = 50
A
0
5
10
15
20
25
30
35
30 40 50 60 70 80 90 100 110 120 130
FORK LENGTH (CM)
PE
RC
EN
T (
NU
MB
ER
OF
FIS
H)
B
FLOATING-OBJECT SETSAVERAGE = 59 CM
N = 2,368
FREE-SWIMMING SCHOOL SETSAVERAGE = 60 CM
N = 10
Figure 8. Size-frequency distribution of bigeye tuna caught in floating-object sets and
free-swimming school sets by U.S. tuna purse seiners fishing in the central-western Pacific Ocean in 1998. Measurements were taken by port samplers (A) and observers (B).
21
40 20 30 50
Length (cm) 90 60 70 80
June
July
August
September
October
November
December
May
1998 - January
February
March
April
20 30 40 50 60 70 80 90
Length (cm) 40 20 30 50
Length (cm) 90 60 70 80
June
July
August
September
October
November
December
May
1998 - January
February
March
April
Figure 9. Comparison of size-frequency distributions of skipjack tuna sampled by port samplers (shaded) and observers (solid line) for floating -object sets (A) and free-swimming school sets (B). Samples were taken from the catch of U.S. tuna purse seiners fishing in the central-western Pacific Ocean in 1998.
A B
22
120 140 160100 80
Length (cm)
July
August
September
May
April
June
1998 - January
February
March
October
November
December
20 40 60
120 140 160100 80
Length (cm)
July
August
September
May
April
June
1998 - January
February
March
October
November
December
20 40 60
Figure 10. Comparison of size-frequency distributions of yellowfin tuna sampled by port
samplers (shaded) and observers (solid line) for floating -object sets (A) and free-swimming school sets (B). Samples were taken from the catch of U.S. tuna purse seiners fishing in the central-western Pacific Ocean in 1998.
A B