the 2010 accenture consumer electronics … 2010 accenture consumer electronics products and ......
TRANSCRIPT

Mobility Takes Center Stage:The 2010 Accenture Consumer Electronics Products and Services Usage Report

2 | Mobility Takes Center Stage
Executive Summary
About the Research
Strong Global Demand Drives Increased Spending on and Use of Consumer for Technology Products and Services
Emerging Markets Are the Engine for Consumer Technology Adoption
US Consumers Continue Their Adoption of Mobility and Social Networking Technology
Generational Differences Remain Strong Influencers of Consumer Technology Purchases
Implications for the Consumer Technology Industry
3
6
7
12
18
20
23
Contents

3 | Mobility Takes Center Stage
It may seem counterintuitive, but despite the deepest and most far-reaching economic downturn of the past 50 years, there has never been greater demand for consumer technology products. According to the Consumer Electronics Association, worldwide spending on consumer electronics products will grow nearly 10 percent between 2008 and 2009 to $700 billion—an increase of $42 billion, driven largely by skyrocketing demand in emerging markets.
Indeed, consumer technologies remain an important and growing part of not only many countries’ economies, but also the lives of an increasing number of people all around the world—as the recently completed 2010 edition of the Accenture Consumer Electronics Products and Usage study vividly illustrates. This field work for this study, formerly conducted only in the United States in 2007 and 2008, was expanded in 2009 to include 16,000 consumers in eight countries in order to develop a greater understanding of consumer preferences and buying behavior for various technology products and services on an international scale.
Our research confirmed that despite the recent global recession, consumers worldwide—and especially those in emerging markets—remain keenly interested in and willing to invest in a multitude of technology products and services.
Executive Summary
3 | Mobility Takes Center Stage

4 | Mobility Takes Center Stage
respondents use technologies. With a greater desire for all different kinds of technology, emerging-market respondents take full advantage of the activities available on any one technology. The net result is that the breadth of technology use appears to be much greater in emerging markets.
Emerging and mature markets are further distinguished by their hunger for innovation. Innovation is more often a primary driver of purchase decisions among emerging-market consumers, and 94 percent of respondents in emerging markets (compared with 82 percent of respondents in mature markets) said it was important to them that the brands they buy are perceived as the most innovative of technologies. Still, price is not an insignificant concern. It remains the top factor in the purchase decision among consumers in both groups, although it less likely to be seen as important by emerging-market consumers.
One of the most surprising findings of our research involves sustainability. Consumers in emerging markets were far more likely than their mature-market counterparts to say they would pay a premium for products that are environmentally friendly. In fact, virtually all—98 percent—of Chinese consumers, compared with just 43 percent of consumers in the United States, reported such willingness.
US consumers continue their adoption of mobility and social networking technologiesDespite the recession, US respondents spent more money on consumer electronics in the past year than in prior years. While computers and mobile phones held steady as being owned by the greatest number of US respondents, Web-enabled mobile phone ownership more than tripled in two
Global demand for and spending on consumer electronics remains strongIn the past 12 months, 85 percent of respondents globally spent money on consumer technologies, with most of that money going toward the two most common (and, in consumers’ minds, most important) devices: mobile phones (both standard and smartphones) and computers (laptops and desktops). When making such technology purchases, price is considered the most important factor in the purchase decision, followed closely by personal research.
While not a primary purchase decision criteria for most consumers, innovation is also extremely important. A full 88 percent of respondents said it was very or somewhat important that the electronics brands they own are perceived as the most innovative technologies. Surprisingly, despite consumers’ emphasis on price, a majority (67 percent) of consumers globally said they were willing to pay a premium for products that are environmentally friendly—indicating that sustainability is rapidly becoming more important to consumers worldwide.
Across the many technologies consumers could own, our survey showed three tiers of technology adoption: technologies pervasively owned, those becoming more pervasive and those still selectively used. The vast majority of respondents own the “basics” or “must haves” in technology: computer, mobile phone, digital camera, DVD player and regular TV. Approximately half of the respondents own the next wave of “must haves” in technology: high-definition TVs and portable music players (MP3s). And, one-third or less of respondents own more specialized-use or older technologies: game console, VCR, digital video camera, portable gaming device, DVR for TV and GPS device. Adoption of
the newest consumer technologies such as netbooks, BluRay players, eBooks and 3-D TVs remains low to date.
Our research also found that consumers tend to be more dissatisfied with technology services than the technologies themselves, yet both returns of products and “drop and switch” rates for services remain low.
Emerging markets are the engine for consumer technology adoptionThis study revealed striking differences in many aspects of the attitudes toward and behavior with consumer technologies between consumers in emerging markets and those in mature ones. At a high level, the former are much more likely to have spent money on consumer technology products in the past year, to have spent more money on those products and to report they engage in a broader range of activities with those products.
Emerging-market consumers are especially interested in mobile technologies—far more than their mature-market counterparts. For example, consumers in emerging markets are more likely to own mobile technologies (such as mobile phones, MP3 players, portable gaming systems and netbooks), to buy such products in the near future and to use all of the product’s functionality. They also are more than twice as likely (64 percent versus 29 percent) to say their mobile phone or smartphone is their most important technology—an honor that goes to the computer among mature-market respondents—and to more often use mobile phone service than home Internet service (54 percent versus 22 percent).
The differences were also dramatic between emerging markets and mature ones in the activities in which

5 | Mobility Takes Center Stage
years. In fact, among the Baby Boomer generation, Web-enabled mobile phone ownership grew 75 percent between 2008 and 2009 in the United States.
Given the preceding statistics, it is perhaps not surprising that while both mobile phones and computers remain the most valued technologies for US consumers, the former has surpassed the latter in importance: when combined as a group, Web-enabled mobile phones and regular mobile phones are the most important consumer technology product for 47 percent of US consumers (versus 36 percent for computers). Home Internet access is the most important service to US consumers but, reflecting the rise of mobile phones themselves, mobile phone service also has increased in importance. Cable/satellite TV saw the greatest decline in the percentage of US consumers choosing it as one of their most important services.
Figure 1. Demographics of Survey Respondents
Gender
Education
Female49%
Male51%
4%Prefer not to answer
Doctorate
Graduate degree
College degree
Trade/technical school
High school diploma
Have not completed high school
2%14%
37%
12%24%
7%
Generation Market of Residences
Mature markets50%
Emerging markets50%
Baby Boomer35%
Gen Y41%
Gen X24%
0 5 10 15 20 25 30 35 40
In addition, US consumer participation in technology-based activities increased at a far greater rate in the past year than in prior years. For instance, the percentage of US consumers in 2009 spending at least 15 hours a week searching for news on the Internet doubled from 2008. The percentage of consumers using social networking sites almost doubled in the past year—a much more dramatic rate of growth than in the prior year. In fact, use of social networking sites among the US Baby Boomer generation grew 164 percent in one year—from 22 percent using social networking to 58 percent participating at least occasionally.
From multiple dimensions—across the globe, by age and by geographic region—Accenture’s research demonstrates significant interest in, and adoption of, consumer technologies among consumers globally. But it also highlights the often dramatic differences in behavior and desires
among different population segments. For companies focused on providing consumer technology products and services, the results of this study can provide crucial insights into consumer technology usage behavior within critical market segments that can help them more effectively target their offerings, capitalize on growth potential in key markets and position themselves for high performance in the post-recession world.

6 | Mobility Takes Center Stage
trends based on current behavior and potentially identify trends emerging from behavioral changes in the use of technology.
A summary of this extensive research is presented in the following report. It begins with key findings from the overall global sample of 16,000 consumers. It then describes the differences the research identified between mature and emerging markets in consumer use of and preferences for technology. It concludes by presenting the major trends identified in the United States during the past three years.
In 2007 and 2008, Accenture's Electronics & High Tech industry practice conducted primary research among United States consumers on the purchase and usage patterns of various types of consumer technology devices and services. In 2009, to provide even greater insight into consumer purchasing patterns and behavior with technology, we expanded our research to include 16,000 consumers across a total of eight countries:
• China • France • Germany • India • Japan • Malaysia • Singapore • United States
The research featured an online survey administered to a sample of 2,000 adults in each country—balanced across basic demographic factors, including geographic regions within countries, age and gender (Figure 1).
The primary objectives for the research were to develop a greater awareness of preferences for consumer technologies and services and to analyze trends in US consumer preferences over the past three years. The intention was to better understand the purchase and use of consumer technologies among key generations and, for the first time this year, gain deeper insights into global differences. Lastly, the research was intended to help project future technology
About the Research
Accenture | 6

7 | Mobility Takes Center Stage
And, one-third or less of respondents own specialized-use or older technologies: game console, VCR, digital video camera, portable gaming device, DVR for TV and GPS device (Figure 3).
Far fewer respondents own the newest consumer technologies such as a netbook, BluRay player, eBook or 3-D TV. Early adopters of these newest technologies reside more frequently in China, Malaysia and Singapore. For instance, 26 percent of respondents in China and 23 percent in Singapore own a netbook, compared with only 10 percent of consumers in the United States and 6 percent in France. Similarly, 17 percent of Chinese respondents own an eBook—a far greater percentage than their counterparts in the United States (5 percent), Germany (2 percent) and France (1 percent).
While most respondents own mobile phones, many owners use them for basic activities. More than one-quarter (28 percent) of respondents use their
Strong Global Demand Drives Increased Spending on and Use of Consumer Technology Products and ServicesOur survey respondents across the globe are reasonably technology literate, with 92 percent owning computers and 90 percent owning mobile phones. In fact, of the 18 technology-related activities we asked consumers about, the majority of respondents (60 percent or more) said they occasionally engaged in 12 of them. Virtually everyone at least occasionally emails from a computer (95 percent), reads news on the Internet (94 percent) and watches TV on a regular TV (87 percent). Furthermore, a subset of respondents spend significant time with technology each week. Almost one-quarter (22 percent) spend at least 15 hours a week watching TV, 14 percent spend at least 15 hours a week emailing from a PC, 12 percent spend more than
15 hours a week reading news on the Internet and working from home, and 8 percent spend at least 15 hours a week connecting on social networking sites (Figure 2).
Across the many technologies consumers could own, our survey showed three tiers of technology adoption: technologies pervasively owned, those becoming more pervasive, and those still selectively used. The vast majority of respondents own the “basics” or “must haves” in technology: computer, mobile phone, digital photo camera, DVD player and regular TV (although DVD players and regular TVs are on the decline according to the three-year trends in the United States). In fact, computers and mobile phones are by far the most important and frequently used technologies. Approximately half of the respondents own the next wave of “must haves” in technology: high-definition TVs and portable music players (MP3 players).
• Despite the global recession, 85 percent of consumers globally spent money on consumer technology products in the past year.
• While just under half (49 percent) of consumers bought a mobile or smartphone in the past year, basic activities such as making calls and texting still dominate as the primary uses of mobile phones.
• Consumers are relying less on the advice of friends, family and in-store salespeople for help with their purchase decisions. Instead, they value third-party reviews and online boards.
• A strong majority—67 percent—of consumers said they would pay a premium for technology products that are marked as environmentally friendly.
• Eighty-eight percent of consumers said it was very or somewhat important that the technology brands they own are perceived as the most innovative technologies.
• Consumers tend to be more dissatisfied with technology services than the technologies themselves, yet both products and services experience very low return percentages among consumers participating in our research.
Research Highlights
7 | Mobility Takes Center Stage

8 | Mobility Takes Center Stage
Figure 2. Participation in Technology-Based Activities
MicrobloggingWatching videos on a mobile phone or other mobile deviceWriting blogs or contributing to online references such as WikipediaPlaying video games on the go (on handheld game device or phone)Emailing from a mobile deviceParticipating in communities of interest on the InternetReading blogs or listening to podcastsWatching TV shows/movies on the internetListening to music on an iPod or other portable music playerPlaying video games at home (on console or PC)Connecting with people on social networking sitesWatching/posting videos on the InternetListening to music onlineManaging personal digital photos and videos on the InternetWorking from homeWatching TV on TVSearching for/reading news and information on the InternetEmailing from a PC
Percentage of Respondents at Least Occasionally Participating in the Activity0 20 40 60 80 100
47%60%
63%63%63%
65%67%68%69%
78%87%
94%95%
24%35%
39%42%
47%
Figure 3. Consumer Technologies Owned by Respondents
3-D televisioneBookBluRay playerNetbookGPS deviceDigital video recorder for TVPortable gaming deviceDigital video cameraVCRGame consolePortable music playerHigh-definition plasma or LCD TVRegular (CRT or tube) TVDVD playerDigital photo cameraWeb-enabled mobile phone/smartphoneMobile PhoneComputer (desktop or laptop)
Percentage of Respondents Owning the Device0 20 40 60 80 100
21%27%
29%34%34%
44%47%
61%73%
77%29%
85%
92%
2%5%
7%14%
20%
9 | Mobility Takes Center Stage
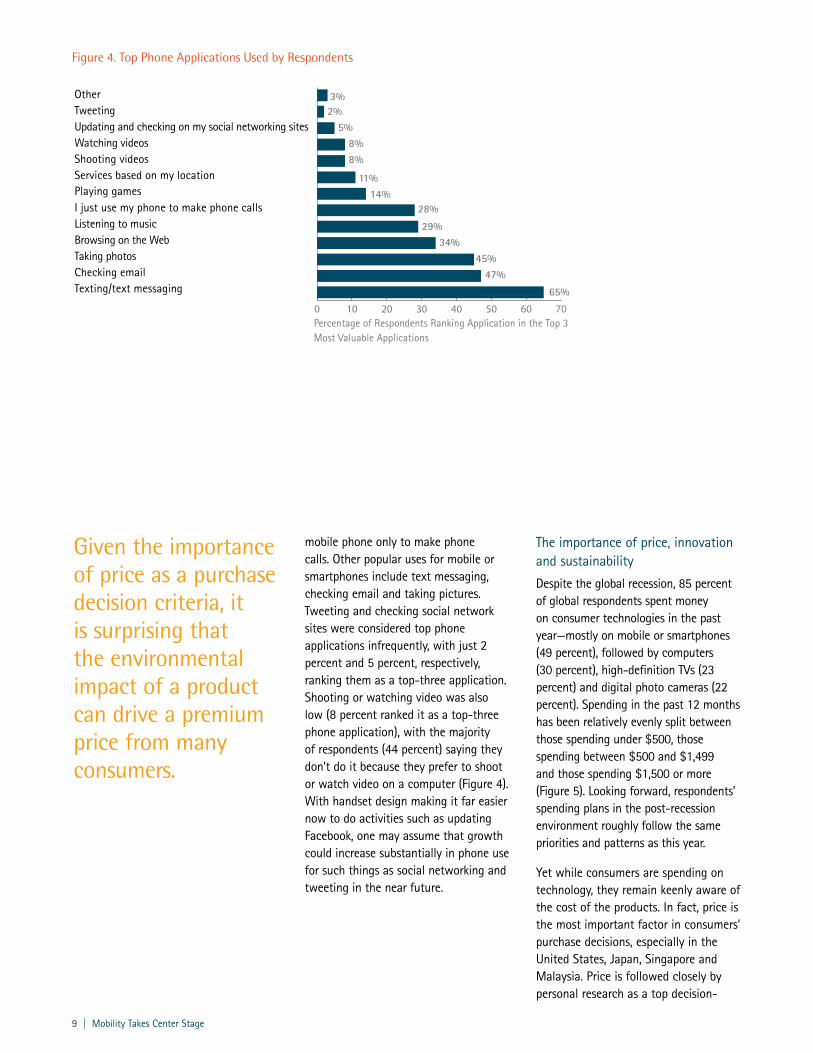
Figure 4. Top Phone Applications Used by Respondents
OtherTweetingUpdating and checking on my social networking sitesWatching videosShooting videosServices based on my locationPlaying gamesI just use my phone to make phone callsListening to musicBrowsing on the WebTaking photosChecking emailTexting/text messaging
Percentage of Respondents Ranking Application in the Top 3 Most Valuable Applications
11%14%
28%
29%34%
45%47%
65%
3%2%
5%8%8%
0 10 20 30 40 50 60 70
mobile phone only to make phone calls. Other popular uses for mobile or smartphones include text messaging, checking email and taking pictures. Tweeting and checking social network sites were considered top phone applications infrequently, with just 2 percent and 5 percent, respectively, ranking them as a top-three application. Shooting or watching video was also low (8 percent ranked it as a top-three phone application), with the majority of respondents (44 percent) saying they don’t do it because they prefer to shoot or watch video on a computer (Figure 4). With handset design making it far easier now to do activities such as updating Facebook, one may assume that growth could increase substantially in phone use for such things as social networking and tweeting in the near future.
The importance of price, innovation and sustainability
Despite the global recession, 85 percent of global respondents spent money on consumer technologies in the past year—mostly on mobile or smartphones (49 percent), followed by computers (30 percent), high-definition TVs (23 percent) and digital photo cameras (22 percent). Spending in the past 12 months has been relatively evenly split between those spending under $500, those spending between $500 and $1,499 and those spending $1,500 or more (Figure 5). Looking forward, respondents’ spending plans in the post-recession environment roughly follow the same priorities and patterns as this year.
Yet while consumers are spending on technology, they remain keenly aware of the cost of the products. In fact, price is the most important factor in consumers’ purchase decisions, especially in the United States, Japan, Singapore and Malaysia. Price is followed closely by personal research as a top decision-
Given the importance of price as a purchase decision criteria, it is surprising that the environmental impact of a product can drive a premium price from many consumers.

10 | Mobility Takes Center Stage
Figure 5. Spending on Consumer Technologies in the Past 12 Months
33%
29%
16%
11%
7%
4%
Less than $500
$500 to less than $1500
$1500 to less than $3000
$3000 or more
Have not spent any money on consumer electronics in the past year
Don’t know
Figure 6. Factors Playing Biggest Role in Purchase Decision
OtherProduct packagingAdvertisementsManufacturer’s websiteMedia coverageInnovative technologiesRecommendations of friends and others you trustConsumer ratings/rankingsPersonal researchPrice
Percentage of Respondents Selecting Factor as Playing the Biggest Role in Purchase Decision
10%11%
13%26%
30%
1%1%2%2%2%
0 5 10 15 20 25 30 35
making factor overall. Both of these factors outweigh other criteria, such as recommendations of friends, consumer ratings or innovative technologies. (An exception is in China, where personal research, recommendations and consumer ratings are more influential in the purchase decision than price.) Marketing appears to have little influence on purchase behavior, as media coverage, advertisements, product packaging and manufacturers’ websites each were cited by 2 percent of consumers or less as a top decision-making factor (Figure 6).
Interestingly, though innovation was chosen as a top purchase decision-making factor by only 10 percent of the global survey respondents, 88 percent of consumers said it was very or somewhat important that the electronics brands they own are perceived as the most innovative technologies. Thus, innovation remains critical for consumer technology companies but may not justify a price premium in consumers’ minds.
On the other hand, a product’s “greenness” may command a higher price. Indeed, 67 percent of respondents said they would pay a premium for technology products that are marked as environmentally friendly. Given the importance of price as a purchase decision criteria, it is surprising that the environmental impact of a product can drive a premium price from many consumers.
Dissatisfaction and returns
Consumers tend to be more dissatisfied with technology services than the technologies themselves, yet both products and services experience very low return percentages among consumers participating in this research. Return rates for computers are triple that of most other devices but are still very low at 6 percent. Mobile phone return rates are double other products (4 percent), while all other devices have a return rate of 2 percent (high-definition TVs and digital photo cameras) or lower
(1 percent for all other devices). “Drop and switch” rates for technology services are also low: between 11 percent and 12 percent for respondents’ most important services (home Internet and mobile phone). This could reflect the reality that in many markets, these services have greatly improved in recent years, thus enabling providers to hold on to a greater proportion of subscribers.
The majority of computers and mobile phones (about two-thirds) were returned because consumers felt they did not work properly. About one-half of portable music players, digital photo cameras and game consoles were returned for this reason. For other devices, reasons for return were more evenly split among the device not working properly, the device not working as consumers thought it should, general dissatisfaction with the product or consumers finding something they liked better (Figure 7).

11 | Mobility Takes Center Stage
Figure 7. Reasons for Returning Selected Consumer Electronics
Other
Decided it was too expensive
Decided I no longer wanted the product
Changed my mind
Found comparable product I liked better
Didn’t work like I had hoped it would
General dissatisfaction
Didn’t work properly
eBook
Netbook
Computer
Web-enabled mobile device
Mobile phone
0 10 20 30 40 50 60 70

12 | Mobility Takes Center Stage
• There is clearly much greater demand for consumer technologies in general in emerging markets than mature ones—adoption, spend and use are all higher in emerging markets.
• Mobile technology is especially coveted by emerging-market consumers.
• Innovation and environmental friendliness are more often major drivers of purchase decisions among consumers in emerging markets than in mature ones.
• Emerging-market respondents are much more likely than their mature-market counterparts to take full advantage of the activities available on any one technology.
Research Highlights
consumers also are more than twice as likely (64 percent versus 29 percent) to say their mobile phone or smartphone is their most important technology.
Further demonstrating the high value emerging markets place on “being mobile” is their use of mobile services. While emerging markets equal mature markets in their use of more longstanding or traditional technologies such as computers, the former rank the importance of home Internet connection lower than mobile connections. Further- more, emerging markets more often use mobile phone service than home Internet service; in mature markets, the reverse is true: 54 percent of emerging-market respondents ranked mobile phone service as the service most frequently used (versus 22 percent of mature-market respondents), while 29 percent of emerging-market respondents ranked home Internet as their most frequently used service (compared with 57 percent of mature-market respondents).
Emerging Markets Are the Engine for Consumer Technology AdoptionTo gain further insights into consumer attitude and buying trends, Accenture analyzed the differences between consumer technology preferences and behavior in mature markets and emerging markets. For the purpose of analysis, we grouped the United States, Japan, France and Germany together as mature markets, or those where technology products and services have been available for many years and the economies are well developed. We grouped India, China, Malaysia and Singapore together as emerging markets, in which technology adoption and substantial economic development has been more recent. As discussed in the following section, some of the differences between the two groups are quite dramatic and clearly support the notion that the strongest markets today for consumer technologies are emerging markets.
Mobility as a driver of technology selection
Our survey results clearly show there is much greater demand for mobile technology (such as mobile phones, MP3 players, portable gaming systems and netbooks) among emerging-market respondents than those in mature markets. Consumers in emerging markets more frequently own mobile technologies, are more likely to buy them in the near future and more often use all of a product’s functionality. For example, Web-enabled mobile devices are owned by 42 percent of emerging-market respondents but only 17 percent of mature-market respondents. In China, 59 percent of respondents own Web-enabled mobile devices versus only 7 percent of respondents in Japan. And, netbooks are owned by 20 percent of emerging-market respondents, (including 26 percent of Chinese consumers) versus 9 percent of mature-market respondents including only 6 percent of French consumers (Figure 8). Emerging-market
Accenture | 12

13 | Mobility Takes Center Stage
Emerging markets
Mature markets
0 20 40 60 80 100
3-D television
eBook
BluRay player
Netbook
GPS device
Digital video recorder for TV
Portable gaming device
Digital video camera
VCR
Game console
Portable music player
High-definition plasma or LCD TV
Regular (CRT or tube) TV
DVD player
Digital photo camera
Web-enabled mobile phone/smartphone
Mobile Phone
Computer (desktop or laptop)
Figure 8. Consumer Technology Products Owned in Emerging Markets versus Mature Markets

14 | Mobility Takes Center Stage
An explosion in demand
Consumers in emerging markets also invest more—and more frequently—in their preferred technologies than the mature-market respondents. Indeed, the former were twice as likely to report having bought a mobile or smartphone in the past year (67 percent versus 32 percent) and twice as likely to have said they purchased a computer in the past 12 months (40 percent versus 20 percent). And across all technology choices, more respondents in emerging markets than mature ones expect to buy new technologies in the next 12 months (Figure 9).
Furthermore, emerging-market consumers spent more money than their mature-market counterparts in the past year. Ninety-one percent of emerging-market respondents spent money on technology last year, with 24 percent spending less than $500 and 67 percent more than $500. Spending was the highest in India, where 77 percent spent more than $500 per person, including 18 percent who spent more than $3,000. Conversely, 78 percent of mature-market respondents spent money on technology last year, with 33 percent spending less than $500 and 44 percent spending more than $500. Unlike consumers in India, just 6 percent of those in the United States, France and Germany spent more than $3,000 on technology each in the past year. It is clear from these figures that as countries such as China and India experience explosive middle-class growth, consumers are eager to spend their newly gained disposable income on consumer technologies (Figure 10).
Figure 9. Mature Versus Emerging Markets Recent and Planned Consumer Technology Purchases
Emerging markets: plan to purchase next year
3-D television
eBook
BluRay player
Netbook
GPS device
Digital video recorder for TV
Portable gaming device
Digital video camera
VCR
Game console
Portable music player
High-definition plasma or LCD TV
Regular (CRT or tube) TV
DVD player
Digital photo camera
Web-enabled mobile phone/smartphone
Mobile Phone
Computer (desktop or laptop)
Emerging markets: purchased in last year
Mature markets: plan to purchase next year
Mature markets: purchased in last year
0.0 0.1 0.2 0.3 0.4 0.5 0.6

15 | Mobility Takes Center Stage
India
China
Malaysia
Singapore
Japan
Germany
France
United States
Emerging Markets
Mature Markets
0 10 20 30 40 50
Don’t know
$3000 or more
$1500 to less than $3000
$500 to less than $1500
Less than $500
Have not spent any money on consumer electronics in the past year
Figure 10. Spending on Consumer Technologies in the Last Twelve Months (by Country)
Figure 11. Interest in Environmentally Friendly Technology Products
India
China
Malaysia
Singapore
Japan
GermanyFrance
United States
Emerging Markets
Mature Markets
Yes
No
0.0 0.2 0.4 0.6 0.8 1.0 1.2Percentage of Respondents Willing to Pay a Premium for a Product Marked as Environmentally Friendly

16 | Mobility Takes Center Stage
The importance of innovation and sustainability
Innovation is more often a primary driver of purchase decisions among consumers in emerging markets than in mature ones (15 percent of the former versus 6 percent of the latter ranked innovation as a factor). In fact, 94 percent of respondents in emerging markets said it was important to them that the brands they buy are perceived as the most innovative technologies, compared with 82 percent of respondents in mature markets. Innovation is especially important in India, where it ranks second only to personal research as the top decision-making factor for technology purchase. Perhaps this drive for innovative technologies explains why consumers in emerging markets appear less loyal to their technology, as they
report purchasing technologies more frequently and spending more overall on technologies than those in other parts of the world.
One of the most surprising findings of our research involves sustainability. Eighty-four percent of respondents in emerging markets said they would pay a premium for a product marked as being more environmentally friendly. This is 34 points higher than the percentage of consumers in mature markets who would accept a higher price to “go greener.” At a specific country level, differences in attitudes toward sustainability were even more pronounced, with virtually all—98 percent—of the Chinese respondents indicating they would pay a premium for products that were environmentally friendly, compared with 84 percent in India, 42 percent in the United States and Germany, and 49 percent in Japan (Figure 11).
Taking full advantage of technology functionality
The differences were also dramatic between emerging and mature markets in the activities that respondents engage in with technologies. In general, respondents in mature markets reported far less innovative use of technology than those in emerging markets. With a greater desire for all different kinds of technology, emerging-market respondents take full advantage of the activities available on any one technology. The net result is the breadth of technology use is much greater among emerging-market respondents.
More than 90 percent of respondents in both markets at least occasionally email from a PC, search for information on the Internet and watch TV. But in most other activities, there is a 15- to 20-point difference in the percentages reported by the two groups, with more respondents in emerging markets than
Eighty-four percent of respondents in emerging markets said they would pay a premium for a product marked as being more environmentally friendly.
mature markets at least occasionally engaging in those activities. For instance, 78 percent of emerging-market respondents, versus only 58 percent of those in mature markets, at least occasionally listen to music online (Figure 12). And surprisingly, 40 percent of respondents in mature markets reported they use their mobile phone only for making phone calls (versus 19 percent in emerging markets).
As technology brings greater connectivity with the rest of the world, emerging-market respondents are taking full advantage. These consumers are more often texting and more likely to use technology in an interactive way (such as blogging and texting). The differences are substantial in the amount of time emerging-versus mature-market respondents spend reading and writing blogs, participating in communities of interest and social networks, and playing video games on a mobile phone.
Consistent with their greater time spent using social networking sites, emerging-market respondents use more of such sites—in some cases, at double or triple the rate of their mature-market counterparts. For instance, 14 percent of emerging-market respondents have used Zorpia occasionally, versus 2 percent of mature-market respondents. In some cases these findings may be largely driven by the fact that some sites are not truly global, but rather are primarily regional or even country-focused. But even well-known global brands such as Facebook appear to have greater popularity in emerging markets. Indeed, 69 percent of emerging-market respondents have used Facebook occasionally, compared with 38 percent of mature-market respondents.

17 | Mobility Takes Center Stage
Figure 12. Mature Versus Emerging Market Participation in Technology-Based Activities
Watching TV shows/movies on the internet
Emerging markets
Mature markets
Microblogging
Watching videos on a mobile phone or other mobile device
Writing blogs or contributing to online references such as Wikipedia
Playing video games on the go (on handheld game device or phone)
Emailing from a mobile device
Participating in communities of interest on the Internet
Reading blogs or listening to podcasts
Listening to music on an iPod or other portable music player
Playing video games at home (on console or PC)
Connecting with people on social networking sites
Watching/posting videos on the Internet
Listening to music online
Managing personal digital photos and videos on the Internet
Working from home
Watching TV on TV
Searching for/reading news and information on the Internet
Emailing from a PC
Percentage of Respondents Whom Have at Least Occasionally Participated in the Activity
0.0 0.2 0.4 0.6 0.8 1.0 1.2

18 | Mobility Takes Center Stage
frequency in the past year include high-definition plasma or LCD TVs (Boomer ownership grew 41 percent in one year), portable music players and game consoles. Products experiencing a decline in ownership include older technologies such as DVD players, regular TVs and VCRs (Figure 14).
While both mobile phones and computers remain the most valued technologies for US consumers, the former has surpassed the latter in importance: when combined as a group, Web-enabled mobile phones and regular mobile phones are the most important technologies to 47 percent of US consumers (versus 36 percent for computers). Home Internet access is the most important service to consumers, but, reflecting the rise of mobile phones themselves, mobile phone service also has increased in importance. Cable/satellite TV saw the greatest decline in the percentage of US consumers choosing it as their most important service.
US Consumers Continue Their Adoption of Mobility and Social Networking TechnologyWith this 2009 survey, Accenture now has data on consumer technology adoption, importance and usage among US consumers spanning the past three years. While some of the research areas have changed to stay consistent with the most contemporary issues and technologies, many have remained, which enables us to present some of the most interesting trends since our research began in 2007.
Purchasing and spending despite the US recession
Despite the impact of the global recessions, US consumers spent more money on consumer technologies in the past year than in prior years. While 11 percent of US respondents did not spend any money on electronics this
year (versus 12 percent and 13 percent in prior years), the percentage spending less than $500 decreased by 14 points (from 43 percent a year ago to 29 percent in the past 12 months) while the percentage spending $500 to more than $3,000 increased from previous years and the percentage spending between $500 and $1500 grew from 27 percent last year to 33 percent this year. At the highest end of the spectrum, the percentage spending more than $1,500 grew from 16 percent last year to 23 percent this year (Figure 13).
While computers and mobile phones held steady as the technology owned by the greatest majority of US respondents, Web-enabled mobile phone ownership has more than tripled in two years. In fact, among the Baby Boomer generation, Web-enabled mobile phone ownership grew 75 percent in one year (from 8 percent owning one to 14 percent owning one). Other products growing significantly in ownership
• US consumers spent more money on consumer technologies in the past year than in prior years, despite the economic downturn.
• Web-enabled mobile phone ownership has more than tripled in two years, largely driven by the enthusiastic adoption by Baby Boomers, and mobile phones have replaced computers as US consumers’ most important technology.
• Consumers in the United States are doing more activities, and doing them more frequently, with their technologies than they did the previous two years.
• Social networks have become a mainstay of US consumer technology users, with the percentage of all US consumers using social networking sites almost doubling in the past year.
Research Highlights
Accenture | 18

19 | Mobility Takes Center Stage
Our research also found that social networks have become a mainstay of US consumer technology users. The percentage of all US consumers using social networking sites almost doubled in the past year (from 43 percent to 75 percent)—a much more dramatic rate of growth than in the prior year (when the percentage of consumers using social networking sites rose from 31 percent to 43 percent). Fully three quarters of US consumers are now users of social Internet sites, with the most dramatic growth in usage occurring among the Baby Boomer generation. Use of social networking sites among US Boomers grew 164 percent in one year, from 22 percent using social networking to 58 percent participating. US consumers said they use such sites mostly to reconnect and stay in touch with old friends and to network for business purposes, and less to make new friends (Figure 16).
Exponentially expanding the use of technology applications
One of the biggest areas of change during the past three years is the breadth of activities that US consumers are engaging in with their technology products. Across most activities, the percentage of US consumers at least occasionally doing the activity increased (in many cases dramatically) in the past year, with participation in activities increasing at a far greater rate in 2009 than in prior years. For instance, the percentage of consumers spending at least 15 hours a week searching for news on the Internet doubled between 2008 and 2009. Furthermore, consumers have spent more time using innovative technologies at the expense of older technologies—for instance, the percentage of consumers spending at least 15 hours a week watching TV fell by almost 50 percent in the past year (Figure 15).
The percentage of all US consumers using social networking sites almost doubled in the past year.
Figure 13. Trends in US Spending on Consumer Technologies
Don’t know
$3000 or more
$1500 to less than $3000
$500 to less than $1500
Less than $500
Have not spent any money on consumer electronics in the past year
2007
2008
2009
0 10 20 30 40 50Percentage of Respondents Spending in Each Category Each Year

20 | Mobility Takes Center Stage
Our latest research contains many findings that further support the perception that younger consumers demonstrate greater technology ownership and usage. We analyzed our 16,000 respondents in three generations: Gen Y (those 18 to 25 years of age), Gen X (those between 25 and 34 years old) and Baby Boomers (those between 35 and 62 years of age). Overall differences in technology ownership and use trended with age. The most dramatic differences were between Baby Boomers and Gen Y, with Gen X seeming to fall in the middle, across all areas queried. This substantiates that how, and how often, people use technology is clearly evolving with each generation.
Baby boomers are far from technology illiterate, but also not as technology savvy as their younger counterparts. Boomers have adopted specific technologies and applications (such as computers and emailing) quite extensively; but there are many technologies and applications that few have purchased or used. Younger respondents have bought more and plan to buy more technologies and services than Gen X and Boomer generations. While Gen Y consumers do buy computers, these consumers prefer mobile phones, portable music players, game consoles, and netbooks—mirroring the profiles of consumers in emerging markets. And, 67 percent of Gen Y respondents at least occasionally use Facebook, by far the most
frequently used social networking site. Conversely, only 39 percent of Boomers use Facebook (although, as noted elsewhere in this report, Boomers’ use of Facebook is growing dramatically).
Older respondents more often returned products because they believed they didn’t work properly, while younger ones found defects but just as often returned products because they found comparable ones or were disappointed in features or functions. As it is unlikely that a product defect rate would vary among generations of users, one could speculate that older people are more likely to mistakenly believe a product isn’t working correctly when the actual issue could be with consumer usage—not setting up or using a device correctly.
Age also plays a part in the top challenges consumers have with mobile phones. Beyond battery life, which frustrates everyone, older people have more trouble with keyboard and screen size. Younger people more often cite problems with the touchscreen. These are important considerations for companies targeting new technology products to the Boomer generation and suggest opportunities to adapt product design to attract and strengthen loyalty among older customers.
Generational Differences Remain Strong Influencers of Consumer Electronics Purchases

21 | Mobility Takes Center Stage
Figure 14. Trends in US Ownership of Consumer Technologies
Digital video recorder for TV
Portable gaming device
Digital video camera
VCR
Game console
Portable music player
2007
2008
2009
Percentage of US Respondents Owning the Technology Product0 20 40 60 80 100
High-definition plasma or LCD TV
Regular (CRT or tube) TV
DVD player
Digital photo camera
Web-enabled mobile phone/smartphone
Mobile Phone
Computer (desktop or laptop)

22 | Mobility Takes Center Stage
0 10 20 30 40 50 60 70 80 90 100
Watching videos on a mobile phone or other mobile device
Writing blogs or contributing to online references such as Wikipedia
Playing video games on the go (on handheld game device or phone)
Emailing from a mobile device
Participating in communities of interest on the Internet
Reading blogs or listening to podcasts
Listening to music on an iPod or other portable music player
Playing video games at home (on console or PC)
Connecting with people on social networking sites
Watching/posting videos on the Internet
Listening to music online
Managing personal digital photos and videos on the Internet
Working from home
Watching TV on TV
Searching for/reading news and information on the Internet
Emailing from a PC
2007
2008
2009
Figure 15. Trends in US Participation in Technology-Based Activities
Figure 16. Trends in US Respondents Using Social Network Sites
Gen Y
Baby Boomers
Total US Respondents
2008
2009
Percentage of Respondents Using Social Network Sites
0 10 20 30 40 50 60 70 80 90 100
81%87%
22%58%
43%75%

23 | Mobility Takes Center Stage
how to set up and use the devices. Companies could increase customer satisfaction and reduce the time and cost associated with handling and processing returns of non-defective items if they not only provided greater initial support and training to customers as a standard service but also enacted efforts to more accurately determine the reasons for product returns. For example, Accenture research on returns in the communications and high-tech industry3
suggests that total landed costs for returns are about 5 percent to 6 percent of revenues for manufacturers and 2 percent to 3 percent of sales for retailers. Accenture believes consumer technology manufacturers and retailers have an opportunity to transform the state of returns by using disciplined analysis of their returns strategies, processes and costs to identify the actions necessary to reduce costs and substantially improve profitability. The potential savings associated with such an approach can be measured in the tens of millions of dollars for large enterprises.
While it is difficult to find consensus among experts on whether the recession is over and when the economy will improve, there is no doubt that consumers agree on their enthusiasm for the innovative technologies that have changed—and will continue to change—the way they live their lives. With this obvious growing enthusiasm comes great opportunity for consumer technology companies to innovate—not only for the benefit of those hungry consumers, but also to support their ongoing pursuit of high performance.
The results of our most recent study are clear: consumers’ appetite for technology that enriches—and, in many ways, simplifies—their lives remains strong. That certainly is good news for companies that provide such technologies and services, especially at a time when enterprises around the world are working to reignite demand and growth as the economy stabilizes.
For consumer technology manufacturers and retailers, the results of our study have several key implications.
Innovation is key, regardless of the market being served. Although innovation is not the primary driver of the purchase decisions, consumers clearly conveyed their desire for innovative technologies. Thus, companies should view innovation as a core business discipline and ensure their innovation capabilities remain strong and able to move quickly to satisfy burgeoning demand. To that end, consumer technology companies should consider beginning to embrace a consumer-engagement-driven model of innovation—and master-key innovation capabilities that allow them to exercise increasing control of the ecosystem to deliver consumer-focused innovations.1
The ability to gain deep insights into customers’ needs and preferences is a competitive necessity. As our research showed, consumers have dramatically different views of the technology world, depending on age, country or other demographic characteristics. Companies with superior analytical and segmentation capabilities that enable them to deeply understand the needs and preferences of specific customer segments—and subsequently tailor offers to meet those segments’ requirements—may be the winners in the post-recession world.
Emerging markets will remain the locus of the strongest demand for consumer technologies. As countries such as China and India continue to develop middle classes with substantial disposable income, the growth potential of those countries will outpace that of more mature markets. Fulfilling that demand will require robust, highly adaptable supply chains, innovative sales channel strategies and flexible global operations that can get products in the hands of consumers anywhere in the world—and do so profitably.
Sustainability is not a fad and is not going away. Consumers, especially those in emerging markets, clearly indicated their interest in products that have a less-harmful impact on the environment—and are willing to pay more for such products. Manufacturers, thus, need to redouble their own sustainability efforts to increase the “green” quotient of their products. For example, another Accenture research study found that high-performance businesses successfully meet difficult challenges—such as those emerging today around the issue of sustainability—by adopting clear strategies and successfully executing associated changes to the business. Companies anticipating the impact of sustainability on core areas of their operations are the ones that will ultimately be the winners. In fact, organizations that have effectively responded to sustainability challenges are achieving financial benefits as a result.2
Consumers need help learning how to use their new products. So many consumers reporting they returned products (especially mobile phones) because they “didn’t work properly” suggests a sizable proportion of those returns could be because consumers simply did not understand
1 This recommendation is based on the findings of a separate Accenture research effort, “Achieving High Performance in the Consumer Technology Industry: The Critical Role of Innovation.”2 From the Accenture research report “Sustainability and High Performance in the Communications and High-Tech Industry”3 From the Accenture research report “Big Trouble with No Trouble Found: How Consumer Electronics Firms Confront the High Cost of Customer Returns”
Implications for Consumer Technology Companies

About AccentureAccenture is a global management consulting, technology services and outsourcing company, with more than 176,000 people serving clients in more than 120 countries. Combining unparalleled experience, comprehensive capabilities across all industries and business functions, and extensive research on the world’s most successful companies, Accenture collaborates with clients to help them become high-performance businesses and governments. The company generated net revenues of US$21.58 billion for the fiscal year ended Aug. 31, 2009. Its home page is www.accenture.com
Copyright © 2010 Accenture All rights reserved.
Accenture, its logo, and High Performance Delivered are trademarks of Accenture.
This document makes reference to trademarks that may be owned by others. The use of such trademarks is not an assertion of ownership of such trademarks by Accenture and is not intended to represent or imply the existence of an association between Accenture and the lawful owners of such trademarks.
All rights reserved © Accenture 2010. Accenture, its logo, and Accenture High Performance Delivered are trademarks of Accenture. This document is produced by consultants at Accenture as general guidance. It is not intended to provide specific advice on your circumstances. If you require advice or further details on any matters referred to, please contact your Accenture representative.