the 2018 latino - latino.ucla.edu · 5 the latino vote in 2018 for each precinct we compared the...
TRANSCRIPT


2
Matt Barreto, Sonja Diaz, Angie
Gutierrez, Bryan Wilcox-Archuleta,
Ana Oaxaca
@UCLALatino
THE 2018
LATINO
VOTE
latino.ucla.edu/vote .

3
THE LATINO VOTE IN 2018
After the 2018 election, there was considerable speculation about degree of growth in the Latino vote
How much of an increase was recorded, and where?
This report relies on a social science approach to evaluate official election data to draw conclusions about turn out and vote growth
Our team of researchers downloaded more than 20,000 individual voting precincts across eight states with large Latino populations.
Arizona, California, Florida, Nevada, New Mexico, New Jersey, New York, and Texas

4
THE LATINO VOTE IN 2018
These 8 states were critical because heading into
Election Day, they contained 30 House seats that were
rated as “toss-up” or “lean” by Cook1
Across these 8 states, 20 districts flipped from
Republican to Democrat:
CA (7); NJ (4); NY (3); TX (2); FL (2) AZ (1); NM (1)
1 https://www.cookpolitical.com/ratings/house-race-ratings

5
THE LATINO VOTE IN 2018
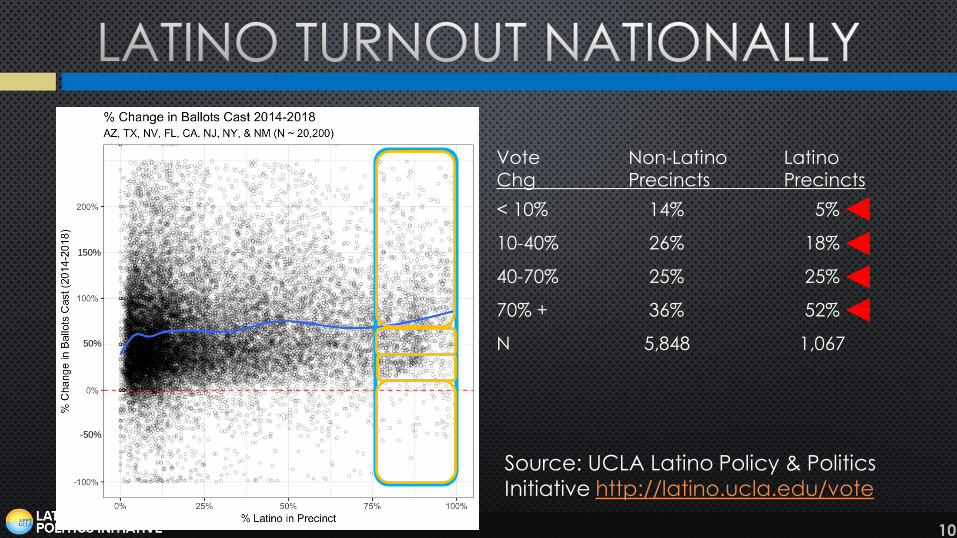
For each precinct we compared the total votes cast in
2014 to the total votes cast in 2018, to generate an
increase in turnout which we call total vote growth.
For each precinct, we report the percent of all voters
who are Latino, using data from Q tool
Thus, for each of the 20,000 precincts, we can
determine what the growth rate was, and whether this
growth rate was higher, or lower, in Latino or non-Latino
areas.

6
150%
50%
-50%X-axis reports what % of all
voters in precinct are Latino

7
150%
50%
-50%
Y-axis reports change in
total votes for each precinct
More votes in 2018
More votes in 2014

8
150%
50%
-50%
Source: UCLA Latino Policy & Politics
Initiative http://latino.ucla.edu/vote

9
Vote Non-Latino Latino
Chg Precincts Precincts
< 10% 14% 7%
10-40% 26% 12%
40-70% 25% 36%
70% + 36% 45%
N 5,848
150%
50%
-50%
Source: UCLA Latino Policy & Politics
Initiative http://latino.ucla.edu/vote
10
Vote Non-Latino Latino
Chg Precincts Precincts
< 10% 14% 5%
10-40% 26% 18%
40-70% 25% 25%
70% + 36% 52%
N 5,848 1,067
150%
50%
-50%
Source: UCLA Latino Policy & Politics
Initiative http://latino.ucla.edu/vote

11
Vote Non-Latino Latino
Chg Precincts Precincts
< 10% 14% 5%
10-40% 26% 18%
40-70% 25% 25%
70% + 36% 52%
N 5,848 1,067
Avg 37% 96%
150%
50%
-50%
Source: UCLA Latino Policy & Politics
Initiative http://latino.ucla.edu/vote

12
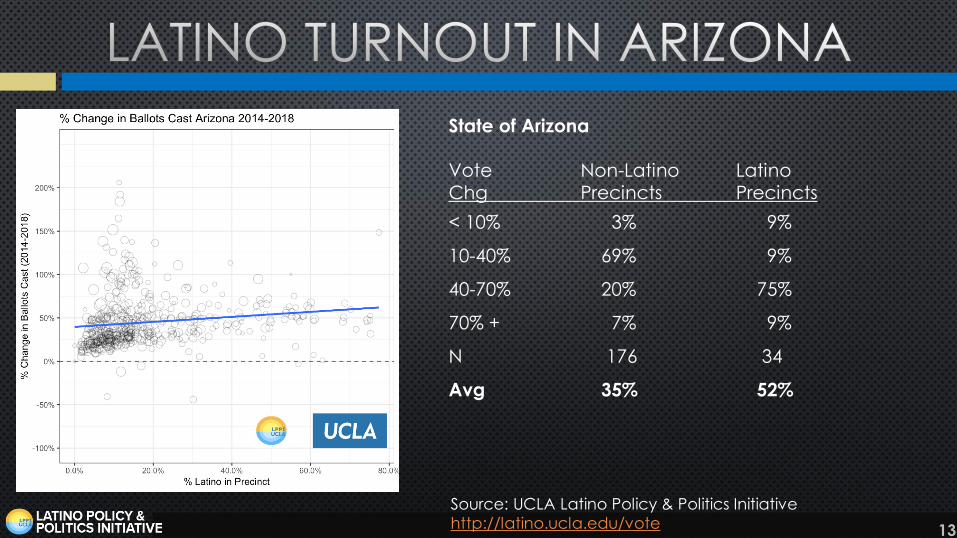
The pattern of
larger growth in
the Latino vote is
consistent across
all states,
evidenced by
the upward
sloping regression
line in each
panel
13
State of Arizona
Vote Non-Latino Latino
Chg Precincts Precincts
< 10% 3% 9%
10-40% 69% 9%
40-70% 20% 75%
70% + 7% 9%
N 176 34
Avg 35% 52%
Source: UCLA Latino Policy & Politics Initiative
http://latino.ucla.edu/vote

14
State of New Mexico
Vote Non-Latino Latino
Chg Precincts Precincts
< 10% 3% 3%
10-40% 74% 44%
40-70% 29% 33%
70% + 4% 19%
N 293 152
Avg 23% 51%
Source: UCLA Latino Policy & Politics Initiative
http://latino.ucla.edu/vote
15
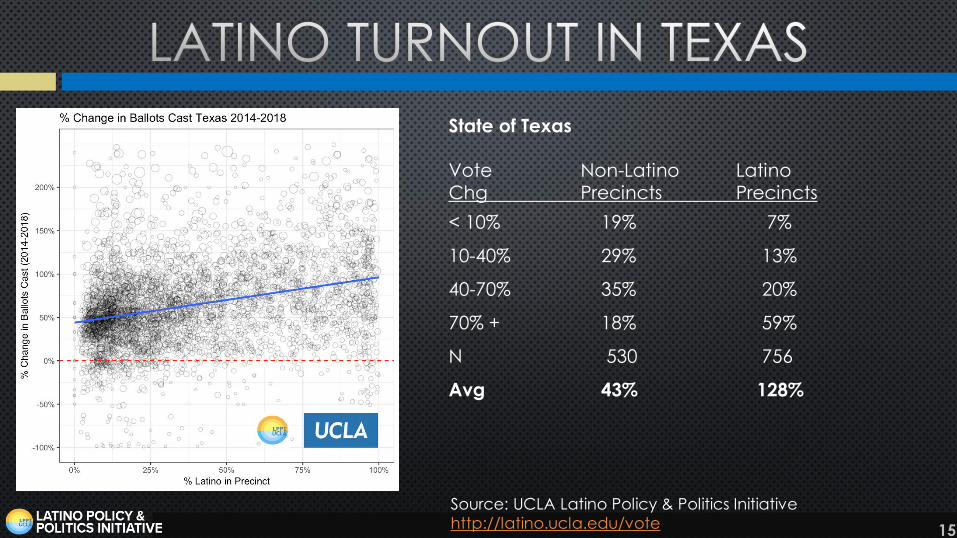
State of Texas
Vote Non-Latino Latino
Chg Precincts Precincts
< 10% 19% 7%
10-40% 29% 13%
40-70% 35% 20%
70% + 18% 59%
N 530 756
Avg 43% 128%
Source: UCLA Latino Policy & Politics Initiative
http://latino.ucla.edu/vote

16
State of Florida
Vote Non-Latino Latino
Chg Precincts Precincts
< 10% 6% 2%
10-40% 66% 54%
40-70% 23% 22%
70% + 4% 22%
N 281 281
Avg 34% 57%
Source: UCLA Latino Policy & Politics Initiative
http://latino.ucla.edu/vote

17
State of New York
Vote Non-Latino Latino
Chg Precincts Precincts
< 10% 5% 3%
10-40% 11% 8%
40-70% 23% 16%
70% + 60% 74%
N 2110 338
Avg 84% 133%
Source: UCLA Latino Policy & Politics Initiative
http://latino.ucla.edu/vote

18
State of New Jersey
Vote Non-Latino Latino
Chg Precincts Precincts
< 10% 2% 5%
10-40% 19% 3%
40-70% 49% 27%
70% + 30% 65%
N 495 79
Avg 61% 80%
Source: UCLA Latino Policy & Politics Initiative
http://latino.ucla.edu/vote

19
State of Nevada
Vote Non-Latino Latino
Chg Precincts Precincts
< 10% 10% 9%
10-40% 29% 3%
40-70% 34% 1%
70% + 26% 87%
N 525 32
Avg 55% 129%
Source: UCLA Latino Policy & Politics Initiative
http://latino.ucla.edu/vote

20
State of California
Vote Non-Latino Latino
Chg Precincts Precincts
< 10% 32% 7%
10-40% 35% 10%
40-70% 15% 37%
70% + 18% 46%
N 1663 532
Avg 37% 77%-
Source: UCLA Latino Policy & Politics Initiative
http://latino.ucla.edu/vote

21
MEASURING RAW VOTE CHANGE
Key Question: Did Latino precincts register large
increases in raw votes cast, or just a large percent
increase?
Example: If a Latino precinct cast 10 votes in 2014; and then
it grew to 19 votes cast in 2018, that represents a 90% growth
rate – but in reality it is only 9 new votes
OR – did Latino precincts grow from 400 votes cast to 700
votes cast which represents both large substantive increase
(+300) and also large growth rate (+75%)

22
MEASURING RAW VOTE CHANGE
Comparing the
most heavily non-
Latino precincts to
the most heavily
Latino precincts:
Latino precincts
actually saw a
larger TOTAL VOTE
increase in 2018,
not just a large
percent increase

23
VOTES CAST VS. TURNOUT GROWTH
So far the data has analyzed change in total votes cast from ‘14 to ’18 Vote Growth.
This was measured as percent change from ‘14 to ‘18
While Latino precincts had a substantially higher percent growth in 2018, some questioned whether Latinos also had higher turnout rates or not?
For California, we have total number of reg voters in 2014 and 2018 and can do a deeper dive into turnout rate change from ‘14 to ‘18
24
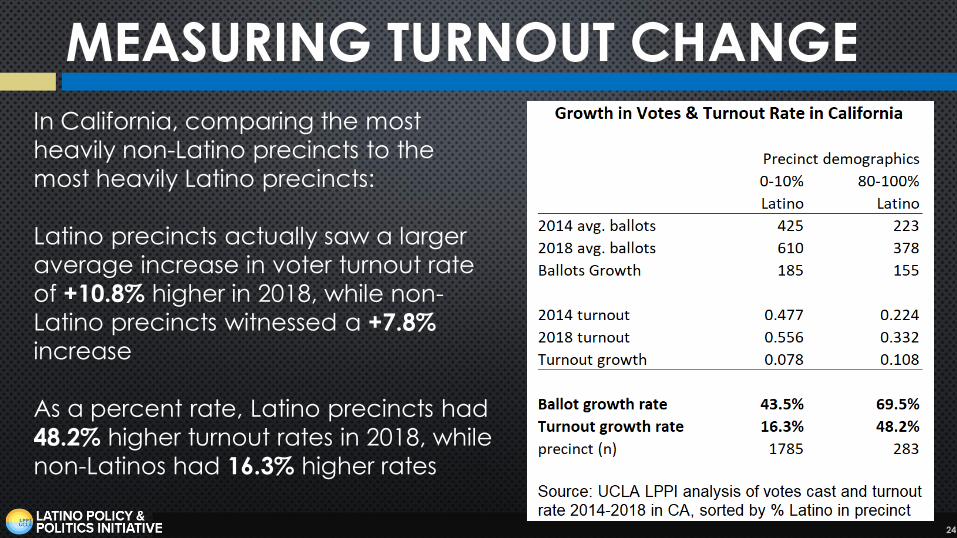
MEASURING TURNOUT CHANGE
In California, comparing the most
heavily non-Latino precincts to the
most heavily Latino precincts:
Latino precincts actually saw a larger
average increase in voter turnout rate
of +10.8% higher in 2018, while non-
Latino precincts witnessed a +7.8%
increase
As a percent rate, Latino precincts had
48.2% higher turnout rates in 2018, while
non-Latinos had 16.3% higher rates

25
MEASURING TURNOUT CHANGE
In California, comparing the most
heavily non-Latino precincts to the
most heavily Latino precincts:
Latino precincts actually saw a larger
average increase in voter turnout rate
of +10.8% higher in 2018, while non-
Latino precincts witnessed a +7.8%
increase
This chart depicts 2014-2018 change in
turnout rate

26
MEASURING TURNOUT CHANGE
In California, comparing the most
heavily non-Latino precincts to the
most heavily Latino precincts:
As a percent rate, Latino precincts had
48.2% higher turnout rates in 2018, while
non-Latinos had 16.3% higher rates
This chart depicts turnout growth rate
percent change 2014-2018
27
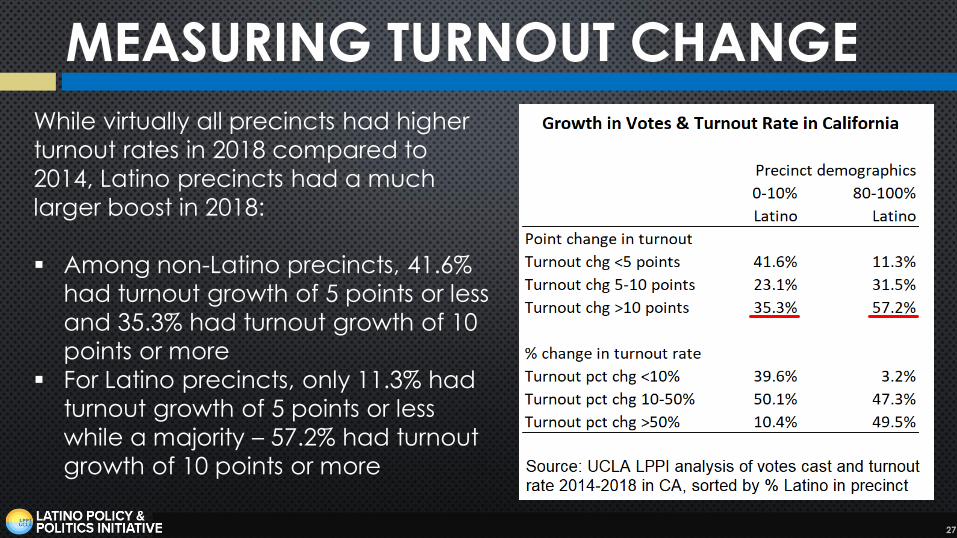
MEASURING TURNOUT CHANGE
While virtually all precincts had higher
turnout rates in 2018 compared to
2014, Latino precincts had a much
larger boost in 2018:
Among non-Latino precincts, 41.6%
had turnout growth of 5 points or less
and 35.3% had turnout growth of 10
points or more
For Latino precincts, only 11.3% had
turnout growth of 5 points or less
while a majority – 57.2% had turnout
growth of 10 points or more

28
TAKE AWAYS ON 2018 VOTE Voter turnout was historic in 2018 and our data clearly show
that the largest growth in ballots cast occurred in majority Latino precincts
This trend was consistent across all eight states analyzed, where the largest vote growth occurred in precincts that were 70%, 80%, or 90% Latino
In contrast there was more modest vote growth in precincts that were under 10% Latino
Overall this comprehensive dataset of official election results provides very clear evidence of substantial growth in the Latino vote in 2018

29
TAKE AWAYS ON 2018 VOTE
In many of these states, but
especially California, New
Jersey, and New York the
Latino vote growth was
responsible for flipping multiple
House seats to the Democrats.
In some cases House seats
flipped by just 2% or 3%, and
this research has documented
Latino turnout growth of over
100% compared to 2014 in
many instances.
