the 2019 virginia assessment / sales ratio study
TRANSCRIPT

THE 2019 VIRGINIA ASSESSMENT / SALES
RATIO STUDY
Virginia Department of Taxation Post Office Box 565
Richmond, Virginia 23218-0565
January 2021

Table of Contents
Page Introduction 1 Results of the 2019 Assessment/Sales Ratio Study 2 Figure 1 Frequency Distribution of the Median Ratio - 2019 2 Figure 2 Frequency Distribution of the Coefficient of Dispersion - 2019 2 Figure 3 Frequency Distribution of the Nominal Tax Rate - 2019 3 Figure 4 Frequency Distribution of the Effective Tax Rate - 2019 4 Table 1 Latest Effective Reassessment, Number of Sales, Median 5
Assessment/Sales Ratio, Coefficient of Dispersion, and Total Fair Market Value for Virginia Localities - 2019
Table 2 Ratios of 2019 Assessed Valuations to 2019 Selling Prices of 8
Real Estate for Selected Classifications of Property Table 3 Nominal and Effective True Real Property Tax Rates in Virginia 26
Counties and Cities - 2018 & 2019 Table 4 Estimated True Full Value of Locally Taxed Property in Virginia 29
Counties and Cities - 2019, Real Estate and Public Service Corporations
Table 5 Estimated True Value Per Capita of Locally Taxed Property in 32
Virginia Counties and Cities - 2019, Real Estate and Public Service Corporations
Appendix 1 Methodology and Terms 35
Appendix 2 Number of Sales Included in the 2019 Assessment/Sales 37
Ratio Study Appendix 3 Computations for State Median Ratio 40

THE 2019 VIRGINIA ASSESSMENT/SALES RATIO STUDY
Introduction
In accordance with Section 207 of Title 58.1 of the Code of Virginia, the Virginia
Department of Taxation conducts an annual real property Assessment/Sales Ratio Study covering every city and county in the Commonwealth. This report summarizes the results of the 2019 Study. The Study estimates the existing assessment/sales ratio for each locality by comparing assessed values to the selling prices of bona fide sales of real property. A locality's total fair market value of real estate, divided by its assessment/sales ratio, produces an estimate of the locality's total true (full) value of real estate. The local true values developed in this Study are used as a factor in Virginia's basic school aid distribution formula. The Study also determines the effective local true tax rates across the Commonwealth. The effective true tax rate (expressed per $100 of true value) provides an appropriate means of comparing tax rates on similar properties in different taxing jurisdictions. The Study also serves as an element in the determination of assessment levels of public service corporation property in each locality of the Commonwealth. Finally, the Study evaluates the level of uniformity in the assessment of real property within and across jurisdictions of the Commonwealth.
The 2019 assessment/sales ratios are calculated from a statistical sample of all fair market real estate sales in tax year 2019, with all bona fide sales used in the case of smaller localities. The Department of Taxation allows localities to file all of their real estate transactions directly with the Department in a prescribed format. Approximately 118,034 sales are used in this Study. For each selected parcel, its assessed value in tax year 2019 is compared to its sale price to calculate an assessment/sales ratio. The best indicator of a locality's overall assessment/sales ratio is the median, or midpoint of the ratios when arrayed by value. The median ratio captures the performance of the real estate market; a low median ratio indicates a strong market. However, a median ratio close to or in excess of 100% (where assessed values closely approximate sales prices) may indicate that a reassessment has been undertaken recently, or may indicate a weak market. Reassessment cycles in Virginia range from annual to every six years.
The Study uses standard statistical measures, such as the coefficient of dispersion and the regression index, to examine the level of uniformity in the assessment of real property within and across jurisdictions in Virginia. The coefficient of dispersion is based on the average absolute deviation as recommended by the International Association of Assessing Officers (IAAO). It measures how closely individual ratios are grouped around the median; the smaller the measure of dispersion, the greater the uniformity of the ratios. The regression index compares the treatment of less expensive property with that of more expensive property. It evaluates the relative tax burdens of owners of low valued properties and owners of high valued properties. The statistical terms, methodology used for computation, and the sources of data are detailed in the appendices.
1

Results of the 2019 Assessment/Sales Ratio Study
Median Ratio and Coefficient of Dispersion
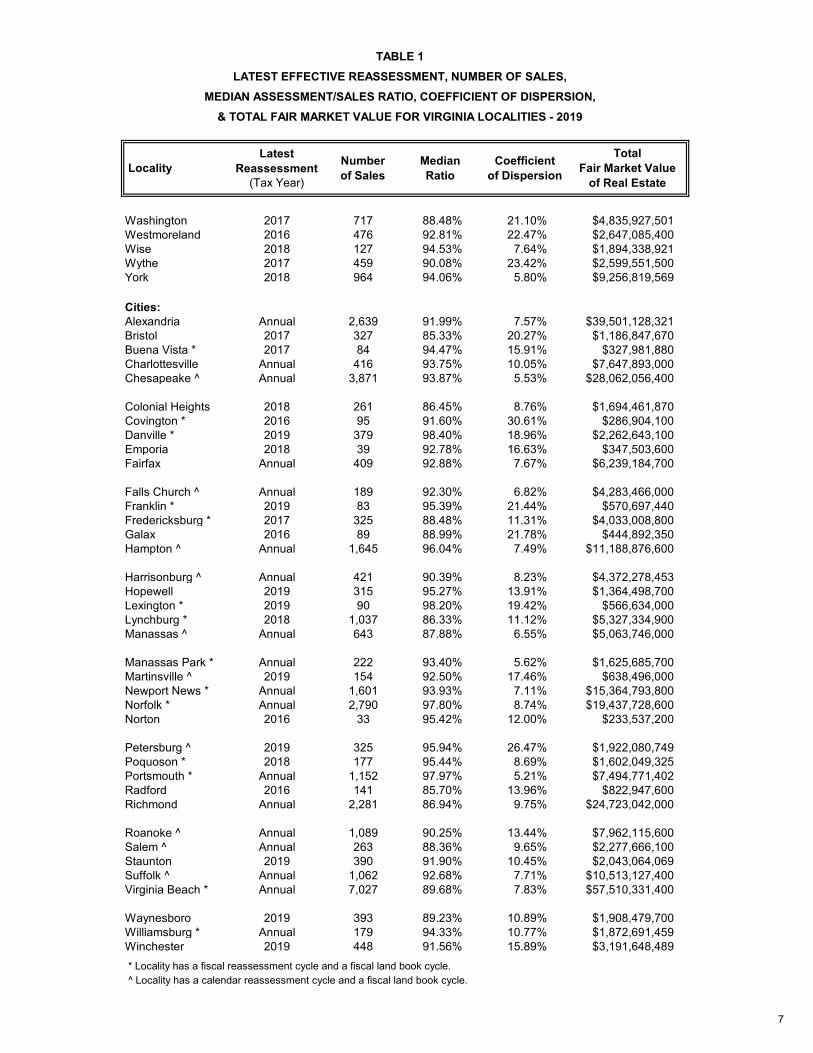
Table 1 contains the median assessment/sales ratio and the coefficient of dispersion for every county and city in the Commonwealth. Table 1 also shows the total fair market value of real estate, the number of sales in the sample, and the latest year of reassessment, which are among the several factors that affect the median ratio and the coefficient of dispersion. Per the IAAO Standards on Ratio Studies, an appraisal level between 90% and 110% is considered acceptable for any class of property. Figure 1 indicates that the 2019 median ratio ranges between 90% and 110% for 58 of Virginia's 95 counties and 27 of its 38 cities. All 133 localities have assessment levels between 70% and 130%, the parameters set forth by the Code of Virginia Title 58.1-3259.
Figure 2 indicates that the coefficient of dispersion is less than 20% in 63 counties and
33 cities, and is less than 10% in 17 counties and 17 cities.
2

In addition to the 30 localities that undertake annual reassessments, 24 other localities
(15 counties and 9 cities) had reassessments effective for 2019. Reassessments typically result in higher or lower median ratios as assessed values are brought into line with selling prices. Title 58.1, Sections 3201 and 3259 of the Code of Virginia require that real estate reassessments be at 100% of fair market value.
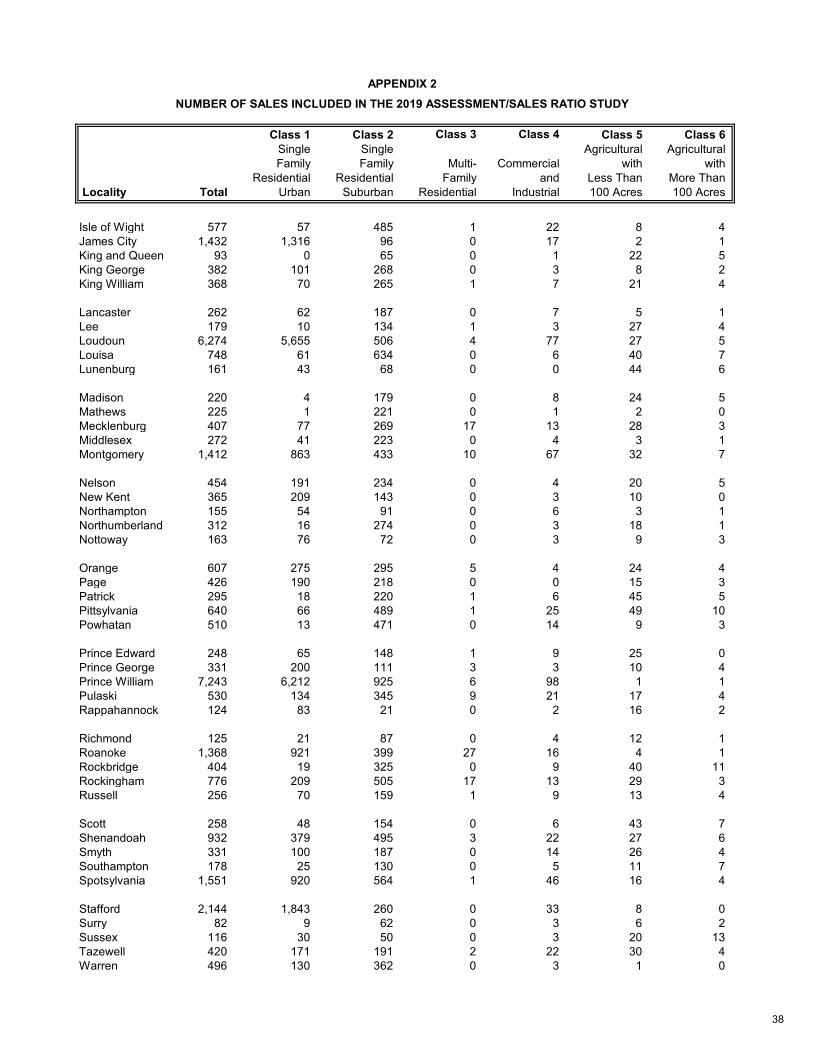
The sample used in this Study consists of 118,034 sales, covering six classes of property. Table 2 examines the variation in median ratios across localities for all six classes: (1) single-family residential urban, (2) single-family residential suburban, (3) multi-family residential, (4) commercial and industrial, (5) agricultural / undeveloped 20 -100 acres, (6) agricultural / undeveloped over 100 acres. Sales in the single-family residential urban and suburban classes dominate the total sample, with 81,510 class 1 urban sales and 30,975 class 2 suburban sales. A breakdown of sample points, by locality and property class, is given in Appendix 2. Nominal and Effective Tax Rates
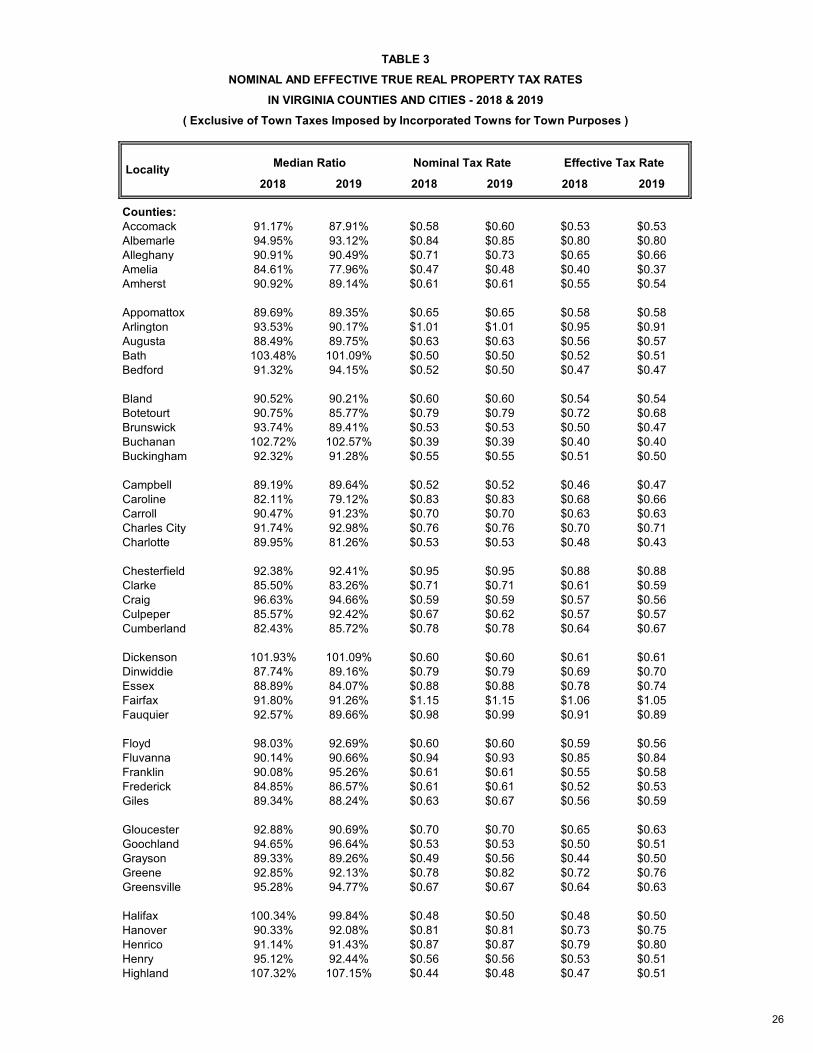
Table 3 provides the nominal and effective true tax rates for 2018 and 2019 for each locality. The 2019 median assessment/sales ratio for Virginia was 89.10%, a decrease from 89.76% in 2018. The steps in the computation of Virginia’s median ratio are detailed in Appendix 3. The 2019 nominal tax rate for the Commonwealth was equal to $0.9934 per $100 of assessed value, while the estimated effective tax rate for the Commonwealth was $0.8851 per $100 of true value. Figure 3 shows that the nominal tax rate for 67 of Virginia's 95 counties was less than $0.80 per $100 of assessed value. The nominal tax rate was greater than or equal to $1.00 per $100 of assessed value in 25 of Virginia’s 38 cities.
Localities' effective true tax rates tend to be somewhat lower than their nominal tax rates.
Figure 4 shows that effective tax rates were less than $0.80 per $100 of true value for 83 of the 95 counties, and were greater than or equal to $1.00 per $100 of true value for 20 of the 38 cities.
3

Estimated True Value of Property
Table 4 provides the total estimated true full value of locally taxed property for real estate and public service corporations. The total estimated true value for Virginia was over $1.366 trillion in 2019, which is approximately 4.3% higher than the figure for 2018. The estimated true value of real estate excluding public service corporations (the total fair market value reported in the local land book divided by the median assessment/sales ratio for the locality) was over $1.312 trillion, which is approximately 4.3% higher than in 2018. Total estimated true value of public service corporations was over $53 billion; that figure includes the value reported by the State Corporation Commission, as well as, the estimated true value of railroad and interstate pipeline transmission property.
Table 5 provides the per capita estimated true full value of locally taxed property for real estate and public service corporations. Across the Commonwealth, total estimated true value averaged $160,044 per capita. While estimated population in Virginia increased by about 0.21% from 2018 to 2019, the estimated true value per capita increased about 4.06%.
4

Counties:Accomack 2018 620 87.91% 21.99% $3,660,008,300Albemarle Annual 1,479 93.12% 9.12% $20,552,760,100Alleghany 2019 244 90.49% 19.41% $1,121,806,200Amelia 2018 211 77.96% 17.36% $1,292,925,055Amherst 2014 445 89.14% 20.80% $2,652,114,000
Appomattox 2014 278 89.35% 18.87% $1,384,557,000Arlington Annual 2,520 90.17% 7.29% $77,590,138,200Augusta 2019 978 89.75% 14.40% $8,762,829,700Bath ^ 2017 79 101.09% 23.40% $883,391,700Bedford 2019 1,566 94.15% 12.13% $10,252,923,534
Bland 2014 36 90.21% 17.25% $609,548,100Botetourt 2016 536 85.77% 12.84% $3,768,484,703Brunswick 2018 202 89.41% 25.33% $1,304,304,560Buchanan 2015 113 102.57% 24.12% $2,242,165,547Buckingham 2014 186 91.28% 26.02% $1,436,922,800
Campbell 2019 711 89.64% 14.52% $4,388,367,457Caroline 2016 396 79.12% 17.57% $2,855,908,212Carroll 2017 503 91.23% 22.47% $2,349,926,800Charles City ^ 2018 70 92.98% 16.60% $853,256,680Charlotte * 2014 121 81.26% 23.78% $931,051,220
Chesterfield Annual 5,147 92.41% 6.72% $39,063,880,200Clarke 2016 236 83.26% 15.45% $2,406,963,400Craig 2018 78 94.66% 19.07% $515,130,200Culpeper 2019 736 92.42% 10.23% $6,119,583,418Cumberland 2014 188 85.72% 24.20% $863,436,935
Dickenson 2018 82 101.09% 27.79% $1,292,727,200Dinwiddie 2019 227 89.16% 12.89% $2,763,388,613Essex 2017 207 84.07% 24.28% $1,390,992,000Fairfax Annual 16,428 91.26% 6.08% $255,352,668,383Fauquier 2018 1,059 89.66% 12.07% $13,425,985,500
Floyd 2015 267 92.69% 22.41% $1,791,404,700Fluvanna 2019 587 90.66% 15.05% $2,969,880,502Franklin 2016 845 95.26% 12.64% $7,152,725,800Frederick 2019 1,608 86.57% 11.36% $10,954,173,175Giles 2015 221 88.24% 22.19% $1,208,803,700
Gloucester 2017 679 90.69% 16.28% $4,488,767,686Goochland Annual 299 96.64% 8.57% $5,906,644,700Grayson 2016 337 89.26% 32.06% $1,668,133,900Greene 2019 349 92.13% 12.17% $2,314,491,649Greensville 2014 71 94.77% 32.71% $636,966,910
Halifax 2018 336 99.84% 12.26% $2,689,744,036Hanover Annual 1,349 92.08% 6.63% $15,841,039,810Henrico Annual 4,315 91.43% 7.82% $40,391,059,400Henry 2017 375 92.44% 16.32% $2,946,641,700Highland 2018 35 107.15% 16.30% $674,154,200
TotalFair Market Value
of Real Estate
TABLE 1LATEST EFFECTIVE REASSESSMENT, NUMBER OF SALES,
MEDIAN ASSESSMENT/SALES RATIO, COEFFICIENT OF DISPERSION,& TOTAL FAIR MARKET VALUE FOR VIRGINIA LOCALITIES - 2019
LocalityLatest
Reassessment(Tax Year)
Numberof Sales
MedianRatio
Coefficientof Dispersion
5

TotalFair Market Value
of Real Estate
TABLE 1LATEST EFFECTIVE REASSESSMENT, NUMBER OF SALES,
MEDIAN ASSESSMENT/SALES RATIO, COEFFICIENT OF DISPERSION,& TOTAL FAIR MARKET VALUE FOR VIRGINIA LOCALITIES - 2019
LocalityLatest
Reassessment(Tax Year)
Numberof Sales
MedianRatio
Coefficientof Dispersion
Isle of Wight * 2016 577 90.60% 17.04% $4,766,275,619James City ^ 2018 1,432 92.00% 8.01% $12,366,271,650King & Queen 2017 93 93.73% 23.93% $902,427,400King George 2018 382 81.24% 13.79% $2,973,689,239King William 2015 368 75.12% 15.79% $1,409,242,279
Lancaster 2019 262 98.00% 16.07% $2,672,216,300Lee 2016 179 83.16% 24.46% $965,135,982Loudoun Annual 6,274 91.66% 4.56% $85,909,281,920Louisa Annual 748 95.83% 16.38% $5,580,455,500Lunenburg 2018 161 91.19% 20.27% $926,502,400
Madison 2019 220 97.29% 18.26% $2,265,906,900Mathews 2017 225 95.06% 19.33% $1,629,386,500Mecklenburg * 2019 407 96.93% 19.44% $4,284,483,300Middlesex 2017 272 98.36% 18.60% $2,273,920,800Montgomery 2019 1,412 89.24% 13.35% $8,658,132,300
Nelson 2018 454 97.04% 19.20% $2,985,743,250New Kent 2018 365 92.24% 9.58% $3,100,118,703Northampton 2018 155 94.59% 15.75% $1,999,101,400Northumberland 2014 312 97.61% 17.38% $3,047,609,200Nottoway 2018 163 83.26% 25.40% $977,114,191
Orange 2016 607 82.93% 16.85% $4,173,536,200Page 2016 426 91.63% 19.78% $2,520,990,100Patrick 2015 295 96.43% 26.56% $1,582,512,500Pittsylvania 2018 640 97.94% 21.69% $4,829,255,400Powhatan ^ 2018 510 83.36% 15.50% $3,854,983,400
Prince Edward 2015 248 88.81% 25.28% $1,559,337,150Prince George ^ Annual 331 91.95% 8.79% $3,001,941,606Prince William Annual 7,243 90.40% 6.03% $62,427,619,400Pulaski 2015 530 86.20% 22.89% $2,745,847,155Rappahannock 2016 124 98.77% 17.58% $2,168,949,300
Richmond 2015 125 93.63% 26.49% $881,309,994Roanoke Annual 1,368 87.89% 8.33% $8,883,727,000Rockbridge 2017 404 98.63% 19.68% $3,093,716,140Rockingham 2018 776 86.94% 14.88% $9,123,576,400Russell 2019 256 87.65% 26.32% $1,608,993,683
Scott 2016 258 86.84% 26.73% $1,233,910,100Shenandoah 2016 932 87.06% 18.17% $5,018,358,180Smyth 2014 331 85.26% 29.60% $1,600,223,200Southampton 2018 178 93.66% 15.90% $1,822,303,200Spotsylvania 2018 1,551 85.22% 10.54% $15,652,591,400
Stafford 2018 2,144 85.58% 7.31% $17,858,571,201Surry 2016 82 99.10% 19.50% $949,954,600Sussex 2018 116 87.85% 26.18% $898,802,822Tazewell 2018 420 101.43% 22.61% $2,734,336,575Warren 2019 496 94.36% 8.27% $4,979,909,800
6
TotalFair Market Value
of Real Estate
TABLE 1LATEST EFFECTIVE REASSESSMENT, NUMBER OF SALES,
MEDIAN ASSESSMENT/SALES RATIO, COEFFICIENT OF DISPERSION,& TOTAL FAIR MARKET VALUE FOR VIRGINIA LOCALITIES - 2019
LocalityLatest
Reassessment(Tax Year)
Numberof Sales
MedianRatio
Coefficientof Dispersion
Washington 2017 717 88.48% 21.10% $4,835,927,501Westmoreland 2016 476 92.81% 22.47% $2,647,085,400Wise 2018 127 94.53% 7.64% $1,894,338,921Wythe 2017 459 90.08% 23.42% $2,599,551,500York 2018 964 94.06% 5.80% $9,256,819,569
Cities:Alexandria Annual 2,639 91.99% 7.57% $39,501,128,321Bristol 2017 327 85.33% 20.27% $1,186,847,670Buena Vista * 2017 84 94.47% 15.91% $327,981,880Charlottesville Annual 416 93.75% 10.05% $7,647,893,000Chesapeake ^ Annual 3,871 93.87% 5.53% $28,062,056,400
Colonial Heights 2018 261 86.45% 8.76% $1,694,461,870Covington * 2016 95 91.60% 30.61% $286,904,100Danville * 2019 379 98.40% 18.96% $2,262,643,100Emporia 2018 39 92.78% 16.63% $347,503,600Fairfax Annual 409 92.88% 7.67% $6,239,184,700
Falls Church ^ Annual 189 92.30% 6.82% $4,283,466,000Franklin * 2019 83 95.39% 21.44% $570,697,440Fredericksburg * 2017 325 88.48% 11.31% $4,033,008,800Galax 2016 89 88.99% 21.78% $444,892,350Hampton ^ Annual 1,645 96.04% 7.49% $11,188,876,600
Harrisonburg ^ Annual 421 90.39% 8.23% $4,372,278,453Hopewell 2019 315 95.27% 13.91% $1,364,498,700Lexington * 2019 90 98.20% 19.42% $566,634,000Lynchburg * 2018 1,037 86.33% 11.12% $5,327,334,900Manassas ^ Annual 643 87.88% 6.55% $5,063,746,000
Manassas Park * Annual 222 93.40% 5.62% $1,625,685,700Martinsville ^ 2019 154 92.50% 17.46% $638,496,000Newport News * Annual 1,601 93.93% 7.11% $15,364,793,800Norfolk * Annual 2,790 97.80% 8.74% $19,437,728,600Norton 2016 33 95.42% 12.00% $233,537,200
Petersburg ^ 2019 325 95.94% 26.47% $1,922,080,749Poquoson * 2018 177 95.44% 8.69% $1,602,049,325Portsmouth * Annual 1,152 97.97% 5.21% $7,494,771,402Radford 2016 141 85.70% 13.96% $822,947,600Richmond Annual 2,281 86.94% 9.75% $24,723,042,000
Roanoke ^ Annual 1,089 90.25% 13.44% $7,962,115,600Salem ^ Annual 263 88.36% 9.65% $2,277,666,100Staunton 2019 390 91.90% 10.45% $2,043,064,069Suffolk ^ Annual 1,062 92.68% 7.71% $10,513,127,400Virginia Beach * Annual 7,027 89.68% 7.83% $57,510,331,400
Waynesboro 2019 393 89.23% 10.89% $1,908,479,700Williamsburg * Annual 179 94.33% 10.77% $1,872,691,459Winchester 2019 448 91.56% 15.89% $3,191,648,489* Locality has a fiscal reassessment cycle and a fiscal land book cycle. ^ Locality has a calendar reassessment cycle and a fiscal land book cycle.
7

Class 1: Single Family Residential UrbanCounties:Accomack 183 85.49% 20.44% 1.05Albemarle 1,004 93.67% 7.21% 1.00Alleghany 57 91.18% 18.48% 1.02Amelia 9 78.00% 15.35% 1.01Amherst 34 89.23% 15.62% 1.00Appomattox 15 90.07% 21.00% 1.07Arlington 2,481 90.18% 7.15% 1.00Augusta 352 88.31% 9.54% 1.00Bath 35 113.93% 20.91% 1.11Bedford 80 91.28% 11.35% 1.02Botetourt 159 85.25% 9.92% 1.00Brunswick 18 88.38% 21.84% 1.08Buchanan 6 95.69% 26.30% 1.01Buckingham 5 95.98% 9.23% 1.08Campbell 296 89.43% 10.36% 1.01Caroline 81 82.77% 13.12% 1.01Carroll 31 84.90% 23.21% 1.03Charles City 1 89.06% 0.00% 1.00Charlotte 16 89.21% 29.51% 1.12Chesterfield 4,139 92.13% 6.40% 0.99Clarke 79 81.88% 13.53% 1.01Craig 10 113.34% 17.16% 1.06Culpeper 241 92.23% 8.54% 1.01Cumberland 11 75.22% 22.64% 0.99Dickenson 12 107.30% 23.51% 1.09Dinwiddie 4 99.46% 9.32% 1.00Essex 34 84.53% 15.05% 1.03Fairfax 12,342 91.10% 6.17% 1.00Fauquier 260 86.88% 11.01% 1.00Floyd 6 71.21% 16.20% 0.97Fluvanna 325 89.90% 12.33% 1.00Franklin 124 95.99% 9.06% 1.02Frederick 958 87.04% 8.68% 1.00Giles 82 90.14% 18.02% 1.08
TABLE 2RATIO OF 2019 ASSESSED VALUATIONS
TO 2019 SELLING PRICES OF REAL ESTATEFOR SELECT CLASSIFICATIONS OF PROPERTY
Locality Numberof Sales
RegressionIndex
MedianRatio (%)
Coefficient of Dispersion (%)
8

TABLE 2RATIO OF 2019 ASSESSED VALUATIONS
TO 2019 SELLING PRICES OF REAL ESTATEFOR SELECT CLASSIFICATIONS OF PROPERTY
Locality Numberof Sales
RegressionIndex
MedianRatio (%)
Coefficient of Dispersion (%)
Gloucester 156 92.51% 10.92% 1.02Goochland 50 96.42% 6.18% 1.00Grayson 4 77.48% 11.50% 1.00Greene 30 91.95% 6.21% 1.00Greensville 4 87.94% 37.47% 1.10Halifax 78 100.91% 13.14% 1.02Hanover 874 92.08% 5.54% 1.00Henrico 4,045 91.50% 7.48% 1.00Henry 2 92.71% 11.14% 1.00Highland 5 108.82% 12.81% 1.01Isle of Wight 57 87.39% 7.66% 1.00James City 1,316 92.03% 7.71% 1.00King George 101 84.18% 12.40% 0.98King William 70 77.49% 18.04% 1.01Lancaster 62 94.76% 9.78% 1.01Lee 10 86.53% 17.29% 1.01Loudoun 5,655 91.73% 4.11% 1.00Louisa 61 92.05% 19.73% 1.09Lunenburg 43 90.00% 21.29% 1.03Madison 4 94.85% 12.22% 0.98Mathews 1 83.88% 0.00% 1.00Mecklenburg 77 98.27% 19.99% 1.02Middlesex 41 98.48% 14.23% 1.00Montgomery 863 88.42% 10.61% 1.01Nelson 191 100.25% 16.62% 1.04New Kent 209 95.16% 9.02% 0.99Northampton 54 89.10% 16.64% 0.99Northumberland 16 88.21% 15.14% 1.05Nottoway 76 86.99% 22.18% 1.03Orange 275 83.56% 13.27% 1.03Page 190 91.80% 17.32% 1.01Patrick 18 103.70% 15.52% 1.02Pittsylvania 66 95.96% 16.32% 1.04Powhatan 13 94.46% 11.65% 0.99Prince Edward 65 92.70% 20.64% 1.08Prince George 200 91.20% 8.07% 1.01
9

TABLE 2RATIO OF 2019 ASSESSED VALUATIONS
TO 2019 SELLING PRICES OF REAL ESTATEFOR SELECT CLASSIFICATIONS OF PROPERTY
Locality Numberof Sales
RegressionIndex
MedianRatio (%)
Coefficient of Dispersion (%)
Prince William 6,212 90.61% 5.46% 1.00Pulaski 134 84.37% 22.27% 1.04Rappahannock 83 97.97% 16.49% 1.00Richmond 21 90.53% 20.81% 1.12Roanoke 921 87.79% 8.06% 1.01Rockbridge 19 104.33% 14.99% 1.02Rockingham 209 85.31% 11.57% 1.01Russell 70 86.81% 25.86% 1.03Scott 48 94.93% 19.82% 1.03Shenandoah 379 84.13% 14.04% 1.02Smyth 100 81.56% 20.88% 1.03Southampton 25 92.60% 14.76% 0.98Spotsylvania 920 85.50% 7.91% 0.99Stafford 1,843 85.57% 6.94% 1.00Surry 9 96.00% 18.79% 0.99Sussex 30 83.14% 29.37% 0.84Tazewell 171 101.79% 20.82% 1.04Warren 130 92.80% 7.39% 0.99Washington 120 83.63% 23.35% 1.03Westmoreland 158 89.63% 18.60% 1.04Wise 52 96.52% 6.69% 1.00Wythe 173 93.89% 20.99% 1.03York 942 94.02% 5.72% 1.00
Class 1: Single Family Residential UrbanCities:Alexandria 2,569 91.92% 7.39% 1.00Bristol 313 85.45% 20.08% 1.04Buena Vista 80 94.12% 15.29% 1.05Charlottesville 354 93.73% 9.22% 1.01Chesapeake 3,802 93.88% 5.43% 1.00Colonial Heights 250 86.26% 8.76% 1.00Covington 90 90.46% 30.15% 1.13Danville 341 97.50% 18.81% 1.07Emporia 34 91.84% 16.44% 1.02Fairfax 376 92.65% 7.41% 1.00
10
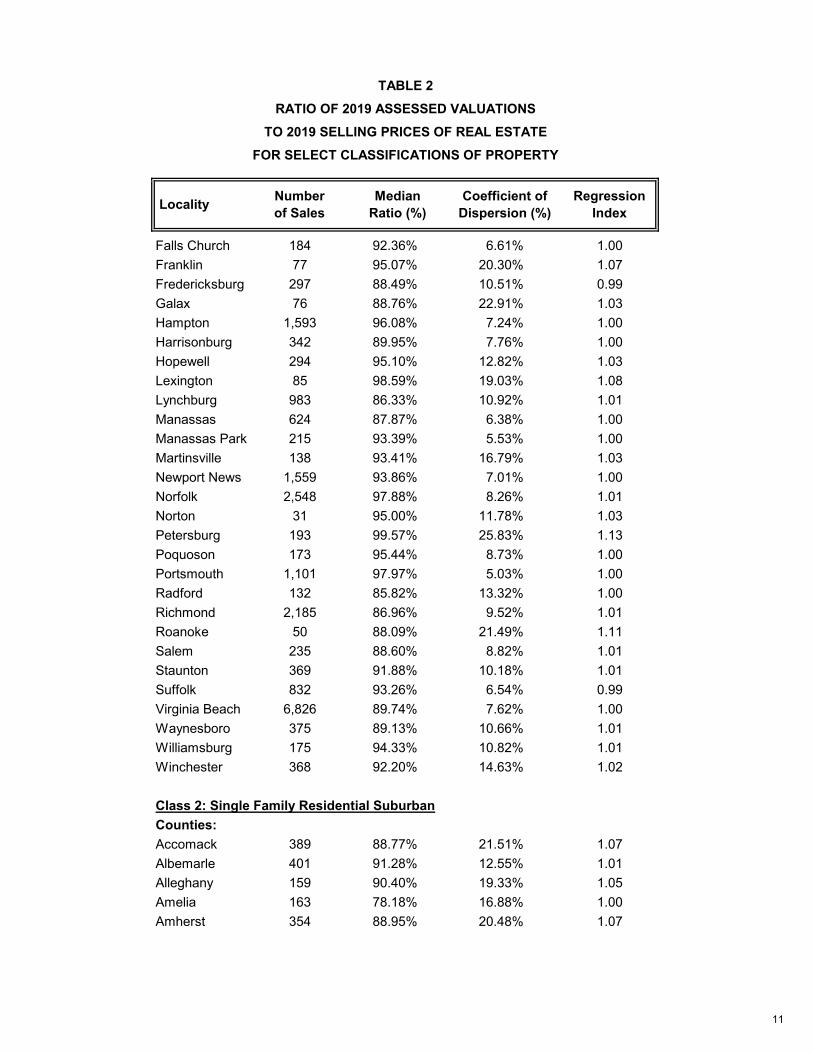
TABLE 2RATIO OF 2019 ASSESSED VALUATIONS
TO 2019 SELLING PRICES OF REAL ESTATEFOR SELECT CLASSIFICATIONS OF PROPERTY
Locality Numberof Sales
RegressionIndex
MedianRatio (%)
Coefficient of Dispersion (%)
Falls Church 184 92.36% 6.61% 1.00Franklin 77 95.07% 20.30% 1.07Fredericksburg 297 88.49% 10.51% 0.99Galax 76 88.76% 22.91% 1.03Hampton 1,593 96.08% 7.24% 1.00Harrisonburg 342 89.95% 7.76% 1.00Hopewell 294 95.10% 12.82% 1.03Lexington 85 98.59% 19.03% 1.08Lynchburg 983 86.33% 10.92% 1.01Manassas 624 87.87% 6.38% 1.00Manassas Park 215 93.39% 5.53% 1.00Martinsville 138 93.41% 16.79% 1.03Newport News 1,559 93.86% 7.01% 1.00Norfolk 2,548 97.88% 8.26% 1.01Norton 31 95.00% 11.78% 1.03Petersburg 193 99.57% 25.83% 1.13Poquoson 173 95.44% 8.73% 1.00Portsmouth 1,101 97.97% 5.03% 1.00Radford 132 85.82% 13.32% 1.00Richmond 2,185 86.96% 9.52% 1.01Roanoke 50 88.09% 21.49% 1.11Salem 235 88.60% 8.82% 1.01Staunton 369 91.88% 10.18% 1.01Suffolk 832 93.26% 6.54% 0.99Virginia Beach 6,826 89.74% 7.62% 1.00Waynesboro 375 89.13% 10.66% 1.01Williamsburg 175 94.33% 10.82% 1.01Winchester 368 92.20% 14.63% 1.02
Class 2: Single Family Residential SuburbanCounties:Accomack 389 88.77% 21.51% 1.07Albemarle 401 91.28% 12.55% 1.01Alleghany 159 90.40% 19.33% 1.05Amelia 163 78.18% 16.88% 1.00Amherst 354 88.95% 20.48% 1.07
11

TABLE 2RATIO OF 2019 ASSESSED VALUATIONS
TO 2019 SELLING PRICES OF REAL ESTATEFOR SELECT CLASSIFICATIONS OF PROPERTY
Locality Numberof Sales
RegressionIndex
MedianRatio (%)
Coefficient of Dispersion (%)
Appomattox 211 87.96% 17.54% 1.06Augusta 547 90.15% 17.05% 1.04Bath 29 100.20% 22.89% 1.11Bedford 1,404 94.22% 11.89% 1.02Bland 28 89.95% 15.90% 1.05Botetourt 335 84.90% 13.81% 1.03Brunswick 134 89.72% 24.14% 1.06Buchanan 87 103.67% 22.71% 1.03Buckingham 140 90.14% 28.03% 1.14Campbell 346 91.14% 16.86% 1.04Caroline 276 75.58% 17.95% 1.03Carroll 414 90.07% 22.73% 1.07Charles City 57 91.20% 16.73% 0.98Charlotte 74 81.23% 22.25% 1.02Chesterfield 913 94.09% 7.04% 0.99Clarke 133 84.41% 15.80% 1.01Craig 42 96.52% 18.04% 1.04Culpeper 443 93.02% 10.09% 1.01Cumberland 130 85.10% 24.19% 1.08Dickenson 60 99.25% 27.26% 1.13Dinwiddie 197 88.63% 11.76% 1.01Essex 151 82.62% 25.20% 1.06Fairfax 3,944 91.67% 5.61% 1.00Fauquier 720 90.55% 11.02% 1.00Floyd 208 91.22% 23.08% 1.06Fluvanna 249 91.41% 17.91% 1.03Franklin 682 95.01% 13.08% 1.01Frederick 588 85.72% 14.54% 1.00Giles 113 86.23% 22.31% 1.09Gloucester 493 89.96% 17.71% 1.06Goochland 232 96.46% 8.91% 1.01Grayson 268 84.83% 32.57% 1.10Greene 295 92.43% 12.12% 1.01Greensville 43 98.00% 29.62% 1.09Halifax 180 98.99% 11.37% 1.02Hanover 445 92.09% 8.48% 0.99
12

TABLE 2RATIO OF 2019 ASSESSED VALUATIONS
TO 2019 SELLING PRICES OF REAL ESTATEFOR SELECT CLASSIFICATIONS OF PROPERTY
Locality Numberof Sales
RegressionIndex
MedianRatio (%)
Coefficient of Dispersion (%)
Henrico 167 90.31% 10.03% 0.99Henry 341 91.97% 15.72% 1.04Highland 17 98.60% 19.79% 1.11Isle of Wight 485 90.60% 16.40% 1.03James City 96 89.01% 10.68% 1.02King & Queen 65 93.73% 24.31% 1.10King George 268 80.22% 14.00% 1.01King William 265 74.82% 14.13% 1.02Lancaster 187 101.35% 17.30% 1.02Lee 134 82.80% 25.05% 1.04Loudoun 506 90.26% 8.14% 1.00Louisa 634 95.89% 15.68% 1.04Lunenburg 68 90.90% 20.37% 1.07Madison 179 95.38% 18.02% 1.05Mathews 221 95.06% 19.25% 1.04Mecklenburg 269 96.42% 18.94% 1.03Middlesex 223 98.08% 19.51% 1.02Montgomery 433 91.44% 15.08% 1.04Nelson 234 94.71% 20.75% 1.07New Kent 143 89.43% 9.22% 0.99Northampton 91 95.50% 15.10% 1.02Northumberland 274 98.27% 17.27% 1.02Nottoway 72 81.16% 26.03% 1.09Orange 295 81.67% 19.06% 1.04Page 218 90.94% 21.86% 1.08Patrick 220 95.21% 26.56% 1.09Pittsylvania 489 96.69% 21.54% 1.07Powhatan 471 82.59% 14.88% 1.02Prince Edward 148 84.58% 25.85% 1.08Prince George 111 92.49% 9.50% 1.01Prince William 925 88.40% 9.14% 0.99Pulaski 345 87.11% 21.08% 1.05Rappahannock 21 101.79% 19.81% 1.01Richmond 87 100.17% 23.21% 1.08Roanoke 399 87.95% 8.68% 1.00Rockbridge 325 96.90% 18.83% 1.06
13

TABLE 2RATIO OF 2019 ASSESSED VALUATIONS
TO 2019 SELLING PRICES OF REAL ESTATEFOR SELECT CLASSIFICATIONS OF PROPERTY
Locality Numberof Sales
RegressionIndex
MedianRatio (%)
Coefficient of Dispersion (%)
Rockingham 505 87.76% 15.92% 1.00Russell 159 87.00% 24.32% 1.05Scott 154 87.41% 27.42% 1.04Shenandoah 495 88.75% 19.94% 1.07Smyth 187 85.45% 31.35% 1.09Southampton 130 93.73% 15.61% 1.02Spotsylvania 564 83.97% 13.95% 0.99Stafford 260 85.62% 8.51% 0.99Surry 62 100.84% 18.07% 1.06Sussex 50 92.39% 20.79% 1.08Tazewell 191 102.00% 22.78% 1.07Warren 362 95.12% 8.36% 0.99Washington 508 88.42% 19.95% 1.03Westmoreland 294 95.93% 23.04% 1.02Wise 71 93.48% 8.14% 1.02Wythe 239 86.73% 24.49% 1.06York 4 96.38% 6.91% 1.00
Class 2: Single Family Residential SuburbanCities:Buena Vista 1 125.55% 0.00% 1.00Petersburg 81 90.77% 23.64% 1.08Roanoke 883 90.16% 12.62% 1.02Staunton 1 99.99% 0.00% 1.00Suffolk 192 87.80% 10.33% 1.00Virginia Beach 79 84.23% 12.22% 1.00
Class 3: Multi-Family ResidentialCounties:Accomack 1 81.24% 0.00% 1.00Albemarle 1 85.37% 0.00% 1.00Alleghany 2 102.98% 1.96% 1.01Amelia 1 76.22% 0.00% 1.00Amherst 5 101.52% 13.61% 1.01Arlington 14 87.56% 8.30% 0.96Augusta 1 100.29% 0.00% 1.00
14

TABLE 2RATIO OF 2019 ASSESSED VALUATIONS
TO 2019 SELLING PRICES OF REAL ESTATEFOR SELECT CLASSIFICATIONS OF PROPERTY
Locality Numberof Sales
RegressionIndex
MedianRatio (%)
Coefficient of Dispersion (%)
Bath 1 35.82% 0.00% 1.00Bedford 6 108.76% 14.54% 1.04Botetourt 5 87.67% 13.72% 0.91Brunswick 1 47.02% 0.00% 1.00Buchanan 2 84.00% 33.33% 0.87Buckingham 1 67.68% 0.00% 1.00Campbell 12 85.00% 11.32% 0.99Carroll 4 88.42% 13.28% 0.98Chesterfield 5 76.93% 17.58% 1.14Culpeper 5 76.29% 35.50% 0.90Essex 1 77.75% 0.00% 1.00Fairfax 28 94.53% 4.61% 1.02Franklin 1 108.99% 0.00% 1.00Giles 1 122.20% 0.00% 1.00Gloucester 3 100.93% 8.90% 1.02Goochland 2 100.32% 0.00% 1.00Greene 1 81.69% 0.00% 1.00Henrico 12 77.28% 11.19% 1.00Henry 2 115.72% 31.56% 1.06Isle of Wight 1 145.25% 0.00% 1.00King William 1 39.30% 0.00% 1.00Lee 1 65.20% 0.00% 1.00Loudoun 4 79.66% 11.77% 1.08Mecklenburg 17 96.81% 15.00% 1.01Montgomery 10 70.23% 21.88% 1.26Orange 5 74.24% 9.06% 1.04Patrick 1 122.90% 0.00% 1.00Pittsylvania 1 109.83% 0.00% 1.00Prince Edward 1 32.66% 0.00% 1.00Prince George 3 90.76% 2.46% 0.98Prince William 6 79.83% 5.74% 1.00Pulaski 9 87.25% 30.51% 1.22Roanoke 27 92.38% 7.23% 1.00Rockingham 17 87.88% 7.74% 1.00Russell 1 128.40% 0.00% 1.00Shenandoah 3 79.35% 8.63% 1.00
15

TABLE 2RATIO OF 2019 ASSESSED VALUATIONS
TO 2019 SELLING PRICES OF REAL ESTATEFOR SELECT CLASSIFICATIONS OF PROPERTY
Locality Numberof Sales
RegressionIndex
MedianRatio (%)
Coefficient of Dispersion (%)
Spotsylvania 1 104.35% 0.00% 1.00Tazewell 2 108.03% 0.44% 1.00Washington 7 97.13% 17.90% 0.92Wythe 6 94.56% 14.72% 0.93
Class 3: Multi-Family ResidentialCities:Alexandria 14 89.29% 11.03% 0.98Bristol 1 68.08% 0.00% 1.00Charlottesville 35 93.36% 11.43% 1.07Chesapeake 8 83.38% 7.89% 0.92Colonial Heights 6 93.22% 5.16% 1.00Danville 14 101.71% 17.32% 1.08Fredericksburg 6 77.63% 23.46% 1.19Galax 3 66.28% 32.83% 1.21Hampton 10 90.20% 18.71% 1.28Harrisonburg 58 89.82% 8.38% 0.98Hopewell 7 117.00% 34.96% 1.67Lexington 2 81.18% 23.01% 1.01Lynchburg 17 92.60% 9.23% 1.00Martinsville 1 104.17% 0.00% 1.00Newport News 9 91.26% 9.69% 1.15Norfolk 191 97.77% 14.09% 1.10Petersburg 26 94.47% 28.11% 0.95Portsmouth 26 99.78% 7.76% 1.01Radford 1 80.00% 0.00% 1.00Richmond 23 79.10% 12.93% 1.00Roanoke 98 91.07% 14.55% 1.09Salem 11 86.32% 12.50% 1.07Staunton 6 104.18% 8.52% 1.00Suffolk 4 81.28% 16.78% 1.08Virginia Beach 7 80.00% 13.19% 1.01Wayesboro 4 95.59% 13.70% 1.00Williamsburg 1 77.54% 0.00% 1.00Winchester 20 85.13% 20.19% 1.04
16

TABLE 2RATIO OF 2019 ASSESSED VALUATIONS
TO 2019 SELLING PRICES OF REAL ESTATEFOR SELECT CLASSIFICATIONS OF PROPERTY
Locality Numberof Sales
RegressionIndex
MedianRatio (%)
Coefficient of Dispersion (%)
Class 4: Commercial/IndustrialCounties:Accomack 13 116.22% 23.07% 1.21Albemarle 22 95.38% 14.44% 1.02Alleghany 10 87.09% 20.68% 1.04Amelia 4 81.65% 41.53% 1.02Amherst 21 82.77% 34.70% 1.23Appomattox 5 90.61% 29.37% 0.88Arlington 25 86.20% 20.27% 1.07Augusta 16 102.09% 20.56% 0.96Bath 2 81.95% 2.14% 1.00Bedford 22 98.11% 14.92% 1.05Botetourt 8 101.40% 10.90% 1.04Brunswick 13 79.70% 37.98% 1.21Buchanan 6 80.74% 34.81% 1.28Buckingham 4 84.36% 20.44% 0.98Campbell 34 83.99% 24.19% 1.12Caroline 11 97.76% 17.87% 1.13Carroll 5 86.76% 9.58% 1.02Charles City 2 121.48% 9.76% 0.95Charlotte 7 80.13% 29.67% 1.03Chesterfield 78 87.99% 15.44% 1.04Clarke 5 63.11% 21.45% 1.10Craig 3 87.58% 6.58% 0.99Culpeper 12 78.14% 23.04% 1.34Cumberland 1 41.58% 0.00% 1.00Dickenson 3 198.93% 19.46% 1.30Dinwiddie 1 54.52% 0.00% 1.00Essex 6 120.74% 19.72% 1.05Fairfax 114 94.15% 11.18% 1.00Fauquier 27 92.31% 25.08% 1.19Fluvanna 1 51.04% 0.00% 1.00Franklin 3 95.29% 5.22% 1.02Frederick 30 73.97% 24.96% 1.19Giles 11 99.94% 42.94% 1.16Gloucester 13 87.85% 25.77% 1.14
17

TABLE 2RATIO OF 2019 ASSESSED VALUATIONS
TO 2019 SELLING PRICES OF REAL ESTATEFOR SELECT CLASSIFICATIONS OF PROPERTY
Locality Numberof Sales
RegressionIndex
MedianRatio (%)
Coefficient of Dispersion (%)
Goochland 3 104.75% 17.27% 0.94Grayson 2 73.23% 8.88% 0.99Greene 6 80.96% 22.71% 1.11Greensville 1 107.22% 0.00% 1.00Halifax 17 100.52% 10.73% 1.04Hanover 17 89.71% 14.49% 1.03Henrico 84 86.66% 19.10% 1.01Henry 14 102.70% 16.13% 0.95Isle of Wight 22 108.33% 37.12% 1.53James City 17 102.62% 11.70% 1.19King & Queen 1 88.60% 0.00% 1.00King George 3 66.69% 36.46% 1.31King William 7 92.17% 21.35% 0.95Lancaster 7 79.00% 22.82% 1.08Lee 3 101.36% 8.47% 0.93Loudoun 77 92.53% 10.26% 1.03Louisa 6 112.53% 9.88% 1.00Madison 8 109.98% 11.37% 1.06Mathews 1 98.54% 0.00% 1.00Mecklenburg 13 98.50% 26.83% 0.94Middlesex 4 115.13% 14.60% 1.06Montgomery 67 89.02% 30.22% 1.26Nelson 4 122.31% 33.98% 1.22New Kent 3 91.73% 12.64% 0.97Northampton 6 91.03% 22.94% 0.94Northumberland 3 99.55% 6.77% 1.02Nottoway 3 128.51% 33.34% 1.32Orange 4 70.24% 30.08% 1.35Patrick 6 111.91% 17.74% 1.32Pittsylvania 25 95.10% 22.52% 1.11Powhatan 14 87.77% 22.81% 1.13Prince Edward 9 98.05% 32.10% 0.96Prince George 3 108.54% 18.12% 0.95Prince William 98 88.17% 11.33% 1.06Pulaski 21 83.81% 44.74% 1.38Rappahannock 2 88.25% 3.10% 0.99
18

TABLE 2RATIO OF 2019 ASSESSED VALUATIONS
TO 2019 SELLING PRICES OF REAL ESTATEFOR SELECT CLASSIFICATIONS OF PROPERTY
Locality Numberof Sales
RegressionIndex
MedianRatio (%)
Coefficient of Dispersion (%)
Richmond 4 98.74% 46.73% 0.82Roanoke 16 91.72% 13.83% 1.09Rockbridge 9 98.03% 18.39% 1.29Rockingham 13 80.56% 14.57% 0.96Russell 9 101.44% 22.12% 1.03Scott 6 98.16% 22.58% 0.91Shenandoah 22 109.58% 23.35% 1.00Smyth 14 90.96% 35.22% 1.27Southampton 5 116.40% 16.42% 1.19Spotsylvania 46 91.91% 17.78% 0.97Stafford 33 85.82% 16.71% 1.08Surry 3 86.83% 24.09% 1.22Sussex 3 67.37% 5.32% 1.02Tazewell 22 104.59% 28.74% 1.15Warren 3 73.11% 13.35% 1.10Washington 25 95.25% 22.78% 1.15Westmoreland 8 78.94% 42.29% 1.46Wise 3 102.00% 1.45% 1.00Wythe 17 97.96% 28.04% 1.57York 17 97.50% 8.77% 0.97
Class 4: Commercial/IndustrialCities:Alexandria 56 97.93% 13.25% 1.07Bristol 12 75.79% 28.49% 1.04Buena Vista 3 95.92% 27.12% 0.72Charlottesville 27 95.81% 18.44% 0.99Chesapeake 52 93.65% 10.55% 1.06Colonial Heights 5 85.65% 10.34% 1.01Covington 5 132.53% 25.31% 1.02Danville 24 102.30% 22.55% 1.01Emporia 5 100.56% 13.63% 0.92Fairfax 33 99.86% 8.36% 1.09Falls Church 5 80.88% 12.16% 0.92Franklin 5 107.79% 25.43% 1.23Fredericksburg 22 86.74% 19.15% 1.15
19

TABLE 2RATIO OF 2019 ASSESSED VALUATIONS
TO 2019 SELLING PRICES OF REAL ESTATEFOR SELECT CLASSIFICATIONS OF PROPERTY
Locality Numberof Sales
RegressionIndex
MedianRatio (%)
Coefficient of Dispersion (%)
Galax 10 93.86% 8.76% 1.00Hampton 42 93.44% 14.85% 1.00Harrisonburg 21 102.99% 10.14% 1.07Hopewell 14 102.00% 19.28% 1.07Lexington 3 71.37% 26.49% 1.05Lynchburg 37 83.18% 16.36% 0.98Manassas 19 88.61% 12.14% 1.01Manassas Park 7 96.47% 7.61% 1.01Martinsville 15 90.00% 22.51% 1.28Newport News 33 99.76% 9.36% 1.04Norfolk 51 94.17% 12.35% 0.98Norton 2 110.75% 3.21% 1.02Petersburg 25 106.00% 27.82% 1.23Poquoson 4 100.28% 6.61% 1.00Portsmouth 25 91.87% 9.15% 1.01Radford 7 76.88% 30.05% 1.22Richmond 73 88.89% 14.79% 1.04Roanoke 58 96.57% 15.40% 1.01Salem 17 86.60% 19.03% 1.15Staunton 14 86.18% 15.14% 0.94Suffolk 24 82.56% 17.67% 1.04Virginia Beach 111 90.82% 15.75% 1.05Waynesboro 14 90.14% 15.62% 1.03Williamsburg 3 96.60% 4.38% 1.00Winchester 60 88.09% 22.24% 0.97
Class 5: Agricultural Undeveloped 20-100 acresCounties:Accomack 28 89.99% 28.11% 1.08Albemarle 49 91.47% 16.65% 1.03Alleghany 11 90.29% 22.37% 0.99Amelia 27 69.65% 18.57% 0.98Amherst 23 95.47% 17.58% 1.07Appomattox 42 90.36% 24.38% 1.09Augusta 55 91.51% 13.70% 0.99Bath 7 104.59% 24.16% 0.99
20

TABLE 2RATIO OF 2019 ASSESSED VALUATIONS
TO 2019 SELLING PRICES OF REAL ESTATEFOR SELECT CLASSIFICATIONS OF PROPERTY
Locality Numberof Sales
RegressionIndex
MedianRatio (%)
Coefficient of Dispersion (%)
Bedford 51 99.00% 15.36% 1.00Bland 6 103.45% 21.72% 1.09Botetourt 24 89.93% 13.14% 1.03Brunswick 29 87.88% 32.32% 1.14Buchanan 12 95.07% 29.50% 1.22Buckingham 27 94.12% 24.80% 1.09Campbell 21 90.86% 15.36% 0.99Caroline 18 91.50% 14.36% 0.98Carroll 48 101.47% 19.86% 1.08Charles City 9 100.67% 11.83% 0.98Charlotte 22 77.16% 21.65% 1.00Chesterfield 9 89.29% 14.06% 1.07Clarke 16 91.72% 14.39% 1.05Craig 21 90.89% 19.36% 1.10Culpeper 30 90.44% 16.12% 0.97Cumberland 40 91.22% 20.15% 1.07Dickenson 6 92.50% 13.43% 1.03Dinwiddie 19 90.69% 19.97% 1.01Essex 15 86.52% 29.36% 1.09Fauquier 48 101.36% 18.15% 0.99Floyd 50 98.21% 17.68% 1.06Fluvanna 8 92.52% 19.16% 1.10Franklin 31 96.43% 18.52% 1.07Frederick 26 94.95% 16.91% 1.02Giles 14 92.60% 20.80% 1.09Gloucester 12 85.31% 19.19% 1.03Goochland 12 102.49% 6.96% 1.04Grayson 52 109.78% 24.80% 1.15Greene 15 106.87% 15.79% 1.03Greensville 17 95.54% 33.85% 1.02Halifax 51 104.07% 12.50% 1.03Hanover 13 92.60% 6.13% 1.01Henrico 7 93.07% 9.28% 1.13Henry 14 98.21% 21.20% 1.02Highland 11 106.84% 15.49% 1.05Isle of Wight 8 106.14% 13.48% 0.99
21

TABLE 2RATIO OF 2019 ASSESSED VALUATIONS
TO 2019 SELLING PRICES OF REAL ESTATEFOR SELECT CLASSIFICATIONS OF PROPERTY
Locality Numberof Sales
RegressionIndex
MedianRatio (%)
Coefficient of Dispersion (%)
James City 2 85.50% 2.93% 1.01King & Queen 22 96.23% 25.10% 1.13King George 8 88.51% 12.68% 1.01King William 21 74.42% 21.87% 1.05Lancaster 5 88.30% 10.44% 0.96Lee 27 79.85% 24.04% 1.15Loudoun 27 88.41% 12.68% 1.02Louisa 40 103.25% 18.93% 1.09Lunenburg 44 92.63% 19.08% 1.07Madison 24 105.86% 16.18% 1.04Mathews 2 96.74% 38.89% 0.77Mecklenburg 28 93.66% 21.76% 1.03Middlesex 3 84.32% 13.22% 1.05Montgomery 32 96.09% 16.77% 1.11Nelson 20 108.08% 16.35% 1.06New Kent 10 89.28% 8.57% 1.03Northampton 3 98.80% 3.26% 1.01Northumberland 18 88.29% 19.11% 1.09Nottoway 9 76.92% 30.33% 1.04Orange 24 90.88% 25.35% 1.03Page 15 100.14% 17.93% 1.05Patrick 45 97.97% 31.57% 1.11Pittsylvania 49 126.90% 18.67% 1.05Powhatan 9 97.13% 18.44% 1.01Prince Edward 25 99.71% 23.24% 0.99Prince George 10 96.67% 11.23% 0.99Prince William 1 84.86% 0.00% 1.00Pulaski 17 83.40% 34.56% 1.07Rappahannock 16 123.03% 10.66% 1.03Richmond 12 71.14% 39.99% 1.05Roanoke 4 89.45% 6.48% 0.97Rockbridge 40 108.61% 19.44% 1.04Rockingham 29 91.20% 19.75% 1.06Russell 13 79.35% 49.50% 1.19Scott 43 76.84% 30.99% 1.16Shenandoah 27 94.95% 16.50% 1.07
22

TABLE 2RATIO OF 2019 ASSESSED VALUATIONS
TO 2019 SELLING PRICES OF REAL ESTATEFOR SELECT CLASSIFICATIONS OF PROPERTY
Locality Numberof Sales
RegressionIndex
MedianRatio (%)
Coefficient of Dispersion (%)
Smyth 26 102.39% 31.10% 1.12Southampton 11 88.22% 18.12% 0.99Spotsylvania 16 85.63% 14.50% 1.11Stafford 8 77.10% 13.31% 0.99Surry 6 97.84% 32.43% 0.99Sussex 20 82.55% 35.57% 1.17Tazewell 30 83.24% 29.50% 1.01Warren 1 109.40% 0.00% 1.00Washington 47 93.26% 21.46% 1.06Westmoreland 13 93.80% 24.94% 0.95Wise 1 99.18% 0.00% 1.00Wythe 15 99.80% 17.39% 1.02York 1 80.28% 0.00% 1.00
Class 5: Agricultural Undeveloped 20-100 acresCities:Bristol 1 87.46% 0.00% 1.00Chesapeake 9 89.52% 11.93% 1.04Radford 1 83.97% 0.00% 1.00Suffolk 9 88.21% 13.10% 0.93Virginia Beach 4 74.14% 20.81% 1.00
Class 6: Agricultural Undeveloped over 100 acresCounties:Accomack 6 88.99% 31.16% 1.07Albemarle 2 123.09% 0.42% 1.00Alleghany 5 78.08% 19.95% 1.01Amelia 7 71.98% 15.70% 1.10Amherst 8 92.28% 27.76% 1.14Appomattox 5 100.11% 11.85% 0.98Augusta 7 81.25% 15.67% 0.99Bath 5 102.91% 13.06% 1.53Bedford 3 97.75% 13.84% 1.04Bland 2 91.53% 1.63% 1.01Botetourt 5 71.97% 25.17% 1.04Brunswick 7 83.61% 8.22% 0.98
23

TABLE 2RATIO OF 2019 ASSESSED VALUATIONS
TO 2019 SELLING PRICES OF REAL ESTATEFOR SELECT CLASSIFICATIONS OF PROPERTY
Locality Numberof Sales
RegressionIndex
MedianRatio (%)
Coefficient of Dispersion (%)
Buckingham 9 91.43% 10.71% 1.00Campbell 2 65.05% 20.32% 1.11Caroline 10 90.45% 16.45% 1.09Carroll 1 121.36% 0.00% 1.00Charles City 1 76.32% 0.00% 1.00Charlotte 2 82.50% 13.42% 1.05Chesterfield 3 98.05% 1.65% 1.00Clarke 3 101.15% 5.89% 1.00Craig 2 87.90% 7.99% 1.03Culpeper 5 80.85% 12.88% 0.96Cumberland 6 103.82% 23.79% 0.94Dickenson 1 175.00% 0.00% 1.00Dinwiddie 6 105.26% 11.60% 1.08Fauquier 4 97.42% 12.59% 1.03Floyd 3 115.54% 23.03% 1.09Fluvanna 4 113.85% 24.15% 1.27Franklin 4 96.10% 6.25% 1.05Frederick 6 91.65% 19.87% 1.19Gloucester 2 100.90% 6.45% 0.99Grayson 11 86.78% 30.01% 1.19Greene 2 72.84% 17.87% 1.10Greensville 6 47.40% 17.75% 0.98Halifax 10 110.82% 14.10% 1.04Henry 2 111.76% 23.81% 0.97Highland 2 98.85% 8.40% 1.00Isle of Wight 4 79.06% 52.88% 0.95James City 1 99.33% 0.00% 1.00King & Queen 5 91.13% 14.11% 1.04King George 2 78.10% 9.75% 0.98King William 4 71.27% 12.73% 1.05Lancaster 1 65.03% 0.00% 1.00Lee 4 103.82% 7.10% 1.03Loudoun 5 78.68% 7.37% 1.02Louisa 7 87.32% 29.50% 1.22Lunenburg 6 74.81% 18.54% 1.04Madison 5 124.06% 26.87% 1.26
24

TABLE 2RATIO OF 2019 ASSESSED VALUATIONS
TO 2019 SELLING PRICES OF REAL ESTATEFOR SELECT CLASSIFICATIONS OF PROPERTY
Locality Numberof Sales
RegressionIndex
MedianRatio (%)
Coefficient of Dispersion (%)
Mecklenburg 3 69.54% 23.09% 1.07Middlesex 1 99.16% 0.00% 1.00Montgomery 7 88.58% 13.59% 1.02Nelson 5 86.30% 10.57% 1.04Northampton 1 100.69% 0.00% 1.00Northumberland 1 59.48% 0.00% 1.00Nottoway 3 82.26% 20.55% 1.00Orange 4 89.77% 21.62% 0.96Page 3 99.16% 12.46% 0.98Patrick 5 88.37% 22.57% 1.03Pittsylvania 10 127.55% 25.88% 1.11Powhatan 3 114.73% 8.38% 1.05Prince George 4 96.36% 1.28% 1.00Prince William 1 103.98% 0.00% 1.00Pulaski 4 74.05% 12.95% 1.03Rappahannock 2 91.66% 3.10% 1.02Richmond 1 68.22% 0.00% 1.00Roanoke 1 68.03% 0.00% 1.00Rockbridge 11 133.11% 23.23% 1.01Rockingham 3 112.66% 13.68% 1.00Russell 4 103.13% 39.90% 1.32Scott 7 82.15% 25.79% 1.02Shenandoah 6 105.49% 14.79% 1.06Smyth 4 145.12% 25.08% 0.93Southampton 7 89.05% 15.41% 0.98Spotsylvania 4 79.27% 10.94% 1.01Surry 2 98.65% 8.28% 0.99Sussex 13 80.47% 22.15% 1.08Tazewell 4 92.95% 8.15% 0.98Washington 10 125.11% 22.66% 1.09Westmoreland 3 64.14% 28.61% 0.91Wythe 9 80.15% 32.70% 1.29
Class 6: Agricultural Undeveloped over 100 acresCities:Franklin 1 157.75% 0.00% 1.00Suffolk 1 75.32% 0.00% 1.00
25
2018 2019 2018 2019 2018 2019
Counties:Accomack 91.17% 87.91% $0.58 $0.60 $0.53 $0.53Albemarle 94.95% 93.12% $0.84 $0.85 $0.80 $0.80Alleghany 90.91% 90.49% $0.71 $0.73 $0.65 $0.66Amelia 84.61% 77.96% $0.47 $0.48 $0.40 $0.37Amherst 90.92% 89.14% $0.61 $0.61 $0.55 $0.54
Appomattox 89.69% 89.35% $0.65 $0.65 $0.58 $0.58Arlington 93.53% 90.17% $1.01 $1.01 $0.95 $0.91Augusta 88.49% 89.75% $0.63 $0.63 $0.56 $0.57Bath 103.48% 101.09% $0.50 $0.50 $0.52 $0.51Bedford 91.32% 94.15% $0.52 $0.50 $0.47 $0.47
Bland 90.52% 90.21% $0.60 $0.60 $0.54 $0.54Botetourt 90.75% 85.77% $0.79 $0.79 $0.72 $0.68Brunswick 93.74% 89.41% $0.53 $0.53 $0.50 $0.47Buchanan 102.72% 102.57% $0.39 $0.39 $0.40 $0.40Buckingham 92.32% 91.28% $0.55 $0.55 $0.51 $0.50
Campbell 89.19% 89.64% $0.52 $0.52 $0.46 $0.47Caroline 82.11% 79.12% $0.83 $0.83 $0.68 $0.66Carroll 90.47% 91.23% $0.70 $0.70 $0.63 $0.63Charles City 91.74% 92.98% $0.76 $0.76 $0.70 $0.71Charlotte 89.95% 81.26% $0.53 $0.53 $0.48 $0.43
Chesterfield 92.38% 92.41% $0.95 $0.95 $0.88 $0.88Clarke 85.50% 83.26% $0.71 $0.71 $0.61 $0.59Craig 96.63% 94.66% $0.59 $0.59 $0.57 $0.56Culpeper 85.57% 92.42% $0.67 $0.62 $0.57 $0.57Cumberland 82.43% 85.72% $0.78 $0.78 $0.64 $0.67
Dickenson 101.93% 101.09% $0.60 $0.60 $0.61 $0.61Dinwiddie 87.74% 89.16% $0.79 $0.79 $0.69 $0.70Essex 88.89% 84.07% $0.88 $0.88 $0.78 $0.74Fairfax 91.80% 91.26% $1.15 $1.15 $1.06 $1.05Fauquier 92.57% 89.66% $0.98 $0.99 $0.91 $0.89
Floyd 98.03% 92.69% $0.60 $0.60 $0.59 $0.56Fluvanna 90.14% 90.66% $0.94 $0.93 $0.85 $0.84Franklin 90.08% 95.26% $0.61 $0.61 $0.55 $0.58Frederick 84.85% 86.57% $0.61 $0.61 $0.52 $0.53Giles 89.34% 88.24% $0.63 $0.67 $0.56 $0.59
Gloucester 92.88% 90.69% $0.70 $0.70 $0.65 $0.63Goochland 94.65% 96.64% $0.53 $0.53 $0.50 $0.51Grayson 89.33% 89.26% $0.49 $0.56 $0.44 $0.50Greene 92.85% 92.13% $0.78 $0.82 $0.72 $0.76Greensville 95.28% 94.77% $0.67 $0.67 $0.64 $0.63
Halifax 100.34% 99.84% $0.48 $0.50 $0.48 $0.50Hanover 90.33% 92.08% $0.81 $0.81 $0.73 $0.75Henrico 91.14% 91.43% $0.87 $0.87 $0.79 $0.80Henry 95.12% 92.44% $0.56 $0.56 $0.53 $0.51Highland 107.32% 107.15% $0.44 $0.48 $0.47 $0.51
TABLE 3NOMINAL AND EFFECTIVE TRUE REAL PROPERTY TAX RATES
IN VIRGINIA COUNTIES AND CITIES - 2018 & 2019( Exclusive of Town Taxes Imposed by Incorporated Towns for Town Purposes )
Locality Median Ratio Nominal Tax Rate Effective Tax Rate
26

2018 2019 2018 2019 2018 2019
TABLE 3NOMINAL AND EFFECTIVE TRUE REAL PROPERTY TAX RATES
IN VIRGINIA COUNTIES AND CITIES - 2018 & 2019( Exclusive of Town Taxes Imposed by Incorporated Towns for Town Purposes )
Locality Median Ratio Nominal Tax Rate Effective Tax Rate
Isle of Wight 91.57% 90.60% $0.85 $0.85 $0.78 $0.77James City 92.73% 92.00% $0.84 $0.84 $0.78 $0.77King & Queen 84.91% 93.73% $0.53 $0.53 $0.45 $0.50King George 82.89% 81.24% $0.70 $0.70 $0.58 $0.57King William 79.07% 75.12% $0.88 $0.86 $0.70 $0.65
Lancaster 100.51% 98.00% $0.59 $0.63 $0.59 $0.62Lee 87.83% 83.16% $0.62 $0.62 $0.54 $0.51Loudoun 91.36% 91.66% $1.09 $1.05 $0.99 $0.96Louisa 95.38% 95.83% $0.72 $0.72 $0.69 $0.69Lunenburg 97.84% 91.19% $0.38 $0.38 $0.37 $0.35
Madison 96.06% 97.29% $0.68 $0.70 $0.65 $0.68Mathews 94.09% 95.06% $0.58 $0.65 $0.54 $0.61Mecklenburg 96.51% 96.93% $0.42 $0.42 $0.41 $0.41Middlesex 99.51% 98.36% $0.62 $0.62 $0.62 $0.61Montgomery 85.30% 89.24% $0.89 $0.89 $0.76 $0.79
Nelson 97.99% 97.04% $0.72 $0.72 $0.71 $0.70New Kent 96.80% 92.24% $0.82 $0.82 $0.79 $0.76Northampton 98.65% 94.59% $0.83 $0.83 $0.82 $0.79Northumberland 100.82% 97.61% $0.56 $0.59 $0.56 $0.58Nottoway 89.76% 83.26% $0.48 $0.48 $0.43 $0.40
Orange 87.71% 82.93% $0.80 $0.80 $0.71 $0.67Page 96.16% 91.63% $0.70 $0.73 $0.67 $0.67Patrick 99.07% 96.43% $0.57 $0.68 $0.56 $0.66Pittsylvania 105.88% 97.94% $0.62 $0.62 $0.66 $0.61Powhatan 85.04% 83.36% $0.88 $0.88 $0.75 $0.73
Prince Edward 86.78% 88.81% $0.51 $0.51 $0.44 $0.45Prince George 93.69% 91.95% $0.86 $0.86 $0.81 $0.79Prince William 90.04% 90.40% $1.13 $1.13 $1.01 $1.02Pulaski 89.14% 86.20% $0.77 $0.77 $0.69 $0.66Rappahannock 102.83% 98.77% $0.67 $0.67 $0.69 $0.66
Richmond 98.21% 93.63% $0.70 $0.70 $0.69 $0.66Roanoke 91.06% 87.89% $1.09 $1.09 $0.99 $0.96Rockbridge 99.93% 98.63% $0.70 $0.73 $0.70 $0.72Rockingham 89.49% 86.94% $0.74 $0.74 $0.66 $0.64Russell 92.15% 87.65% $0.63 $0.63 $0.58 $0.55
Scott 86.42% 86.84% $0.74 $0.80 $0.64 $0.69Shenandoah 90.78% 87.06% $0.64 $0.64 $0.58 $0.56Smyth 80.00% 85.26% $0.74 $0.74 $0.59 $0.63Southampton 94.10% 93.66% $0.85 $0.90 $0.80 $0.84Spotsylvania 87.79% 85.22% $0.83 $0.85 $0.73 $0.72
Stafford 87.23% 85.58% $0.99 $1.01 $0.86 $0.86Surry 100.22% 99.10% $0.71 $0.71 $0.71 $0.70Sussex 94.81% 87.85% $0.58 $0.58 $0.55 $0.51Tazewell 104.33% 101.43% $0.58 $0.58 $0.61 $0.59Warren 84.84% 94.36% $0.66 $0.66 $0.56 $0.62
27

2018 2019 2018 2019 2018 2019
TABLE 3NOMINAL AND EFFECTIVE TRUE REAL PROPERTY TAX RATES
IN VIRGINIA COUNTIES AND CITIES - 2018 & 2019( Exclusive of Town Taxes Imposed by Incorporated Towns for Town Purposes )
Locality Median Ratio Nominal Tax Rate Effective Tax Rate
Washington 91.35% 88.48% $0.63 $0.63 $0.58 $0.56Westmoreland 96.57% 92.81% $0.59 $0.65 $0.57 $0.60Wise 93.70% 94.53% $0.62 $0.69 $0.58 $0.65Wythe 95.36% 90.08% $0.54 $0.54 $0.51 $0.49York 95.57% 94.06% $0.80 $0.80 $0.76 $0.75
Cities: Alexandria 95.80% 91.99% $1.13 $1.13 $1.08 $1.04Bristol 88.42% 85.33% $1.17 $1.17 $1.03 $1.00Buena Vista 99.54% 94.47% $1.21 $1.21 $1.20 $1.14Charlottesville 89.17% 93.75% $0.95 $0.95 $0.85 $0.89Chesapeake 94.36% 93.87% $1.05 $1.05 $0.99 $0.99
Colonial Heights 88.91% 86.45% $1.20 $1.20 $1.07 $1.04Covington 93.75% 91.60% $0.76 $0.80 $0.71 $0.73Danville 97.89% 98.40% $0.80 $0.80 $0.78 $0.79Emporia 93.78% 92.78% $0.90 $0.95 $0.84 $0.88Fairfax 95.30% 92.88% $1.06 $1.08 $1.01 $1.00
Falls Church 93.75% 92.30% $1.34 $1.35 $1.25 $1.25Franklin 92.15% 95.39% $1.00 $1.00 $0.92 $0.95Fredericksburg 92.99% 88.48% $0.80 $0.80 $0.74 $0.71Galax 91.50% 88.99% $0.80 $0.85 $0.73 $0.75Hampton 95.61% 96.04% $1.24 $1.24 $1.19 $1.19
Harrisonburg 91.30% 90.39% $0.85 $0.86 $0.78 $0.78Hopewell 94.34% 95.27% $1.13 $1.13 $1.07 $1.08Lexington 92.70% 98.20% $1.11 $1.04 $1.03 $1.02Lynchburg 90.67% 86.33% $1.11 $1.11 $1.01 $0.96Manassas 88.02% 87.88% $1.46 $1.48 $1.29 $1.30
Manassas Park 92.30% 93.40% $1.55 $1.55 $1.43 $1.45Martinsville 96.45% 92.50% $1.06 $1.06 $1.02 $0.98Newport News 94.07% 93.93% $1.22 $1.22 $1.15 $1.15Norfolk 97.30% 97.80% $1.15 $1.25 $1.12 $1.22Norton 97.50% 95.42% $0.90 $0.90 $0.88 $0.86
Petersburg 96.61% 95.94% $1.35 $1.35 $1.30 $1.30Poquoson 96.19% 95.44% $1.07 $1.14 $1.03 $1.09Portsmouth 99.53% 97.97% $1.30 $1.30 $1.29 $1.27Radford 88.22% 85.70% $0.76 $0.82 $0.67 $0.70Richmond 87.77% 86.94% $1.20 $1.20 $1.05 $1.04
Roanoke 96.13% 90.25% $1.22 $1.22 $1.17 $1.10Salem 92.26% 88.36% $1.20 $1.20 $1.11 $1.06Staunton 91.05% 91.90% $0.97 $0.95 $0.88 $0.87Suffolk 94.26% 92.68% $1.11 $1.11 $1.05 $1.03Virginia Beach 89.76% 89.68% $1.00 $1.01 $0.90 $0.90
Waynesboro 83.52% 89.23% $0.90 $0.90 $0.75 $0.80Williamsburg 95.85% 94.33% $0.57 $0.60 $0.55 $0.57Winchester 90.87% 91.56% $0.91 $0.93 $0.83 $0.85
28

Counties:Accomack $4,163,358,321 $476,187,385 $4,639,545,706 10.26%Albemarle $22,071,262,994 $471,023,192 $22,542,286,186 2.09%Alleghany $1,239,701,846 $199,300,430 $1,439,002,276 13.85%Amelia $1,658,446,710 $62,458,681 $1,720,905,391 3.63%Amherst $2,975,223,244 $122,870,219 $3,098,093,463 3.97%
Appomattox $1,549,588,137 $127,830,361 $1,677,418,498 7.62%Arlington $86,048,728,180 $992,954,936 $87,041,683,116 1.14%Augusta $9,763,598,552 $483,036,094 $10,246,634,646 4.71%Bath $873,866,555 $1,385,637,012 $2,259,503,567 61.32%Bedford $10,889,987,822 $349,988,082 $11,239,975,904 3.11%
Bland $675,699,036 $110,238,968 $785,938,004 14.03%Botetourt $4,393,709,576 $492,870,703 $4,886,580,279 10.09%Brunswick $1,458,790,471 $1,030,932,489 $2,489,722,960 41.41%Buchanan $2,185,985,714 $159,071,670 $2,345,057,384 6.78%Buckingham $1,574,192,375 $651,190,129 $2,225,382,504 29.26%
Campbell $4,895,546,025 $474,405,230 $5,369,951,255 8.83%Caroline $3,609,590,763 $514,227,331 $4,123,818,094 12.47%Carroll $2,575,826,811 $141,634,863 $2,717,461,674 5.21%Charles City $917,677,651 $173,982,397 $1,091,660,048 15.94%Charlotte $1,145,768,176 $101,701,439 $1,247,469,615 8.15%
Chesterfield $42,272,351,694 $1,830,146,027 $44,102,497,721 4.15%Clarke $2,890,900,072 $79,944,634 $2,970,844,706 2.69%Craig $544,189,943 $21,495,005 $565,684,948 3.80%Culpeper $6,621,492,554 $279,162,580 $6,900,655,134 4.05%Cumberland $1,007,275,939 $130,457,892 $1,137,733,831 11.47%
Dickenson $1,278,788,406 $119,034,999 $1,397,823,405 8.52%Dinwiddie $3,099,359,144 $266,341,346 $3,365,700,490 7.91%Essex $1,654,564,054 $50,276,614 $1,704,840,668 2.95%Fairfax $279,807,876,817 $4,411,919,605 $284,219,796,422 1.55%Fauquier $14,974,331,363 $835,249,492 $15,809,580,855 5.28%
Floyd $1,932,683,893 $65,226,226 $1,997,910,119 3.26%Fluvanna $3,275,844,366 $610,997,253 $3,886,841,619 15.72%Franklin $7,508,635,104 $204,354,921 $7,712,990,025 2.65%Frederick $12,653,544,155 $491,455,002 $13,144,999,157 3.74%Giles $1,369,904,465 $130,245,696 $1,500,150,161 8.68%
Gloucester $4,949,572,925 $155,139,583 $5,104,712,508 3.04%Goochland $6,112,008,175 $158,459,931 $6,270,468,106 2.53%Grayson $1,868,848,196 $58,490,193 $1,927,338,389 3.03%Greene $2,512,201,942 $60,411,980 $2,572,613,922 2.35%Greensville $672,118,719 $1,027,929,340 $1,700,048,059 60.46%
Halifax $2,694,054,523 $1,143,177,354 $3,837,231,877 29.79%Hanover $17,203,561,914 $811,869,515 $18,015,431,429 4.51%Henrico $44,177,030,953 $1,265,668,984 $45,442,699,937 2.79%Henry $3,187,626,244 $204,010,670 $3,391,636,914 6.02%Highland $629,168,642 $24,064,748 $653,233,390 3.68%
Isle of Wight $5,260,789,866 $190,746,611 $5,451,536,477 3.50%James City $13,441,599,620 $415,748,654 $13,857,348,274 3.00%King & Queen $962,794,623 $34,047,040 $996,841,663 3.42%
TABLE 4ESTIMATED TRUE FULL VALUE OF LOCALLY TAXED PROPERTY
IN VIRGINIA COUNTIES AND CITIES - 2019REAL ESTATE AND PUBLIC SERVICE CORPORATIONS
Locality True Valueof Real Estate
True Value ofPublic ServiceCorporations
Total EstimatedTrue Value
Public Service Corps.% of Total
Estimated True Value
29
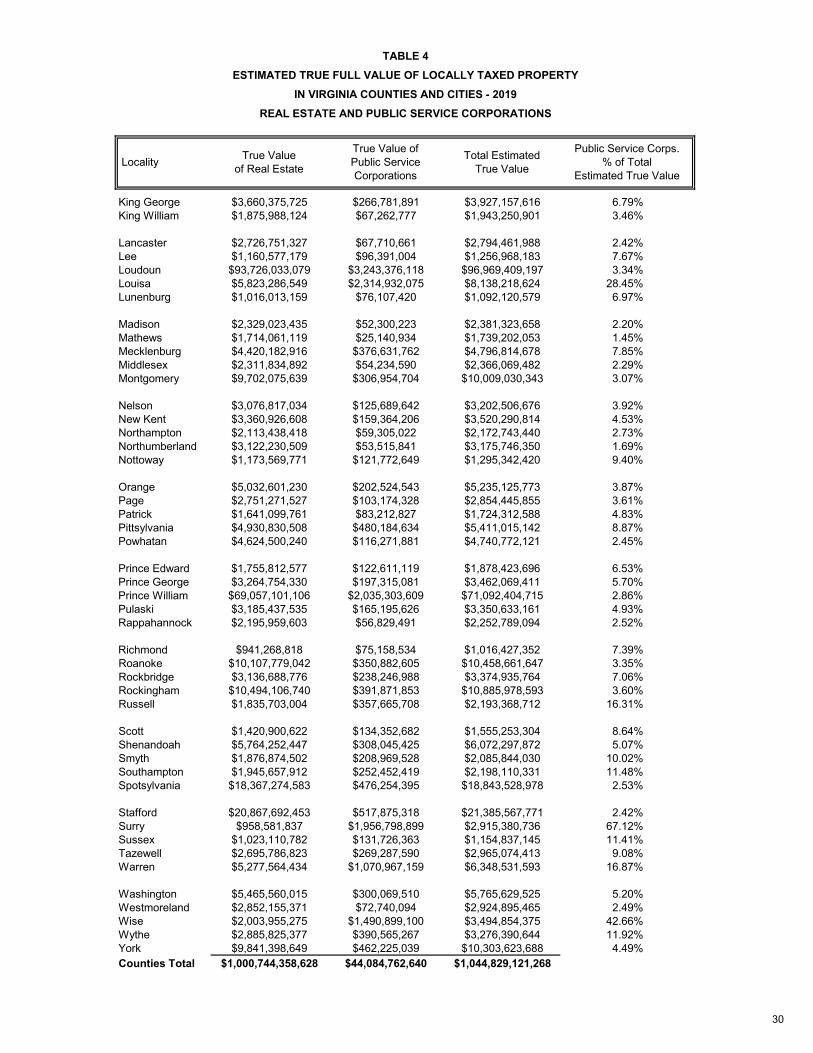
TABLE 4ESTIMATED TRUE FULL VALUE OF LOCALLY TAXED PROPERTY
IN VIRGINIA COUNTIES AND CITIES - 2019REAL ESTATE AND PUBLIC SERVICE CORPORATIONS
Locality True Valueof Real Estate
True Value ofPublic ServiceCorporations
Total EstimatedTrue Value
Public Service Corps.% of Total
Estimated True Value
King George $3,660,375,725 $266,781,891 $3,927,157,616 6.79%King William $1,875,988,124 $67,262,777 $1,943,250,901 3.46%
Lancaster $2,726,751,327 $67,710,661 $2,794,461,988 2.42%Lee $1,160,577,179 $96,391,004 $1,256,968,183 7.67%Loudoun $93,726,033,079 $3,243,376,118 $96,969,409,197 3.34%Louisa $5,823,286,549 $2,314,932,075 $8,138,218,624 28.45%Lunenburg $1,016,013,159 $76,107,420 $1,092,120,579 6.97%
Madison $2,329,023,435 $52,300,223 $2,381,323,658 2.20%Mathews $1,714,061,119 $25,140,934 $1,739,202,053 1.45%Mecklenburg $4,420,182,916 $376,631,762 $4,796,814,678 7.85%Middlesex $2,311,834,892 $54,234,590 $2,366,069,482 2.29%Montgomery $9,702,075,639 $306,954,704 $10,009,030,343 3.07%
Nelson $3,076,817,034 $125,689,642 $3,202,506,676 3.92%New Kent $3,360,926,608 $159,364,206 $3,520,290,814 4.53%Northampton $2,113,438,418 $59,305,022 $2,172,743,440 2.73%Northumberland $3,122,230,509 $53,515,841 $3,175,746,350 1.69%Nottoway $1,173,569,771 $121,772,649 $1,295,342,420 9.40%
Orange $5,032,601,230 $202,524,543 $5,235,125,773 3.87%Page $2,751,271,527 $103,174,328 $2,854,445,855 3.61%Patrick $1,641,099,761 $83,212,827 $1,724,312,588 4.83%Pittsylvania $4,930,830,508 $480,184,634 $5,411,015,142 8.87%Powhatan $4,624,500,240 $116,271,881 $4,740,772,121 2.45%
Prince Edward $1,755,812,577 $122,611,119 $1,878,423,696 6.53%Prince George $3,264,754,330 $197,315,081 $3,462,069,411 5.70%Prince William $69,057,101,106 $2,035,303,609 $71,092,404,715 2.86%Pulaski $3,185,437,535 $165,195,626 $3,350,633,161 4.93%Rappahannock $2,195,959,603 $56,829,491 $2,252,789,094 2.52%
Richmond $941,268,818 $75,158,534 $1,016,427,352 7.39%Roanoke $10,107,779,042 $350,882,605 $10,458,661,647 3.35%Rockbridge $3,136,688,776 $238,246,988 $3,374,935,764 7.06%Rockingham $10,494,106,740 $391,871,853 $10,885,978,593 3.60%Russell $1,835,703,004 $357,665,708 $2,193,368,712 16.31%
Scott $1,420,900,622 $134,352,682 $1,555,253,304 8.64%Shenandoah $5,764,252,447 $308,045,425 $6,072,297,872 5.07%Smyth $1,876,874,502 $208,969,528 $2,085,844,030 10.02%Southampton $1,945,657,912 $252,452,419 $2,198,110,331 11.48%Spotsylvania $18,367,274,583 $476,254,395 $18,843,528,978 2.53%
Stafford $20,867,692,453 $517,875,318 $21,385,567,771 2.42%Surry $958,581,837 $1,956,798,899 $2,915,380,736 67.12%Sussex $1,023,110,782 $131,726,363 $1,154,837,145 11.41%Tazewell $2,695,786,823 $269,287,590 $2,965,074,413 9.08%Warren $5,277,564,434 $1,070,967,159 $6,348,531,593 16.87%
Washington $5,465,560,015 $300,069,510 $5,765,629,525 5.20%Westmoreland $2,852,155,371 $72,740,094 $2,924,895,465 2.49%Wise $2,003,955,275 $1,490,899,100 $3,494,854,375 42.66%Wythe $2,885,825,377 $390,565,267 $3,276,390,644 11.92%York $9,841,398,649 $462,225,039 $10,303,623,688 4.49%Counties Total $1,000,744,358,628 $44,084,762,640 $1,044,829,121,268
30

TABLE 4ESTIMATED TRUE FULL VALUE OF LOCALLY TAXED PROPERTY
IN VIRGINIA COUNTIES AND CITIES - 2019REAL ESTATE AND PUBLIC SERVICE CORPORATIONS
Locality True Valueof Real Estate
True Value ofPublic ServiceCorporations
Total EstimatedTrue Value
Public Service Corps.% of Total
Estimated True Value
Cities:Alexandria $42,940,676,509 $648,256,156 $43,588,932,665 1.49%Bristol $1,390,891,445 $25,069,854 $1,415,961,299 1.77%Buena Vista $347,180,989 $21,994,172 $369,175,161 5.96%Charlottesville $8,157,752,533 $159,144,454 $8,316,896,987 1.91%Chesapeake $29,894,595,078 $1,071,772,251 $30,966,367,329 3.46%
Colonial Heights $1,960,048,433 $40,332,927 $2,000,381,360 2.02%Covington $313,214,083 $279,537,380 $592,751,463 47.16%Danville $2,299,434,045 $65,590,049 $2,365,024,094 2.77%Emporia $374,545,807 $23,344,938 $397,890,745 5.87%Fairfax $6,717,468,454 $127,350,541 $6,844,818,995 1.86%
Falls Church $4,640,808,234 $30,564,717 $4,671,372,951 0.65%Franklin $598,278,058 $8,390,726 $606,668,784 1.38%Fredericksburg $4,558,102,170 $127,306,452 $4,685,408,622 2.72%Galax $499,935,217 $16,214,890 $516,150,107 3.14%Hampton $11,650,225,531 $397,678,229 $12,047,903,760 3.30%
Harrisonburg $4,837,126,289 $61,055,780 $4,898,182,069 1.25%Hopewell $1,432,243,833 $401,607,392 $1,833,851,225 21.90%Lexington $577,020,367 $19,946,050 $596,966,417 3.34%Lynchburg $6,170,896,444 $265,477,725 $6,436,374,169 4.12%Manassas $5,762,114,247 $113,869,734 $5,875,983,981 1.94%
Manassas Park $1,740,562,848 $33,679,174 $1,774,242,022 1.90%Martinsville $690,265,946 $29,556,084 $719,822,030 4.11%Newport News $16,357,706,590 $575,448,164 $16,933,154,754 3.40%Norfolk $19,874,978,119 $938,498,203 $20,813,476,322 4.51%Norton $244,746,594 $29,261,041 $274,007,635 10.68%
Petersburg $2,003,419,584 $184,718,313 $2,188,137,897 8.44%Poquoson $1,678,593,174 $21,288,676 $1,699,881,850 1.25%Portsmouth $7,650,067,778 $395,436,785 $8,045,504,563 4.92%Radford $960,265,578 $27,733,257 $987,998,835 2.81%Richmond $28,436,901,311 $1,086,424,084 $29,523,325,395 3.68%
Roanoke $8,822,288,753 $506,376,887 $9,328,665,640 5.43%Salem $2,577,711,747 $66,662,186 $2,644,373,933 2.52%Staunton $2,223,138,269 $101,911,457 $2,325,049,726 4.38%Suffolk $11,343,469,357 $438,533,909 $11,782,003,266 3.72%Virginia Beach $64,128,380,241 $1,153,746,219 $65,282,126,460 1.77%
Waynesboro $2,138,831,895 $121,434,851 $2,260,266,746 5.37%Williamsburg $1,985,255,443 $58,414,935 $2,043,670,378 2.86%Winchester $3,485,854,619 $94,962,235 $3,580,816,854 2.65%Cities Total $311,464,995,612 $9,768,590,877 $321,233,586,489
Virginia Total $1,312,209,354,240 $53,853,353,517 $1,366,062,707,757
31

Counties:Accomack 32,561 $127,863 $14,624 $142,488Albemarle 109,722 $201,156 $4,293 $205,449Alleghany 14,952 $82,912 $13,329 $96,241Amelia 13,053 $127,055 $4,785 $131,840Amherst 31,766 $93,661 $3,868 $97,529
Appomattox 15,818 $97,964 $8,081 $106,045Arlington 242,152 $355,350 $4,101 $359,451Augusta 75,831 $128,755 $6,370 $135,125Bath 4,318 $202,378 $320,898 $523,275Bedford 78,581 $138,583 $4,454 $143,037
Bland 6,364 $106,175 $17,322 $123,497Botetourt 33,494 $131,179 $14,715 $145,894Brunswick 16,292 $89,540 $63,278 $152,819Buchanan 21,295 $102,653 $7,470 $110,122Buckingham 17,075 $92,193 $38,137 $130,330
Campbell 55,480 $88,240 $8,551 $96,791Caroline 30,318 $119,058 $16,961 $136,019Carroll 29,137 $88,404 $4,861 $93,265Charles City 7,016 $130,798 $24,798 $155,596Charlotte * 11,928 $96,057 $8,526 $104,583
Chesterfield 350,760 $120,516 $5,218 $125,734Clarke 14,360 $201,316 $5,567 $206,883Craig 5,108 $106,537 $4,208 $110,745Culpeper 51,998 $127,341 $5,369 $132,710Cumberland 9,855 $102,210 $13,238 $115,447
Dickenson 14,299 $89,432 $8,325 $97,757Dinwiddie 28,667 $108,116 $9,291 $117,407Essex 10,765 $153,698 $4,670 $158,369Fairfax 1,143,528 $244,688 $3,858 $248,546Fauquier 70,580 $212,161 $11,834 $223,995
Floyd 15,561 $124,200 $4,192 $128,392Fluvanna 27,038 $121,157 $22,598 $143,755Franklin 55,782 $134,607 $3,663 $138,270Frederick 88,830 $142,447 $5,533 $147,979Giles 16,757 $81,751 $7,773 $89,524
Gloucester 37,090 $133,448 $4,183 $137,630Goochland 23,472 $260,396 $6,751 $267,147Grayson 15,445 $121,000 $3,787 $124,787Greene 20,097 $125,004 $3,006 $128,010Greensville 11,408 $58,916 $90,106 $149,022
Halifax 34,329 $78,478 $33,301 $111,778Hanover 107,928 $159,399 $7,522 $166,921Henrico 328,999 $134,277 $3,847 $138,124Henry 51,019 $62,479 $3,999 $66,478Highland 2,246 $280,129 $10,714 $290,843
Isle of Wight * 37,649 $139,733 $5,066 $144,799James City 75,907 $177,080 $5,477 $182,557
TABLE 5ESTIMATED TRUE VALUE PER CAPITA OF LOCALLY TAXED PROPERTY
IN VIRGINIA COUNTIES AND CITIES - 2019REAL ESTATE AND PUBLIC SERVICE CORPORATIONS
Locality 2019Population
EstimatedTrue Value
ofReal EstatePer Capita
EstimatedTrue Value
ofPublic ServiceCorporations
Per Capita
TOTALEstimatedTrue ValuePer Capita
32

TABLE 5ESTIMATED TRUE VALUE PER CAPITA OF LOCALLY TAXED PROPERTY
IN VIRGINIA COUNTIES AND CITIES - 2019REAL ESTATE AND PUBLIC SERVICE CORPORATIONS
Locality 2019Population
EstimatedTrue Value
ofReal EstatePer Capita
EstimatedTrue Value
ofPublic ServiceCorporations
Per Capita
TOTALEstimatedTrue ValuePer Capita
King and Queen 6,902 $139,495 $4,933 $144,428King George 26,016 $140,697 $10,255 $150,952King William 17,133 $109,496 $3,926 $113,422
Lancaster 10,829 $251,801 $6,253 $258,054Lee 23,810 $48,743 $4,048 $52,792Loudoun 413,546 $226,640 $7,843 $234,483Louisa 36,620 $159,019 $63,215 $222,234Lunenburg 12,246 $82,967 $6,215 $89,182
Madison 13,251 $175,762 $3,947 $179,709Mathews 8,645 $198,272 $2,908 $201,180Mecklenburg * 30,917 $142,969 $12,182 $155,151Middlesex 10,712 $215,817 $5,063 $220,880Montgomery 100,073 $96,950 $3,067 $100,017
Nelson 14,794 $207,977 $8,496 $216,473New Kent 23,066 $145,709 $6,909 $152,618Northampton 11,810 $178,953 $5,022 $183,975Northumberland 11,981 $260,598 $4,467 $265,065Nottoway 15,413 $76,142 $7,901 $84,042
Orange 35,921 $140,102 $5,638 $145,740Page 23,857 $115,323 $4,325 $119,648Patrick 17,752 $92,446 $4,688 $97,133Pittsylvania 61,002 $80,831 $7,872 $88,702Powhatan 29,867 $154,836 $3,893 $158,729
Prince Edward 22,959 $76,476 $5,340 $81,816Prince George 37,350 $87,410 $5,283 $92,693Prince William 465,498 $148,351 $4,372 $152,723Pulaski 34,097 $93,423 $4,845 $98,268Rappahannock 7,285 $301,436 $7,801 $309,237
Richmond 9,192 $102,401 $8,177 $110,577Roanoke 93,805 $107,753 $3,741 $111,494Rockbridge 22,500 $139,408 $10,589 $149,997Rockingham 82,208 $127,653 $4,767 $132,420Russell 26,830 $68,420 $13,331 $81,751
Scott 21,892 $64,905 $6,137 $71,042Shenandoah 42,987 $134,093 $7,166 $141,259Smyth 30,075 $62,406 $6,948 $69,355Southampton 17,855 $108,970 $14,139 $123,109Spotsylvania 135,715 $135,337 $3,509 $138,846
Stafford 151,689 $137,569 $3,414 $140,983Surry 6,561 $146,103 $298,247 $444,350Sussex 11,449 $89,362 $11,505 $100,868Tazewell 41,332 $65,223 $6,515 $71,738Warren 39,936 $132,151 $26,817 $158,968
Washington 53,417 $102,319 $5,617 $107,936Westmoreland 17,895 $159,383 $4,065 $163,448Wise 37,752 $53,082 $39,492 $92,574Wythe 28,480 $101,328 $13,714 $115,042York 69,407 $141,793 $6,660 $148,452Counties (as a whole) 5,960,959 $167,883 $7,396 $175,279
33
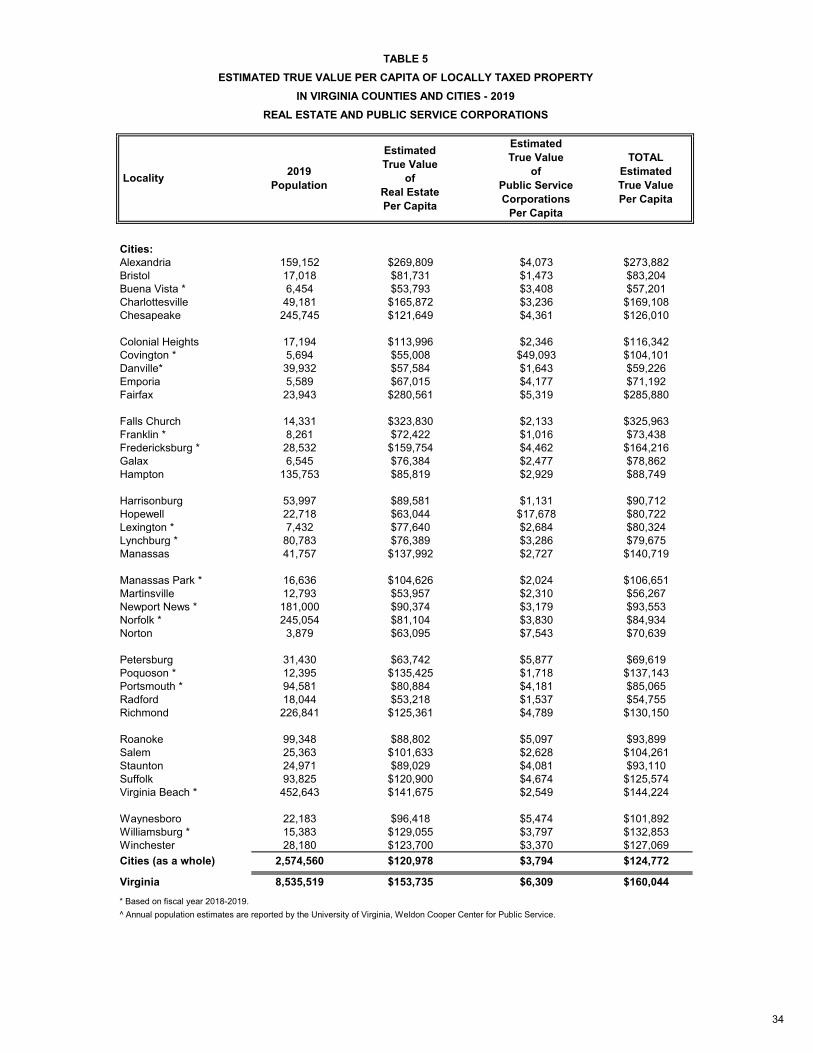
TABLE 5ESTIMATED TRUE VALUE PER CAPITA OF LOCALLY TAXED PROPERTY
IN VIRGINIA COUNTIES AND CITIES - 2019REAL ESTATE AND PUBLIC SERVICE CORPORATIONS
Locality 2019Population
EstimatedTrue Value
ofReal EstatePer Capita
EstimatedTrue Value
ofPublic ServiceCorporations
Per Capita
TOTALEstimatedTrue ValuePer Capita
Cities:Alexandria 159,152 $269,809 $4,073 $273,882Bristol 17,018 $81,731 $1,473 $83,204Buena Vista * 6,454 $53,793 $3,408 $57,201Charlottesville 49,181 $165,872 $3,236 $169,108Chesapeake 245,745 $121,649 $4,361 $126,010
Colonial Heights 17,194 $113,996 $2,346 $116,342Covington * 5,694 $55,008 $49,093 $104,101Danville* 39,932 $57,584 $1,643 $59,226Emporia 5,589 $67,015 $4,177 $71,192Fairfax 23,943 $280,561 $5,319 $285,880
Falls Church 14,331 $323,830 $2,133 $325,963Franklin * 8,261 $72,422 $1,016 $73,438Fredericksburg * 28,532 $159,754 $4,462 $164,216Galax 6,545 $76,384 $2,477 $78,862Hampton 135,753 $85,819 $2,929 $88,749
Harrisonburg 53,997 $89,581 $1,131 $90,712Hopewell 22,718 $63,044 $17,678 $80,722Lexington * 7,432 $77,640 $2,684 $80,324Lynchburg * 80,783 $76,389 $3,286 $79,675Manassas 41,757 $137,992 $2,727 $140,719
Manassas Park * 16,636 $104,626 $2,024 $106,651Martinsville 12,793 $53,957 $2,310 $56,267Newport News * 181,000 $90,374 $3,179 $93,553Norfolk * 245,054 $81,104 $3,830 $84,934Norton 3,879 $63,095 $7,543 $70,639
Petersburg 31,430 $63,742 $5,877 $69,619Poquoson * 12,395 $135,425 $1,718 $137,143Portsmouth * 94,581 $80,884 $4,181 $85,065Radford 18,044 $53,218 $1,537 $54,755Richmond 226,841 $125,361 $4,789 $130,150
Roanoke 99,348 $88,802 $5,097 $93,899Salem 25,363 $101,633 $2,628 $104,261Staunton 24,971 $89,029 $4,081 $93,110Suffolk 93,825 $120,900 $4,674 $125,574Virginia Beach * 452,643 $141,675 $2,549 $144,224
Waynesboro 22,183 $96,418 $5,474 $101,892Williamsburg * 15,383 $129,055 $3,797 $132,853Winchester 28,180 $123,700 $3,370 $127,069Cities (as a whole) 2,574,560 $120,978 $3,794 $124,772
Virginia 8,535,519 $153,735 $6,309 $160,044* Based on fiscal year 2018-2019.^ Annual population estimates are reported by the University of Virginia, Weldon Cooper Center for Public Service.
34

APPENDIX 1
Methodology and Terms
The Department of Taxation has adopted a method of collecting data in a prescribed format. The data are derived from the recordation tax receipts that the law requires the Clerk of the Court in each locality to file with the Virginia Department of Taxation. The Department obtains the transfer data from the Supreme Court of Virginia, the Clerk of Court, a contractor, or the local assessment officers. For each transfer, the listing indicates the date of recordation, the instrument number and document type, the name of the grantor and the grantee, the sale price, and a description of the parcel. The Department of Taxation collects information from the local assessment offices on the assessed values and the class codes of the properties for a sampling of the transactions. Localities may include their entire qualifying (“arms’ length") population in the Study with minimal cost of data collection to the Department.
Fair market sales are defined as "arms’ length" transactions in which there is a willing buyer and a willing seller, neither of whom are under pressure to buy or sell. This excludes such transfers as sales within a family, foreclosures, or sales to a government unit.
The number of sales selected in the study is determined by the personnel of the
Property Tax Unit in consultation with the localities’ assessment officer. Only arms’ length sales are selected from the total number of transfers reported in the land records of a locality.
The assessed value for each sale is divided by its selling price to produce an assessment to sales ratio. The ratios for each sale in a locality are arrayed by numerical value, and the median ratio is selected as the best indicator of that locality's existing assessment/sales ratio. The median ratio is defined as the ratio value where half the ratio values are higher and half the ratio values are lower. The median ratio is unaffected by distortions caused by large sales or "extreme" ratios at either end of the spectrum, particularly those at the higher end. The National Association of Tax Administrators, the U.S. Department of Commerce, and a special committee of the International Association of Assessing Officers (IAAO) recognize the accuracy of the median ratio. The median ratio for the state is calculated by dividing the state’s effective tax rate by the state’s nominal tax rate.
The coefficient of dispersion in this report is based on the measure recommended by the
IAAO. This measure represents the mean percentage deviation from the median ratio. This average absolute deviation method based on all sample data has been used by the Department of Taxation in every annual Assessment Sales Ratio Study since 1993. Mathematically, if Xi represents the assessment/sales ratio for the ith sale in a sample of size n, and Xm represents the median ratio of the sample, the Coefficient of Dispersion = [({Sum[Abs(Xi-Xm)]}/n)/Xm]*100. It is calculated by:
(1) Subtracting the median ratio from each ratio in the sample (2) Taking the absolute value of the calculated differences (3) Summing the absolute differences (4) Dividing by the number of ratios to obtain the ‘average absolute deviation’ (5) Dividing the average absolute deviation by the median ratio (6) Multiplying by 100 The coefficient of dispersion calculated by this method is affected by the size of the
sample (n), that is, the number of sales of property used in the study for a locality. Comparing two localities with the same median ratio and similar spread, the coefficient of one may be larger if it has a smaller sample size.
35

A small coefficient of dispersion indicates that the ratios are grouped relatively close to the median and that assessment of property is more equitable. A large coefficient indicates that there is a wide spread in the ratios around the median, reflecting a less uniform assessment of property. The acceptable level for the coefficient of dispersion depends on the type of property considered and the size of the sample. The IAAO notes that a low coefficient (15 percent or less) tends to be associated with good appraisal uniformity. A coefficient of 15 percent indicates a good distribution of assessments for single-family residential properties. Similarly, a coefficient of 20 percent or less indicates a good distribution for more diverse classes of property. A less uniform assessment translates into inequality in actual tax burdens. As market activity decreases or the complexity of properties increases, the coefficient of dispersion often rises, even though appraisal procedures may be valid. Variation in assessments may be a result, among other factors, of the length of period between reassessments, difficulty of obtaining fair market value for different types of parcels, and the unique characteristics of different properties.
Total fair market value includes the value of land, buildings, and improvements, and minerals under the surface, as well as standing timber (trees) not owned by the owners of the land/lot. This information is based on land book records and reported every year to the Department of Taxation by the local Commissioners of the Revenue and assessors. The fair market value for localities refers to 2019, except for counties and cities that conduct fiscal year reassessments, where the 2018-2019 values are reported.
The regression index is defined as the mean ratio divided by the sales-weighted ratio. The
sales-weighted ratio is the total of the assessed values divided by the total of the selling prices of all sales in the classification. It allows transfers with a larger selling price to have a greater impact on the ratio than those with smaller selling prices. A value of 1.00 indicates a uniform relationship between assessed values and selling prices of properties with different prices. An index above 1.00 indicates that less expensive property has a higher assessment/sales ratio than more expensive property. A reasonable index may be in the range of 0.95 to 1.05 percent, but tax experts have not reached a consensus in regards to this level.
The nominal tax rate for a locality is the rate of tax per $100 of assessed value that is levied for county/city and district purposes. The tax rate is calculated by dividing the real estate levies by the local real estate taxable value, as reported from the local land books by the local Commissioners of the Revenue. Some localities impose additional district levies, so that the rate is higher than the county levy reported in the Virginia Local Tax Rates Bulletin. The nominal tax rate for the state is obtained by dividing the total local real estate levies by the total taxable real estate value of all counties and cities.
The effective tax rate for a locality is calculated by multiplying the nominal tax rate by the median assessment/sales ratio. The effective tax rate for the state is computed by multiplying the total fair market value for all counties and cities by the state nominal tax rate and then dividing by the total true value of real estate for the state.
The total estimated true value of locally taxed property is composed of two components: real
estate and public service corporation property. The estimated true value of real estate is computed as the total fair market value reported in the local land book, divided by the median assessment/sales ratio for the locality. The public service corporation component includes the value reported for each locality annually by the State Corporation Commission plus the estimated true value of railroad and pipelines for each locality as reported by the Railroad and Pipeline Appraisal section of the Property Tax Unit of the Department of Taxation.
The estimated true value per capita of locally taxed property is defined as the true value of
property divided by the 2019 estimates for population as reported by the University of Virginia, Weldon Cooper Center for Public Service.
36

Locality Total
Class 1SingleFamily
ResidentialUrban
Class 2SingleFamily
ResidentialSuburban
Class 3
Multi-Family
Residential
Class 4
Commercialand
Industrial
Class 5Agricultural
withLess Than100 Acres
Class 6Agricultural
withMore Than100 Acres
Counties:Accomack 620 183 389 1 13 28 6Albemarle 1,479 1,004 401 1 22 49 2Alleghany 244 57 159 2 10 11 5Amelia 211 9 163 1 4 27 7Amherst 445 34 354 5 21 23 8
Appomattox 278 15 211 0 5 42 5Arlington 2,520 2,481 0 14 25 0 0Augusta 978 352 547 1 16 55 7Bath 79 35 29 1 2 7 5Bedford 1,566 80 1,404 6 22 51 3
Bland 36 0 28 0 0 6 2Botetourt 536 159 335 5 8 24 5Brunswick 202 18 134 1 13 29 7Buchanan 113 6 87 2 6 12 0Buckingham 186 5 140 1 4 27 9
Campbell 711 296 346 12 34 21 2Caroline 396 81 276 0 11 18 10Carroll 503 31 414 4 5 48 1Charles City 70 1 57 0 2 9 1Charlotte 121 16 74 0 7 22 2
Chesterfield 5,147 4,139 913 5 78 9 3Clarke 236 79 133 0 5 16 3Craig 78 10 42 0 3 21 2Culpeper 736 241 443 5 12 30 5Cumberland 188 11 130 0 1 40 6
Dickenson 82 12 60 0 3 6 1Dinwiddie 227 4 197 0 1 19 6Essex 207 34 151 1 6 15 0Fairfax 16,428 12,342 3,944 28 114 0 0Fauquier 1,059 260 720 0 27 48 4
Floyd 267 6 208 0 0 50 3Fluvanna 587 325 249 0 1 8 4Franklin 845 124 682 1 3 31 4Frederick 1,608 958 588 0 30 26 6Giles 221 82 113 1 11 14 0
Gloucester 679 156 493 3 13 12 2Goochland 299 50 232 2 3 12 0Grayson 337 4 268 0 2 52 11Greene 349 30 295 1 6 15 2Greensville 71 4 43 0 1 17 6
Halifax 336 78 180 0 17 51 10Hanover 1,349 874 445 0 17 13 0Henrico 4,315 4,045 167 12 84 7 0Henry 375 2 341 2 14 14 2Highland 35 5 17 0 0 11 2
APPENDIX 2NUMBER OF SALES INCLUDED IN THE 2019 ASSESSMENT/SALES RATIO STUDY
37
Locality Total
Class 1SingleFamily
ResidentialUrban
Class 2SingleFamily
ResidentialSuburban
Class 3
Multi-Family
Residential
Class 4
Commercialand
Industrial
Class 5Agricultural
withLess Than100 Acres
Class 6Agricultural
withMore Than100 Acres
APPENDIX 2NUMBER OF SALES INCLUDED IN THE 2019 ASSESSMENT/SALES RATIO STUDY
Isle of Wight 577 57 485 1 22 8 4James City 1,432 1,316 96 0 17 2 1King and Queen 93 0 65 0 1 22 5King George 382 101 268 0 3 8 2King William 368 70 265 1 7 21 4
Lancaster 262 62 187 0 7 5 1Lee 179 10 134 1 3 27 4Loudoun 6,274 5,655 506 4 77 27 5Louisa 748 61 634 0 6 40 7Lunenburg 161 43 68 0 0 44 6
Madison 220 4 179 0 8 24 5Mathews 225 1 221 0 1 2 0Mecklenburg 407 77 269 17 13 28 3Middlesex 272 41 223 0 4 3 1Montgomery 1,412 863 433 10 67 32 7
Nelson 454 191 234 0 4 20 5New Kent 365 209 143 0 3 10 0Northampton 155 54 91 0 6 3 1Northumberland 312 16 274 0 3 18 1Nottoway 163 76 72 0 3 9 3
Orange 607 275 295 5 4 24 4Page 426 190 218 0 0 15 3Patrick 295 18 220 1 6 45 5Pittsylvania 640 66 489 1 25 49 10Powhatan 510 13 471 0 14 9 3
Prince Edward 248 65 148 1 9 25 0Prince George 331 200 111 3 3 10 4Prince William 7,243 6,212 925 6 98 1 1Pulaski 530 134 345 9 21 17 4Rappahannock 124 83 21 0 2 16 2
Richmond 125 21 87 0 4 12 1Roanoke 1,368 921 399 27 16 4 1Rockbridge 404 19 325 0 9 40 11Rockingham 776 209 505 17 13 29 3Russell 256 70 159 1 9 13 4
Scott 258 48 154 0 6 43 7Shenandoah 932 379 495 3 22 27 6Smyth 331 100 187 0 14 26 4Southampton 178 25 130 0 5 11 7Spotsylvania 1,551 920 564 1 46 16 4
Stafford 2,144 1,843 260 0 33 8 0Surry 82 9 62 0 3 6 2Sussex 116 30 50 0 3 20 13Tazewell 420 171 191 2 22 30 4Warren 496 130 362 0 3 1 0
38

Locality Total
Class 1SingleFamily
ResidentialUrban
Class 2SingleFamily
ResidentialSuburban
Class 3
Multi-Family
Residential
Class 4
Commercialand
Industrial
Class 5Agricultural
withLess Than100 Acres
Class 6Agricultural
withMore Than100 Acres
APPENDIX 2NUMBER OF SALES INCLUDED IN THE 2019 ASSESSMENT/SALES RATIO STUDY
Washington 717 120 508 7 25 47 10Westmoreland 476 158 294 0 8 13 3Wise 127 52 71 0 3 1 0Wythe 459 173 239 6 17 15 9York 964 942 4 0 17 1 0
Cities:Alexandria 2,639 2,569 0 14 56 0 0Bristol 327 313 0 1 12 1 0Buena Vista 84 80 1 0 3 0 0Charlottesville 416 354 0 35 27 0 0Chesapeake 3,871 3,802 0 8 52 9 0
Colonial Heights 261 250 0 6 5 0 0Covington 95 90 0 0 5 0 0Danville 379 341 0 14 24 0 0Emporia 39 34 0 0 5 0 0Fairfax 409 376 0 0 33 0 0
Falls Church 189 184 0 0 5 0 0Franklin 83 77 0 0 5 0 1Fredericksburg 325 297 0 6 22 0 0Galax 89 76 0 3 10 0 0Hampton 1,645 1,593 0 10 42 0 0
Harrisonburg 421 342 0 58 21 0 0Hopewell 315 294 0 7 14 0 0Lexington 90 85 0 2 3 0 0Lynchburg 1,037 983 0 17 37 0 0Manassas 643 624 0 0 19 0 0
Manassas Park 222 215 0 0 7 0 0Martinsville 154 138 0 1 15 0 0Newport News 1,601 1,559 0 9 33 0 0Norfolk 2,790 2,548 0 191 51 0 0Norton 33 31 0 0 2 0 0
Petersburg 325 193 81 26 25 0 0Poquoson 177 173 0 0 4 0 0Portsmouth 1,152 1,101 0 26 25 0 0Radford 141 132 0 1 7 1 0Richmond 2,281 2,185 0 23 73 0 0
Roanoke 1,089 50 883 98 58 0 0Salem 263 235 0 11 17 0 0Staunton 390 369 1 6 14 0 0Suffolk 1,062 832 192 4 24 9 1Virginia Beach 7,027 6,826 79 7 111 4 0
Waynesboro 393 375 0 4 14 0 0Williamsburg 179 175 0 1 3 0 0Winchester 448 368 0 20 60 0 0
Virginia Totals 118,034 81,510 30,975 851 2,340 1,997 361
39

APPENDIX 3
Computations for State Median Ratio
1. The Nominal Tax Rate for Virginia is obtained by dividing the total of the local real estate levies by the total taxable fair market real estate values of all counties and cities. The local levy and taxable value refer to fiscal year 2018-2019 for the following localities which conducted fiscal year reassessments:
Counties: Charlotte Cities: Buena Vista Manassas Park Isle of Wight Covington Newport News Mecklenburg Danville Norfolk Franklin City Poquoson Fredericksburg Portsmouth Lexington Virginia Beach Lynchburg Williamsburg
Data on taxable value and levies for the above localities for Fiscal Year 2018-2019 are from the Virginia Department of Taxation's Annual Report, Fiscal Year 2019. All other localities conducted calendar year reassessments and the data for those localities is taken from the Virginia Department of Taxation's Annual Report, Fiscal Year 2020. State Nominal Tax Rate = Total Local Levy / Total FMV Taxable * 100
= $11,614,067,909 / $1,169,167,929,351 * 100
= $0.9934 per $100 of Assessed Value 2. The Effective Tax Rate for Virginia is computed by multiplying the sum of the total taxable fair market real estate values for all counties and cities by the State nominal tax rate and then dividing by the total estimated true value of real estate for the State. State Effective Tax Rate = Total FMV Taxable * Nominal Tax Rate / Total True Value of Real Estate
= $1,169,167,929,351 * 0.9934 / $1,312,209,354,240
= $0.8851 per $100 of True Value
3. The Median Ratio for Virginia is calculated by dividing the State effective tax rate by the State nominal tax rate. State Median Ratio = State Effective Tax Rate / State Nominal Tax Rate
= $0.8851 / $0.9934
= 89.10%
40