the ab cd pattern - · pdf file14/08/2007 · courtesy of lambert gann publishing....
TRANSCRIPT

c04 JWPR033-Pesavento (Wiley Trading Series) August 14, 2007 13:3 Char Count=
C H A P T E R 4
The AB=CDPattern
I t has been said many times in trading to study, learn, and trade methodsthat are simple in nature. The AB=CD pattern is one of the most basicand simple patterns in technical analysis. If the trader will take the time
to learn this pattern and its variations, it will be time well spent.We teach you this pattern here both in structure and from a trading
standpoint using real chart examples. In coming chapters we show youhow this simple pattern is also formed within other patterns such as theGartley “222” pattern, Butterfly pattern, Three Drives pattern, and some ofthe classic technical analysis patterns.
HISTORY OF THE AB=CD PATTERN
In 1935 a book was published for sale to investors at an incredible priceof $1,500. That book was Profits in the Stock Market by H.M. Gartley. Onpage 249, under “Practical Use of Trend Lines,” Gartley describes a chartpattern that we now call the AB=CD pattern. (See Figure 4.1.)
39

c04 JWPR033-Pesavento (Wiley Trading Series) August 14, 2007 13:3 Char Count=
40 TRADE WHAT YOU SEE
Figure 4.1 Illustration of the Parallel Trend Lines chart found in H.M. Gartley’sbook, Profits in the Stock Market (1935).Courtesy of Lambert Gann Publishing. P.O. Box 0, Pomeroy, WA 99347. www.wdgann.com.
This pattern has appeared in another work, one by Frank Tubbs. Tubbsoffered a correspondence course in the 1950s called The Frank Tubbs
Stock Market Course. This course was based on the pattern that Gartleyhad explained in his 1935 book.
Tubbs used many charts from the 1920s and 1930s in his descriptionof the pattern and brought the work forward into the 1950s, validating thisclassic pattern. Charles Lindsay also used this pattern in his book Trident:
A Trading Strategy written in 1976. Lindsay identified trends as micro,minor, intermediate, and major. He illustrated that the parallel price swingswere apparent on all charts and in all time frames. The system describedwas identical to Gartley’s pattern. Lindsay labeled his pattern with P1, P2,P3, and P4, which were nothing more than A, B, C, and D.
Lindsay took the AB=CD pattern and made it into a formula that wouldgive the pattern a completion target at D (P4), so the formula would be:
P4 = P2 + P3P1
This is equivalent to:
D = B + CA
He then came up with a formula that said P3 should be a ratio of .625of P1 to P2. This is equivalent to a .618 retracement by the BC leg from theAB swing. (See Figure 4.2.) He took 25 percent of the P1 or the first leg asa risk factor.

c04 JWPR033-Pesavento (Wiley Trading Series) August 14, 2007 13:3 Char Count=
The AB=CD Pattern 41
Figure 4.2 Merck (MRK) daily chart showing AB=CD pattern with .618 retrace-ment of the AB leg. This is similar to Lindsay’s .625 retracement of the P1 to P2leg.
AB=CD PATTERN DESCRIPTION
Gartley’s description of the AB=CD pattern illustrated how the marketwould rally in an uptrend and then retrace. It would then rally to anotheruptrend then make another retracement, forming an upsloping parallelchannel. It was from this description that the AB=CD pattern achieved itsnickname, the lightning bolt. (See Figure 4.1.)
Gartley spent several pages referring to these trend lines and parallellines as excellent signals when used in conjunction with other workingtools. He also applied these lines to price ratios. He used mainly ratios ofone-third and one-half for retracements.
AB=CD PATTERN STRUCTURE
The AB=CD pattern is found in all markets and all time frames. This pat-tern is the foundation for the Gartley buy and sell patterns (discussed inChapter 5). It is also an integral part of the Butterfly pattern (Chapter 6)and also forms a part of the Three Drives pattern (Chapter 7). The pattern

c04 JWPR033-Pesavento (Wiley Trading Series) August 14, 2007 13:3 Char Count=
42 TRADE WHAT YOU SEE
is a measured move where the CD leg is similar in length to the AB leg. Itshould be noted, though, that the CD leg can extend and will not always beexactly equal to the AB leg; this is discussed in “Important Characteristicsof the AB=CD Pattern” later in this chapter. Figure 4.3 shows the shape ofthe basic AB=CD buy and sell patterns.
There are three legs that form this pattern. (See Figure 4.4.) The firstleg of the pattern is labeled AB. After the completion of the first leg, a re-tracement or correction occurs that will usually find support or resistanceat one of these Fibonacci levels: .382, .50, .618, or .786. This correctionor retracement is labeled BC and is the second leg of the pattern. (Note:Strongly trending markets will usually see only a retracement to the .382level. See the chart in the “Slope and Time Frames” section later in thechapter for an example of a shallow retracement at the .382 level.)
Figure 4.3a Basic structure of the AB=CD pattern, illustrating the “lightning bolt”shape of the buy and sell patterns.
Figure 4.3b AB=CD buy and sell patterns with S&P E-mini chart price.

c04 JWPR033-Pesavento (Wiley Trading Series) August 14, 2007 13:3 Char Count=
The AB=CD Pattern 43
Figure 4.4 Merck (MRK) daily chart showing completed AB=CD pattern. This pat-tern completion leads to retracements of the AD swing of almost all the main Fi-bonacci levels we use.
When price resumes in the same direction as the AB leg, the CD legthen begins to form. Once we identify the CD leg forming, we can projectthe potential pattern completion and devise a trading strategy. As the CDleg forms and completes, we monitor the final leg for any warning signsthat would alert us to a change in market conditions that may signal us topossibly pass on the trade or wait for further confirmation before enter-ing the trade. Chapter 11, “Trade Management,” covers this in more detail.Once the price exceeds B, we make an assumption that the price will reachpattern completion at point D.
When studying this pattern, it is important to know what invalidatesthe pattern. Here are three items that would invalidate the AB=CD pat-tern:
1. BC cannot exceed the AB leg, meaning the retracement of AB cannotexceed 1.00.
2. BC can be a 1.00 retracement of the AB leg; this is a rare pattern and adouble top or bottom, but it is a valid pattern.
3. D must exceed B in order for the pattern to complete at point D and bea valid AB=CD pattern. See Figure 4.5 as an example.

c04 JWPR033-Pesavento (Wiley Trading Series) August 14, 2007 13:3 Char Count=
44 TRADE WHAT YOU SEE
Figure 4.5 Euro daily chart. Once price exceeds B, we assume the pattern willcomplete at point D.
IMPORTANT CHARACTERISTICS OF THEAB=CD PATTERN
About 40 percent of the time, the AB=CD pattern will be perfectly symmet-rical, meaning AB equals CD. The other 60 percent of the time variationsof the pattern will be present. What this means is that after the AB leghas formed and the retracement leg, BC, has completed, the CD leg willbe different from the AB leg. The two legs may or may not be perfectlysymmetrical.
Some of the ways the CD leg can vary from the AB leg include:
Ĺ The CD leg is an extension of AB anywhere from 1.27 to 2.00 (orgreater). See Figure 4.6 as an example.
Ĺ The CD leg has a slope or angle steeper or wider than AB.
At first glance this variation might make the trader think the patternis not tradable. The key lies in identifying the BC leg. The most importantthing is to watch the price action coming after point C has formed. Manyof the examples that you will see in this chapter will show that the CD legdetermines the relationship to the AB leg.

c04 JWPR033-Pesavento (Wiley Trading Series) August 14, 2007 13:3 Char Count=
The AB=CD Pattern 45
Figure 4.6 Daily chart of 30-year bonds showing AB=CD pattern with the CD legextending to 1.27 of the AB leg.
CD LEG VARIATIONS
These CD leg phenomena can be described in four ways:
1. If after point C has occurred a gap exists in the direction of point D,this usually indicates that the CD leg will be much greater than the ABleg—1.272, 1.618, or more. See Figure 4.7 as an example.
2. A wide range bar (twice normal size) at point C is another indicationthat the CD leg could become extended. See Figure 4.8 as an example.
3. Ideally, AB=CD moves are symmetrical in price and time. For exam-ple, if the AB leg is six bars up, then the CD leg will be six bars up. SeeFigure 4.9 as an example.
4. As illustrated in Figure 4.10, the time to form the two legs is symmetri-cal.
This next sentence is very important: If the CD leg is made in just a fewbars, this strongly indicates that the CD leg is going to be an expansion ofthe AB leg. See Figure 4.11 for an example of this.
As an example of this thrust principle, imagine having two Ferrari auto-mobiles on the racetrack, one with diesel fuel and the other with high-tech

c04 JWPR033-Pesavento (Wiley Trading Series) August 14, 2007 13:3 Char Count=
46 TRADE WHAT YOU SEE
Figure 4.7 Classic AB=CD pattern on EOG Resources (EOG) daily chart with gapfrom point C and sharp sloping down move to point D suggests CD leg will extend.
Figure 4.8 All the warning signs are present in this 120-minute chart of the NAS-DAQ futures. (Warning signs are discussed in Chapter 11.) Notice the long bars asthe CD leg is just beginning down. This gives the trader an alert that the CD leg maybe an extension to 1.272, 1.618, or greater of the AB leg.

c04 JWPR033-Pesavento (Wiley Trading Series) August 14, 2007 13:3 Char Count=
The AB=CD Pattern 47
Figure 4.9 Euro currency daily chart showing AB=CD pattern with very symmet-rical six bars up in the AB leg and six bars up in the CD leg.
Figure 4.10 Google (GOOG) 5-minute chart showing time is also an element inthe symmetry of the patterns.

c04 JWPR033-Pesavento (Wiley Trading Series) August 14, 2007 13:3 Char Count=
48 TRADE WHAT YOU SEE
Figure 4.11 A very long bar from the C turning point in this Intel (INTC) dailychart indicates that the CD leg will be an expansion of the AB leg.
gasoline. It would be easy to understand the Ferrari powered with high-tech gasoline getting to the finish line first. Watch the CD leg, because if itstarts fast, that is the faster Ferrari going further faster.
SLOPE AND TIME FRAMES
The slope or time frame of the BC move can also be helpful in determin-ing the pattern. BC legs generally correct to one of the Fibonacci ratios:.382, .50, .618, or .786. The slope of this BC leg is usually a good indica-tion of what the next CD leg will be. For example, assume that the AB legtook 15 trading bars to reach point B, and now the BC leg has taken 8 barsbut has retraced only .382 percent of the AB leg. This is a sign of the mar-ket absorbing a lot of selling at a high price; it is a shallow retracement,and the price has not been able to retrace to .50, .618, or .786 percent. Wewould assume that prices would go much higher and possibly quite rapidlyonce the selling slows. However, if the market retraces to a .618 or .786retracement, the CD leg will most probably be a normal move equalingAB=CD.

c04 JWPR033-Pesavento (Wiley Trading Series) August 14, 2007 13:3 Char Count=
The AB=CD Pattern 49
To figure the extension of the CD leg, take the difference between Aand B and multiply it by 1.272 or 1.618; then add the resulting figure to thelow (or subtract it from the high) of C. The steps in Figure 4.12 to find the1.618 projection would be calculated like this:
Ĺ B = 1274 − A = 1256 = 18 pointsĹ 18 points × 1.618 = 29.12Ĺ Add this to the low of C: 1266.25 + 29.12 = 1295.37
(If figuring 1.272 or any other extension number, simply use that num-ber in place of 1.618.)
The number of time bars in the AB=CD pattern will usually range fromfive to eight bars. When the CD leg is extending beyond eight bars in an upor down move, the probability is for a price extension where CD will be1.272, 1.618, or greater of the AB swing.
The examples in this chapter give a good point of reference to studythese types of patterns. The reader should keep in mind that these pat-terns are only probabilities; they are not certainties, and trying to use thesepatterns without a solid understanding of them and a sound money man-agement strategy is equivalent to trading suicide.
Figure 4.12 In this S&P E-mini 30-minute chart, the 1.618 extension can be fig-ured by taking the difference between the high and low of AB, multiplying it by 1.618,and adding it to the low (or subtracting it from the high) of C.

c04 JWPR033-Pesavento (Wiley Trading Series) August 14, 2007 13:3 Char Count=
50 TRADE WHAT YOU SEE
PSYCHOLOGY OF THE AB=CD PATTERN
Classic crowd psychology also forms the legs of the AB=CD pattern. Thereare two mechanisms that make the market move up and down—more buy-ers or more sellers; this is the ultimate greed barometer. Since fear is astronger emotion than greed, markets tend to go down faster than they goup.
Price action in any actively traded market can be broken down intothree steps:
1. Up moves.2. Down moves.3. Sideways moves.
The AB=CD pattern contains all three of these movements in a sim-ple geometric form. Its trading value comes from its repetitive nature. Itmeasures buying enthusiasm and selling climaxes.
Using an AB=CD sell pattern as an example (refer back to Figure 4.5),as the price begins to rise in the AB leg it catches the interest of those want-ing to be in early. This could be early buying from large money sourcessuch as mutual funds, pensions, and so on. As the price continues to rise,speculators may take note and climb on board, causing the price to risefurther into the AB leg. Toward the top of the AB leg, individual investors(the general public) may start buying, not wanting to miss the move. Theremay be some news items on the individual stock or market, further draw-ing attention to the price rise. It is usually the case that this is toward theend of the first leg. Once the first leg is complete, some profit taking oc-curs and the price begins down. Those who bought near the top of this legare now at a loss and some fear begins to set in, which can increase theselling.
As the price declines toward the Fibonacci retracement levels, thosewho may have missed the first move up begin to step in to buy the dip.Institutional investors may add to their positions, and speculators also maystep in to buy a higher low, providing price support. The selling subsides,and the price finds support as more new buyers come into the stock ormarket and the price begins to resume its rise (CD leg). At this point someinvestors who rode out the loss from buying near the top of the AB legmay sell as the price approaches their breakeven point on the retracementsback up from the BC leg. Some who missed getting out at a profit near thetop of the AB leg now take profits as the price is close to those levels again.
The CD leg now begins to repeat the cycle of buyers, and as the pricerises further those who realized they sold too soon may jump back in. Anew surge of buying (or selling) will then push the price through the Bpoint to complete the pattern at D.

c04 JWPR033-Pesavento (Wiley Trading Series) August 14, 2007 13:3 Char Count=
The AB=CD Pattern 51
TRADING THE AB=CD PATTERN
The AB=CD pattern can be found and traded in any time frame. We willshow you examples of how we approach trading this pattern, including ex-amples of both winning and losing trades. Here we show trade chart exam-ples and trade management that could be applied to each trade; ultimatelyit is up to the individual trader to use a well thought-out and studied tradingplan. (See Chapter 13, “Building a Trading Plan.”)
We use two contracts in the futures or commodities markets trades toillustrate examples of scaling out in two parts, and also present an alternatetrade management example using one exit. The stock examples use 200shares to illustrate scaling out in two parts.
Trade Setup #1: AB=CD Sell Pattern
Market: S&P 500 E-mini
Contracts: 2
In the trade shown in Figure 4.13, the S&P E-mini market completesa picture-perfect AB=CD sell pattern. A limit order would be used on thisentry at approximately 1286 to go short, just below the completion point atD. Once the order is filled, a stop-loss buy order is placed 5 points abovethe entry. In this case the stop-loss buy order would be placed at 1291.
The first exit is at the .618 retracement of the AD swing. We shadethe exit order, meaning we place orders just above or below the actualexit, just as we do the entry orders, about .50 to 1 point away to try toensure a fill. The exit order would be placed at 1279.50, just above the .618retracement. Occasionally the market may trade just at but not through theprice, and it will be up to the individual trader’s discretion how to handlethese situations. We prefer to exit if the price is traded at, even if it meansslightly less profit. We don’t want a winning trade to turn into a losing trade.
Risk-Free Trade Once a profit is realized on the first part, the stop-lossorder is then moved to the breakeven point. This accomplishes two veryimportant things:
1. Reduces the risk in the trade.2. Books a profit.
At this point in the trade we have a 6.5-point profit and our stop hasbeen moved to the breakeven point. Our second profit objective is at the.786 retracement level from the A–D swing. We place a limit order to exitthe second contract at 1277.25, just above the .786 retracement level. Once

c04 JWPR033-Pesavento (Wiley Trading Series) August 14, 2007 13:3 Char Count=
52 TRADE WHAT YOU SEE
Figure 4.13 This is a picture-perfect S&P E-mini day trade of the AB=CD sell pat-tern. The market turns down almost exactly at the completion of D (15-minute chart).
the second profit objective is filled, we then remove our stop-loss order.The second contract profit nets 8.75 points for a total profit of 15.25 points.
Alternate Trade Management As mentioned earlier, there are manyways to manage trades. In this particular example, a trader could choose toexit both contracts at the initial .618 profit objective. In this case the traderwould have netted +13 points. In terms of 5 points being risked initially fora total of 10 points of risk, this is perfectly acceptable trade management. Ifthe trade had been stopped out after the first profit objective was reached,then the trader would have netted +6.5 points on the trade. We have foundthat it is best to take profits when available and not worry about what themarket does after you have reached your profit objectives. Always keep inmind that you are trading to make profits. In our trading we use both meth-ods to exit our trades. Which method we use depends on current marketconditions.
Trade Setup #2: AB=CD Buy Pattern
Market: S&P 500 E-mini
Contracts: 2

c04 JWPR033-Pesavento (Wiley Trading Series) August 14, 2007 13:3 Char Count=
The AB=CD Pattern 53
Figure 4.14 S&P E-mini 15-minute chart showing an AB=CD buy pattern tradewhere shading the order just above the actual completion point definitely helped usto get into the trade.
The S&P E-mini buy pattern setup shown in Figure 4.14 is a very goodexample of why we want to shade the orders to try to ensure a fill. Thistrade has an entry at 1232. Once the order is filled, an initial 5-point sellstop is placed. The first objective is easily reached within two time bars.On the chart you can see the long bar up from the entry point; this givesan indication that the price will make it to the .618 retracement. Once thefirst profit objective is reached, the stop is moved to breakeven to protectprofits and to put us in a risk-free trade. The second profit objective is atthe .786 retracement. Once the second profit objective is reached, the stop-loss order is canceled and that trade is over. This particular trade wouldhave netted the trader +19 points.
Alternate Trade Management A full exit at the .618 level would havebeen a perfectly acceptable way to manage this trade. That would havegiven the trader a net profit of 16 points.
Trade Setup #3: 60-Minute Failed AB=CDBuy Pattern
Market: Wal-Mart (WMT) Stock
Shares: 200

c04 JWPR033-Pesavento (Wiley Trading Series) August 14, 2007 13:3 Char Count=
54 TRADE WHAT YOU SEE
Figure 4.15 This AB=CD buy pattern trade (60-minute chart) of Wal-Mart (WMT)stock illustrates a very important point: Always use stop-loss orders.
An example of a failed AB=CD buy pattern is shown in Figure 4.15. Asnoted on the chart, there are gaps and a steep CD leg down to the com-pletion point. Sooner or later traders will find themselves in a gap-opensituation against their position. Usually the first loss is the best loss, and atrader must always use stop-loss orders. This is a lucky exit with the stopplacement. Had the position been open with the gap down, then a stop canbe placed just below the immediate low of the day to ensure no additionalloss is incurred and then the trade can be exited on the first rally. (Refer toFigure 4.15 for stop-loss placement on this trade.) A $2.00 stop-loss wouldhave been used, and the trader would have been stopped out for a loss of$400 on 200 shares.
The use of stop-loss orders is essential in good trading and money man-agement. We never know which trades will win or lose, and controlling therisk allows us to move on to the next trade.

c05 JWPR033-Pesavento (Wiley Trading Series) August 14, 2007 13:4 Char Count=
C H A P T E R 5
The Gartley“222” Pattern
The Gartley “222” pattern is certainly one of the classic retracementpatterns. It offers the trader early entry with minimum risk into apotential longer-term trend reversal. For short-term day traders, the
pattern can be used effectively to buy and sell tests of highs and lowson an intraday basis. Gartley said to buy or sell the first AB=CD patternin a new bear or bull market, and that is what this pattern can achievealong with entries into an already established trend. A major reversal maynot always follow with this pattern, but even so the trader can still gainprofits using good trade management skills (assuming the pattern is not afailure pattern).
HISTORY OF THE GARTLEY “222” PATTERN
The Gartley “222” pattern is named for the page number it is found onin H.M. Gartley’s book, Profits in the Stock Market. Since then, multiplebooks have been written describing the Gartley “222” pattern and chartingsoftware that applies it. Ensign Software was the first to mathematically
55
c05 JWPR033-Pesavento (Wiley Trading Series) August 14, 2007 13:4 Char Count=
56 TRADE WHAT YOU SEE
provide the pattern in its charting software to be used on any activelytraded stock, commodity, or futures market.
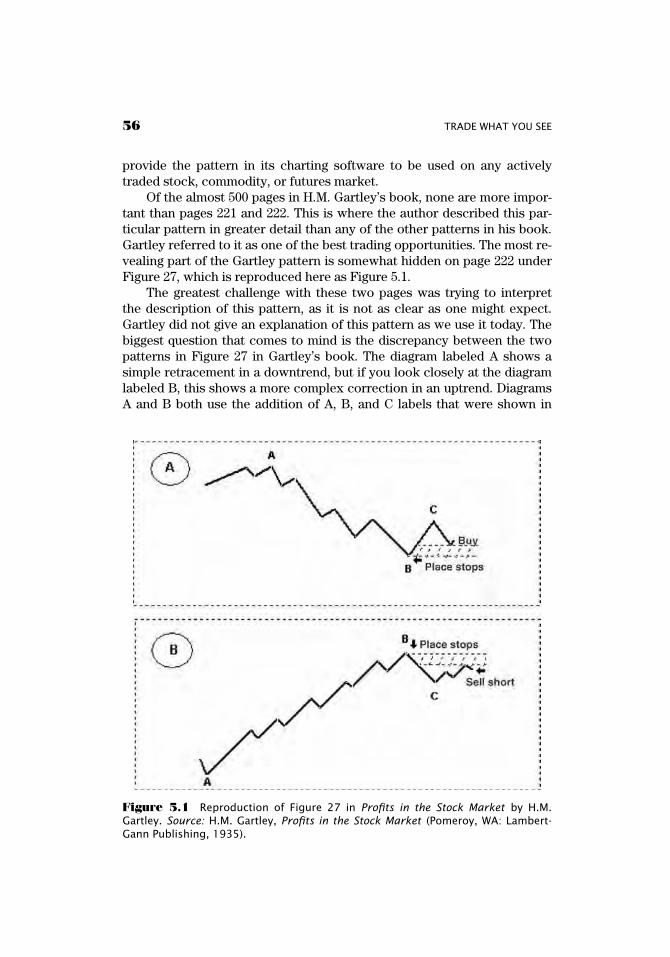
Of the almost 500 pages in H.M. Gartley’s book, none are more impor-tant than pages 221 and 222. This is where the author described this par-ticular pattern in greater detail than any of the other patterns in his book.Gartley referred to it as one of the best trading opportunities. The most re-vealing part of the Gartley pattern is somewhat hidden on page 222 underFigure 27, which is reproduced here as Figure 5.1.
The greatest challenge with these two pages was trying to interpretthe description of this pattern, as it is not as clear as one might expect.Gartley did not give an explanation of this pattern as we use it today. Thebiggest question that comes to mind is the discrepancy between the twopatterns in Figure 27 in Gartley’s book. The diagram labeled A shows asimple retracement in a downtrend, but if you look closely at the diagramlabeled B, this shows a more complex correction in an uptrend. DiagramsA and B both use the addition of A, B, and C labels that were shown in
Figure 5.1 Reproduction of Figure 27 in Profits in the Stock Market by H.M.Gartley. Source: H.M. Gartley, Profits in the Stock Market (Pomeroy, WA: Lambert-Gann Publishing, 1935).

c05 JWPR033-Pesavento (Wiley Trading Series) August 14, 2007 13:4 Char Count=
The Gartley “222” Pattern 57
Gartley’s Parallel Trend Lines chart (refer back to Figure 4.1). Thesedistinct differences between the simple and complex corrections led to theGartley “222” pattern that we know today. This provided a clearer pictureof what the pattern was all about; realizing the differences of the correc-tions led to a breakthrough after many attempts to understand the concept.
The next step in the development of this pattern was the addition ofthe mathematical relationships of sacred geometry (which includes theFibonacci summation series). Adding the Fibonacci ratios to this patterngave the pattern recognition swing trader the tools to determine price en-try, exit points, and stop levels for risk control. The final step was empir-ically and statistically testing the validity of these patterns. Gartley hademphasized that the pattern was correct approximately 70 percent of thetime. Testing weekly, daily, and intraday patterns over the past 40 yearshas proven that Gartley’s original premise was indeed accurate.
GARTLEY “222” PATTERN DESCRIPTION
While Gartley described both buy and sell patterns identically, he had dif-ferent diagrams for each. It was the AB=CD pattern within the Gartley sellpattern that led to the nickname Gartley “222.” Gartley applied this particu-lar pattern to all the market indexes, and he also published it in his weeklynewsletter.
The difference between Figure 5.1 (Figure 27 in Profits in the Stock
Market by H.M. Gartley) and the Gartley “222” pattern that we use today isin the combination of two of Gartley’s patterns:
1. The practical use of trend lines diagram from page 249 of Gartley’sbook (Figure 4.1).
2. Gartley’s retracement pattern coupled with the AB=CD pattern(Figure 5.1).
Combining both of these elements creates a buy pattern and a sell pat-tern.
Larry Pesavento found about 20 years ago that by further adding the ra-tios from the Fibonacci summation series, he could develop a solid tradingpattern. Gartley also used ratios of one-third and two-thirds with this pat-tern but did not use ratios from the Fibonacci summation series. The mainFibonacci retracement ratios that we apply to the Gartley pattern include:.382 (used with strong trends), .50, .618, and .786. As mentioned in the fol-lowing section on pattern structure, the 1.00 can be used for a double topor bottom.
c05 JWPR033-Pesavento (Wiley Trading Series) August 14, 2007 13:4 Char Count=
58 TRADE WHAT YOU SEE
Gartley stated in his 1935 masterpiece that over a 30-year period hefound these patterns to be profitable in 7 out of 10 cases. The statisticsvalidating this are still the same as Gartley suggested over 70 years ago.
GARTLEY “222” PATTERN STRUCTURE
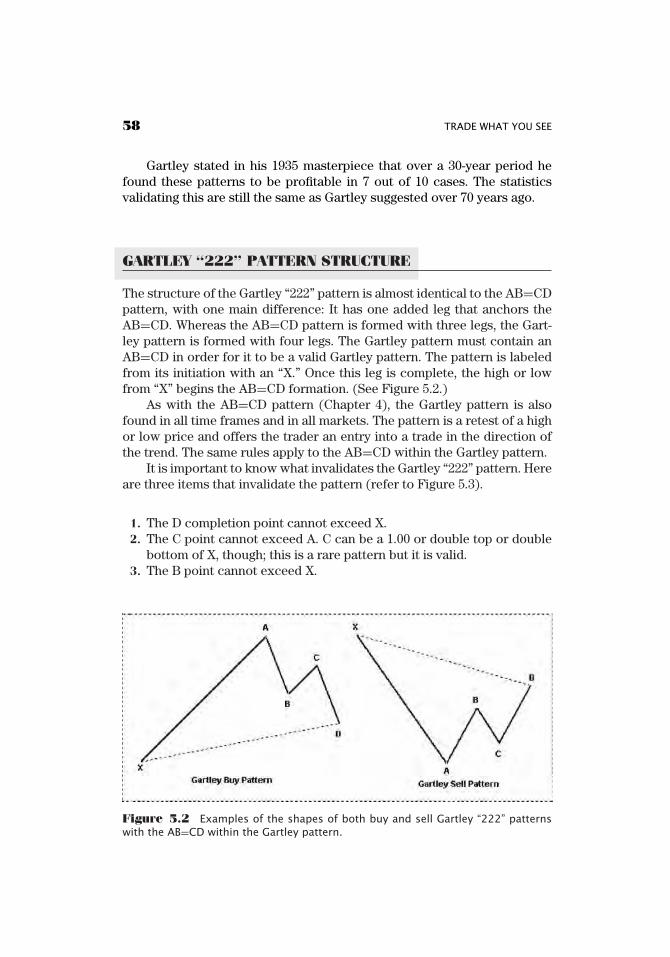
The structure of the Gartley “222” pattern is almost identical to the AB=CDpattern, with one main difference: It has one added leg that anchors theAB=CD. Whereas the AB=CD pattern is formed with three legs, the Gart-ley pattern is formed with four legs. The Gartley pattern must contain anAB=CD in order for it to be a valid Gartley pattern. The pattern is labeledfrom its initiation with an “X.” Once this leg is complete, the high or lowfrom “X” begins the AB=CD formation. (See Figure 5.2.)
As with the AB=CD pattern (Chapter 4), the Gartley pattern is alsofound in all time frames and in all markets. The pattern is a retest of a highor low price and offers the trader an entry into a trade in the direction ofthe trend. The same rules apply to the AB=CD within the Gartley pattern.
It is important to know what invalidates the Gartley “222” pattern. Hereare three items that invalidate the pattern (refer to Figure 5.3).
1. The D completion point cannot exceed X.2. The C point cannot exceed A. C can be a 1.00 or double top or double
bottom of X, though; this is a rare pattern but it is valid.3. The B point cannot exceed X.
Figure 5.2 Examples of the shapes of both buy and sell Gartley “222” patternswith the AB=CD within the Gartley pattern.

c05 JWPR033-Pesavento (Wiley Trading Series) August 14, 2007 13:4 Char Count=
The Gartley “222” Pattern 59
B and / or D cannot exceed X.
C cannot exceed A.
Figure 5.3 Soybeans daily chart illustrating the conditions that would invalidatea Gartley buy pattern.
The same warning signs apply to the Gartley pattern as to the AB=CDpattern: gaps in the CD leg near the completion point, wide range bars, andtail closes. (See Chapter 11.)
IMPORTANT CHARACTERISTICS OF THEGARTLEY “222” PATTERN
The Gartley pattern can be broken down into four segments that relate tothe labeling of the swings. Point X is the high or low point of the swingand is the starting point of the pattern. The X can be found on longer timeframes at major highs or lows. However, the X can also sometimes be foundas a top or bottom within a larger trend; in other words, the pattern canform within a larger swing or leg without the X being a major top or bottom.(Refer to Figure 5.4.) It is important to remember that most traders will notbe initiating trades at exact tops and bottoms the majority of the time, butthe Gartley pattern offers the trader a retracement entry into the trend atlow-risk trading points and with quantified risk levels.
The X point becomes the fulcrum or anchor price that all technicaltraders watch daily. After point X is formed and the market begins to movein one direction, the XA leg starts to form; at this stage it is impossible to

c05 JWPR033-Pesavento (Wiley Trading Series) August 14, 2007 13:4 Char Count=
60 TRADE WHAT YOU SEE
Figure 5.4 Daily chart of 30-year bonds showing a good example of a downtrendand the Gartley sell patterns that formed with the X point being within the trend.
determine where the completion of the XA leg may be. There are certaincharacteristics of how this first swing embarks that give clues to the lengthand thrust of the XA leg: If there are gaps, wide range bars, and tail closesin the direction of the trend, it may be some time before a correction takesplace. (Refer back to Figure 4.7.)
As this first leg accelerates, it will take out old support or resistancelevels from past chart data. The only way to visually know that the XAleg is complete is by the formation of the second leg, labeled AB. Near thecompletion of A, many times a doji bar and/or tweezer bar will form, tellingus that the momentum may be slowing at this point. A doji bar is a type ofJapanese candlestick in which the close is at or near the open of the bar;it is considered a neutral bar. A tweezer top or bottom is also a Japanesecandlestick pattern; it forms when two bars have the same high or low.(See Figure 5.5.)
Once it has been determined that the XA leg is complete, then the nextstep is to watch the formation of the AB leg. This leg is the first reaction upor down from the initial impulse wave from X. The key items to watch inthis formation are:
Ĺ The Fibonacci retracement ratio to which the market corrects.Ĺ The number of bars that form the leg.

c05 JWPR033-Pesavento (Wiley Trading Series) August 14, 2007 13:4 Char Count=
The Gartley “222” Pattern 61
Figure 5.5 S&P 5-minute chart showing examples of a tweezer top and tweezerbottom pattern. The tweezer top pattern and the lower tweezer bottom pattern alsoshow a doji bar or a neutral close marked with an arrow.
Ĺ The similarities in slope and thrust. (See Chapter 4, section titled“Slope and Time Frames.”)
For example, if the AB leg takes a considerable amount of time (morethan 8 to 10 bars) to form, then we would assume that the market is headingfor a larger correction, potentially to .618, .786, or further.
As the price begins to turn down or up from B, it is important to notethat the pattern would be invalid if the BC leg exceeded X. (Refer to Figure5.3.) It is possible for the completion point of this leg at C to be an exactdouble bottom or top of the X point, and that is still a valid pattern. But ifthe price at C exceeds X, the pattern is then invalid; it would potentiallybe forming a Butterfly Extension pattern. (See Chapter 6 for more on theButterfly pattern.)
PSYCHOLOGY OF THE GARTLEY“222” PATTERN
In Chapter 4 we described the crowd psychology of the AB=CD pattern.The same elements apply to the Gartley “222” pattern. It is formed by fear

c05 JWPR033-Pesavento (Wiley Trading Series) August 14, 2007 13:4 Char Count=
62 TRADE WHAT YOU SEE
and greed levels of the market participants. When the Gartley pattern formsat a major top, the initial move from the top finds support at the A point.(We use a sell pattern as an example here to describe the crowd psychol-ogy; refer to Figure 5.4.) Markets rarely go straight up or down withoutany correction. This point in the pattern is formed when enough marketparticipants view this area as a buying opportunity and the price can rallyfrom there. This is also true from the C point of the pattern. Since thereare always buyers and sellers in a market, as the price forms the B and Dpoints, sellers step in, seeing these as areas either to exit the market or toinitiate short positions. The D point of the pattern is the moment of truthto determine if the buyers or the sellers will be the winners. A price declinewill reward the sellers, and price above the X point will deem the pattern afailure.
If the pattern is successful, the price can accelerate to the downsideif it exceeds the A point. At this point many previous support areas arebeing broken and all traders or market participants who bought above theA point are now at a loss on the positions. It is true to human nature thata few are quick to get out with minimum losses while many others arewaiting for the price to come back up to their entry price—which may ormay not occur. As the price continues to decline, more market participantswho are experiencing larger losses are forced to liquidate at undesirableprice levels. There is usually some type of selling climax that signals thebottom, and support is found as new buyers step in.
TRADING THE GARTLEY “222” PATTERN
As mentioned earlier, the Gartley pattern can be found and traded in anytime frame. This particular pattern eliminates the need to pick tops andbottoms, as it is a retest of the recent high or low. By definition, it is buyinga higher low or selling a lower high, which is ideal for trading with thetrend. The trend is defined by higher highs and higher lows in an uptrendand lower highs and lower lows in a downtrend.
The following three trade examples using the Gartley “222” patternillustrate entry, exit, and stop placements. Refer to Chapter 13, “Build-ing a Trading Plan,” to help you develop a personal trading plan for thispattern.
We use two contracts in the futures or commodities trade examplesand 200 shares of stock to illustrate scaling out in two parts. We alsopresent a couple of examples under the heading “Alternate Trade Man-agement” to provide an assortment of options for managing these patternsetups.

c05 JWPR033-Pesavento (Wiley Trading Series) August 14, 2007 13:4 Char Count=
The Gartley “222” Pattern 63
Trade Setup #1: Gartley “222” Buy Pattern
Market: Soybeans
Contracts: 2
The entry point in this trade is at the .786 completion at point D. SeeFigure 5.6 for several repetitions of the .786 in this pattern. Notice the sec-ond AB=CD pattern that forms within the CD leg, marked in parentheses;this gives us an indication of where the pattern may complete.
A limit order just above the .786 at 586.00 would be used on this tradewith an initial stop-loss order of 8 cents or $400 per contract. When trad-ing the Gartley pattern it is ideal to be able to place a stop just below the1.00 (X) level, but this will sometimes be too large for the amount of dol-lars risked and a dollar amount will be calculated for the stop-loss orderinstead. Always look at the amount of risk and where the stop must beplaced in any trade. If the trader cannot find an acceptable stop level ac-cording to the trader’s money management plan, then the trade should bedropped and another trade with acceptable risk should be found. We can
Figure 5.6 Soybeans daily chart showing a Gartley “222” buy pattern setup thathas three repetitions of the .786 ratio. This may give the trader a clue as to the profitobjective.

c05 JWPR033-Pesavento (Wiley Trading Series) August 14, 2007 13:4 Char Count=
64 TRADE WHAT YOU SEE
always reenter a trade that is stopped out if the pattern is still intact. Theseare the types of decisions that traders must make continually.
Risk-Free Trade The first exit in this trade at 594.00 will be at a profitof 8 cents or $400. The reason for this is if we risked 8 cents and we cantake a partial profit at 8 cents, we can then move our stop up to breakevenand thereby either reduce the risk in the trade or put ourselves in a risk-freetrade.
The second exit in this trade is at the .618 at 622.00. This particulartrade would have netted +8 cents on the first contract and +36 cents onthe second contract for a total of +44 cents per contract, which equals$2,200.
As the price moves in the trader’s favor and in the anticipated direc-tion, the trader can trail the stop to lock in profits. There is no exact wayto do this, and there is no 100 percent method that will work all of thetime. If the trader is stopped out on a trailing stop prematurely before theprice reaches the final profit objective, the trader can reenter the trade ona retracement type pattern (refer to Chapter 8 for more information on re-tracement entries). A trailing stop may be used by implementing a specificdollar amount or a percentage of price, or by using Fibonacci retracementlevels. Place the stop above or below key levels or other visual support orresistance chart levels.
In Figure 5.7 you can see that once the price makes the .382 retrace-ment from the AD swing of the Gartley buy pattern, a new retracementprojection can then be done from the most recent swing low price to thehigh or the swing price at the .382 retracement of the AD leg, and a trailingstop can be placed below the .786 of that retracement. The assumption isthat if the price goes below the .786 on that retracement the pattern maybe failing. In this case this would have been the third stop placement forthis trade:
1. Initial stop at 578.00.2. Stop moved to breakeven after exit #1.3. Trailing stop moved to below the .786 retracement.
Alternate Trade Management In this example we show you exit-ing in three parts versus two parts. On longer time frames and with largertargets, using a trading strategy that employs a three-part scaling-out exitcan produce more profits. The downside, of course, is that if the trade isstopped out at a loss, then additional losses will be incurred. The correctmoney management for the trader’s portfolio should always be used andnever exceeded to implement this strategy. Another downside to this strat-egy is that if the third objective is not reached and the price reverses, the

c05 JWPR033-Pesavento (Wiley Trading Series) August 14, 2007 13:4 Char Count=
The Gartley “222” Pattern 65
Figure 5.7 Soybeans daily chart showing an example of using Fibonacci retrace-ment levels to trail a stop.
trader may end up giving back some of the profits if the third contract isstopped out below the second profit objective area.
In Figure 5.6 we have marked the .786 level as the third and final profitobjective exit. The trader in this particular trade would most likely havebeen able to gain an additional 11 cents per contract or $550.
Trade Setup #2: Gartley “222” Sell Pattern
Market: Google (GOOG) Stock
Shares: 200
A limit order to sell (refer to Figure 5.8) would be placed just below the.786 at $384.25 per share to sell short. Once the order is filled, immediatelyplace a protective buy stop order above the 1.00 or X level for a risk of$5.50 per share at $389.75. The first profit objective (exit #1) is equal to theamount of risk in the trade at $378.75. Once this is filled, move the stopdown to breakeven. Exit #2 is at the .618 at $371.50. We would want toshade the exit order to ensure a fill and would place the order at $371.75.Once the second profit objective (exit #2) is reached, the protective buystop order is canceled.

c05 JWPR033-Pesavento (Wiley Trading Series) August 14, 2007 13:4 Char Count=
66 TRADE WHAT YOU SEE
Figure 5.8 Google (GOOG) 60-minute chart of Gartley “222” sell pattern. The riskin this pattern is acceptable to place the stop above the X point; the risk is $5.50 pershare, very low risk on a $384 stock.
Because of the high price of this stock and larger dollar movement,the trader would certainly want to trail a stop to protect profits after theprice moves in the trader’s favor following moving the stop to breakeven.It can be helpful to use a smaller time frame to see the most recent swingsto trail a stop if using visual chart points or Fibonacci retracement levels(see Figure 5.9). In this case, using a 30-minute or 15-minute chart wouldbe sufficient.
This trade would have netted +$5.50 per share on the first exit and+$12.50 per share on the second exit for a total of +$18.00 on the trade.
Alternate Trade Management An alternate and acceptable way tomanage this trade is to take a full exit at the .618 retracement. This wouldgive the trader close to a 3:1 risk/reward trade-off. Why don’t we do thaton each trade? The answer is simple: We have found over time that takingpartial profits around or close to the amount risked gives us a high win/lossratio on trades and quickly reduces the risk in the trade to close to a risk-free trade. Whenever we can put ourselves in the position of a risk-freetrade we do so.

c05 JWPR033-Pesavento (Wiley Trading Series) August 14, 2007 13:4 Char Count=
The Gartley “222” Pattern 67
Figure 5.9 Google (GOOG) 15-minute chart showing example of dropping downa time frame to help the trader trail stops using most recent swings.
Figure 5.10 S&P E-mini 5-minute chart of failed Gartley “222” pattern. A widerange bar, one of the warning signs, is present at the completion point, but it is notlikely that it would have been seen in full prior to being filled on the trade.

c05 JWPR033-Pesavento (Wiley Trading Series) August 14, 2007 13:4 Char Count=
68 TRADE WHAT YOU SEE
Trade Setup #3: Failed Gartley “222” Pattern
Market: S&P 500 E-Mini
Contracts: 2
In Figure 5.10, a limit order of 1270.00 to sell short is placed for thistrade. A protective buy stop-loss order above the 1.00 (X) point at 1273.50is immediately placed upon being filled. We would have been filled on thistrade before the long bar was complete near the D completion point, whichis one of the warning signs. This just happens occasionally and is part oftrading. The protective buy stop-loss order keeps this loss small and en-ables us to move on to the next trade.
Accept the responsibility for the trade regardless of the outcome; thisis learning to think in probabilities. The Gartley “222” pattern places a pos-itive expectation in the trader’s favor. It is the trader’s responsibility to ac-cept the risk, use sound money management, and develop good executionskills.

c06 JWPR033-Pesavento (Wiley Trading Series) August 31, 2007 12:42 Char Count=
C H A P T E R 6
The ButterflyPattern
The Butterfly pattern is certainly one of our favorite extension pat-terns. This particular setup is one that attempts to trade highs andlows at market reversal points. The formations and completions tend
to occur at major tops and bottoms, and they can also be seen on all timeframes. It is not uncommon to see more than one Butterfly pattern on mul-tiple time frames completing at the same price area.
The risk/reward profile is very favorable with this pattern. The bestpatterns tend to turn immediately at or near the completion point. It is oneof the few patterns that can truly find tops and bottoms. This pattern is not100 percent, though, and stop-loss orders must be used; as you will see inthe last trade setup in this chapter, when this one fails it usually fails in abig way.
HISTORY OF THE BUTTERFLY PATTERN
In order to explain the history of the Butterfly pattern, we have to intro-duce the Australian trader and developer of the Wave Trader Program,Bryce Gilmore. Bryce has spent a lifetime studying the works of the great
69

c06 JWPR033-Pesavento (Wiley Trading Series) August 31, 2007 12:42 Char Count=
70 TRADE WHAT YOU SEE
masters—R.N. Elliott, W.D. Gann, and many others. He developed theWave Trader Program in 1988; it was the first computer program to useall the numbers of sacred geometry, including the Fibonacci summationseries. This pioneering led to the discovery of the Butterfly pattern.
The Wave Trader Program calculated each swing and ratio and wentthrough a sequence of analyzing that labeled the patterns from 1 to 10, 10being the level at which 10 swings and ratios came together at the sametime and price. This was the level when multiple patterns had completedwith the ratios from sacred geometry. Bryce included all the numbers fromsacred geometry so that no stone was left unturned. As with many patterns,when the Wave 10 level trades failed it was usually an indication that themarket would continue in the direction of the original trend.
Bryce was a perfectionist in everything he attempted. On one occa-sion he had done extensive analysis on the Treasury bond market andhad concluded that T-bonds would not exceed 101.00. He sold T-bonds at101.00 and used a stop-loss order at 101.02, which is exactly $62.50 per con-tract. When Larry suggested that the stop might be a bit too close, Bryceshouted, “If those bonds trade above 101.02, everything I’ve researched,read, and believe in will be a total loss!” He went on to say that if bondswere to trade above 101.03, he would burn all of his books and materi-als and return to race-car driving and playing golf in his home country ofAustralia. The bonds made a swing high at 101.00 that lasted more thantwo months.
The Butterfly pattern came into existence in 1992 on a trading daywhen Larry was sitting with Bryce watching a Wave 10 pattern form. Itappeared in many different colors, and as two colorful right triangles cametogether Larry commented that it looked like a butterfly. Bryce replied thatit was as good a name for the pattern as any, and that is how the name wascoined for this pattern. (See Figure 6.1.)
Almost two decades and thousands of Butterfly patterns later, it can besaid that it is one of the most profitable trading patterns with the proper useof stop-loss orders. As you go through this chapter and learn this pattern,pay special attention to risk.
BUTTERFLY PATTERN DESCRIPTION
The Butterfly pattern is best described as an extension pattern. It is also afailed Gartley pattern where the D completion point completes above theX. Remember that a Gartley pattern is considered a failed pattern if thisoccurs, but with this failure a Butterfly pattern may be forming. (Refer toFigure 6.2.) The extension of the AD swing and the CD leg can be thought

c06 JWPR033-Pesavento (Wiley Trading Series) August 31, 2007 12:42 Char Count=
The Butterfly Pattern 71
Figure 6.1 Line drawings of the Butterfly buy and sell patterns showing two con-necting triangles.
of as a stretched rubber band. It is at these points that the market becomesoverbought or oversold and a reversal can occur.
Even if a full reversal does not take place, the trader can still profit onthis pattern by exiting on retracements of the CD leg or the AD swing. Youwill see an example of this in the “Trading the Butterfly Pattern” section
Figure 6.2 Google (GOOG) 60-minute chart showing a failed Gartley “222” pat-tern forming a Butterfly pattern.

c06 JWPR033-Pesavento (Wiley Trading Series) August 31, 2007 12:42 Char Count=
72 TRADE WHAT YOU SEE
of this chapter under “Trade Setup #2.” The pattern is formed by two righttriangles coming together at one point. It is this formation that gives thepattern its appearance as a Butterfly. The completion points can be calcu-lated by using Fibonacci ratios above 1.00, such as 1.272, 1.618, 2.00, and2.618. Beyond 2.618 the pattern is considered negated and the trend mostlikely will continue. In most cases the maximum risk is at the 1.618 level.
Because of the chance that any pattern can be a failed pattern and eventhe Butterfly pattern can fail, we will note again here that this particularpattern when failed can move very quickly against the trader’s position; ifthe trader does not have the trading skills or discipline to use stops, it isbest to not trade this pattern until both of those elements are part of thetrader’s tool kit.
BUTTERFLY PATTERN STRUCTURE
The Butterfly pattern should be a very symmetrical pattern in its formationand structure. As with the Gartley “222” pattern, the Butterfly pattern isformed with four legs. The difference is that the last leg (the CD leg) of theButterfly pattern will extend beyond the X point and will move toward the1.272 or 1.618 expansion of XA. (See Figure 6.3 for an example.) The BC legwill also be an extension, but the completion point is generally determinedby the XA swing.
The AB leg of the pattern will usually be at the .618 or the .786 retrace-ment levels. The pattern also is valid if this retracement is at the .382 or.50. This retracement of the AB leg can go further than the .786, as is seenin Figure 6.3, but the pattern will be negated if it goes beyond X. One cluethat a Butterfly pattern may be forming is if the first retracement, the AB,goes to the .786 retracement level or further.
It is important to know what invalidates this pattern; here are five itemsthat would negate this pattern:
1. Absence of an AB=CD within the AD swing. This pattern must containan AB=CD.
2. An extension move beyond the 2.618 of XA. The 1.618 expansion isgenerally the maximum risk.
3. B point above (for a sell pattern) or below the X point (for a buy pat-tern).
4. C above or below the A point.5. Failure of D to extend beyond X: D must extend beyond X to be a But-
terfly pattern.

c06 JWPR033-Pesavento (Wiley Trading Series) August 31, 2007 12:42 Char Count=
The Butterfly Pattern 73
Figure 6.3 Soybeans daily chart showing an example of the structure of the But-terfly pattern.
It is not unusual to see smaller “ab=cd” patterns within one of the mainlegs; for example, a small ab=cd may be seen within the larger AB=CDformation of the AD swing in Figure 6.3.
Some of our favorite setups are those that contain multiple patterns inseveral time frames completing in one price area. For more information,see Chapter 8, “Retracement Entries and Multiple Time Frames.”
IMPORTANT CHARACTERISTICS OF THEBUTTERFLY PATTERN
This pattern, of all the patterns in this book, can be the most rewardingone if it is indeed a major turning point in a market. It is the ultimate con-trarian’s trading pattern. The risk, however, can be great if the trader doesnot take the time to study and learn how to properly assess and managethis pattern. There are several characteristics that should be studied whenlearning this pattern that will help the trader to identify acceptable risk-to-reward setups and valid patterns. Refer back to Chapter 4, “The AB=CDPattern,” and review the “CD Leg Variations” and “Slope and Time Frames”

c06 JWPR033-Pesavento (Wiley Trading Series) August 31, 2007 12:42 Char Count=
74 TRADE WHAT YOU SEE
sections. That information also pertains to the AB=CD within the Butterflypattern.
Here are three points that are important characteristics of the Butterflypattern:
1. Thrust. How the move from the C point starts is important to watchas it will give the trader information on whether the pattern may forma Butterfly pattern rather than a Gartley pattern—that is, long bars orgaps through the .618 or .786. Gaps should be watched closely by thetrader. They indicate an unknown or a change in sentiment and poten-tially signal changing market conditions. The thrust coming out of theCD leg strongly suggest that the extension has a higher probability ofmaking a 1.618 new high versus a 1.272 new high.
2. Symmetry. Study the symmetry of the AB=CD; note the slope and an-gle of the AB leg and then the CD leg. If the CD leg is exhibiting asteeper angle, that may be a clue that the CD leg will extend beyondX and form a Butterfly pattern. The symmetry or slope of the AB legshould be very close to that of the CD leg in order to keep the idealsymmetry in the pattern. Note also the time bar relationship in theselegs; for instance, if the AB leg has taken eight bars to form, then theCD leg should also take approximately eight bars to form, thus formingan ideal Butterfly pattern.
3. Failure signs. Beware of price beyond the 1.618 expansion of XA.Generally a move beyond the 1.618 will indicate a continuation of thetrend. If the technician will keep focused on these characteristics, itwill greatly reduce the potential for getting into trouble with the But-terfly pattern. Butterfly trades are not for the faint of heart, as they en-ter counter to the trend in markets when they appear the most bullishand the most bearish.
PSYCHOLOGY OF THE BUTTERFLY PATTERN
We have discussed previously in Chapter 4, “The AB=CD Pattern,” andChapter 5, “The Gartley ‘222’ Pattern,” how these patterns are formed bybasic fear and greed. When there are more buyers, the price rises; whenthere are more sellers, the price declines. Since the Butterfly pattern is anextension pattern, is found for the most part at major tops and bottoms,and often signals a major reversal point, then we can apply basic masscrowd psychology and witness it at extremes. When this pattern is a ma-jor reversal turning point in a market, what you will witness is a marketturn and masses heading for the door at the same time. It is an extreme inmarket emotions of fear and greed.

c06 JWPR033-Pesavento (Wiley Trading Series) August 31, 2007 12:42 Char Count=
The Butterfly Pattern 75
At the tops, market participants start heading for the door trying tosell. There is fear of losing money on wrong or early short positions, fearof losing profits, profit taking on longs, or initiating new short positions.At the bottoms, market participants start buying perceived bargain prices;others are still heading for the door selling out losing long positions (thishas been called the puke point, the point at which traders or investors cannot hang on to a losing position one more cent); still others are taking prof-its on short positions. At this point, any new shorts will be forced to coverlosses as prices rise against them, adding more momentum. This point isan extreme of fear of losing or missing out.
At these major turning points, one might notice an unusual amount ofpress coverage on television and in magazines and newspapers, as well astalk at social gatherings and even randomly on the street or in other publicplaces. All of this coverage or talk will be either very bullish at the top withthe Butterfly sell pattern or very bearish at the bottom with the Butterflybuy pattern. The news at this point will be so overwhelmingly skewed in thedirection of the trend that it would be difficult to find anyone who wouldadmit to taking the other side of the public viewpoint and opinions. Anyoneusing long-term moving averages would be nowhere near a decision ontaking a countertrend position as the Butterfly pattern nears completion.
Traders should remember that very few traders ever buy the exact highor low of a stock or market and that the Butterfly pattern turns as the lastbull buys at the top or the last bear sells at the bottom.
TRADING THE BUTTERFLY PATTERN
The Butterfly pattern can provide instant gratification when the marketturns quickly at or near the completion point. However, it can also be oneof the fastest loss trades, because the trader is attempting to pick a high orlow spot in the market, and if it fails and the trend continues, the trade isusually stopped out quickly. We have stressed several times the necessityof using protective stop-loss orders, and it is especially important with thispattern; this is not a pattern that traders would ever want to let go againstthem beyond their trading plan and money management plan.
We give three trade examples here and several variations on managingthe trades with this pattern.
Trade Setup #1: Butterfly Buy Pattern
Market: Pfizer (PFE) Stock
Shares: 200
c06 JWPR033-Pesavento (Wiley Trading Series) August 31, 2007 12:42 Char Count=
76 TRADE WHAT YOU SEE
(See “Alternate Trade Management” for using a three-part scale-outwith the Butterfly pattern.)
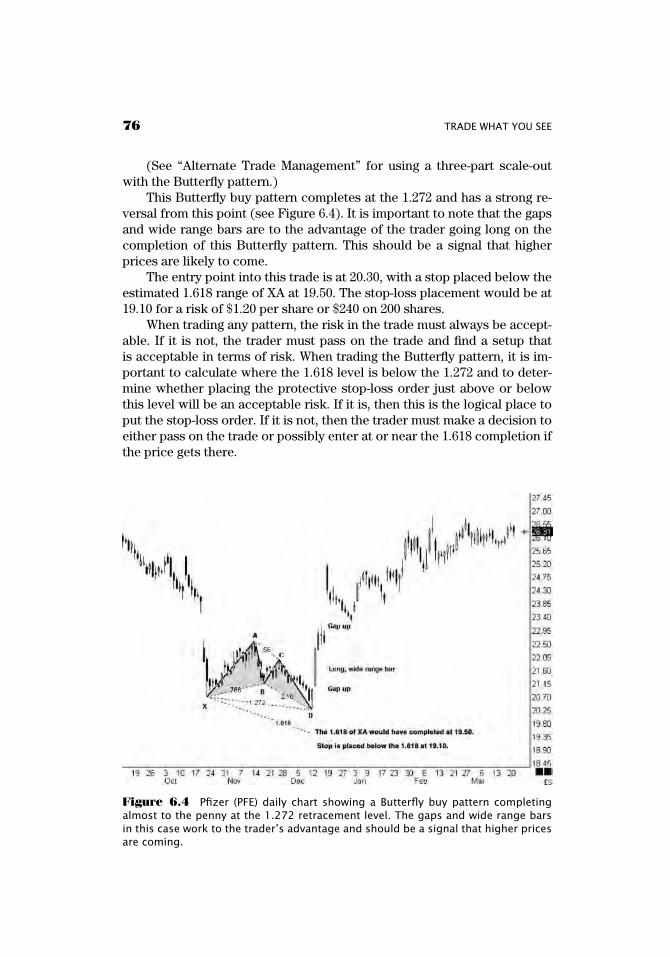
This Butterfly buy pattern completes at the 1.272 and has a strong re-versal from this point (see Figure 6.4). It is important to note that the gapsand wide range bars are to the advantage of the trader going long on thecompletion of this Butterfly pattern. This should be a signal that higherprices are likely to come.
The entry point into this trade is at 20.30, with a stop placed below theestimated 1.618 range of XA at 19.50. The stop-loss placement would be at19.10 for a risk of $1.20 per share or $240 on 200 shares.
When trading any pattern, the risk in the trade must always be accept-able. If it is not, the trader must pass on the trade and find a setup thatis acceptable in terms of risk. When trading the Butterfly pattern, it is im-portant to calculate where the 1.618 level is below the 1.272 and to deter-mine whether placing the protective stop-loss order just above or belowthis level will be an acceptable risk. If it is, then this is the logical place toput the stop-loss order. If it is not, then the trader must make a decision toeither pass on the trade or possibly enter at or near the 1.618 completion ifthe price gets there.
Figure 6.4 Pfizer (PFE) daily chart showing a Butterfly buy pattern completingalmost to the penny at the 1.272 retracement level. The gaps and wide range barsin this case work to the trader’s advantage and should be a signal that higher pricesare coming.

c06 JWPR033-Pesavento (Wiley Trading Series) August 31, 2007 12:42 Char Count=
The Butterfly Pattern 77
Another alternative is to use a dollar amount or percentage of capitalfor the stop-loss with the knowledge that there may be another entry pointat or near that level and to be ready to reenter the trade if stopped out. Stillanother alternative is to wait for a retracement entry or Gartley pattern toenter the trade. Refer to Chapter 8 on retracement entries and Chapter 5on the Gartley “222” pattern.
Risk-Free Trade The first exit on this trade is at the .618 level of the ADswing at 21.70. (See Figure 6.5.) This initial risk in the trade was $1.20 pershare, and this exit reduces the risk to just above breakeven. After takingthe first exit, the stop-loss order is moved up to breakeven. The stop canbe trailed using either a dollar amount, percent of profit the trader feels isthe maximum amount to give back, or visual chart points such as the mostrecent lows or gap areas. The method the trader chooses to trail the stopshould be known before entering the trade and should be part of the tradeplan.
The second exit in this trade is at the 1.272 extension of the AD swing at23.25. Sometimes in trading you get lucky, and in this case the market gapsup on the open, exceeding the second target, and would be filled aroundthe opening price at 25.15. This trade would have netted +$625 with an
Figure 6.5 Pfizer (PFE) daily chart showing Butterfly pattern profit target exitsusing the .618 retracement level and 1.272 extension.
c06 JWPR033-Pesavento (Wiley Trading Series) August 31, 2007 12:42 Char Count=
78 TRADE WHAT YOU SEE
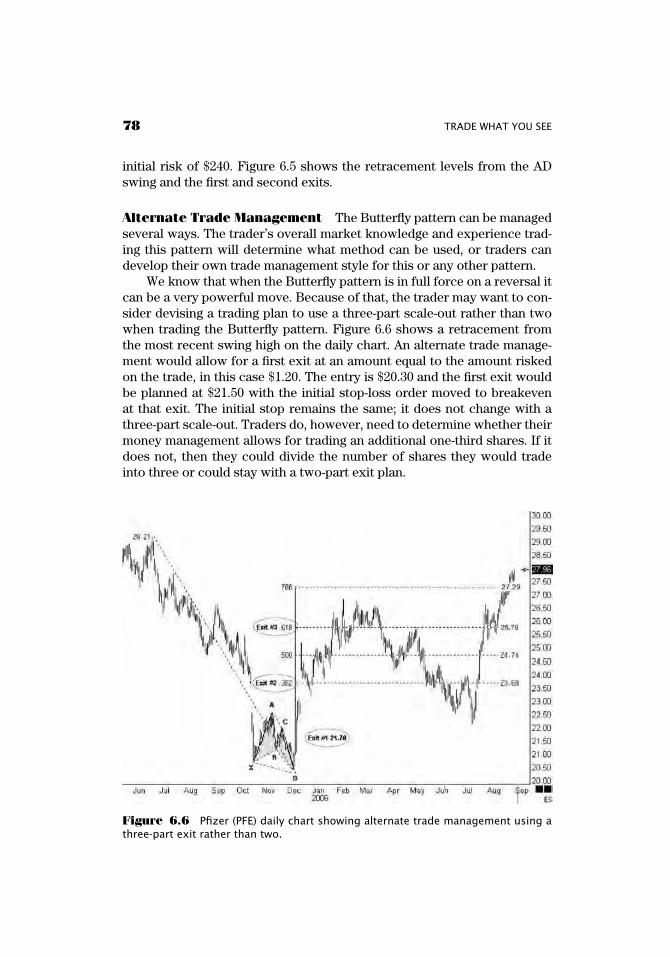
initial risk of $240. Figure 6.5 shows the retracement levels from the ADswing and the first and second exits.
Alternate Trade Management The Butterfly pattern can be managedseveral ways. The trader’s overall market knowledge and experience trad-ing this pattern will determine what method can be used, or traders candevelop their own trade management style for this or any other pattern.
We know that when the Butterfly pattern is in full force on a reversal itcan be a very powerful move. Because of that, the trader may want to con-sider devising a trading plan to use a three-part scale-out rather than twowhen trading the Butterfly pattern. Figure 6.6 shows a retracement fromthe most recent swing high on the daily chart. An alternate trade manage-ment would allow for a first exit at an amount equal to the amount riskedon the trade, in this case $1.20. The entry is $20.30 and the first exit wouldbe planned at $21.50 with the initial stop-loss order moved to breakevenat that exit. The initial stop remains the same; it does not change with athree-part scale-out. Traders do, however, need to determine whether theirmoney management allows for trading an additional one-third shares. If itdoes not, then they could divide the number of shares they would tradeinto three or could stay with a two-part exit plan.
Figure 6.6 Pfizer (PFE) daily chart showing alternate trade management using athree-part exit rather than two.
c06 JWPR033-Pesavento (Wiley Trading Series) August 31, 2007 12:42 Char Count=
The Butterfly Pattern 79
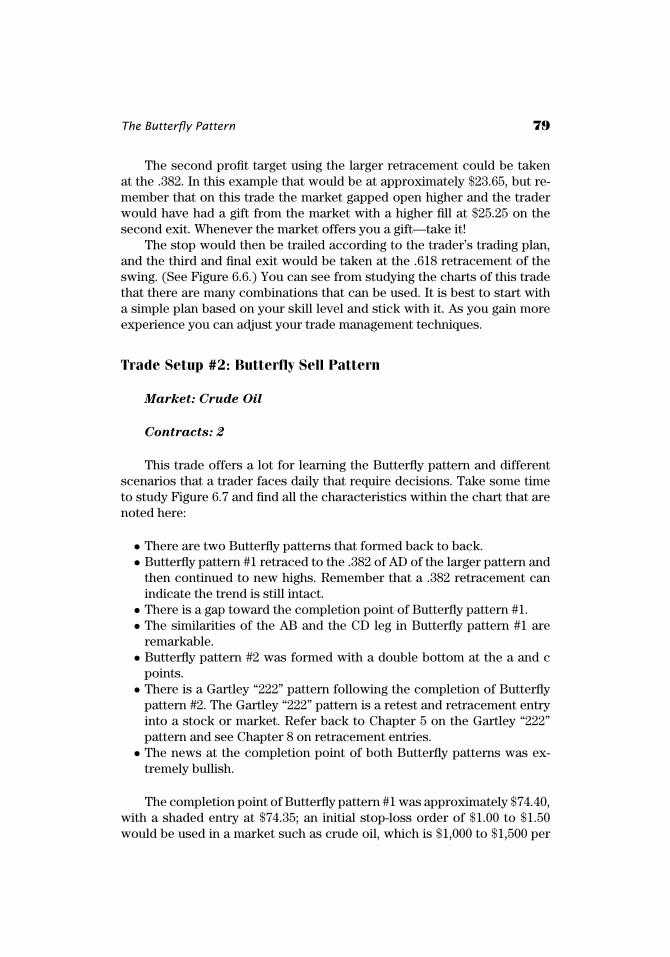
The second profit target using the larger retracement could be takenat the .382. In this example that would be at approximately $23.65, but re-member that on this trade the market gapped open higher and the traderwould have had a gift from the market with a higher fill at $25.25 on thesecond exit. Whenever the market offers you a gift—take it!
The stop would then be trailed according to the trader’s trading plan,and the third and final exit would be taken at the .618 retracement of theswing. (See Figure 6.6.) You can see from studying the charts of this tradethat there are many combinations that can be used. It is best to start witha simple plan based on your skill level and stick with it. As you gain moreexperience you can adjust your trade management techniques.
Trade Setup #2: Butterfly Sell Pattern
Market: Crude Oil
Contracts: 2
This trade offers a lot for learning the Butterfly pattern and differentscenarios that a trader faces daily that require decisions. Take some timeto study Figure 6.7 and find all the characteristics within the chart that arenoted here:
Ĺ There are two Butterfly patterns that formed back to back.Ĺ Butterfly pattern #1 retraced to the .382 of AD of the larger pattern and
then continued to new highs. Remember that a .382 retracement canindicate the trend is still intact.
Ĺ There is a gap toward the completion point of Butterfly pattern #1.Ĺ The similarities of the AB and the CD leg in Butterfly pattern #1 are
remarkable.Ĺ Butterfly pattern #2 was formed with a double bottom at the a and c
points.Ĺ There is a Gartley “222” pattern following the completion of Butterfly
pattern #2. The Gartley “222” pattern is a retest and retracement entryinto a stock or market. Refer back to Chapter 5 on the Gartley “222”pattern and see Chapter 8 on retracement entries.
Ĺ The news at the completion point of both Butterfly patterns was ex-tremely bullish.
The completion point of Butterfly pattern #1 was approximately $74.40,with a shaded entry at $74.35; an initial stop-loss order of $1.00 to $1.50would be used in a market such as crude oil, which is $1,000 to $1,500 per

c06 JWPR033-Pesavento (Wiley Trading Series) August 31, 2007 12:42 Char Count=
80 TRADE WHAT YOU SEE
Figure 6.7 Study this crude oil daily chart of two Butterfly sell patterns—there isa lot to be learned from it. There is a gap toward the completion point at D of thefirst pattern, and the similarities of the AB and CD leg are remarkable. The secondButterfly pattern completes at the swing high. There is a Gartley “222” sell patternfollowing the last high.
contract. One of three likely scenarios could have occurred with this setup.The outcome would have been dependent on the size of the stop-loss orderused, the decisions the trader would have had to make, and the originaltrade plan:
1. The trader, if using a $1.00 stop, would have been stopped out at thehigh of the swing at $75.35 for a loss of $1,000.
2. If a wider stop had been used, $1,500, the trader would have been ableto exit the first portion of the trade at an equal risk to the initial stop-loss at $72.85, and would have moved the stop to breakeven and beenstopped out on the second half of the trade. This would have netted+1,500.00 on a Butterfly pattern that continued in the direction of theuptrend.
3. Had the trader with a wider stop had the patience to keep the initialstop-loss order in place and exited at the .382 retracement, this strategywould have netted approximately $6.00 per contract or $6,000.
This trade setup is an excellent example of trade management vari-ances. The best thing to do is to have a well-written trading plan and then

c06 JWPR033-Pesavento (Wiley Trading Series) August 31, 2007 12:42 Char Count=
The Butterfly Pattern 81
trade that plan. There will be times when you have outcomes from each ofthe three scenarios.
Regardless of the outcome of the first Butterfly pattern, a second But-terfly pattern formed, offering another short entry into this market. (SeeFigure 6.8.) The entry point of Butterfly pattern #2 was at $77.50 with aninitial stop-loss order placed at $78.50 for an initial risk of $1,000 per con-tract.
The first exit in this setup would be at the .382 retracement of CD;remember, this is a double bottom Butterfly pattern, so it makes no differ-ence in this case if the retracement is done from AD or CD, at around 74.50.The market at this point has the earmarks of being at a potential reversalpoint and therefore has the potential to be a larger win with a relative smallrisk per contract. The stop-loss order is moved to breakeven upon comple-tion of the first profit target. The second profit target will be at the .618retracement of CD around 72.05. If the trade is being exited in three parts,the trader would then trail the stop for a potential larger profit exit on thethird contract.
The net on two contracts would be $8.45 or $8,450, with an initial riskof $1,000. You can see why it is important for the trader to stay with thetrade and trade all the Butterfly patterns that form. We have no way ofknowing which ones will work.
Figure 6.8 Crude oil daily chart of Butterfly sell pattern #2.

c06 JWPR033-Pesavento (Wiley Trading Series) August 31, 2007 12:42 Char Count=
82 TRADE WHAT YOU SEE
Trade Setup #3: Failed Butterfly Pattern
Market: Euro Futures
Contracts: 2
This trade in the euro market was a failed pattern and trade. Lookclosely at Figure 6.9 and note the AB=CD patterns that formed within theAD leg. We have marked in three of them but there are actually four in to-tal; the chart would be too difficult to read with the last one marked in. Youcan see how one pattern ends and another begins.
The entry would be 1.2495 with a $500 stop-loss per contract, which is$12.50 per tick (pip) and is placed at 1.2545. Placing the stop just beyondthe 1.618 would mean far too much risk for this trade. The bar following theentry is a wide range bar, and this trade would be stopped out in minutes.When Butterfly patterns fail, they generally do so quickly, because whenthey fail it indicates the trend is still intact and the momentum is still inthat direction. A second loss would have been incurred had another tradebeen entered at the 1.618.
Figure 6.9 Euro daily chart of failed Butterfly sell pattern.

c06 JWPR033-Pesavento (Wiley Trading Series) August 31, 2007 12:42 Char Count=
The Butterfly Pattern 83
The high of that swing is at approximately 1.3000, which in terms ofloss would equate to around 5 full points or $6,250 per contract.
We have been advocating the use of protective stop-loss orders with allof the patterns presented in this book, and especially one as powerful asthe Butterfly pattern. It is powerful both in potential gains and in potentiallosses. Learn to protect your working capital so that you can come backand trade another day.

c06 JWPR033-Pesavento (Wiley Trading Series) August 31, 2007 12:42 Char Count=

c07 JWPR033-Pesavento (Wiley Trading Series) August 14, 2007 13:48 Char Count=
C H A P T E R 7
The ThreeDrives Pattern
One important element that is consistent with all of the patterns inthis book is symmetry. Each pattern is symmetrical in its structure.We presented and discussed symmetry with the AB=CD pattern,
the Gartley “222” pattern, and the Butterfly pattern. The Three Drives pat-tern is no exception. Symmetry is at the core of this great trading pattern,as you will learn in this chapter.
HISTORY OF THE THREE DRIVES PATTERN
There is very little written about the Three Drives pattern in pattern recog-nition books. Most likely the first mention of anything resembling this pat-tern was by a man named George Cole. Although Cole did allude to thepattern in his book written in 1936, Keys to Speculation, he did not ac-curately describe the pattern. H.M. Gartley came closer than anyone elsedescribing this pattern with his description of the Expanding Five WaveTriangle in Profits in the Stock Market. J. Welles Wilder, a popular author
85
c07 JWPR033-Pesavento (Wiley Trading Series) August 14, 2007 13:48 Char Count=
86 TRADE WHAT YOU SEE
on trading in the 1930s, sold Gartley’s Expanding Five Wave Triangle as atrading system called the Reverse Point Wave for $2,500.
It wasn’t until the 1950s that William Dunnigan, a stock investor fromSanta Barbara, California, wrote pamphlets on two trading systems, onetitled The Dunnigan One Way Method, and the second titled The Dunni-
gan Thrust Method. These two pamphlets were written as the U.S. stockmarket was evolving into one of the most prestigious financial instrumentsin the world. This was at a time when investors were still regaining con-fidence many years after the crash of 1929. Dunnigan did call this patternThree Drives, and it is likely that he was the first to name this pattern.
John Hill from Futures Truth, a publication dedicated to honesty inthe futures business, brought this pattern to Larry’s attention as a mentorand friend in the 1970s. It is a good trading pattern, although it does notappear on all time frames as frequently as other trading patterns.
THREE DRIVES PATTERN DESCRIPTION
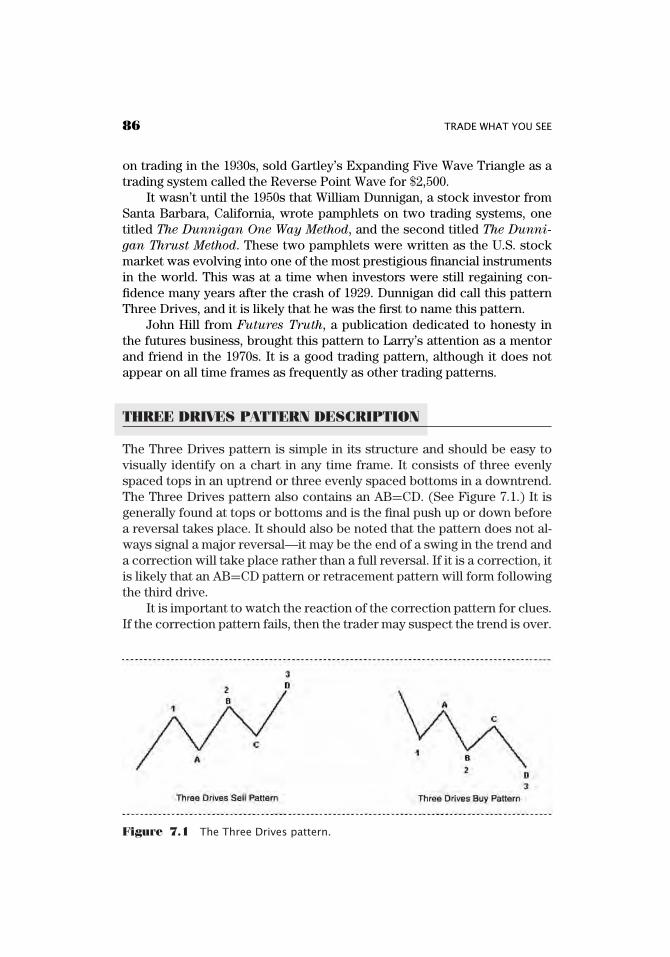
The Three Drives pattern is simple in its structure and should be easy tovisually identify on a chart in any time frame. It consists of three evenlyspaced tops in an uptrend or three evenly spaced bottoms in a downtrend.The Three Drives pattern also contains an AB=CD. (See Figure 7.1.) It isgenerally found at tops or bottoms and is the final push up or down beforea reversal takes place. It should also be noted that the pattern does not al-ways signal a major reversal—it may be the end of a swing in the trend anda correction will take place rather than a full reversal. If it is a correction, itis likely that an AB=CD pattern or retracement pattern will form followingthe third drive.
It is important to watch the reaction of the correction pattern for clues.If the correction pattern fails, then the trader may suspect the trend is over.
Figure 7.1 The Three Drives pattern.

c07 JWPR033-Pesavento (Wiley Trading Series) August 14, 2007 13:48 Char Count=
The Three Drives Pattern 87
It is not uncommon with reversals to see very sharp moves up or downfrom this pattern. Refer to trade setup #1 later in the chapter for an ex-ample of a correction pattern and trade setup #2 for a reversal from thecompletion of the Three Drives pattern.
THREE DRIVES PATTERN STRUCTURE
The drives (tops and bottoms) of the pattern are numbered 1, 2, and 3. Eachdrive is consecutively higher or lower than the last—consecutively higherin a Three Drives to the top pattern and consecutively lower in a ThreeDrives to the bottom pattern. (Refer back to Figure 7.1.) The distance fromthe top or bottom of drive 1 to the top or bottom of drive 2 should be a1.272 or 1.618 extension, and it is the same for the top or bottom of drive 2to drive 3. It is important to remember that the market may fall a bit shortof these levels or may go just a bit farther. The important thing is to watchfor a symmetrical pattern to form. There may also be an extension numberof 1.272 or 1.618 measuring from drive 1 to A and completing at drive 3.Refer to Figure 7.2 below for an example.
Figure 7.2 Barrick Gold Corporation (ABX) daily chart of Three Drives sell pattern.The distance from the top of drive 1 to drive 2 and from drive 2 to drive 3 is a 1.272extension. The distance from drive 1 to A and completing at drive 3 is a 1.618extension.

c07 JWPR033-Pesavento (Wiley Trading Series) August 14, 2007 13:48 Char Count=
88 TRADE WHAT YOU SEE
The retracements at points A and C, which form the AB=CD, shouldbe a Fibonacci retracement, ideally at the .618 or the .786. If a retracementat the .382 is formed, it is again a sign of a strong trend. These drives shouldappear symmetrical to the eye and jump out. If the trader has to force thepattern, it is probably not a Three Drives pattern.
There should also be time symmetry from point A to drive 2 and frompoint C to drive 3, in that it should take each of these legs approximatelythe same number of time bars to form.
Five items to watch for that would invalidate this pattern are:
1. Drive 1 above or below drive 2 (above in a sell pattern or below in abuy pattern).
2. Drive 2 above or below drive 3 (above in a sell pattern or below in abuy pattern).
3. C below A (for a sell pattern) or above A (for a buy pattern). B shouldnot be above D (for a sell pattern) or below D (for a buy pattern).
4. Extensions that extend past the 1.618 as the Three Drives pattern isforming will usually result in a failed pattern.
5. Large price gaps that appear as this pattern is forming in the directionof the established trend, especially toward the completion of drive 3,are a sign that the pattern is not valid and the trader should wait forfurther confirmation of a top or bottom or the formation of anotherpattern.
IMPORTANT CHARACTERISTICS OF THETHREE DRIVES PATTERN
The Three Drives pattern is similar to the Butterfly pattern in that it is verysymmetrical. There are three areas of symmetry to study and learn to iden-tify and trade this pattern successfully.
1. Price symmetry. Symmetry of price should be equal in the formationof the legs from A to drive 2 and from C to drive 3.
2. Time symmetry. The Three Drives pattern will have near-perfect sym-metry where the upswings or downswings consist of close to the samenumber of time bars. If the time bars are not exactly the same, theyshould be close to a Fibonacci ratio that can be calculated by dividingthe number of time bars in each leg—for example, five time bars in theAB and eight time bars in the CD (5 ÷ 8 = .625).
3. Visual symmetry. The pattern should be aesthetically pleasing to theeye. Three Drives patterns that are asymmetrical or that are forcedshould be viewed with suspicion. By force, we are referring to the

c07 JWPR033-Pesavento (Wiley Trading Series) August 14, 2007 13:48 Char Count=
The Three Drives Pattern 89
market technician trying to force the pattern where it does not existbased on the elements outlined in the pattern structure section of thischapter. If it doesn’t look symmetrical, it is probably not valid.
PSYCHOLOGY OF THE THREE DRIVESPATTERN
All patterns are formed by crowd psychology, and it is interesting and edu-cational to study what forms any particular pattern. The Three Drives pat-tern is slightly different in its psychology, as it has three tops or bottomsthat must form to complete the pattern, compared to most patterns withone (or occasionally two in the cases of double bottoms and tops).
It is a natural phenomenon that bulls are the most bullish at the tops ofmarkets and bears the most bearish at the bottom. When this occurs thereis typically an unusual amount of news that accompanies these tops andbottoms in favor of the excess bullishness or bearishness.
The Three Drives pattern goes through an extended process of bringingin new buyers or short sellers too early at tops with successive waves andnew sellers at lows or new buyers who are too early. The pattern generallymakes the final wave as the last buyer has bought at the top and the lastseller has sold at the bottom. This is the time when the market will appearabsolutely the most bullish or most bearish. The last push up or down toform the last gasp in the market is almost like a game of hot potato, andthe market has just passed the last hot potato to the last market participantbefore it changes direction.
As the market then changes direction, each new low below the latestswing low in an uptrend now has more bulls trapped. Conversely, each newhigh above the previous swing low has more bears trapped. This in itselfcan add fuel to a rally or decline. Usually it is not until a new trend is wellunder way that the news media will also change direction.
TRADING THE THREE DRIVES PATTERN
As we mentioned earlier in this chapter, the Three Drives pattern can beeither a reversal or part of a correction in a trend, where the market ispausing before resuming the original direction of the trend.
Trade setup #1 illustrates a Three Drives buy pattern that is a correc-tion in a trend. We use an example in trade setup #2 that is a reversal,and we use a failed Three Drives pattern in trade setup #3. Pay particular

c07 JWPR033-Pesavento (Wiley Trading Series) August 14, 2007 13:48 Char Count=
90 TRADE WHAT YOU SEE
attention to the chart in trade setup #3 and notice how a failed pattern thatis not labeled is much more difficult to spot on a chart.
Setup #1: Three Drives Buy Pattern
Market: QQQQ Daily
Shares: 200
The completion point on the Three Drives buy pattern shown inFigure 7.3 is at the 1.618 level. This was determined by the previous 1.618from drive 1 to drive 2, which is repeated from drive 2 to drive 3. Althoughthe time bars are not the same number, they are close to a Fibonacci ratiowith 6 bars in the first leg down of the pattern and 10 bars down in thesecond leg (6 ÷ 10 = .60).
The risk in this trade is very small because of the completion point atthe 1.618. The entry is at 62.25, and a stop can be placed at $2.00 per shareat 60.25, just below the recent low.
Risk-Free Trade The first profit target is equal to the risk at 64.25, andthe stop can be moved up to just below the most recent swing low at 60.40.
Figure 7.3 NASDAQ-100 (QQQQ) daily chart of trade setup #1 is an example ofa Three Drives buy pattern being a correction in a downtrend rather than a reversalpattern.

c07 JWPR033-Pesavento (Wiley Trading Series) August 14, 2007 13:48 Char Count=
The Three Drives Pattern 91
The assumption is that with the stop just below the most recent low, themarket would be telling us that this pattern is a failed pattern at that point.
The stop would be trailed on this trade. The trader must keep in mindthat this is a daily chart and allow for the market to move up and down,giving it enough room and not trailing the stop too closely. In this casethe market does reach the second price objective at the .618. This particu-lar Three Drives pattern turns out to be only a correction, and the marketturns down from the .618 and makes new lows. Although this trade is a cor-rection in a downtrend and not a reversal, it achieves a very good profit. Itwould have netted +$14.75 with very low risk.
Trade Setup #2: Three Drives Sell Pattern
Market: S&P E-mini Daily
Contracts: 3
In this trade example we use a three-part exit that we have used inprevious trades. It is always up to the trader according to his trade planand money management plan how many shares or contracts are traded inany given trade. The nature of this particular setup would be conducive toa three-part exit for a couple of reasons:
1. When the extension patterns are reversal patterns, larger gains can becaptured by using extension exits. (See Figure 7.4.)
2. There are multiple patterns forming: two Butterfly sell patterns, mul-tiple AB=CD patterns, and a Three Drives pattern. The trader neverknows if there will be a market reversal, but with so many patternsand ratios coming into one completion area it may well be worth therisk for a three-part exit. Refer to Figure 7.5 to see the multiple patternsthat form in this chart.
The entry on this sell pattern is at the 1.272 retracement level. Figure7.4 shows both drives 2 and 3 completing at the 1.272. You can see thenatural trend line the market forms with these ratios. Notice also in Figure7.4 where the .618 retracement level is as the pattern is forming. This willbe an important level for the market to break, as it also forms a trend line,and this will signal the trader to try to capture larger gains.
The entry is at 1330.50 with a 5-point stop at 1335.50. Placing the stopabove the 1.618 in this trade involves too much risk. If the trade is stoppedout, then the trader can look for another entry at or around the 1.618 level.

c07 JWPR033-Pesavento (Wiley Trading Series) August 14, 2007 13:48 Char Count=
92 TRADE WHAT YOU SEE
Figure 7.4 S&P E-mini daily chart. The Three Drives sell pattern turns out to be amarket reversal, and by using a three-part exit strategy the trader is able to capturelarger gains. The break of the .618 trend line is a signal to the trader to determine athird profit objective at the 1.272 extension.
Risk-Free Trade The first profit objective is at 1325.50, which wouldbe equal to the initial risk of 5 points in the trade. (See Figure 7.4.) Thistrade is on a daily chart, and the first profit objective is reached three daysafter entry. A day trader would exit each day and find a new entry untilthe market either reached the first profit objective or continued higher,exceeding the stop area.
The initial stop-loss at 1335.50 is moved to one tick above the swinghigh at 1331.50 once the first exit is reached. The second profit objective isat the .618 retracement at 1302.25. Once this objective is reached the stopcan be trailed to protect profits. Figure 7.4 shows a long, wide range bar atthe second profit objective. The trader at this point wants to monitor themarket for further downside and to determine the best level for the thirdexit.
The trend line at the .618 retracements that formed the pattern, oncebroken, gives the trader a profit objective at the 1.272 extension from thepoint marked X to the top of drive 3. This profit objective is around 1248.25,and the trader should shade the exit to ensure a fill.
This trade on the daily chart would have netted +114.75 points. It cer-tainly is a rare home run trade, and the trader would need to have the

c07 JWPR033-Pesavento (Wiley Trading Series) August 14, 2007 13:48 Char Count=
The Three Drives Pattern 93
Figure 7.5 Multiple patterns are forming and completing around the top in thisS&P E-mini daily chart. There are two Butterfly patterns, multiple AB=CD patterns,and a Three Drives sell pattern.
patience to let large profits accumulate and reach the price targets andbe willing to hold the position overnight, as this particular trade took 13trading days to reach the third profit objective and exit.
We will revisit this particular pattern again in Chapter 8 on retracementpatterns.
Trade Setup #3: Three Drives Failed Sell Pattern
Market: Gold Futures
Contracts: 2
This trade setup (shown in Figure 7.6) is stopped out for a $5.00 lossper contract for a total loss of $1,000. Failed patterns are always more diffi-cult to see, even in hindsight, when you are studying patterns, because theyare obscured somewhat by the price movement.
Figure 7.7 shows the same chart with no price pattern drawn in. Youcan see how difficult it is to find the Three Drives pattern in this chart. Theprice of gold moves up over $125 per ounce after the failed Three Drivesentry; you must always honor your stop-loss orders.

c07 JWPR033-Pesavento (Wiley Trading Series) August 14, 2007 13:48 Char Count=
94 TRADE WHAT YOU SEE
Figure 7.6 Gold futures daily chart of Three Drives failed sell pattern. We havesaid this before, and it is worth repeating looking at this chart: Always honor yourstop-loss orders.
Figure 7.7 Gold futures daily chart without Three Drives failed sell pattern drawnin. It is always more difficult to see failed patterns when studying charts.

c08 JWPR033-Pesavento (Wiley Trading Series) August 31, 2007 12:46 Char Count=
C H A P T E R 8
RetracementEntries and
Multiple TimeFrames
Retracement entries serve several purposes. For example, they canbe used if the initial entry point was missed, or they can be used forreentering a trade in the direction of the trend or for adding onto
a position.In this chapter we cover two types of retracement entry patterns that
we use in our pattern recognition study:
1. Fibonacci Retracement patterns.2. Opening Price Retracement patterns.
We have already covered the Gartley “222” pattern in Chapter 5; pleasereview that chapter for using the Gartley “222” pattern as a retracemententry setup. Trend-type retracement entries will be covered in Chapter 10on trend identification for the S&P 500 market. Retracement patterns arenothing new to the present-day technical analyst, and studying them willadd another valuable tool to the trader’s market knowledge.
At the end of this chapter we cover the use of multiple time frames,which is a necessary tool for each trader using technical analysis to studyand learn.
95

c08 JWPR033-Pesavento (Wiley Trading Series) August 31, 2007 12:46 Char Count=
96 TRADE WHAT YOU SEE
FIBONACCI RETRACEMENT ENTRIES
We have covered the AB=CD, Gartley “222,” Butterfly, and Three Drivespatterns up to this point; all of them are structured with Fibonacci ratios.Fibonacci ratios can be applied and used for retracement entries into atrade as well. The most common Fibonacci retracement ratios used for re-tracement entries are .382, .50, .618, and .786. These same Fibonacci ratioscan also be used for profit objectives and placing stops, as we show in ourtrade examples in this chapter.
Fibonacci retracement entries differ in one main characteristic fromthe Gartley pattern in that they do not contain an AB=CD pattern. See Fig-ure 8.1 for diagrams of .618 retracement buy and sell patterns.
FIBONACCI RETRACEMENT PATTERNSTRUCTURE
There are only two legs that form a Fibonacci Retracement pattern, asshown in Figure 8.1. The first leg is labeled XA, and the second leg is la-beled AB. X is the beginning of the pattern, and B is the completion point.The X generally begins at the high or low of the most recent swing on thattime frame, but as with the Gartley pattern a swing in an already estab-lished trend may be used. See Figure 8.2 for an example of a long, widerange bar warning sign.
Figure 8.1 Examples of Fibonacci Retracement buy and sell patterns. An AB=CDis not present in a Fibonacci Retracement pattern.

c08 JWPR033-Pesavento (Wiley Trading Series) August 31, 2007 12:46 Char Count=
Retracement Entries and Multiple Time Frames 97
Figure 8.2 S&P E-mini 5-minute chart. In this example, the pattern on the rightside has a warning sign in the long, wide range bar.
A retracement-type pattern gives the trader an advantage of not havingto try to pick a top or a bottom—it is an entry into a trade in the directionof the trend.
As a rule of thumb for analyzing a Fibonacci retracement pattern thatdoes not contain an AB=CD, the number of bars in the two legs that formthe pattern can be used for analysis. Usually, either the trader will seean equal number of bars, such as six bars up, then six bars down (seeFigure 8.3 for an example), or the pattern may form as a Fibonacci ra-tio of the number of bars in the two legs. For example, if the first leg ofthe pattern consists of eight bars, then the trader would want to see thesecond leg form with eight bars or form as a Fibonacci ratio of that num-ber, such as five bars. This would create the .382, .618, or .786 retracementin time.
When these time ratios come together with the price ratios, it is whatW.D. Gann referred to as the squaring of price and time, which is nothingmore than the description of the geometric triangle. Do not get too caughtup in exact bar counts; there may be a perfectly acceptable pattern that isvery close to the description but not exact. (See Figure 8.4.) You want touse bar counts as a guideline, not an absolute. A trader would want to beaware of and alert to seeing something along the lines of the XA forming

c08 JWPR033-Pesavento (Wiley Trading Series) August 31, 2007 12:46 Char Count=
98 TRADE WHAT YOU SEE
Figure 8.3 This 5-minute chart of Research in Motion Limited (RIMM) shows aretracement pattern that forms with six bars up and then six bars down. The com-pletion point is at the .618 retracement.
with 10 bars and then the AB completing with only 2 or 3 bars. This wouldbe a warning sign that there may a stronger shift in emotion that is causingthe pattern to complete rapidly, and the trader would then want to wait foreither another pattern to form or some type of confirmation before enteringthat trade.
The warning signs are the same as previously described in Chapters 4through 7. Please review those chapters for warning signs that would eitherinvalidate the pattern or alert the trader to wait for further confirmation.See the “Warning Signs and Confirmation Signs” section of Chapter 11 formore detailed information.
TRADING THE FIBONACCI RETRACEMENTPATTERN
In this section we look at three trade examples using a Fibonacci retrace-ment entry. The first trade example is a Fibonacci Retracement sell pattern,and the second is a buy pattern. These are followed by a failed buy setup.

c08 JWPR033-Pesavento (Wiley Trading Series) August 31, 2007 12:46 Char Count=
Retracement Entries and Multiple Time Frames 99
Figure 8.4 Gold futures daily chart showing a Fibonacci Retracement pattern witha close, but not exact, time count.
Trade Setup #1: Retracement Sell Pattern
Market: INTC
Shares: 200
In the trade shown in Figure 8.5, there is a long, wide range bar justbefore the .618 entry level. This would alert the trader to wait for the .786or a confirmation that momentum has slowed. Using the .786 as an entryinto this trade, the trader has an excellent risk/reward setup. With the entryat $27.45 and a protective buy stop-loss order placed just above the X pointat $28.90, the trade has a total risk of $290 using 200 shares.
Risk-Free Trade The first exit is at the amount equal to the stop-lossorder, which is $1.45 per share. The market reaches the first profit objectivewithin four days. The stop-loss order is then moved down to the breakevenpoint after exit #1.
The market has a large gap-down open through the .618 retracementfrom AB and offers the trader an exit at the 1.00 level around $22.55.There is an old saying in the markets: “When the markets offer you a gift—take it.”

c08 JWPR033-Pesavento (Wiley Trading Series) August 31, 2007 12:46 Char Count=
100 TRADE WHAT YOU SEE
Figure 8.5 This Intel Corporation (INTC) daily chart retracement sell setup is anespecially nice trade, with the market helping the trader out with a large gap-downopen to the second profit objective.
Alternate Trade Management We have discussed in previous tradeexamples alternate trade management suggestions. As an alternative in thiscase, the trader could at this point, depending on one’s risk profile and mar-ket experience, choose to trail a stop in an attempt to gain larger profits.If the trader had an order sitting in the market to exit the second part ofthe trade at the .618 retracement level, he would have been filled on thegapdown open around the opening price that day.
Another consideration and possible alternate form of trade manage-ment with these types of conditions is to move the stop-loss order a smallamount above the high of the day about 20 to 30 minutes after the openfollowing a large gap such as this. Using this type of trade managementwould still allow the trader to exit the second portion of the trade with anice profit if the stock moved up and rallied following the gap-down open,but if the stock then declined further following the gap-down open it wouldoffer the trader an opportunity for larger gains.
Trade Setup #2: Retracement Buy Pattern
Market: QQQQ
Shares: 200
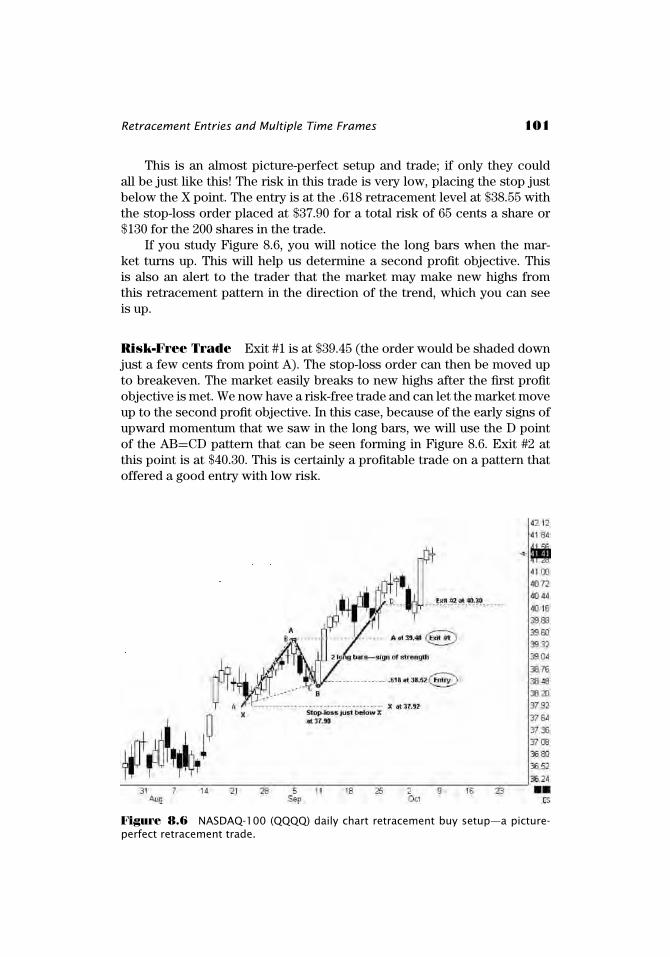
c08 JWPR033-Pesavento (Wiley Trading Series) August 31, 2007 12:46 Char Count=
Retracement Entries and Multiple Time Frames 101
This is an almost picture-perfect setup and trade; if only they couldall be just like this! The risk in this trade is very low, placing the stop justbelow the X point. The entry is at the .618 retracement level at $38.55 withthe stop-loss order placed at $37.90 for a total risk of 65 cents a share or$130 for the 200 shares in the trade.
If you study Figure 8.6, you will notice the long bars when the mar-ket turns up. This will help us determine a second profit objective. Thisis also an alert to the trader that the market may make new highs fromthis retracement pattern in the direction of the trend, which you can seeis up.
Risk-Free Trade Exit #1 is at $39.45 (the order would be shaded downjust a few cents from point A). The stop-loss order can then be moved upto breakeven. The market easily breaks to new highs after the first profitobjective is met. We now have a risk-free trade and can let the market moveup to the second profit objective. In this case, because of the early signs ofupward momentum that we saw in the long bars, we will use the D pointof the AB=CD pattern that can be seen forming in Figure 8.6. Exit #2 atthis point is at $40.30. This is certainly a profitable trade on a pattern thatoffered a good entry with low risk.
Figure 8.6 NASDAQ-100 (QQQQ) daily chart retracement buy setup—a picture-perfect retracement trade.

c08 JWPR033-Pesavento (Wiley Trading Series) August 31, 2007 12:46 Char Count=
102 TRADE WHAT YOU SEE
Alternate Trade Management Traders’ knowledge and market skillat reading market momentum will have an effect on how they managetrades. In the case of this trade, a skilled and experienced trader may wellread the signs of market momentum to the upside and trail a stop up on aportion of the trade to try to capture larger gains if offered. As traders gainmore experience, their trading skills and ability will improve with time andthey will recognize particular instances in the market when it may be pru-dent to hold for larger gains.
Trade Setup #3: Retracement Buy Failed Pattern
Market: S&P E-mini
Contracts: 2
The entry in this retracement pattern (see Figure 8.7) is at the .618 levelat the price of 1355.50, with the stop-loss order placed just above the X at1358.25 for a total risk of 2.75 points per contract or $137.50. After the ini-tial entry, the market starts to turn down toward the first price objectivebut only reaches 1354.50 before turning up and stopping the trade out at a
Figure 8.7 S&P E-mini 5-minute chart showing failed retracement buy patternsetup.

c08 JWPR033-Pesavento (Wiley Trading Series) August 31, 2007 12:46 Char Count=
Retracement Entries and Multiple Time Frames 103
loss. After the trade is stopped out, the market then turns down and comesback close to the initial entry point. There is no way for the trader to an-ticipate this, and the best way to manage trades for loss control is alwaysthrough the use of stop-loss orders. These types of occurrences are a partof trading.
OPENING PRICE RETRACEMENT SETUPS
The Opening Price Retracement patterns can be used either for day tradingstocks or for originating or adding onto positions using a longer time frame.We use the opening price setups for stocks only and do not use them inother markets. The concept is simple; the opening price will be near thehigh or low of the day more than 60 percent of the time—that is, withinthe upper or lower 20 percent range of that day, according to The Opening
Price Principle by Larry Pesavento and Peggy MacKay.The best way to appreciate this setup is to study charts and to note the
opening price and where the closing price is in relation to it in a given timeframe. The opening price seems to act like a magnet; why this occurs isnot fully known. One theory is that traders and investors have had 16 to 18hours since the previous close to contemplate the next day’s orders, andthose orders are placed near the open of the next day.
When using the Opening Price Retracement setup, it is important touse only the current day’s opening price and to not use the previous day’sopening or closing prices; they are irrelevant. This method is a simple con-cept for day traders, and the risk is easily quantified, as we have seen inour previous retracement trade setups. Simply stated, if the price is abovethe opening price, the probability of a winning long trade is above 60 per-cent; conversely, if the price is below the opening price, the probability ofa winning short trade is above 60 percent.
MARKET SETUP FOR THE OPENING PRICERETRACEMENT TRADE
To use the Opening Price Retracement setup, the trader wants to look forspecific criteria before initiating a trade. These criteria include:
Ĺ A price above or below the opening price of a specific stock 30 to 60minutes after the open.
Ĺ A retracement of .618 or .786 above or below the opening price.

c08 JWPR033-Pesavento (Wiley Trading Series) August 31, 2007 12:46 Char Count=
104 TRADE WHAT YOU SEE
Ĺ A setup absent of warning signs. (See Chapter 11.)Ĺ An acceptable stop placement and risk level.
As an example of a long trade using the Opening Price Retracement, atrader would look for a stock that is trading above its opening price 30 to60 minutes after the open that day and would then look for a .618 or .786retracement level from the low price off the open to the current high ofthe day for an entry point. The trader must be able to place an acceptablestop-loss in order to accept the trade. (Refer to Figure 8.8.) The entry atthe .618 or .786 retracement level positions the trader in the direction ofthe opening price with the trade, and the odds for a successful trade are inthe trader’s favor. The opposite would be true for a short trade; the traderwould initiate the trade by selling a .618 or .786 retracement from the highof the day off the open and the current low and would then be positionedin the market in the direction of the opening price.
A 5-, 15-, 30-, or even 60-minute time frame could be used—whateverthe trader is comfortable with. We will use a 5-minute chart for our tradeexamples with this setup.
Figure 8.8 Centex Corporation (CTX) 5-minute chart showing long Opening PriceRetracement trade setup. Note the long, wide range bar off the open. This makes anideal setup.

c08 JWPR033-Pesavento (Wiley Trading Series) August 31, 2007 12:46 Char Count=
Retracement Entries and Multiple Time Frames 105
TRADING THE OPENING PRICERETRACEMENT SETUP
Trade Setup #1: Opening Price RetracementBuy Setup
Stock: CTX
Shares: 200
The long entry on this opening price setup is at the .618 retracementlevel at $48.25. The stop-loss order is placed just below the low of the dayat $47.70 for a total risk of 55 cents per share or $110. In Figure 8.8 illustrat-ing this trade, you can see a long, wide range bar off the open. This is anespecially ideal setup; the long, wide range bar is suggesting momentum tothe upside, and the retracement entry should offer support at the .618 withvery low risk in the trade.
Risk-Free Trade The first profit objective is the first .618 retracementfrom the high of the first swing to the low of the first retracement. In thisexample, exit #1 is at $48.65 and the stop-loss order is then moved up to thebreakeven point. The trader can, if he chooses, move the stop to just belowthe first swing low of the entry retracement. It should be noted that thistrade is a day trade method, and the trader does not want to be in a positionto give back profits if at all possible. Moving the stop to breakeven will putthe trader in a risk-free position with the potential to gain further profits.You will have to study Figure 8.8 and observe how the trade is managed.When day trading, it is important to obtain a risk-free trade as soon as themarket offers it and take profits when available. The best way to do thisis by outlining a detailed trading plan and getting into the habit of pullingyour stop-loss down as soon as the first profit objective is reached.
See Figure 8.9 for the formation of a Butterfly sell pattern that wouldhelp the trader determine the second profit objective. It is also an option, ifallowed in the trader’s risk management and money management plan, toexit in three stages if one feels that is the best way to manage the trade.
Exit #2 is at the 1.27 extension and completion area of the Butterfly sellpattern at $49.20.
Trade Setup #2: Opening Price RetracementSell Setup
Stock: GS
Shares: 200

c08 JWPR033-Pesavento (Wiley Trading Series) August 31, 2007 12:46 Char Count=
106 TRADE WHAT YOU SEE
Figure 8.9 Centex Corporation (CTX) 5-minute chart showing Butterfly sell pat-tern that can help the trader determine the second exit.
This trade example was chosen to illustrate the importance of trademanagement and to show that not every Opening Price Retracement tradewill be a large winner. This example will also serve as our alternate trademanagement example.
As in our first opening price example, there are long, wide range barsoff the open. The market continues down and then comes back and makesa .618 retracement, offering an entry short into the trade. The entry intothis trade is at the .618 retracement at $148.90. The initial stop-loss order isplaced just above the high of the day at $149.75 for a total risk on the tradeof 85 cents per share or $170.
In Figure 8.10, the price retraces after the entry down to the .382 and.50 retracement levels. It is quite feasible for a day trader to take partial ex-its at either of these levels and then move the stop-loss order to breakeven.In this particular example a small profit would have been obtained beforebeing stopped out on the balance. There is no way to determine in advancewhich of the retracement levels the market may turn from, and it is up tothe trader to determine the risk in the trade and the profit objectives. It isalways good to keep in mind that the day trader is trading for short-termprofits and to take those when they are available.

c08 JWPR033-Pesavento (Wiley Trading Series) August 31, 2007 12:46 Char Count=
Retracement Entries and Multiple Time Frames 107
Figure 8.10 Goldman Sachs Group (GS) 5-minute chart showing an OpeningPrice Retracement sell setup that offers a small profit before the trade is stoppedout.
A partial exit at the .382 retracement in this example would have netteda 45-cent profit on a trade that otherwise would have been stopped out fora loss.
Trade Setup #3: Failed Opening PriceRetracement Sell Setup
Stock: AA
Shares: 200
This setup has a gap-down open and long, wide range bar, suggestingfurther downside to come. But as stocks and markets often do, they have adifferent idea. The entry is at the .618 at $27.35 with the stop-loss at $27.60for a total risk of 25 cents per share or $50 on 200 shares.
The trade is stopped out at a loss. Notice on the chart in Figure 8.11how the market after the entry into the trade consolidates sideways ratherthan moving toward a retracement level; the trader can move the stopcloser if he determines that the market is not doing what it is supposed

c08 JWPR033-Pesavento (Wiley Trading Series) August 31, 2007 12:46 Char Count=
108 TRADE WHAT YOU SEE
Figure 8.11 Alcoa (AA) 5-minute chart example of a failed Opening Price Retrace-ment sell setup.
to do within a reasonable amount of time. There is no way for the traderto anticipate this, so it is best to always manage trades for loss controlthrough the use of stop-loss orders. These types of occurrences are a partof trading.
MULTIPLE TIME FRAMES
In this section we discuss using multiple time frames and present severalchart examples to illustrate how they can be used. The information that atrader can gather by using multiple time frames is invaluable and can beused to initiate entries into trades, stay on the sidelines when appropriate,and even help in placing stop-loss orders.
Other advantages of using multiple time frames that we cover include:
Ĺ Allowing the trader to get a micro view of larger time frames, whichcan in turn confirm the trader’s original analysis of a trade. It is likeusing a backup pattern and fine-tuning an entry. An example would behaving a pattern on a 60-minute chart and using a 5-minute chart toconfirm the entry. (See Figures 8.12 through 8.14 an examples.)

c08 JWPR033-Pesavento (Wiley Trading Series) August 31, 2007 12:46 Char Count=
Retracement Entries and Multiple Time Frames 109
Figure 8.12 Google (GOOG) 60-minute chart showing a Butterfly sell pattern thathas completed.
Figure 8.13 This Google (GOOG) 5-minute chart shows the 1.272 completionpoint of the 60-minute Butterfly pattern at $427.50.

c08 JWPR033-Pesavento (Wiley Trading Series) August 31, 2007 12:46 Char Count=
110 TRADE WHAT YOU SEE
Figure 8.14 Micro view of trade entry from the Google (GOOG) 5-minute chartof the 1.618 completion area from the 60-minute Butterfly sell pattern.
Ĺ Risk can be managed more effectively by combining time frames. Atrader can learn to move stops on smaller time frames for patterns thatcomplete on larger time frames.
Ĺ Using multiple time frames from larger to smaller can help the traderto be aware of contrary or opposing patterns that form on smaller timeframes that are against the longer-term time frame.
The trader will always want to view larger time frames first for anoverall view of the market or stock being studied, and then move downto smaller time frames. Many traders use varying combinations of multipletime frames—weekly charts with daily charts, daily charts with 60-minutecharts, 15-minute charts with 5-minute charts, and so on. Some traders useall time frames starting with the largest and scaling down through eachtime frame to the shortest. It is a matter of preference and experience.
A word of caution: Do not reverse the process by initiating a trade ona short time frame such as a 5-minute chart, planning exits on that timeframe, and then moving to daily charts. This is especially true if the traderis at a loss on a trade on a small time frame that is designed as a day trade,and then looks to longer-term charts for signs of a turnaround and tries

c08 JWPR033-Pesavento (Wiley Trading Series) August 31, 2007 12:46 Char Count=
Retracement Entries and Multiple Time Frames 111
to turn the trade into a position trade. Position trades should be enteredfrom a position trading plan, and day trades should be entered from a daytrading plan.
Managing Risk Using Multiple Time FrameExamples and Fibonacci Retracement Setups
Using Fibonacci Retracement setups with multiple time frames is a natu-ral combination. Many times a trader will come across a pattern that hasalready completed on a larger time frame and observe that the trade hasalready moved in the anticipated direction; the trader now needs to find anentry into the trade. Using a Fibonacci retracement level and then scalingdown to a smaller time frame is an excellent method for entering a tradein that manner. See Figure 8.12 for a 60-minute Butterfly pattern that formsand is completed on Google stock.
Looking at Figure 8.12, the 1.272 extension of the Butterfly does nothold, and the pattern is completed at the 1.618. Let’s take a look now at a5-minute chart showing the 1.272 price level around $427.50 per share. Ifthe trader had entered there using a lower time frame, he would have beenable to manage the risk in the trade with the use of a stop-loss order andthen reenter the trade at the 1.618 again using a 5-minute chart. Refer toFigure 8.13 to study the 1.272 price level.
The first thing to notice on this micro view of the 60-minute patternis that there is a gap-up open and a long, wide range bar. These are bothwarning signs to alert the trader to either pass on the trade or wait for an-other acceptable entry. The market during the day on the 5-minute chartpresents an opportunity for entry by forming a 5-minute Gartley sell pat-tern. This offers a very low-risk entry into a very high-priced stock. Therisk in this trade using this small 5-minute pattern and placing the stop justabove the high of the day is around $2.00 per share.
A partial profit could be taken on the retracement of the 5-minute Gart-ley pattern and the stop kept at the initial location if the trade is being heldovernight. This trade would have been stopped out if held until the nextmorning and would have been a breakeven or very small loss trade.
If the trader then wants to initiate another entry at the 1.618 com-pletion level of the 60-minute Butterfly pattern, the 5-minute chart can beused to aid the trader. See Figure 8.14 for a micro view of the entry usingthe 1.618.
Many times in trading you have to initiate multiple attempts into a tradein order to achieve a larger gain. It is very important to learn techniquesto manage the risk when reentering trades in this manner. In Figure 8.14,GOOG gaps up on the open and has a long, wide range bar. This time the

c08 JWPR033-Pesavento (Wiley Trading Series) August 31, 2007 12:46 Char Count=
112 TRADE WHAT YOU SEE
price reverses and trades below the opening price. Once the price forms the5-minute Gartley sell pattern and Opening Price Retracement sell pattern,it offers an excellent entry into the trade with very little risk. The risk inthis trade with the stop-loss placed just above the high of the day is justaround $3.00 per share.
The trader can then reduce the risk in the trade and/or put oneself intoa risk-free trade by taking partial profits at the .618 retracement level equalto or close to the amount of risk in the trade. If day trading, then the traderwould close the trade at the end of the day. If the trader is position tradingbased on the longer-term 60-minute chart, a stop-loss order would be keptworking and the trader would then use larger profit targets based on the60-minute chart retracements and trail a stop to protect profits.
Multiple Pattern Completions in MultipleTime Frames
Now let’s look at an example of multiple patterns in multiple time framescompleting around the same price area. Refer to Figure 8.15 and the Gartley“222” sell pattern on the daily time frame. We’ll look at Figure 8.16 next fora closer view and another sell pattern that forms and is completed on a15-minute chart in the same price area.
Figure 8.15 Daily chart of the euro shows a Gartley “222” sell pattern.

c08 JWPR033-Pesavento (Wiley Trading Series) August 31, 2007 12:46 Char Count=
Retracement Entries and Multiple Time Frames 113
Figure 8.16 This chart of the euro shows a 15-minute Gartley “222” sell patternthat completes within a couple of ticks (pips) of the daily Gartley “222” sell patternin Figure 8.15.
The high of point D on the daily Gartley “222” sell pattern is at 1.2891and the 15-minute D completion point is at 1.2888—within a few ticks(pips) of the larger time frame. When there is a congestion area of supportor resistance price levels that are formed by multiple patterns, the tradercan use that information for entering trades, placing stop-loss orders andprofit-taking objectives.
Opposing Patterns on Multiple Time Frames
Our last example in this chapter shows you an example of a daily chart ofcorn (Figure 8.17) and a 30-minute chart of corn (Figure 8.18) that can beused to alert the trader to opposing price patterns.
The corn daily chart (Figure 8.17) shows a larger Butterfly pattern andAB=CD pattern with a completion point at D. Notice the circled area onthis chart. If you look closely, you will see that after the completion of thebuy pattern a sell Gartley “222” pattern forms and shortly after that patternanother Gartley “222” buy pattern. Figure 8.18 shows a detail of these twopatterns that are clearly visible on the 30-minute chart.
The information offered by these two conflicting patterns can be usedin several ways:

c08 JWPR033-Pesavento (Wiley Trading Series) August 31, 2007 12:46 Char Count=
114 TRADE WHAT YOU SEE
Figure 8.17 Corn daily chart shows a large bullish Butterfly pattern and AB=CDpattern completing.
Figure 8.18 Corn 30-minute chart shows two opposing Gartley “222” patternsthat have formed. One is a Gartley “222” sell pattern and the other is a Gartley “222”buy pattern.
c08 JWPR033-Pesavento (Wiley Trading Series) August 31, 2007 12:46 Char Count=
Retracement Entries and Multiple Time Frames 115
Ĺ Assuming the trader, after entering the large Butterfly/AB=CD buy pat-tern, has already taken partial profits and is anticipating a larger movebased on the larger time frame pattern, the trader could manage therisk in the trade by observing whether the AB=CD sell pattern makesnew lows; if it does, the Butterfly buy pattern would be considered afailed pattern. A stop-loss order at the low of the completion of thedaily Butterfly pattern could be maintained at that level, and the traderwould be stopped out with a small profit on the trade. Once the tradersees that the Gartley “222” sell pattern failed by making highs above theX point of that pattern, the trader can then move the stop-loss order upto protect profits. Since the trader is working with a larger time framesuch as the daily chart in this example, it is important to not move astop-loss order too close and to give the market enough room to movearound, as well as to use the chart points that would suggest a failureof the pattern.
Ĺ Another important point for a trader who chooses to trade the Gartley“222” sell pattern in Figure 8.18 to be aware of is that the risk in thetrade can be closely managed based on an awareness of a larger timeframe pattern that has completed and is thus far profitable. A trader inthis situation would want to be cognizant of stop-loss protection anddiligent in taking profit objectives.
Ĺ The Gartley “222” buy pattern that also formed in the 30-minute timeframe gives a trader who missed the original entry point an excellententry into the trade with a quantifiable risk and stop-loss level usingpoint X of the daily Butterfly/AB=CD pattern.
Ĺ A trader could also use the Gartley “222” buy entry to add onto an ex-isting position in the market being traded. Adding onto a position mustalways be within the trader’s trade plan and money management andrisk parameters. This type of trading must also be within the trader’sskill and market knowledge level.
Notice also in Figure 8.18 the gap up areas on the right side of the chart.These are certainly showing a shift of sentiment in this market, and thatinformation can be used to the advantage of the trader who is long—thathigher prices may be ahead and it would be a good idea to hold the position.Conversely, it would give a trader who was short that market an alert totighten stops or exit the trade.
We have covered several areas using and interpreting informationbased on multiple time frames. The trader should always be aware of thelarger time frames and the overall market conditions of any market or stockone is trading and learn to combine time frames to improve one’s tradingskills.

c08 JWPR033-Pesavento (Wiley Trading Series) August 31, 2007 12:46 Char Count=
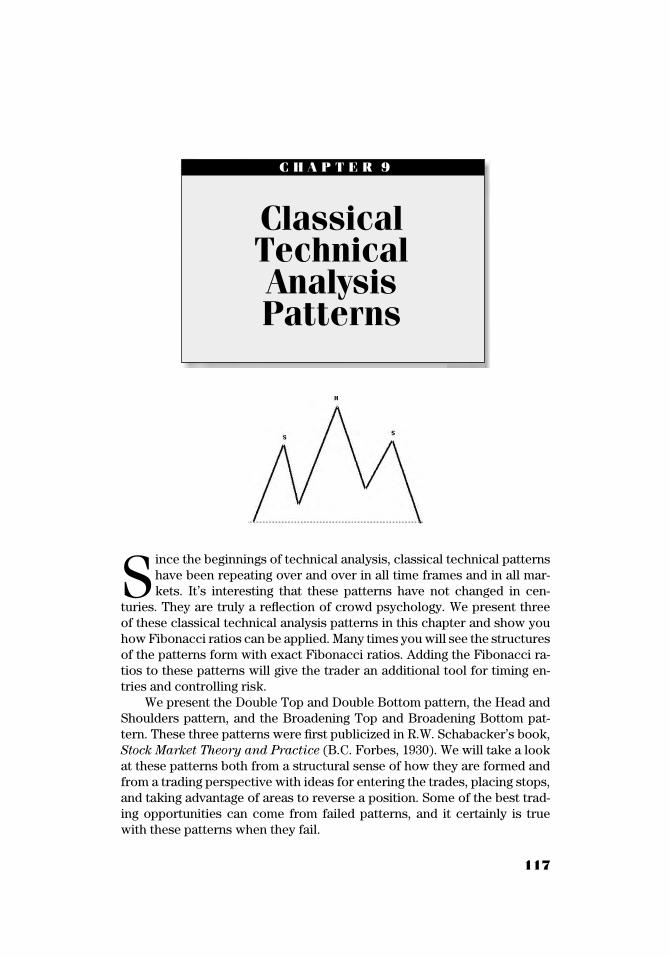
c09 JWPR033-Pesavento (Wiley Trading Series) August 14, 2007 13:12 Char Count=
C H A P T E R 9
ClassicalTechnicalAnalysisPatterns
S ince the beginnings of technical analysis, classical technical patternshave been repeating over and over in all time frames and in all mar-kets. It’s interesting that these patterns have not changed in cen-
turies. They are truly a reflection of crowd psychology. We present threeof these classical technical analysis patterns in this chapter and show youhow Fibonacci ratios can be applied. Many times you will see the structuresof the patterns form with exact Fibonacci ratios. Adding the Fibonacci ra-tios to these patterns will give the trader an additional tool for timing en-tries and controlling risk.
We present the Double Top and Double Bottom pattern, the Head andShoulders pattern, and the Broadening Top and Broadening Bottom pat-tern. These three patterns were first publicized in R.W. Schabacker’s book,Stock Market Theory and Practice (B.C. Forbes, 1930). We will take a lookat these patterns both from a structural sense of how they are formed andfrom a trading perspective with ideas for entering the trades, placing stops,and taking advantage of areas to reverse a position. Some of the best trad-ing opportunities can come from failed patterns, and it certainly is truewith these patterns when they fail.
117

c09 JWPR033-Pesavento (Wiley Trading Series) August 14, 2007 13:12 Char Count=
118 TRADE WHAT YOU SEE
A BRIEF HISTORY OF TECHNICAL ANALYSIS
The history of technical analysis using charts to monitor price dates backat least 1,000 years and was first documented by the Japanese. They usedrice as a gauge to determine supply and demand. In the late 1800s into theearly 1900s an evolutionary process occurred and launched a technical rev-olution of sorts by great technical analysts such as Jesse Livermore, H.M.Gartley, W.D. Gann, Richard Wyckoff, Richard Schabacker, Ralph Elliott,Charles Dow, George Cole, and a host of others too numerous to mentionwho devoted their time and lives to the art, science, and skill of technicalanalysis. An extraordinary note is that much of their work was done byhand. Computers were not available to compute moving averages and in-stantly call up charts of various time frames with multitudes of indicatorsand filters applied. These pioneers hand drew their charts meticulously,carefully noting market observations that were then tested and applied astheories and trading strategies. These technicians were great market ob-servers, and today many of the great traders still do some chart work byhand on a daily basis as part of a daily ritual. There were services avail-able that furnished daily or weekly charts of around 50 select individualstocks for a fee, but it certainly was a long way from the real-time data weenjoy today.
Through the Depression years and even World War II, there was verylittle printed material available regarding technical analysis. The first finan-cial news printed in newspapers, long before the Wall Street Journal, hadbegun about 10 years after the Civil War. As communications advanced andimproved, so did the ease of gaining financial information through tickertape, teletype, and telephone. Some of us can remember using the tickertapes through the Chicago Board of Trade and the Chicago Mercantile Ex-change during the late 1960s and early 1970s.
As the Internet and home computers became accessible, the communi-cations industry as related to financial information and technical analysisprograms exploded. Real-time data and charting software packages loadedwith every indicator and testing capability imaginable are now available toboth the novice technician and the professional alike.
For many years technical analysis was looked at by the financial com-munity as a form of voodoo and not worthy of consideration for seriouslymaking money. Books such as Jack Schwager’s Market Wizards have dis-pelled these myths with interviews from some of the greatest traders ofour time, like Marty Schwartz, who embrace technical analysis as the coreof their trading strategies. In his interview with Schwartz, Schwager asksabout his transition from a fundamental to a technical analyst. Schwartz’sreply clearly indicates that it was not until he went to technical analysisafter using fundamentals for nine years that he became rich.

c09 JWPR033-Pesavento (Wiley Trading Series) August 14, 2007 13:12 Char Count=
Classical Technical Analysis Patterns 119
As we mentioned at the beginning of this chapter, only recently hasthe academic world given its blessing (through its research) to the validityof technical analysis and the repetition of particular patterns that make itpossible for traders to profit.
BASICS OF TECHNICAL ANALYSIS
Everything in technical analysis starts with a single bar chart. This barchart is plotted on an x-axis and y-axis showing time and price. The pricebar represents the total sum of all buyers and sellers for that bar in thattime frame. The individual price bars give a great deal of information:
Ĺ The high price of the bar.Ĺ The low price of the bar.Ĺ The opening price of the bar.Ĺ The closing price of the bar.Ĺ The time frame of the bar.
Volume is also involved in the formation of the bar. The reason a barforms is irrelevant; what is important is how multiple bars form in rela-tion to one another over a period of time to create particular patternsthat repeat. It is important that the technical analyst learn to read thesebars as patterns and act appropriately when a pattern forms that offers atrading opportunity.
DOUBLE BOTTOM AND TOP PATTERNS
R.W. Schabacker stated that the Double Bottom pattern was an importantchart formation. This pattern can be found at major bear market bottomsand is a reversal pattern and an accumulation phase. The Double Top pat-tern is just the opposite; it is a reversal pattern and a distribution phase andcan be found at major tops. The pattern may also form as an intermediatepattern in a longer trend that is established.
Double Top and Bottom patterns are seen with a fair amount ofregularity on price charts in all time frames. They are sometimes referredto as W bottoms because of the apparent shape forming the letter W. It isprobably one of the most common patterns that novice technical analystsbecome aware of. As a reversal pattern it can be very powerful. If thepattern is seen on an index chart, then it is probable that the same patternwill be forming on many stocks that are in that index.

c09 JWPR033-Pesavento (Wiley Trading Series) August 14, 2007 13:12 Char Count=
120 TRADE WHAT YOU SEE
Double Bottom Pattern Example
If you will take a moment to examine Figure 9.1 and the example of theDouble Bottom pattern on the Dow Index, you will see long, wide rangebars to the downside that are indicated with arrows. They generally wouldindicate further downside in price, but on the second test down the lowshold and the market reverses back up, showing large bars to the upside,which is a definite shift in momentum. Because of this shift in momentum,the trader attempting to short as price approaches the .618 retracementlevel would either stand aside and wait for further confirmation, use a veryclosely managed stop, or look for an entry to trade long, which may befound on a smaller time frame.
The market’s job is to fool as many market participants as possible,and it is evident from this example that it did just that. This pattern formedprior to the Dow Jones Industrial Average reaching all-time highs above12,000. When the market does fool many participants, it catches tradersand investors off guard. Those who shorted believed that the price wouldcontinue lower based on the long, wide range bars. They were forced intocovering or holding and painfully watching losses grow larger. This willcreate upside fuel for this pattern.
Figure 9.1 This Double Bottom pattern formed in the Dow Jones Industrial Aver-age weekly chart prior to reaching all-time highs above the 12,000 level.

c09 JWPR033-Pesavento (Wiley Trading Series) August 14, 2007 13:12 Char Count=
Classical Technical Analysis Patterns 121
Also notice in Figure 9.1 the number of bars that formed after the firstbottom formed. The retracement up was approximately three bars up, andthen the second leg of the double bottom was approximately three barsdown. When the time ratios are equal in length, as in this example, thepattern is generally more significant. This concept was first described byW.D. Gann in the 1920s, and he referred to it as the equal time phenomenon.This is another way of describing symmetry.
Looking for Trend Clues
Figure 9.2 offers a closer look at what is happening with the Dow indexprice than is clearly visible on the weekly chart in Figure 9.1. We will exam-ine some clues in Figure 9.2 that the astute trader could use to determinea potential early trend reversal. We can see that the second low just barelyticked through the first low of the Double Bottom pattern before reversing.After the second low is made, long, wide range bars start to form to theupside. These are marked with arrows in Figure 9.2. The first retracementpattern that forms is able to retrace only to the .382 level. This, along withthe wide range bars up, is an indication of a trend. We will cover ways toidentify trends in Chapter 10 on trend identification of the S&P 500 market.
Figure 9.2 Daily view of the Double Bottom pattern on the Dow index. On thischart you can see that the price on the second bottom just barely ticks through thelows below reversing.
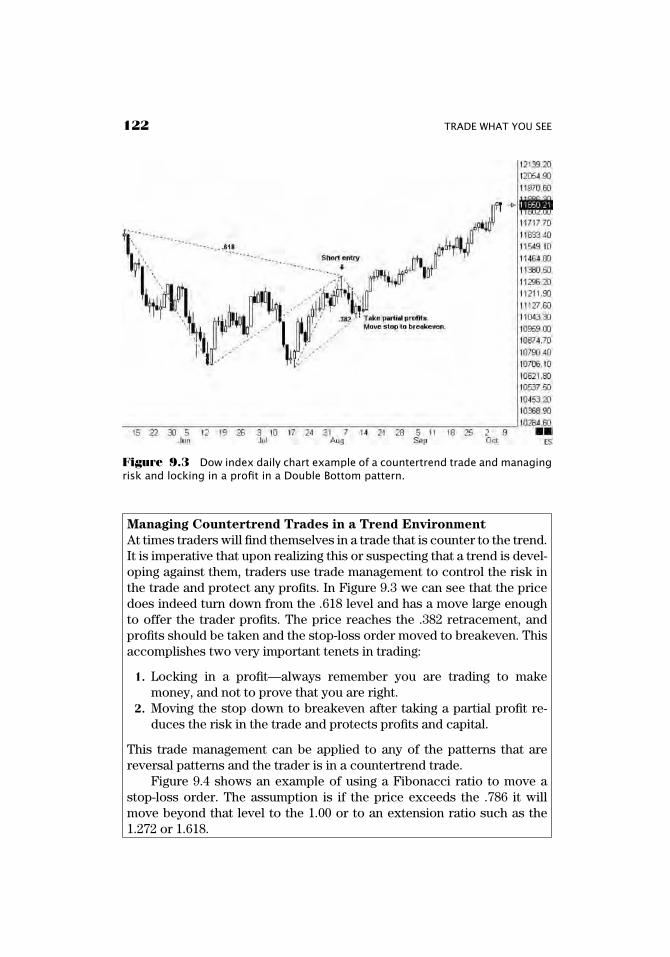
c09 JWPR033-Pesavento (Wiley Trading Series) August 14, 2007 13:12 Char Count=
122 TRADE WHAT YOU SEE
Figure 9.3 Dow index daily chart example of a countertrend trade and managingrisk and locking in a profit in a Double Bottom pattern.
Managing Countertrend Trades in a Trend Environment
At times traders will find themselves in a trade that is counter to the trend.It is imperative that upon realizing this or suspecting that a trend is devel-oping against them, traders use trade management to control the risk inthe trade and protect any profits. In Figure 9.3 we can see that the pricedoes indeed turn down from the .618 level and has a move large enoughto offer the trader profits. The price reaches the .382 retracement, andprofits should be taken and the stop-loss order moved to breakeven. Thisaccomplishes two very important tenets in trading:
1. Locking in a profit—always remember you are trading to makemoney, and not to prove that you are right.
2. Moving the stop down to breakeven after taking a partial profit re-duces the risk in the trade and protects profits and capital.
This trade management can be applied to any of the patterns that arereversal patterns and the trader is in a countertrend trade.
Figure 9.4 shows an example of using a Fibonacci ratio to move astop-loss order. The assumption is if the price exceeds the .786 it willmove beyond that level to the 1.00 or to an extension ratio such as the1.272 or 1.618.

c09 JWPR033-Pesavento (Wiley Trading Series) August 14, 2007 13:12 Char Count=
Classical Technical Analysis Patterns 123
Figure 9.4 Dow index daily chart of Double Bottom pattern: managing coun-tertrend trade using Fibonacci ratios to move stops and protect profits. The stop-lossorder can be moved to just above the .786. The assumption is if the price exceedsthe .786 level, it will move higher.
Double Top Pattern Example
Figure 9.5 shows an example of a Double Top pattern in the crude oil mar-ket that leads to a large decline. The second top does not exactly match thefirst top in price, but there is only a few cents’ difference. Once the marketturns down from the second top, it accelerates to the downside, as is visi-ble with the gaps down and the long, wide range bars. A trader recognizingthese warning signs would want to look for areas to trade with that trendand momentum. A smaller time frame could be used for entries.
Pattern Recognition
The Double Top and Bottom patterns should be easy to see and aestheti-cally pleasing to the eye. The key to these patterns is the formation of thesecond leg of the top or bottom. It is not unusual for the second low on aDouble Bottom pattern to be exceeded by a small amount or the secondhigh on a Double Top pattern to be exceeded by a small amount. The rea-son for this is that stops are placed just at or slightly beyond these levels

c09 JWPR033-Pesavento (Wiley Trading Series) August 14, 2007 13:12 Char Count=
124 TRADE WHAT YOU SEE
Figure 9.5 Crude oil daily chart example of a Double Top pattern. The two highsare within 20 cents.
and are taken out just as the market reverses. Refer back to Figure 9.2 foran example of the price exceeding the second low. The same principles forcontrolling risk and managing trades apply to both the Double Top patternand the Double Bottom pattern.
Failure Point
The technician should always be aware of where the failure points are onany technical pattern. This knowledge will help the trader to control riskand manage the trade by placing stops at the appropriate price levels. Thefailure point of the Double Top pattern would be at the high of the pattern.(Refer back to Figure 9.5.) If the price reversed back up to those highs, thetrader would want to cover any short positions and look for a place to golong. The trader could use a buy-stop order just above the highs to let themarket pull them into the trade. A stop-loss order could be placed basedon a visible chart point or dollar amount.
The failure point on the Double Bottom pattern would be if price re-versed back down through the lows. The trader could use a buy-stop or-der to let the market pull them into the trade and then place a stop-loss
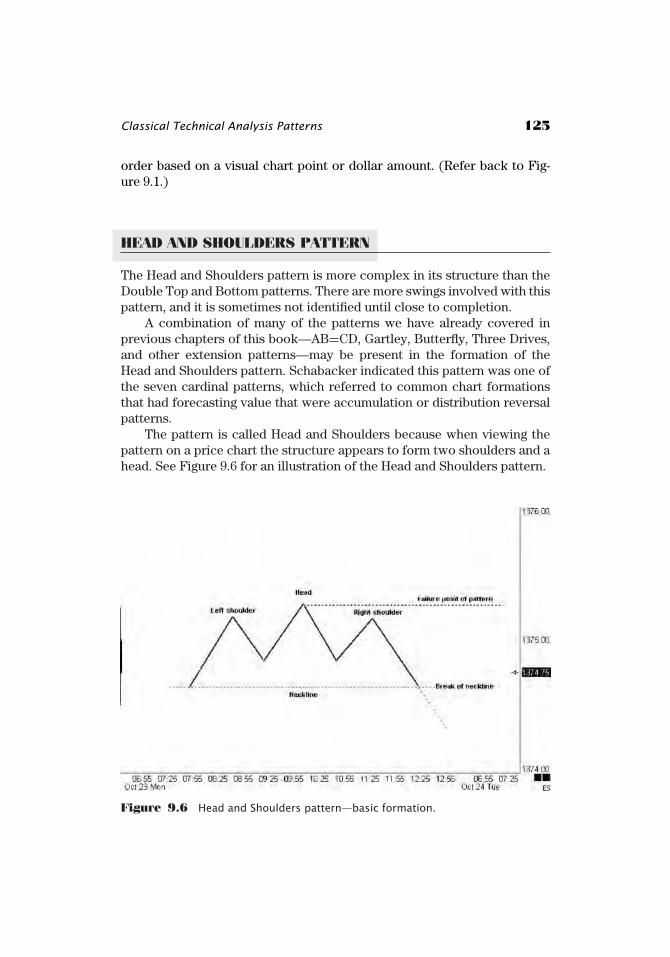
c09 JWPR033-Pesavento (Wiley Trading Series) August 14, 2007 13:12 Char Count=
Classical Technical Analysis Patterns 125
order based on a visual chart point or dollar amount. (Refer back to Fig-ure 9.1.)
HEAD AND SHOULDERS PATTERN
The Head and Shoulders pattern is more complex in its structure than theDouble Top and Bottom patterns. There are more swings involved with thispattern, and it is sometimes not identified until close to completion.
A combination of many of the patterns we have already covered inprevious chapters of this book—AB=CD, Gartley, Butterfly, Three Drives,and other extension patterns—may be present in the formation of theHead and Shoulders pattern. Schabacker indicated this pattern was one ofthe seven cardinal patterns, which referred to common chart formationsthat had forecasting value that were accumulation or distribution reversalpatterns.
The pattern is called Head and Shoulders because when viewing thepattern on a price chart the structure appears to form two shoulders and ahead. See Figure 9.6 for an illustration of the Head and Shoulders pattern.
Figure 9.6 Head and Shoulders pattern—basic formation.

c09 JWPR033-Pesavento (Wiley Trading Series) August 14, 2007 13:12 Char Count=
126 TRADE WHAT YOU SEE
Figure 9.7 Daily chart of IBM with a Head and Shoulders Top pattern with Fi-bonacci ratios applied.
Applying Fibonacci Ratios to the Head andShoulders Top Pattern
Let’s take a look at a Head and Shoulders Top pattern that has Fibonacciratios applied and has several other patterns as part of the structure. Fig-ure 9.7 is a daily chart of IBM with a completed Head and Shoulders Toppattern. In this example you can see that the left shoulder also contains aButterfly pattern and an AB=CD pattern. In the circled area you can see aDouble Top pattern. In this case we have several patterns coming into thesame price area as a potential top and reversal area.
The retracement in the left shoulder from point X to A to B cameto above the .786 level. This is important to note, because how the rightshoulder forms in relation to this will give information as to the validity ofthis pattern and its potential strength or weakness, since the right shoul-der is the reaction pattern coming after the high or head has been made.This countertrend rally will usually stop at the .618 or .786 level. When theright shoulder has a lower ratio than the left shoulder, it usually signifiesa much more bearish pattern. Time symmetry is also important and placesan added significance on the pattern if it is present.
c09 JWPR033-Pesavento (Wiley Trading Series) August 14, 2007 13:12 Char Count=
Classical Technical Analysis Patterns 127
Trading the Head and Shoulders Top Pattern
There several ways to approach trading this pattern, the first being that thetrader is already short the market based on an extension pattern, such asthe Butterfly and AB=CD pattern that can be seen in Figure 9.7, or possi-bly from the Double Top pattern that formed. This pattern is very easy tosee after the full formation, but, as we indicated earlier, it is a little moredifficult to spot sooner, before at least the top or head is complete and thefirst reaction down from there has taken place.
We will assume that if the trader is already positioned short in the mar-ket based on other patterns near the highs and has taken partial profits,the trader can then begin to look for signs of a right shoulder forming by areaction rally back up, as outlined earlier. A stop-loss order could be keptat breakeven or just at the previous highs of the head, because the patternwould be void if the price then exceeded this level. As mentioned previ-ously, the majority of traders watch for a break of the neckline to enter thetrade. Because of this, the trader positioned in this trade earlier would wantto monitor the price for a break of the neckline for potential further gains.
There is always the possibility of any pattern failing, so the trader couldalso take a second profit as the neckline is being tested or broken and movethe stop to just above the last high. Figure 9.8 shows an example of placingthe stops and where the break of the neckline is. From that point, if pricescontinue further, the trader can then use either a 1.272 extension from theAD of the AB=CD pattern for further profits and trail a stop or a Fibonacciretracement from a larger swing.
Another traditional way to measure a profit objective with this patternis to take the height of the pattern and project it down from the price levelof the broken neckline. Figure 9.9 shows this example.
This pattern can also be entered using the break of the neckline byusing a sell-stop order and letting the market pull you into the trade. Astop-loss order can be placed using a visual chart point or dollar amount.
Failure Point The failure point in this pattern is just above the forma-tion of the head. Refer back to Figure 9.6. At this point the trader wouldlook to go long by using a buy-stop order. The stop-loss order can be placedusing a visual chart point or dollar amount. Failure points and failed pat-terns will usually have a strong move in the opposite direction of the origi-nal pattern.
Head and Shoulders Bottom Pattern
Since we mentioned earlier that these patterns have been present in mar-kets for centuries and have not changed, we will take this opportunity to

c09 JWPR033-Pesavento (Wiley Trading Series) August 14, 2007 13:12 Char Count=
128 TRADE WHAT YOU SEE
Figure 9.8 IBM daily chart example of Head and Shoulders Top pattern showingstops moved as the price reaches the neckline level. The 1.272 extension of AD canbe used for a profit objective.
show you an example of this repetition. Figure 9.10 is a Head and Shoul-ders Bottom pattern from 1928. It is an example from R.W. Schabacker’s1930 book, Stock Market Theory and Practice.
The chart is of Westinghouse Electric from 1928 (i.e., prior to the crashof 1929). In this figure, A, B, and C are used to label the left shoulder, head,and right shoulder of the pattern (the Bottom pattern is an inverted Headand Shoulders Top pattern). If we were to remove the labeling of this chartand the year it is from, it would be indistinguishable from any price charttoday that forms the same pattern.
On the left-hand side of Figure 9.10 you can see an AB=CD patternthat forms and is completed at the point labeled A, or the bottom of the leftshoulder. A small sell AB=CD then forms following the completion of theleft shoulder and makes a new low to complete the point of the head.
Once the price moves up from the point labeled B or the bottom of thehead, you can see long bars where the neckline is broken, and then a smallbuy AB=CD before the price accelerates to the upside. The price does notquite make it down to the .618 retracement of BC, the completion of thehead and the completion of the right shoulder, which, as we discussed ear-lier, would have been a sign of strength. Again, this is a sign of a shift of

c09 JWPR033-Pesavento (Wiley Trading Series) August 14, 2007 13:12 Char Count=
Classical Technical Analysis Patterns 129
Figure 9.9 IBM daily chart example of Head and Shoulders Top pattern. The pat-tern height can be measured and projected down from the break of the neckline andused for a profit objective.
momentum to the upside. The same trading techniques and risk manage-ment apply to this chart from 1928 as to any other chart in this book.
The caption at the bottom of the page states that it is an irregular Headand Shoulders Bottom pattern. Schabacker says of this chart that no chartpicked at random from actual market history will ever show a perfect for-mation. He does not consider this pattern perfect because the head of thepattern, B, does not go as low as it could have, and the right shoulder doesnot retrace as deeply as it could have to form a perfect Head and Shoulderspattern. We thought it both interesting and educational to show this partic-ular example that illustrates these imperfections. It is not often that we getperfect patterns. The longer a trader studies any pattern, the easier it is toidentify the acceptable imperfect patterns and distinguish them from onesthat are invalid.
Failure Point By now you probably know the failure point of this pat-tern. It is below B, the completion of the head. If the price were to reverseand make new lows below that point, the pattern would be considered afailed pattern. Once the momentum shifts up and starts making higher lowsand higher highs, an astute trader could even use the point below C, thecompletion of the right shoulder, for a failure point.

c09 JWPR033-Pesavento (Wiley Trading Series) August 14, 2007 13:12 Char Count=
130 TRADE WHAT YOU SEE
Figure 9.10 Head and Shoulders Bottom pattern from Stock Market Theory andPractice.Source: R.W. Schabacker, Stock Market Theory and Practice (B.C. Forbes, 1930).
BROADENING TOP AND BOTTOM PATTERNS
Schabacker credits A.W. Wetzel with first publicly identifying the Broaden-ing Top and Bottom patterns. In his book Stock Market Theory and Prac-
tice, Schabacker refers to this pattern as one of the seven formations thatindicate preparation for a major movement. This pattern was seen in manystocks in the third quarter of 1929 preceding the crash of October and thebear market that followed.

c09 JWPR033-Pesavento (Wiley Trading Series) August 14, 2007 13:12 Char Count=
Classical Technical Analysis Patterns 131
This pattern is rare, and Schabacker stated that because of this it wasless important as an indicator than the more common reversal patterns.This does not in any way mean that it is not a powerful pattern when itdoes form.
This pattern was marketed by J. Welles Wilder 50 or so years later asthe Reverse Point Wave system. It was sold at the time for about $2,500 toalmost 1,000 traders. It is also covered in H.M. Gartley’s 1935 book, Profits
in the Stock Market, where it is referred to as the T-6 Broadening Top.
Pattern Structure
The structure of this pattern consists of five reversal points. Each low issuccessively lower and each high successively higher. Figure 9.11 shows aBroadening Top formation in the Dow Jones Industrial Average precedingthe price highs of 2000 and the bear market that ensued.
The Broadening Top and Bottom patterns are really nothing more thantriangle and coil patterns, which are classic technical analysis patterns inwhich the market comes to a point of indecision before breaking out toeither the upside or downside. They can also be continuation type patternsfound in trends. Refer to Chapter 10, “Learning to Recognize Trend Days.”The apex of the pattern is reversed from a traditional and more commonlyfound triangle pattern. The apex is on the left side of the pattern rather
Figure 9.11 Dow Jones Industrial Average weekly chart of a Broadening Top pat-tern shows five reversal points and the apex on the left side. Many stocks in the thirdquarter of 1929 formed this pattern preceding the October crash.

c09 JWPR033-Pesavento (Wiley Trading Series) August 14, 2007 13:12 Char Count=
132 TRADE WHAT YOU SEE
than on the right side and expands from there. The pattern is sometimesreferred to as an Expanding Triangle pattern.
You can see in Figure 9.11 that following the decline after point 5 thereis a rally that would be considered a sixth reversal point, but the rally doesnot exceed point 5. The establishment of this lower high indicates the prob-ability of a reversal.
Adding Fibonacci Ratios
We can define the waves in most Broadening Top and Bottom patterns bythe use of Fibonacci numbers. Each wave in the pattern is interrelated bythese numbers. The most common Fibonacci numbers that will be seenand used in this pattern are .618, .786, 1.00, 1.272, and 1.618.
Figure 9.12 shows a portion of the Dow index chart used in Figure 9.11with the addition of Fibonacci ratios to define the geometric structure.
The left side of the pattern from points 1 through 3 forms a 1.272 ex-tension pattern. You can also see the formation of a Three Drives pattern,which completes at point 3 of the Broadening Top pattern. There is alsoa small AB=CD that completes at the top of the pattern. Point 3 is higherthan point 1.
Points 2 through 4 form another 1.272 extension pattern. This patternextends just a bit beyond the 1.272. Point 4 is lower than point 2. One last
Figure 9.12 Dow index weekly chart of Broadening Top pattern with Fibonacciratios added to define the geometric structure.

c09 JWPR033-Pesavento (Wiley Trading Series) August 14, 2007 13:12 Char Count=
Classical Technical Analysis Patterns 133
1.272 extension pattern forms from point 4 to point 5 to complete the pat-tern. A note here on the final wave completion at point 5: An extension upto the 2.00 is acceptable, but anything beyond that signals the market is ina strongly trending mode.
The lower high that would be the sixth point rally completes at the .786retracement of the initial decline from point 5. In this example the patternis very symmetrical and the waves are easily identifiable.
The formation of a Broadening Bottom pattern is just the opposite ofthe Broadening Top pattern. (See Figure 9.13 for an example of a Broad-ening Bottom pattern.) You can see in this example that the corn markettakes off and goes into a very strong uptrend after completing the pattern.
The low points 1, 3, and 5 do not reach the 1.272 extension—they justexceed the 1.00. Symmetrically this pattern is almost perfect. The time ittakes to form the lows between points 1 and 3 and again between 3 and 5is almost identical, as is illustrated in Figure 9.13.
Failure Point
Both Figures 9.12 and 9.13 have the failure points of the Broadening Topand Bottom patterns marked. These patterns are seen at tops and bottomson longer-term time frames; they can form on smaller time frames, but
Figure 9.13 Corn daily chart example of Broadening Bottom pattern. Althoughthe lows do not quite reach the 1.272 extensions, the times between lows are almostidentical.

c09 JWPR033-Pesavento (Wiley Trading Series) August 14, 2007 13:12 Char Count=
134 TRADE WHAT YOU SEE
when found on the longer-term time frames they can signal a major re-versal. This is evident in the example of the Broadening Top pattern of theDow index (refer back to Figure 9.12).
When these patterns fail, they can lead to explosive moves in the oppo-site direction (i.e., continuing in the direction of the original trend). Whenpoint 5, which should be the completion point of the pattern, explodes witha wide range bar (usually two to three times the length of an average dailybar) or a price gap occurs, a continuation move of major proportions ismost likely under way. As always, the trader must quantify the risk and usestop-loss protection when trading this pattern.
Trading the Broadening Top andBottom Patterns
As is noted and depicted in the example charts of this pattern, it is not un-usual to see other patterns form as a Broadening Top or Bottom pattern isforming. In Figure 9.12 we can see an AB=CD pattern, a 1.272 extensionpattern, and a Three Drives pattern. When entering a trade into a Broaden-ing Top or Bottom pattern, the trader can use any of these other patternsas entries and any of the stop-loss and profit objective techniques we havealready discussed.
Using the example in Figure 9.12 of the Broadening Top pattern, a re-tracement entry could be used after the initial reaction down and a stop-loss order placed above either the .786 or the 1.00 if the risk is acceptable.A trailing stop can be used for managing exits on the trade.
In the case of the Broadening Bottom in Figure 9.13, the exampleshows there is not much of a retracement; the trader who is waiting fora 1.272 to enter would miss the initial entry. The trader would probablywant to scale down to a smaller time frame for a pattern to enter on andplace a stop-loss order. If the pattern is being traded from a longer-termtime frame such as a daily or weekly chart, keep in mind that it could be alonger-term reversal signal and you may want to plan exits accordingly.
If either pattern has a failure and turns up or down through the failurepoints, the trader would want to then look for an entry in the direction ofthat failure.
Although a Broadening Top or Bottom pattern is rarer than others pre-sented in this book, it can be one of the most reliable and profitable pat-terns and is certainly worth the trader’s time to study.

c10 JWPR033-Pesavento (Wiley Trading Series) August 14, 2007 9:22 Char Count=
C H A P T E R 1 0
Learning toRecognizeTrend Days
A trend day can easily become a countertrend trader’s largest loss dayas a result of repeatedly trying to trade against the trend. A trend daycan be defined as a market where price opens on or near its highs
or lows and then closes at the opposite end of the range. These tradersmay feel they are doing the right thing by taking the countertrend signalsor patterns but repeatedly get stopped out. A day like that can erase weeksor even months of profits. Not only can it damage the trader financially, butit can also damage the trader’s mind-set. Conversely, if a trader learns toidentify trend days and trade in the direction of the trend, the trader canturn that around and trend days can be their best trading days.
In this chapter we want to present examples of trend days that occur inthe S&P 500 E-mini market. We chose this market for a couple of reasons;first, it is a widely traded market by day traders, and second, the character-istics illustrated in this market can also be used with individual stocks orother markets. Since the S&P 500 index has a total of 500 stocks, it wouldstand to reason that if the index is trending, a large majority of the stocks inthat index will also be trending. The main purpose of including this chapteris to help countertrend traders become aware of when a trend is presentso that they can make well-informed trading decisions that will help themto protect capital and learn to trade in the direction of the short-term trendin this market.
The areas we cover are:
Ĺ Identifying a trend day.Ĺ Patterns found on trend days.Ĺ Combining time frames and using Fibonacci ratios on trend days.
135

c10 JWPR033-Pesavento (Wiley Trading Series) August 14, 2007 9:22 Char Count=
136 TRADE WHAT YOU SEE
Ĺ Avoiding countertrend trades on a trend day and controlling risk on atrend day.
Ĺ Example of trading a trend day.
IDENTIFYING A TREND DAY
We first define a trend as higher highs and higher lows in an uptrend andlower highs and lower lows in a downtrend. (See Figures 10.1 and 10.2.)Trends can manifest on any time frame, short or long, and for trends longerin duration the trend will be seen first on the shorter time frames. Strongtrends will open or close on or near the lows or highs and close at theopposite end of the range. It is a mistake to assume when a trend is inprogress that a price has gone too high so therefore it is a short sale orit has gone too low and therefore it is a buy. Prices can always movefurther up or down than anyone expects. The percentage of trend daysis much smaller than the percentage of range or countertrend type days.A typical trading month may see anywhere from two to five trend dayson average.
Figure 10.1 Example of a short-term 5-minute chart uptrend in the S&P 500E-mini market. Higher highs and higher lows define the uptrend. On this day themarket opens near the lows and closes near the highs.

c10 JWPR033-Pesavento (Wiley Trading Series) August 14, 2007 9:22 Char Count=
Learning to Recognize Trend Days 137
Figure 10.2 Example of a short-term 5-minute chart downtrend in the S&P 500E-mini market. Lower highs and lower lows define the downtrend. Just the oppositeof Figure 10.1, the market opens near the highs and closes near the lows.
When trading from a short time frame such as a 5-minute chart, thetrader should be aware that a trend can manifest at any point during thetrading day and end at any point in the trading day. In other words, some-times trends can be short-lived.
Figure 10.3 is a price chart of the same time period as Figure 10.1.Figure 10.3 shows a more condensed view that gives us a little more data towork with. In this example we can see the market gapping up on the open.This tells us there is an imbalance of price. The vertical grid line marksthe opening price on the day, and to the left is the previous day’s closingprice bar. The important point to note here is how the market holds thegap open. In Figure 10.3 we can see how the market holds the gap with noattempt to retrace back into the gap and fill in the price void. This is ourfirst sign of strength and an indication that an uptrend may be in the makingfor the day. We can also see marked in Figure 10.3 a long, wide range barthat makes new highs on the day; this also can be an early indication of atrend day. If the price had reversed back into the gap after making the long,wide range bar with new highs, then a trend day would have most likely notbeen in progress.
The markets are constantly in a process of either contracting (i.e.,trading in a range), which gives us the countertrend trading setups, or

c10 JWPR033-Pesavento (Wiley Trading Series) August 14, 2007 9:22 Char Count=
138 TRADE WHAT YOU SEE
Figure 10.3 Example of a short-term 5-minute chart uptrend in the S&P 500 E-mini market. The price holds the gap-up open and makes no attempt to fill the gap.A long, wide range bar makes highs on the day, a sign of strength and an indicationthat an uptrend may be in progress.
expanding, which gives us trends. There are three market tendencies thatcan alert the trader to the possibility of a trend day developing.
1. A narrowing of range, referred to as an NR7, which is defined as thenarrowest range in the past seven trading days. This was first publishedby Toby Crabel in Day Trading with Short Term Price Patterns and
Opening Range Breakout (Traders Press, 1990). Linda Raschke alsohas done extensive research using narrow range trading days as a char-acteristic that can precede a trend day.
2. Gap opening followed by long, wide range bars in the first 15 to 30minutes of trading.
3. Neutral market closes, where the market closes in the same area thatit opened.
Both Toby Crabel and Linda Raschke have done excellent statisticalresearch on these market tendencies that precede trends.
When a trend day does develop, it will be most valid when all indexes—S&P 500, Dow Jones Industrial Average, NASDAQ, and Russell—are trend-ing in the same direction. In an uptrend they would each be making new

c10 JWPR033-Pesavento (Wiley Trading Series) August 14, 2007 9:22 Char Count=
Learning to Recognize Trend Days 139
highs; they would make new lows in a downtrend. As mentioned earlier,the majority of stocks that make up these indexes will be trending in thesame direction. If traders see individual stocks that are not participatingin the trend, they should make a note of those and watch for patterns todevelop to trade those stocks. And if they see stocks that are leading thetrend, they can also make a note of those stocks to watch for setups in thedirection of the trend.
PATTERNS FOUND ON TREND DAYS
Once traders have identified that a trend is under way, they will do besttrading in the direction of the trend. There are specific patterns that tendto form during these trends. As we have mentioned previously, any retrace-ments that are pullbacks in a trend will most likely reach only the .382 forthe strongest trends, and the .50 for other trends. There may or may notbe an AB=CD pattern with these retracements, and the trader may want towatch for consolidation-type patterns to form and use repetitive correctionsizes to time entries into trades. Most of the corrections or pullbacks thatoccur during a trend day will be shallow. The strongest trends will tendto correct between 1.25 and 3.5 points. Generally, any corrections or pull-backs in a trend will not exceed 5.5 points. This helps the trader to placestops when trading a trend day.
We will focus on these two trend day patterns:
1. AB=CD correction2. Consolidation pattern
AB=CD Pattern on a Trend Day
Most intraday trends will see at least one small AB=CD pattern form thatwill give the trader a low-risk entry into the trend. As mentioned earlier, thecorrections tend to be shallow, and many times the small AB=CD patternsthat form will retrace to the .382 or to the .50. On a true trend day they willusually not retrace to the .618 or the .786 once the trend is under way. InFigure 10.4, two AB=CD patterns form during the trading day on a 5-minutechart. The first AB=CD pattern forms early in the day and before the trendis in full progress. This first pattern does retrace to the .618. Notice thesize of the correction: 4.5 points. The corrections tend to be very similarin size on a trend day. On very strong trend days and if the trend accel-erates, the corrections will become shallower. Trends are one of the fewtimes we use the .382 or .50 retracement as an entry into a trade.

c10 JWPR033-Pesavento (Wiley Trading Series) August 14, 2007 9:22 Char Count=
140 TRADE WHAT YOU SEE
Figure 10.4 5-minute chart showing two AB=CD corrections in trend day down.The first AB=CD correction pattern forms shortly after the opening and retraces tothe .618.
The second AB=CD pattern that forms later in the trading day is onepoint less than the first AB=CD correction at 3.5 points. Notice in Figure10.5 that the retracement uses the open price at 1386 rather than the actualhigh of the swing. On trend days the price tends to retrace to the .382 levelfrom the open price. There will usually be one AB=CD pattern that retracesto the .382 using the open price. It is good to be aware of this, as it may helpthe trader time an entry into a trade.
Trend Day Consolidation Pattern
Although the AB=CD pattern is a consolidation pattern on a trend day,consolidation patterns can also form that are absent of an AB=CD. Thesepatterns may form as bull flags in an uptrend and bear flags in a down-trend. Triangle patterns may also form as a consolidation pattern alongwith sideways-type consolidation in very strong trends.
In Figure 10.6 the trend day starts with a gap-up open. The pricedoes not attempt to fill in the gap area and instead makes a very shal-low retracement of only 1.75 points before making highs on the day. Thebars making highs that lead to the next correction of only 2.75 pointsare long bars, which shows strength in the market. The retracement from

c10 JWPR033-Pesavento (Wiley Trading Series) August 14, 2007 9:22 Char Count=
Learning to Recognize Trend Days 141
Figure 10.5 5-minute chart showing two AB=CD corrections in trend day down.Using the opening price rather than the high, the AB=CD pattern completes at the.382 level.
Figure 10.6 5-minute chart of trend day up. The market gaps up on the open,and the price does not fill the gap. The corrections are shallow and repetitive.

c10 JWPR033-Pesavento (Wiley Trading Series) August 14, 2007 9:22 Char Count=
142 TRADE WHAT YOU SEE
the second correction of 2.75 points is just shy of the .382 using theopen price.
Notice the third correction up of only 2.0 points; this correction is veryshallow as price consolidates and is considered a sideways correction.Once again the market is showing us there is strength behind this moveup and the trend is likely to continue into the close. If you look closely atthe fourth correction on the chart, you can see a small AB=CD correctionthat is only 2.5 points, another very shallow correction in a strong trend up.
Once traders see a repetition of corrections in the same range, they canuse that to time an entry into a consolidation pattern. These tendencies arethe same for trend days down.
FIBONACCI RATIOS ON TREND DAYS
Generally, when a trend on a short time frame such as a 5-minute chart isprogressing throughout the trading day, the trader wants to be aware ofthe higher time frame cycles. The markets are usually traveling to a higheror lower level based on a larger time frame. Look at Figure 10.7 and noticehow this 60-minute chart with seven bars enclosed within the dotted rect-angle shows us a view of the price from the trend day shown in Figure 10.6.We can clearly see how strong the momentum is looking at this 60-minutechart. We can see the gap-up open, and we can also see how the price re-acted at the Fibonacci retracement levels.
At the first .382 retracement in Figure 10.7, there is a long, wide rangebar that easily slices through this level with no resistance. Refer now toFigure 10.8, which shows an interesting close-up view of price action us-ing the retracement from the 60-minute time frame applied to the 5-minutechart. We can see that when the price reaches the .382 shortly after thegap-up open, it slices right through the .382 price level with no resistance.This move is the first long bar seen on the 60-minute chart in Figure 10.7,and in Figure 10.8 we are looking at the same long bar broken down into a5-minute time frame. The price then goes up to the .50 level and finds verylittle resistance there as well.
This information is very valuable because it tells us that the price is ina trend and is likely to get to at least the larger .618 or the .786 and possiblyhigher using the 60-minute time frame. It is also important because it tellsthe countertrend trader to avoid countertrend trades and to trade with thetrend. We can also see in Figure 10.8 how, once the price is around theFibonacci retracement levels from the 60-minute time frame and appliedto the 5-minute time frame, the consolidations are a test and retest of thelevels once they are broken.
The next thing we want to look at is where the consolidation patternsthat are outlined in Figure 10.6 are consolidating. Figure 10.9 shows us

c10 JWPR033-Pesavento (Wiley Trading Series) August 14, 2007 9:22 Char Count=
Learning to Recognize Trend Days 143
Figure 10.7 60-minute chart showing the larger cycle at work: the trend day fromFigure 10.6 enclosed in the dotted rectangle.
Figure 10.8 5-minute chart showing the 60-minute 29.75 swing and the Fi-bonacci retracement levels. Using the retracement levels from the 60-minute chartapplied to a 5-minute chart, we can get a close-up view of how the price reacts at theresistance levels.

c10 JWPR033-Pesavento (Wiley Trading Series) August 14, 2007 9:22 Char Count=
144 TRADE WHAT YOU SEE
these same consolidation patterns but puts them into perspective with the60-minute Fibonacci retracement levels. We can see that the price reactsin a trendlike manner at the Fibonacci resistance levels. At each level theprice forms a consolidation pattern before moving higher.
If we look at the .50, .618, and .786 levels, we can see that the priceconsolidated above each of these levels; this is usually an indication thatthe price is in a trend and is going to move higher. The .50 level shows thesideways consolidation pointed out earlier in Figure 10.6 and how bullishthe price is with only a 2.0-point pullback above the resistance area. Thisis why it is so important for the trader to learn to identify a trend and totake appropriate trading actions. It would have been a disastrous day for acountertrend trader to have attempted selling into this strength.
CONTROLLING RISK ON A TREND DAY
If countertrend traders inadvertently find themselves in a trend day, theycan make a graceful exit by using the consolidation patterns as an exit.Referring back to Figure 10.9 as an example, let’s assume a trader sellsthe market at the .618 retracement level and initiates a 3-point stop, onlyrealizing that a trend day is in progress once in the trade. At this point, tocontrol the risk and protect capital, the trader wants to utilize one or moreof these trade management techniques:
Ĺ Ensure a stop-loss order is in place to prevent a small loss from turninginto a large loss.
Ĺ Use the small pullbacks to exit if possible.Ĺ Put the stop-loss order just above or below the last small swing high or
low.
Again, refer to Figure 10.9 and the .618 level, and let’s assume the traderis short from the 1383.75 level with a three-point stop and the initial objec-tive was another .618 retracement down. The trader would have an oppor-tunity to exit at least part of position as the small AB=CD pattern formsand to pull the stop down to breakeven. This would allow a small profiteven in a countertrend trade. If the trader either does not exit or enters thetrade at the second test up of the .618 and then realizes he is caught in atrend, he can either:
Ĺ Exit the trade immediately and reverse.Ĺ Use the next small pullback to exit, realizing it may be very shallow.Ĺ Pull the stop down to the last small high.

c10 JWPR033-Pesavento (Wiley Trading Series) August 14, 2007 9:22 Char Count=
Learning to Recognize Trend Days 145
Figure 10.9 5-minute chart with 60-minute Fibonacci retracement levels applied,showing consolidation patterns that formed at Fibonacci levels during the trend day.
Again, in either case a stop-loss order must be in the market to controllosses. When traders see prices consolidating on top of Fibonacci levels inan uptrend or below in a downtrend, they must realize that the probabilityis in favor of the price continuing in the direction of the trend.
TRADING A TREND DAY
We now look at a few examples of entering trades from our chart examples,placing stop-loss orders and profit objectives. We use the same trend daycharts we have been viewing for our first trade example. We also look at afailed trend day trade example, because, as we have mentioned, nothing intrading is ever 100 percent.
Trade Setup: Trend Day Up
Market: S&P E-mini
Contracts: 2

c10 JWPR033-Pesavento (Wiley Trading Series) August 14, 2007 9:22 Char Count=
146 TRADE WHAT YOU SEE
Ideally, on a trend day the trader would want to hold a core positionthat is initiated early in the day and try to hold the position into the close.The assumption is that a true trend day will open on or near its lows andclose on or near its lows. The trader can then take off contracts and addthem back on as the trend day patterns form. This will lock in profits andreduce risk in the event that the trend ends prematurely before the closeof the market, and it will keep the trader in the market for the bulk of thetrend.
In Figure 10.10 there are five trend day patterns marked in the chart,and we will review those:
1. Consolidation pattern shortly after gap-up open of 1.75 points.2. Consolidation pattern at the .50 resistance area of 2.75 points.3. Sideways consolidation pattern above the .50 retracement level. The
correction is 2.0 points.4. Small AB=CD pattern with a 2.5-point correction.5. Small consolidation pattern of 1.75 points at the .618 level.
Using pattern #1, if the trader has enough market knowledge and skillto identify an early trend condition off the open, he would have a very early
Figure 10.10 Five trend day patterns marked on a 5-minute chart of a trend dayup. Note the size of the corrections; the market will tend to repeat the correctionsize.
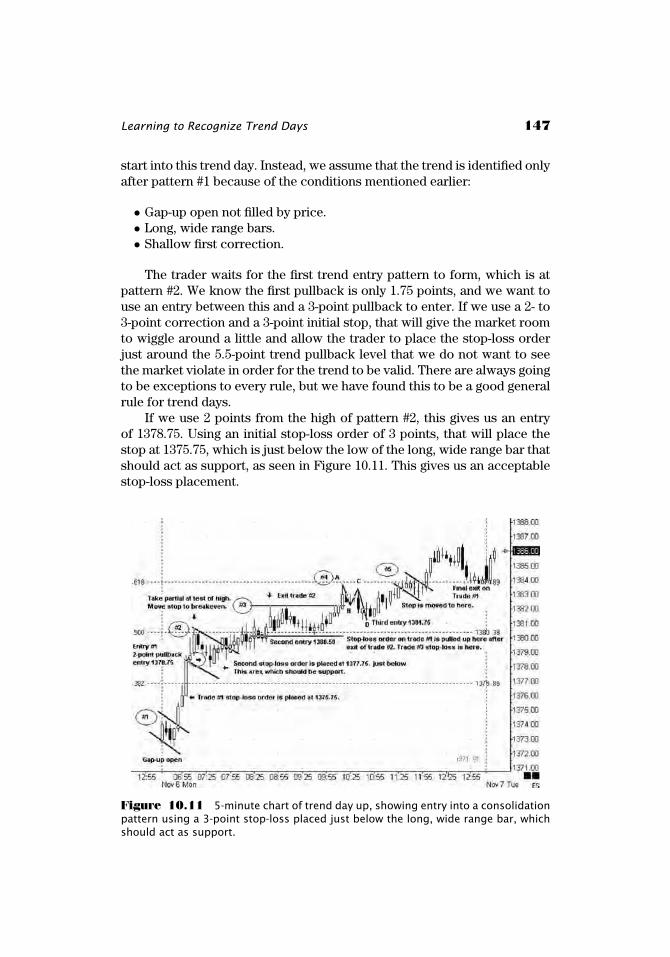
c10 JWPR033-Pesavento (Wiley Trading Series) August 14, 2007 9:22 Char Count=
Learning to Recognize Trend Days 147
start into this trend day. Instead, we assume that the trend is identified onlyafter pattern #1 because of the conditions mentioned earlier:
Ĺ Gap-up open not filled by price.Ĺ Long, wide range bars.Ĺ Shallow first correction.
The trader waits for the first trend entry pattern to form, which is atpattern #2. We know the first pullback is only 1.75 points, and we want touse an entry between this and a 3-point pullback to enter. If we use a 2- to3-point correction and a 3-point initial stop, that will give the market roomto wiggle around a little and allow the trader to place the stop-loss orderjust around the 5.5-point trend pullback level that we do not want to seethe market violate in order for the trend to be valid. There are always goingto be exceptions to every rule, but we have found this to be a good generalrule for trend days.
If we use 2 points from the high of pattern #2, this gives us an entryof 1378.75. Using an initial stop-loss order of 3 points, that will place thestop at 1375.75, which is just below the low of the long, wide range bar thatshould act as support, as seen in Figure 10.11. This gives us an acceptablestop-loss placement.
Figure 10.11 5-minute chart of trend day up, showing entry into a consolidationpattern using a 3-point stop-loss placed just below the long, wide range bar, whichshould act as support.
c10 JWPR033-Pesavento (Wiley Trading Series) August 14, 2007 9:22 Char Count=
148 TRADE WHAT YOU SEE
The first profit objective is going to be a test of the last highs at 1378.50.Once this is filled, the trader wants to move the stop-loss order up tobreakeven to lock in a profit and reduce risk in the trade. Remember thatthe trader wants to try to hold a partial position into the close on a trendday, so the next step is to wait for the next pattern and then add on onemore contract. The number of contracts is totally dependent on the moneymanagement plan of the trader. We are using an example of two contractsto illustrate how the trade can be managed on a trend day. In this examplethe trader has a 2-point profit with the stop at breakeven.
The next entry forms at pattern #3 with the sideways consolidationabove the .50. When the trader sees price consolidating above a Fibonacciresistance level (or below on a trend day down), this is a sign of strength,and the trader may use that as a low-risk entry. The premise is simple:What was once resistance is now support. The opposite would be true in adowntrend: What was once support is now resistance.
We can use that information to our advantage and enter the secondtrade in the trend day. We can place an order to go long just above the.50 at 1380.50 and place a stop one tick below the last consolidation levelat 1377.75 for a 2.75 stop. The stop on the first position can be main-tained at 1378.75. The profit target again is at a retest of the last high at1382.25. This would gain 1.75 points, and the stop on the first positioncan be moved to 1380.00, just below the last low. This leaves one openposition that the trader is trying to press for further gains on the trendday.
The third entry comes at the completion of the small AB=CD of pat-tern #4. Again, be aware of the pullback sizes that have already occurred.We can determine that the pattern completes around 1381.75, which is a 2-point pullback from the last high. We can place the stop-loss order just be-low the last low, along with the other stop-loss order on the core at 1380.00.The exit is at the retest of the last high at 1383.75 for a gain of 2 points onthat contract.
Pattern #5 is the last consolidation pattern shown on this chart, and thepullback is only 2 points. This most likely would be a tough entry becauseof the shallow pullback, and in real-life trading sometimes you just miss it.The trader, however, would still have the initial core trade on from 1378.75and the stop-loss order on that position at 1380.00. Once pattern #5 makesnew highs, the stop-loss order on the 1378.75 position can be moved upto one tick below the low of that pattern at 1382.50. The trader would thenwant to look for a spot to exit at or near the close. The closing price is 1384,and that would yield 5.25 points on the initial core position. If the traderhad been able to enter earlier off the open, the gains would, of course, belarger. Take some time to study Figure 10.11 and the trades presented withthat chart.

c10 JWPR033-Pesavento (Wiley Trading Series) August 14, 2007 9:22 Char Count=
Learning to Recognize Trend Days 149
Trade Setup: Failed Trend Day Up
Market: S&P E-mini
Contracts: 2
In the next chart example, Figure 10.12, we look at the importanceof maintaining the stop-loss levels as the trade progresses and of alwaysremembering that any type of pattern can fail. It will serve the trader inthe long run to focus on preserving capital by keeping losses small andprotecting profits.
We have already covered that any correction beyond a 5.5-point cor-rection is likely to signal a trend change on the 5-minute chart. We can seein Figure 10.12 that the day starts out in a trend day fashion; there are longbars and shallow corrections. The important items to note in this chart are:
Ĺ After the high and the second 3.25-point correction are made, the mar-ket then fails to make a new high.
Ĺ Remember that on a strong trend day the market will continue to makehigher highs and higher lows on an uptrend day and lower highs andlower lows on a downtrend day.
Figure 10.12 5-minute chart of failed trend day up. Once the market fails tomake new highs and turns lower, the trend is over.