the ability of rock physics models to infer marine in situ pore pressure
TRANSCRIPT
RESEARCH ARTICLE10.1002/2014GC005442
The ability of rock physics models to infer marine in situ porepressureMatthew J. Hornbach1 and Michael Manga2
1Department of Earth Sciences, Southern Methodist University, Dallas, Texas, USA, 2Department of Earth and PlanetaryScience, University of California, Berkeley, California, USA
Abstract Pore fluid pressure is an important parameter defining the mechanical strength of marine sedi-ments. Obtaining high spatial resolution in situ pore pressure measurements in marine sediments, however,is a challenge, and as a result, only a handful of in situ pore pressure measurements exist at scientific drillsites. Integrating rock physics models with standard IODP/ODP measurements provides a potentially widelyapplicable approach for calculating in situ pore pressure. Here we use a rock physics approach to estimatein situ pore pressure at two Scientific Ocean Drill Sites where in situ pressure is well constrained: ODP Site1173, used as reference for normal (hydrostatic) fluid pressures, and ODP Site 948, where previous studiesinfer high fluid pressures (k* � 0.45–0.95, where the pore pressure ratio k* is defined as the pore pressureabove hydrostatic divided by the difference between the largest principal stress and hydrostatic stress). Ouranalysis indicates that the rock physics method provides an accurate, low-precision method for estimatingin situ pore pressure at these drill sites, and sensitivity analysis indicates this method can detect modestlyhigh (k*> 0.6) pore pressure at the 95% confidence level. This approach has broad applicability because itprovides an inexpensive, high-resolution (meter-scale) method for retrospectively detecting and quantifyinghigh pore pressure at any drill site where quality wireline logs and ocean drilling data exist.
1. Introduction
Determining in situ pore fluid pressure provides critical insight into sediment mechanical strength and slopestability [e.g., Iverson, 1997; Dugan and Flemings, 2002; Stegmann et al., 2007]. Rapid sedimentation, low per-meability, diagensis, thermal expansion, focused fluid flow, fluid expansion, and earthquake-induced cyclicdeformation can all elevate subsurface fluid pressure [e.g., Gibson, 1958; Bredehoeft and Hanshaw, 1968;Bowers, 1995; Wang and Manga, 2010; Dugan and Sheahan, 2012], increasing the risk of slope failure.
Pore pressure can be measured in situ at drill sites using downhole penetrometers [e.g., Stegmann et al.,2006, 2007; Flemings et al., 2008], logging-while-drilling techniques combined with consolidation tests [e.g.,Moore et al., 1995; Moore and Tobin, 1997; Saffer, 2003], and via borehole monitoring [e.g., Davis et al., 1992;Screaton et al., 1997]. When in situ pressure measurements are not available, they are sometimes inferredusing seismic interval velocities and tomographic inversion [e.g., Bangs et al., 1990; Mallick, 1995; Dutta,1997], consolidation tests [e.g., Saffer, 2003], or by integrating empirical velocity-porosity-pressure relation-ships derived via consolidation tests or regional compaction and cementation models [e.g., Carstens andDypvik, 1981; Burrus, 1998; Harrold et al., 1999; Tobin and Saffer, 2009; Kitajima and Saffer, 2012]. Pore pres-sure studies integrating rock physics properties with appropriate prestack seismic velocity data and seismicattribute analysis offer perhaps the most comprehensive approach toward 2-D–3-D in situ pore pressureprediction [e.g., Dutta, 2002].
Measuring in situ pore pressure directly usually requires additional ship time, expense, or significant post-cruise analysis via consolidation tests. Additionally, with the possible exception of coupling logging-while-drilling techniques with empirical velocity relationships [e.g., Tobin and Saffer, 2009; Kitajima and Saffer,2012], in situ pressure measurements generally provide only spot measurements of pore pressure at a fewdepth locations downhole, resulting in low spatial resolution of pore pressure. As a result, of the more than1400 ocean drilling sites that exist, only a few sites have direct downhole in situ pore pressure measure-ments, with most of these consisting of only a handful of pore pressure measurements at discrete depthintervals.
Key Points:� In situ pressure is estimated by
integrating rock physics models withODP data� The approach typically can detect
pore pressure ratios in excess of �0.6� The method can provide meter-scale
pressure estimates at ocean drill sites
Correspondence to:M. J. Hornbach,[email protected]
Citation:Hornbach, M. J., and M. Manga (2014),The ability of rock physics models toinfer marine in situ pore pressure,Geochem. Geophys. Geosyst., 15, 4769–4780, doi:10.1002/2014GC005442.
Received 2 JUN 2014
Accepted 14 NOV 2014
Accepted article online 18 NOV 2014
Published online 10 DEC 2014
HORNBACH AND MANGA VC 2014. American Geophysical Union. All Rights Reserved. 4769
Geochemistry, Geophysics, Geosystems
PUBLICATIONS
In instances where limited in situ pore pressure measurements or consolidation data exist, empirical meth-ods using porosity, velocity, and specific mineralogies are sometimes used to estimate in situ pressure [Hott-mann and Johnson, 1965; Eaton, 1975; Bowers, 1995]. These techniques provide a useful approach forestimating pore pressure where relatively uniform lithology exists and have been shown especially effectivein areas where sand content exceeds 50% [e.g., Eberhart-Phillips et al., 1989]. In reality, however, significantvariability in sediment mineralogy and grain size often exists over short (>1m) vertical distances at scientificocean drilling sites [Hamilton and Bachman, 1982], and the velocity and porosity values used for such empir-ical analysis are directly dependent on sediment grain type [e.g., Hamilton and Menard, 1956; Wyllie et al.,1956]. As a result, empirical approaches for estimating pore pressure typically are most effective wherewell-constrained and near-uniform lithology exist.
Although there are few in situ pore pressure measurements at most drill sites, scientific ocean drilling pro-vides a wealth of other physical properties and stratigraphic measurements that offer insight into subsur-face fluid pressure. Since its inception more than 40 years ago, scientific ocean drilling has systematicallycollected stratigraphic and shipboard physical properties measurements, including porosity, density, andseismic velocity. It is standard (required) practice with the IODP program to collect in situ physical proper-ties measurements at all new IODP drill sites where hole conditions are stable (http://www.iodp.org/pro-gram-documents/). As a result, more than 50% of all IODP drill sites have downhole in situ seismic velocitymeasurements. As of 2014, a total of 439 scientific ocean drilling downhole in situ velocity measurementsexist, with this number steadily growing as more IODP sites are drilled. Many of these data are collectedwith cm-scale resolution—much higher than the typical spatial resolution of in situ pore pressure measure-ments, although meter-scale uncertainties in depth can be pervasive.
Given the huge volume of high-resolution shipboard physical properties data and the need for assessing insitu pore pressure, an obvious question arises: does a robust method for constraining in situ pressure condi-tions exists using only shipboard physical properties and standard wireline logs? Dvorkin et al. [1999a,1999b] and Mavko et al. [2009] address this question indirectly by applying rock physics models to estimatesubsurface velocity and incorporating the effects subsurface fluid pressure has on in situ P and S wavevelocity. They demonstrate that rock physics models can accurately predict subsurface velocity and provideinsight into in situ pore pressure if tight constraints on sediment lithology and physical properties exist[Dvorkin et al., 1999a, 1999b]. As a result, rock physics models are often used to calculate in situ velocity inareas with complex lithologies, including clay-rich marine sediments [Helgerud et al., 1999; Vanorio et al.,2003], and are sometimes used to estimate in situ pore pressure at scientific drill sites [Tsuji et al., 2008].Although the rock physics approach for estimating in situ pore fluid pressure is straightforward, severalphysical factors besides pore fluid pressure affect seismic velocity, and as a result, the accuracy and resolu-tion of using a rock physics approach to estimate in situ pore fluid pressure is unclear.
Here we first present a sensitivity study demonstrating how mineralogy, porosity, and grain contact uncer-tainties influence rock physics model results and contribute to uncertainty in pore fluid pressure estimatesbased on a rock physics approach. We then compare calculated in situ pressure values derived using a rockphysics approach with measured in situ pressure values at two scientific ocean drilling sites where in situpressure is well constrained. From this, we determine the accuracy and resolution of in situ pressure meas-urements derived from rock physics models. Using standard uncertainty values for scientific ocean drillingdata, our analysis suggests in situ pore pressure estimates using rock physics models are generally low pre-cision, but accurate, and represent one valuable, inexpensive, and rapid technique for detecting elevatedpore pressures with high spatial resolution.
2. Method
We use a derivation of the effective-medium rock physics model developed by Dvorkin et al. [1999a, 1999b]and Mavko et al. [2009] to estimate in situ pore fluid pressure. This rock physics model represents a firstprinciples approach for calculating in situ seismic velocity. The method estimates seismic velocity and incor-porates pore pressure directly into the analysis. The method uses the bulk and shear moduli for both thesaturated and dry sediment frame conditions based on Hertz-Mindlin Contact Theory and Gassmann’sequations [Mindlin, 1949; Gassmann, 1951]. The equations for estimating in situ velocity are the following[Mindlin, 1949; Gassmann, 1951; Dvorkin et al., 1999a; Mavko et al., 2009]:
Geochemistry, Geophysics, Geosystems 10.1002/2014GC005442
HORNBACH AND MANGA VC 2014. American Geophysical Union. All Rights Reserved. 4770

Vp5Ksat1
43 Gsat
qb
� �0:5
(1)
and
Vs5Gsat
qb
� �0:5
(2)
where Vp is the P wave velocity and Vs is the S wave velocity through the saturated sediments, Ksat is theshear modulus of saturated sediments, Gsat is the bulk modulus of saturated sediments, and qb is the bulkdensity of the saturated sediments. Since we know in situ velocity from wireline log measurements, we canuse the system of equations to solve for pore pressure through its effect on G and K.
Using results from Gassmann [1951], we calculate Ksat and Gsat via
Ksat5K uKDry2
11uð ÞKf KDry
K 1Kf
� �12uð ÞKf 1uK2
Kf KDry
K
(3)
and
Gsat5GDry (4)
where u is the porosity, KDry is the effective bulk modulus of the dry frame, K is the bulk modulus of themineral constituents in the sediment frame, Kf is the bulk modulus of the pore fluid, and GDry is the effectiveshear modulus of the dry frame. We calculate the effective dry frame moduli using the following equations:
KDry5
12u12uc
KHM1 43
� �GHM
1
u2uc12uc
43
� �GHM
!21
243
GHM (5)
GDry5
12u12uc
GHM1 GHM6 ð
9KHM18GHMKHM12GHM
Þ1
u2uc12uc
GHM6 ð
9KHM18GHMKHM12GHM
Þ
!21
2GHM
69KHM18GHM
KHM12GHM
� �(6)
where uc is the critical porosity for randomly packed spheres, 36%, and GHM and KHM are the effective shearand bulk moduli at the critical porosity as defined by Hertz-Mindlin contact theory [Mindlin, 1949], such that
KHM5n2 12ucð Þ2G2
18p2 12vð Þ2P
!13
(7)
GHM5524v
5 22vð Þ3n2 12ucð Þ2G2
2p2 12vð Þ2� P
!13
(8)
where n, the average number of contacts, varies between 6 and 9, G and v are the shear modulus andPoisson’s ratio of the solid mineral grains, respectively, and P is the effective pressure (i.e., the differencebetween lithostatic pressure and the pore fluid pressure from the seafloor to the depth of interest). Thisapproach for calculating KHM and GMH is valid for effective pressures below 10 MPa and assumes no changein grain contact number with pressure [e.g., Makse et al., 2004]. For our initial velocity prediction, we holdpore fluid pressure constant at hydrostatic values.
To calculate the elastic constants of the solid phase (i.e., G, K, and v), we use a weighted average for individ-ual mineral constituents, such that
K512
Xm
i51
fiKi1Xm
i51
fi=Ki
!21" #(9)
where m is the number of constituents and fi is the volumetric fraction of the ith constituent, and Ki is thebulk modulus of the ith constituent. The first term in equation (9) is the Voight upper bound, the isostrainaverage; the second term in equation (9) is the Reuss lower bound, the isostress average. We conduct anidentical averaging for the shear modulus and Poisson ratio.
Geochemistry, Geophysics, Geosystems 10.1002/2014GC005442
HORNBACH AND MANGA VC 2014. American Geophysical Union. All Rights Reserved. 4771
Given these equations, in order to determine in situ pore pressure using the rock physics model requiresconstraining four key parameters: (1) sediment elastic moduli, (2) sediment porosity, (3) the average numberof particle grain contacts in the sediment, and (4) in situ seismic velocities. Each of these parameters andtheir associated uncertainties can be constrained using routinely collected ocean drilling data. For example,we know in situ seismic velocities from sonic logs. We determine sediment mineralogy and elastic modulifrom detailed (meter to cm scale) stratigraphic and geochemical analysis of shipboard cores. We constrainporosity from either wireline density or porosity logs, or shipboard measurements. Finally, we determinethe number of grain contacts from either theoretical values or empirical studies [e.g., Smith et al., 1929;Mavko et al., 2009].
With constraints on each of these variables, we use the rock physics model to calculate in situ seismic veloc-ities at meter-scale resolution assuming hydrostatic conditions. If model-predicted velocities match wirelinevelocities to within our uncertainty, then we conclude that near-hydrostatic fluid pressure exists. If, how-ever, modeled velocities fail to match in situ conditions beyond our uncertainty, we adjust the pore pres-sure in the model to determine what value provides the best match between modeled and measured insitu seismic velocity.
Although the approach is generally straightforward, in practice, determining in situ pore pressure using therock physics model has a few important caveats. In particular, accurately determining whether elevatedpore pressure exists using the rock physics model requires a comprehensive assessment of uncertainty foreach of the four variables listed above. It is therefore important to assess the significance and sensitivity oftypical rock physics model uncertainties on predicted velocity results before we draw conclusions regardingin situ pore pressure.
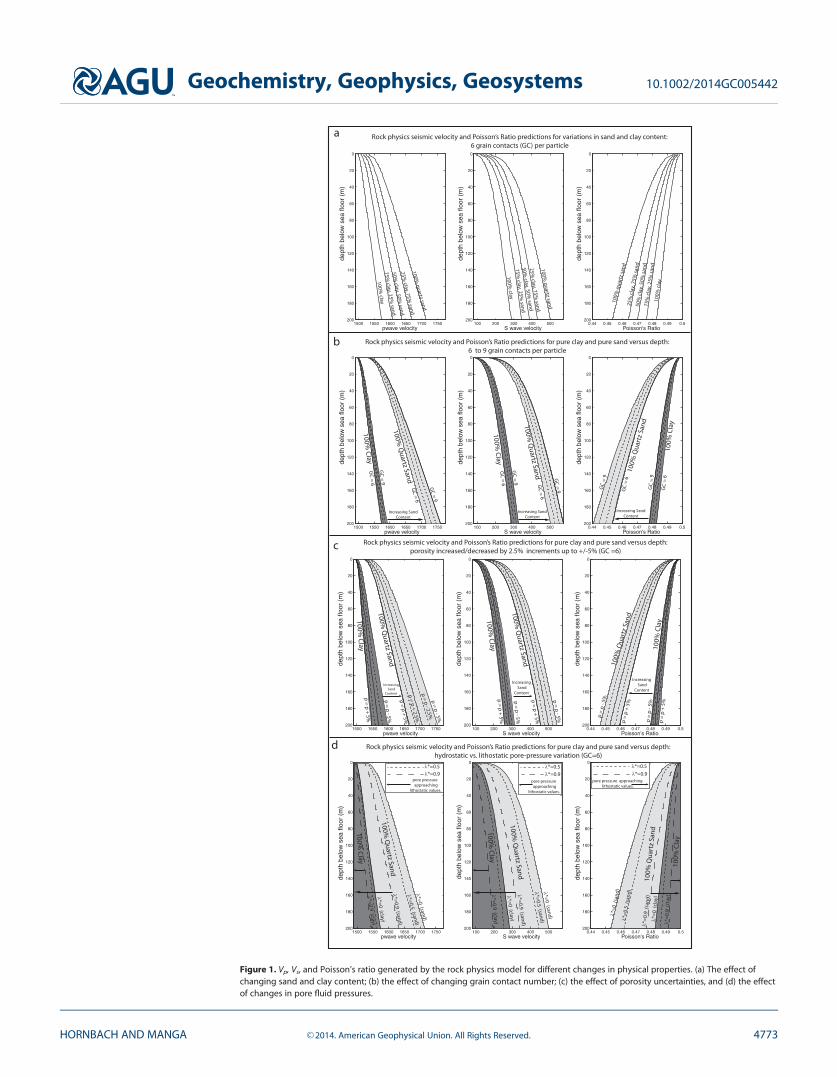
2.1. Testing the Sensitivity of the Rock Physics Pore Pressure ModelTo develop a better understanding of rock physics model sensitivities, we run the rock physics modelthrough a series of test cases that demonstrate how typical uncertainties in sediment physical propertiesaffect model results (Figure 1). For these tests, we assume (1) shipboard porosity measurements have anuncertainty ranging from 62.5% to 65%, consistent with previous ocean drilling porosity studies [e.g.,Shipboard Scientific Party, 2001; Hoffman and Tobin, 2004], (2) the average number of grain contacts variesbetween 6 and 9 with 6 the theoretical minimum limit and 9 typical of sand with �35% porosity [e.g.,Mavko et al., 2009; Liu and Nagel, 2010], (3) sediment mineralogy varies from 100% clay to 100% quartzsand, and (4) pore pressure varies from hydrostatic to lithostatic. We neglect the effects of temperature onsolid and fluid properties because temperature in marine sediments typically varies by less than a fewdegrees over the depth intervals of most ocean drill sites. We also neglect the effects of different sandmineralogy, such as basalt or andesite sands as opposed to pure quartz, as we find that these changesresult in second-order (<2%) velocity effects. Although not shown here, we also find that the effects ofcalcium carbonate, with higher bulk and shear moduli than clays, generally mimic the effects of sand. Forsimplicity, we therefore show only sand versus clay effects in the sensitivity study. For our analysis of porepressure, we define the pore fluid pressure ratio (k*) as the fluid overpressure divided by hydrostatic effec-tive stress:
k�5P�
r12Phð Þ (10)
where P* is the fluid pressure above hydrostatic, r1 is the maximum principal stress, and Ph is the hydro-static stress.
The analysis demonstrates the nonlinear effect of pore pressure on seismic velocity. Velocity changescaused by pore pressure ratios below 0.5 are very subtle, and typically below velocity uncertainties associ-ated with other rock physics model parameters. For example, resolving elevated pore pressures where k* isless than 0.5 requires uncertainty in sediment mineralogy below �20%, a porosity uncertain below 62.5%,and a grain contact number uncertainty below 3. Notice that these represent individual parameter uncer-tainties, however, these uncertainties can be additive such that even if grain contact number is constrainedto within 1, porosity uncertainty is at or below 62.5%, and sediment mineralogy is known to within 10%, itmay be difficult if not impossible to resolve pore pressure ratios below k* 5 0.5 without robust statisticalanalysis. We also note that significant uncertainty exists for grain contact number, particularly in mudstones,
Geochemistry, Geophysics, Geosystems 10.1002/2014GC005442
HORNBACH AND MANGA VC 2014. American Geophysical Union. All Rights Reserved. 4772
1500 1550 1600 1650 1700 1750
0
20
40
60
80
100
120
140
160
180
200
pwave velocity
dept
h be
low
sea
floo
r (m
)
100 200 300 400 500
0
20
40
60
80
100
120
140
160
180
200
S wave velocity
dept
h be
low
sea
floo
r (m
)
0.44 0.45 0.46 0.47 0.48 0.49 0.5
0
20
40
60
80
100
120
140
160
180
200
Poisson's Ratio
dept
h be
low
sea
floo
r (m
)
Rock physics seismic velocity and Poisson’s Ratio predictions for variations in sand and clay content:6 grain contacts (GC) per particle
100% clay
75% clay, 25%
sand50%
clay, 50% sand
100% quartz sand
25% clay, 75%
sand
100% clay
75% clay, 25%
sand50%
clay, 50% sand
100% quartz sand
25% clay, 75%
sand
100%
cla
y
75%
cla
y, 2
5% sa
nd
50%
cla
y, 5
0% sa
nd
100%
qua
rtz
sand
25%
cla
y, 7
5% sa
nd
1500 1550 1600 1650 1700 1750
0
20
40
60
80
100
120
140
160
180
200
pwave velocity
dept
h be
low
sea
floo
r (m
)
100 200 300 400 500
0
20
40
60
80
100
120
140
160
180
200
S wave velocity
dept
h be
low
sea
floo
r (m
)
0.44 0.45 0.46 0.47 0.48 0.49 0.5
0
20
40
60
80
100
120
140
160
180
200
Poisson's Ratio
dept
h be
low
sea
floo
r (m
)
100% Clay
Increasing SandContent
GC = 6
GC = 6
GC = 9
100% Q
uartz Sand
GC = 9
100% Clay
Increasing SandContent
GC = 6
GC = 6
GC = 9
100% Q
uartz Sand GC = 9
100%
Cla
y
Increasing SandContent
GC
= 6
GC
= 6
GC
= 9
100%
Qua
rtz
Sand
GC
= 9
Rock physics seismic velocity and Poisson’s Ratio predictions for pure clay and pure sand versus depth:6 to 9 grain contacts per particle
p = p + 5%
100% Q
uartz Sand
100% Clay
p = p - 5%
p = p + 5%
p = p - 5%
p = p + 5%
p = p - 5%
p = p - 5%
p = p + 5%
Increasing Sand
Content
100% Q
uartz Sand
100% Clay
Increasing Sand
Content
100%
Qua
rtz
Sand
100%
Cla
y
Increasing Sand
Content
p =
p +
5%
p =
p - 5
%
p =
p - 5
%
p =
p +
5%
Rock physics seismic velocity and Poisson’s Ratio predictions for pure clay and pure sand versus depth:porosity increased/decreased by 2.5% increments up to +/-5% (GC =6)
λ*=0 (sand)
λ*=0.5 (sand)
λ*=0.9 (sand)
λ*=0 (clay)100%
Quartz Sand
100% Clay
λ*=0 (sand)
λ*=0.5 (sand)
λ*=0.9 (sand)
100% Q
uartz Sand
λ*=0 (clay)
λ*=0.9 (clay)
100% Clay
Rock physics seismic velocity and Poisson’s Ratio predictions for pure clay and pure sand versus depth:hydrostatic vs. lithostatic pore-pressure variation (GC=6)
λ*=0
(sa
nd)
λ*=0
.5 (
sand
)
λ*=0
.9 (
sand
)λ*
=0 (
clay
)
λ*=0
.9 (
clay
)
100%
Qua
rtz
Sand
100%
Cla
y
pore pressure approaching
lithostatic values.
λ*=0.5λ*=0.9
pore pressure approaching lithostatic values.
p = p - 2.5%
p = p + 2.5%
a
b
c
d
pore pressure approaching
lithostatic values.
λ*=0.5λ*=0.9
λ*=0.5λ*=0.9
λ*=0.9 (clay)
Figure 1. Vp, Vs, and Poisson’s ratio generated by the rock physics model for different changes in physical properties. (a) The effect ofchanging sand and clay content; (b) the effect of changing grain contact number; (c) the effect of porosity uncertainties, and (d) the effectof changes in pore fluid pressures.
Geochemistry, Geophysics, Geosystems 10.1002/2014GC005442
HORNBACH AND MANGA VC 2014. American Geophysical Union. All Rights Reserved. 4773

where platy, nonspherical grain contacts likely exist. Further study is ultimately needed to assess relation-ships between grain contacts in mud-rich sediment. Nonetheless, our analysis using experimentally derivedvalues indicates that uncertainty in grain contact number plays a smaller role in pore pressure uncertaintycompared to sediment mineralogy and porosity effects (Figure 1). As pore pressure ratio values increaseabove 0.7, however, both P wave and S wave velocities decrease significantly in a nonlinear manner, andthe effects of pore pressure begin to dominate (Figure 1d). For the end-member case of near-lithostaticpore pressure, shear stress drops to zero; S wave velocity reduces to zero, and P wave velocities reduceapproximately to water velocity values (�1500 m/s). As pore pressure increases, the largest percent changereduction in velocity occurs with S wave velocities which are more sensitive to increased pore pressure thanP wave velocities (Figure 1). Where in situ S wave velocities are available, they should therefore be usedwith the rock physics model to estimate in situ pore pressure. In general, the rock physics analysis indicatesthat where sediment physical properties are well constrained (to within a few percent) or overpressures aresignificant (k*> 0.5), the rock physics model approach is able to quantify in situ pore pressure.
3. Estimating Pore Pressure Resolution Using the Rock Physics Model at ODP Sites
ODP Site 1173, located seaward of the subduction zone trench near the Nankai Trough, is routinely used asa reference for evaluating sediment physical properties and in situ pore fluid pressures [e.g., Screaton et al.,2002; Tobin and Saffer, 2009; Kitajima and Saffer, 2012]. High-quality in situ velocity logs, X-ray diffraction(XRD) analysis of sediment cores, and both shipboard and in situ porosity measurements provide physicalproperties measurements. Sediments at site 1173 consist of two primary units: the Upper Shikoku BasinUnit sediments located at depths shallower than �344 mbsf, and the Lower Shikoku Basin Unit sedimentslocated at depths between 344 and 688 mbsf [Shipboard Scientific Party, 2001]. We focus our analysis on theLower Shikoku Basin Unit, where multiple studies suggest there are no elevated fluid pressures. We can usethe fact that sediment physical properties and velocities are well constrained and near-hydrostatic fluidpressures exist in the Lower Shikoku Unit at Site 1173 to determine the typical uncertainty of rock physicsmodels for predicting elevated fluid pressure at the Site. Specifically, by accounting for physical propertiesuncertainties, we can estimate when elevated in situ pore fluid pressures are detectable at a typical scien-tific ocean drilling site using the rock physics approach.
3.1. Previous Pore Pressure Studies at Site 1173Sediments at Site 1173 are relatively homogenous and mud rich, especially in the Lower Shikoku Basin unit,and at least eight independent studies suggest hydrostatic or near-hydrostatic conditions exist in the lowerunit [Shipboard Scientific Party, 2001; Moore et al., 2001; Steurer and Underwood, 2003; Screaton et al., 2002;Underwood et al., 2005; Bangs and Gulick, 2005; Gamage and Screaton, 2006; Davis et al., 2006]. Screatonet al. [2002] suggest from analysis of porosity-depth profiles at site 1173 that near-hydrostatic conditionsexist in Lower Shikoku Basin sediments, and Gamage and Screaton [2006] later used 1-D loading and fluidflow models to explain why there are no significant overpressures at depths between 350 and 600 in theLower Shikoku Basin unit. Morgan and Ask [2004] and Spinelli et al. [2007] independently use consolidationtests to show little if any overpressure exists in the Lower Shikoku Basin unit. Similarly, Underwood et al.[2005] confirm with consolidation tests that the Lower Shikoku Basin unit is slightly overconsolidated. AnAdvanced CORK (ACORK) pressure measurement system, capable of monitoring pressures at multiple depthintervals at Site 1173 was installed to monitor pore pressure in Lower Shikoku Basin unit in 2001, and thesedata show no evidence for significant overpressures [Mikada et al., 2003; Moore et al., 2005; Davis et al.,2006]. Analysis of in situ pore pressure at site 1173 using seismic waveform inversion also suggests no ele-vated fluid pressures in the Lower Shikoku Basin [Bangs and Gulick, 2005].
In situ porosity and seismic velocity are well constrained at Site 1173 from wireline logs, with porosity sys-tematically decreasing and velocity systematically increasing with depth in the Lower Shikoku Basin unit.The average sedimentation rate prior to the Quaternary at site 1173 is less than 100 m/Myr, implying that,on average, no anomalously high sedimentation occurred during deposition of the Lower Shikoku Basinunit that might enhance pore pressure [Shipboard Scientific Party, 2001; Moore et al., 2001]. Thus, multiplelines of evidence support the conclusion that near-hydrostatic fluid pressures exist in the Lower ShikokuBasin unit at Site 1173 and that this sedimentary unit makes a good benchmark for hydrostatic pore pres-sure analysis [e.g., Tobin and Saffer, 2009; Kitajima and Saffer, 2012].
Geochemistry, Geophysics, Geosystems 10.1002/2014GC005442
HORNBACH AND MANGA VC 2014. American Geophysical Union. All Rights Reserved. 4774
In contrast with the Lower Shikoku Basin Unit, fluidpressures in the Upper Shikoku Basin Unit at Site1173 are poorly constrained, and it remains unclearif elevated fluid pressures exist in the upper unit.Quaternary sedimentation rates are almost an orderof magnitude higher (averaging 760 m/Myr) insome Upper Shikoku Basin compared with LowerShikoku Basin sediments [Moore et al., 2001], andanomalously high porosities (55–65%) exist
between 100 and 340 in the Upper Shikoku Basin, with seismic velocities slightly increasing through thisinterval [Moore et al., 2001; Shipboard Scientific Party, 2001]. Sand content is also generally higher in this unit[Moore et al., 2001; Steurer and Underwood, 2003]. No isolated ACORK pressure data exists in Upper ShikokuBasin sediments to provide direct in situ pressure measurements [Mikada et al., 2003]. Consolidation tests inthe Upper Shikoku Basin reveal complex consolidation trends that can be explained by opal cementation,changes in lithology, or elevated fluid pressure [e.g., Spinelli et al., 2007]. Although seismic inversion studiesby Bangs and Gulick [2005] suggest overpressures exist in some of the Upper Shikoku Basin Unit at Site1173 this conclusion is qualitative.
3.2. Applying the Rock Physics Model to Site 1173We apply the rock physics model to Site 1173 to determine if the model predicts velocities consistent withhydrostatic pressure in the Lower Shikoku Basin Unit. We use in situ wireline measurements of neutronporosity with depth to constrain porosity and assign an uncertainty of 2.24% (1 sigma), consistent with pre-vious estimates and other detailed porosity studies from recent scientific drilling results [e.g., Shipboard Sci-entific Party, 2001; Hoffman and Tobin, 2004]. We constrain relative mineral weight abundances for clay(incorporating smectite and illite ratios), calcite, and quartz at �5 m depth intervals via core descriptionsand X-ray diffraction analysis (XRD) at Site 1173 [Shipboard Scientific Party, 2001; Moore et al., 2001; Steurerand Underwood, 2003]. Based on repeat XRD measurements [Steurer and Underwood, 2003] and mineraluncertainties from core description at other drill sites [e.g., Expedition 340 Scientists, 2012], we assign a con-servative estimate for the mineral uncertainty of 610% (1 sigma). Finally, we allow mean grain contact num-ber at the critical porosity to vary between 6 and 9.5, consistent with other studies [e.g., Helgerud et al.,1999] and expected values based on measured porosities at Site 1173 [e.g., Nur et al., 1998; Mavko et al.,2009; Hoffman and Tobin, 2004]. We assume hydrostatic pressures, standard bulk modulus values for smec-tite, illite, sand, and calcite (Table 1), and run the model using normal distributions for porosity and mineral-ogy uncertainty and a uniform distribution for grain contact number uncertainty. The model also accountsfor smectite effects on porosity [e.g., Brown and Ransom, 1996]. We calculate 1000 velocity realizations withdepth to generate a 95% (2 sigma) confidence velocity versus depth profile assuming hydrostatic condi-tions via the rock physics model. Due to meter-scale spatial sampling of the XRD and calcium carbonatemeasurements and meter-scale uncertainties between core depth and logging depth, we conduct the rockphysics analysis at the lowest resolution sample interval (5 m) and smooth the rock physics model resultsover a 10 m interval (Figure 1). We then compare the calculated upper and lower (62 sigma) rock physicsmodel velocities (Vp and Vs) with measured in situ wireline Vp and Vs velocities at the site for both the Upperand Lower Shikoku Basin Units.
3.3. Results and Discussion for Site 1173Our analysis indicates that in situ velocities match model-predicted velocities to within the 95% confidencelevel at nearly all depths in the Lower Shikoku Unit at Site 1173 (Figure 2a). To demonstrate the sensitivityof the rock physics model to pore pressure at site 1173 and how velocity responds nonlinearly, we rerunthe rock physics model at Site 1173 using a series of different pore pressure values (Figures 2b and 2c). Thisanalysis demonstrates how a pore pressure ratio in excess of �0.6 is necessary in the Lower Shikoku Unitfor a majority of the measured in situ P wave velocities to fall outside the model-predicted P wave velocities.We can conclude from this analysis that pore fluid pressure ratios below 0.6 at this site would be difficult todetect at the 95% confidence level without additional analysis due to the impact of other uncertainties inthe rock physics model. For higher pore pressure ratio values, and in particular, for the more extreme casewhere k* 5 0.8, nearly all of the measured in situ Vp values in the Lower Shikoku Unit fall outside the pre-dicted rock physics model velocities. Additionally, our analysis indicates that when standard (1 sigma)
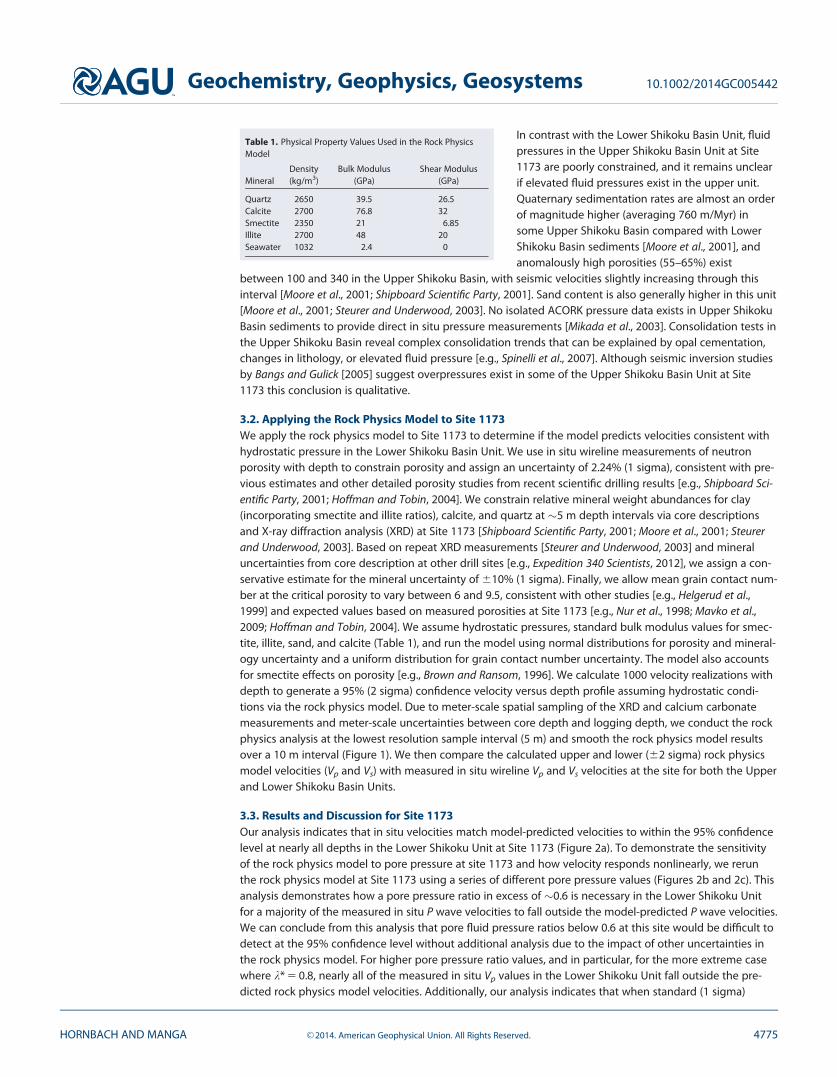
Table 1. Physical Property Values Used in the Rock PhysicsModel
MineralDensity(kg/m3)
Bulk Modulus(GPa)
Shear Modulus(GPa)
Quartz 2650 39.5 26.5Calcite 2700 76.8 32Smectite 2350 21 6.85Illite 2700 48 20Seawater 1032 2.4 0
Geochemistry, Geophysics, Geosystems 10.1002/2014GC005442
HORNBACH AND MANGA VC 2014. American Geophysical Union. All Rights Reserved. 4775

uncertainty is used, the approach detects k* values in excess of �0.4. This implies that the rock physicsapproach presented here, although it fails to resolve low or moderate fluid pressures, represents a useful,inexpensive, and efficient approach for detecting and bounding with high spatial resolution high pore fluidpressures at ocean drill sites.
In the Upper Shikoku Basin Unit, we observe a poor fit between model-predicted velocities and measuredin situ velocities. Specifically, model results systematically overpredict both Vp and Vs in the Upper ShikokuBasin unit, especially in the upper 300 mbsf, where nearly all measured Vs values fall outside 2-sigma uncer-tainty. Although changes in mineralogy due to diagenesis and cementation provide one possible explana-tion for this discrepancy [Spinelli et al., 2007], an alternative hypothesis is that rapid sedimentation andcementation in and above the Upper Shikoku Unit creates elevated pore fluid pressure. Both hypotheses
Lower Shikoku
Unit
Lower Shikoku
Unit
Lower Shikoku
Unit
Lower Shikoku
Unit
Upper Shikoku
Unit
Upper Shikoku
Unit
Upper Shikoku
Unit
Upper Shikoku
Unit
hydrostatic (λ *= 0) λ *= 0.6 λ *= 0.7 λ *= 0.8
1600 1800 2000
-650
-600
-550
-500
-450
-400
-350
-300
-250
-200
-150
dbsf
(m
)
P wave velocity (m/s)1600 1800 2000
P wave velocity (m/s)1600 1800 2000
P wave velocity (m/s)1600 1800 2000
P wave velocity (m/s)
Lower Shikoku
Unit
Lower Shikoku
Unit
Lower Shikoku
Unit
Lower Shikoku
Unit
Upper Shikoku
Unit
Upper Shikoku
Unit
Upper Shikoku
Unit
Upper Shikoku
Unit
200 400 600 800
-650
-600
-550
-500
-450
-400
-350
-300
-250
-200
-150
dbsf
(m
)
S wave velocity (m/s)
hydrostatic (λ *= 0)
400 600 800S wave velocity (m/s)
λ *= 0.6
400 600 800S wave velocity (m/s)
λ *= 0.7
400 600 800S wave velocity (m/s)
λ *= 0.8
a b c d
e f g h
Figure 2. Comparison of model-predicted (a–f) Vp and (e–h) Vs velocities at Site 1173 to measured wireline velocities (blue points) at Site 1173 for different pore pressure ratios. The areabetween the black lines indicates the 95% confidence level (2 sigma) of model-predicted velocities. The pore pressure ratio, labeled at the top of each subplot, increases nonuniformlyfrom 0 to 0.8 from Figures 2a–2h.
Geochemistry, Geophysics, Geosystems 10.1002/2014GC005442
HORNBACH AND MANGA VC 2014. American Geophysical Union. All Rights Reserved. 4776

might explain observations, and they are not mutually exclusive. It is well recognized that both rapid sedi-mentation and diagenesis can independently cause elevated fluid pressures [e.g., Dugan and Sheahan,2012]. It therefore is not necessarily surprising that the model predicts elevated fluid pressures in the UpperShikoku basin because sedimentation rates in the Upper Shikoku Unit are an order of magnitude higherthan the Lower Shikoku unit [Shipboard Scientific Party, 2001; Moore et al., 2001], and compaction followinghigh sedimentation and cementation both elevate fluid pressure by reducing pore space [e.g., Carstens andDypvik, 1981]. Our analysis indicates that k* � 0.7 or greater can explain the velocity discrepancy observedat depths shallower than 250 mbsf (Figures 2c and 2f). Permeability values of 1 3 10218 m2 or less are likelynecessary at Site 1173 to produce high fluid pressures in the Upper Shikoku Basin Unit [Gibson, 1958; Brede-hoeft and Hanshaw, 1968], values typical of unconsolidated marine clays that have 30–70% porosity, like weobserve for the Upper Shikoku Basin Unit [e.g., Neuzil, 1994]. Permeability values of this magnitude exist atSite 1173, however, to our knowledge, values on the order of 10218 m2 or less occur at depths greater than367 m, approximately 20 m below the Upper Shikoku Unit [Gamage and Screaton, 2003; Gamage and Screa-ton, 2006]. Although none have been measured, if at least one zone of low permeability (<10218) exists inthe Upper Shikoku Unit, it is possible that recent (Quaternary) rapid sedimentation elevated fluid pressuresin the Upper Shikoku Unit.
3.4. Applying the Rock Physics Model to Site 948To assess further the reliability of the rock physics model approach for predicting overpressures, we alsoapply this method to ODP Site 948, located on the Northern Barbados Ridge. ODP Site 948 was drilled toanalyze the relationship between fluid flow, tectonics, and pore pressure near the decollement associatedwith subduction of the North American Plate beneath the Caribbean Plate. Several studies using an array ofdifferent techniques independently suggest significant overpressure exist in subsurface sediments at ODPSite 948, making it an ideal location to test the reliability of the rock physics model for estimating high porepressure. Data collected at Site 948 used to assess in situ pressure include consolidation tests, packer tests,circulation obviation retrofit kit (CORK) experiments, and empirical methods using logging-while-drillingdata [Shipley et al., 1997]. Fisher and Zwart [1997] used packer tests from 481 to 538 mbsf at Site 948 to esti-mate fluid pressure. Based on analysis of their highest quality data, they suggest pore pressure ratios k* of0.45–0.95 exist in this depth interval. Moore et al. [1995] uses Logging-While-Drilling density data calibratedto consolidation tests to show the most significant fluid pressures (k* 5�0.9) exist from a depth of 400–520mbsl near this Site. A circulation obviation retrofit kit (CORK) was installed at hole 948D in 1994 to measurepressure changes over the entire drill hole (0–538 mbsf). Despite the CORK not being properly sealed,Foucher et al. [1997] show through analysis of fluid pressure equilibration during an 18 month period evi-dence of overpressures at the site, and they suggest overpressures are associated with the decollement,located at a depth of 480–523 mbsf. This result is consistent with other regional CORK studies that suggestelevated fluid pressures in the Barbados decollement zone [e.g., Becker et al., 1997]. Consolidation tests atSite 948 at a depth of 438 mbsf suggest sediments are underconsolidated and have a low permeability(10218210219 m2), consistent with the onset of overpressure development following burial [Vrolijk et al.,1998]. Finally, high-quality, high-resolution measurements of pore pressure at Site 948 using field-basedconsolidation curves derived from logging-while-drilling (LWD) bulk densities at the site suggest pore pres-sure ratio values of 0.70–0.92 exist from 530 to 570 mbsf at 948 [Saffer, 2003].
We calculate the in situ fluid pressure at Site 948 using the same rock physics technique described for Site1173. We again constrain sediment mineralogy from XRD and calcium carbonate data that exist for alldepths greater than 422 mbsf at this site. The model also corrects for smectite-illite concentration effects onporosity [Brown and Ransom, 1996]. Like Site 1173, we assume a 10% one-sigma Gaussian uncertainty inmineralogy, a one-sigma Gaussian uncertainty in porosity equal to 2.25%, and a uniform uncertainty distri-bution for grain contact number ranging from 6 to 9.5 for Site 948 and generate a 95% (2 sigma) confidencevelocity versus depth profile assuming hydrostatic conditions via the rock physics model. We only apply themodel at depths where XRD data exist at Site 948 (Figure 3). We compare our results to LWD Vp data col-lected at the site (no Vs data were acquired at Site 948).
Results from our analysis using the rock physics model demonstrate that the model systematically overpre-dicts in situ velocities for more than 65% of the section analyzed if we assume hydrostatic pressure (Figure3a). We can therefore state at the 95% confidence level that most of this section is overpressured. Assumingother uncertainties are properly accounted for already in the model, a better fit between modeled and
Geochemistry, Geophysics, Geosystems 10.1002/2014GC005442
HORNBACH AND MANGA VC 2014. American Geophysical Union. All Rights Reserved. 4777
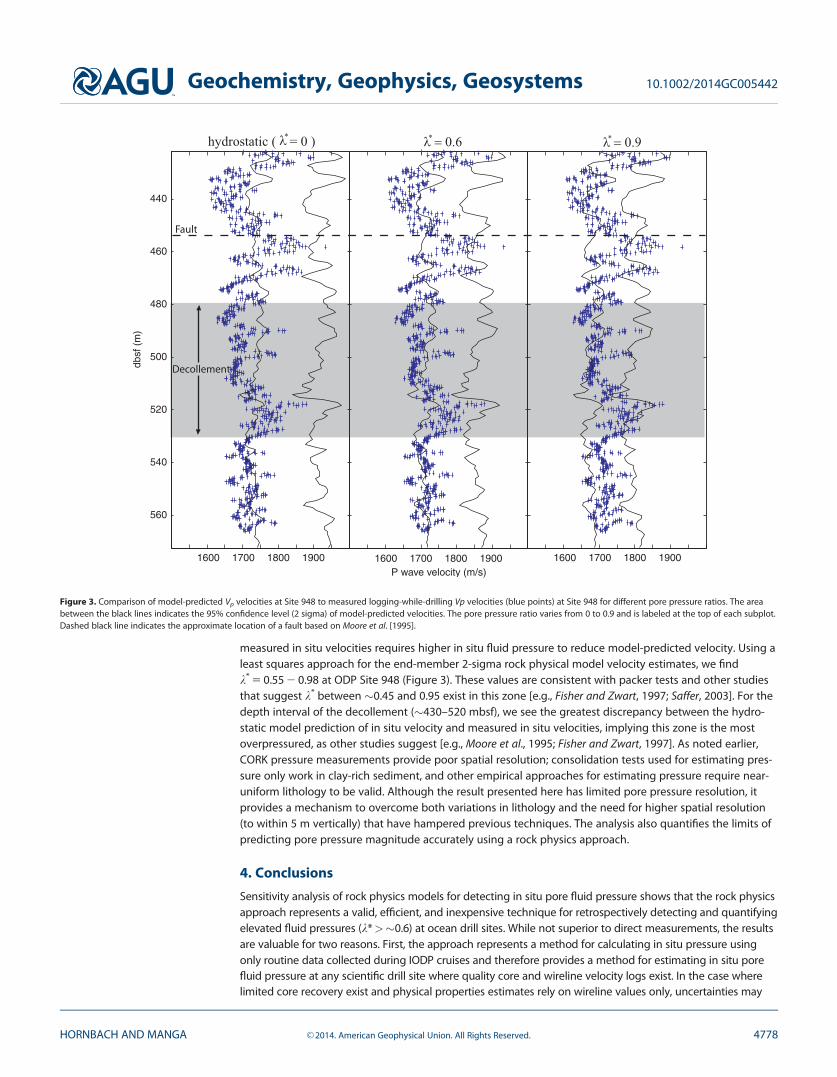
measured in situ velocities requires higher in situ fluid pressure to reduce model-predicted velocity. Using aleast squares approach for the end-member 2-sigma rock physical model velocity estimates, we findk* 5 0.55 2 0.98 at ODP Site 948 (Figure 3). These values are consistent with packer tests and other studiesthat suggest k* between �0.45 and 0.95 exist in this zone [e.g., Fisher and Zwart, 1997; Saffer, 2003]. For thedepth interval of the decollement (�430–520 mbsf), we see the greatest discrepancy between the hydro-static model prediction of in situ velocity and measured in situ velocities, implying this zone is the mostoverpressured, as other studies suggest [e.g., Moore et al., 1995; Fisher and Zwart, 1997]. As noted earlier,CORK pressure measurements provide poor spatial resolution; consolidation tests used for estimating pres-sure only work in clay-rich sediment, and other empirical approaches for estimating pressure require near-uniform lithology to be valid. Although the result presented here has limited pore pressure resolution, itprovides a mechanism to overcome both variations in lithology and the need for higher spatial resolution(to within 5 m vertically) that have hampered previous techniques. The analysis also quantifies the limits ofpredicting pore pressure magnitude accurately using a rock physics approach.
4. Conclusions
Sensitivity analysis of rock physics models for detecting in situ pore fluid pressure shows that the rock physicsapproach represents a valid, efficient, and inexpensive technique for retrospectively detecting and quantifyingelevated fluid pressures (k*>�0.6) at ocean drill sites. While not superior to direct measurements, the resultsare valuable for two reasons. First, the approach represents a method for calculating in situ pressure usingonly routine data collected during IODP cruises and therefore provides a method for estimating in situ porefluid pressure at any scientific drill site where quality core and wireline velocity logs exist. In the case wherelimited core recovery exist and physical properties estimates rely on wireline values only, uncertainties may
1600 1700 1800 1900
560
540
520
500
480
460
440
dbsf
(m
)
1600 1700 1800 1900P wave velocity (m/s)
1600 1700 1800 1900
Decollement
hydrostatic ( = 0 )λ∗λ = 0.6∗ λ = 0.9∗
Fault
Figure 3. Comparison of model-predicted Vp velocities at Site 948 to measured logging-while-drilling Vp velocities (blue points) at Site 948 for different pore pressure ratios. The areabetween the black lines indicates the 95% confidence level (2 sigma) of model-predicted velocities. The pore pressure ratio varies from 0 to 0.9 and is labeled at the top of each subplot.Dashed black line indicates the approximate location of a fault based on Moore et al. [1995].
Geochemistry, Geophysics, Geosystems 10.1002/2014GC005442
HORNBACH AND MANGA VC 2014. American Geophysical Union. All Rights Reserved. 4778
be higher by a few percent as indicated in previous comparisons between shipboard and in situ measure-ments [e.g., Hoffman and Tobin, 2004]. Second, the technique provides one of the few mechanisms for esti-mating pore fluid pressure with depth with meter to submeter spatial resolution (depending on XRD andwireline resolution) but with low magnitude resolution. The presented technique, although it represents argu-ably a more robust method for estimating in situ pore pressure compared to other empirical approachesbecause it fully integrates mineralogy, porosity, and rock physics uncertainties, demonstrates that only thehighest pore-pressure magnitudes (i.e., k* �> 0.6) are resolvable at 95% confidence levels given expecteduncertainties. This result therefore provides new insight into both the utility and limitation of rock physicsmodels for in situ pore pressure estimation. Here we chose a conservative approach with physical propertiesuncertainties; however, any reduction in porosity or sediment mineralogy uncertainty would further improvethe minimum detection threshold for elevated fluid pressure using this technique. The rock physics approachevaluated here therefore provides an alternative, inexpensive approach for estimating in situ pore fluid pres-sure with submeter-scale resolution that requires no additional tools, additional consolidation tests, or time ata drill site. With more than 430 in situ velocity measurements at scientific drill sites, and the number steadilygrowing, this technique represents a valuable way to detect and quantify zones of elevated fluid pressure atpotentially hundreds of drilled sites where complex mineralogy and no in situ measurements exist.
ReferencesBangs, N. L., and S. P. Gulick (2005), Physical Properties along the Developing D�ecollement in the Nankai Trough: Inferences from 3-D Seis-
mic Reflection Data Inversion and Leg 190 and 196 Drilling Data, in Proc. Ocean Drill. Program Sci. Results, 190/196, edited by H. Mikadaet al., pp. 1–18, Ocean Drill. Program, College Station, Tex.
Bangs, N. L., G. K. Westbrook, J. W. Ladd, and P. Buhl (1990), Seismic velocities from the Barbados Ridge complex: Indicators of high porefluid pressures in an accretionary Complex, J. Geophys. Res., 95(B6), 8767–8782.
Becker, K., A. T. Fisher, and E. E. Davis (1997), The CORK experiment in Hole 949C: Long-term observations of pressure and temperature inthe Barbados accretionary prism, in Proceedings of Ocean Drilling Program, Scientific Results, vol. 156, edited by T. H. Shipley et al., pp.247–252, Ocean Drill. Program, College Station, Tex., doi:10.2973/odp.proc.sr.156.031.1997.
Bowers, G. L. (1995), Pore pressure estimation from velocity data: Accounting for overpressure mechanisms besides undercompaction, SPEDrill. Completion, 10(2), 89–95.
Bredehoeft, J. D., and B. B. Hanshaw (1968), On the maintenance of anomalous fluid pressures: I. Thick sedimentary sequences, Geol. Soc.Am. Bull., 79(9), 1097–1106.
Brown, K. M., and B. Ransom (1996), Porosity corrections for smectite-rich sediments: Impact on studies of compaction, fluid generation,and tectonic history, Geology, 24(9), 843–846.
Burrus, J. (1998), Overpressure models for clastic rocks, their relation to hydrocarbon expulsion: A critical reevaluation, in Abnormal pres-sures in hydrocarbon environments: AAPG Memoir 70, vol. 70, edited by B. E. Law et al., pp. 35–64, The American Association of Petro-leum geologists, Tulsa, Okla.
Carstens, H., and H. Dypvik (1981), Abnormal formation pressure and shale porosity, AAPG Bull., 65(2), 344–350.Davis, E. E., K. Becker, T. Pettigrew, B. Carson, and R. MacDonald (1992), CORK: A hydrologic seal and downhole observatory for deep-ocean
boreholes, in Proceedings of the Ocean Drilling Program, Initial results, vol. 139, edited by E. E. Davis et al., pp. 43–53, Ocean Drill. Pro-gram, College Station, Tex.
Davis, E. E., K. Becker, K. Wang, K. Obara, Y. Ito, and M. Kinoshita (2006), A discrete episode of seismic and aseismic deformation of the Nan-kai trough subduction zone accretionary prism and incoming Philippine Sea plate, Earth Planet. Sci. Lett., 242(1), 73–84.
Dugan, B., and P. B. Flemings (2002), Fluid flow and stability of the US continental slope offshore New Jersey from the Pleistocene to thepresent, Geofluids, 2(2), 137–146.
Dugan, B., and T. C. Sheahan (2012), Offshore sediment overpressures of passive margins: Mechanisms, measurement, and models, Rev.Geophys., 50, RG3001, doi:10.1029/2011RG000379.
Dutta, N. C. (1997), Pressure prediction from seismic data: Implications for seal distribution and hydrocarbon exploration and exploitationin the deepwater Gulf of Mexico, Norw. Pet. Soc. Spec. Publ., 7, 87–199.
Dutta, N. C. (2002), Geopressure prediction using seismic data: Current status and the road ahead, Geophysics, 67(6), 2012–2041.Dvorkin, J., M. Prasad, A. Sakai, and D. Lavoie (1999a), Elasticity of marine sediments: Rock physics modeling, Geophys. Res. Lett., 26(12),
1781–1784.Dvorkin, J., G. Mavko, and A. Nur (1999b), Overpressure detection from compressional- and shear-wave data, Geophys. Res. Lett., 26(22),
3417–3420.Eaton, B. A. (1975), The equation for geopressure prediction from well logs, paper presented at Fall Meeting of the Society of Petroleum
Engineers of AIME, Soc. of Pet. Eng., Dallas, 28 September–1 October.Eberhart-Phillips, D., D. H. Han, and M. D. Zoback (1989), Empirical relationships among seismic velocity, effective pressure, porosity, and
clay content in sandstone, Geophysics, 54(1), 82–89.Expedition 340 Scientists (2012), Lesser Antilles volcanism and landslides: Implications for hazard assessment and long-term magmatic
evolution of the arc, Prelim. Rep. Integrated Ocean Drill. Program, 340, 19–30, doi:10.2204/iodp.pr.340.2012.Fisher, A. T., and G. Zwart (1997), Packer experiments along the decollement of the Barbados accretionary complex: Measurements of in situ
permeability, in Proceedings of the Ocean Drilling Program. Scientific Results, vol. 156, pp. 199–218, Ocean Drill. Program, College Station, Tex.Flemings, P. B., H. Long, B. Dugan, J. Germaine, C. M. John, J. H. Behrmann, and IODP Expedition 308 scientists (2008), Pore pressure pene-
trometers document high overpressure near the seafloor where multiple submarine landslides have occurred on the continental slope,offshore Louisiana, Gulf of Mexico, Earth Planet. Sci. Lett., 269(3), 309–325.
Foucher, J.-P., P. Henry, and F. Harmegnies (1997), Long-term observations of pressure and temperature in Hole 948D, Barbados accretion-ary prism, in Proceedings of the Ocean Drilling Program. Scientific Results, vol. 156, edited by T. H. Shipley et al., pp. 239–245, Ocean Drill.Program, College Station, Tex., doi:10.2973/odp.proc.sr.156.045.1997.
AcknowledgmentsDiscussions originating onboard IODPLeg 340 provided motivation for thiswork. Email discussions with J. Dvorkinprovided helpful insight. We thankA. Slagle and G. Guerin for helpfuldiscussions related to IODP dataavailability and data policies. We thankthree anonymous reviewers for theiruseful comments. All data used in thisstudy are publically available throughthe IODP core and log databasewebsites: http://iodp.tamu.edu/curation/samples.html and http://iodp.tamu.edu/curation/samples.html.
Geochemistry, Geophysics, Geosystems 10.1002/2014GC005442
HORNBACH AND MANGA VC 2014. American Geophysical Union. All Rights Reserved. 4779

Gamage, K., and E. Screaton (2003), Data report: Permeabilities of Nankai accretionary prism sediments, Proc. Ocean Drill. Program Sci.Results, 190/196, 1–22.
Gamage, K., and E. Screaton (2006), Characterization of excess pore pressures at the toe of the Nankai accretionary complex, Ocean DrillingProgram sites 1173, 1174, and 808: Results of one-dimensional modeling, J. Geophys. Res., 111, B04103, doi:10.1029/2004JB003572.
Gassmann, F. (1951), €Uber die elastizit€at por€oser medien. Viertel. Naturforsch. Ges. Z€urich, 96, 1–23.Gibson, R. E. (1958), The progress of consolidation in a clay layer increasing in thickness with time, Geotechnique, 8(4), 171–182.Hamilton, E. L., and R. T. Bachman (1982), Sound velocity and related properties of marine sediments, J. Acoust. Soc. Am., 72(6), 1891–1904.Hamilton, E. L., and H. W. Menard (1956), Density and porosity of sea-floor surface sediments off San Diego, California, AAPG Bull., 40(4),
754–761.Harrold, T. W., R. E. Swarbrick, and N. R. Goulty (1999), Pore pressure estimation from\mudrock porosities in Tertiary basins, southeast Asia,
AAPG Bull., 83(7), 1057–1067.Helgerud, M. B., J. Dvorkin, A. Nur, A. Sakai, and T. Collett (1999), Elastic-wave velocity in marine sediments with gas hydrates: Effective
medium modeling, Geophys. Res. Lett., 26(13), 2021–2024.Hoffman, N. W., and H. J. Tobin (2004), An empirical relationship between velocity and porosity for underthrust sediments in the Nankai
Trough accretionary prisms, in Proc. Ocean Drill. Program Sci. Results, 190/196, edited by H. Mikada et al, pp. 1–23, Ocean Drill. Program,College Station, Tex.
Hottmann, C. E., and R. K. Johnson (1965), Estimation of formation pressures from log-derived shale properties, J. Pet. Technol., 17(6), 717–722.Iverson, R. M. (1997), The physics of debris flows, Rev. Geophys., 35(3), 245–296.Kitajima, H., and D. M. Saffer (2012), Elevated pore pressure and anomalously low stress in regions of low frequency earthquakes along the
Nankai Trough subduction megathrust, Geophys. Res. Lett., 39, L23301, doi:10.1029/2012GL053793.Liu, A. J., and S. R. Nagel (2010), The jamming transition and the marginally jammed solid, Annu. Rev. Condens. Matter Phys., 1(1), 347–369.Makse, H. A., N. Gland, D. L. Johnson, and L. Schwartz (2004), Granular packings: Nonlinear elasticity, sound propagation, and collective
relaxation dynamics, Phys. Rev. E, 70(6), 061302.Mallick, S. (1995), Model-based inversion of amplitude-variations-with-offset data using a genetic algorithm, Geophysics, 60(4), 939–954.Mavko, G., T. Mukerji, and J. Dvorkin (2009), The Rock Physics Handbook: Tools for Seismic Analysis of Porous Media, Cambridge Univ.
Press. N. Y.Mikada, H., et al. (2003), Hydrogeological and Geothermal studies around Naikai Trough (KR02–10 Nankai Trough Cruise Report), JAMSTEC
J. Deep Sea Res., 22, 125–171.Mindlin, R. D. (1949), Compliance of elastic bodies in contact, J. Appl. Mech., 16, 259–268.Moore, G. F., et al. (2001), New insights into deformation and fluid flow processes in the Nankai Trough accretionary prism: Results of
Ocean Drilling Program Leg 190, Geochem. Geophys. Geosyst., 2(10), 1058, doi:10.1029/2001GC000166.Moore, G. F., H. Mikada, J. C. Moore, K. Becker, and A. Taira (2005), Legs 190 and 196 synthesis: Deformation and fluid flow processes in the
Nankai Trough accretionary prism, Proc. Ocean Drill. Program Sci. Results, 190, 196, 1–25.Moore, J. C., and H. Tobin (1997), Estimated fluid pressures of the Barbados accretionary prism and adjacent sediments, in Proceedings of
the Ocean Drilling Program. Scientific Results, vol. 156, pp. 229–238, Ocean Drill. Program, College Station, Tex.Moore, J. C., et al. (1995), Abnormal fluid pressures and fault-zone dilation in the Barbados accretionary prism: Evidence from logging while
drilling, Geology, 23(7), 605–608.Morgan, J. K., and M. V. Ask (2004), Consolidation state and strength of underthrust sediments and evolution of the decollement at the
Nankai accretionary margin: Results of uniaxial reconsolidation experiments, J. Geophys. Res., 109, B03102, doi:10.1029/2002JB002335.Neuzil, C. E. (1994), How permeable are clays and shales?, Water Resour. Res., 30(2), 145–150.Nur, A., G. Mavko, J. Dvorkin, and D. Galmudi (1998), Critical porosity: A key to relating physical properties to porosity in rocks, Leading
Edge, 17(3), 357–362.Saffer, D. M. (2003), Pore pressure development and progressive dewatering in underthrust sediments at the Costa Rican subduction mar-
gin: Comparison with northern Barbados and Nankai, J. Geophys. Res., 108(B5), 2261, doi:10.1029/2002JB001787.Screaton, E., D. Saffer, P. Henry and S. Hunze (2002), Porosity loss within the underthrust sediments of the Nankai accretionary complex:
Implications for overpressures, Geology, 30(1), 19–22.Screaton, E. J., A. T. Fisher, B. Carson, and K. Becker (1997), Barbados Ridge hydrogeologic tests: Implications for fluid migration along an
active decollement, Geology, 25(3), 239–242.Shipboard Scientific Party (2001), Leg 190 summary, in Proceedings of Ocean Drilling Program Initial Reports, vol. 190, pp. 1–87, Ocean Drill.
Program, College Station, Tex.Shipley, T. H., Y. Ogawa, P. Blum, and J. M. Bahr (Eds.) (1997), Proceedings of Ocean Drilling Program, Scientific Results, vol. 156, Ocean Drill.
Program, College Station, Tex., doi:10.2973/odp.proc.sr.156.1997.Smith, W. O., P. D. Foote, and P. F. Busang (1929), Packing of homogeneous spheres, Phys. Rev., 34(9), 1271.Spinelli, G. A., P. S. Mozley, H. J. Tobin, M. B. Underwood, N. W. Hoffman, and G. W. Bellew (2007), Diagenesis, sediment strength, and pore
collapse in sediment approaching the Nankai Trough subduction zone, Geol. Soc. Am. Bull., 119(3-4), 377–390.Stegmann, S., H. Villinger, and A. Kopf (2006), Design of a modular, marine free-fall cone penetrometer, Sea Technol., 47(2), 27–33.Stegmann, S., M. Strasser, F. Anselmetti, and A. Kopf (2007), Geotechnical in situ characterization of subaquatic slopes: The role of pore
pressure transients versus frictional strength in landslide initiation, Geophys. Res. Lett., 34, L07607, doi:10.1029/2006GL029122.Steurer, J. F., and M. B. Underwood (2003), Clay mineralogy of mudstones from the Nankai Trough reference Sites 1173 and 1177 and fron-
tal accretionary prism Site 1174, Proc. Ocean Drill. Program Sci. Results, 190/196, 1–37.Tobin, H. J., and D. M. Saffer (2009), Elevated fluid pressure and extreme mechanical weakness of a plate boundary thrust, Nankai Trough
subduction zone, Geology, 37(8), 679–682.Tsuji, T., H. Tokuyama, P. C. Pisani, and G. Moore (2008), Effective stress and pore pressure in the Nankai accretionary prism off the Muroto
Peninsula, southwestern Japan, J. Geophys. Res., 113, B11401, doi:10.1029/2007JB005002.Underwood, M. B., D. M. Saffer and A. W. McKiernan (2005), Three dimensional variations in fluid pressure and fluid production within Nan-
kai Trough subduction zone, Eos Trans. AGU, 86(52), Fall Meet. Suppl., Abstract OS24A-02.Vanorio, T., M. Prasad, and A. Nur (2003), Elastic properties of dry clay mineral aggregates, suspensions and sandstones, Geophys. J. Int.,
155(1), 319–326.Vrolijk, P., T. Miller, and M. J. Gooch (1998), Hydrostatic consolidation tests of undeformed, clay-rich samples from the Barbados accretion-
ary prism, Leg 156, Proc. Ocean Drill. Program Initial Rep., 171A, 107–116.Wang, C. Y., and M. Manga (2010), Hydrologic responses to earthquakes and a general metric, Geofluids, 10(1-2), 206–216.Wyllie, M. R. J., A. R. Gregory, and L. W. Gardner (1956), Elastic wave velocities in heterogeneous and porous media, Geophysics, 21(1), 41–70.
Geochemistry, Geophysics, Geosystems 10.1002/2014GC005442
HORNBACH AND MANGA VC 2014. American Geophysical Union. All Rights Reserved. 4780