the action plan for threatened australian macropods
TRANSCRIPT

The Action Plan for Threatened Australian Macropods2011-2021

Action Plan for Threatened Macropods 2011-2021
Written and edited by Michael Roache.
The author is grateful to the following individuals for their help and contributions during the preparation of this action plan:
Liana Joseph for her extensive consultation on the project regarding prioritisation of threatened species recovery, and her input to some sections of the text. Katherine Miller of KSR Consulting who contributed substantially to the section on current issues in macropod conservation. Simone Albert who assisted with the compilation of recovery outlines. Lis McLellan, Tony Trujillo and Mina Bassarova for extensive review and comments on the draft manuscript. Finally, many experts provided comments on the manuscript and on the recovery outlines:
Andrew Burbidge, Paul de Tores (Department of Environment and Conservation, WA), Michael Driessen (Department of Primary Industries, Parks, Water and Environment, Tasmania), Tony Friend (Department of Environment and Conservation, WA), Matt Hayward (Australian Wildlife Conservancy), John Kanowski (Australian Wildlife Conservancy), Janelle Lowry (Department of Environment and Resource Management, QLD), Nicky Marlow, (Department of Environment and Conservation, WA), (Department of Environment and Resource Management, QLD), Manda Page (Australian Wildlife Conservancy), Barry Nolan (Department of Environment and Resource Management, QLD), David Pearson (Department of Environment and Conservation, WA), Jeff Short (Wildlife Research and Management Pty Ltd), Neil Thomas (Department of Environment and Conservation, WA), Threatened Species Section (Department of Environment and Resource Management, QLD), Adrian Wayne (Department of Environment and Conservation, WA). Distribution maps were prepared using Landsat 7 imagery (Geoscience Australia 2000).
Published in August 2011 by WWF-Australia - World Wide Fund for Nature (formerly World Wildlife Fund)
Any reproduction in full or in part of this publication must mention the title and credit the above-mentioned publisher as the copyright owner.
No photographs from this publication may be reproduced on the internet without prior authorization from WWF.
© text 2011 WWF All rights reserved
For further information on the WWF Threatened Macropod Program please see our website:
http://www.wwf.org.au Or contact: Macropod Program WWF-Australia GPO Box 528 Sydney NSW 2001 Australia
Cover image: Brush-tailed rock wallaby (Petrogale penicillata). © Ben Bishop/WWF-Australia
Designed by Three Blocks Left
For information on all of WWF’s flagship species conservation work, including threatened macropods, see:
http://www.panda.org/species

3
Action Plan for Threatened Macropods 2011-2021
ConTenTs 1. exeCuTive suMMAry 11Introduction 11
Current Issues in Macropod Conservation 11
Status of Macropods 12
Action Plan Framework 12
Methods 12
Results 13
Conclusions 13
2. inTroduCTion 14Lack of Resources 16
The Need for More Explicit Recovery Planning 16
3. CurrenT issues in ThreATened MACroPod ConservATion 18State of Macropods 18
Socio-Economic Context 18
Human Impacts 18
Conservation Funding 18
How Does Environment Rate as a Priority for Australians? 19
Perceptions of Macropods 19
Regulatory Context 20
Landscape-Scale Issues for Macropods 20
Land Clearing, Fragmentation and Degradation 20
Feral Animals 20
Predator and Competitor Control Strategies 22
Changed fire regimes 23
Climate change 23
Protected Areas 24
Species-Level Issues For Macropods 26
Genetics 26
Translocations and Reintroductions 26
Captive Breeding 26
Monitoring 26
4. ACTion PlAn FrAMework 28Action Plan Scope 28
Action Plan Vision 30
Action Plan Goal 30
Action Plan Objectives 30
4
Action Plan for Threatened Macropods 2011-2021
5. MeThods 31Step 1: Define The Goal 32
Step 2: List Biodiversity Assets 32
Step 3: List Management Projects 32
Step 4: Provide Rationale for the Proposed Activities 33
Step 5: Estimate Cost 33
6. resulTs 36
7. disCussion 43
8. ConClusion And reCoMMendATions 46Future Recommendations 47
Regular review 47
Confidence levels 47
More detailed expert input 47
9. reFerenCes 48
10. APPendiCes 50Appendix 1: Acronyms 50
Appendix 2: List of Macropods 52
Appendix 3: Conservation Actions 54
Appendix 4: Yearly Costs 56
Appendix 5: Recovery Outlines 57
Recovery Outline – Bettongia gaimardi 57
Recovery Outline – Bettongia lesueur 61
Recovery Outline – Bettongia penicillata 72
Recovery Outline – Bettongia tropica 83
Recovery Outline – Dendrolagus bennettianus 93
Recovery Outline – Lagorchestes hirsutus 97
Recovery Outline – Lagostrophus fasciatus 106
Recovery Outline – Macropus bernardus 115
Recovery Outline – Macropus parma 119
Recovery Outline – Onychogalea fraenata 123
Recovery Outline – Petrogale burbidgei 130
Recovery Outline – Petrogale coenensis 135
Recovery Outline – Petrogale concinna 139
Recovery Outline – Petrogale lateralis 144
Recovery Outline – Petrogale penicillata 154
Recovery Outline – Petrogale persephone 164
Recovery Outline – Petrogale sharmani 174
Recovery Outline – Petrogale xanthopus 178
Recovery Outline – Potorous gilbertii 187
Recovery Outline – Potorous longipes 193
Recovery Outline – Setonix brachyurus 202

5
Action Plan for Threatened Macropods 2011-2021
lisT oF TAblesTable 1: List of changes in IUCN threat status for Australian macropods between 1996 and 2008. 15
Table 2: Australian macropods listed as threatened, near threatened or data deficient according to the IUCN Red List of Threatened Species (IUCN, 2010).
29
Table 3: Summary of the steps undertaken in collecting information for this action plan. 32
Table 4: Projects with dedicated recovery coordinator salary built in to project cost. 34
Table 5: List of threatened macropod recovery projects in order of their affordability. 37
Table 6: Average cost of down-listing by IUCN threat rating. 37
Table 7: Number of species projects that could be funded under nominal recovery budgets to achieve down-listing on the IUCN Red List within 10 years if projects are prioritised based on cost.
39
Table 8: Cost of all 21 macropod projects by category of management activity (Conservation Measures Partnership 2011). For explanations of the categories, see Appendix 3.
41
Table 9: Most costly category of management action by IUCN threat category, and the combined costs of those actions.
41
Table 10: Most costly category of management action for each species, showing percentage of total project cost, and the relevant actions contributing to those costs.
42
Table 11: List of recovery actions for Bettongia gaimardi, and the rationale for their contribution to recovery, and effort required.
59
Table 12: List of recovery actions for Bettongia gaimardi, and their costs. 60
Table 13: List of recovery actions for Bettongia lesueur, and the rationale for their contribution to recovery, and effort required.
64
Table 14: List of recovery actions for Bettongia lesueur, and their costs. 68
Table 15: List of recovery actions for Bettongia penicillata, and the rationale for their contribution to recovery, and effort required.
75
Table 16: List of recovery actions for Bettongia penicillata, and their costs. 79
Table 17: List of recovery actions for Bettongia tropica, and the rationale for their contribution to recovery, and effort required.
86
Table 18: List of recovery actions for Bettongia tropica, and their costs. 90
Table 19: List of recovery actions for Dendrolagus bennettianus, and the rationale for their contribution to recovery, and effort required.
95
Table 20: List of recovery actions for Dendrolagus bennettianus, and their costs. 96
Table 21: List of recovery actions for Lagorchestes hirsutus, and the rationale for their contribution to recovery, and effort required.
100
Table 22: List of recovery actions for Lagorchestes hirsutus, and their costs. 103
Table 23: List of recovery actions for Lagostrophus fasciatus, and the rationale for their contribution to recovery, and effort required.
109
Table 24: List of recovery actions Lagostrophus fasciatus, and their costs. 112
6
Action Plan for Threatened Macropods 2011-2021
Table 25: List of recovery actions for Macropus bernardus, and the rationale for their contribution to recovery, and effort required.
117
Table 26: List of recovery actions Macropus bernardus, and their costs. 118
Table 27: List of recovery actions for Macropus parma, and the rationale for their contribution to recovery, and effort required.
121
Table 28: List of recovery actions for Macropus parma, and their costs. 122
Table 29: List of recovery actions for Onychogalea fraenata, and the rationale for their contribution to recovery, and effort required.
126
Table 30: List of recovery actions for Onychogalea fraenata, and their costs. 128
Table 31: List of recovery actions for Petrogale burbidgei, and the rationale for their contribution to recovery, and effort required.
132
Table 32: List of recovery actions for Petrogale burbidgei, and their costs. 134
Table 33: List of recovery actions for Petrogale coenensis, and the rationale for their contribution to recovery, and effort required.
137
Table 34: List of recovery actions for Petrogale coenensis, and their costs. 138
Table 35: List of recovery actions Petrogale concinna, and the rationale for their contribution to recovery, and effort required.
141
Table 36: List of recovery actions for Petrogale concinna, and their costs. 143
Table 37: List of recovery actions Petrogale lateralis, and the rationale for their contribution to recovery, and effort required.
147
Table 38: List of recovery actions for Petrogale lateralis, and their costs. 151
Table 39: List of recovery actions for Petrogale penicillata, and the rationale for their contribution to recovery, and effort required.
158
Table 40: List of recovery actions for Petrogale penicillata, and their costs. 161
Table 41: List of recovery actions for Petrogale persephone, and the rationale for their contribution to recovery, effort required, and probability of success
167
Table 42: List of recovery actions for Petrogale persephone, and their costs. 171
Table 43: List of recovery actions for Petrogale sharmani, and the rationale for their contribution to recovery, and effort required.
176
Table 44: List of recovery actions for Petrogale sharmani, and their costs. 177
Table 45: List of recovery actions for Petrogale xanthopus, and the rationale for their contribution to recovery, and effort required.
181
Table 46: List of recovery actions for Petrogale xanthopus, and their costs. 184
Table 47: List of recovery actions for Potorous gilbertii, and the rationale for their contribution to recovery, and effort required.
189
Table 48: List of recovery actions for Potorous gilbertii, and their costs. 191
Table 49: List of recovery actions for Potorous longipes, and the rationale for their contribution to recovery, and effort required.
196
Table 50: List of recovery actions for Potorous longipes, and their costs. 199
Table 51: List of recovery actions for Setonix brachyurus, and the rationale for their contribution to recovery, and effort required.
205
Table 52: List of recovery actions for Setonix brachyurus, and their costs. 209
7
Action Plan for Threatened Macropods 2011-2021
lisT oF FiguresFigure 1: Number of macropod recovery projects undertaken by spending budgets up to
$300 million over 10 years.39
Figure 2: Ranked cost of macropod recovery projects. Colours indicate current threat status (IUCN 2010).
40
Figure 3: Known distribution of Bettongia gaimardi from the 2008 Global Mammal Assessment. 57
Figure 4: Known distribution of Bettongia lesueur from the 2008 Global Mammal Assessment. 61
Figure 5: Known distribution of Bettongia penicillata from the 2008 Global Mammal Assessment. 72
Figure 6: Known distribution of Bettongia tropica from the 2008 Global Mammal Assessment. 83
Figure 7: Known distribution of Dendrolagus bennettianus from the 2008 Global Mammal Assessment.
93
Figure 8: Known distribution of Lagorchestes hirsutus from the 2008 Global Mammal Assessment. 93
Figure 9: Known distribution of Lagostrophus fasciatus from the 2008 Global Mammal Assessment.
106
Figure 10: Known distribution of Macropus bernardus from the 2008 Global Mammal Assessment. 115
Figure 11: Known distribution of Macropus parma from the 2008 Global Mammal Assessment. 119
Figure 12: Known distribution of Onychogalea fraenata from the 2008 Global Mammal Assessment. 123
Figure 13: Known distribution of Petrogale burbidgei from the 2008 Global Mammal Assessment. 130
Figure 14: Known distribution of Petrogale coenensis from the 2008 Global Mammal Assessment. 135
Figure 15: Known distribution of Petrogale concinna from the 2008 Global Mammal Assessment. 139
Figure 16: Known distribution of Petrogale lateralis from the 2008 Global Mammal Assessment. 145
Figure 17: Known distribution of Petrogale penicillata from the 2008 Global Mammal Assessment. 154
Figure 18: Known distribution of Petrogale persephone from the 2008 Global Mammal Assessment. 164
Figure 19: Known distribution of Petrogale sharmani from the 2008 Global Mammal Assessment. 174
Figure 20: Known distribution of Petrogale xanthopus from the 2008 Global Mammal Assessment. 178
Figure 21: Known distribution of Potorous gilbertii from the 2008 Global Mammal Assessment. 187
Figure 22: Known distribution of Potorous longipes from the 2008 Global Mammal Assessment. 193
Figure 23: Known distribution of Setonix brachyurus from the 2008 Global Mammal Assessment. 202

vel illuM dolore eu FeugiAT quiDolore magna aliquam erat voluptat.Ut wisi enin ad minim. Quis nostrud ad nostris pro amat. Sed aliquo ut nisi alter ego qid propter
anno et cetera. Ullam venit cum permissio, alter ego cum frater et patris et mater inter familias.
Vel illum dolore eu feugiat nulla facilitis ad vero eros et accususam et lustro odio dignissim qui blandit praeset lupatum auge duis aplore. Mimimum veniami ex ea con dolor nisi ut aliquip. Consequat Duis autem vel eum iruire dolor in endrerit, voluptate velit est. Sit amet, consectetuer adipiscing elit, sed diam nonummi.t, voluptate velit est. Sit amet, consectetuer adipiscing elit, sed diam nonummi.
Dolore magna aliquam erat voluptat.Ut wisi enin ad minim. Quis nostrud ad nostris pro amat. Sed aliquo ut nisi alter ego qid propter anno et cetera. Ullam venit cum permissio, alter ego cum frater et
Patris et mater inter familias.
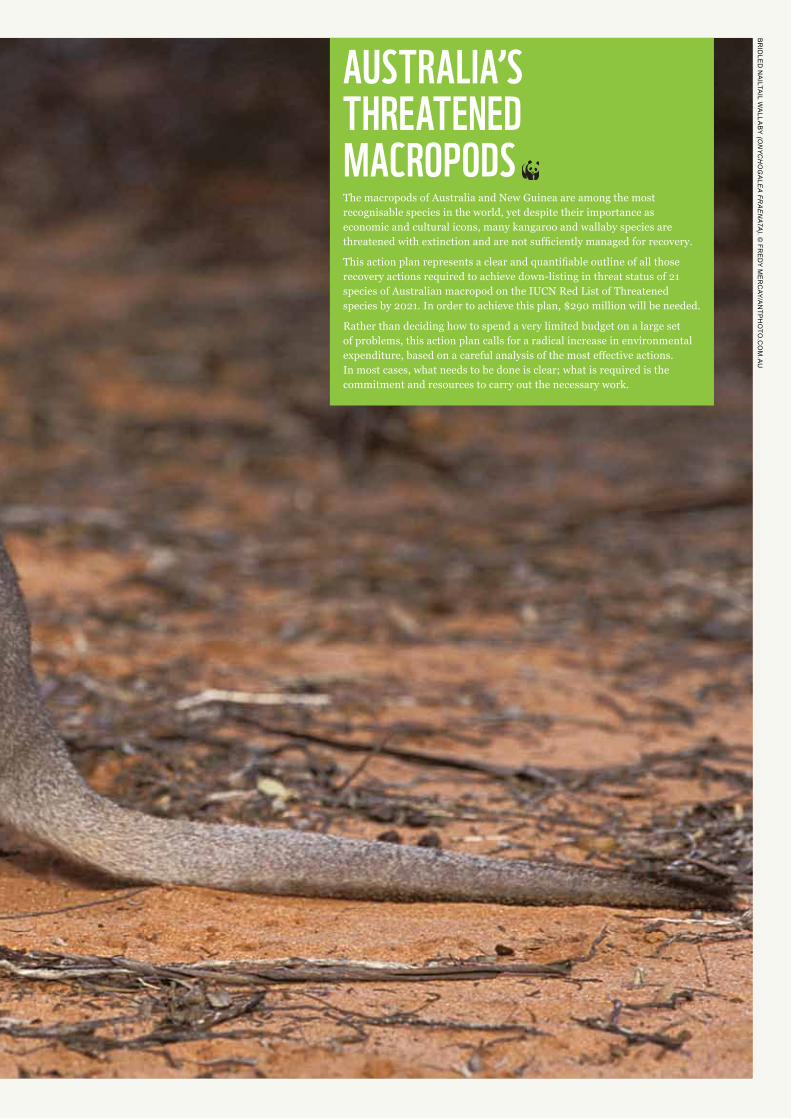
AusTrAliA’s ThreATened MACroPodsThe macropods of Australia and New Guinea are among the most recognisable species in the world, yet despite their importance as economic and cultural icons, many kangaroo and wallaby species are threatened with extinction and are not sufficiently managed for recovery.
This action plan represents a clear and quantifiable outline of all those recovery actions required to achieve down-listing in threat status of 21 species of Australian macropod on the IUCN Red List of Threatened species by 2021. In order to achieve this plan, $290 million will be needed.
Rather than deciding how to spend a very limited budget on a large set of problems, this action plan calls for a radical increase in environmental expenditure, based on a careful analysis of the most effective actions. In most cases, what needs to be done is clear; what is required is the commitment and resources to carry out the necessary work.
Br
idle
d n
ailta
il wa
llaB
y (O
ny
ch
Og
ale
a fr
ae
nata
). © Fr
ed
y M
er
cay/a
ntP
ho
to.c
oM
.au

© X
XX
XX
XX
XX
XX
XX
Xn
or
the
rn
Be
tto
ng
(Be
ttO
ng
ia t
rO
pic
a).
© B
ru
ce
th
oM
so
n/ a
ntP
ho
to.c
oM
.au

11
Introduction
The macropods1 of Australia and New Guinea are among the most recognisable species in the world and they have substantial cultural and economic significance. The kangaroo is an important symbol in Australia and for the peoples of New Guinea, and contributes to national and cultural identities. Their appeal to domestic and international tourists contributes towards the generation of considerable revenue through nature-based tourism. Yet despite their importance as economic and cultural
icons, many kangaroo and wallaby species are threatened with extinction and are not sufficiently managed for recovery.
It is clear that globally, the financial and human resources available for conservation are inadequate for the task of protecting all species. Currently, only a small fraction of the species that are officially recognised as threatened with extinction are managed for recovery, both worldwide and in Australia. Furthermore, investment in species recovery, without reference to long-term recovery objectives that are quantifiable and time-bound, and directly linked to down-listing in threat status, will likely fail.
This action plan represents a clear and quantifiable outline of all those recovery actions required to achieve down-listing in threat status of 21 species of macropod on the IUCN Red List of Threatened species by 2021.
In order to achieve this plan, $290 million will be needed, perhaps one order of magnitude more than currently invested in threatened macropod recovery in Australia. This will require a significantly higher level of political commitment than at present.
This plan represents a bare minimum for short-term security of each species of Australian macropod listed as threatened or near threatened. If actions to secure species in the next few years are not funded now, it may subsequently become more difficult if not impossible to secure these species over the long term.
For greatest efficiency in the allocation of resources to species conservation, those responsible for recovery need to make explicit decisions about their objectives. Recovery decisions are often made not with a strategy for achieving long-term objectives, but rather for satisfying short-term needs or solving immediate problems. Moreover, the allocation of ultimately limited resources should also be undertaken in a considered and objective way across all species, not piecemeal across various levels of management as is the case for most recovery processes.
Current Issues in Macropod Conservation
This action plan highlights the extraordinarily high proportion of Australian macropods that are threatened with extinction. The main causes of extinction and decline in macropods have been identified and include the introduction to Australia of predators such as the red fox and feral cat and of herbivores such as the rabbit, sheep and cattle, habitat destruction through land clearing, and changed fire regimes. Social and economic factors also present significant barriers to threatened species recovery in Australia.
1. exeCuTive suMMAry
1 The term ‘macropod’ is used in this document to refer to all members of the super-family Macropodoidea – comprising the three families Potoroidae (potoroos and bettongs), Hypsiprymnodontidae (the musky rat-kangaroo) and Macropodidae (wallabies, kangaroos and tree-kangaroos).

12
Action Plan for Threatened Macropods 2011-2021
Status of Macropods
Seven species of Australian macropods have become extinct since European settlement (Burbidge et al. 2009). Of the 50 species remaining, this action plan lists two species as critically endangered (CR), five as endangered (EN), two as vulnerable (VU), one as data deficient (DD), and eleven as near threatened (NT), as per the IUCN Red List of Threatened Species (IUCN 2010). The remaining 29 Australian macropod species are listed as least concern (LC), and have not been considered in this document.
The proportion of macropod species listed as threatened (CR + EN + VU) out of the total number of extant Australian species (50) is 18%. When near threatened and data deficient species (NT + DD) are included, this proportion rises to 42%.
There have been two significant improvements in the status of macropod species since the last action plan for marsupials and monotremes was completed in 1996. Unfortunately, there have been two significant declines in status since 1996. For example, the woylie, which was hailed as a conservation success in 1996 having been down-listed from endangered to low risk/conservation dependent, has since suffered severe population declines for reasons that are still poorly known and is now listed as critically endangered. Seven of the species listed as threatened in 1996 have experienced no improvement in status, while another species considered low risk/near threatened in 1996 is now listed as data deficient due to poor knowledge. Fortunately, no species of macropod has become extinct since the last assessment.
Despite significant improvements in knowledge of ecology and conservation requirements, and substantial investments in recovery planning and implementation, very little progress has been made in down-listing threatened Australian macropods over the last 15 years. This action plan argues that this is likely due to inadequate recovery funding and poorly framed recovery objectives.
Action Plan Framework
The long-term vision of this action plan is that all species of macropods extant in 2011 are thriving in the wild by 2061. The goal for the next 10 years is that each Australian macropod listed as threatened or near threatened on the IUCN Red List of Threatened Species will be eligible for down-listing: moving from a category of higher threat to a category of lower threat according to IUCN criteria (IUCN 2001). Specific and measureable objectives to achieve this goal within the specified time frame for each species were developed, directly addressing these criteria. Importantly, given the fate of the woylie over the last 20 years, it will be critical to ensure that recovery efforts are not limited to down-listing, but continue long into the future to ensure ultimate delisting and maintenance of species status as Least Concern.
Methods
The method of defining species recovery projects in this action plan relies on the articulation of long-term recovery objectives that are specific, measurable, attainable, realistic and time-bound. It then relies on expert opinion to define the full set of recovery actions required to achieve those objectives with a high degree of confidence. The rationale for this approach operates on the assumption that all of these actions will be essential to achieving the goal of down-listing within 10 years, and that to undertake only a portion of those actions is to invite failure in achieving the goal.
Where funds and capacity are limited, prioritisation may need to be undertaken in order to optimise resource allocation among projects, where costs, benefits, and the likelihood of management success are considered simultaneously. The project prioritisation protocol (PPP; Joseph et al. 2009) and INFFER (Pannell et al. 2009) are examples of such prioritisation methods. Prioritisation has not been undertaken as part of this action plan, due to the relatively small number of species under consideration, and the high degree of similarity in their conservation requirements.
13
Action Plan for Threatened Macropods 2011-2021
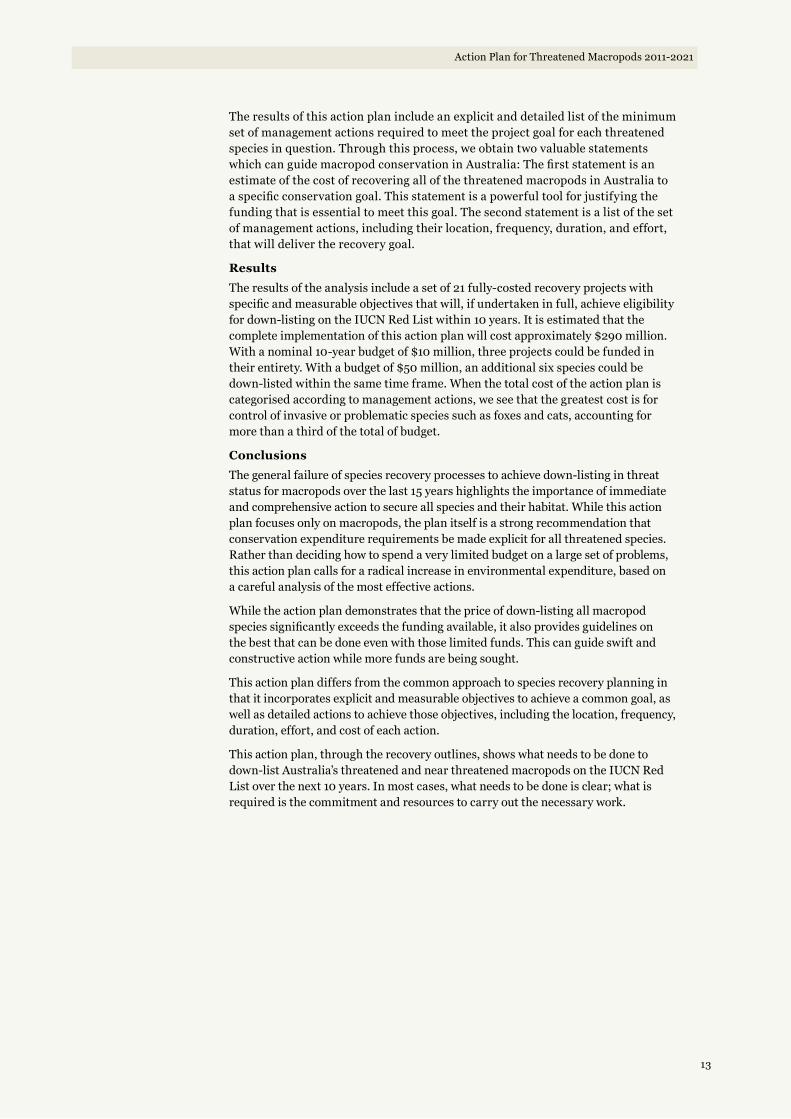
The results of this action plan include an explicit and detailed list of the minimum set of management actions required to meet the project goal for each threatened species in question. Through this process, we obtain two valuable statements which can guide macropod conservation in Australia: The first statement is an estimate of the cost of recovering all of the threatened macropods in Australia to a specific conservation goal. This statement is a powerful tool for justifying the funding that is essential to meet this goal. The second statement is a list of the set of management actions, including their location, frequency, duration, and effort, that will deliver the recovery goal.
Results
The results of the analysis include a set of 21 fully-costed recovery projects with specific and measurable objectives that will, if undertaken in full, achieve eligibility for down-listing on the IUCN Red List within 10 years. It is estimated that the complete implementation of this action plan will cost approximately $290 million. With a nominal 10-year budget of $10 million, three projects could be funded in their entirety. With a budget of $50 million, an additional six species could be down-listed within the same time frame. When the total cost of the action plan is categorised according to management actions, we see that the greatest cost is for control of invasive or problematic species such as foxes and cats, accounting for more than a third of the total of budget.
Conclusions
The general failure of species recovery processes to achieve down-listing in threat status for macropods over the last 15 years highlights the importance of immediate and comprehensive action to secure all species and their habitat. While this action plan focuses only on macropods, the plan itself is a strong recommendation that conservation expenditure requirements be made explicit for all threatened species. Rather than deciding how to spend a very limited budget on a large set of problems, this action plan calls for a radical increase in environmental expenditure, based on a careful analysis of the most effective actions.
While the action plan demonstrates that the price of down-listing all macropod species significantly exceeds the funding available, it also provides guidelines on the best that can be done even with those limited funds. This can guide swift and constructive action while more funds are being sought.
This action plan differs from the common approach to species recovery planning in that it incorporates explicit and measurable objectives to achieve a common goal, as well as detailed actions to achieve those objectives, including the location, frequency, duration, effort, and cost of each action.
This action plan, through the recovery outlines, shows what needs to be done to down-list Australia’s threatened and near threatened macropods on the IUCN Red List over the next 10 years. In most cases, what needs to be done is clear; what is required is the commitment and resources to carry out the necessary work.
14
Action Plan for Threatened Macropods 2011-2021
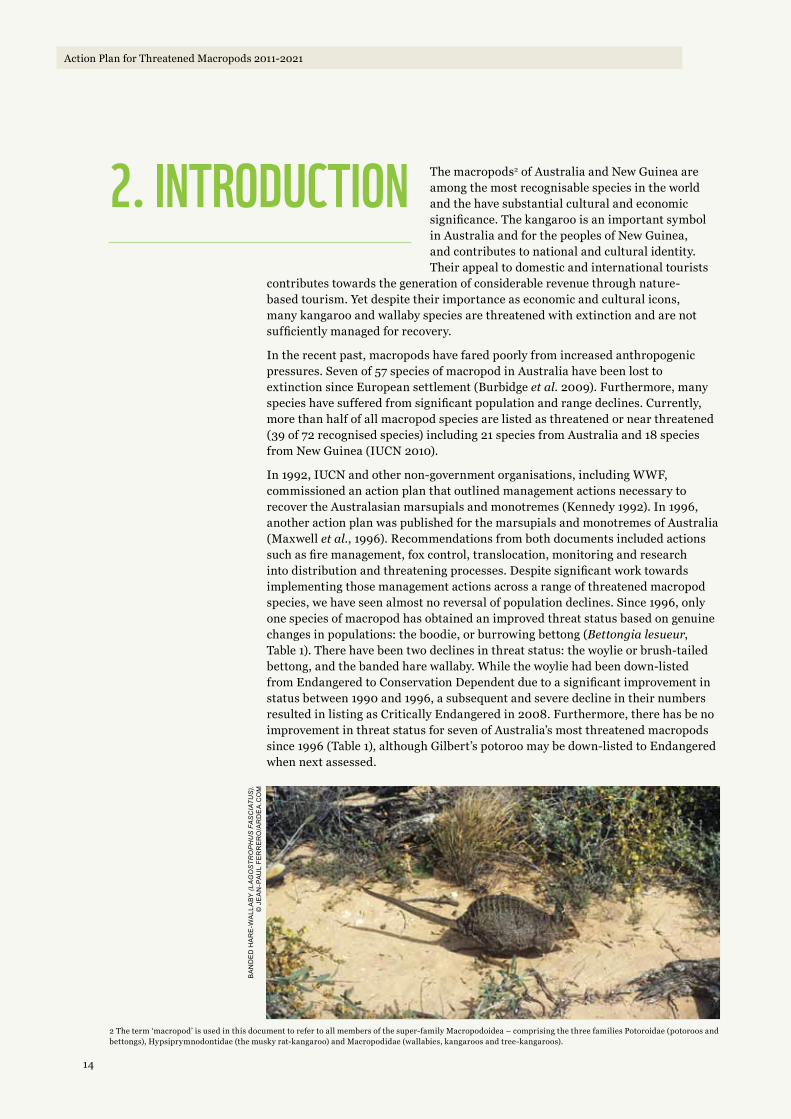
2. inTroduCTion The macropods2 of Australia and New Guinea are among the most recognisable species in the world and the have substantial cultural and economic significance. The kangaroo is an important symbol in Australia and for the peoples of New Guinea, and contributes to national and cultural identity. Their appeal to domestic and international tourists
contributes towards the generation of considerable revenue through nature-based tourism. Yet despite their importance as economic and cultural icons, many kangaroo and wallaby species are threatened with extinction and are not sufficiently managed for recovery.
In the recent past, macropods have fared poorly from increased anthropogenic pressures. Seven of 57 species of macropod in Australia have been lost to extinction since European settlement (Burbidge et al. 2009). Furthermore, many species have suffered from significant population and range declines. Currently, more than half of all macropod species are listed as threatened or near threatened (39 of 72 recognised species) including 21 species from Australia and 18 species from New Guinea (IUCN 2010).
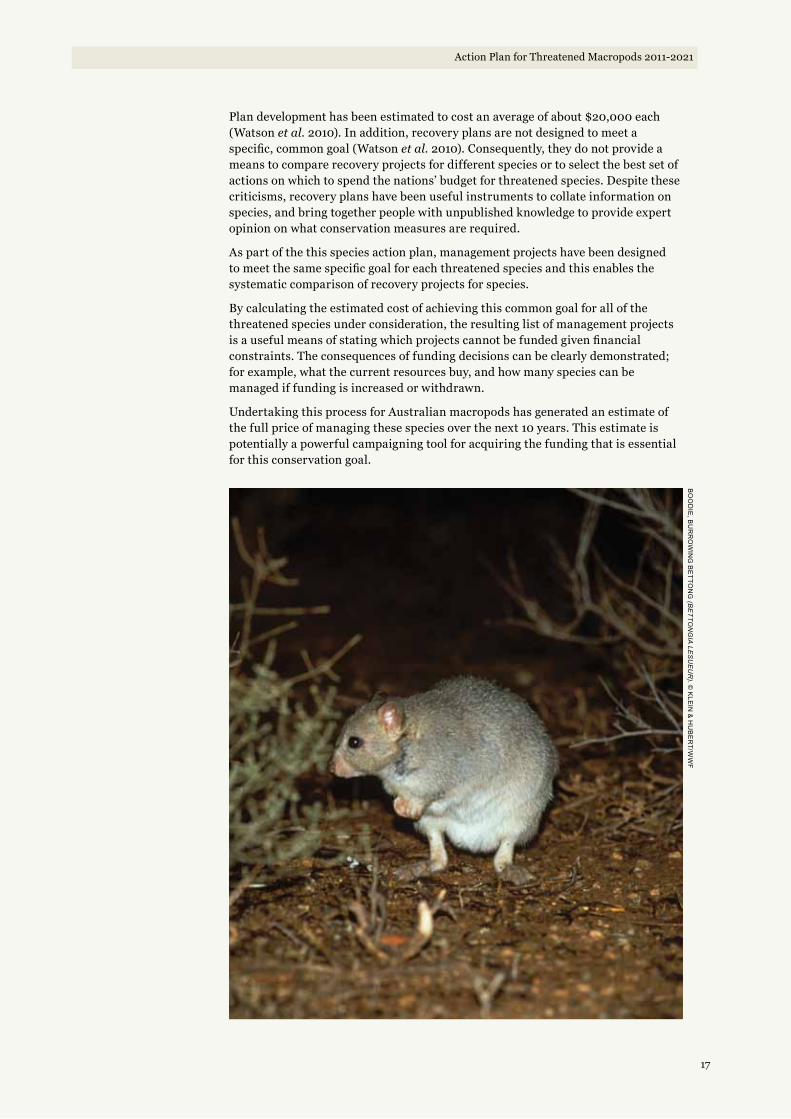
In 1992, IUCN and other non-government organisations, including WWF, commissioned an action plan that outlined management actions necessary to recover the Australasian marsupials and monotremes (Kennedy 1992). In 1996, another action plan was published for the marsupials and monotremes of Australia (Maxwell et al., 1996). Recommendations from both documents included actions such as fire management, fox control, translocation, monitoring and research into distribution and threatening processes. Despite significant work towards implementing those management actions across a range of threatened macropod species, we have seen almost no reversal of population declines. Since 1996, only one species of macropod has obtained an improved threat status based on genuine changes in populations: the boodie, or burrowing bettong (Bettongia lesueur, Table 1). There have been two declines in threat status: the woylie or brush-tailed bettong, and the banded hare wallaby. While the woylie had been down-listed from Endangered to Conservation Dependent due to a significant improvement in status between 1990 and 1996, a subsequent and severe decline in their numbers resulted in listing as Critically Endangered in 2008. Furthermore, there has be no improvement in threat status for seven of Australia’s most threatened macropods since 1996 (Table 1), although Gilbert’s potoroo may be down-listed to Endangered when next assessed.
2 The term ‘macropod’ is used in this document to refer to all members of the super-family Macropodoidea – comprising the three families Potoroidae (potoroos and bettongs), Hypsiprymnodontidae (the musky rat-kangaroo) and Macropodidae (wallabies, kangaroos and tree-kangaroos).
Ba
nd
ed
ha
re
-wa
lla
By
(la
gO
str
Op
hu
s f
as
cia
tus
). ©
Je
an
-Pa
ul
Fer
re
ro
/ar
de
a.c
oM

15
Action Plan for Threatened Macropods 2011-2021
Table 1: List of changes in IUCN threat status for Australian macropods between 1996 and 2008.
Species IUCN Threat Status - 19963 IUCN Threat Status - 2008
Improvement in Status
Bettongia lesueur (Boodie) Vulnerable Near Threatened
Macropus eugenii (Tammar wallaby) Low Risk/Near Threatened Least Concern
Decline in Status
Bettongia penicillata (Woylie) Conservation Dependent Critically Endangered
Lagostrophus fasciatus (Banded hare wallaby) Vulnerable Endangered
No Improvement in Threatened Status
Bettongia tropica (Northern bettong) Endangered Endangered
Lagorchestes hirsutus (Mala) Vulnerable Vulnerable
Onychogalea fraenata (Bridled nailtail wallaby) Endangered Endangered
Petrogale persephone (Proserpine rock wallaby) Endangered Endangered
Potorous gilbertii (Gilbert’s potoroo) Critically Endangered Critically Endangered*
Potorous longipes (Long-footed potoroo) Endangered Endangered
Setonix brachyurus (Quokka) Vulnerable Vulnerable
Change in Status – Criteria Change
Dendrolagus lumholtzi (Lumholtz’s tree kangaroo) Lower Risk/Near Threatened Least Concern
Lagorchestes conspicillatus (Spectacled hare wallaby) Lower Risk/Near Threatened Least Concern
Macropus fuliginosus (Western grey kangaroo) Lower Risk/Near Threatened Least Concern
Macropus irma (Western brush wallaby) Low Risk/Near Threatened Least Concern
Petrogale lateralis (Black-footed rock wallaby) Vulnerable Near Threatened
Petrogale penicillata (Brush-tailed rock wallaby) Vulnerable Near Threatened
Change in Status – Lack of Knowledge
Petrogale concinna (Nabarlek) Low Risk/Near Threatened Data Deficient*gilbert’s potoroo no longer meets the criterion by which it was listed as critically endangered, having been established at two sites in addition to the single site where it occurred in 1996. However the species must still be classified as Critically Endangered until it has not met any criteria in that threat status for a period of at least five years. During the next assessment of its status, it may be down-listed to Endangered (T. Friend, pers. comm. 2010).
3 Status from ‘The 1996 Action Plan for Australian Marsupials and Monotremes’ (Maxwell et al. 1996).

16
Action Plan for Threatened Macropods 2011-2021
Several other macropod species have changed in threat status between 1996 and 2008 (Table 1). This is partly because of slight changes to the criteria for the near threatened category of threat (IUCN, 2010) and partly because some species’ threat status has changed, e.g. Bettongia lesueur (Boodie) now has several subpopulations within fenced sanctuaries on the Australian mainland and Macropus eugenii (Tammar wallaby) has recovered in southwest Australia due to fox control, while Bettongia penicillata has declined, possibly because of increased predation by feral cats and foxes. There is so little useful information for the Nabarlek (Petrogale concinna) that it is now listed as data deficient (Table 1). The remaining 31 species of Australian macropods have not changed in threat status since 1996, remaining either as near threatened or least concern.
Thus conservation management of threatened macropods in Australia has not been sufficient to recover those species most at threat, and in two cases, threat status has worsened. Such failure to obtain significant conservation outcomes for threatened macropods has likely resulted from a combination of insufficient funding and poor allocation of that limited conservation budget, in addition to the large suite of threats these species face (see Section 3 – Current Issues in Conservation of Threatened Macropods).
Lack of Resources
It is clear that globally, the financial and human resources available for conservation are inadequate for the task of protecting all species (James et al. 2001; Balmford et al. 2003). Currently, only a small fraction of the species that are officially recognised as threatened with extinction are managed for recovery, both worldwide and in Australia. In the years 1989 to 1991, 54% of United States funding for threatened species was devoted to conservation of just 1.8% of all threatened species in that country (Metrick & Weitzman 1996). Similarly, in 2006, only 22% of New Zealand’s threatened species were actively managed, and many of these were inadequately managed to ensure persistence (Joseph et al. 2008). There is limited documentation about the allocation of resources to threatened species management in Australia. A review of funding for conservation of threatened birds in Australia over the period 1993-2000 (Garnett et al. 2003) showed that most of the funds dedicated to the recovery of those species were spent on the taxa closest to extinction. Without an analysis of costs involved, or the nature of recovery actions required, such an approach could result in expenditure that is not strategic, such as all available funds being spent on species that have little chance of recovery, or on species that are far more costly to recover than less-threatened species. Furthermore, substantial funds were allocated to Australian populations of taxa that are not threatened globally. Importantly, the status of most taxa did not change during that study period, but those that did improve had generally received more funds than those taxa that declined (Garnett et al. 2003).
The Need for More Explicit Recovery Planning
The lack of specific, measurable, attainable, relevant and time-bound (SMART) objectives in many recovery plans for threatened species is a significant barrier to being able to assess the success or otherwise of those recovery programs. Furthermore, the recommended actions outlined in published action plans and recovery plans are also often broad and non-specific.
A general criticism of traditional recovery planning processes (such as those used in Australia and New Zealand) is that the plans take too long to prepare and are expensive to produce. Since their inception over a decade ago in Australia, approximately 500 recovery plans have been published, leaving approximately 1100 threatened species without recovery plans (Watson et al. 2010).
17
Action Plan for Threatened Macropods 2011-2021
Plan development has been estimated to cost an average of about $20,000 each (Watson et al. 2010). In addition, recovery plans are not designed to meet a specific, common goal (Watson et al. 2010). Consequently, they do not provide a means to compare recovery projects for different species or to select the best set of actions on which to spend the nations’ budget for threatened species. Despite these criticisms, recovery plans have been useful instruments to collate information on species, and bring together people with unpublished knowledge to provide expert opinion on what conservation measures are required.
As part of the this species action plan, management projects have been designed to meet the same specific goal for each threatened species and this enables the systematic comparison of recovery projects for species.
By calculating the estimated cost of achieving this common goal for all of the threatened species under consideration, the resulting list of management projects is a useful means of stating which projects cannot be funded given financial constraints. The consequences of funding decisions can be clearly demonstrated; for example, what the current resources buy, and how many species can be managed if funding is increased or withdrawn.
Undertaking this process for Australian macropods has generated an estimate of the full price of managing these species over the next 10 years. This estimate is potentially a powerful campaigning tool for acquiring the funding that is essential for this conservation goal.
Bo
od
ie, B
ur
ro
win
g B
et
ton
g (B
et
tOn
gia
les
ue
ur
). © K
lein
& h
uB
er
t/ww
F

18
Action Plan for Threatened Macropods 2011-2021
State of Macropods
Seven species of Australian macropods have become extinct since European settlement (Burbidge et al. 2009), leaving 50 species that are extant, with 21 of those 50 listed by the IUCN as Threatened, Near-Threatened, or Data Deficient (IUCN 2010). In addition, some macropods – particularly larger species preferring open habitats - have not suffered from changed land use and conditions since European settlement, and are widely distributed and abundant. Others – generally small- to medium-sized, more specialised species – have suffered significant range contractions and/or population declines.
Australia has the highest mammal extinction rate of any country or continent, with half of global mammal extinctions over the last 100 years being Australian. The highest proportion of mammal extinctions have been amongst medium-sized ground dwelling mammals, predominantly marsupials and rodents, from the large mouse-like
murids to small wallabies (Burbidge & McKenzie 1989; Short and Smith 1994; Burbidge et al. 2009).
The following is an outline of the many pressures on macropods and a host of other threatened species in Australia, ranging from the socio-economic such as poor funding for conservation initiatives and low public awareness of threatened species issues, to the physical, such as invasive predators and wildlife disease.
Socio-Economic ContextThe fundamental causes of biodiversity loss are ‘deeply embedded in the ethical, cultural and institutional arrangements that determine the nature of Australian society’ (Young et al. 1996).
Human Impacts
For Australia’s macropod species, human population trends are having both direct and indirect impacts. Encroaching land development is a significant threat for some species, and more broadly, expanding population and its associated footprint are placing increasing pressure on urban green spaces, farming productivity and water allocation, leaving less natural resources and management capacity for conservation efforts.
Conservation Funding
Resourcing for the conservation of Australian species is clearly inadequate with scarce funds for management activities for the expanding National Reserve System, lack of funds for full scale implementation of threat abatement plans, inadequate incentives for private landholders to offset production losses resulting from conservation activity, recovery plans being funded to a fraction of what is required, and legislative lists of threatened species and ecological species continuing to expand at State and Federal levels.
3. CurrenT issues in ThreATened MACroPod ConservATion
4 Bettongia pusilla, Caloprymnus campestris, Potorous platyops, Lagorchestes asomatus, Lagorchestes leporides, Macropus greyi, Onychogalea lunata

19
Action Plan for Threatened Macropods 2011-2021
Modelling by Garnett et al. (2008) predicts that an annual expenditure of $10 million (approximately three times current expenditure) would be required in order to reduce the number of threatened Australian bird species by approximately 15%. While the same work has not been conducted for macropods, we can view this as indicative of the inadequacy of species conservation resources. Costing provided in this action plan estimates that approximately $290 million is needed in order to adequately address macropod conservation needs.
With Australia’s size, its status as a megadiverse country with uniquely evolved flora and fauna, and critical threats, substantial funds are required in order to adequately manage its natural resources. With its human population being so low, however, there are resourcing issues on several levels: access to vast and remote areas requiring management, knowledge of appropriate management techniques, and having the tax base and philanthropic capacity to adequately fund management action.
How Does Environment Rate as a Priority for Australians
Newspoll, a prominent Australian public opinion polling company, shows that the environment as an issue in the minds of respondents has progressively decreased in importance over the term of the former federal government (from 69% of respondents ranking as ‘very important’ in October 2007 to 57% in February 2010). The top ranking issues continue to be health, education and the economy (Newspoll 2010).
Perceptions of Macropods
There have been no in depth studies of the public’s understanding of macropod conservation issues. The perception studies that have been conducted have been done at the level of ‘kangaroos’ rather than a particular species, which may suggest that there is little understanding of the range of macropod species and associated issues. Studies that have been undertaken indicate that perspectives of macropods can be broadly classed into four categories:
• Significance to Indigenous Australians,
• Animal rights perspectives opposing culling and their use as human food or pet meat,
• The impact of kangaroos on agricultural productivity,
• Kangaroos as tourism icons.
Macropods are highly significant to Indigenous Australians. Many traditional management practices, especially the use of fire, are related to land management for macropods (Bowman et al. 2001). Many macropod species are central to creation history, are commonly depicted in rock art sites and are important in traditional ceremonies.
In the broader Australian community, perceptions of macropods are dominated by commercial harvesting and pest management programs, with strong polarised views. Five macropod species are currently commercially harvested for meat in Australia (DEWHA, 2010d), and further culling occurs as a pest control measure in rural areas.
Many urban Australian residents see macropods as an Australian icon, with culling programs of large and locally abundant macropod species attracting fierce community opposition (e.g., see National Kangaroo Protection Coalition 2009). Rural Australian residents are more likely to view macropods as a pest impacting agricultural productivity. In Victoria, a study showed that 26% of respondents considered kangaroos a pest, with a majority considering that some management was needed (Johnston and Marks 1997 in: Fitzgerald et al. 2007). In Queensland, many sheep and beef farmers consider them to be a pest, with 16% of all landholder respondents rating them the pest animal of most concern (Oliver and Walton, 2004 in: Fitzgerald et al. 2007).

20
Action Plan for Threatened Macropods 2011-2021
Tourism studies show that the kangaroo is seen as an Australian icon, and that satisfying wildlife experiences are an important factor with many international visitors (Sustainable Tourism Cooperative Research Centre 2009). Satisfying kangaroo encounters are more likely to be with large species of open habitats – i.e. not threatened species (Higginbottom et al. 2004).
Regulatory Context
Australia’s central environmental legislative instrument, the Environment Protection and Biodiversity Conservation (EPBC) Act 1999, has recently undergone a 10 year review. At the time of writing, the government’s response is yet to be delivered. The review encompasses several recommendations that would make the Act more strategic, less reactive, and shift biodiversity conservation more into the mainstream – e.g. an enhanced role for regional planning, and introducing a systems-based approach to decision-making and a system of national environmental accounts. The review supports the recent shift in conservation paradigms towards a landscape focus by recommending bioregional planning with a flexible approach. It is yet to be seen what the consequences of this review will be for threatened species recovery in Australia.
At the State level, legislation, political will and enforcement vary greatly from state to state, thus complicating recovery processes for species which occur across state boundaries.
Landscape-Scale Issues for MacropodsThe key issues impacting Australian macropods at the landscape scale are the clearing, fragmentation and degradation of habitat; predation; competition; and changed fire regimes. At least 12 of the macropod species listed as threatened or near threatened on the Red List are thought to be threatened by predation, at least nine are thought to be threatened by altered fire regime, seven by grazing competition, and seven by ongoing habitat loss, not to mention the potential interactions of these threats (IUCN 2010). These problems are exacerbated and complicated by the impacts of a changing climate. These issues, along with the role of protected areas – a key landscape scale conservation strategy – are considered below.
Land Clearing, Fragmentation and Degradation
Past and current land clearing and land use practises have resulted in the removal, fragmentation and degradation of habitat for many of Australia’s macropods.
Protecting, reconnecting and building the resilience of remaining habitat is a high priority for most threatened macropods. Projects such as Gondwana Link provide important ecological linkages across a range of ecosystems. As Murray et al. (2006) outlined using a brush-tailed rock-wallaby Petrogale penicillata case study, it is important to look at multiple scales for habitat suitability for specialist species when undertaking connectivity planning. Protected areas are a key mechanism for reconnecting habitat, and these are considered in more detail at the end of this section.
Feral Animals
The key feral animals negatively impacting on Australian macropods are foxes, cats, pigs, rabbits and goats.
There is strong evidence that predation by introduced foxes and cats has had a significant negative impact on small and medium-sized marsupials in Australia (Burbidge and McKenzie 1989; Short and Smith 1994; Algar and Burrows 2004; Saunders et al. 2010; Kinnear et al. 2010). Furthermore, foxes and cats are the main causes of failure of reintroductions of small macropods in Australia (Short et al. 1992). The degree of threat depends upon local conditions such as presence of other predators, prey availability, climatic conditions and habitat conditions such as the presence of a protective understorey or rock pile shelter.

21
Action Plan for Threatened Macropods 2011-2021
One of the more complex issues affecting predation is the presence of dingoes. There is increasing evidence of the role of dingoes as a trophic regulator in some regions, with negative associations between dingoes and fox abundance (Newsome et al. 2001; Letnic 2007), and positive associations between dingo presences and medium-sized marsupials and native rodents (Smith and Quin 1996; Johnson et al. 2007; Southgate et al. 2007; Wallach et al. 2008). For example, Wallach et al. (2008) found that the yellow-footed rock-wallaby Petrogale xanthopus co-occurred with the dingo, and that the most common predator in areas inhabited by the rock-wallaby was the dingo.
Arguments for re-establishing dingoes in the landscape as a trophic regulator are complicated by lack of knowledge of the effect of dingo-wild dog hybridisation (Claridge & Hunt 2008), the relatively recent arrival of dingo to mainland Australia complicating native/non-native classifications (Johnson 2006), and the impact of dingoes/wild dogs on domestic stock (Fleming et al. 2001). Some ecologists argue that the dingo, wild dog and their hybrids should be treated equally from a functional point of view (Daniels & Corbett 2003), while some conservationists seek to preserve the purity of the dingo subspecies (Australian Dingo Conservation Association 2008), and many in the agricultural sector argue that the dingo should be controlled as a pest animal, and this is supported by legislation in some states. It is also clear that dingo suppression of fox and cat numbers, while probably significant is some parts of Australia, was insufficient to prevent extinction and decline of medium-sized mammals in arid Australia.
The main feral competitors impacting macropods are pigs, rabbits and goats. For pigs, competition for food as well as habitat alteration due to rooting behaviour are thought to be issues for a number of macropods that rely on fungal fruiting bodies, such as the northern bettong Bettongia tropica (DERM 2009), or which rely on pig-impacted swamp or riverine habitat such as the quokka Setonix brachyurus (DEWHA 2010c).
While not thought to be a limiting factor for most macropod species, rabbits have significant dietary overlap with some species (Robley et al. 2001). The national rabbit threat abatement plan identifies rock-wallabies and hare-wallabies (Petrogale, Lagorchestes and Lagostrophus species) as potentially impacted by rabbits (DEWHA 2008a). Moreover, rabbits can support large populations of foxes and cats (Holden and Mutze 2002).
Goats have a competitive effect with some macropods, particularly those confined to steeper, rocky terrain, such as rock wallabies (Short & Milkovits 1990; Eldridge 1997). The presence of dingoes is one of several factors that limit the distribution of goats (DEWHA 2008c).
There are limited studies about public attitudes to feral animal control, however a Queensland study of primary producers in 2004 showed dingoes and wild dogs were ranked as landholders’ main pest animal by 33% of respondents (highest of any species), followed by feral pigs (16% said were main pest), then kangaroos and wallabies (16% said were main pest) (Oliver and Walton 2004 in: Fitzgerald et al. 2007). In another study of Queensland landholders (Finch and Baxter, 2005 in: Fitzgerald et al. 2007), feral pigs, rabbits, feral cats, wild dogs/dingoes, mice and foxes were identified by more than 75% of respondents as being ‘significant’ or ‘very significant’ pests. In a Victorian study, feral cats were the most likely to be considered a pest of the 14 animals listed in the survey (Johnston and Marks 1997 in: Fitzgerald et al. 2007).
From the perspective of macropod conservation, it is highly problematic that macropods themselves, and a key trophic regulator thought to be of benefit to some macropods, are considered to be pests by a large proportion of rural Australians. Further studies are needed in order to assess these attitudes in more detail and determine triggers for changing attitudes where needed for macropod conservation.

22
Action Plan for Threatened Macropods 2011-2021
Predator and Competitor Control Strategies
There are a range of control strategies that vary in their cost efficiency depending upon local ecological conditions and the animal being targeted.
Baiting is the dominant control technique currently utilised for feral predators in Australia, and is also widely used for rabbits and pigs. The poison usually utilised is known as 1080, and there are an increasing range of specialist uptake mechanisms being developed to increase effectiveness and reduce non-target uptake – for example PIGOUT® (Invasive Animal CRC 2010).
1080 poison naturally occurs in native pea bushes in south-western Western Australia and in scattered areas in central Australia, which is thought to result in a higher tolerance of native wildlife for the poison in those areas, greatly reducing non-target losses. Capitalising on this, the Western Shield program has rolled out large scale and long term baiting for introduced predators has significantly contributed to the success of small and medium sized mammal in situ conservation and re-introductions in the southwest. In other parts of Australia, effects on non-target species (such as quolls and birds) need to be taken into account and mitigated via burying the bait or use of dye (DEWHA 2010a).
Other poisons include a toxic formulation based on para-aminopropiophenone, used in fresh cat meat baits Eradicat® and Curiosity® (DEWHA 2010b). Cat baiting has proven more challenging for conservation managers than fox baiting, however sausage or fresh meat baits are proving successful in certain circumstances, with effectiveness varying with bioregion, season, and live prey abundance. Sausage baits have been successful in achieving a 95% reduction in the Gibson Desert, and the eradication of cats on two West Australian islands (Algar and Burrows 2004).
There is a range of traps utilised for feral animal control, including conventional cage traps, soft-catch traps and yards that may be created around watering holes to catch animals as they come in to drink. Trapping is labour intensive – particularly in remote areas - as traps must be checked at least once a day, and success can be limited. Cage and soft-catch traps are typically baited with food and used for feral predators such as cats and foxes. Yard traps are commonly used for feral goats (DEWHA 2010a).
Shooting is generally not a cost effective animal control technique, however is often utilised in order to remove any remaining individuals from an area once other techniques have been employed. Hunting with dogs is the most common method of controlling pigs in many parts of northern Australia, however improvements in trap design and technique are making this a more cost effective mechanism (DPIF 2007).
Biological control has been used with varying success in Australia to reduce the impact of feral species. The introduction of two viruses has been very successful in the substantial reduction of rabbit numbers, however the introduction of the cane toad to control two insect pests of sugar cane was unsuccessful as it did not control the insect pest and led to the establishment of a new pest in the cane toad (DEWHA 2010).
Fencing has been used to exclude rabbits and dingoes for over 100 years, and more recently has been developed to exclude a broader range of predators and competitors. Pen and field trials have been conducted to look at the cost efficiency of a range of predator and competitor exclusion fences (Moseby & Read 2005). Material costs are high, particularly for cat exclusion fencing, making it only a viable option where the area to be enclosed is relatively small, or for a narrow peninsula such as Heirisson Prong, Shark Bay. Fencing needs to be regularly monitored, maintained, and in some cases supplemented by regular baiting and trapping (Short & Turner 2000).

23
Action Plan for Threatened Macropods 2011-2021
Offshore islands are valuable for threatened species, providing unique ecosystems, protection from feral predators and competitors, and opportunities to eradicate feral species and establish insurance populations of threatened species. Integrated pest management plans have been successfully implemented on several islands, but more opportunities exist in order to capitalise on island attributes, given sufficient resources.
In order for offshore islands to be valuable for macropod conservation however, one of the fundamental criteria to be considered – particularly in terms of larger species – is island size. Barrow Island is the smallest Australian island (23,300 hectares) to have successfully supported a population of large macropods for the 8-10,000 years since separation from mainland, providing evidence of minimum viable population and habitat requirements of large macropods for long term survival (Short and Turner 1991). However, smaller islands have supported one or more species of smaller macropods for thousands of years, e.g. Bernier and Dorre Islands in Shark Bay (4,000 to 5,000 ha) protect three species of threatened macropods.
Islands can also be used for translocation of highly-threatened species, sometimes termed marooning. The conservation status of one threatened macropod subspecies, the mala (a subspecies of the rufous hare-wallaby), was improved from Extinct in the Wild to Vulnerable via introduction to Trimouille Island in the Montebello Islands off the Pilbara coast (Langford and Burbidge 2001). Other macropods have been translocated to islands, e.g. black-footed and Proserpine rock-wallabies.
Changed fire regimes
Fire plays an important role in Australian ecosystems. Much of Australia was routinely burnt by Indigenous Australians from the late Quaternary period until European settlement. This burning is thought to have resulted in substantial changes to the range and demographic structure of many vegetation types, and was important in creating habitat mosaics that favoured the abundance of some mammal species (Bowman 1998). Observations suggest that burning was sparse and biased towards coastal and sub-coastal areas, in line with population density (Russell-Smith et al. 2002) but was widespread in the spinifex grasslands of the interior. There is little traditional fire management being conducted today.
Today, burning is undertaken for a range of purposes including for the reduction of fuel loads to minimise wildfire risk, for regeneration of areas following timber harvesting, and for biodiversity conservation purposes. The impact of fire frequency, timing and intensity on some ecological communities has been widely studied, while for others there is a paucity of information.
After a number of recent and severe wildfires in southern Australia with high loss of life, fire policy has become increasingly focused on wildfire suppression. While wildfire suppression is not in itself counter-productive to optimal burning regimes for biodiversity, in the wake of the human tragedy of Black Saturday in 2009, there is currently little space in fire policy discussions to promote biodiversity considerations.
The impact of deviation from traditional burning regimes varies amongst macropods. For the northern bettong Bettongia tropica, for example, fire regime changes are thought to be responsible for understorey changes resulting in reduced food availability and weed incursions (Department of Environment and Resource Management, 2009).
Climate change
The magnitude and rate of changing climate is already resulting in observable changes, mostly at the species level (Steffen et al. 2009b). The interaction of

24
Action Plan for Threatened Macropods 2011-2021
climate change with the existing threats outlined above, along with an array of responses at different levels, will result in a high level of complexity in ecosystem management and species recovery work. Specific climate responses of species and ecosystems are difficult to predict, however past responses provide information that can be utilised in modelling likely future responses. For example, the bridled nailtail wallaby Onychogalea fraenata declined severely during a major drought, with increased predation being the major cause of low juvenile survivorship (Fisher et al. 2000). With increased drought predicted in bridled nailtail wallaby habitat, this provides insight to the challenges ahead for this species.
Characteristics of species likely to be climate change winners and losers have been identified, with more specialised, spatially restricted species with a low range of physiological tolerance, low genetic variability, low fecundity and poor dispersal rates posing barriers to timely adaptation. Assessing and managing risk at multiple levels, coupled with adaptive management, becomes critical under the complexity of climate change (Steffen et al. 2009a).
Key management strategies are to enhance the resilience of ecosystems in order to maximise opportunities for adaptive responses, such as migration. Specific actions to achieve this include enhancing connectivity, protecting key refugia, reducing the impact of existing threats such as invasive species, and managing for fire (Steffen et al. 2009b).
Protected Areas
In recent years there has been a significant increase in investment – both public and private – in protected areas acquisition. Increased government investment has been utilised for additions to the public estate, as well as funds leveraged by non-government organisations such as the Australian Wildlife Conservancy (AWC) and Bush Heritage Australia (BHA) with public donations and partnerships. However, it has been shown (Watson et al. 2011) that there is relatively poor coverage of protected areas for threatened species, despite this growth in the National Reserve System.
While funds have become more accessible for parks acquisition, there hasn’t been a proportional increase in management funds, either for publicly or privately managed parks, with management funds in most cases being inadequate (Miller 2010). In the absence of adequate funds to manage landscape-scale threats such as predation, competition and inappropriate fire regimes, large fenced sanctuaries have played an important role in the short-term conservation of macropods and other small mammals.
The Australian Wildlife Conservancy/Bush Heritage model has demonstrated some success with macropod conservation, with the captive woylie subpopulation managed by AWC at Karakamia currently being the only high density population of woylies that is not in steep decline (AWC 2009). Management practises are a mix of landscape-scale threat abatement (for example feral species and fire management), as well as species specific recovery actions such as reintroductions and translocations.
25
Action Plan for Threatened Macropods 2011-2021
tas
Ma
nia
n B
et
ton
g (B
et
tOn
gia
ga
ima
rd
i). © d
ave
wat
ts/a
ntP
ho
to.c
oM
.au

26
Action Plan for Threatened Macropods 2011-2021
Species-Level Issues For MacropodsGeneticsWith genetic diversity being one of the pillars of biodiversity and underpinning the adaptability of a species, it is a critical consideration in any species recovery program. Integrating genetic assessments into recovery efforts means understanding patterns of genetic variation within a species; working to maintain genetic stock in insurance populations especially for high risk populations; and incorporating genetic considerations into boosting small isolated populations, establishing new populations, or undertaking captive breeding.
Translocations and ReintroductionsMany of Australia’s macropod species have suffered such significant habitat fragmentation and destruction, range contraction and population decline, that translocations or reintroductions are a necessary part of recovery efforts. In planning such cost-intensive actions, there are many issues that first need to be considered to maximise probability of success.
Predation by foxes and cats is the main cause of failure of reintroductions of small macropods in Australia (Short et al. 1992). Any translocation or reintroduction should therefore incorporate a predator control program unless it is a known predator free area.
Decisions regarding the choice of individuals to be translocated/reintroduced needs to take into account genetic studies (Eldridge 1997) and the mating system of the species in question (Sigg et al. 2005) in order to reduce costs and increase chances of establishing self-sustaining population.
Use of modelling is critical in determining minimum viable population sizes in the face of predation and other factors. For example, modelling of bridled nailtail wallaby Onychogalea fraenata reintroductions showed that even very small amounts of predation (2-4 individuals per six months) can cause reintroductions of up to 50 individuals to fail. Furthermore, modelling indicated that for this species a single reintroduction was preferable to multiple reintroductions of the same total number of individuals (McCallum et al. 1995).
Captive Breeding With the focus of the Action Plan being in-situ conservation, captive breeding is considered here in that context. Developing captive populations is an expensive undertaking, however it can assist in-situ threatened species conservation efforts in a number of ways. The study of captive individuals can enhance understanding of the species’ biology and ecology thereby informing management action in the wild. Furthermore, securing a captive population can provide insurance against stochastic events in the wild and disease risk, and help maintain the genetic diversity of the species. The generation of captive bred individuals can increase the resilience of small populations and/or establish new populations.
For most macropods, captive breeding has been conducted with some success. For some, techniques such as cross-fostering are used in order to boost numbers as cost effectively and quickly as possible (e.g. Zoos SA 2010).
Monitoring There are significant knowledge gaps pertaining to the taxonomy, demography, biology, ecology, behaviour, distribution and abundance of many macropod species, as well as the effectiveness of specific management actions. In some cases these knowledge gaps are substantial enough to impede management, while in others the results would not significantly impact management decisions. Assessing

27
Action Plan for Threatened Macropods 2011-2021
the costs and benefits of investing in such research questions is essential, and decision-theory frameworks can be useful in this regard.
Monitoring programs need to take into account appropriate spatial, population and temporal scales in order to determine and assess the impact of management strategies; and utilise existing scientific and local knowledge in order to minimise monitoring costs.
There is a range of monitoring techniques utilised for macropods such as live trapping, drive fence techniques, radio tracking, scat and hair analysis, and predator dietary analysis. The choice of monitoring technique needs to be informed by the specific questions to be answered.
Mo
nJo
n (p
etr
Og
ale
Bu
rB
idg
ei). ©
Jiri lo
ch
Ma
n/lo
ch
Ma
n tr
an
sPa
re
nc
ies

28
Action Plan for Threatened Macropods 2011-2021
This action plan outlines the vision, goal, objectives, and essential activities for the down-listing of threatened and near threatened Australian macropods. It is the framework that could effectively guide the implementation of threatened macropod recovery for the period 2011-2021. The goal, objectives and activities are structured in a logical, hierarchical manner, and are as objectively verifiable as possible to assist in program monitoring and evaluation.
Action Plan Scope
A project’s scope defines the broad parameters or the subject of the project. For this action plan, the scope is all Australian macropods listed as threatened (Vulnerable, Endangered, Critically Endangered), Near Threatened, or Data Deficient on the IUCN Red List of Threatened Species (IUCN, 2010) (Table 2). The IUCN Red List criteria used to define threat status of species are recognised internationally, and provide quantifiable elements by which we can assess progress in recovery. By using the IUCN list and not the Australian Government’s Environment Protection and Biodiversity Conservation (EPBC) Act, we are able to include species that are listed as near threatened, thus incorporating preventative action into our suite of recovery projects.
In this action plan, the choice of the taxonomic level of species was made to ensure that recovery projects are all working towards the same project goal, and to avoid the complicated arguments around recovery of threatened subspecies of a species that may not be threatened at the national (or international) level. With further taxonomic assessment, some macropods, particularly those with distinct geographic subpopulations, may be subject to reassessment under this action plan.
4. ACTion PlAn FrAMework
ye
llo
w-F
oo
ted
ro
cK
wa
lla
By (p
etr
Og
ale
xa
nth
Op
us
). ©
Ma
rti
n h
ar
ve
y/w
wF-
ca
no
n

29
Action Plan for Threatened Macropods 2011-2021
Table 2: Australian macropods listed as threatened, near threatened or data deficient according to the IUCN Red List of Threatened Species (IUCN, 2010).
Scientific Name Common Name(s) Threat Status
Bettongia gaimardi Tasmanian bettong Near ThreatenedBettongia lesueur Boodie, burrowing bettong Near ThreatenedBettongia penicillata Woylie, brush-tailed bettong Critically EndangeredBettongia tropica Northern bettong EndangeredDendrolagus bennettianus Bennett’s tree kangaroo Near ThreatenedLagorchestes hirsutus Mala, rufous hare-wallaby VulnerableLagostrophus fasciatus Munning, banded hare-wallaby EndangeredMacropus bernardus Black wallaroo Near ThreatenedMacropus parma Parma wallaby Near ThreatenedOnychogalea fraenata Bridled nailtail wallaby EndangeredPetrogale burbidgei Monjon Near ThreatenedPetrogale coenensis Cape York rock wallaby Near ThreatenedPetrogale concinna Nabarlek Data DeficientPetrogale lateralis Black-footed rock wallaby, black-flanked rock wallaby Near ThreatenedPetrogale penicillata Brush-tailed rock wallaby Near ThreatenedPetrogale persephone Proserpine rock wallaby EndangeredPetrogale sharmani Mount Claro rock wallaby Near ThreatenedPetrogale xanthopus Yellow-footed rock wallaby Near ThreatenedPotorous gilbertii Gilbert’s potoroo Critically EndangeredPotorous longipes Long-footed potoroo EndangeredSetonix brachyurus Quokka Vulnerable
Ma
la, r
uFo
us h
ar
e-w
alla
By (lagO
rc
he
ste
s hir
su
tus
). © M
ar
tin h
ar
ve
y/ww
F-ca
no
n

30
Action Plan for Threatened Macropods 2011-2021
Action Plan Vision
A project’s vision is the desired state or ultimate condition that the project is working to achieve. This action plan has a 50-year vision:
By 2061, all species of macropods5 extant in 2011 have multiple6 secure7 subpopulations in the wild8.
Action Plan Goal
A goal is a specific statement detailing the desired impact of a project. The goal of this action plan was determined based on quantifiable criteria that could be objectively measured and could be achieved within a 10-year period. For this reason, down-listing on the IUCN Red List was deemed to be the most suitable measure of species recovery:
By 2021, all threatened Australian macropods9 will be eligible10 to be moved from a category of higher threat to a category of lower threat according to IUCN Red List of Threatened Species criteria.
Action Plan Objectives
An objective is a more specific statement than a goal, detailing a desired accomplishment or outcome of a project. Multiple objectives have been developed for each species, according to the criteria used to determine each species’ conservation status during the 2008 Global Mammal Assessment coordinated by the IUCN (IUCN 2010). The objectives thus reflect the actions required to ensure that each species no longer meets any of the criteria for its current threat category by 2021, and include targets for population size, geographic range, population trend, and/or number of secure subpopulations, as well as mitigation of threats, and conservation of known genetic diversity.
The timeframe of this action plan is ten years, which is a short period of time in which to achieve significant recovery outcomes. Since a species may only be moved from a category of higher threat to a category of lower threat if none of the criteria of the higher category have been met for a period of five years or more (IUCN 2001), some species may only be eligible for down-listing within 10 years. In these cases, the objective of any future recovery plans should be to ensure that none of the criteria under the current threat category are close to being met for a period of at least five years, thus allowing for down-listing after that time.
Objectives for each species can be found within each species recovery outline in Appendix 5.
5 Those species in the families Macropodidae, Potoroidae and Hypsiprymnodontidae.
6 Minimum of three.
7 A taxon is defined as secure when its numbers and distribution are stable or increasing, and when numbers and distribution are sufficient that there is a 95% prob-ability that the species will survive the stochastic events anticipated over a 50 year timeframe, given that all known and predicted threats are adequately mitigated.
8 A fenced subpopulation may be considered wild for the purposes of this vision if the fenced area contains sufficient natural habitat to support a self-sustaining subpopulation. In this context, self-sustaining means that the subpopulation persists without the provision of food or water.
9 Those species belonging to the families Macropodidae, Potoroidae and Hypsiprymnodontidae that are listed on the IUCN Red List of Threatened Species as Criti-cally Endangered, Endangered, Vulnerable, Near Threatened, or Data Deficient (IUCN 2010).
10 All of the criteria of the higher category are no longer met. This condition may or may not have been achieved for the required period of five years or more by 2021: “A taxon may be moved from a category of higher threat to a category of lower threat if none of the criteria of the higher category has been met for five years or more” (IUCN 2001). Where this period has not been met, the population should be stable or increasing until such time it meets the IUCN conditions in full.

31
Action Plan for Threatened Macropods 2011-2021
5. MeThods A working group was convened in the early stages of development of this action plan to determine the most appropriate framework of recovery goals and objectives. In doing so, the working group decided that all species included should be treated consistently. Recovery plans for different species may have quite different goals, with some simply
aiming to ensure that the species does not become further threatened, while others aim to secure several populations across Australia. The reasons for these differences are varied, making comparison of the recommended projects difficult.
This plan was initially formulated as a prioritisation of management projects based on the Project Prioritisation Protocol (Joseph et al. 2009). However, given the relatively small number of species covered by this action plan, their relative taxonomic similarity and thus similarity in necessary recovery projects, prioritisation of any factor other than total project cost was deemed to be arbitrary.
At least two government bodies have already incorporated the Project Prioritisation Protocol into their species recovery planning. The New Zealand Department of Conservation (DOC; Joseph et al. 2009), and the Tasmanian Department of Primary Industries, Parks, Water and Environment (DPIPWE 2010) have both undertaken this process to determine long term expenditure and priorities for the management and recovery of threatened species. Whilst both departments set different goals, they were able to equitably and objectively quantify the time, effort and cost required to manage threatened species in their respective jurisdictions. With a given funding over a set period of time, those departments can now use their budgets to most effectively achieve their goals.
The set of steps (Table 3) undertaken for this action plan is adapted from the prioritisation protocol (Joseph et al. 2009), with the omission of explicit prioritisation elements.
The nature of the goal and objectives to be used for the species in this action plan were discussed at length during several workshops involving experts in strategic planning and macropod recovery. Once it was decided that the common goal should be down-listing on the IUCN Red List, and the objectives for recovery of each species should be based on the IUCN criteria (IUCN 2001), spreadsheets containing a list of questions (outlined below) were distributed via email to experts. We endeavoured to ensure that all people with knowledge about the conservation needs of Australian macropod species were consulted and had an opportunity to provide information and comment on drafts.
We asked relevant experts to provide information about the requirements for down-listing each species over the next 10 years. Some difficulties were encountered in the high degree of variability in content of expert input. However, these inputs were able to be combined across species to ensure that a consistent framework was in place to achieve objective and quantifiable recovery according to the IUCN criteria for threatened species (IUCN 2001).
A draft action plan was then circulated to all experts for review, and comments received were incorporated before finalisation of this action plan.
32
Action Plan for Threatened Macropods 2011-2021
Table 3: Summary of the steps undertaken in collecting information for this action plan.
Step 1: Define goal and objectives.Step 2: List biodiversity assets: Identify the assets of interest, in this case threatened macropods.Step 3: List management projects: Identify the set of feasible projects that achieve the goal.Step 4: Provide rationale for proposed activities: Justify the need for each activity in achieving the goal.Step 5: Estimate cost: Calculate the costs of each project.
Step 1: Define The Goal
To optimally allocate resources among projects for the management of the threatened macropods of Australia, it is essential to clearly state the goal of the conservation program (Possingham et al. 2001; Sanderson 2006). An appropriate goal may be to maximise the persistence of the greatest number of macropod species over the next 100 years. Alternatively, the goal may be to maximise the number of species that have 10% of their original range or greater than 5,000 individuals (which ever is larger) in the next 50 years. The time frame and population targets are crucial in this regard, and will influence the total cost of management projects. Therefore, the first step of this project was to properly formulate the goal of each macropod recovery project.
For the purposes of this Action Plan, the overall goal was to achieve eligibility for down-listing of all threatened and near threatened Australian macropods on the IUCN Red List of Threatened Species (IUCN, 2010) within ten years, while the objectives for each species addressed the specific criteria by which each species was listed during the Global Mammal Assessment in 2008 (IUCN 2010) (see Section 4 – Action Plan Framework).
Step 2: List Biodiversity Assets
The second step listed the biodiversity assets that require conservation attention.
For the purposes of this Action Plan, species were selected on the basis of their status on the IUCN Red List of Threatened Species (IUCN 2010). Australian species belonging to the families Macropodidae, Potoroidae and Hypsiprymnodontidae listed as Critically Endangered, Endangered, Vulnerable, Near Threatened or Data Deficient were included (see Section 4 – Action Plan Framework for the rationale behind this decision).
Step 3: List Management Projects
Experts were asked to design an appropriate project for each species. A project is the minimum set of all necessary actions for meeting the pre-defined goal. Experts were asked to provide a list of actions that, if undertaken in full, would result in the achievement of the goal (down-listing within 10 years) with 95% confidence. Thus for a near threatened species suspected to be facing a range of possible threats, in a remote area far from human habitation, the project would require dedicated research to establish the nature and intensity of those threats, but would unlikely require dedicated community involvement in the recovery process.
Experts were required to clearly describe a precise location, and frequency, intensity and duration of management, for each action. In many cases, particularly for species whose distributions are poorly known, locations will need to be confirmed during future status assessments. For those species requiring the establishment of additional subpopulations in order to meet the requirements of down-listing, suitable areas of habitat may need to be identified and secured before this can occur.

33
Action Plan for Threatened Macropods 2011-2021
A caveat: data for the frequency, intensity and duration of each activity have in most instances been estimated. While attempts were made to base these estimates on knowledge or experience of similar activities, it was often difficult to make accurate estimates. These estimates should be discussed in detail by the relevant recovery teams and other agencies responsible for the implementation of this plan.
Step 4: Provide Rationale for the Proposed Activities
For every action proposed, a rationale for its execution was sought, to ensure that the action is directly relevant to the goal of down-listing, and the stated objectives of recovery.
Step 5: Estimate Cost
The fifth step was to estimate the cost of each project. Costs include all future outlays. Past outlays, such as the cost of building captive breeding facilities that are now available for use, were not considered. Costs were estimated by experts by drawing on information of past experiences and future projections. Again, most costs are rough estimates, and will require detailed assessment by recovery teams and other agencies to confirm full project costs. The cost of some activities, such as the implementation of appropriate fire management across large areas, has been very broadly estimated, such that corrections of one order of magnitude may be necessary.
Several costs were not incorporated in project budgets. These included car travel (purchase, fuel and running costs, food and accommodation) and project management (all aspects of salaries, super, the costs of running an office, including computers, software, administration, and human resources). Importantly, each project was assigned a budget for status assessment (distribution, abundance, genetics), data management, and dedicated monitoring programs. These activities were considered essential in achieving down-listing within ten years, yet are often the most poorly neglected activities of existing recovery programs.
Costs have been estimated independently for each species, and do not account for potential savings where actions in one location will benefit multiple species. The rationale for this is that projects must be undertaken in full in order to achieve the recovery goal. If only some activities are conducted for a species, it is unlikely that the goal will be achieved within the specified time, and the species status may decline even further as a result.
For those recovery projects with species across multiple States and Territories, or with highly complex recovery requirements, the cost of a dedicated recovery program coordinator was incorporated into project costs (Table 4).

34
Action Plan for Threatened Macropods 2011-2021
A dedicated project manager will most likely be required to coordinate recovery for the group of macropods that co-occur on the islands off the Western Australian coast, including the boodie, rufous hare-wallaby, and banded hare-wallaby (combined project cost approximately $54 million11). These 10 species projects are the most expensive recovery projects in this action plan, each with a total cost exceeding $15 million (Table 4).
Where costs have been estimated in the first year, costs for subsequent years were increased by 3% each year to account for the estimated rise in consumer price index (CPI) as a proxy for inflation.
Summed costs for each project have been rounded down to the nearest thousand dollars to avoid the appearance of highly precise estimates of the cost of recovery.
Table 4: Projects with dedicated recovery coordinator salary built in to project cost.
Species Threat Status Project Cost ($millions)
Woylie Critically Endangered $19 millionNorthern bettong Endangered $22 millionBlack-footed rock wallaby Near Threatened $27 millionBrush-tailed rock wallaby Near Threatened $31 millionYellow-footed rock wallaby Near Threatened $20 millionLong-footed potoroo Endangered $20 millionQuokka Vulnerable $24 million
Species that would also benefit from recovery coordination
Boodie Near Threatened $18 millionRufous hare-wallaby Vulnerable $17 millionBanded hare-wallaby Endangered $19 million
gil
Be
rt’
s P
oto
ro
o (p
OtO
rO
us
gil
Be
rti
i). ©
Jir
i lo
ch
Ma
n/l
oc
hM
an
tr
an
sPa
re
nc
ies
11 It is important to note that costs of each species project do not account for shared costs that will provide savings when undertaking common activities for multiple species at the same location.

35
Action Plan for Threatened Macropods 2011-2021
Bla
cK
wa
llar
oo
(ma
cr
Op
us
Be
rn
ar
du
s). ©
Be
lind
a w
rig
ht-o
XFo
rd
sc
ien
tiFic FilM
s/a
us
ca
Pe

36
Action Plan for Threatened Macropods 2011-2021
6. resulTs This Action Plan lists recovery projects for two species listed as critically endangered (CR), five as endangered (EN), two as vulnerable (VU), one as data deficient (DD), and eleven as near threatened (NT). There are an additional 29 Australian species listed as least concern (LC) on the IUCN Red List of Threatened Species (IUCN 2010). These species are not included in this plan.
The proportion of threatened macropod species (CR + EN + VU) of the total number of extant Australian macropods (50) is 18%. When near threatened and data deficient species (NT + DD) are included, this proportion rises to 42%.
The total budget required to down-list all 21 Australian macropods listed as threatened, near threatened or data deficient on the IUCN Red List is approximately $290 million over 10 years (Table 5). Bennett’s tree kangaroo, listed as near threatened, is the least expensive project at about $2.5 million, while the brush-tailed rock wallaby, also listed as near threatened, is the most expensive project at over $31 million (Table 5).
na
Ba
rle
K (p
etr
Og
ale
cO
nc
inn
a).
© J
iri l
oc
hM
an
/lo
ch
Ma
n t
ra
ns
Par
en
cie
s
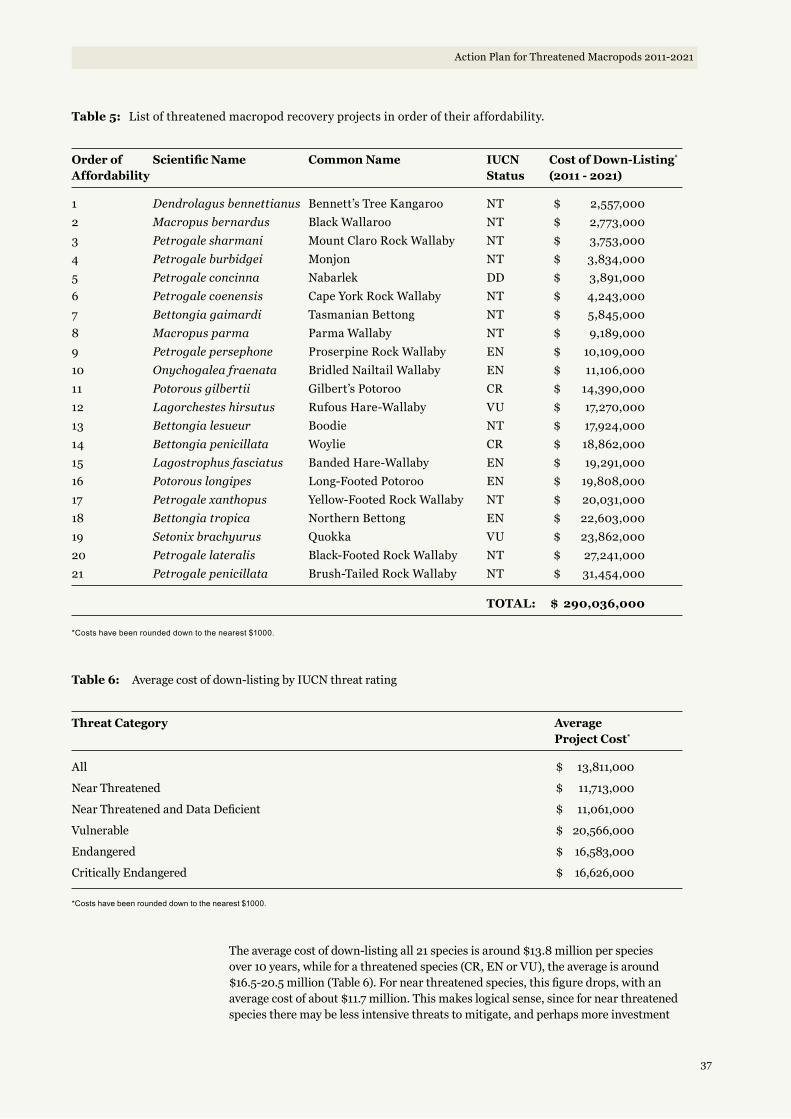
37
Action Plan for Threatened Macropods 2011-2021
Table 5: List of threatened macropod recovery projects in order of their affordability.
Order of Scientific Name Common Name IUCN Cost of Down-Listing* Affordability Status (2011 - 2021)
1 Dendrolagus bennettianus Bennett’s Tree Kangaroo NT $ 2,557,000 2 Macropus bernardus Black Wallaroo NT $ 2,773,000 3 Petrogale sharmani Mount Claro Rock Wallaby NT $ 3,753,000 4 Petrogale burbidgei Monjon NT $ 3,834,000 5 Petrogale concinna Nabarlek DD $ 3,891,000 6 Petrogale coenensis Cape York Rock Wallaby NT $ 4,243,000 7 Bettongia gaimardi Tasmanian Bettong NT $ 5,845,000 8 Macropus parma Parma Wallaby NT $ 9,189,000 9 Petrogale persephone Proserpine Rock Wallaby EN $ 10,109,000 10 Onychogalea fraenata Bridled Nailtail Wallaby EN $ 11,106,000 11 Potorous gilbertii Gilbert’s Potoroo CR $ 14,390,000 12 Lagorchestes hirsutus Rufous Hare-Wallaby VU $ 17,270,000 13 Bettongia lesueur Boodie NT $ 17,924,000 14 Bettongia penicillata Woylie CR $ 18,862,000 15 Lagostrophus fasciatus Banded Hare-Wallaby EN $ 19,291,000 16 Potorous longipes Long-Footed Potoroo EN $ 19,808,000 17 Petrogale xanthopus Yellow-Footed Rock Wallaby NT $ 20,031,000 18 Bettongia tropica Northern Bettong EN $ 22,603,000 19 Setonix brachyurus Quokka VU $ 23,862,000 20 Petrogale lateralis Black-Footed Rock Wallaby NT $ 27,241,000 21 Petrogale penicillata Brush-Tailed Rock Wallaby NT $ 31,454,000
TOTAL: $ 290,036,000
*Costs have been rounded down to the nearest $1000.
Table 6: Average cost of down-listing by IUCN threat rating
Threat Category Average Project Cost*
All $ 13,811,000
Near Threatened $ 11,713,000
Near Threatened and Data Deficient $ 11,061,000
Vulnerable $ 20,566,000
Endangered $ 16,583,000
Critically Endangered $ 16,626,000
*Costs have been rounded down to the nearest $1000.
The average cost of down-listing all 21 species is around $13.8 million per species over 10 years, while for a threatened species (CR, EN or VU), the average is around $16.5-20.5 million (Table 6). For near threatened species, this figure drops, with an average cost of about $11.7 million. This makes logical sense, since for near threatened species there may be less intensive threats to mitigate, and perhaps more investment

38
Action Plan for Threatened Macropods 2011-2021
Qu
oK
Ka
(se
tOn
ix B
ra
ch
yu
ru
s).
© J
ur
ge
n o
tto
/an
tPh
oto
.co
M.a
u

39
Action Plan for Threatened Macropods 2011-2021
Table 7: Number of species projects that could be funded under nominal recovery budgets to achieve down-listing on the IUCN Red List within 10 years if projects are prioritised based on cost.
Budget (10 years) Number of macropod projects funded
$10 million 3$20 million 5$50 million 9$100 million 12$250 million 19$300 million 21
212019181716151413121110
9876543210
$0 $100,000,000 $200,000,000 $300,000,000
Num
ber
of M
acro
pod
Proj
ects
Budget
Figure 1: Number of macropod recovery projects undertaken by spending budgets up to $300 million over 10 years.
required for research questions than for complex on-ground recovery actions. Despite this, there remain some significant project costs for several species that are near threatened, particularly those that are close to qualifying for vulnerable due to low area of occupancy, low extent of occurrence, or low estimates of total numbers in the species, and those that occur across many distinct subpopulations. Such conditions warrant recovery efforts that may incur significant costs, including management across large areas, securing or restoring habitat, and translocation. Recovery projects for the black-footed and the brush-tailed rock wallabies are good examples of expensive projects for near threatened species (Table 5). In the case of the black-footed rock wallaby, the species includes five taxa with quite different conservation issues. Further work will be required to ensure recovery efforts are targeted for optimum outcomes and most efficient use of resources.
If projects are prioritised based on cost, with a nominal 10-year total recovery budget of, say, $10 million, three projects could be funded in their entirety: Bennett’s tree kangaroo, black wallaroo, and Mount Claro rock wallaby (Table 5 & Table 7). With a total macropod recovery budget of $50 million, an additional six species could be down-listed within the same time frame (Table 7). Figure 1 shows the cumulative cost of all projects. The change in the gradient of the curve after the first seven projects reflects the significant costs of the remaining projects, each greater than $9 million dollars over 10 years. This analysis on the basis of cost alone is limited to an assessment of that single factor. No account is made here (Table 7 and Figure 1) of conservation status, nature of threats, or recovery actions required.
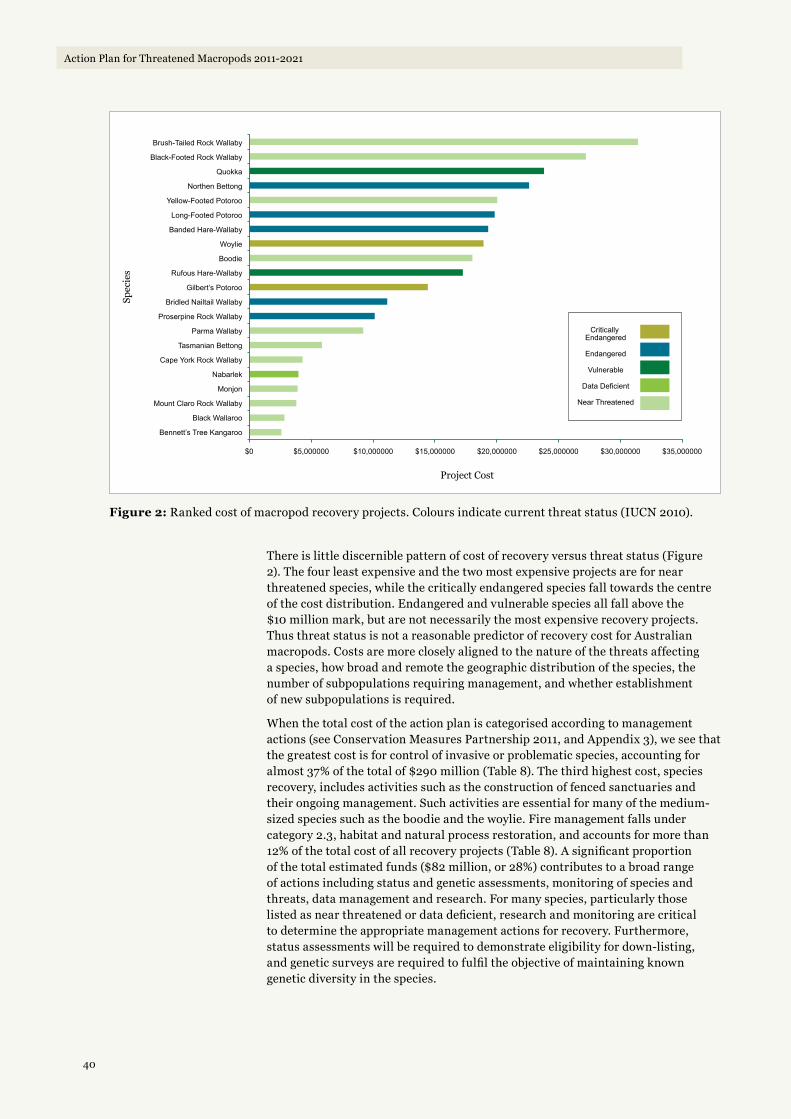
40
Action Plan for Threatened Macropods 2011-2021
Brush-Tailed Rock Wallaby
Black-Footed Rock Wallaby
Quokka
Northen Bettong
Yellow-Footed Potoroo
Long-Footed Potoroo
Banded Hare-Wallaby
Woylie
Boodie
Rufous Hare-Wallaby
Gilbert’s Potoroo
Bridled Nailtail Wallaby
Proserpine Rock Wallaby
Parma Wallaby
Tasmanian Bettong
Cape York Rock Wallaby
Nabarlek
Monjon
Mount Claro Rock Wallaby
Black Wallaroo
Bennett’s Tree Kangaroo
Critically Endangered
Endangered
Vulnerable
Data Deficient
Near Threatened
$0 $5,000000 $10,000000 $15,000000 $20,000000 $25,000000 $30,000000 $35,000000
Project Cost
Spec
ies
Figure 2: Ranked cost of macropod recovery projects. Colours indicate current threat status (IUCN 2010).
There is little discernible pattern of cost of recovery versus threat status (Figure 2). The four least expensive and the two most expensive projects are for near threatened species, while the critically endangered species fall towards the centre of the cost distribution. Endangered and vulnerable species all fall above the $10 million mark, but are not necessarily the most expensive recovery projects. Thus threat status is not a reasonable predictor of recovery cost for Australian macropods. Costs are more closely aligned to the nature of the threats affecting a species, how broad and remote the geographic distribution of the species, the number of subpopulations requiring management, and whether establishment of new subpopulations is required.
When the total cost of the action plan is categorised according to management actions (see Conservation Measures Partnership 2011, and Appendix 3), we see that the greatest cost is for control of invasive or problematic species, accounting for almost 37% of the total of $290 million (Table 8). The third highest cost, species recovery, includes activities such as the construction of fenced sanctuaries and their ongoing management. Such activities are essential for many of the medium-sized species such as the boodie and the woylie. Fire management falls under category 2.3, habitat and natural process restoration, and accounts for more than 12% of the total cost of all recovery projects (Table 8). A significant proportion of the total estimated funds ($82 million, or 28%) contributes to a broad range of actions including status and genetic assessments, monitoring of species and threats, data management and research. For many species, particularly those listed as near threatened or data deficient, research and monitoring are critical to determine the appropriate management actions for recovery. Furthermore, status assessments will be required to demonstrate eligibility for down-listing, and genetic surveys are required to fulfil the objective of maintaining known genetic diversity in the species.

41
Action Plan for Threatened Macropods 2011-2021
Table 8: Cost of all 21 macropod projects by category of management activity (Conservation Measures Partnership 2011). For explanations of the categories, see Appendix 3.
Category Management Action Cost* Percent of Total
2.2 Invasive Species Control $ 112,336,000 38.738 Research, Monitoring and Management $ 82,267,000 28.363.2 Species Recovery $ 35,122,000 12.112.3 Habitat and Natural Process Restoration $ 32,271,000 11.136.4 Conservation Payments $ 14,341,000 4.941.1 Site/Area Protection $ 3,677,000 1.273.4 Ex-situ Conservation $ 3,439,000 1.193.3 Species Reintroduction $ 2,728,000 0.943.1 Species Management $ 2,678,000 0.922.1 Site/Area Management $ 964,000 0.334.3 Awareness and Communications $ 183,000 0.065.2 Policies and Regulations $ 30,000 0.01
Total $ 290,036,000 100
*Costs have been rounded down to the nearest $1000.
Table 9: Most costly category of management action by IUCN threat category, and the combined costs of those actions.
Threat Category Most Costly Category Combined Cost* Average Cost of Management Action per Species*
Near Threatened and Data Deficient Species 2.2 – Invasive Species Control $ 58,508,000 $ 4,875,000Vulnerable Species 2.2 – Invasive Species Control $ 12,696,000 $ 6,348,000Endangered Species 2.2 – Invasive Species Control $ 28,282,000 $ 5,656,000Critically Endangered Species 2.2 – Invasive Species Control $ 12,852,000 $ 6,426,000
*Costs have been rounded down to the nearest $1000.
When species are grouped by IUCN threat category, the most costly category of management action, on average, is Invasive Species Control (Table 9). This is the case regardless of threat category.
When we explore the most costly category of action for each species (Table 10), we see that control and eradication programs for feral and invasive species are the most costly element for 10 of the 21 species. The establishment and management of secure enclosures is the most costly element for the boodie, rufous hare-wallaby, and banded hare-wallaby, which all occur on various islands off the west coast of Western Australia, as well as within enclosures on the mainland. These are all relatively small species that have been particularly susceptible to predation by feral animals such as foxes and cats, and are unlikely to survive outside enclosures without intense and ongoing feral control programs. For six species, monitoring of species and threats is the most costly element of their respective recovery programs. These costs fall between 27 and 38% of project costs, while feral control programs, where they represent the greatest cost in a recovery program, range from 35 to 66% of project costs.
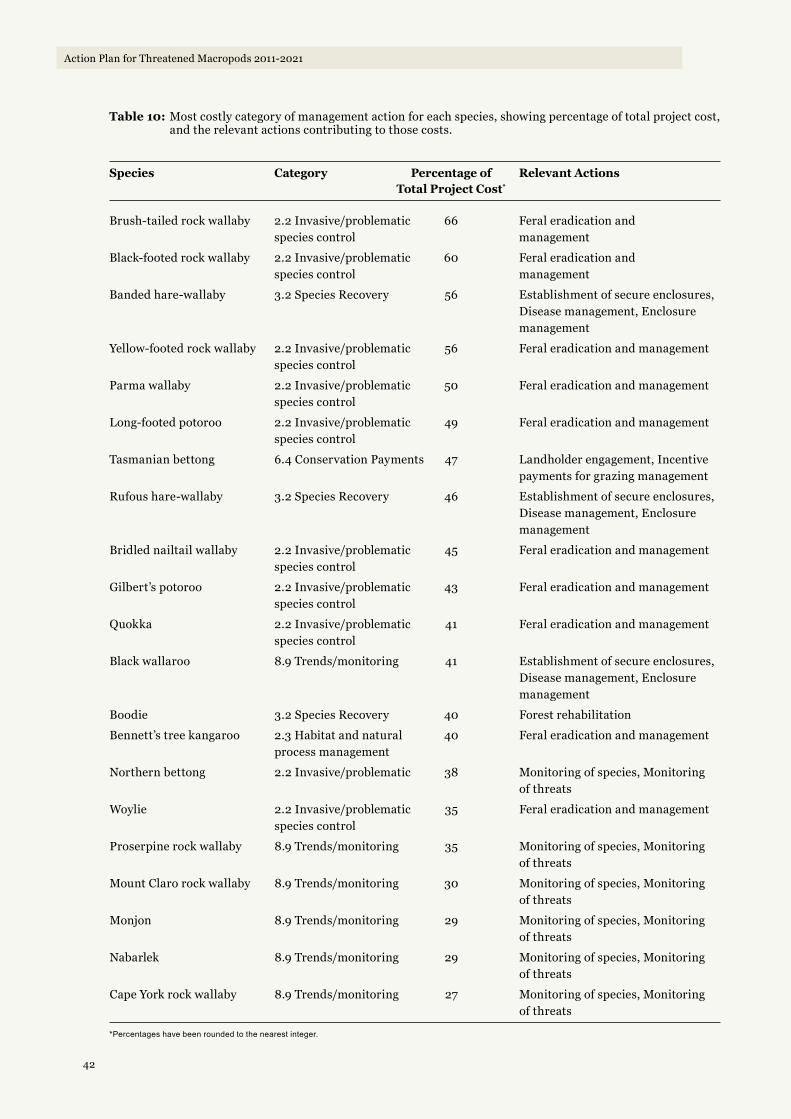
42
Action Plan for Threatened Macropods 2011-2021
Table 10: Most costly category of management action for each species, showing percentage of total project cost, and the relevant actions contributing to those costs.
Species Category Percentage of Relevant Actions Total Project Cost*
Brush-tailed rock wallaby 2.2 Invasive/problematic 66 Feral eradication and species control management
Black-footed rock wallaby 2.2 Invasive/problematic 60 Feral eradication and species control management
Banded hare-wallaby 3.2 Species Recovery 56 Establishment of secure enclosures, Disease management, Enclosure management
Yellow-footed rock wallaby 2.2 Invasive/problematic 56 Feral eradication and management species control
Parma wallaby 2.2 Invasive/problematic 50 Feral eradication and management species control
Long-footed potoroo 2.2 Invasive/problematic 49 Feral eradication and management species control
Tasmanian bettong 6.4 Conservation Payments 47 Landholder engagement, Incentive payments for grazing management
Rufous hare-wallaby 3.2 Species Recovery 46 Establishment of secure enclosures, Disease management, Enclosure management
Bridled nailtail wallaby 2.2 Invasive/problematic 45 Feral eradication and management species control
Gilbert’s potoroo 2.2 Invasive/problematic 43 Feral eradication and management species control
Quokka 2.2 Invasive/problematic 41 Feral eradication and management species control
Black wallaroo 8.9 Trends/monitoring 41 Establishment of secure enclosures, Disease management, Enclosure management
Boodie 3.2 Species Recovery 40 Forest rehabilitation
Bennett’s tree kangaroo 2.3 Habitat and natural 40 Feral eradication and management process management
Northern bettong 2.2 Invasive/problematic 38 Monitoring of species, Monitoring of threats
Woylie 2.2 Invasive/problematic 35 Feral eradication and management species control
Proserpine rock wallaby 8.9 Trends/monitoring 35 Monitoring of species, Monitoring of threats
Mount Claro rock wallaby 8.9 Trends/monitoring 30 Monitoring of species, Monitoring of threats
Monjon 8.9 Trends/monitoring 29 Monitoring of species, Monitoring of threats
Nabarlek 8.9 Trends/monitoring 29 Monitoring of species, Monitoring of threats
Cape York rock wallaby 8.9 Trends/monitoring 27 Monitoring of species, Monitoring of threats
*Percentages have been rounded to the nearest integer.
43
Action Plan for Threatened Macropods 2011-2021
7. disCussion The general failure of species recovery processes to achieve down-listing in threat status for macropods over the last 15 years highlights the importance of immediate, comprehensive and fully-funded action to secure all species and their habitat. Of course down-listing is not the ultimate goal, but a stepping-stone on the way to listing as Least Concern. For many species, full recovery to their historical abundance
and distribution will simply not be possible. While this action plan focuses only on macropods, the plan itself is a strong recommendation that conservation expenditure requirements be made explicit for all threatened species. Rather than deciding how to spend a very limited budget on a large set of problems, this action plan calls for a radical increase in environmental expenditure, based on a careful analysis of the most effective actions.
The total cost of $290 million over 10 years to undertake all 21 macropod recovery projects at first glance appears high, particularly given government expenditure on the national estate and environmental protection. In the 2010-11 financial year, $310 million was allocated to the national estate and parks, and $867 million was allocated to environment protection, a total of $1.177 billion (Australian Government 2010). Compare this to $21 billion for defence, or $3.2 billion for recreation and culture in the same financial year.
If were we to apply the same process to every species listed as threatened on the Australian Government’s Environment Protection and Biodiversity Conservation (EPBC) Act, the sum would likely be far higher. This is not outside the realm of possibility however, and this action plan serves as a strong argument to invest in more strategic, equitable, comparable and measurable recovery planning and implementation.
When using the Project Prioritisation Protocol (Joseph et al. 2009) for threatened species in New Zealand, the Department of Conservation defined their goal as “to improve the security of the greatest possible number of unique species”. Through implementing the PPP, it was determined that the full cost for “securing” 680 species over a period of 50 years was $90 million in the first year, and this dropped off significantly after the first three years once the initial setup costs were met. This list included species such as small flowering plants and invertebrates, many of which have fewer and less costly recovery requirements compared to large vertebrates, and indicates that macropods may be at the “expensive” end of any list that incorporates all nationally threatened species in Australia.
It is important to reiterate that the recovery projects listed in this action plan will not lead to listing as Least Concern, except in the case of the near threatened species. Full down-listing for species currently listed as critically endangered, endangered or vulnerable could take decades, and substantial investment of funds and effort, although critical actions taken early may lead to delisting in the longer term without significant increased expenditure.
This action plan highlights the financial investment required to successfully down-list threatened species, yet does not begin to count the cost of recovering the biodiversity in Australian landscapes from the pressures that humans have applied over the last two centuries. The state of threatened macropods today, and indeed of most threatened species and ecosystems in Australia, is a direct result of human influence. Introduced species, land clearing and degradation, and altered fire patterns have proven powerful forces in changing the nature of our environment. Many native

44
Action Plan for Threatened Macropods 2011-2021
species have not been successful in adapting to this changed environment, resulting in more than 100 extinctions since European settlement, and at least 1600 native species being listed as threatened by the Australian Government (DSEWPAC 2011). Climate change, relatively low and diminishing expenditure on environmental management, increasing human population pressures, and failures of environmental policies and regulations will surely contribute to this problem in the future.
The rationale of this action plan is based on the assertion that in order to recover a species, the full suite of recovery actions prescribed should be undertaken. Experts have recommended a suite of actions that, if undertaken in full, would likely result in the achievement of the project goal: eligibility for down-listing within 10 years. Without substantial use of population models incorporating Bayesian analysis of recovery actions, followed by intensive monitoring and adaptive management, it will be difficult to determine the efficacy of only undertaking part of a prescribed recovery program. To undertake only a portion of these actions is to invite failure.
The recovery planning process across this group of species, including the elicitation of specific actions for each location, highlights critical gaps in our knowledge, as well as gaps in management effectiveness. For instance, there are obvious gaps in knowledge about the status and distribution of many macropod species, as well as knowledge gaps in the nature and severity of threats, particularly fire.
The data collected are also useful in highlighting management actions which are most commonly required for the recovery of threatened macropods. Nineteen of the 21 recovery projects include introduced predator control. The two projects for which this action is unnecessary (Dendrolagus bennettianus and Macropus bernardus) are in fact the two least expensive projects. The prevalent requirement for fox and cat control in this action plan indicates that predation by introduced animals requires renewed investment and research if we are to successfully address this problem, not only for threatened macropods, but for a very broad range of native animals that face the same threat.
In an analysis by Taylor and Booth (2008) it was found that for threatened species recognised as habitat-constrained, only 67% of recovery plans for those species prescribed new protected areas as a recovery action. For the macropod action plan, protection of new areas of habitat is only explicit in eight12 of the 21 projects. However, it is clear from their reasons for listing that for most macropods there are far more pressing threats that must be dealt with to achieve down-listing within 10 years. Predation, competition and altered fire patterns are key. Furthermore, several macropods will require the establishment of new subpopulations if they are to meet the criteria for down-listing. For several species, there are explicit actions to identify suitable areas of habitat for future expansion or translocation. Greater emphasis on these actions will be required in the future as climate and habitats change, and as human developments continue to encroach on wildlife. To be sure, new protected areas will need to be established to achieve the long-term vision of all macropods thriving in the wild, but that approach has not been the focus of this action plan. As Taylor and Booth (2008) conclude, caution should be taken in using threatened species as a basis for prioritisation of reserve system growth generally, due to the biased and incomplete nature of species level data. Ecosystem diversity sampling targets as presently used should remain the main guide for reserve system growth. Suffice to say that more protected areas will be needed in concert with drastic threat abatement if we are to ensure a long legacy of healthy habitats and thriving native species.
This action plan outlines complete recovery projects to meet the goal of down-listing each threatened species. The actions suggested for each recovery project are the minimum set of actions required to secure the species. None of the actions is obsolete, therefore if any of the actions are not funded, the species is unlikely to achieve its goal. For this reason, this action plan does not provide guidance on the relative importance of individual actions within projects.
12 Tasmanian bettong, Bennett’s tree kangaroo, Parma wallaby, Monjon, Cape York rock wallaby, Proserpine rock wallaby, Mount Claro rock wallaby, and Long-footed potoroo.
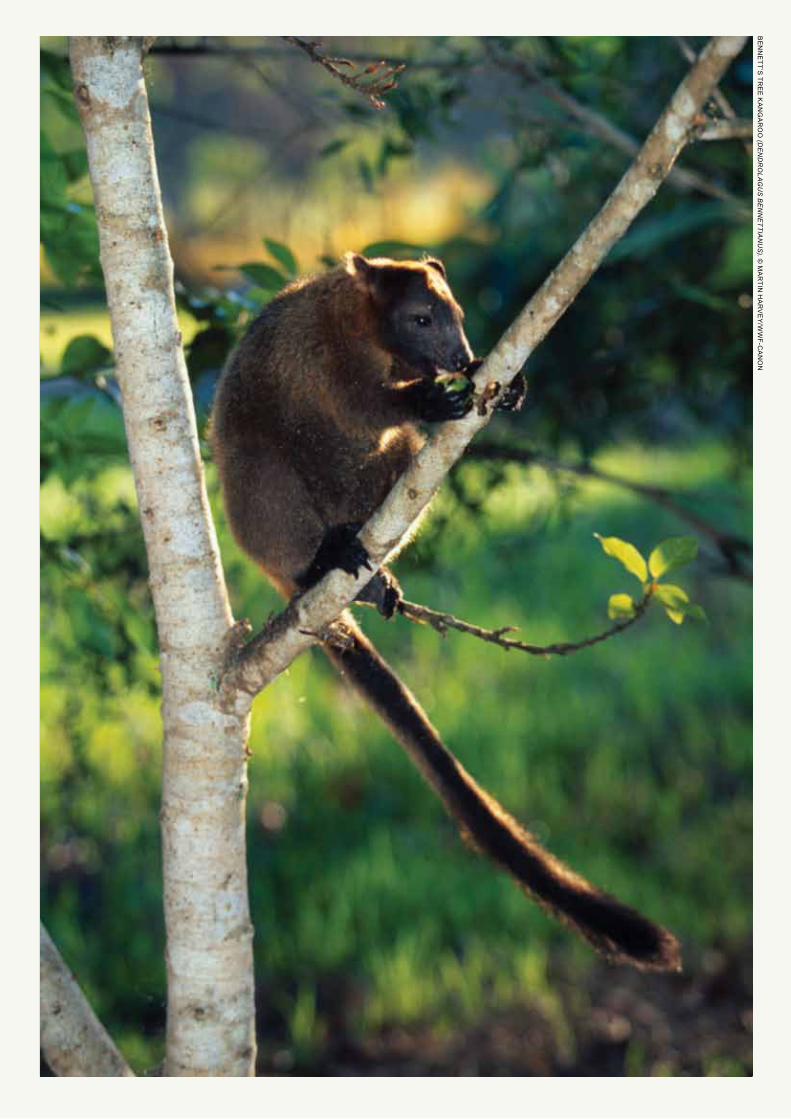
45
Action Plan for Threatened Macropods 2011-2021
Be
nn
et
t’s tr
ee
Ka
ng
ar
oo
(de
nd
rO
lag
us
Be
nn
et
tian
us
). © M
ar
tin h
ar
ve
y/ww
F-ca
no
n

46
Action Plan for Threatened Macropods 2011-2021
8. ConClusion And reCoMMendATions
Little progress has been made over the last 15 years to recover some of Australia’s most iconic species. The status of macropods in Australia can be seen as an indicator of systemic environmental problems that conspire against recovery efforts. No less
than dedicated, fully-funded threatened species recovery projects are required to overcome these problems, and this action plan shows that while the costs are not insignificant, the necessary actions are clear.
The framework of this action plan provides a systematic, transparent, repeatable and objective method for articulating recovery projects to achieve the given goal; in this case, to down-list threatened macropods on the IUCN Red List within 10 years. Clearly stating the steps used to make decisions presents an opportunity to scrutinise and improve the decision-making process; initiates a forum for the explicit examination of management principles and limitations, including the development of unambiguous working objectives; and reveals knowledge gaps and uncertainty in the system. Consequently, the number of species managed and the expected overall benefit to threatened macropods may be increased substantially over business as usual recovery effort.
It is important to reiterate that the costs outlined in this action plan are indicative only, and may be subject to substantial changes once more detailed analysis is undertaken by relevant recovery teams. Of course, costs may also decrease significantly, particularly where several species with the same conservation requirements occur at the same location.
The results of this action plan suggest that for greatest efficiency in the allocation of resources to species conservation, governments need to make explicit decisions about their objectives. As McCarthy et al. (2008) point out, this is at best simply implied in legislation, and is usually ambiguous in either statutes or policy. As a result, recovery decisions are often made not with a strategy for achieving long-term goals or objectives, but rather for satisfying short-term needs or solving immediate problems. Moreover, the allocation of ultimately limited resources should also be undertaken in a considered and objective way across all species, not piecemeal across various levels of management as is the case for most recovery processes.

47
Action Plan for Threatened Macropods 2011-2021
Future RecommendationsRegular reviewFive-yearly reviews have been built in to each recovery project, in light of progress and new information. It is possible that without any management intervention, species not currently threatened may become threatened and species that are threatened will decline further. In order to achieve the vision of this action plan, all species of macropods must be considered, and protected from extinction.
Confidence levelsExperts could be asked to provide confidence levels when determining actions for recovery, as well as their likelihood of success. This would allow for improved sensitivity analyses of recommendations in future iterations of this plan and others that follow.
More detailed expert inputThis is a high-level document that seeks to synthesise the recovery actions for 21 species of Australian macropods. To implement these plans, more detailed elaboration is required, in concert with the recovery team (where one exists), the State Government(s) and other agencies that have principal responsibility for species management, and the latest recovery plans.
While we received many comments on this action plan, there were many experts who made no contribution. If there are large errors in our estimates, we welcome any input that will strengthen this document as a blueprint for the conservation and recovery of threatened Australian macropods.
lon
g-Fo
ote
d P
oto
ro
o (p
OtO
rO
us
lOn
gip
es
). © d
ave
wat
ts/a
ntP
ho
to.c
oM
.au

48
Action Plan for Threatened Macropods 2011-2021
9. reFerenCes Algar, D, and Burrows, ND (2004) Feral cat control research: Western Shield review – February 2003. Conservation Science Western Australia 5(2): 131-163.
Australian Dingo Conservation Association (2008) Objectives of the Austra-lian dingo conservation association. www.dingoconservation.com, accessed 27 May 2010.
Australian Government (2010) Budget Overview 2010-11. Commonwealth of Australia, Canberra. www.budget.gov.au, accessed March 15 2011.
Australian Wildlife Conservancy (2009) AWC wins Biodiversity Award for protecting the endangered Woylie. www.australianwildlife.org, accessed 20 June 2010.
Balmford, A, Gaston, KJ, Blyth, S, James, A and Kapos, V (2003) Global variation in terrestrial conservation costs, conservation benefits, and unmet conservation needs. Proceedings of the National Academy of Sciences of the United States of America 100: 1046-1050.
Bowman, DMJS (1998) The impact of Aboriginal landscape burning on the Australian biota. New Phytologist 140(3): 385-410.
Bowman, DMJS, Garde, M, and Saulwick, A, (2001) Kunj-ken makka man-wurrk, Fire is for kangaroos: interpreting Aboriginal accounts of landscape burning in central Arnhem Land. In: Histories of Old Ages, Essays in honour of Rhys Jones. (ed. O’Connor, S). Pandanus Books, Research School of Pacific and Asian Studies, Australian National University, canberra.
Burbidge, AA, McKenzie, NL (1989) Patterns in the modern decline of Western Australia’s vertebrate fauna: causes and conservation implications. Biological Conservation 50, 143–198.
Burbidge, aa, McKenzie, nl, Brennan, Kec, woinarski, JcZ, dickman, cr, Baynes, a, gordon, g, Menkhorst, Pw and Robinson, AC (2009) Conservation status and biogeography of Australia’s terrestrial mammals. Australian Journal of Zoology 56, 411-422.
Claridge, AW, and Hunt, R (2008) Evaluating the role of the dingo as a trophic regulator: Additional practical suggestions. Ecological Management and Restoration 9(2): 116-119.
Conservation Measures Partnership (2011) Conservation Actions Taxonomy. http://www.conservationmeasures.org/ initiatives/threats-actions-taxonomies/actions-taxonomy, accessed March 15 2011.
Daniels, MJ and Corbett, L (2003) Redefining introgressed protected mammals: When is a wildcat a wild cat and a dingo a wild dog? Wildlife Research 30, 213–218.
Department of Environment and Resource Management (DERM, Queensland) (2009) National recovery plan for the northern bettong Bettongia tropica. Report to Department of the Environment, Water, Heritage and the Arts, Canberra. Department of Environment and Resource Management, Brisbane.
Department of the Environment, Water, Heritage and the Arts (DEWHA) (2008a) Threat abatement plan for competition and land degradation by rabbits. dewha, canberra.
Department of the Environment, Water, Heritage and the Arts (DEWHA) (2008c) Background to the threat abatement plan for competition and land degradation by unmanaged goats. DEWHA, Canberra.
Department of the Environment, Water, Heritage and the Arts (DEWHA) (2010a) Feral animals in Australia. www.environment.gov.au/biodiversity/invasive/ferals, accessed 28 May 2010.
Department of Environment, Water, Heritage and the Arts (DEWHA) (2010b) A bait efficacy trial for the management of cats on Christmas Island. Technical Report Series 200. www.environment.gov.au/biodiversity/invasive/publications/ cat-bait-christmas-island.html, accessed 1 June 2010.
Department of the Environment, Water, Heritage and the Arts (DEWHA) (2010c) Setonix brachyurus in Species Profile and Threats Database, Department of the Environment, Water, Heritage and the Arts, Canberra. www.environment.gov.au/sprat, accessed 1 June 2010.
Department of the Environment, Water, Heritage and the Arts (DEWHA) (2010d) Background information – Commercial kangaroo and wallaby harvest quotas. http://www.environment.gov.au/biodiversity/trade-use/publications/kangaroo/quotas-background.html, accessed 22 June 2010.
Department of Primary Industries and Fisheries (DPIF, Queensland) (2007) Feral pig control in the Wet Tropics. www.dpi.qld.gov.au/documents/Biosecurity_EnvironmentalPests/IPA-Feral-Pigs-Tropics-PA8.pdf, accessed 1 June 2010.
Department of Primary Industries, Parks, Water and Environment (DPIPWE, Tasmania) (2010) Prioritisation of threatened flora and fauna recovery actions for the Tasmanian NRM regions. Nature Conservation Report 10/03. DPIPWE, Hobart.
Department of Sustainability, Environment, Water, Population and Communities (DSEWPAC) (2011) Species Profile and Threats Database. Department of Sustainability, Environment, Water, Population and Communities, Canberra. www.environment.gov.au/sprat, accessed 15 March 2011.
Eldridge, MDB (compiler) (1997) Rock-Wallaby Conservation: Essential data and management priorities. Proceedings of the 1994 national rock-wallaby symposium workshops. Australian Mammalogy 19: 325-330.
Fisher, DO, Blomberg, SP, and Hoyle, SD (2000) Mechanisms of drought-induced population decline in an endangered wallaby. Biological Conservation 102: 107-115.
Fitzgerald, G, Fitzgerald, N and Davidson, C (2007) Public attitudes towards invasive animals and their impacts. invasive animals cooperative research centre, canberra.
Fleming P, Corbett, L, Harden R and Thomson, P (2001) Managing the Impacts of Dingoes and Other Wild Dogs. Bureau of Rural Sciences, Canberra, ACT.
Garnett, S, Crowley, G and Balmford, A (2003) The costs and effectiveness of funding the conservation of Australian threatened birds. Bioscience 53(7): 658-665.
Garnett, ST, McCarthy, MA, and Thompson, CJ (2008) Optimal investment in conservation of species. Journal of Applied Ecology 45: 1428-1435.

49
Action Plan for Threatened Macropods 2011-2021
Geoscience Australia (2000) Landsat 7 Picture Mosaic of Australia. Commonwealth of Australia, Canberra.
Higginbottom, K, Northrope, CL, Croft, DB, Hill, B and Fredline, E (2004) The role of kangaroos in Australian tourism. Australian Mammalogy 26: 23-32.
Holden, C and Mutze, G (2002) Impact of rabbit haemorrhagic disease on introduced predators in the Flinders Ranges, South Australia. Wildlife Re-search 29: 615–626.
Invasive Animal CRC (2010) The feral pig. www.invasiveanimals.com, accessed 1 June 2010.
IUCN (2001) Categories and Criteria (version 3.1). http://www.iucnredlist.org/static/categories_criteria_3_1, accessed 15 November 2010.
IUCN (2010) IUCN Red List of Threatened Species. Version 2010.4. www.iucnredlist.org, accessed 10 March 2011.
James, A, Gaston, KJ, and Balmford, A (2001) Can we afford to conserve biodiversity? BioScience 51: 43-52.
Johnson CN (2006) Australia’s Mammal Extinctions: A 50,000 Year History. cambridge university Press, cambridge, uK.
Johnson CN, Isaac, JL and Fisher, DO (2007) Rarity of a top predator triggers continent-wide collapse of mammal prey: dingoes and marsupials in Australia. Proceedings of the Royal Society of Biological Sciences 274: 341–346.
Joseph, ln, Maloney, rF, o’connor, sM, cromarty, P, Jansen, P, stephens, T and Possingham, HP (2008) Improving methods for allocating resources among threatened species: the case for a new national approach in New Zealand. Pacific Conservation Biology. 14: 154-158
Joseph, LN, Maloney, RF, and Possingham, HP (2009) Optimal allocation of resources among threatened species: a project prioritization protocol. Conser-vation Biology 23: 328-338.
Kinnear, JE, Krebs, CJ, Pentland C, Orell, P, Holme, C and Karvinen, R (2010) Predator-baiting experiments for the conservation of rock-wallabies in Western Australia: a 25-year review with recent advances. Wildlife Research 37: 37-57.
Kennedy, M (1992) Australasian marsupials and monotremes: an action plan for their conservation. International Union for Conservation of Nature and Natural resources, gland.
Langford D and Burbidge AA (2001) Translocation of mala from the Tanami desert, northern territory to trimouille island, western australia. australian Mammalogy 23, 37-46.
Laurance, WF (1997) A distributional survey and habitat model for the endangered northern bettong Bettongia tropica in tropical Queensland. Biological Conservation 82: 47-60.
Letnic M (2007) The impacts of pastoralism on the fauna of arid Australia. In: Animals of Arid Australia: Out on their Own? (eds. Dickman, CR, Lunney, D and Burgin, S) pp. 65–75. Royal Zoological Society of New South Wales, Sydney.
Maxwell, S, Burbidge, AA and Morris, K (1996) The 1996 Action Plan for Australian Marsupials and Monotremes. Wildlife Australia Endangered Species Program, canberra.
McCallum, H, Timmers, P and Hoyle, S (1995) Modelling the impact of predation on reintroductions of bridled nailtail wallabies. Wildlife Research 22: 153-171.
McCarthy, MA, Thompson, CJ, and Garnett, ST (2008) Optimal investment in conservation of species. Journal of Applied Ecology 45: 1428-1435.
Metrick, A and Weitzman, ML (1996) Patterns of behavior in endangered species preservation. Land Economics 7:1-16.
Miller, KL (2010) Future directions for species conservation. KSR Consulting report for WWF-Australia.
Moseby, KE and Read, JL (2005) The efficacy of feral cat, fox and rabbit exclusion fence designs for threatened species protection. Biological Conservation 127: 429-437.
Murray, Jv, low choy, s, Mcalpine, ca, Possingham, hP and goldizen, aw (2006) The importance of ecological scale for wildlife conservation in naturally fragmented environments: A case study of the brush-tailed rock wallaby (Petrogale penicillata). Biological Conservation 141: 7-22.
National Kangaroo Protection Coalition (2009) Kangaroo culling, Australia’s Dirty Secret! www.kangaroo-protection-coalition.com, accessed 15 May 2010.
Newsome, AE, Catling, PC, Cooke, BD and Smyth, R (2001) Two ecological universes separated by the dingo fence in semi-arid Australia: interactions between landscapes, herbivory and carnivory, with and without dingoes. The Rangeland Journal 23: 71–98.
Newspoll, 2010. Importance of and best party to handle major issues, 17-02-2010. www.newspoll.com.au, accessed 14 March 2011.
Pannell, dJ, roberts, aM, Park, g, curatolo, a, Marsh, s and alexander, J (2009) INFFER (Investment Framework For Environmental Resources), INFFER Working Paper 0901, University of Western Australia, Perth.
Possingham, hP, andelman, sJ, noon, Br, trombulak, s and Pulliam, hr (2001) Making smart conservation decisions. Pages 225-244 in Soule, ME and Orians, GH (eds.) Conservation Biology: Research Priorities for the Next decade. island Press, washington.
Robley, AJ, Short, J and Bradley, S (2001) Dietary overlap between the burrow-ing bettong (Bettongia lesueur) and the European rabbit (Oryctolagus cunicu-lus) in semi-arid coastal Western Australia. Wildlife Research 28(4): 341-349.
Russell-Smith, J, Craig, R, Gill, AM, Smith, R and Williams, J (2002) Australia State of the Environment Second Technical Paper Series (Biodiversity), Department of the Environment and Heritage, Canberra. www.ea.gov.au/soe/techpapers/index.html, accessed 3 June 2010.
Salafsky, N, Salzer, A, Stattersfiel, C, Hilton-Taylor, R and Neugarten, S (2008) A standard lexicon for biodiversity conservation: Unified classifications of threats and actions. Conservation Biology 22: 897-911.
Sanderson, EW (2006) How many animals do we want to save? The many ways of setting population target levels for conservation. BioScience 56: 911-922.
Saunders, GR, Gentle, MN and Dickman, CR (2010) The impacts and management of foxes Vulpes vulpes in Australia. Mammal Review 40: 181-211.
Short, J, Bradshaw, SD, Giles, J, Prince, RIT and Wilson, GR (1992) Reintroduction of macropods (Marsupialia, Macropodoidea) in Australia – a review. Biological Conservation 62: 189-204.
Short, J and Milkovits, G (1990) Distribution and status of the brush-tailed rock-wallaby in South-Eastern Australia. Wildlife Research 17: 169–179.
Short, J, and Smith, A (1994) Mammal Decline and Recovery in Australia. Journal of Mammalogy 75(2): 288-297.
Short, J, and Turner, B (1991) Distribution and abundance of spectacled hare-wallabies and euros on Barrow Island, Western Australia. Wildlife Research 18(4): 421-429.
Short, J, and Turner, B (2000) Reintroduction of the burrowing bettong Bettongia lesueur (Marsupialia: Potoroidae) to mainland Australia. Biological Conservation 96: 185-196.
Sigg, DP, Goldizen, AW and Pople, AR (2005) The importance of mating system in translocation programs: reproductive success of released male bridled nailtail wallabies. Biological Conservation 123: 289-300.
Smith, AP and Quin, DG (1996) Patterns and causes of extinction and decline in Australian conilurine rodents. Biological Conservation 77: 243–67.
Southgate, R, Paltridge, R, Masters, P and Carthew, S (2007) Bilby distribution and fire: a test of alternative models of habitat suitability in the Tanami Desert, Australia. Ecography 30: 759–76.
Steffen, W, Burbidge, A, Hughes, L, Kitching, R, Lindenmayer, D, Musgrave, W, Stafford Smith, M and Werner, P (2009a) Australia’s Biodiversity and Cli-mate Change: A strategic assessment of the vulnerability of Australia’s biodiversity to climate change. Summary for Policy Makers. Report to the NRM Ministerial Council. Department of Climate Change, Canberra.
Steffen, W, Burbidge, A, Hughes, L, Kitching, R, Lindenmayer, D, Musgrave, W, Stafford Smith, M and Werner, P (2009b) Australia’s Biodiversity and Climate Change: A strategic assessment of the vulnerability of Australia’s biodiversity to climate change. technical synthesis. report to the nrM Ministerial Council. Department of Climate Change, Canberra..
Sustainable Tourism Cooperative Research Centre (2009) Wildlife Tourism: challenges, opportunities and Managing the Future. www.crctourism.com.au, accessed 27 May 2010.
Taylor, M and Booth, C (2008) Protected area gaps for threatened Australian animals identified from recovery plans. WWF-Australia, Sydney.
Wallach, AD, Murray, BR and O’Neill, AJO (2008) Can threatened species survive where the top predator is absent? Biological Conservation 142: 43-52.
Watson, JEM, Bottrill, MC, Walsh, JC, Joseph, LN and Possingham, HP (2010) evaluating threatened species recovery planning in australia. Prepared on behalf of the Department of the Environment, Water, Heritage and the Arts by the Spatial Ecology Laboratory, University of Queensland. Pp 158.
watson, JeM, evans, Mc, carwardine, J, Fuller, ra Joseph, ln, segan, dB, Taylor, MF, Fensham, RJ and Possingham, HP (2011) The capacity of Aus-tralia’s protected-area system to represent threatened species. conservation Biology, 25:324-332.
Zoos South Australia (2010) Conservation Ark, Conservation Programs, Brush-tailed rock-wallaby. www.zoosa.com.au, accessed 7 June 2010.

50
Action Plan for Threatened Macropods 2011-2021
10. APPendiCesAppendix 1: Acronyms
Acronyms and abbreviations used in the text
AWC Australian Wildlife Conservancy
CPI Consumer Price Index
CR Critically Endangered
CRC Cooperative Research Centre
DD Data Deficient
DERM Department of Environment and Resource Management (Queensland)
DECCW Department of Environment, Climate Change and Water (New South Wales)
DOC Department of Conservation (New Zealand)
DPIF Department of Primary Industries and Fisheries (Queensland)
DPIPWE Department of Primary Industries, Parks, Water and Environment (Tasmania)
DEWHA Department of Environment, Water, Heritage and the Arts (Australia)
DSEWPAC Department of Sustainability, Environment, Water, Population and Communities (Australia)
EN Endangered
EPBC Environment Protection and Biodiversity Conservation
IUCN International Union for Conservation of Nature
NT Near Threatened
OECD Organisation for Economic Co-operation and Development
PPP Project Prioritisation Protocol
VU Vulnerable
WWF World Wide Fund for Nature (formerly World Wildlife Fund)
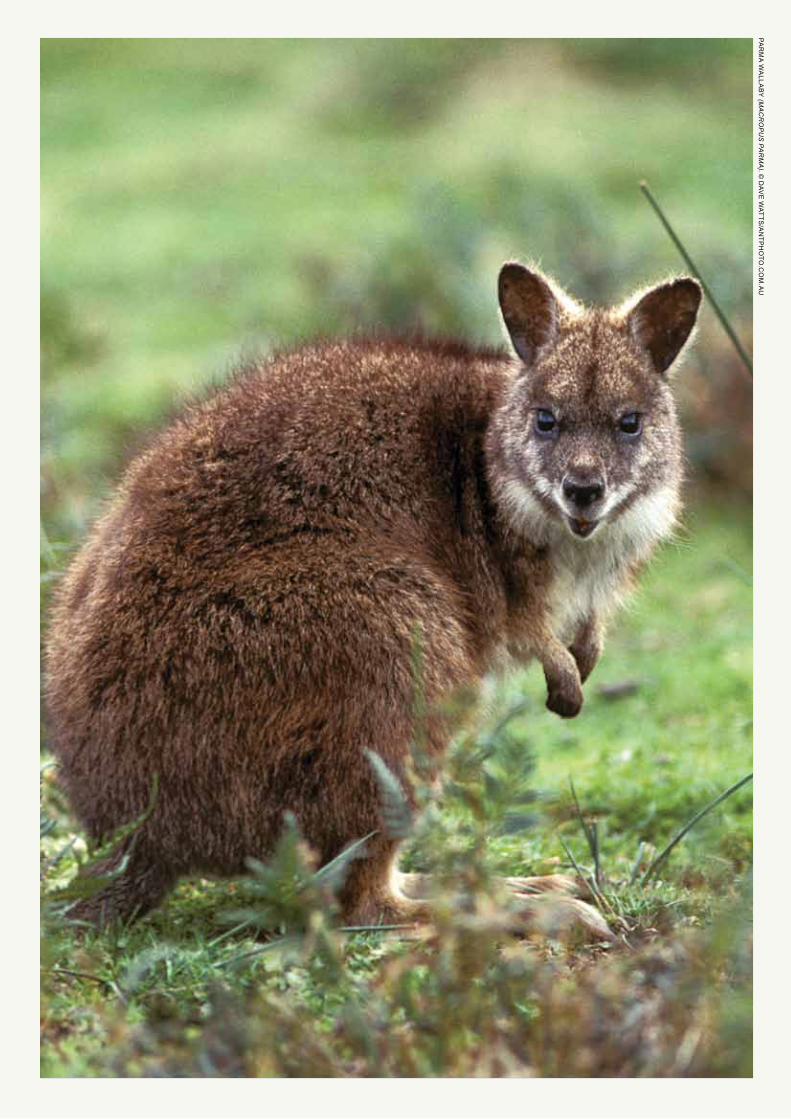
51
Action Plan for Threatened Macropods 2011-2021
Par
Ma
wa
llaB
y (m
ac
rO
pu
s p
ar
ma
). © d
ave
wat
ts/a
ntP
ho
to.c
oM
.au

52
Action Plan for Threatened Macropods 2011-2021
Appendix 2: List of Macropods
List of all extant described macropods in Australia and New Guinea and surrounding islands.
Scientific Name Common NameThreat Status
Population Trend
Geographic Location
IUCN IUCN Criteria
EPBC Act Country* State
Aepyprymnus rufescens Rufous bettong LC Unknown AUS QLD, NSW
Bettongia gaimardi Tasmanian bettong NT Stable AUS TAS
Bettongia lesueur Boodie, burrowing bettong
NT D2 VU Increasing AUS WA, SA, NSW
Bettongia penicillata Woylie, brush-tailed bettong
CR A4be B1ab(iii,v)
EN Declining AUS WA, SA
Bettongia tropica Northern bettong EN +2ab(iii,v) EN Declining AUS QLD
Dendrolagus bennettianus Bennett's tree kangaroo NT Stable AUS QLD
Dendrolagus dorianus Doria's tree kangaroo VU A3cd Declining PNG
Dendrolagus goodfellowi Goodfellow's tree kan-garoo
EN A2cd Declining PNG
Dendrolagus inustus Grizzled tree kangaroo VU A4cd Declining PNG, IND
Dendrolagus lumholtzi Lumholtz's tree kangaroo
LC Stable AUS QLD
Dendrolagus matschiei Matschie's tree kangaroo EN C2a(ii) Declining PNG
Dendrolagus mayri Wondiwoi CR D Unknown IND
Dendrolagus mbaiso Dingiso CR A2cd Declining IND
Dendrolagus notatus Ifola EN A2cd A2cd+A3cd+ A4cd; B1ab
Declining PNG
Dendrolagus pulcherrimus Golden tree kangaroo CR (I,ii,iii,iv,v);C1 Declining IND
Dendrolagus scottae Tenkile, Scott's tree kangaroo
EN A4cd Declining PNG
Dendrolagus spadix Lowland tree kangaroo LC Declining PNG
Dendrolagus stellarum Seri's tree kangaroo VU A2cd Declining PNG
Dendrolagus ursinus Black tree kangaroo VU A2cd Declining IND
Dorcopsis atrata Black dorcopsis CR B1ab(i,iii) Declining PNG
Dorcopsis hageni White-striped dorcopsis LC Stable PNG, IND
Dorcopsis luctuosa Grey dorcopsis VU A4cd Declining PNG, IND
Dorcopsis muelleri Brown dorcopsis LC Stable IND
Dorcopsulus macleayi Macleay's dorcopsis LC Stable PNG
Dorcopsulus vanheurni Small dorcopsis NT Declining PNG, IND
Hypsiprymnodon moschatus
Musky rat-kangaroo LC Stable AUS QLD
Lagorchestes conspicillatus Spectacled hare-wallaby LC VU Declining PNG, AUS QLD, NT, WA
Lagorchestes hirsutus Mala, rufous hare-wallaby VU D2 VU - EN Declining AUS WA
Lagostrophus fasciatus Banded hare-wallaby EN B1ac(iv)+2ac(iv) VU Unknown AUS WA
Macropus agilis Agile wallaby LC Declining AUS, PNG, IND
WA, QLD, NT
Macropus antilopinus Antilopine wallaby LC Declining AUS WA, QLD, NT
Macropus bernardus Black wallaroo NT Unknown AUS NT
Macropus dorsalis Black-striped wallaby LC Declining AUS QLD, NSW
Macropus eugenii Tammar wallaby LC Unknown AUS WA, SA
Macropus fuliginosus Western grey kangaroo LC Increasing AUS WA, SA, VIC, NSW, QLD
Macropus giganteus Eastern grey kangaroo LC Stable AUS QLD, NSW, VIC, TAS
Macropus irma Western brush wallaby LC Stable AUS WA
Macropus parma Parma wallaby NT Unknown AUS QLD, NSW

53
Action Plan for Threatened Macropods 2011-2021
Scientific Name Common NameThreat Status
Population Trend
Geographic Location
IUCN IUCN Criteria
EPBC Act Country* State
Macropus parryi Whiptail wallaby LC Stable AUS QLD, NSW
Macropus robustus Common wallaroo LC Stable AUS All except TAS
Macropus rufogriseus Red-necked wallaby LC Stable AUS QLD, NSW, VIC, SA, TAS
Macropus rufus Red kangaroo LC Stable AUS All except TAS
Onychogalea fraenata Bridled nailtail wallaby EN B1ab(iii) EN Stable AUS QLD, NSW
Onychogalea unguifera Northern nailtail wallaby LC Unknown AUS QLD, NT, WA
Petrogale assimilis Allied rock wallaby LC Stable AUS QLD
Petrogale brachyotis Short-eared rock wallaby LC Unknown AUS NT WA
Petrogale burbidgei Monjon NT Unknown AUS WA
Petrogale coenensis Cape York rock wallaby NT Unknown AUS QLD
Petrogale concinna Nabarlek DD Unknown AUS NT, WA
Petrogale godmani Godman's rock wallaby LC Stable AUS QLD
Petrogale herberti Herbert's rock wallaby LC Unknown AUS QLD
Petrogale inornata Unadorned rock wallaby LC Unknown AUS QLD
Petrogale lateralis Black-footed rock wallaby NT VU Declining AUS NT, SA, WA
Petrogale mareeba Mareeba rock wallaby LC Stable AUS QLD
Petrogale penicillata Brush-tailed rock wallaby NT VU Declining AUS QLD, NSW
Petrogale persephone Proserpine rock wallaby EN B1ab(iii,v) EN Declining AUS QLD
Petrogale purpureicollis Purple-necked rock wallaby
LC Unknown AUS QLD, NT
Petrogale rothschildi Rothschild's rock wallaby LC Unknown AUS WA
Petrogale sharmani Mount Claro rock wallaby NT Stable AUS QLD
Petrogale xanthopus Yellow-footed rock wal-laby
NT VU Unknown AUS QLD, NSW, SA
Potorous gilbertii Gilbert's potoroo CR D CR Stable AUS WA
Potorous longipes Long-footed potoroo EN B1ab(v) EN Unknown AUS VIC, NSW
Potorous tridactylus Long-nosed potoroo LC VU Declining AUS QLD, NSW, VIC, TAS
Setonix brachyurus Quokka VU B1ab(ii,iii) VU Declining AUS WA
Thylogale billardierii Tasmanian pademelon LC Stable AUS TAS
Thylogale browni New Guinea pademelon VU A2d Declining PNG, IND
Thylogale brunii Dusky pademelon VU A4d Declining PNG, IND
Thylogale calabyi Calaby's pademelon EN B1ab(iii,v) +2ab(iii,v)
Declining PNG
Thylogale lanatus Mountain pademelon EN B1ab(v) Declining PNG
Thylogale stigmatica Red-legged pademelon LC Declining AUS, PNG, IND
QLD, NSW
Thylogale thetis Red-necked pademelon LC Stable AUS NSW, QLD
Wallabia bicolor Swamp wallaby LC Increasing AUS QLD, NSW, VIC, SA
*AUS: Australia; PNG: Papua New Guinea; IND: Indonesia

54
Action Plan for Threatened Macropods 2011-2021
Appendix 3: Conservation Actions
Conservation actions taxonomy (Conservation Measures Partnership 2011, www.conservationmeasures.org; Salafsky et al. 2008)
1. Land/Water Protection Actions to identify, establish or expand parks and other legally protected areas
1.1 Site/Area Protection Establishing or expanding public or private parks, reserves, and other protected areas roughly equivalent to IUCN Categories I-VI
1.2 Resource & Habitat Protection Establishing protection or easements of some specific aspect of the resource on public or private lands outside of IUCN Categories I-VI
2. Land/Water Management Actions directed at conserving or restoring sites, habitats and the wider environment
2.1 Site/Area Management Management of protected areas and other resource lands for conservation
2.2 Invasive/Problematic Species Control Controlling and/or preventing invasive and/or other problematic plants, animals, and pathogens
2.3 Habitat & Natural Process Restoration Enhancing degraded or restoring missing habitats and ecosystem functions; dealing with pollution
3. Species Management Actions directed at managing or restoring species, focused on the species of concern itself
3.1 Species Management Managing specific plant and animal populations of concern
3.2 Species Recovery Manipulating, enhancing or restoring specific plant and animal populations, vaccination programs
3.3 Species Re-Introduction Re-introducing species to places where they formally occurred or benign introductions
3.4 Ex-Situ Conservation Protecting biodiversity out of its native habitats
4. Education & Awareness Actions directed at people to improve understanding and skills, and influence behaviour
4.1 Formal Education Enhancing knowledge and skills of students in a formal degree program
4.2 Training Enhancing knowledge, skills and information exchange for practitioners, stakeholders, and other relevant individuals in structured settings outside of degree programs
4.3 Awareness & Communications Raising environmental awareness and providing information through various media or through civil disobedience
5. Law & Policy Actions to develop, change, influence, and help implement formal legislation, regulations, and voluntary standards
5.1 Legislation Making, implementing, changing, influencing, or providing input into formal government sector legislation or polices at all levels: international, national, state/provincial, local, tribal
5.2 Policies & Regulations Making, implementing, changing, influencing, or providing input into policies and regulations affecting the implementation of laws at all levels: international, national, state/provincial, local/community, tribal
5.3 Private Sector Standards & Codes Setting, implementing, changing, influencing, or providing input into voluntary standards & professional codes that govern private sector practice
5.4 Compliance & Enforcement Monitoring and enforcing compliance with laws, policies & regulations, and standards & codes at all levels

55
Action Plan for Threatened Macropods 2011-2021
6. Livelihood, Economic & Other Incentives Actions to use economic and other incentives to influence behaviour
6.1 Linked Enterprises & Livelihood Alternatives Developing enterprises that directly depend on the maintenance of natural resources or provide substitute livelihoods as a means of changing behaviours and attitudes
6.2 Substitution Promoting alternative products and services that substitute for environmentally damaging ones
6.3 Market Forces Using market mechanisms to change behaviours and attitudes
6.4 Conservation Payments Using direct or indirect payments to change behaviours and attitudes
6.5 Non-Monetary Values Using intangible values to change behaviours and attitudes
7. External Capacity Building Actions to build the infrastructure to do better conservation
7.1 Institutional & Civil Society Development Creating or providing non-financial support & capacity building for non-profits, government agencies, communities, and for-profits
7.2 Alliance & Partnership Development Forming and facilitating partnerships, alliances, and networks of organizations
7.3 Conservation Finance Raising and providing funds for conservation work
8. Research Actions (IUCN 2010)
8.1 Taxonomy
8.2 Population Numbers and Range
8.3 Biology and Ecology
8.4 Habitat Status
8.5 Threats
8.6 Uses and Harvest Levels
8.7 Cultural Relevance
8.8 Conservation Measures
8.9 Trends/Monitoring
8.10 Other
wo
ylie, Bru
sh-tailed
Betton
g (B
ettOn
gia pen
icillata). ©
Mar
tin h
arve
y/ antPh
oto
.co
M.au

56
Action Plan for Threatened Macropods 2011-2021
Appendix 4: Yearly Costs
Yearly costs of recovery for each species in order of affordability
Common Name
IUCN Threat Status
Year 1 Year 2 Year 3 Year 4 Year 5 Year 6 Year 7 Year 8 Year 9 Year 10
Bennett's tree kangaroo
NT $160,000 $321,950 $299,782 $374,339 $354,650 $178,125 $229,363 $162,450 $167,324 $309,773
Black wallaroo NT $265,000 $222,850 $233,786 $326,363 $324,298 $232,682 $301,006 $236,243 $243,330 $388,061
Mount Claro rock wallaby
NT $185,000 $322,850 $452,536 $541,676 $544,160 $342,682 $401,006 $267,143 $275,157 $420,841
Monjon NT $295,000 $292,850 $555,886 $400,626 $368,008 $277,702 $628,754 $284,005 $292,525 $438,730
Nabarlek DD $265,000 $332,850 $347,086 $443,062 $444,498 $356,488 $428,526 $367,589 $378,616 $527,404
Cape York rock wallaby
NT $205,000 $467,850 $486,136 $586,284 $559,235 $333,977 $405,341 $343,708 $354,019 $502,069
Tasmanian pademelon
NT $565,000 $583,350 $600,851 $673,512 $646,187 $469,506 $591,055 $498,099 $513,041 $705,005
Parma wallaby NT $235,000 $833,750 $1,083,013 $923,567 $960,018 $886,490 $1,255,805 $929,868 $957,764 $1,123,926
Proserpine rock wallaby
EN $777,000 $826,710 $955,761 $1,049,698 $1,057,979 $1,051,878 $1,189,508 $996,900 $1,010,416 $1,193,721
Bridled nailtail wallaby
EN $933,250 $941,358 $1,030,198 $1,147,064 $1,113,149 $1,086,660 $1,155,081 $1,186,603 $1,187,423 $1,326,064
Gilbert's potoroo CR $1,210,000 $1,230,850 $1,267,776 $1,472,563 $1,456,866 $1,436,082 $1,567,373 $1,523,539 $1,569,245 $1,655,894
Rufous hare-wallaby
VU $867,000 $795,010 $1,906,437 $3,140,498 $3,590,947 $2,296,523 $1,225,402 $1,084,771 $1,096,714 $1,267,045
Boodie NT $2,504,000 $2,481,120 $2,864,668 $1,334,452 $1,547,066 $1,325,600 $1,510,662 $1,378,588 $1,399,346 $1,578,756
Woylie CR $1,678,000 $2,225,040 $2,344,523 $1,959,159 $1,891,510 $1,663,005 $1,693,244 $1,713,163 $1,789,892 $1,905,242
Banded hare-wallaby
EN $625,500 $546,265 $1,682,057 $2,956,374 $4,594,338 $3,335,015 $2,417,208 $983,156 $992,051 $1,159,242
Long-footed potoroo
EN $1,348,500 $1,506,255 $1,946,960 $2,262,864 $2,168,121 $1,952,149 $2,082,357 $2,071,035 $2,133,166 $2,337,106
Yellow-footed rock wallaby
NT $1,750,000 $1,767,750 $1,769,347 $1,953,555 $2,263,600 $1,845,995 $2,044,662 $2,248,210 $2,017,168 $2,371,687
Northern bettong EN $1,970,000 $2,021,400 $2,266,292 $2,469,895 $2,315,244 $2,136,254 $2,271,986 $2,266,352 $2,334,343 $2,551,803
Quokka VU $2,135,000 $2,109,850 $2,348,451 $2,419,835 $2,424,300 $2,262,621 $2,506,165 $2,473,862 $2,417,790 $2,764,650
Black-footed rock wallaby
NT $2,520,000 $2,353,600 $2,309,108 $2,640,636 $3,070,608 $2,467,660 $2,817,961 $2,724,944 $2,685,551 $3,651,643
Brush-Tailed rock wallaby
NT $2,802,000 $2,817,700 $2,754,686 $3,017,626 $3,476,805 $2,944,556 $3,229,911 $3,241,492 $3,217,596 $3,952,502
TOTALS $23,295,250 $25,001,208 $29,505,335 $32,093,647 $35,171,588 $28,881,649 $29,952,376 $26,981,718 $27,032,477 $32,131,166
Bla
cK
-Fo
ote
d r
oc
K w
all
aB
y (p
etr
Og
ale
la
ter
ali
s).
© d
ave
wat
ts/a
ntP
ho
to.c
oM
.au

57
Action Plan for Threatened Macropods 2011-2021
Appendix 5: Recovery Outlines
5. Reasons for listing
Listed as Near Threatened because, although it is considered to be common on Tasmania, the recent introduction of the Red Fox has the potential to be a major threat to this species in the future. The Tasmanian Bettong is thought to have been eliminated from mainland Australia by introduced foxes, and if fox control measures are not successful on Tasmania, this species could face a significant decline in the next ten years (but unlikely to be as great as 30%), thus making the species close to qualifying for Vulnerable under criterion A (Menkhorst 2008).
6. Infraspecific Taxa
6.1 Bettongia gaimardi cuniculus, Tasmania
6.2 Bettongia gaimardi gaimardi, south east Australia, extinct.
7. Range and abundance
Recovery Outline - Bettongia gaimardi
1. Family Potoroidae
2. Scientific name: Bettongia gaimardi (Desmarest, 1822)
3. Common name: Tasmanian bettong, Eastern Rat-kangaroo, Eastern bettong, Gaimard’s bettong, Gaimard’s Rat-kangaroo
4. Conservation status (IUCN): Near Threatened
Figure 3: Known distribution of Bettongia gaimardi from the 2008 Global Mammal Assessment (IUCN 2010; Landsat imagery ©Commonwealth of Australia - Geoscience Australia).
Bettongia gaimardi gaimardi is presumed to be extinct. It was formerly distributed throughout much of the south-eastern Australian mainland, as far north as south-eastern Queensland, but disappeared around the 1920s (Menkhorst 2008).
B. g. cuniculus is widespread and common in eastern Tasmania from sea level up to 1,000 metres. The population is presumed to be stable (Menkhorst 2008).

58
Action Plan for Threatened Macropods 2011-2021
8. Habitat
Found only in open dry sclerophyll forest and woodland with an open understorey, where its density is correlated with the abundance of mycorrhizal fungi (Taylor 1988).
9. Threats
9.1 Potential for fox predation.
9.2 Land clearing, through timber harvesting and excessive grazing of livestock.
9.3 Use of 1080 poison for wallaby control on private land.
9.4 Habitat alteration through inappropriate fire regimes.
10. Information required
10.1 Status assessment of the species, including distribution, abundance, genetic variation, population trend, and risks.
10.2 Further research on appropriate fire regimes for the Tasmanian Bettong.
10.3 Impacts of grazing on bettong habitat are poorly understood.
11. Recovery objectives
11.1 By 2021, Bettongia gaimardi is eligible for listing as Least Concern according to IUCN Red List criteria.
11.2 By 2021, the population trend for Bettongia gaimardi is stable or increasing, and the threat of foxes establishing in Tasmania has been eliminated, thus making Bettongia gaimardi ineligible to qualify as Vulnerable under IUCN criterion A.
11.3 By 2021, fire regimes required for maintaining bettong habitat are known and are being implemented.
11.4 By 2021, the genetic diversity of Bettongia gaimardi has been maintained at known 2011 levels.
12. Actions completed or underway
12.1 Implementation of intensive fox monitoring and control measures throughout Tasmania
13. Management actions required
13.1 Status assessment of the species, including identification of important subpopulations, genetic diversity, and population trend.
13.2 Manage species data to inform adaptive management.
13.3 Implement monitoring protocols for species and predator activity, and effectiveness of management intervention.
13.4 Ongoing Tasmanian fox eradication.
13.5 Investigate optimum fire regimes to maintain Tasmanian bettong habitat, including diverse food sources such as hypogeous fungi.
13.6 Undertake fire management to maintain open understorey and diverse food sources including hypogeous fungi.
13.7 Identify subpopulations of Tasmanian bettong vulnerable to 1080 poisoning and implement measures to reduce use of poison in those areas.
13.8 Identify important subpopulations of Tasmanian bettongs on private land and engage landholders to implement habitat management, including grazing management where applicable.
13.9 Reserve suitable dry sclerophyll habitats where the Tasmanian bettong occurs.
14. Organisations responsible for conservation of species
14.1 Department of Primary Industries, Parks, Water and Environment, Tasmania.
15. Other organisations involved
15.1 None.
16. Staff and financial resources required for recovery to be carried out
16.1 No dedicated staff required.
17. Action costs
17.1 Total cost over 10 years exceeds A$5.8 million.
18. Notes
18.1 None.

59
Action Plan for Threatened Macropods 2011-2021
Table 11: List of recovery actions for Bettongia gaimardi, and the rationale for their contribution to recovery, and effort required.
Subpopulation Action Rationale Frequency Duration Effort
All
Status assessment - distribution and trend. Includes surveys of known subpopulations, and identification of subpopulations of high conservation value.
Whilst the species is relatively secure, information is required to assess those subpopulations most at risk from a range of threats, and to ensure that genetic stock is maintained.
5-Yearly 2 Months 5 People
AllStatus assessment of the species - genetics
5-Yearly 1 Month 3 People
AllManage data to inform adaptive management, including 5-year program review
Good data management is essential to making it possible to extract the maximum amount of information from monitoring data.
3-Monthly 1 Week 1 Person
AllOngoing Tasmanian fox eradication program
The recent introduction of the Red Fox has the potential to be a major threat to this species in the future. The Tasmanian Bettong is thought to have been eliminated from mainland Australia by introduced foxes, and if fox control measures are not successful on Tasmania, this species could face a significant decline in the next ten years.
NA - Currently implemented by DPIPWE
NA - Currently implemented by DPIPWE
NA - Currently implemented by DPIPWE
All
Investigate optimum fire regimes to maintain Tasmanian bettong habitat, including diverse food sources such as hypogeous fungi.
Research is required to better understand the dynamics of fire in bettong habitat, and the impact it has on food availability, including fungi.
Once 3 Years 1 Person
Priority subpopulations (as identified in status assessment)
Undertake fire management to maintain open understorey
Bettongs inhabit open, dry, fire-prone forests with a grassy or heath understorey on poor soils. Fire management in bettong habitats may be required to maintain optimum conditions.
Yearly 2 Weeks 50 People
AllProhibit the use of 1080 poison in or near areas containing isolated populations of bettongs.
Bettongs may be subject to poison baits laid out for native species to deter them from impacting new forestry sites. Such poisoning represents a small but ongoing threat.
Once 2 Months 2 People
Priority subpopulations (as identified in status assessment)
Engage landholders in areas where grazing could pose a threat to bettong habitat, and provide incentives to manage accordingly. Grazing will have to be assessed as a threat in the first instance.
With the highest densities occurring on private land, it is important that property owners manage remaining vegetation to allow the continued existence of the bettong.
Yearly 1 Year 2 People
Priority subpopulations (as identified in status assessment)
Reserve suitable dry sclerophyll habitat
Little of the bettong's habitat is protected within reserves. Sufficient habitat will be required to ensure the ongoing security of the species.
Once 1 Year 1 Person
All
Develop and implement monitoring protocols for species and predator activity, and effectiveness of management intervention.
A long-term consistent and cohesive approach to regular monitoring is essential to inform adaptive management strategies
Yearly 1 Month 4 People
19. References
IUCN (2010) IUCN Red List of Threatened Species. Version 2010.2. http://www.iucnredlist.org. Accessed 29 June 2010.
Menkhorst, P (2008) Bettongia gaimardi. In: IUCN (2010) IUCN Red List of Threatened Species. Version 2010.2. http://www.iucnredlist.org/apps/redlist/details/2783/0. Accessed 29 June 2010.
Taylor, RJ (1988) Ecology and conservation of the Tasmanian bettong (Bettongia gaimardi). Report, Australian National Parks and Wildlife Service: Canberra.
20. Comments received from
20.1 Michael Driessen, Department of Primary Industries, Parks, Water and Environment, Tasmania.

60
Action Plan for Threatened Macropods 2011-2021
Tab
le 1
2: L
ist o
f rec
over
y ac
tion
s fo
r B
etto
ngia
gai
mar
di, a
nd t
heir
cos
ts
Su
bp
op
ula
tio
nA
ctio
nY
ear
1#Y
ear
2Y
ear
3Y
ear
4Y
ear
5Y
ear
6Y
ear
7Y
ear
8Y
ear
9Y
ear
10
All
Stat
us a
sses
smen
t - d
istr
ibut
ion
and
abun
danc
e.
Incl
udes
sur
veys
of k
now
n su
bpop
ulat
ions
, an
d id
enti
ficat
ion
of s
ubpo
pula
tion
s of
hig
h co
nser
vati
on v
alue
.
$90,
000
$0$0
$98,
345
$0$0
$107
,464
$0$0
$117
,430
All
Stat
us a
sses
smen
t of t
he s
peci
es -
gene
tics
$30,
000
$0$0
$0$3
3,76
5$0
$0$0
$0$3
9,14
3
All
Man
age
data
to in
form
ada
ptiv
e m
anag
emen
t, in
clud
ing
5-ye
ar p
rogr
am r
evie
w$5
,000
$5,1
50$5
,305
$5,4
64$2
5,62
8*$5
,796
$5,9
70$6
,149
$6,3
33$2
6,52
3*
All
Ong
oing
Tas
man
ian
fox
erad
icat
ion
prog
ram
$0†
$0$0
$0$0
$0$0
$0$0
$0
All
Inve
stig
ate
opti
mum
fire
reg
imes
to m
aint
ain
Tasm
ania
n be
tton
g ha
bita
t, in
clud
ing
dive
rse
food
so
urce
s su
ch a
s hy
poge
ous
fung
i.$3
0,00
0$3
0,90
0$3
1,82
7$0
$0$0
$0$0
$0$0
Prio
rity
sub
popu
lati
ons
(as
iden
tifie
d in
sta
tus
asse
ssm
ent)
Und
erta
ke fi
re m
anag
emen
t to
mai
ntai
n op
en
unde
rsto
rey
$100
,000
$103
,000
$106
,090
$109
,273
$112
,551
$115
,927
$119
,405
$122
,987
$126
,677
$130
,477
All
Ban
use
of 1
080
in T
asm
ania
, exc
ept w
here
fox
pres
ence
is s
uspe
cted
$10,
000
$10,
300
$10,
609
$0$0
$0$0
$0$0
$0
Prio
rity
sub
popu
lati
ons
(as
iden
tifie
d in
sta
tus
asse
ssm
ent)
Eng
age
land
hold
ers
in a
reas
whe
re g
razi
ng is
a
thre
at to
bet
tong
hab
itat
, and
pro
vide
ince
ntiv
es to
m
anag
e ac
cord
ingl
y.$2
40,0
00$2
47,2
00$2
54,6
16$2
62,2
54$2
70,1
22$2
78,2
26$2
86,5
73$2
95,1
70$3
04,0
25$3
13,1
46
Prio
rity
sub
popu
lati
ons
(as
iden
tifie
d in
sta
tus
asse
ssm
ent)
Res
erve
sui
tabl
e dr
y sc
lero
phyl
l hab
itat
$0$1
25,0
00$1
28,7
50$1
32,6
13$1
36,5
91$0
$0$0
$0$0
All
Dev
elop
and
impl
emen
t mon
itori
ng p
roto
cols
for
spec
ies
and
pred
ator
act
ivit
y, a
nd e
ffec
tive
ness
of
man
agem
ent i
nter
vent
ion.
$60,
000
$61,
800
$63,
654
$65,
564
$67,
531
$69,
556
$71,
643
$73,
792
$76,
006
$78,
286
YE
AR
LY
TO
TA
LS
$565
,00
0$5
83,3
50$6
00,
851
$673
,512
$646
,187
$469
,50
6$5
91,0
55$4
98,0
99$5
13,0
41$7
05,0
05
GR
AN
D T
OT
AL
$5,
84
5,6
06**
#Not
e th
at a
n in
dex
of 3
% h
as b
een
appl
ied
to e
ach
succ
essi
ve y
ear o
f fun
ding
to a
ccou
nt fo
r CP
I
*Inc
lude
s 5-
year
pro
gram
revi
ew
†cos
ts a
lread
y co
vere
d by
tas
man
ian
and
aus
tral
ian
gov
ernm
ents
.
**C
osts
may
be
sign
ifica
ntly
def
raye
d by
exi
stin
g D
PIP
WE
pro
gram
s.

61
Action Plan for Threatened Macropods 2011-2021
Recovery Outline - Bettongia lesueur
1. Family Potoroidae
2. Scientific name: Bettongia lesueur (Quoy & Gaimardi, 1824)
3. Common name: Burrowing bettong, boodie, Lesueur’s rat kangaroo
4. Conservation status (IUCN): Near Threatened
5. Reasons for listing
Listed as Near Threatened because its extent of occurrence is small and it is known from just six-eight locations, making it close to qualifying for Vulnerable under criterion B1. The natural populations of this species are considered stable and reintroduced populations are increasing, habitat for the species is considered stable, and although there are major threats potentially from introduced predators, fire, and disease, this species has genuinely improved in status since the prior assessment. The species occurs naturally on three islands, and has been introduced to another five localities. There is, however, uncertainty as to whether two of these reintroduction sites can be counted as “self-sustaining”, and thus be included in the number of locations used in the assessment. This species is also close to qualifying as having “extreme fluctuations” in population, which would also qualify it for a threatened category (Richards et al. 2008).
Listed as Vulnerable under the Australian Government Environment Protection and Biodiversity Conservation Act (1999) (DEWHA 2010).
6. Infraspecific Taxa
6.1 Bettongia lesueur lesueur – Bernier, Dorre and Faure Islands, Heirisson Prong (Vulnerable, EPBC Act 1999).
6.2 Bettongia lesueur unnamed subspecies – Barrow and Boodie Islands (Vulnerable EPBC, Act 1999).
6.3 Bettongia lesueur graii - Burrowing Bettong (inland), Boodie (Extinct).
7. Range and abundance
Figure 4: Known distribution of Bettongia lesueur from the 2008 Global Mammal Assessment (IUCN 2010; Landsat imagery ©Commonwealth of Australia - Geoscience Australia).

62
Action Plan for Threatened Macropods 2011-2021
Formerly the most widespread of all potoroids, the range of the burrowing bettong extended southeast from near Broome, Western Australia, through the Northern Territory, South Australia, western New South Wales to north-western Victoria. It is now extinct in free-ranging situations on the mainland, but still occurs on Bernier, Dorre, Barrow, and Boodie Islands of the Western Australian coast (Claridge et al. 2007).
It is abundant on Barrow (total 3,400 individuals) (Short et al. 1993), Bernier (total of 842 individuals), and Dorre (3,292 individuals) (Reinhold 2010) The populations on Bernier and Dorre Islands (and presumably Barrow Island and possibly mainland populations) are known to undergo extreme fluctuations in response to rainfall and drought (Short et al. 1997). For example, the Dorre Island population declined to critically low levels in 2007 after an extended dry period (N. Thomas, pers. comm.).
Estimates for the reintroduced island populations are as follows:
Boodie Island: perhaps as many as 100, with a high degree of uncertainty (J. Short, pers. comm.).
Faure Island: more than 900 at last count (J. Short, pers. comm.).
Dirk Hartog Island: extinct (Burbidge and Short 2008).
Reintroduced mainland populations include:
Arid Recovery: 500 (Reference required).
Scotia sanctuary: about 300 (M. Hayward, pers. comm..)
Heirisson Prong: more than 400 at last count (J. Short, pers. comm.).
8. Habitat On the mainland, warrens were constructed in most types of country where the soil was deep enough. Loams were favoured and in the sand-ridge deserts burrows were constructed in the low-lying areas. Burrows were often dug into slight outcrops of limestone or gypseous rock, and rises in salt-lake systems were a favoured habitat. Another favoured site was under boulders or capping rock. On Barrow Island, warrens are almost always associated with limestone cap-rock on slopes and the top of ridges; some are in the floors of caves. Old, collapsed warrens are still abundant and obvious in non-sandy soils throughout much of arid Australia (Burbidge and Short 2008).
9. Threats
9.1 Predation by foxes and feral cats.
9.2 Major fire events.
9.3 Introduction of invasive species.
9.4 Potential for disease introduction to islands.
9.5 Inappropriate recreation activity or development.
10. Information required
10.1 Review of translocations, including factors influencing success and failure.
10.2 Investigation of burrowing bettong management to control excessive population growth where resources are limited.
11. Recovery objectives
11.1 By 2021, Bettongia lesueur is eligible for listing as Least Concern according to IUCN Red List criteria.
11.2 By 2021, the number of distinct secure* subpopulations of Bettongia lesueur is greater than 10, thus making it ineligible to qualify as Vulnerable under IUCN criterion B1.
11.3 By 2021, management plans have been developed and are being implemented to reduce the threats of introduced predators, fire, disease and unpredictable resource availability for all Bettongia lesueur subpopulations.
11.4 By 2021, the genetic diversity of Bettongia lesueur has been maintained at known 2011 levels.
* A taxon is defined as secure when its numbers and distribution are stable or increasing, and when numbers and distribution are sufficient that there is a 95% probability that the species will survive the stochastic events anticipated over a 50 year timeframe, given that all known and predicted threats are adequately mitigated.
12. Actions completed or underway
12.1 Translocations to Heirisson Prong, Faure Island, Roxby Downs, Scotia, Yookamurra and Lorna Glen.
12.2 Translocations to Dryandra have failed on three occasions and are unlikely to be continued (J. Short, pers. comm.).
63
Action Plan for Threatened Macropods 2011-2021
12.3 Management of captive subpopulations at Dryandra, Scotia, Yookamurra, Roxby Downs and Lorna Glen.
12.4 Studies into the taxonomic identity are long completed but are yet to be written (J. Short, pers. comm.).
12.5 A recovery plan for the species has been developed for the 2007-2011 period (Richards 2007).
12.6 Dryandra Breeding Facility is in the process of being closed at the time of writing due to lack of funding and unsuccessful introduction attempts that failed in part due to predation by foxes and cats (N. Thomas, pers. comm.)
12.7 Systematic monitoring of boodies has been undertaken by CSIRO (1988 to 1989) and more recently by DEC (2006 to 2010, Bernier and Dorre islands only).
12.8 A site at Lagoon point has been fenced with the potential for future introduction of the species to establish a new subpopulation (J. Short, pers. comm.)
13. Management actions required
13.1 Status assessment of the species, including genetic diversity, abundance, distribution, population trend and risks.
13.2 Manage species data to inform adaptive management.
13.3 Use of population viability analysis to compare the viability of ‘wild’ subpopulations.
13.4 Monitor species at all sites throughout range, including future translocation sites.
13.5 Control or exclude invasive predators on islands where ‘wild’ subpopulations occur.
13.6 Control or exclude competitors on islands where ‘wild’ subpopulations occur.
13.7 Implement hygiene and quarantine protocols for all subpopulations to control disease.
13.8 Control and manage weeds on Bernier, Dorre, Boodie, Barrow and Faure Islands.
13.9 Control and manage visitors to Bernier, Dorre, Boodie and Barrow islands.
13.10 Implement management to avoid catastrophic wildfires for all subpopulations.
13.11 Maintenance of fence enclosures at Scotia, Yookamurra, Roxby Downs, Heirisson Prong and Lorna Glen.
13.12 Survey habitat at potential future translocation sites to ensure suitability for burrowing bettongs.
13.13 Establish fenced sanctuaries for future translocations. Possible sites include Mount Gibson (WA) and Lagoon Point near Shark Bay (WA).
13.14 Implement threat reduction activities at proposed translocation sites, including predator and competitor eradication and exclusion, fire management
13.15 Continue management of secure subpopulations as potential sources for future genetically diverse translocations.
13.16 Translocate burrowing bettongs from existing sites to new secure areas to establish new subpopulations throughout former range.
13.17 Enhance community participation and education.
14. Organisations responsible for conservation of species
14.1 Department of Environment and Conservation (DEC), Western Australia.
15. Other organisations involved
15.1 Australian Wildlife Conservancy (AWC).
15.2 Arid Recovery Project, Roxby Downs.
15.3 Useless Loop Community Biosphere Project Group, Heirisson Prong.
16. Staff and financial resources required for recovery to beW carried out
16.1 No dedicated staff required. Many staff are already employed at various sanctuaries.
17. Action costs
17.1 Total cost over 10 years exceeds A$17 million.
18. Notes
18.1 None.
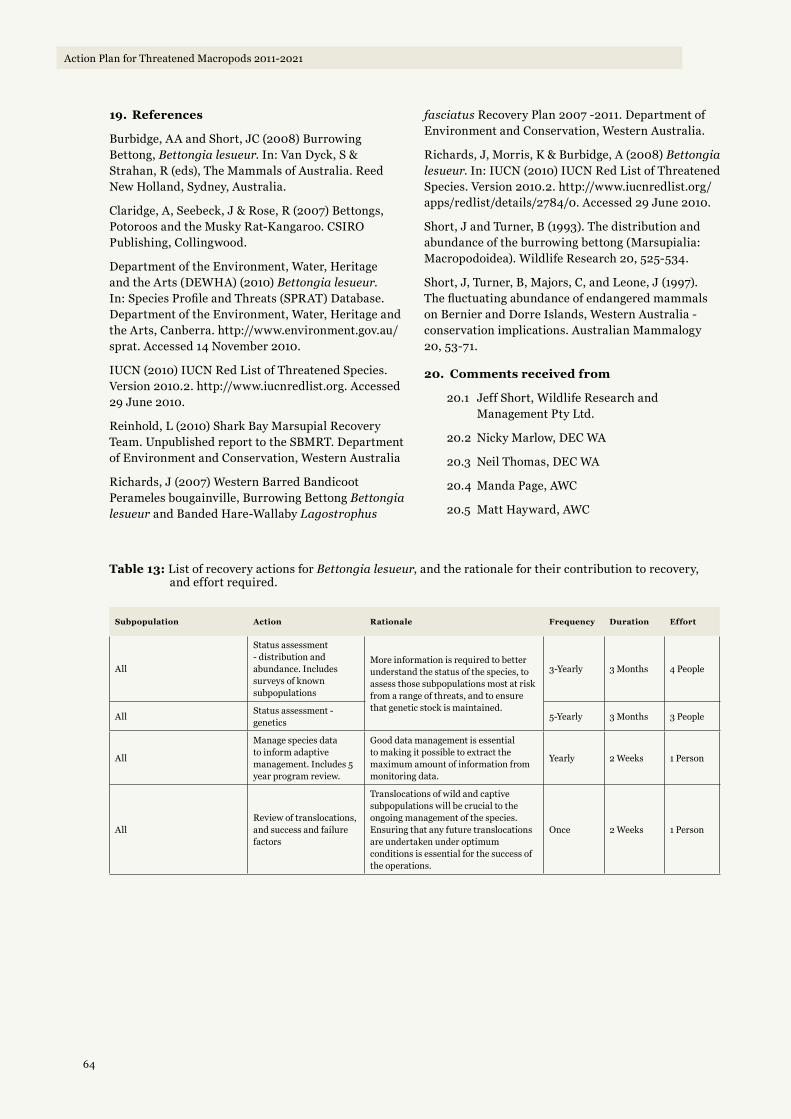
64
Action Plan for Threatened Macropods 2011-2021
19. References
Burbidge, AA and Short, JC (2008) Burrowing Bettong, Bettongia lesueur. In: Van Dyck, S & Strahan, R (eds), The Mammals of Australia. Reed New Holland, Sydney, Australia.
Claridge, A, Seebeck, J & Rose, R (2007) Bettongs, Potoroos and the Musky Rat-Kangaroo. CSIRO Publishing, Collingwood.
Department of the Environment, Water, Heritage and the Arts (DEWHA) (2010) Bettongia lesueur. In: Species Profile and Threats (SPRAT) Database. Department of the Environment, Water, Heritage and the Arts, Canberra. http://www.environment.gov.au/sprat. Accessed 14 November 2010.
IUCN (2010) IUCN Red List of Threatened Species. Version 2010.2. http://www.iucnredlist.org. Accessed 29 June 2010.
Reinhold, L (2010) Shark Bay Marsupial Recovery Team. Unpublished report to the SBMRT. Department of Environment and Conservation, Western Australia
Richards, J (2007) Western Barred Bandicoot Perameles bougainville, Burrowing Bettong Bettongia lesueur and Banded Hare-Wallaby Lagostrophus
fasciatus Recovery Plan 2007 -2011. Department of Environment and Conservation, Western Australia.
Richards, J, Morris, K & Burbidge, A (2008) Bettongia lesueur. In: IUCN (2010) IUCN Red List of Threatened Species. Version 2010.2. http://www.iucnredlist.org/apps/redlist/details/2784/0. Accessed 29 June 2010.
Short, J and Turner, B (1993). The distribution and abundance of the burrowing bettong (Marsupialia: Macropodoidea). Wildlife Research 20, 525-534.
Short, J, Turner, B, Majors, C, and Leone, J (1997). The fluctuating abundance of endangered mammals on Bernier and Dorre Islands, Western Australia - conservation implications. Australian Mammalogy 20, 53-71.
20. Comments received from
20.1 Jeff Short, Wildlife Research and Management Pty Ltd.
20.2 Nicky Marlow, DEC WA
20.3 Neil Thomas, DEC WA
20.4 Manda Page, AWC
20.5 Matt Hayward, AWC
Table 13: List of recovery actions for Bettongia lesueur, and the rationale for their contribution to recovery, and effort required.
Subpopulation Action Rationale Frequency Duration Effort
All
Status assessment - distribution and abundance. Includes surveys of known subpopulations
More information is required to better understand the status of the species, to assess those subpopulations most at risk from a range of threats, and to ensure that genetic stock is maintained.
3-Yearly 3 Months 4 People
AllStatus assessment - genetics
5-Yearly 3 Months 3 People
All
Manage species data to inform adaptive management. Includes 5 year program review.
Good data management is essential to making it possible to extract the maximum amount of information from monitoring data.
Yearly 2 Weeks 1 Person
AllReview of translocations, and success and failure factors
Translocations of wild and captive subpopulations will be crucial to the ongoing management of the species. Ensuring that any future translocations are undertaken under optimum conditions is essential for the success of the operations.
Once 2 Weeks 1 Person

65
Action Plan for Threatened Macropods 2011-2021
Subpopulation Action Rationale Frequency Duration Effort
Bernier and Dorre Islands
Implement monitoring protocols for species activity, predator activity, and effectiveness of management intervention.
Monitoring is essential to ensure adaptive management and achieving the species objectives
6-Monthly 3 Weeks 4 People
Faure Island 6-Monthly 2 Weeks 4 People
Barrow Island 6-Monthly 2 Weeks 4 People
Boodie Island 6-Monthly 1 Week 2 People
Heirisson Prong 6-Monthly 2 Weeks 2 People
Scotia Sanctuary - Stage 1 3-Monthly 2 Weeks 4 People
Yookamurra Sanctuary 6-Monthly 1 Week 2 People
Roxby Downs Arid Recovery Reserve
4-Monthly 2 Weeks 2 People
Lorna Glen 4-Monthly 2 Weeks 2 People
Reintroduction Site - Scotia Stage 3
3-Monthly 2 Weeks 4 People
Reintroduction Site - Mount Gibson Sanctuary
6-Monthly 2 Weeks 4 People
Reintroduction Site - Site Z (Lagoon Point?)
6-Monthly 2 Weeks 4 People
Bernier and Dorre Islands (habitat condition only)
Implement monitoring protocols for fire management and habitat condition, and effectiveness of management intervention.
Yearly 3 Weeks 4 People
Faure Island Yearly 1 Week 4 People
Barrow Island Yearly 1 Week 4 People
Boodie Island Yearly 1 Week 2 People
Heirisson Prong (habitat condition only)
Yearly 1 Week 2 People
Scotia Sanctuary - Stage 1 Yearly 1 Week 4 People
Yookamurra Sanctuary Yearly 1 Week 2 People
Roxby Downs Arid Recovery Reserve
Yearly 1 Week 2 People
Lorna Glen Yearly 1 Week 2 People
Reintroduction Site - Scotia Stage 3
Yearly 1 Week 4 People
Reintroduction Site - Mount Gibson Sanctuary
Yearly 1 Week 4 People
Reintroduction Site - Site Z (Lagoon Point?)
Yearly 1 Week 4 People
Bernier Island Prevent unauthorised human visitation to exclude invasive predators and competitors, and to prevent wildfires and disease incursion.
The influx of unauthorised visitors to these islands could introduce feral species or contribute to habitat degradation through fire and other stressors.
Monthly 1 Week 2 People
Dorre Island Monthly 1 Week 2 People
Faure Island Monthly 1 Week 2 People
Boodie Island Monthly 1 Day 2 People
Barrow Island Monthly 1 Month 4 People
Island Predator Removal Predator control
Predation by foxes and cats is regarded as the primary reason for the decline of the burrowing bettong on mainland Australia and the primary threat to the persistence of reintroduced mainland Australia. Their potential vulnerability on their remaining island refuges is illustrated by the loss of bettongs from Dirk Hartog Island early this century and from Boodie Island in 1985. The former is thought to have been due to predation by feral cats, and the latter was due to a rat eradication program in 1984 that unintentionally eradicated the bettongs.
Unknown 6 Months 4 People
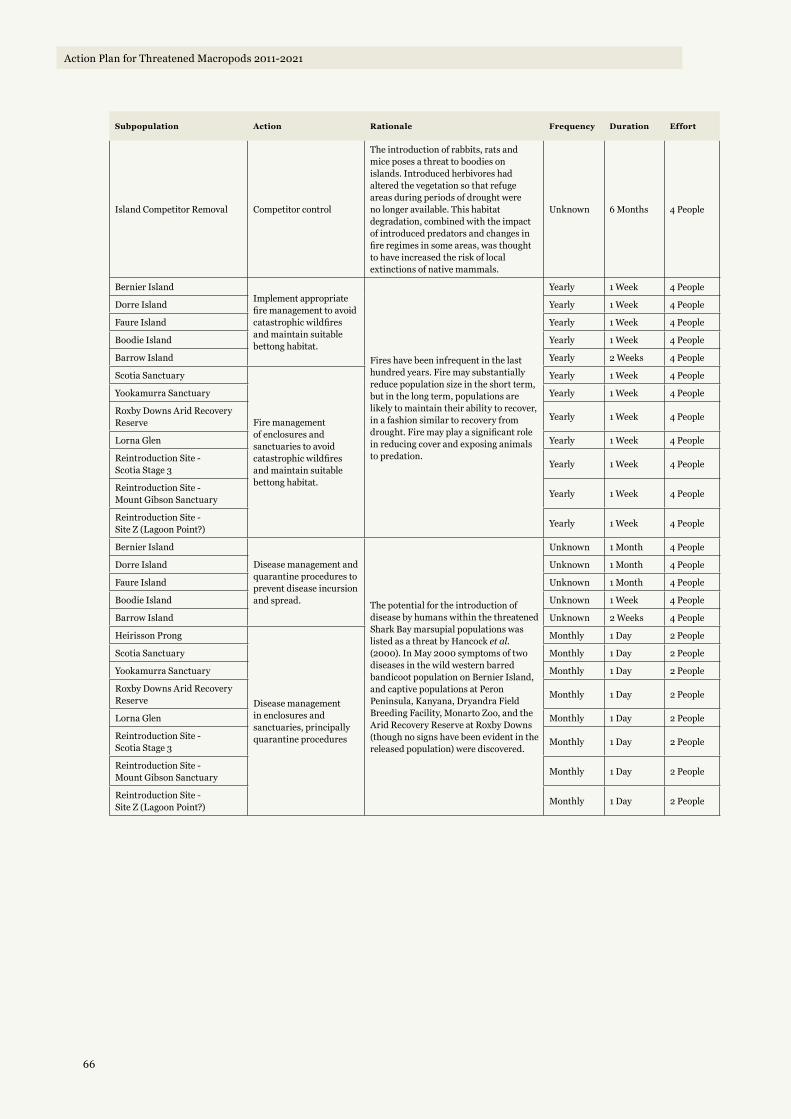
66
Action Plan for Threatened Macropods 2011-2021
Subpopulation Action Rationale Frequency Duration Effort
Island Competitor Removal Competitor control
The introduction of rabbits, rats and mice poses a threat to boodies on islands. Introduced herbivores had altered the vegetation so that refuge areas during periods of drought were no longer available. This habitat degradation, combined with the impact of introduced predators and changes in fire regimes in some areas, was thought to have increased the risk of local extinctions of native mammals.
Unknown 6 Months 4 People
Bernier IslandImplement appropriate fire management to avoid catastrophic wildfires and maintain suitable bettong habitat.
Fires have been infrequent in the last hundred years. Fire may substantially reduce population size in the short term, but in the long term, populations are likely to maintain their ability to recover, in a fashion similar to recovery from drought. Fire may play a significant role in reducing cover and exposing animals to predation.
Yearly 1 Week 4 People
Dorre Island Yearly 1 Week 4 People
Faure Island Yearly 1 Week 4 People
Boodie Island Yearly 1 Week 4 People
Barrow Island Yearly 2 Weeks 4 People
Scotia Sanctuary
Fire management of enclosures and sanctuaries to avoid catastrophic wildfires and maintain suitable bettong habitat.
Yearly 1 Week 4 People
Yookamurra Sanctuary Yearly 1 Week 4 People
Roxby Downs Arid Recovery Reserve
Yearly 1 Week 4 People
Lorna Glen Yearly 1 Week 4 People
Reintroduction Site - Scotia Stage 3
Yearly 1 Week 4 People
Reintroduction Site - Mount Gibson Sanctuary
Yearly 1 Week 4 People
Reintroduction Site - Site Z (Lagoon Point?)
Yearly 1 Week 4 People
Bernier Island
Disease management and quarantine procedures to prevent disease incursion and spread. The potential for the introduction of
disease by humans within the threatened Shark Bay marsupial populations was listed as a threat by Hancock et al. (2000). In May 2000 symptoms of two diseases in the wild western barred bandicoot population on Bernier Island, and captive populations at Peron Peninsula, Kanyana, Dryandra Field Breeding Facility, Monarto Zoo, and the Arid Recovery Reserve at Roxby Downs (though no signs have been evident in the released population) were discovered.
Unknown 1 Month 4 People
Dorre Island Unknown 1 Month 4 People
Faure Island Unknown 1 Month 4 People
Boodie Island Unknown 1 Week 4 People
Barrow Island Unknown 2 Weeks 4 People
Heirisson Prong
Disease management in enclosures and sanctuaries, principally quarantine procedures
Monthly 1 Day 2 People
Scotia Sanctuary Monthly 1 Day 2 People
Yookamurra Sanctuary Monthly 1 Day 2 People
Roxby Downs Arid Recovery Reserve
Monthly 1 Day 2 People
Lorna Glen Monthly 1 Day 2 People
Reintroduction Site - Scotia Stage 3
Monthly 1 Day 2 People
Reintroduction Site - Mount Gibson Sanctuary
Monthly 1 Day 2 People
Reintroduction Site - Site Z (Lagoon Point?)
Monthly 1 Day 2 People

67
Action Plan for Threatened Macropods 2011-2021
Subpopulation Action Rationale Frequency Duration Effort
Heirisson Prong
Enclosure fence inspection.
Captive subpopulations must be protected from feral predators. Well-maintained enclosure fences are the best means of ensuring this security
Monthly 1 Day 2 People
Scotia Sanctuary Monthly 1 Week 2 People
Yookamurra Sanctuary Monthly 1 Week 2 People
Roxby Downs Arid Recovery Reserve
Monthly 1 Week 2 People
Lorna Glen Monthly 1 Week 2 People
Reintroduction Site - Scotia Stage 3
Monthly 1 Week 2 People
Reintroduction Site - Mount Gibson Sanctuary
Monthly 1 Week 2 People
Reintroduction Site - Site Z (Lagoon Point?)
Monthly 1 Week 2 People
Dryandra Captive Breeding Facility
Enclosure fence repairs to prevent predator/competitor ingress and escape of captive animals.
Yearly 2 days 2 People
Heirisson Prong Yearly 2 Weeks 2 People
Scotia Sanctuary Yearly 2 Weeks 2 People
Yookamurra Sanctuary Yearly 2 Weeks 2 People
Roxby Downs Arid Recovery Reserve
Yearly 2 Weeks 2 People
Lorna Glen Yearly 2 Weeks 2 People
Reintroduction Site - Scotia Stage 3
Yearly 2 Weeks 2 People
Reintroduction Site - Mount Gibson Sanctuary
Yearly 2 Weeks 2 People
Reintroduction Site - Site Z (Lagoon Point?)
Yearly 2 Weeks 2 People
Reintroduction Site - Scotia Stage 3
Artificial feeding/watering to ensure effective translocation.
Translocated subpopulations may require support when first moved to a new location.
Weekly 4 Hours 2 People
Reintroduction Site - Mount Gibson Sanctuary
Weekly 4 Hours 2 People
Reintroduction Site - Site Z (Lagoon Point?)
Weekly 4 Hours 2 People
Reintroduction Site - Scotia Stage 3
Establish secure areas of habitat for future translocations, including any necessary fencing and predator/ competitor removal.
Additional subpopulations need to be established in order to achieve eligibility to be down-listed to Near Threatened. A minimum of ten secure subpopulations will ensure that the burrowing bettong no longer meets the IUCN criteria B1 and B2, as long as the establishment increases the 2010 area of occupancy and extent of occurrence of the species. Captive source subpopulations are essential to increase wild and translocated subpopulations to a minimum viable number. The 6000 ha Stage 3 at Scotia is planned for fencing in the near future. This will provide an increased carrying capacity at Scotia. Similarly, Mount Gibson Sanctuary will have a 6000 ha fenced and feral free section within the next 3 years.
Once 6 Months 4 People
Reintroduction Site - Mount Gibson Sanctuary
Once 6 Months 5 People
Reintroduction Site - Site Z (Lagoon Point?)
Once 6 Months 5 People
Reintroduction Site - Scotia Stage 3
Translocation of animals from captivity/wild subpopulations.
Once 2 Weeks 4 People
Reintroduction Site - Mount Gibson Sanctuary
Once 2 Weeks 4 People
Reintroduction Site - Site Z (Lagoon Point?)
Once 2 Weeks 4 People
Reintroduction Site - Scotia Stage 3 Ongoing management
of translocated subpopulations, including resource supplementation as required.
Reintroduction sites may not have sufficient habitat to ensure consistent food availability until they are suitably established.
Monthly 1 Day 2 People
Reintroduction Site - Mount Gibson Sanctuary
Monthly 1 Day 2 People
Reintroduction Site - Site Z (Lagoon Point?)
Monthly 1 Day 2 People
All
Enhance public participation and education in Burrowing Bettong recovery efforts.
The community can contribute substantially to the recovery of this species, particularly where habitat restoration is required.
Yearly 2 days 1 Person

68
Action Plan for Threatened Macropods 2011-2021
Tab
le 1
4:
Lis
t of r
ecov
ery
acti
ons
for
Bet
tong
ia le
sueu
, and
the
ir c
osts
Su
bp
op
ula
tio
nA
ctio
nY
ear
1#Y
ear
2Y
ear
3Y
ear
4Y
ear
5Y
ear
6Y
ear
7Y
ear
8Y
ear
9Y
ear
10
All
Stat
us a
sses
smen
t - d
istr
ibut
ion
and
abun
danc
e.
Incl
udes
sur
veys
of k
now
n su
bpop
ulat
ions
$60,
000
$0$0
$65,
564
$0$0
$71,
644
$0$0
$78,
287
All
Stat
us a
sses
smen
t - g
enet
ics
$30,
000
$0$0
$0$3
3,76
5$0
$0$0
$0$3
9,14
3
All
Man
age
spec
ies
data
to in
form
ada
ptiv
e m
anag
emen
t. In
clud
es 5
yea
r pro
gram
rev
iew
.$5
,000
$5,1
50$5
,305
$5,4
64$2
5,62
8$5
,796
$5,9
70$6
,149
$6,3
33$2
6,52
3
All
Rev
iew
of t
rans
loca
tion
s, a
nd s
ucce
ss a
nd
failu
re fa
ctor
s$0
$5,0
00$0
$0$0
$0$0
$0$0
$0
All
Dev
elop
/refi
ne m
onito
ring
pro
toco
ls fo
r the
sp
ecie
s, in
clud
ing
trap
ping
, sat
ellit
e co
llars
and
ca
mer
a tr
aps,
and
to m
onito
r hab
itat
and
thre
ats
$10,
000
$0$0
$0$0
$5,0
00$0
$0$0
$0
Ber
nier
and
Dor
re Is
land
s
Impl
emen
t mon
itori
ng p
roto
cols
for s
peci
es
acti
vity
, pre
dato
r act
ivit
y, a
nd e
ffec
tive
ness
of
man
agem
ent i
nter
vent
ion.
$60,
000
$61,
800
$63,
654
$65,
564
$67,
531
$69,
556
$71,
643
$73,
792
$76,
006
$78,
286
Faur
e Is
land
$40,
000
$41,
200
$42,
436
$43,
709
$45,
020
$46,
371
$47,
762
$49,
195
$50,
671
$52,
191
Bar
row
Isla
nd$4
0,00
0$4
1,20
0$4
2,43
6$4
3,70
9$4
5,02
0$4
6,37
1$4
7,76
2$4
9,19
5$5
0,67
1$5
2,19
1
Boo
die
Isla
nd$2
0,00
0$2
0,60
0$2
1,21
8$2
1,85
5$2
2,51
0$2
3,18
5$2
3,88
1$2
4,59
7$2
5,33
5$2
6,09
5
Hei
riss
on P
rong
$20,
000
$20,
600
$21,
218
$21,
855
$22,
510
$23,
185
$23,
881
$24,
597
$25,
335
$26,
095
Scot
ia S
anct
uary
- St
age
1$1
5,00
0$1
5,45
0$1
5,91
4$1
6,39
1$1
6,88
3$1
7,38
9$1
7,91
1$1
8,44
8$1
9,00
2$1
9,57
2
Yook
amur
ra S
anct
uary
$15,
000
$15,
450
$15,
914
$16,
391
$16,
883
$17,
389
$17,
911
$18,
448
$19,
002
$19,
572
Rox
by D
owns
Ari
d R
ecov
ery
Res
erve
$15,
000
$15,
450
$15,
914
$16,
391
$16,
883
$17,
389
$17,
911
$18,
448
$19,
002
$19,
572
Lor
na G
len
$15,
000
$15,
450
$15,
914
$16,
391
$16,
883
$17,
389
$17,
911
$18,
448
$19,
002
$19,
572
Rei
ntro
duct
ion
Site
- Sc
otia
St
age
3$0
$0$1
5,91
4$1
6,39
1$1
6,88
3$1
7,39
0$1
7,91
1$1
8,44
9$1
9,00
2$1
9,57
2
Rei
ntro
duct
ion
Site
- M
ount
G
ibso
n Sa
nctu
ary
$0$0
$15,
914
$16,
391
$16,
883
$17,
390
$17,
911
$18,
449
$19,
002
$19,
572
Rei
ntro
duct
ion
Site
- La
goon
Po
int
$0$0
$0$1
6,93
1$1
7,43
9$1
7,96
2$1
8,50
1$1
9,05
6$1
9,62
8$2
0,21
6

69
Action Plan for Threatened Macropods 2011-2021
Su
bp
op
ula
tio
nA
ctio
nY
ear
1#Y
ear
2Y
ear
3Y
ear
4Y
ear
5Y
ear
6Y
ear
7Y
ear
8Y
ear
9Y
ear
10
Ber
nier
and
Dor
re Is
land
s
Impl
emen
t mon
itori
ng p
roto
cols
for fi
re
man
agem
ent a
nd h
abit
at c
ondi
tion
, and
ef
fect
iven
ess
of m
anag
emen
t int
erve
ntio
n.
$30,
000
$30,
900
$31,
827
$32,
782
$33,
765
$34,
778
$35,
822
$36,
896
$38,
003
$39,
143
Faur
e Is
land
$20,
000
$20,
600
$21,
218
$21,
855
$22,
510
$23,
185
$23,
881
$24,
597
$25,
335
$26,
095
Bar
row
Isla
nd$2
0,00
0$2
0,60
0$2
1,21
8$2
1,85
5$2
2,51
0$2
3,18
5$2
3,88
1$2
4,59
7$2
5,33
5$2
6,09
5
Boo
die
Isla
nd$1
0,00
0$1
0,30
0$1
0,60
9$1
0,92
7$1
1,25
5$1
1,59
3$1
1,94
1$1
2,29
9$1
2,66
8$1
3,04
8
Hei
riss
on P
rong
$10,
000
$10,
300
$10,
609
$10,
927
$11,
255
$11,
593
$11,
941
$12,
299
$12,
668
$13,
048
Scot
ia S
anct
uary
- St
age
1$5
,000
$5,1
50$5
,305
$5,4
64$5
,628
$5,7
96$5
,970
$6,1
49$6
,334
$6,5
24
Yook
amur
ra S
anct
uary
$5,0
00$5
,150
$5,3
05$5
,464
$5,6
28$5
,796
$5,9
70$6
,149
$6,3
34$6
,524
Rox
by D
owns
Ari
d R
ecov
ery
Res
erve
$5,0
00$5
,150
$5,3
05$5
,464
$5,6
28$5
,796
$5,9
70$6
,149
$6,3
34$6
,524
Lor
na G
len
$5,0
00$5
,150
$5,3
05$5
,464
$5,6
28$5
,796
$5,9
70$6
,149
$6,3
34$6
,524
Rei
ntro
duct
ion
Site
- Sc
otia
St
age
3$5
,000
$5,1
50$5
,305
$5,4
64$5
,628
$5,7
96$5
,970
$6,1
49$6
,334
$6,5
24
Rei
ntro
duct
ion
Site
- M
ount
G
ibso
n Sa
nctu
ary
$5,0
00$5
,150
$5,3
05$5
,464
$5,6
28$5
,796
$5,9
70$6
,149
$6,3
34$6
,524
Rei
ntro
duct
ion
Site
- La
goon
Po
int
$5,0
00$5
,150
$5,3
05$5
,464
$5,6
28$5
,796
$5,9
70$6
,149
$6,3
34$6
,524
Ber
nier
Isla
nd
Prev
ent u
naut
hori
sed
hum
an v
isit
atio
n to
exc
lude
in
vasi
ve p
reda
tors
and
com
peti
tors
, and
to p
reve
nt
wild
fires
and
dis
ease
incu
rsio
n.
$60,
000
$61,
800
$63,
654
$65,
564
$67,
531
$69,
556
$71,
643
$73,
792
$76,
006
$78,
286
Dor
re Is
land
$60,
000
$61,
800
$63,
654
$65,
564
$67,
531
$69,
556
$71,
643
$73,
792
$76,
006
$78,
286
Faur
e Is
land
$40,
000
$41,
200
$42,
436
$43,
709
$45,
020
$46,
371
$47,
762
$49,
195
$50,
671
$52,
191
Boo
die
Isla
nd$1
0,00
0$1
0,30
0$1
0,60
9$1
0,92
7$1
1,25
5$1
1,59
3$1
1,94
1$1
2,29
9$1
2,66
8$1
3,04
8
Bar
row
Isla
nd$0
$0$0
$0$0
$0$0
$0$0
$0
Isla
nd P
reda
tor R
emov
alPr
edat
or c
ontr
ol$0
$0$0
$0$2
50,0
00$4
0,00
0$0
$0$0
$0
Isla
nd C
ompe
tito
r Rem
oval
Com
peti
tor c
ontr
ol$0
$0$0
$0$0
$0$1
20,0
00$2
0,00
0$0
$0
Ber
nier
Isla
nd
Impl
emen
t app
ropr
iate
fire
man
agem
ent t
o av
oid
cata
stro
phic
wild
fires
and
mai
ntai
n su
itab
le
bett
ong
habi
tat.
$30,
000
$30,
900
$31,
827
$32,
782
$33,
765
$34,
778
$35,
822
$36,
896
$38,
003
$39,
143
Dor
re Is
land
$30,
000
$30,
900
$31,
827
$32,
782
$33,
765
$34,
778
$35,
822
$36,
896
$38,
003
$39,
143
Faur
e Is
land
$30,
000
$30,
900
$31,
827
$32,
782
$33,
765
$34,
778
$35,
822
$36,
896
$38,
003
$39,
143
Boo
die
Isla
nd$5
,000
$5,1
50$5
,305
$5,4
64$5
,628
$5,7
96$5
,970
$6,1
49$6
,334
$6,5
24
Bar
row
Isla
nd$0
$0$0
$0$0
$0$0
$0$0
$0

70
Action Plan for Threatened Macropods 2011-2021
Su
bp
op
ula
tio
nA
ctio
nY
ear
1#Y
ear
2Y
ear
3Y
ear
4Y
ear
5Y
ear
6Y
ear
7Y
ear
8Y
ear
9Y
ear
10
Scot
ia S
anct
uary
Fire
Man
agem
ent o
f enc
losu
res
and
sanc
tuar
ies
to
avoi
d ca
tast
roph
ic w
ildfir
es a
nd m
aint
ain
suit
able
be
tton
g ha
bita
t.
$10,
000
$10,
300
$10,
609
$10,
927
$11,
255
$11,
593
$11,
941
$12,
299
$12,
668
$13,
048
Yook
amur
ra S
anct
uary
$10,
000
$10,
300
$10,
609
$10,
927
$11,
255
$11,
593
$11,
941
$12,
299
$12,
668
$13,
048
Rox
by D
owns
Ari
d
Rec
over
y R
eser
ve$1
0,00
0$1
0,30
0$1
0,60
9$1
0,92
7$1
1,25
5$1
1,59
3$1
1,94
1$1
2,29
9$1
2,66
8$1
3,04
8
Lor
na G
len
$10,
000
$10,
300
$10,
609
$10,
927
$11,
255
$11,
593
$11,
941
$12,
299
$12,
668
$13,
048
Rei
ntro
duct
ion
Site
-
Scot
ia S
tage
3$0
$0$1
0,60
9$1
0,92
7$1
1,25
5$1
1,59
3$1
1,94
1$1
2,29
9$1
2,66
8$1
3,04
8
Rei
ntro
duct
ion
Site
-
Mou
nt G
ibso
n Sa
nctu
ary
$0$0
$31,
827
$32,
782
$33,
765
$34,
778
$35,
822
$36,
896
$38,
003
$39,
143
Rei
ntro
duct
ion
Site
-Lag
oon
Poin
t$0
$0$0
$32,
782
$33,
765
$34,
778
$35,
822
$36,
896
$38,
003
$39,
143
Hei
riss
on P
rong
Dis
ease
man
agem
ent,
prin
cipa
lly q
uara
ntin
e pr
oced
ures
.
$2,0
00$2
,060
$2,1
22$2
,185
$2,2
51$2
,319
$2,3
88$2
,460
$2,5
34$2
,610
Scot
ia S
anct
uary
$2,0
00$2
,060
$2,1
22$2
,185
$2,2
51$2
,319
$2,3
88$2
,460
$2,5
34$2
,610
Yook
amur
ra S
anct
uary
$2,0
00$2
,060
$2,1
22$2
,185
$2,2
51$2
,319
$2,3
88$2
,460
$2,5
34$2
,610
Rox
by D
owns
Ari
d
Rec
over
y R
eser
ve$2
,000
$2,0
60$2
,122
$2,1
85$2
,251
$2,3
19$2
,388
$2,4
60$2
,534
$2,6
10
Lor
na G
len
$2,0
00$2
,060
$2,1
22$2
,185
$2,2
51$2
,319
$2,3
88$2
,460
$2,5
34$2
,610
Rei
ntro
duct
ion
Site
-
Scot
ia S
tage
3$2
,000
$2,0
60$2
,122
$2,1
85$2
,251
$2,3
19$2
,388
$2,4
60$2
,534
$2,6
10
Rei
ntro
duct
ion
Site
-
Mou
nt G
ibso
n Sa
nctu
ary
$3,0
00$3
,090
$3,1
83$3
,278
$3,3
77$3
,478
$3,5
82$3
,690
$3,8
00$3
,914
Rei
ntro
duct
ion
Site
-
Lago
on P
oint
$3,0
00$3
,090
$3,1
83$3
,278
$3,3
77$3
,478
$3,5
82$3
,690
$3,8
00$3
,914
Hei
riss
on P
rong
Enc
losu
re fe
nce
insp
ecti
on.
$2,0
00$2
,060
$2,1
22$2
,185
$2,2
51$2
,319
$2,3
88$2
,460
$2,5
34$2
,610
Scot
ia S
anct
uary
$2,0
00$2
,060
$2,1
22$2
,185
$2,2
51$2
,319
$2,3
88$2
,460
$2,5
34$2
,610
Yook
amur
ra S
anct
uary
$2,0
00$2
,060
$2,1
22$2
,185
$2,2
51$2
,319
$2,3
88$2
,460
$2,5
34$2
,610
Rox
by D
owns
Ari
d R
ecov
ery
Res
erve
$2,0
00$2
,060
$2,1
22$2
,185
$2,2
51$2
,319
$2,3
88$2
,460
$2,5
34$2
,610
Lor
na G
len
$2,0
00$2
,060
$2,1
22$2
,185
$2,2
51$2
,319
$2,3
88$2
,460
$2,5
34$2
,610
Rei
ntro
duct
ion
Site
-
Scot
ia S
tage
3$2
,000
$2,0
60$2
,122
$2,1
85$2
,251
$2,3
19$2
,388
$2,4
60$2
,534
$2,6
10
Rei
ntro
duct
ion
Site
-
Mou
nt G
ibso
n Sa
nctu
ary
$3,0
00$3
,090
$3,1
83$3
,278
$3,3
77$3
,478
$3,5
82$3
,690
$3,8
00$3
,914
Rei
ntro
duct
ion
Site
-
Lago
on P
oint
$3,0
00$3
,090
$3,1
83$3
,278
$3,3
77$3
,478
$3,5
82$3
,690
$3,8
00$3
,914
Hei
riss
on P
rong
Enc
losu
re fe
nce
repa
irs
to p
reve
nt p
reda
tor/
com
peti
tor i
ngre
ss a
nd e
scap
e of
cap
tive
ani
mal
s.
$20,
000
$20,
600
$21,
218
$21,
855
$22,
510
$23,
185
$23,
881
$24,
597
$25,
335
$26,
095
Scot
ia S
anct
uary
$20,
000
$20,
600
$21,
218
$21,
855
$22,
510
$23,
185
$23,
881
$24,
597
$25,
335
$26,
095
Yook
amur
ra S
anct
uary
$20,
000
$20,
600
$21,
218
$21,
855
$22,
510
$23,
185
$23,
881
$24,
597
$25,
335
$26,
095
Rox
by D
owns
Ari
d
Rec
over
y R
eser
ve$2
0,00
0$2
0,60
0$2
1,21
8$2
1,85
5$2
2,51
0$2
3,18
5$2
3,88
1$2
4,59
7$2
5,33
5$2
6,09
5

71
Action Plan for Threatened Macropods 2011-2021
Su
bp
op
ula
tio
nA
ctio
nY
ear
1#Y
ear
2Y
ear
3Y
ear
4Y
ear
5Y
ear
6Y
ear
7Y
ear
8Y
ear
9Y
ear
10
Lor
na G
len
Enc
losu
re fe
nce
repa
irs
to p
reve
nt p
reda
tor/
com
peti
tor i
ngre
ss a
nd e
scap
e of
cap
tive
ani
mal
s.
$20,
000
$20,
600
$21,
218
$21,
855
$22,
510
$23,
185
$23,
881
$24,
597
$25,
335
$26,
095
Rei
ntro
duct
ion
Site
-
Scot
ia S
tage
3$2
0,00
0$2
0,60
0$2
1,21
8$2
1,85
5$2
2,51
0$2
3,18
5$2
3,88
1$2
4,59
7$2
5,33
5$2
6,09
5
Rei
ntro
duct
ion
Site
-
Mou
nt G
ibso
n Sa
nctu
ary
$30,
000
$30,
900
$31,
827
$32,
782
$33,
765
$34,
778
$35,
822
$36,
896
$38,
003
$39,
143
Rei
ntro
duct
ion
Site
-
Lago
on P
oint
$30,
000
$30,
900
$31,
827
$32,
782
$33,
765
$34,
778
$35,
822
$36,
896
$38,
003
$39,
143
Rei
ntro
duct
ion
Site
-
Scot
ia S
tage
3
Art
ifici
al fe
edin
g/w
ater
ing
to e
nsur
e ef
fect
ive
tran
sloc
atio
n.
$2,0
00$2
,060
$2,1
22$0
$0$0
$0$0
$0$0
Rei
ntro
duct
ion
Site
-
Mou
nt G
ibso
n Sa
nctu
ary
$3,0
00$3
,090
$3,1
83$0
$0$0
$0$0
$0$0
Rei
ntro
duct
ion
Site
-
Lago
on P
oint
$3,0
00$3
,090
$3,1
83$0
$0$0
$0$0
$0$0
Rei
ntro
duct
ion
Site
-
Scot
ia S
tage
3E
stab
lish
secu
re a
reas
of h
abit
at fo
r fut
ure
tran
sloc
atio
ns, i
nclu
ding
any
nec
essa
ry fe
ncin
g an
d pr
edat
or/
com
peti
tor r
emov
al.
$500
,000
$515
,000
$530
,450
$0$0
$0$0
$0$0
$0
Rei
ntro
duct
ion
Site
-
Mou
nt G
ibso
n Sa
nctu
ary
$1,0
00,0
00$1
,030
,000
$1,0
60,9
00$0
$0$0
$0$0
$0$0
Rei
ntro
duct
ion
Site
-
Lago
on P
oint
$0$0
$0$0
$0$0
$0$0
$0$0
Rei
ntro
duct
ion
Site
-
Scot
ia S
tage
3
Tran
sloc
atio
n of
ani
mal
s fr
om c
apti
vity
/wild
su
bpop
ulat
ions
.
$0$0
$60,
000
$0$0
$0$0
$0$0
$0
Rei
ntro
duct
ion
Site
-
Mou
nt G
ibso
n Sa
nctu
ary
$0$0
$60,
000
$0$0
$0$0
$0$0
$0
Rei
ntro
duct
ion
Site
-
Lago
on P
oint
$0$0
$0$6
1,80
0$0
$0$0
$0$0
$0
Rei
ntro
duct
ion
Site
-
Scot
ia S
tage
3O
ngoi
ng m
anag
emen
t of t
rans
loca
ted
subp
opul
atio
ns, i
nclu
ding
res
ourc
e su
pple
men
tati
on a
s re
quir
ed.
$0$0
$60,
000
$20,
000
$20,
600
$21,
218
$21,
855
$22,
510
$23,
185
$23,
881
Rei
ntro
duct
ion
Site
-
Mou
nt G
ibso
n Sa
nctu
ary
$0$0
$60,
000
$20,
000
$20,
600
$21,
218
$21,
855
$22,
510
$23,
185
$23,
881
Rei
ntro
duct
ion
Site
-
Lago
on P
oint
$0$0
$0$6
1,80
0$6
3,65
4$6
5,56
4$6
7,53
1$6
9,55
6$7
1,64
3$7
3,79
2
All
Enh
ance
pub
lic p
arti
cipa
tion
and
edu
cati
on in
B
urro
win
g B
etto
ng r
ecov
ery
effo
rts.
$5,0
00$5
,150
$5,3
05$5
,464
$5,6
28$5
,796
$5,9
70$6
,149
$6,3
34$6
,524
YE
AR
LY
TO
TA
LS
$2,5
04,
00
0$2
,481
,120
$2,8
64,6
68$1
,334
,452
$1,5
47,0
66$1
,325
,60
0$1
,510
,662
$1,3
78,5
88$1
,399
,346
$1,5
78,7
56
GR
AN
D T
OT
AL
$17,
92
4,2
57
#Not
e th
at a
n in
dex
of 3
% h
as b
een
appl
ied
to e
ach
succ
essi
ve y
ear o
f fun
ding
to a
ccou
nt fo
r CP
I
*Inc
lude
s 5-
year
pro
gram
revi
ew
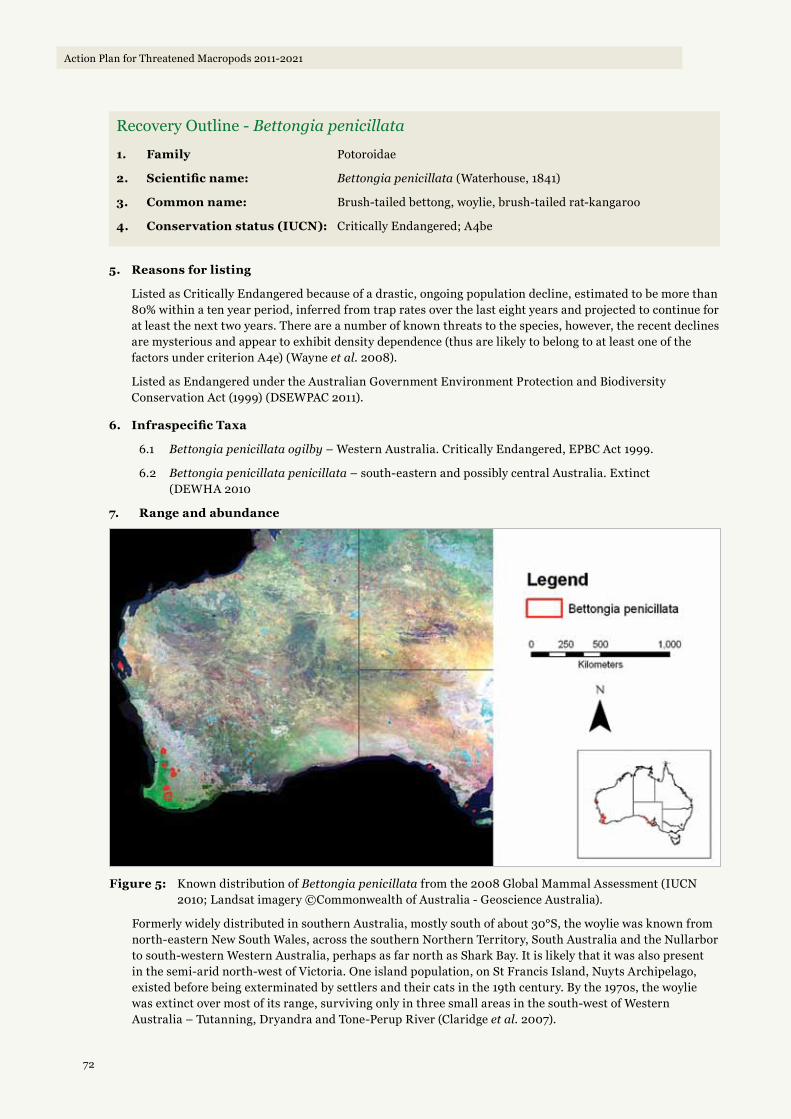
72
Action Plan for Threatened Macropods 2011-2021
Recovery Outline - Bettongia penicillata
1. Family Potoroidae
2. Scientific name: Bettongia penicillata (Waterhouse, 1841)
3. Common name: Brush-tailed bettong, woylie, brush-tailed rat-kangaroo
4. Conservation status (IUCN): Critically Endangered; A4be
5. Reasons for listing
Listed as Critically Endangered because of a drastic, ongoing population decline, estimated to be more than 80% within a ten year period, inferred from trap rates over the last eight years and projected to continue for at least the next two years. There are a number of known threats to the species, however, the recent declines are mysterious and appear to exhibit density dependence (thus are likely to belong to at least one of the factors under criterion A4e) (Wayne et al. 2008).
Listed as Endangered under the Australian Government Environment Protection and Biodiversity Conservation Act (1999) (DSEWPAC 2011).
6. Infraspecific Taxa
6.1 Bettongia penicillata ogilby – Western Australia. Critically Endangered, EPBC Act 1999.
6.2 Bettongia penicillata penicillata – south-eastern and possibly central Australia. Extinct (DEWHA 2010
7. Range and abundance
Figure 5: Known distribution of Bettongia penicillata from the 2008 Global Mammal Assessment (IUCN 2010; Landsat imagery ©Commonwealth of Australia - Geoscience Australia).
Formerly widely distributed in southern Australia, mostly south of about 30°S, the woylie was known from north-eastern New South Wales, across the southern Northern Territory, South Australia and the Nullarbor to south-western Western Australia, perhaps as far north as Shark Bay. It is likely that it was also present in the semi-arid north-west of Victoria. One island population, on St Francis Island, Nuyts Archipelago, existed before being exterminated by settlers and their cats in the 19th century. By the 1970s, the woylie was extinct over most of its range, surviving only in three small areas in the south-west of Western Australia – Tutanning, Dryandra and Tone-Perup River (Claridge et al. 2007).

73
Action Plan for Threatened Macropods 2011-2021
8. Habitat
This species formerly inhabited a wide range of habitats from desert spinifex grasslands to forests. It is now restricted to forests and open woodlands in Western Australia and mallee shrublands in South Australia with clumped low understorey of tussock grasses or low woody scrub (Maxwell et al. 1996).
In south-western Australia the woylie is mostly restricted to dry sclerophyll forest and woodland types – often dominated in the overstorey by Jarrah (Eucalyptus marginata) in combination with Wandoo (E. wandoo). These vegetation communities typically occur on well-drained upland, deep soils and either have a low xeric scrub or tussock grass understorey (Claridge et al. 2007).
9. Threats
9.1 Fox and cat predation.
9.2 Habitat destruction and alteration.
9.3 Disease (still under investigation).
9.4 Catastrophic wildfire.
The cause of the dramatic population decline since 2001 is as yet unknown (Wayne et al. 2008).
10. Information required
10.1 Population survey and monitoring.
10.2 Research into the reasons for the sudden decline in woylie numbers, particularly in large wild populations.
10.3 Recommended areas of research:
• The impacts of disease on important woylie populations and associated hygiene practices that could be built into management practices to ensure no further spread of disease.
• Altered baiting regimes to better target the direct predators of woylies.
11. Recovery objectives
11.1 By 2021, Bettongia penicillata is eligible for listing as Endangered according to IUCN Red List criteria.
11.2 By 2021, numbers of mature Bettongia penicillata in the wild are considered stable or increasing based on an index of abundance appropriate to the species.
11.3 By 2021, the cause of recent declines and suppression of recovery in Bettongia penicillata are understood, and
management plans have been developed and implemented to address those causes.
11.4 By 2021, management plans have been developed and are being implemented to reduce the threat of feral predators for key Bettongia penicillata subpopulations.
11.5 By 2021, the genetic diversity of Bettongia penicillata has been maintained at known 2011 levels13.
12. Actions completed or underway
12.1 Woylies have been the subject of more translocations than any other species in Australia (see Short 2009 for details).
12.2 Release of woylies to Paruna has not been successful, and further releases are unlikely. Paruna is not fenced and is not secure despite substantial effort (J. Short, pers. comm.).
12.3 Since 2005 the Woylie Conservation Research Project has been intensively investigating the causes of the recent rapid and substantial declines with a focus in the Upper Warren region. Lead by The West Australian Department of Environment and Conservation (DEC) in collaboration with Murdoch University, Perth Zoo, and Australian Wildlife Conservancy, the project is investigating the roles of predation, food resources, and disease (A. Wayne pers. comm.).
12.4 A secure enclosure of 400 ha at Perup was established and populated with more than 40 woylies in late 2010.
12.5 There are many reintroduction sites with little or no follow-up information (J. Short, pers. comm.).
12.6 Eight woylies (trypanosome positive) were translocated to Native Animal Rescue, Malaga (WA).
12.7 A group of five woylies was translocated to the Perth zoo for breeding purposes in late 2010.
12.8 Woylies were reintroduced to the 430 ha Wadderin Sanctuary in the central wheatbelt in 2010 (-31.985 118.414). Current estimate of population (February 2011) is 40 and growing (J. Short, pers. comm.)
12.9 Possible new translocation sites are being investigated.
13 Ideally, the genetic diversity of South Australia’s island subpopulations should be increased within the timeframe of this plan.

74
Action Plan for Threatened Macropods 2011-2021
12.10 In Western Australia, fox and cat baiting under the Western Shield program is aimed at improving the conservation status of many species. Ongoing fox control is important for the management of woylies. Reintroduction projects under the same program also benefit a range of species including woylies.
12.11 Current research:
• Investigation into the nature of disease afflicting woylies is being undertaken by DEC, Perth Zoo and Murdoch University.
• Meso-predator release is being undertaken by DEC Science Division. The project aims to investigate the relationship between introduced predators (foxes and cats) and various native species in 1080 baited and unbaited sites. Similar research has also been undertaken by the Arid Recovery project at Roxby Downs in South Australia.
13. Management actions required
13.1 Status assessment of the species – distribution and abundance.
13.2 Status assessment – genetic diversity.
13.3 Manage species data to inform adaptive management.
13.4 Determine role of predation in woylie decline and suppression of recovery.
13.5 Determine role/nature of disease in woylie decline and suppression of recovery.
13.6 Develop and apply disease management protocol to reduce introduction of disease, particularly for work with all high priority and key subpopulations (high importance for Karakamia, low priority for other subpopulations).
13.7 Moratorium/control on movement and translocation of woylies to reduce spread of disease to other locations and other species until such time as the role of disease in woylie decline and recovery suppression is established.
13.8 Develop monitoring protocols for key subpopulations (including high priority sites), including woylie abundance, demographics, genetics, health, predators and disease.
13.9 Implement monitoring protocols for species activity, abundance, demographics and health, and effectiveness of management intervention.
13.10 Implement monitoring protocols for predator activity, and effectiveness of management intervention.
13.11 Secure high priority wild subpopulations (in situ or ex situ as appropriate) by mitigating known threats under an adaptive management framework, including intensive fox and cat control.
13.12 Establish captive insurance subpopulation at Perth Zoo - includes installation of infrastructure and disease exclusion.
13.13 Review of translocations (and success and failure factors)
13.14 Those subpopulations not high priority or at key monitoring sites are to be left in situ, and undergo minimum monitoring at least every five years. All woylies in care or pet trade in SA to be excluded from recovery considerations, with no recovery resources allocated to them.
13.15 Characterise recent declines of woylies (e.g. spatial patterns, gender bias, age bias, etc.).
13.16 Relate characteristics of recent declines to possible role of other factors, e.g. dieback, pigs, gastrolobium, resource availability etc.
13.17 Development of protocols on how to best manage the species in the future.
13.18 Once disease factors are better understood, develop genetically diverse and viable subpopulations (having a sustainable carrying capacity of > 3,000 mature individuals) throughout former range, including South Australian islands.
14. Organisations responsible for conservation of species
14.1 Department of Environment and Conservation (DEC), Western Australia.
14.2 Department of Environment and Natural Resources (DENR), South Australia.

75
Action Plan for Threatened Macropods 2011-2021
15. Other organisations involved
15.1 Australian Wildlife Conservancy (AWC).
15.2 Perth Zoo.
15.3 Zoos South Australia
15.4 Murdoch University.
15.5 Wadderin Committee – Shire of Narembeen.
16. Staff and other resources required for recovery to be carried out
16.1 Full-time project manager to oversee the complex recovery project.
17. Action costs
17.1 Total cost over 10 years exceeds A$18 million.
18. Note
18.1 None
19. References
Claridge, A, Seebeck, J & Rose, R (2007) Bettongs, Potoroos and the Musky Rat-Kangaroo. CSIRO Publishing, Collingwood.
Department of Sustainability, Environment, Water, Population and Communities (DSEWPAC) (2011) Bettongia penicillata ogilbyi . In: Species Profile and Threats (SPRAT) Database. Department of the Environment, Water, Heritage and the Arts, Canberra. http://www.environment.gov.au/sprat. Accessed 29 December 2010 .
IUCN (2010) IUCN Red List of Threatened Species. Version 2010.2. http://www.iucnredlist.org. Accessed 29 June 2010.
Maxwell, S, Burbidge, AA and Morris, K (1996) The 1996 Action Plan for Australian Marsupials and Monotremes. Australasian Marsupial and Monotreme Specialist Group, IUCN Species Survival Commission, Gland, Switzerland.
Short, J (2009) The characteristics and success of vertebrate translocations within Australia. Report to the Department of Agriculture, Fisheries and Forestry.
Wayne, A, Friend, T, Burbidge, A, Morris, K & van Weenen, J (2008) Bettongia penicillata. In: IUCN (2010) IUCN Red List of Threatened Species. Version 2010.2. http://www.iucnredlist.org/apps/redlist/details/2785/0. Accessed 29 June 2010.
20. Comments received
20.1 Adrian Wayne, DEC WA.
20.2 Jeff Short, Wildlife Research and Management, WA.
20.3 Manda Page, AWC.
20.4 Matt Hayward, AWC.
20.5 David Armstrong, DENR SA.
Table 15: List of recovery actions for Bettongia penicillata, and the rationale for their contribution to recovery, and effort required.
Subpopulation Action Rationale Frequency Duration Effort
NAProject Coordinator manages project.
Current recovery actions are ad hoc and opportunistic, and the recovery program is of sufficient complexity to warrant a dedicated manager. There is also be a need for coordination of disease research.
Yearly 1 Year 1 Person
NACoordination of disease investigation, including operating budget.
Yearly 6 Months 1 Person
All
Status assessment of extant subpopulations using standard protocol, including trend, size, risk and priority. Includes 5-year review.
More information is required to better understand the status of the species, to assess those subpopulations most at risk from a range of threats, and to ensure that genetic stock is maintained. There are also many translocated subpopulations about which very little is known. One-off trapping efforts may be required to establish which of these subpopulations are extant.
Yearly 2 Months 5 People
AllStatus assessment of extant subpopulations - genetics.
5-Yearly 2 Months 3 People
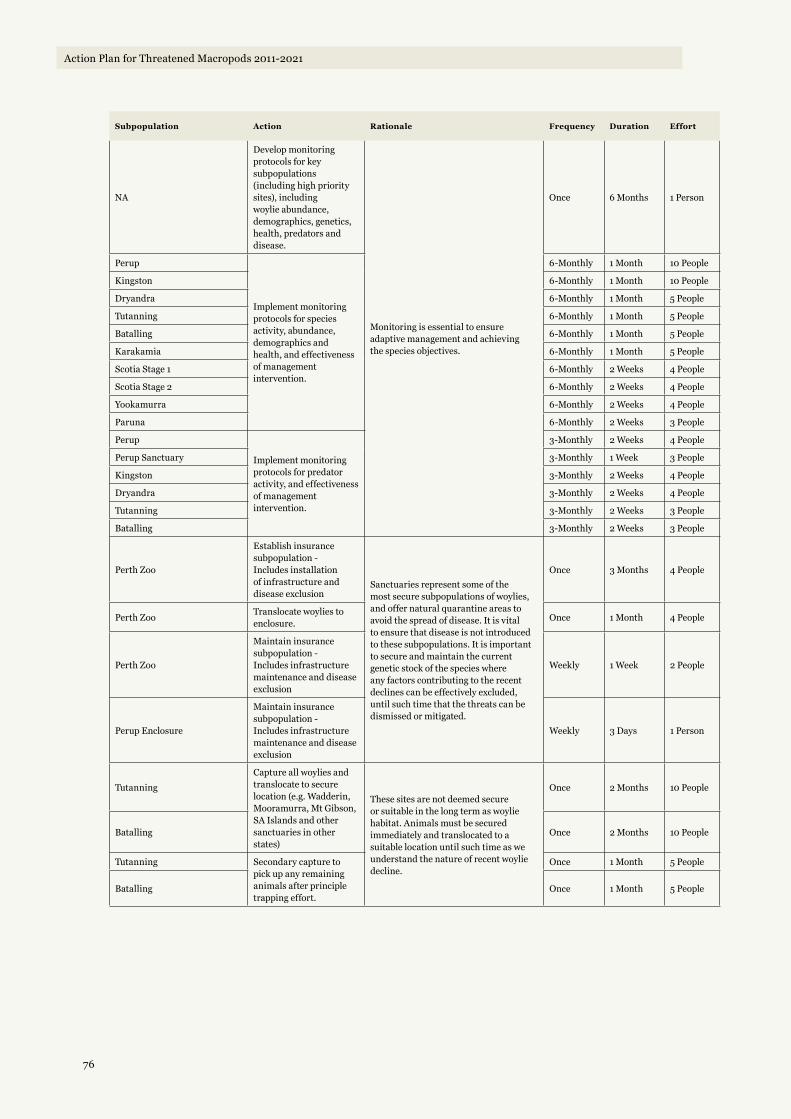
76
Action Plan for Threatened Macropods 2011-2021
Subpopulation Action Rationale Frequency Duration Effort
NA
Develop monitoring protocols for key subpopulations (including high priority sites), including woylie abundance, demographics, genetics, health, predators and disease.
Monitoring is essential to ensure adaptive management and achieving the species objectives.
Once 6 Months 1 Person
Perup
Implement monitoring protocols for species activity, abundance, demographics and health, and effectiveness of management intervention.
6-Monthly 1 Month 10 People
Kingston 6-Monthly 1 Month 10 People
Dryandra 6-Monthly 1 Month 5 People
Tutanning 6-Monthly 1 Month 5 People
Batalling 6-Monthly 1 Month 5 People
Karakamia 6-Monthly 1 Month 5 People
Scotia Stage 1 6-Monthly 2 Weeks 4 People
Scotia Stage 2 6-Monthly 2 Weeks 4 People
Yookamurra 6-Monthly 2 Weeks 4 People
Paruna 6-Monthly 2 Weeks 3 People
Perup
Implement monitoring protocols for predator activity, and effectiveness of management intervention.
3-Monthly 2 Weeks 4 People
Perup Sanctuary 3-Monthly 1 Week 3 People
Kingston 3-Monthly 2 Weeks 4 People
Dryandra 3-Monthly 2 Weeks 4 People
Tutanning 3-Monthly 2 Weeks 3 People
Batalling 3-Monthly 2 Weeks 3 People
Perth Zoo
Establish insurance subpopulation - Includes installation of infrastructure and disease exclusion
Sanctuaries represent some of the most secure subpopulations of woylies, and offer natural quarantine areas to avoid the spread of disease. It is vital to ensure that disease is not introduced to these subpopulations. It is important to secure and maintain the current genetic stock of the species where any factors contributing to the recent declines can be effectively excluded, until such time that the threats can be dismissed or mitigated.
Once 3 Months 4 People
Perth ZooTranslocate woylies to enclosure.
Once 1 Month 4 People
Perth Zoo
Maintain insurance subpopulation - Includes infrastructure maintenance and disease exclusion
Weekly 1 Week 2 People
Perup Enclosure
Maintain insurance subpopulation - Includes infrastructure maintenance and disease exclusion
Weekly 3 Days 1 Person
Tutanning
Capture all woylies and translocate to secure location (e.g. Wadderin, Mooramurra, Mt Gibson, SA Islands and other sanctuaries in other states)
These sites are not deemed secure or suitable in the long term as woylie habitat. Animals must be secured immediately and translocated to a suitable location until such time as we understand the nature of recent woylie decline.
Once 2 Months 10 People
Batalling Once 2 Months 10 People
Tutanning Secondary capture to pick up any remaining animals after principle trapping effort.
Once 1 Month 5 People
Batalling Once 1 Month 5 People

77
Action Plan for Threatened Macropods 2011-2021
Subpopulation Action Rationale Frequency Duration Effort
Perup Intensive fox and cat control through ground baiting and trapping. Introduced predators, in particular
the European red fox and feral cat are considered one of the greatest threats to the survival of woylie occurrences. Despite targeted management and research programs the fox and feral cat are likely to remain one of the most dangerous elements threatening woylie survival.
3-Monthly 1 Month 10 People
Kingston 3-Monthly 1 Month 10 People
Dryandra 3-Monthly 1 Month 10 People
TutanningIntensive fox and cat control until translocation is undertaken to secure location.
3-Monthly 1 Month 5 People
Batalling 3-Monthly 1 Month 5 People
Karakamia
Ongoing sanctuary management, including resource supplementation, fence maintenance, disease and predator exclusion
Sanctuaries represent secure and disease-free subpopulations of woylies, and ongoing maintenance needs to be factored into species management into the future.
Weekly 1 Day 2 People
Scotia Stage 1 Weekly 1 Day 2 People
Scotia Stage 2 Weekly 1 Day 2 People
Yookamurra Weekly 1 Day 2 People
Paruna Weekly 1 Day 2 People
Other Sanctuary 1 Weekly 1 Day 2 People
Other Sanctuary 2 Weekly 1 Day 2 People
NA
Develop disease management protocol to reduce introduction of disease
Once the causes of the recent decline are better understood, protocols will need to be developed to avoid future declines of a similar nature.
Once 3 Months 1 Person
All
Apply disease management protocol to reduce introduction/ spread of disease.
Unknown Unknown 1 Person
NA
Moratorium/ control on movement and translocation of woylies to reduce spread of disease to other locations and other species until such time as the role of disease in woylie decline and recovery suppression is established
Until such time as the impacts of disease on the decline of woylies is known, translocations or mixing of subpopulations could be detrimental to the health of those subpopulations involved.
Once 1 Month 1 Person
Perup and Perup Sanctuary
Conduct research to determine role of predation in woylie decline and suppression of recovery
More information about the nature of woylie decline is required to understand those demographic or geographic groups susceptible to decline.
Once 2 Years 3 People
NA
Conduct research to determine role/nature of disease in woylie decline and suppression of recovery.
Once 2 Years 5 People
NA
Characterise recent declines of woylies (e.g. spatial patterns, gender bias, age bias, etc.)
Once 1 Year 2 People
NA
Relate characteristics of recent declines to possible role of other factors (e.g. dieback, pigs, gastrolobium, resource availability etc.)
A range of threats may have contributed to recent declines, and more information is required to establish the relative importance of each.
Once 1 Year 2 People
NAManage data and compile annual report for woylies. Distribute report.
Good data management is essential to making it possible to extract the maximum amount of information from monitoring data.
6-Monthly 2 Weeks 1 Person

78
Action Plan for Threatened Macropods 2011-2021
Subpopulation Action Rationale Frequency Duration Effort
NAReview of translocations (and success and failure factors)
Translocations of wild and captive subpopulations will be crucial to the ongoing management of the species. Ensuring that any future translocations are undertaken under optimum conditions is essential for the success of the operations.
Once 1 Month 1 Person
NADevelopment of protocols on how to best manage the species in the future
Once 3 Months 1 Person
Saint Peter and Wedge Islands
Prepare site for development of genetically diverse and viable (> 3,000 individuals) subpopulation, including fence construction as preliminary holding pen
The South Australian islands represent a very secure and disease-free, albeit genetically limited, subpopulation. The establishment of additional self-sustaining subpopulations that are secure from the threats of habitat loss, predation and disease is required to ensure the species can be down-listed on the IUCN Red List. The Venus Bay subpopulation (descended from 67 woylies translocated from the wild in WA in 1994-95, D. Armstrong pers. comm.) may be a suitable source, or could be maintained as a viable insurance subpopulation in its own right. St Peter Island is approximately 3400 ha. Wedge Island is approximately 1800 ha.
Once 6 Months 4 People
Saint Peter and Wedge IslandsTranslocation of woylies from genetically diverse sources.
Once 2 Months 5 People
Saint Peter and Wedge Islands
Secondary translocation of woylies from genetically diverse sources.
Once 1 Month 5 People
Saint Peter and Wedge IslandsOngoing maintenance of translocated subpopulation
3-Monthly 2 Weeks 3 People
Low-priority subpopulation 1
Minimum monitoring at 5-yearly intervals. Includes distribution and abundance, trend and risks.
There are many small subpopulations of woylies that present management challenges, and that would not add significantly to the conservation objectives, from the perspective of abundance and/or genetic diversity. It would be extremely resource-intensive to manage these subpopulations, with little prospective return. Also there is the possibility that human intervention could inadvertently cause more harm.
5-Yearly 2 Weeks 4 People
Low-priority subpopulation 2 5-Yearly 2 Weeks 4 People
Low-priority subpopulation 3 5-Yearly 2 Weeks 4 People
Low-priority subpopulation 4 5-Yearly 2 Weeks 4 People
Low-priority subpopulation 5 5-Yearly 2 Weeks 4 People
Low-priority subpopulation 6 5-Yearly 2 Weeks 4 People
Low-priority subpopulation 7 5-Yearly 2 Weeks 4 People
Low-priority subpopulation 8 5-Yearly 2 Weeks 4 People
Low-priority subpopulation 9 5-Yearly 2 Weeks 4 People
Low-priority subpopulation 10 5-Yearly 2 Weeks 4 People
Low-priority subpopulation 11 5-Yearly 2 Weeks 4 People
Low-priority subpopulation 12 5-Yearly 2 Weeks 4 People
Low-priority subpopulation 13 5-Yearly 2 Weeks 4 People
Low-priority subpopulation 14 5-Yearly 2 Weeks 4 People
Low-priority subpopulation 15 5-Yearly 2 Weeks 4 People
Low-priority subpopulation 16 5-Yearly 2 Weeks 4 People
Low-priority subpopulation 17 5-Yearly 2 Weeks 4 People
Low-priority subpopulation 18 5-Yearly 2 Weeks 4 People
Low-priority subpopulation 19 5-Yearly 2 Weeks 4 People
Low-priority subpopulation 20 5-Yearly 2 Weeks 4 People
Low-priority subpopulation 21 5-Yearly 2 Weeks 4 People
Low-priority subpopulation 22 5-Yearly 2 Weeks 4 People
Low-priority subpopulation 23 5-Yearly 2 Weeks 4 People
Low-priority subpopulation 24 5-Yearly 2 Weeks 4 People
Low-priority subpopulation 25 5-Yearly 2 Weeks 4 People
Low-priority subpopulation 26 5-Yearly 2 Weeks 4 People
Low-priority subpopulation 27 5-Yearly 2 Weeks 4 People
Low-priority subpopulation 28 5-Yearly 2 Weeks 4 People
Low-priority subpopulation 29 5-Yearly 2 Weeks 4 People
Low-priority subpopulation 30 5-Yearly 2 Weeks 4 People
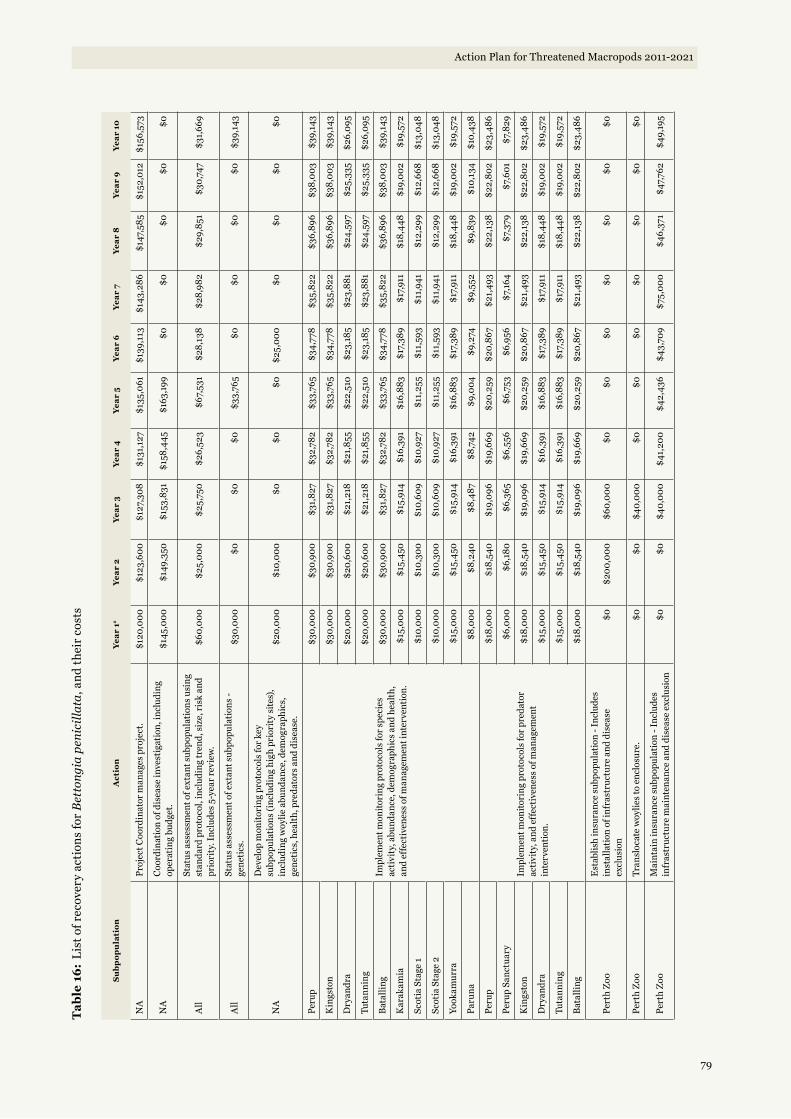
79
Action Plan for Threatened Macropods 2011-2021
Tab
le 1
6:
Lis
t of r
ecov
ery
acti
ons
for
Bet
tong
ia p
enic
illat
a, a
nd t
heir
cos
ts
Su
bp
op
ula
tio
nA
ctio
nY
ear
1#Y
ear
2Y
ear
3Y
ear
4Y
ear
5Y
ear
6Y
ear
7Y
ear
8Y
ear
9Y
ear
10
NA
Proj
ect C
oord
inat
or m
anag
es p
roje
ct.
$120
,000
$123
,600
$127
,308
$131
,127
$135
,061
$139
,113
$143
,286
$147
,585
$152
,012
$156
,573
NA
Coo
rdin
atio
n of
dis
ease
inve
stig
atio
n, in
clud
ing
oper
atin
g bu
dget
.$1
45,0
00$1
49,3
50$1
53,8
31$1
58,4
45$1
63,1
99$0
$0$0
$0$0
All
Stat
us a
sses
smen
t of e
xtan
t sub
popu
lati
ons
usin
g st
anda
rd p
roto
col,
incl
udin
g tr
end,
siz
e, r
isk
and
prio
rity
. Inc
lude
s 5-
year
rev
iew
.$6
0,00
0$2
5,00
0$2
5,75
0$2
6,52
3$6
7,53
1$2
8,13
8$2
8,98
2$2
9,85
1$3
0,74
7$3
1,66
9
All
Stat
us a
sses
smen
t of e
xtan
t sub
popu
lati
ons
- ge
neti
cs.
$30,
000
$0$0
$0$3
3,76
5$0
$0$0
$0$3
9,14
3
NA
Dev
elop
mon
itori
ng p
roto
cols
for k
ey
subp
opul
atio
ns (i
nclu
ding
hig
h pr
iori
ty s
ites)
, in
clud
ing
woy
lie a
bund
ance
, dem
ogra
phic
s,
gene
tics
, hea
lth,
pre
dato
rs a
nd d
isea
se.
$20,
000
$10,
000
$0$0
$0$2
5,00
0$0
$0$0
$0
Peru
p
Impl
emen
t mon
itori
ng p
roto
cols
for s
peci
es
acti
vity
, abu
ndan
ce, d
emog
raph
ics
and
heal
th,
and
effe
ctiv
enes
s of
man
agem
ent i
nter
vent
ion.
$30,
000
$30,
900
$31,
827
$32,
782
$33,
765
$34,
778
$35,
822
$36,
896
$38,
003
$39,
143
Kin
gsto
n$3
0,00
0$3
0,90
0$3
1,82
7$3
2,78
2$3
3,76
5$3
4,77
8$3
5,82
2$3
6,89
6$3
8,00
3$3
9,14
3
Dry
andr
a$2
0,00
0$2
0,60
0$2
1,21
8$2
1,85
5$2
2,51
0$2
3,18
5$2
3,88
1$2
4,59
7$2
5,33
5$2
6,09
5
Tuta
nnin
g$2
0,00
0$2
0,60
0$2
1,21
8$2
1,85
5$2
2,51
0$2
3,18
5$2
3,88
1$2
4,59
7$2
5,33
5$2
6,09
5
Bat
allin
g$3
0,00
0$3
0,90
0$3
1,82
7$3
2,78
2$3
3,76
5$3
4,77
8$3
5,82
2$3
6,89
6$3
8,00
3$3
9,14
3
Kar
akam
ia$1
5,00
0$1
5,45
0$1
5,91
4$1
6,39
1$1
6,88
3$1
7,38
9$1
7,91
1$1
8,44
8$1
9,00
2$1
9,57
2
Scot
ia S
tage
1$1
0,00
0$1
0,30
0$1
0,60
9$1
0,92
7$1
1,25
5$1
1,59
3$1
1,94
1$1
2,29
9$1
2,66
8$1
3,04
8
Scot
ia S
tage
2$1
0,00
0$1
0,30
0$1
0,60
9$1
0,92
7$1
1,25
5$1
1,59
3$1
1,94
1$1
2,29
9$1
2,66
8$1
3,04
8
Yook
amur
ra$1
5,00
0$1
5,45
0$1
5,91
4$1
6,39
1$1
6,88
3$1
7,38
9$1
7,91
1$1
8,44
8$1
9,00
2$1
9,57
2
Paru
na$8
,000
$8,2
40$8
,487
$8,7
42$9
,004
$9,2
74$9
,552
$9,8
39$1
0,13
4$1
0,43
8
Peru
p
Impl
emen
t mon
itori
ng p
roto
cols
for p
reda
tor
acti
vity
, and
eff
ecti
vene
ss o
f man
agem
ent
inte
rven
tion
.
$18,
000
$18,
540
$19,
096
$19,
669
$20,
259
$20,
867
$21,
493
$22,
138
$22,
802
$23,
486
Peru
p Sa
nctu
ary
$6,0
00$6
,180
$6,3
65$6
,556
$6,7
53$6
,956
$7,1
64$7
,379
$7,6
01$7
,829
Kin
gsto
n$1
8,00
0$1
8,54
0$1
9,09
6$1
9,66
9$2
0,25
9$2
0,86
7$2
1,49
3$2
2,13
8$2
2,80
2$2
3,48
6
Dry
andr
a$1
5,00
0$1
5,45
0$1
5,91
4$1
6,39
1$1
6,88
3$1
7,38
9$1
7,91
1$1
8,44
8$1
9,00
2$1
9,57
2
Tuta
nnin
g$1
5,00
0$1
5,45
0$1
5,91
4$1
6,39
1$1
6,88
3$1
7,38
9$1
7,91
1$1
8,44
8$1
9,00
2$1
9,57
2
Bat
allin
g$1
8,00
0$1
8,54
0$1
9,09
6$1
9,66
9$2
0,25
9$2
0,86
7$2
1,49
3$2
2,13
8$2
2,80
2$2
3,48
6
Pert
h Zo
oE
stab
lish
insu
ranc
e su
bpop
ulat
ion
- Inc
lude
s in
stal
lati
on o
f inf
rast
ruct
ure
and
dise
ase
excl
usio
n$0
$200
,000
$60,
000
$0$0
$0$0
$0$0
$0
Pert
h Zo
oTr
ansl
ocat
e w
oylie
s to
enc
losu
re.
$0$0
$40,
000
$0$0
$0$0
$0$0
$0
Pert
h Zo
oM
aint
ain
insu
ranc
e su
bpop
ulat
ion
- Inc
lude
s in
fras
truc
ture
mai
nten
ance
and
dis
ease
exc
lusi
on$0
$0$4
0,00
0$4
1,20
0$4
2,43
6$4
3,70
9$7
5,00
0$4
6,37
1$4
7,76
2$4
9,19
5

80
Action Plan for Threatened Macropods 2011-2021
Su
bp
op
ula
tio
nA
ctio
nY
ear
1#Y
ear
2Y
ear
3Y
ear
4Y
ear
5Y
ear
6Y
ear
7Y
ear
8Y
ear
9Y
ear
10
Peru
p E
nclo
sure
Mai
ntai
n in
sura
nce
subp
opul
atio
n - I
nclu
des
infr
astr
uctu
re m
aint
enan
ce a
nd d
isea
se e
xclu
sion
$40,
000
$41,
200
$42,
436
$43,
709
$45,
020
$46,
371
$47,
762
$49,
195
$50,
671
$52,
191
Tuta
nnin
gC
aptu
re a
ll w
oylie
s an
d tr
ansl
ocat
e to
sec
ure
loca
tion
(e.g
. Wad
deri
n, M
oora
mur
ra, M
t Gib
son,
SA
Isla
nds
and
othe
r san
ctua
ries
in o
ther
sta
tes)
$0$0
$125
,000
$0$0
$0$0
$0$0
$0
Bat
allin
g$0
$125
,000
$0$0
$0$0
$0$0
$0$0
Tuta
nnin
gSe
cond
ary
capt
ure
to p
ick
up a
ny r
emai
ning
an
imal
s af
ter p
rinc
iple
trap
ping
eff
ort.
$0$0
$0$6
0,00
0$0
$0$0
$0$0
$0
Bat
allin
g$0
$0$6
0,00
0$0
$0$0
$0$0
$0$0
Peru
pIn
tens
ive
fox
and
cat c
ontr
ol th
roug
h gr
ound
ba
itin
g an
d tr
appi
ng.
$200
,000
$206
,000
$212
,180
$218
,545
$225
,102
$231
,855
$238
,810
$245
,975
$253
,354
$260
,955
Kin
gsto
n$2
00,0
00$2
06,0
00$2
12,1
80$2
18,5
45$2
25,1
02$2
31,8
55$2
38,8
10$2
45,9
75$2
53,3
54$2
60,9
55
Dry
andr
a$1
50,0
00$1
54,5
00$1
59,1
35$1
63,9
09$1
68,8
26$1
73,8
91$1
79,1
08$1
84,4
81$1
90,0
16$1
95,7
16
Tuta
nnin
gIn
tens
ive
fox
and
cat c
ontr
ol u
ntil
tran
sloc
atio
n is
un
dert
aken
to s
ecur
e lo
cati
on.
$50,
000
$51,
500
$53,
045
$54,
636
$0$0
$0$0
$0$0
Bat
allin
g$5
0,00
0$5
1,50
0$5
3,04
5$0
$0$0
$0$0
$0$0
Kar
akam
ia
Ong
oing
san
ctua
ry m
anag
emen
t, in
clud
ing
reso
urce
sup
plem
enta
tion
, fen
ce m
aint
enan
ce,
dise
ase
and
pred
ator
exc
lusi
on
$30,
000
$30,
900
$31,
827
$32,
782
$33,
765
$34,
778
$35,
822
$36,
896
$38,
003
$39,
143
Scot
ia S
tage
1$1
5,00
0$1
5,45
0$1
5,91
4$1
6,39
1$1
6,88
3$1
7,38
9$1
7,91
1$1
8,44
8$1
9,00
2$1
9,57
2
Scot
ia S
tage
2$1
5,00
0$1
5,45
0$1
5,91
4$1
6,39
1$1
6,88
3$1
7,38
9$1
7,91
1$1
8,44
8$1
9,00
2$1
9,57
2
Yook
amur
ra$2
5,00
0$2
5,75
0$2
6,52
3$2
7,31
8$2
8,13
8$2
8,98
2$2
9,85
1$3
0,74
7$3
1,66
9$3
2,61
9
Paru
na$1
5,00
0$1
5,45
0$1
5,91
4$1
6,39
1$1
6,88
3$1
7,38
9$1
7,91
1$1
8,44
8$1
9,00
2$1
9,57
2
Oth
er S
anct
uary
1$3
0,00
0$3
0,90
0$3
1,82
7$3
2,78
2$3
3,76
5$3
4,77
8$3
5,82
2$3
6,89
6$3
8,00
3$3
9,14
3
Oth
er S
anct
uary
2$3
0,00
0$3
0,90
0$3
1,82
7$3
2,78
2$3
3,76
5$3
4,77
8$3
5,82
2$3
6,89
6$3
8,00
3$3
9,14
3
NA
Dev
elop
dis
ease
man
agem
ent p
roto
col t
o re
duce
in
trod
ucti
on o
f dis
ease
$10,
000
$10,
300
$10,
609
$10,
927
$11,
255
$0$0
$0$0
$0
All
App
ly d
isea
se m
anag
emen
t pro
toco
l to
redu
ce
intr
oduc
tion
/spr
ead
of d
isea
se.
$0$2
0,00
0$2
0,60
0$2
1,21
8$2
1,85
5$2
2,51
0$2
3,18
5$2
3,88
1$2
4,59
7$2
5,33
5
NA
Mor
ator
ium
/con
trol
on
mov
emen
t and
tr
ansl
ocat
ion
of w
oylie
s to
red
uce
spre
ad o
f di
seas
e to
oth
er lo
cati
ons
and
othe
r spe
cies
unt
il su
ch ti
me
as th
e ro
le o
f dis
ease
in w
oylie
dec
line
and
reco
very
sup
pres
sion
is e
stab
lishe
d
$5,0
00$5
,150
$5,3
05$0
$0$0
$0$0
$0$0
Peru
p an
d Pe
rup
Sanc
tuar
yC
ondu
ct r
esea
rch
to d
eter
min
e ro
le o
f pre
dati
on in
w
oylie
dec
line
and
supp
ress
ion
of r
ecov
ery
$0$0
$40,
000
$41,
200
$0$0
$0$0
$0$0
NA
Con
duct
res
earc
h to
det
erm
ine
role
/nat
ure
of
dise
ase
in w
oylie
dec
line
and
supp
ress
ion
of
reco
very
.$0
$30,
000
$30,
900
$31,
827
$32,
782
$0$0
$0$0
$0
NA
Cha
ract
eris
e re
cent
dec
lines
of w
oylie
s (e
.g. s
pati
al
patt
erns
, gen
der b
ias,
age
bia
s, e
tc.)
$0$0
$30,
000
$0$0
$0$0
$0$0
$0

81
Action Plan for Threatened Macropods 2011-2021
Su
bp
op
ula
tio
nA
ctio
nY
ear
1#Y
ear
2Y
ear
3Y
ear
4Y
ear
5Y
ear
6Y
ear
7Y
ear
8Y
ear
9Y
ear
10
NA
Rel
ate
char
acte
rist
ics
of r
ecen
t dec
lines
to
poss
ible
rol
e of
oth
er fa
ctor
s(e.
g. d
ieba
ck, p
igs,
ga
stro
lobi
um, r
esou
rce
avai
labi
lity
etc.
)$0
$0$3
0,00
0$0
$0$0
$0$0
$0$0
NA
Man
age
data
and
com
pile
ann
ual r
epor
t for
w
oylie
s. D
istr
ibut
e re
port
.$0
$0$0
$0$2
0,00
0$0
$0$0
$0$2
2,51
0
NA
Rev
iew
of t
rans
loca
tion
s (a
nd s
ucce
ss a
nd fa
ilure
fa
ctor
s)$0
$0$0
$0$0
$0$0
$0$0
$0
NA
Dev
elop
men
t of p
roto
cols
on
how
to b
est m
anag
e th
e sp
ecie
s in
the
futu
re$0
$0$0
$0$0
$0$0
$0$0
$0
Sain
t Pet
er a
nd W
edge
Isla
nds
Prep
are
site
for d
evel
opm
ent o
f gen
etic
ally
div
erse
an
d vi
able
(> 3
,000
indi
vidu
als)
sub
popu
lati
on,
incl
udin
g fe
nce
cons
truc
tion
as
prel
imin
ary
hold
ing
pen
$0$2
00,0
00$5
0,00
0$3
0,00
0$0
$0$0
$0$0
$0
Sain
t Pet
er a
nd W
edge
Isla
nds
Tran
sloc
atio
n of
woy
lies
from
gen
etic
ally
div
erse
so
urce
s.$0
$0$1
25,0
00$0
$0$0
$0$0
$0$0
Sain
t Pet
er a
nd W
edge
Isla
nds
Seco
ndar
y tr
ansl
ocat
ion
of w
oylie
s fr
om
gene
tica
lly d
iver
se s
ourc
es.
$0$0
$0$5
0,00
0$0
$0$0
$0$0
$0
Sain
t Pet
er a
nd W
edge
Isla
nds
Ong
oing
mai
nten
ance
of t
rans
loca
ted
subp
opul
atio
n$0
$0$2
5,00
0$2
5,75
0$2
6,52
3$2
7,31
8$2
8,13
8$2
8,98
2$2
9,85
1$3
0,74
7
Low
-pri
orit
y su
bpop
ulat
ion
1
Min
imum
mon
itori
ng a
t 5-y
earl
y in
terv
als.
In
clud
es d
istr
ibut
ion
and
abun
danc
e, tr
end
an
d ri
sks.
$20,
000
$0$0
$0$2
2,51
0$0
$0$0
$25,
335
$0
Low
-pri
orit
y su
bpop
ulat
ion
2$0
$20,
600
$0$0
$0$2
3,18
5$0
$0$0
$26,
095
Low
-pri
orit
y su
bpop
ulat
ion
3$0
$0$2
1,21
8$0
$0$0
$23,
881
$0$0
$0
Low
-pri
orit
y su
bpop
ulat
ion
4$0
$0$0
$21,
855
$0$0
$0$2
4,59
7$0
$0
Low
-pri
orit
y su
bpop
ulat
ion
5$2
0,00
0$0
$0$0
$22,
510
$0$0
$0$2
5,33
5$0
Low
-pri
orit
y su
bpop
ulat
ion
6$0
$20,
600
$0$0
$0$2
3,18
5$0
$0$0
$26,
095
Low
-pri
orit
y su
bpop
ulat
ion
7$0
$0$2
1,21
8$0
$0$0
$23,
881
$0$0
$0
Low
-pri
orit
y su
bpop
ulat
ion
8$0
$0$0
$21,
855
$0$0
$0$2
4,59
7$0
$0
Low
-pri
orit
y su
bpop
ulat
ion
9$2
0,00
0$0
$0$0
$22,
510
$0$0
$0$2
5,33
5$0
Low
-pri
orit
y su
bpop
ulat
ion
10$0
$20,
600
$0$0
$0$2
3,18
5$0
$0$0
$26,
095
Low
-pri
orit
y su
bpop
ulat
ion
11$0
$0$2
1,21
8$0
$0$0
$23,
881
$0$0
$0
Low
-pri
orit
y su
bpop
ulat
ion
12$0
$0$0
$21,
855
$0$0
$0$2
4,59
7$0
$0
Low
-pri
orit
y su
bpop
ulat
ion
13$2
0,00
0$0
$0$0
$22,
510
$0$0
$0$2
5,33
5$0
Low
-pri
orit
y su
bpop
ulat
ion
14$0
$20,
600
$0$0
$0$2
3,18
5$0
$0$0
$26,
095
Low
-pri
orit
y su
bpop
ulat
ion
15$0
$0$2
1,21
8$0
$0$0
$23,
881
$0$0
$0
Low
-pri
orit
y su
bpop
ulat
ion
16$0
$0$0
$21,
855
$0$0
$0$2
4,59
7$0
$0

82
Action Plan for Threatened Macropods 2011-2021
Su
bp
op
ula
tio
nA
ctio
nY
ear
1#Y
ear
2Y
ear
3Y
ear
4Y
ear
5Y
ear
6Y
ear
7Y
ear
8Y
ear
9Y
ear
10
Low
-pri
orit
y su
bpop
ulat
ion
17
Min
imum
mon
itori
ng a
t 5-y
earl
y in
terv
als.
In
clud
es d
istr
ibut
ion
and
abun
danc
e, tr
end
an
d ri
sks.
$20,
000
$0$0
$0$2
2,51
0$0
$0$0
$25,
335
$0
Low
-pri
orit
y su
bpop
ulat
ion
18$0
$20,
600
$0$0
$0$2
3,18
5$0
$0$0
$26,
095
Low
-pri
orit
y su
bpop
ulat
ion
19$0
$0$2
1,21
8$0
$0$0
$23,
881
$0$0
$0
Low
-pri
orit
y su
bpop
ulat
ion
20$0
$0$0
$21,
855
$0$0
$0$2
4,59
7$0
$0
Low
-pri
orit
y su
bpop
ulat
ion
21$2
0,00
0$0
$0$0
$22,
510
$0$0
$0$2
5,33
5$0
Low
-pri
orit
y su
bpop
ulat
ion
22$0
$20,
600
$0$0
$0$2
3,18
5$0
$0$0
$26,
095
Low
-pri
orit
y su
bpop
ulat
ion
23$0
$0$2
1,21
8$0
$0$0
$23,
881
$0$0
$0
Low
-pri
orit
y su
bpop
ulat
ion
24$0
$0$0
$21,
855
$0$0
$0$2
4,59
7$0
$0
Low
-pri
orit
y su
bpop
ulat
ion
25$2
0,00
0$0
$0$0
$22,
510
$0$0
$0$2
5,33
5$0
Low
-pri
orit
y su
bpop
ulat
ion
26$0
$20,
600
$0$0
$0$2
3,18
5$0
$0$0
$26,
095
Low
-pri
orit
y su
bpop
ulat
ion
27$0
$0$2
1,21
8$0
$0$0
$23,
881
$0$0
$0
Low
-pri
orit
y su
bpop
ulat
ion
28$0
$0$0
$21,
855
$0$0
$0$2
4,59
7$0
$0
Low
-pri
orit
y su
bpop
ulat
ion
29$2
0,00
0$0
$0$0
$22,
510
$0$0
$0$2
5,33
5$0
Low
-pri
orit
y su
bpop
ulat
ion
30$0
$20,
600
$0$0
$0$2
3,18
5$0
$0$0
$26,
095
YE
AR
LY
TO
TA
LS
$1,6
78,0
00
$2,2
25,0
40$2
,344
,523
$1,9
59,1
59$1
,891
,510
$1,6
63,0
05$1
,693
,244
$1,7
13,1
63$1
,789
,892
$1,9
05,2
42
GR
AN
D T
OT
AL
$18
,86
2,7
79
#Not
e th
at a
n in
dex
of 3
% h
as b
een
appl
ied
to e
ach
succ
essi
ve y
ear o
f fun
ding
to a
ccou
nt fo
r CP
I
*Inc
lude
s 5-
year
pro
gram
revi
ew
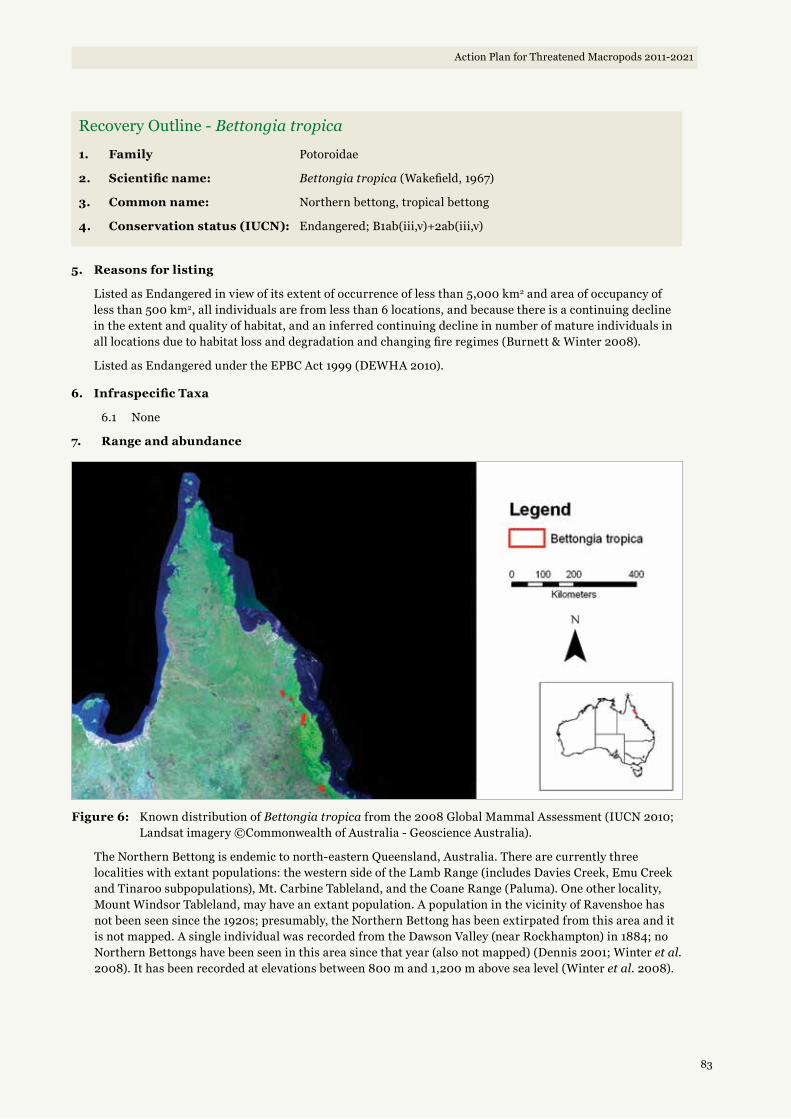
83
Action Plan for Threatened Macropods 2011-2021
Recovery Outline - Bettongia tropica
1. Family Potoroidae
2. Scientific name: Bettongia tropica (Wakefield, 1967)
3. Common name: Northern bettong, tropical bettong
4. Conservation status (IUCN): Endangered; B1ab(iii,v)+2ab(iii,v)
5. Reasons for listing
Listed as Endangered in view of its extent of occurrence of less than 5,000 km2 and area of occupancy of less than 500 km2, all individuals are from less than 6 locations, and because there is a continuing decline in the extent and quality of habitat, and an inferred continuing decline in number of mature individuals in all locations due to habitat loss and degradation and changing fire regimes (Burnett & Winter 2008).
Listed as Endangered under the EPBC Act 1999 (DEWHA 2010).
6. Infraspecific Taxa
6.1 None
7. Range and abundance
Figure 6: Known distribution of Bettongia tropica from the 2008 Global Mammal Assessment (IUCN 2010; Landsat imagery ©Commonwealth of Australia - Geoscience Australia).
The Northern Bettong is endemic to north-eastern Queensland, Australia. There are currently three localities with extant populations: the western side of the Lamb Range (includes Davies Creek, Emu Creek and Tinaroo subpopulations), Mt. Carbine Tableland, and the Coane Range (Paluma). One other locality, Mount Windsor Tableland, may have an extant population. A population in the vicinity of Ravenshoe has not been seen since the 1920s; presumably, the Northern Bettong has been extirpated from this area and it is not mapped. A single individual was recorded from the Dawson Valley (near Rockhampton) in 1884; no Northern Bettongs have been seen in this area since that year (also not mapped) (Dennis 2001; Winter et al. 2008). It has been recorded at elevations between 800 m and 1,200 m above sea level (Winter et al. 2008).

84
Action Plan for Threatened Macropods 2011-2021
There are no total population estimates for the Northern Bettong. Of the three localities with confirmed extant populations, only the Lamb Range has a substantial number of individuals over a broad area (densities of 4 to 7 individuals/km2). Mount Carbine Tableland and the Coane Range both have small and restricted populations occurring at low densities (Dennis 2001; Winter et al. 2008).
No northern bettongs have been seen at Mount Windsor Tableland since 2003, despite considerable effort, and the status of this population is unknown (Dennis 2001; Winter et al. 2008).
8. Habitat
The Northern bettong is found in a range of eucalypt forest types associated with granite soils, from tall and wet forest dominated by Eucalyptus grandis and tall forest dominated by E. resinifera, abutting the rainforest, to medium height and drier woodlands dominated by Corymbia citriodora and C. platyphylla (Dennis 2001; Winter et al. 2008). Diet is specialised, relying on a range of hypogeous fungi, and the underground parts of grasses, particularly Cockatoo grass (Alloteropsis semialata), smaller amounts of the tuberous material from ground orchids and lilies, and small invertebrates (Winter et al. 2008).
9. Threats
9.1 Small size of extant subpopulations.
9.2 Fragmented, isolated distribution across a limited geographic extent.
9.3 Habitat transformation due to lack of fire and subsequent invasion of rainforest species.
9.4 Cattle grazing.
9.5 Predation by cats and possibly foxes (minor threat).
9.6 Possible competition for hypogenous fungi from feral pigs (minor threat).
9.7 Weeds and the habitat degradation resulting from the invasion of gamba grass, grader grass, thatch grass and lantana (minor threat).
10. Information required
10.1 Surveys to confirm size and distribution of extant subpopulations.
10.2 Conduct studies into the diet of northern bettongs, habitat partitioning between rufous and northern bettongs, and food competition between northern bettongs and feral pigs.
11. Recovery objectives
11.1 By 2021, Bettongia tropica is eligible for listing as Vulnerable according to IUCN Red List criteria.
11.2 By 2021, the geographic range of Bettongia tropica in the form of extent of occurrence is greater than 5,000 km2, with subpopulations secure at greater than five locations within that range.
11.3 By 2021, the geographic range of Bettongia tropica in the form of area of occupancy is greater than 500 km2, with subpopulations secure at greater than five locations within that range.
11.4 By 2021, numbers of mature Bettongia tropica in the wild are considered stable or increasing based on an index of abundance appropriate to the species.
11.5 By 2021, management plans have been developed and are being implemented to reduce the threats of altered fire regimes, feral pigs and predators, and to improve habitat area, extent and quality, for all Bettongia tropica subpopulations.
11.6 By 2021, the genetic diversity of Bettongia tropica has been maintained at known 2011 levels.
* A taxon is defined as secure when its numbers and distribution are stable or increasing, and when numbers and distribution are sufficient that there is a 95% probability that the species will survive the stochastic events anticipated over a 50 year timeframe, given that all known and predicted threats are adequately mitigated.
12. Actions completed or underway
12.1 Back on Track prioritisation of recovery and management actions for threatened species in Queensland, undertaken by DERM.
12.2 Fire scar mapping of both burnt and long-term unburnt areas is being undertaken by DERM.
85
Action Plan for Threatened Macropods 2011-2021
12.3 Fire manipulation is being undertaken on plots at Davies Creek for cockatoo grass (Alloteropsis semialata) fire response and looking to replicate at other sites for the northern bettong.
12.4 DERM is undertaking feral pig control at some northern bettong sites.
12.5 AWC undertaking a range of on-ground management actions at Mount Zero-Taravale, including establishing appropriate fire management programs and control of rainforest understorey.
12.6 Habitat mapping was undertaken at Mount Zero-Taravale (Brooke Bateman, pers. comm.).
12.7 James Cook University is conducting camera trapping exercises to monitor northern bettongs and feral predator activity at a range of sites.
12.8 DERM is currently finalising a habitat map based on regional ecosystem mapping.
12.9 An experimental fire management program has been established on Lamb Range which attempts to look at the complex interplay between fire, grazing and pigs.
12.10 Camera traps in the Mount Windsor and Mount Carbine Tablelands were successful in recording northern bettong on the Mount Windsor Tablelands in 2003 (DERM unpublished data).
12.11 DERM is currently finalising a community fox and rabbit survey based on a previous survey undertaken in 1996.
12.12 A trial re-introduction of northern bettongs was undertaken in 2005 with the release of 15 animals into Tumoulin State Forest. It was unsuccessful due to factors including feral predators, stock vitality issues not apparent until after the release, and habitat selection.
13. Management actions required
13.1 Status assessment of extant subpopulations using standard protocols, including distribution, abundance, genetics, trend, risk and priority subpopulations.
13.2 Manage data to inform adaptive management, and compile annual report.
13.3 Implement monitoring protocols, including fire management, habitat condition, predation and predator activity, and species activity.
13.4 Review the need and reasons for translocations.
13.5 Fire planning and management.
13.6 Feral pig management.
13.7 Feral predator management.
13.8 Fostering appropriate grazing regimes.
13.9 Protect and manage unreserved habitat.
13.10 Identify sites for translocation or reintroduction based on habitat mapping and/or on-ground assessment.
13.11 Establish and manage secure areas of habitat for future translocations.
13.12 Translocation of bettongs to secure and managed areas of habitat.
13.13 Ongoing management of translocated subpopulations
13.14 Incorporate updated habitat knowledge into plans for habitat continuity under potential climate change scenarios.
14. Organisations responsible for conservation of species
14.1 Department of Environment and Resource Management (DERM) Queensland.
14.2 Australian Wildlife Conservancy
15. Other organisations involved
15.1 Terrain Natural Resource Management (Terrain NRM)
15.2 James Cook University (JCU)
15.3 Wet Tropics Management Authority (WTMA)
16. Staff and other resources required for recovery to be carried out
16.1 A dedicated recovery coordinator is required to manage the complex recovery program.
17. Action costs
17.1 Total cost over 10 years exceeds A$22 million.
18. Notes
18.1 None

86
Action Plan for Threatened Macropods 2011-2021
19. References
Burnett, S & Winter, J (2008) Bettongia tropica. In: IUCN (2010) IUCN Red List of Threatened Species. Version 2010.2. http://www.iucnredlist.org/apps/redlist/details/2787/0. Accessed 29 June 2010.
Dennis, AJ (2001) Recovery plan for the northern bettong, Bettongia tropica 2000-2004. Report to Environment Australia, Canberra. Queensland Parks and Wildlife Service, Brisbane.
Department of Environment and Resource Management (2009a) Back on Track Species Prioritisation Framework. Department of Environment and Resource Management, Brisbane.
Department of Environment and Resource Management (2009b) National Draft Recovery Plan for the Northern Bettong Bettongia tropica. Report to Department of the Environment, Water, Heritage and the Arts, Canberra. Department of Environment and Resource Management, Brisbane.
Department of Environment, Water, Heritage and the Arts (DEWHA) (2010) Bettongia tropica . In: Species Profile and Threats (SPRAT) Database. Department of the Environment, Water, Heritage and the Arts, Canberra. http://www.environment.gov.au/sprat. Accessed 29 Jul 2010 .
IUCN (2010) IUCN Red List of Threatened Species. Version 2010.2. http://www.iucnredlist.org. Downloaded 29 June 2010.
Johnson, CN (1997) Fire and habitat management for a mycophagous marsupial, the Tasmanian bettong Bettongia gaimardi. Australian Journal of Ecology 22, 101-105.
Laurance, WF (1996) A distributional survey and habitat model for the endangered northern bettong (Bettongia tropica) in tropical Queensland. Biological Conservation 82: 47-60.
Vernes, K (2000) Ecology of the northern bettong in fire prone wet sclerophyll forest. PhD Thesis in the Department of Zoology and Tropical Ecology, James Cook University of North Queensland, Townsville.
Vernes, K and Pope, LC (2001) Stability of nest range, home range and movement of the northern bettong (Bettongia tropica) following moderate-intensity fire in a tropical woodland, north-eastern Queensland. Wildlife Research 28: 141-150.
Winter, JW, Johnson, PM and Vernes, K (2008) Northern Bettong, Bettongia tropica. In The Mammals of Australia (Eds. Van Dyck, S & Strahan, R).
20. Comments received
20.1 John Kanowski, AWC.
20.2 Threatened Species Section, DERM QLD.
20.3 Brooke Bateman, James Cook University.
Table 17: List of recovery actions for Bettongia tropica, and the rationale for their contribution to recovery, and effort required.
Subpopulation Action Rationale Frequency Duration Effort
AllProject coordinator manages project
Current recovery actions are ad hoc and opportunistic, and the recovery program is of sufficient complexity to warrant a dedicated manager.
Yearly 1 Year 1 Person
All
Status assessment - distribution and abundance. Includes surveys of known subpopulations
More information is required to better understand the status of the species, to assess those subpopulations most at risk from a range of threats, and to ensure that genetic stock is maintained.
3-Yearly 3 Months 10 People
AllStatus assessment - genetics
5-Yearly 2 Months 3 People
Mount Windsor Tableland and Greater Ravenshoe Area and other potential habitat
Survey to confirm bettong presence
There are several unconfirmed sightings, and areas where bettongs have not been sighted for many years. It will be important to confirm the existence of any subpopulations as yet unknown or presumed extinct in order to achieve eligibility for down-listing.
Yearly 2 Months 5 People

87
Action Plan for Threatened Macropods 2011-2021
Subpopulation Action Rationale Frequency Duration Effort
All
Manage species data to inform adaptive management. Includes 5 year program review.
Good data management is essential to making it possible to extract the maximum amount of information from monitoring data.
3-Monthly 1 Week 1 Person
AllReview of translocations, and success and failure factors
Translocations of wild and captive subpopulations will be crucial to the ongoing management of the species. Ensuring that any future translocations are undertaken under optimum conditions is essential for the success of the operations.
Once 2 Weeks 1 Person
All
Conduct research into optimal fire management practices to maintain bettong habitat, including food resources
Deviation from the burning regimes implemented by Traditional Owners is likely to have caused significant ecological changes to northern bettong habitat, resulting in habitat alteration (especially understorey composition changes altering the availability of food resources). Little is known about the optimum fire regime to maintain bettong food sources. Any reduction in the availability of foodstuffs during dry conditions, when truffle availability is low, could significantly impact populations.
Yearly 3 Months 2 People
All
Develop monitoring protocols for the species, including trapping, satellite collars and camera traps, and to monitor habitat and threats
Monitoring is essential to ensure adaptive management and achieving the species objectives
Once 1 Month 1 Person
Lamb RangeImplement monitoring protocols for species activity, predator and pig activity, and effectiveness of management intervention.
3-Monthly 2 Weeks 10 People
Coane Range 3-Monthly 1 Week 5 People
Mount Carbine Tableland 3-Monthly 1 Week 5 People
Mount Windsor Tableland 3-Monthly 1 Week 5 People
Translocation Site 1 3-Monthly 1 Week 5 People
Translocation Site 2 3-Monthly 1 Week 5 People
Lamb RangeImplement monitoring protocols for fire management and habitat condition, and effectiveness of management intervention.
Yearly 2 Weeks 4 People
Coane Range Yearly 1 Week 3 People
Mount Carbine Tableland Yearly 1 Week 3 People
Mount Windsor Tableland Yearly 1 Week 3 People
Translocation Site 1 Yearly 1 Week 3 People
Translocation Site 2 Yearly 1 Week 3 People
Lamb Range
Implement appropriate fire management in bettong habitat, and assess rainforest encroachment dynamics
Deviation from the burning regimes implemented by Traditional Owners is likely to have caused significant ecological changes to northern bettong habitat, resulting in habitat alteration (especially understorey composition changes altering the availability of food resources). It is understood that too frequent fires promote the encroachment of rainforest understorey into northern bettong habitat, making it less suitable for the species.
Yearly 3 Weeks 10 People
Coane Range Yearly 2 Weeks 4 People
Mount Carbine Tableland Yearly 2 Weeks 4 People
Mount Windsor Tableland Yearly 2 Weeks 4 People
Translocation Site 1 Yearly 2 Weeks 4 People
Translocation Site 2 Yearly 2 Weeks 4 People

88
Action Plan for Threatened Macropods 2011-2021
Subpopulation Action Rationale Frequency Duration Effort
Lamb Range
Conduct strategic feral predator control in bettong habitat
Cats are established within northern bettong habitat, and may be a significant predator. The high density Lamb Range population could be quickly impacted if red fox establish.
3-Monthly 2 Weeks 4 People
Coane Range 3-Monthly 2 Weeks 3 People
Mount Carbine Tableland 3-Monthly 2 Weeks 3 People
Mount Windsor Tableland 3-Monthly 2 Weeks 3 People
Translocation Site 1 3-Monthly 2 Weeks 3 People
Translocation Site 2 3-Monthly 2 Weeks 3 People
Lamb Range
Conduct adaptive management feral pig control in bettong habitat
Feral pigs are widespread in the Wet Tropics. As generalist omnivores, they consume a wide variety of food resources, and their rooting behaviour disturbs the ground layer.
The likely impacts on northern bettongs from feral pigs include competition for resources and habitat alteration.
6-Monthly 1 Month 2 People
Coane Range 6-Monthly 2 Weeks 1 Person
Mount Carbine Tableland 6-Monthly 2 Weeks 1 Person
Mount Windsor Tableland 6-Monthly 2 Weeks 1 Person
Translocation Site 1 6-Monthly 2 Weeks 1 Person
Translocation Site 2 6-Monthly 2 Weeks 1 Person
Lamb Range
Exclude cattle grazing from bettong habitat, including landholder communication and fencing
Cattle grazing continues to occur in habitat on private property, and inadequate fencing and the presence of feral cattle means the pressure on reserved northern bettong habitat continues. Cattle grazing directly and indirectly influences fire regimes. The combined influence of cattle is to reduce the occurrence of fires that contribute to traditional burning patterns. This will cause understorey changes that alter the availability of food resources.
Yearly 2 Weeks 2 People
Coane Range Yearly 1 Week 2 People
Mount Carbine Tableland Yearly 1 Week 2 People
Mount Windsor Tableland Yearly 1 Week 2 People
Translocation Site 1 Yearly 1 Week 2 People
Translocation Site 2 Yearly 1 Week 2 People
Lamb Range
Rehabilitate degraded habitat, including weed control
Where rainforest understorey has already encroached into northern bettong habitat due to altered fire patterns, intensive habitat rehabilitation may be required.
Yearly 3 Weeks 10 People
Coane Range Yearly 2 Weeks 5 People
Mount Carbine Tableland Yearly 2 Weeks 5 People
Mount Windsor Tableland Yearly 2 Weeks 5 People
Translocation Site 1 Yearly 2 Weeks 5 People
Translocation Site 2 Yearly 2 Weeks 5 People
All
Identify unreserved northern bettong habitat and run extension program to engage landholders to better manage or reserve land
Clearing for agriculture has resulted in a permanent loss of habitat, and there has also been loss associated with road construction and electricity lines. Logging and selective logging has affected large areas of the Wet Tropics eucalypt forest, and to a lesser extent eucalypt woodland, but has largely ceased for commercial purposes. Most new clearing is associated with rural residential activity. Habitat clearing is likely to have influenced fire regimes by fragmenting tracts, and in the case of forestry, altering forest structure. While most known habitat is now managed for conservation, the legacy of forestry on some habitat types will be significant in certain areas.
Yearly 1 Year 1 Person

89
Action Plan for Threatened Macropods 2011-2021
Subpopulation Action Rationale Frequency Duration Effort
New subpopulations
Identify sites for translocation or reintroduction based on habitat mapping and/or on-ground assessment
In order to achieve an increase in area of occupancy and extent of occurrence, new or previously occupied sites will need to be identified, secured, and used as translocation sites.
Once 6 Months 1 Person
Translocation Site 1Establish secure areas of habitat for future translocations, including any necessary fencing and predator/pig removal
Once 6 Months 4 People
Translocation Site 2 Once 6 Months 4 People
Translocation Site 1 Translocation of bettongs to secure and managed areas of habitat
Once 3 Weeks 5 People
Translocation Site 2 Once 3 Weeks 5 People
Translocation Site 1Ongoing management of translocated subpopulations, including resource supplementation as required
Monthly 1 Day 2 People
Translocation Site 2 Monthly 1 Day 2 People
AllConduct studies to refine northern bettong dietary requirements
The dietary requirements of the northern bettong are likely closely linked to particular fire regimes and habitat condition. More research is required to better inform management decisions.
Once 1 Year 2 People
All
Conduct studies on the extent of food resource competition between northern bettongs and feral pigs
The impact of pigs on northern bettongs is poorly known, but may be a significant threat to the species.
Once 1 Year 2 People
All
Conduct studies detailing rufous and northern bettong habitat partitioning and impacts of land management decisions
Competition between the two species of bettong for resources may favour the rufous bettong. More information is required.
Once 1 Year 2 People
All
Incorporate updated habitat knowledge into plans for habitat continuity under potential climate change scenarios
Given the fragmented and limited distribution of the northern bettong, possible impacts of climate change on northern bettong habitat could be severe, and adaptation programs need to be established early.
3-Yearly 3 Months 3 People

90
Action Plan for Threatened Macropods 2011-2021
Tab
le 1
8:
Lis
t of r
ecov
ery
acti
ons
for
Bet
tong
ia t
ropi
ca, a
nd t
heir
cos
ts
Su
bp
op
ula
tio
nA
ctio
nY
ear
1#Y
ear
2Y
ear
3Y
ear
4Y
ear
5Y
ear
6Y
ear
7Y
ear
8Y
ear
9Y
ear
10
All
Proj
ect c
oord
inat
or m
anag
es p
roje
ct
$100
,000
$103
,000
$106
,090
$109
,273
$112
,551
$115
,927
$119
,405
$122
,987
$126
,677
$130
,477
All
Stat
us a
sses
smen
t - d
istr
ibut
ion
and
abun
danc
e.
Incl
udes
sur
veys
of k
now
n su
bpop
ulat
ions
$60,
000
$0$0
$65,
564
$0$0
$71,
644
$0$0
$78,
287
All
Stat
us a
sses
smen
t - g
enet
ics
$30,
000
$0$0
$0$3
3,76
5$0
$0$0
$0$3
9,14
3
Mou
nt W
inds
or T
able
land
and
G
reat
er R
aven
shoe
Are
a an
d ot
her p
oten
tial
hab
itat
Surv
ey to
con
firm
bet
tong
pre
senc
e$4
5,00
0$4
6,35
0$4
7,74
1$4
9,17
3$5
0,64
8$0
$0$0
$0$0
All
Man
age
spec
ies
data
to in
form
ada
ptiv
e m
anag
emen
t. In
clud
es 5
yea
r pro
gram
rev
iew
.$0
$0$0
$0$2
0,00
0*$0
$0$0
$0$3
0,00
0*
All
Rev
iew
of t
rans
loca
tion
s, a
nd s
ucce
ss a
nd fa
ilure
fa
ctor
s$0
$0$0
$0$0
$0$0
$0$0
$0
All
Con
duct
res
earc
h in
to o
ptim
al fi
re m
anag
emen
t pr
acti
ces
to m
aint
ain
bett
ong
habi
tat,
incl
udin
g fo
od r
esou
rces
$50,
000
$51,
500
$53,
045
$54,
636
$56,
275
$0$0
$0$0
$0
All
Dev
elop
mon
itori
ng p
roto
cols
for t
he s
peci
es,
incl
udin
g tr
appi
ng, s
atel
lite
colla
rs a
nd c
amer
a tr
aps,
and
to m
onito
r hab
itat
and
thre
ats
$0$0
$0$0
$0$0
$0$0
$0$0
Lam
b R
ange
Impl
emen
t mon
itori
ng p
roto
cols
for s
peci
es
acti
vity
, pre
dato
r and
pig
act
ivit
y, a
nd
effe
ctiv
enes
s of
man
agem
ent i
nter
vent
ion.
$60,
000
$61,
800
$63,
654
$65,
564
$67,
531
$69,
556
$71,
643
$73,
792
$76,
006
$78,
286
Coa
ne R
ange
$20,
000
$20,
600
$21,
218
$21,
855
$22,
510
$23,
185
$23,
881
$24,
597
$25,
335
$26,
095
Mou
nt C
arbi
ne T
able
land
$20,
000
$20,
600
$21,
218
$21,
855
$22,
510
$23,
185
$23,
881
$24,
597
$25,
335
$26,
095
Mou
nt W
inds
or T
able
land
$20,
000
$20,
600
$21,
218
$21,
855
$22,
510
$23,
185
$23,
881
$24,
597
$25,
335
$26,
095
Tran
sloc
atio
n Si
te 1
$20,
000
$20,
600
$21,
218
$21,
855
$22,
510
$23,
185
$23,
881
$24,
597
$25,
335
$26,
095
Tran
sloc
atio
n Si
te 2
$20,
000
$20,
600
$21,
218
$21,
855
$22,
510
$23,
185
$23,
881
$24,
597
$25,
335
$26,
095
Lam
b R
ange
Impl
emen
t mon
itori
ng p
roto
cols
for fi
re
man
agem
ent a
nd h
abit
at c
ondi
tion
, and
ef
fect
iven
ess
of m
anag
emen
t int
erve
ntio
n.
$30,
000
$30,
900
$31,
827
$32,
782
$33,
765
$34,
778
$35,
822
$36,
896
$38,
003
$39,
143
Coa
ne R
ange
$10,
000
$10,
300
$10,
609
$10,
927
$11,
255
$11,
593
$11,
941
$12,
299
$12,
668
$13,
048
Mou
nt C
arbi
ne T
able
land
$10,
000
$10,
300
$10,
609
$10,
927
$11,
255
$11,
593
$11,
941
$12,
299
$12,
668
$13,
048
Mou
nt W
inds
or T
able
land
$10,
000
$10,
300
$10,
609
$10,
927
$11,
255
$11,
593
$11,
941
$12,
299
$12,
668
$13,
048
Tran
sloc
atio
n Si
te 1
$10,
000
$10,
300
$10,
609
$10,
927
$11,
255
$11,
593
$11,
941
$12,
299
$12,
668
$13,
048
Tran
sloc
atio
n Si
te 2
$10,
000
$10,
300
$10,
609
$10,
927
$11,
255
$11,
593
$11,
941
$12,
299
$12,
668
$13,
048

91
Action Plan for Threatened Macropods 2011-2021
Su
bp
op
ula
tio
nA
ctio
nY
ear
1#Y
ear
2Y
ear
3Y
ear
4Y
ear
5Y
ear
6Y
ear
7Y
ear
8Y
ear
9Y
ear
10
Lam
b R
ange
Impl
emen
t app
ropr
iate
fire
man
agem
ent
in b
etto
ng h
abit
at, a
nd a
sses
s ra
info
rest
en
croa
chm
ent d
ynam
ics
$150
,000
$154
,500
$159
,135
$163
,909
$168
,826
$173
,891
$179
,108
$184
,481
$190
,016
$195
,716
Coa
ne R
ange
$80,
000
$82,
400
$84,
872
$87,
418
$90,
041
$92,
742
$95,
524
$98,
390
$101
,342
$104
,382
Mou
nt C
arbi
ne T
able
land
$80,
000
$82,
400
$84,
872
$87,
418
$90,
041
$92,
742
$95,
524
$98,
390
$101
,342
$104
,382
Mou
nt W
inds
or T
able
land
$80,
000
$82,
400
$84,
872
$87,
418
$90,
041
$92,
742
$95,
524
$98,
390
$101
,342
$104
,382
Tran
sloc
atio
n Si
te 1
$80,
000
$82,
400
$84,
872
$87,
418
$90,
041
$92,
742
$95,
524
$98,
390
$101
,342
$104
,382
Tran
sloc
atio
n Si
te 2
$80,
000
$82,
400
$84,
872
$87,
418
$90,
041
$92,
742
$95,
524
$98,
390
$101
,342
$104
,382
Lam
b R
ange
Con
duct
str
ateg
ic fe
ral p
reda
tor c
ontr
ol in
bet
tong
ha
bita
t
$50,
000
$51,
500
$53,
045
$54,
636
$56,
275
$57,
964
$59,
703
$61,
494
$63,
339
$65,
239
Coa
ne R
ange
$25,
000
$25,
750
$26,
523
$27,
318
$28,
138
$28,
982
$29,
851
$30,
747
$31,
669
$32,
619
Mou
nt C
arbi
ne T
able
land
$25,
000
$25,
750
$26,
523
$27,
318
$28,
138
$28,
982
$29,
851
$30,
747
$31,
669
$32,
619
Mou
nt W
inds
or T
able
land
$25,
000
$25,
750
$26,
523
$27,
318
$28,
138
$28,
982
$29,
851
$30,
747
$31,
669
$32,
619
Tran
sloc
atio
n Si
te 1
$25,
000
$25,
750
$26,
523
$27,
318
$28,
138
$28,
982
$29,
851
$30,
747
$31,
669
$32,
619
Tran
sloc
atio
n Si
te 2
$25,
000
$25,
750
$26,
523
$27,
318
$28,
138
$28,
982
$29,
851
$30,
747
$31,
669
$32,
619
Lam
b R
ange
Con
duct
ada
ptiv
e m
anag
emen
t fer
al p
ig c
ontr
ol
in b
etto
ng h
abit
at
$100
,000
$103
,000
$106
,090
$109
,273
$112
,551
$115
,927
$119
,405
$122
,987
$126
,677
$130
,477
Coa
ne R
ange
$40,
000
$41,
200
$42,
436
$43,
709
$45,
020
$46,
371
$47,
762
$49,
195
$50,
671
$52,
191
Mou
nt C
arbi
ne T
able
land
$40,
000
$41,
200
$42,
436
$43,
709
$45,
020
$46,
371
$47,
762
$49,
195
$50,
671
$52,
191
Mou
nt W
inds
or T
able
land
$40,
000
$41,
200
$42,
436
$43,
709
$45,
020
$46,
371
$47,
762
$49,
195
$50,
671
$52,
191
Tran
sloc
atio
n Si
te 1
$40,
000
$41,
200
$42,
436
$43,
709
$45,
020
$46,
371
$47,
762
$49,
195
$50,
671
$52,
191
Tran
sloc
atio
n Si
te 2
$40,
000
$41,
200
$42,
436
$43,
709
$45,
020
$46,
371
$47,
762
$49,
195
$50,
671
$52,
191
Lam
b R
ange
Exc
lude
cat
tle
graz
ing
from
bet
tong
hab
itat
, in
clud
ing
land
hold
er c
omm
unic
atio
n an
d fe
ncin
g
$20,
000
$20,
600
$21,
218
$21,
855
$22,
510
$23,
185
$23,
881
$24,
597
$25,
335
$26,
095
Coa
ne R
ange
$10,
000
$10,
300
$10,
609
$10,
927
$11,
255
$11,
593
$11,
941
$12,
299
$12,
668
$13,
048
Mou
nt C
arbi
ne T
able
land
$10,
000
$10,
300
$10,
609
$10,
927
$11,
255
$11,
593
$11,
941
$12,
299
$12,
668
$13,
048
Mou
nt W
inds
or T
able
land
$10,
000
$10,
300
$10,
609
$10,
927
$11,
255
$11,
593
$11,
941
$12,
299
$12,
668
$13,
048
Tran
sloc
atio
n Si
te 1
$10,
000
$10,
300
$10,
609
$10,
927
$11,
255
$11,
593
$11,
941
$12,
299
$12,
668
$13,
048
Tran
sloc
atio
n Si
te 2
$10,
000
$10,
300
$10,
609
$10,
927
$11,
255
$11,
593
$11,
941
$12,
299
$12,
668
$13,
048
Lam
b R
ange
Reh
abili
tate
deg
rade
d ha
bita
t, in
clud
ing
w
eed
cont
rol
$50,
000
$51,
500
$53,
045
$54,
636
$56,
275
$57,
964
$59,
703
$61,
494
$63,
339
$65,
239
Coa
ne R
ange
$30,
000
$30,
900
$31,
827
$32,
782
$33,
765
$34,
778
$35,
822
$36,
896
$38,
003
$39,
143
Mou
nt C
arbi
ne T
able
land
$30,
000
$30,
900
$31,
827
$32,
782
$33,
765
$34,
778
$35,
822
$36,
896
$38,
003
$39,
143
Mou
nt W
inds
or T
able
land
$30,
000
$30,
900
$31,
827
$32,
782
$33,
765
$34,
778
$35,
822
$36,
896
$38,
003
$39,
143
Tran
sloc
atio
n Si
te 1
$30,
000
$30,
900
$31,
827
$32,
782
$33,
765
$34,
778
$35,
822
$36,
896
$38,
003
$39,
143
Tran
sloc
atio
n Si
te 2
$30,
000
$30,
900
$31,
827
$32,
782
$33,
765
$34,
778
$35,
822
$36,
896
$38,
003
$39,
143

92
Action Plan for Threatened Macropods 2011-2021
Su
bp
op
ula
tio
nA
ctio
nY
ear
1#Y
ear
2Y
ear
3Y
ear
4Y
ear
5Y
ear
6Y
ear
7Y
ear
8Y
ear
9Y
ear
10
All
Iden
tify
unr
eser
ved
nort
hern
bet
tong
hab
itat
and
ru
n ex
tens
ion
prog
ram
to e
ngag
e la
ndho
lder
s to
be
tter
man
age
or r
eser
ve la
nd$1
50,0
00$1
54,5
00$1
59,1
35$1
63,9
09$1
68,8
26$1
73,8
91$1
79,1
08$1
84,4
81$1
90,0
16$1
95,7
16
New
sub
popu
lati
ons
Iden
tify
site
s fo
r tra
nslo
cati
on o
r rei
ntro
duct
ion
base
d on
hab
itat
map
ping
and
/or o
n-gr
ound
as
sess
men
t$0
$25,
000
$25,
000
$0$0
$0$0
$0$0
$0
Tran
sloc
atio
n Si
te 1
Est
ablis
h se
cure
are
as o
f hab
itat
for f
utur
e tr
ansl
ocat
ions
, inc
ludi
ng a
ny n
eces
sary
fenc
ing
and
pred
ator
/pig
rem
oval
$0$0
$60,
000
$0$0
$0$0
$0$0
$0
Tran
sloc
atio
n Si
te 2
$0$0
$80,
000
$0$0
$0$0
$0$0
$0
Tran
sloc
atio
n Si
te 1
Tran
sloc
atio
n of
bet
tong
s to
sec
ure
and
man
aged
ar
eas
of h
abit
at
$0$0
$0$5
0,00
0$0
$0$0
$0$0
$0
Tran
sloc
atio
n Si
te 2
$0$0
$0$6
0,00
0$0
$0$0
$0$0
$0
Tran
sloc
atio
n Si
te 1
Ong
oing
man
agem
ent o
f tra
nslo
cate
d su
bpop
ulat
ions
, inc
ludi
ng r
esou
rce
supp
lem
enta
tion
as
requ
ired
$0$0
$0$6
0,00
0$3
0,00
0$3
0,90
0$3
1,82
7$3
2,78
2$3
3,76
5$3
4,77
8
Tran
sloc
atio
n Si
te 2
$0$0
$0$7
0,00
0$3
5,00
0$3
6,05
0$3
7,13
2$3
8,24
5$3
9,39
3$4
0,57
5
All
Con
duct
stu
dies
to r
efine
nor
ther
n be
tton
g di
etar
y re
quir
emen
ts$0
$30,
000
$30,
900
$31,
827
$32,
782
$0$0
$0$0
$0
All
Con
duct
stu
dies
on
the
exte
nt o
f foo
d re
sour
ce
com
peti
tion
bet
wee
n no
rthe
rn b
etto
ngs
and
fera
l pi
gs$0
$30,
000
$30,
900
$31,
827
$0$0
$0$0
$0$0
All
Con
duct
stu
dies
det
ailin
g ru
fous
and
nor
ther
n be
tton
g ha
bita
t par
titi
onin
g an
d im
pact
s of
land
m
anag
emen
t dec
isio
ns$0
$0$3
0,00
0$3
0,90
0$3
1,82
7$0
$0$0
$0$0
All
Inco
rpor
ate
upda
ted
habi
tat k
now
ledg
e in
to p
lans
fo
r hab
itat
con
tinu
ity
unde
r pot
enti
al c
limat
e ch
ange
sce
nari
os$0
$0$1
5,00
0$1
5,45
0$1
5,91
4$0
$0$0
$0$0
YE
AR
LY
TO
TA
LS
$1,9
70,0
00
$2,0
21,4
00
$2,2
66,2
92$2
,469
,895
$2,3
15,2
44$2
,136
,254
$2,2
71,9
86$2
,266
,352
$2,3
34,3
43$2
,551
,803
GR
AN
D T
OT
AL
$2
2,6
03
,56
8
#Not
e th
at a
n in
dex
of 3
% h
as b
een
appl
ied
to e
ach
succ
essi
ve y
ear o
f fun
ding
to a
ccou
nt fo
r CP
I
*Inc
lude
s 5-
year
pro
gram
revi
ew

93
Action Plan for Threatened Macropods 2011-2021
Recovery Outline - Dendrolagus bennettianus
1. Family Macropodidae
2. Scientific name: Dendrolagus bennettianus (De Vis, 1887)
3. Common name: Bennett’s tree kangaroo, Dusty tree kangaroo, Tree-climber, Grey Tree kangaroo, Tree Wallaby. Indigenous names: Jarabeena, Tcharibeena.
4. Conservation status (IUCN): Near Threatened
5. Reasons for listing
Listed as Near Threatened because, although the species appears not to be in decline and populations are not considered to be severely fragmented, its extent of occurrence is less than 5000 km², and the extent and quality of its habitat are probably declining, thus making the species close to qualifying for Vulnerable under criterion B1 (Winter et al. 2008).
6. Infraspecific Taxa
6.1 None
7. Range and abundance
Figure 7: Known distribution of Dendrolagus bennettianus from the 2008 Global Mammal Assessment (IUCN 2010; Landsat imagery ©Commonwealth of Australia - Geoscience Australia).
A cryptic species that is now relatively common, although it is thought to be rare in the uplands.
8. Habitat
Closed forest, including lowland vine forests and montane rainforests. Its staple diet is foliage from a limited number of preferred tree and vine species and some fruit.
9. Threats
9.1 Land clearing and degradation as a result of continued subdivision and development of remaining tracts of lowland rainforest under freehold tenure.
9.2 Increased exposure to predation by domestic dogs.

94
Action Plan for Threatened Macropods 2011-2021
10. Information required
10.1 Extent and quality of habitat.
10.2 Population estimate.
10.3 Research species biology, ecology and conservation requirements.
11. Recovery objectives
11.1 By 2021, Dendrolagus bennettianus is eligible for listing as Least Concern according to IUCN Red List criteria.
11.2 By 2020, research, surveys and monitoring confirm the population trend of Dendrolagus bennettianus as stable, and any potential threats are identified, with management plans developed and implemented to mitigate those threats.
11.3 By 2021, the geographic range of Dendrolagus bennettianus in the form of extent of occurrence has increased to greater than 5,000 km2, with subpopulations secure at greater than five locations within that range.
11.4 By 2020, the genetic diversity of Dendrolagus bennettianus has been maintained at known 2010 levels.
12. Actions completed or underway
12.1 Unknown.
13. Management actions required
13.1 Status assessment of the species – distribution and abundance.
13.2 Status assessment – genetic diversity.
13.3 Develop and implement monitoring protocols, including fire management, grazing, habitat condition, predation and predator activity, and species activity.
13.4 Manage species data to inform adaptive management.
13.5 Habitat assessment and modelling to determine current habitat condition and possibilities for future range expansion.
13.6 Identify areas where current habitat fragmentation poses a significant threat to tree kangaroos and develop management plans for those subpopulations.
13.7 Rehabilitate areas of degraded Dendrolagus bennettianus habitat.
13.8 Survey habitat of Dendrolagus bennettianus to assess status and extent, and identify areas of suitable habitat that may be appropriate for reintroductions or range or area of occupancy expansion.
13.9 Investigate the need to conduct assisted migration to achieve the target range expansion.
13.10 Reserve suitable habitats for the species.
14. Organisations responsible for conservation of species
14.1 Department of Environment and Resource Management (DERM) Queensland.
15. Other organisations involved
15.1 Tree Kangaroo and Mammal Group
16. Staff and other resources required for recovery to be carried out
16.1 No dedicated staff required.
17. Action costs
17.1 Total cost over 10 years exceeds A$2.5 million.
18. Note
18.1 None.
19. References
IUCN (2010) IUCN Red List of Threatened Species. Version 2010.2. http://www.iucnredlist.org. Accessed 29 June 2010.
Winter, J, Burnett, S and Martin, R (2008) Dendrolagus bennettianus. In: IUCN (2010) IUCN Red List of Threatened Species. Version 2010.2. http://www.iucnredlist.org/apps/redlist/details/2783/0. Accessed 29 June 2010.
20. Comments received
20.1 None.

95
Action Plan for Threatened Macropods 2011-2021
Table 19: List of recovery actions for Dendrolagus bennettianus, and the rationale for their contribution to recovery, and effort required.
Subpopulation Action Rationale Frequency Duration Effort
AllStatus assessment of the species - distribution and abundance
Whilst the species is relatively secure, information is required to assess those subpopulations most at risk from a range of threats, and to ensure that genetic stock is maintained.
3-Yearly 3 Months 5 People
AllStatus assessment of the species - genetics
5-Yearly 2 Months 3 People
All
Status assessment of the species - identify important subpopulations, and those subject to specific threats including habitat fragmentation.
Little is known about which subpopulations should be targeted for intensive management.
5-Yearly 2 Weeks 1 Person
AllManage data to inform adaptive management
Good data management is essential to making it possible to extract the maximum amount of information from monitoring data.
6-Monthly 1 Week 1 Person
All
Implement monitoring protocols for species activity, habitat condition, and effectiveness of management intervention.
Monitoring is essential to ensure adaptive management and achieving the species objectives.
6-Monthly 2 Weeks 4 People
All
Conduct habitat assessment and modelling to determine current habitat condition and possibilities for future range expansion.
The extent and quality of the species' habitat are probably declining. To qualify for Least Concern, the species range in the form of extent of occurrence may need to be expanded, and an understanding of potential habitat surrounding extant subpopulations will be required. Alternatively, habitat extent and condition may have to be improved significantly to avoid being listed as Vulnerable.
5-Yearly 6 Months 1 Person
All
Identify areas where current habitat fragmentation poses a significant threat to tree kangaroos, and develop management plans for rehabilitation.
Once 3 Months 1 Person
Priority subpopulations (as identified in status assessment)
Conduct forest rehabilitation for those subpopulations subject to habitat fragmentation
Habitat fragmentation may prevent the species from expanding its current range, or may hinder its ability to increase in numbers.
Once 3 Months 1 Person
Priority subpopulations (as identified in status assessment)
Reserve suitable habitat for the species.
Whilst the historical land clearing and subdivision that led to the loss of some of the species' habitat is now over for the most part, the reservation of land for this species will ensure the future security of remaining habitat.
Once Unknown 2 People
All
Conduct research into species biology, ecology and conservation requirements
Very little is known about this species, and research is required to inform adaptive conservation measures.
Once Unknown 2 People
All
Investigate need to undertake translocations to increase the species' extent of occurrence above 5,000 km2.
Once secure habitat is identified outside the current species range, it may be necessary to translocate animals to create a new subpopulation, thus bolstering the future security of the species.
Once 3 Months 1 Person

96
Action Plan for Threatened Macropods 2011-2021
Tab
le 2
0:
Lis
t of r
ecov
ery
acti
ons
for
Den
drol
agus
ben
nett
ianu
s, a
nd t
heir
cos
ts
Su
bp
op
ula
tio
nA
ctio
nY
ear
1#Y
ear
2Y
ear
3Y
ear
4Y
ear
5Y
ear
6Y
ear
7Y
ear
8Y
ear
9Y
ear
10
All
Stat
us a
sses
smen
t of t
he s
peci
es -
dist
ribu
tion
and
ab
unda
nce
$60,
000
$0$0
$65,
564
$0$0
$71,
644
$0$0
$78,
287
All
Stat
us a
sses
smen
t of t
he s
peci
es -
gene
tics
$30,
000
$0$0
$0$3
3,76
5$0
$0$0
$0$3
9,14
3
All
Stat
us a
sses
smen
t of t
he s
peci
es -
iden
tify
im
port
ant s
ubpo
pula
tion
s, a
nd th
ose
subj
ect t
o sp
ecifi
c th
reat
s in
clud
ing
habi
tat f
ragm
enta
tion
.$5
,000
$0$0
$0$5
,628
$0$0
$0$0
$0
All
Man
age
data
to in
form
ada
ptiv
e m
anag
emen
t$5
,000
$5,1
50$5
,305
$5,4
64$2
5,62
8*$5
,796
$5,9
70$6
,149
$6,3
33$2
6,52
3*
All
Impl
emen
t mon
itori
ng p
roto
cols
for s
peci
es
acti
vity
, hab
itat
con
diti
on, a
nd e
ffec
tive
ness
of
man
agem
ent i
nter
vent
ion.
$30,
000
$30,
900
$31,
827
$32,
782
$33,
765
$34,
778
$35,
822
$36,
896
$38,
003
$39,
143
All
Con
duct
hab
itat
ass
essm
ent a
nd m
odel
ling
to d
eter
min
e cu
rren
t hab
itat
con
diti
on a
nd
poss
ibili
ties
for f
utur
e ra
nge
expa
nsio
n.$2
0,00
0$2
0,60
0$0
$0$0
$25,
000
$0$0
$0$0
All
Iden
tify
are
as w
here
cur
rent
hab
itat
fr
agm
enta
tion
pos
es a
sig
nific
ant t
hrea
t to
tree
ka
ngar
oos,
and
dev
elop
man
agem
ent p
lans
for
reha
bilit
atio
n.
$10,
000
$10,
300
$0$0
$0$0
$0$0
$0$0
Prio
rity
sub
popu
lati
ons
(as
iden
tifie
d in
sta
tus
asse
ssm
ent)
Con
duct
fore
st r
ehab
ilita
tion
for t
hose
su
bpop
ulat
ions
sub
ject
to h
abit
at fr
agm
enta
tion
$0$1
00,0
00$1
03,0
00$1
06,0
90$1
09,2
73$1
12,5
51$1
15,9
27$1
19,4
05$1
22,9
87$1
26,6
77
Prio
rity
sub
popu
lati
ons
(as
iden
tifie
d in
sta
tus
asse
ssm
ent)
Res
erve
sui
tabl
e ha
bita
t for
the
spec
ies
$0$1
25,0
00$1
28,7
50$1
32,6
13$1
36,5
91$0
$0$0
$0$0
All
Con
duct
res
earc
h in
to s
peci
es b
iolo
gy, e
colo
gy a
nd
cons
erva
tion
req
uire
men
ts$0
$30,
000
$30,
900
$31,
827
$0$0
$0$0
$0$0
All
Inve
stig
ate
need
to u
nder
take
tran
sloc
atio
ns to
in
crea
se th
e sp
ecie
s' ex
tent
of o
ccur
renc
e ab
ove
5,00
0 km
2 .$0
$0$0
$0$1
0,00
0$0
$0$0
$0$0
YE
AR
LY
TO
TA
LS
$160
,00
0$3
21,9
50$2
99,7
82$3
74,3
39$3
54,6
50$1
78,1
25$2
29,3
63$1
62,4
50$1
67,3
24$3
09,7
73
GR
AN
D T
OT
AL
$2
,557
,756
#Not
e th
at a
n in
dex
of 3
% h
as b
een
appl
ied
to e
ach
succ
essi
ve y
ear o
f fun
ding
to a
ccou
nt fo
r CP
I
*Inc
lude
s 5-
year
pro
gram
revi
ew
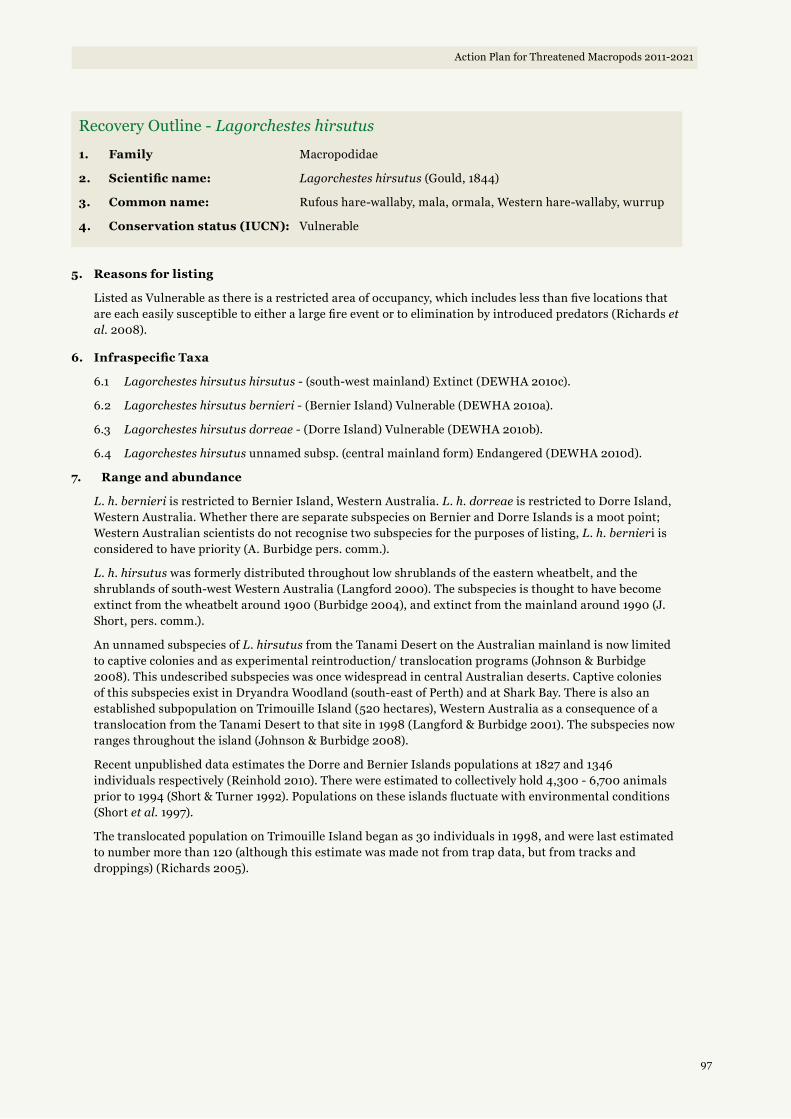
97
Action Plan for Threatened Macropods 2011-2021
Recovery Outline - Lagorchestes hirsutus
1. Family Macropodidae
2. Scientific name: Lagorchestes hirsutus (Gould, 1844)
3. Common name: Rufous hare-wallaby, mala, ormala, Western hare-wallaby, wurrup
4. Conservation status (IUCN): Vulnerable
5. Reasons for listing
Listed as Vulnerable as there is a restricted area of occupancy, which includes less than five locations that are each easily susceptible to either a large fire event or to elimination by introduced predators (Richards et al. 2008).
6. Infraspecific Taxa
6.1 Lagorchestes hirsutus hirsutus - (south-west mainland) Extinct (DEWHA 2010c).
6.2 Lagorchestes hirsutus bernieri - (Bernier Island) Vulnerable (DEWHA 2010a).
6.3 Lagorchestes hirsutus dorreae - (Dorre Island) Vulnerable (DEWHA 2010b).
6.4 Lagorchestes hirsutus unnamed subsp. (central mainland form) Endangered (DEWHA 2010d).
7. Range and abundance
L. h. bernieri is restricted to Bernier Island, Western Australia. L. h. dorreae is restricted to Dorre Island, Western Australia. Whether there are separate subspecies on Bernier and Dorre Islands is a moot point; Western Australian scientists do not recognise two subspecies for the purposes of listing, L. h. bernieri is considered to have priority (A. Burbidge pers. comm.).
L. h. hirsutus was formerly distributed throughout low shrublands of the eastern wheatbelt, and the shrublands of south-west Western Australia (Langford 2000). The subspecies is thought to have become extinct from the wheatbelt around 1900 (Burbidge 2004), and extinct from the mainland around 1990 (J. Short, pers. comm.).
An unnamed subspecies of L. hirsutus from the Tanami Desert on the Australian mainland is now limited to captive colonies and as experimental reintroduction/ translocation programs (Johnson & Burbidge 2008). This undescribed subspecies was once widespread in central Australian deserts. Captive colonies of this subspecies exist in Dryandra Woodland (south-east of Perth) and at Shark Bay. There is also an established subpopulation on Trimouille Island (520 hectares), Western Australia as a consequence of a translocation from the Tanami Desert to that site in 1998 (Langford & Burbidge 2001). The subspecies now ranges throughout the island (Johnson & Burbidge 2008).
Recent unpublished data estimates the Dorre and Bernier Islands populations at 1827 and 1346 individuals respectively (Reinhold 2010). There were estimated to collectively hold 4,300 - 6,700 animals prior to 1994 (Short & Turner 1992). Populations on these islands fluctuate with environmental conditions (Short et al. 1997).
The translocated population on Trimouille Island began as 30 individuals in 1998, and were last estimated to number more than 120 (although this estimate was made not from trap data, but from tracks and droppings) (Richards 2005).

98
Action Plan for Threatened Macropods 2011-2021
Figure 8: Known distribution of Lagorchestes hirsutus from the 2008 Global Mammal Assessment (IUCN 2010; Landsat imagery ©Commonwealth of Australia - Geoscience Australia).
8. Habitat
The mainland habitat was mainly in spinifex (Triodia spp.) hummock grasslands of the central deserts (Northern Territory, Western Australia, and South Australia). Tanami Desert colonies formerly associated with saline paleo-drainage system, sand dunes, and tight fire patterns. Large areas of spinifex desert appear suitable provided that exotic predators and rabbits are at low densities or controlled and fire is properly managed (Langford 2000).
In south-western Australia, the mala occurred on sandplains with kwongan (heath) vegetation. On Bernier and Dorre Islands, it uses this habitat together with spinifex hummock grasslands. It shelters by day in a shallow scrape dug under a spinifex hummock or low shrub and sometimes in a burrow more than 70 centimetres deep, especially during the intense heat of summer (Johnson & Burbidge 2008).
On Bernier and Dorre Islands, sandplain and sand dune habitats are covered with a vegetation of heath (with dominant species of Scaevola crassifolia, Thryptomene baeckeacea, or Melaleuca cardiophylla), grassland of Triodia plurinervata, or low scrub (often dominated by Pileanthus limacis, Diplolaena dampieri, Pimelia microcephala, Acacia rostellifera, or A. coriacea) (Short et al. 1997).
9. Threats
9.1 Climatic events such as drought, fire and changes in rainfall.
9.2 Potential threats include predation by cats and foxes which are implicated in the extinction in the wild of the mainland subspecies.
10. Information required
10.1 Exploration of suitable habitat for future translocations.
11. Recovery objectives
11.1 By 2021, Lagorchestes hirsutus is eligible for listing as Near Threatened according to IUCN Red List criteria.
11.2 By 2021, the geographic range of Lagorchestes hirsutus in the form of area of occupancy has increased to greater than 20 km2, with subpopulations secure* at greater than five locations within that range.
11.3 By 2021, numbers of mature Lagorchestes hirsutus in the wild are considered stable or increasing based on an index of abundance appropriate to the species.
11.4 By 2021, management plans have been developed and are being implemented to reduce the threats of introduced predators and fire for all subpopulations of Lagorchestes hirsutus.

99
Action Plan for Threatened Macropods 2011-2021
11.5 By 2021, the genetic diversity of Lagorchestes hirsutus has been maintained at known 2011 levels.
12. Actions completed or underway
12.1 Reintroduction of 30 mala from the Northern Territory to Trimouille Island in 1998.
12.2 Systematic monitoring of mala has been undertaken by CSIRO (1988 to 1989 and 1991 to 1992) and more recently by DEC (2006 to 2010).
13. Management actions required
13.1 Status assessment of extant subpopulations using standard protocols, including distribution, abundance, genetics, trend, risk and priority subpopulations.
13.2 Implement monitoring protocols, including fire management, habitat condition, predation and predator activity, and species activity.
13.3 Review of translocations, and factors influencing success or failure.
13.4 Manage data to inform adaptive management, and compile annual report.
13.5 Invasive predator control.
13.6 Competitor exclusion.
13.7 Disease management.
13.8 Fire management.
13.9 Fence maintenance for captive subpopulations.
13.10 Artificial feeding of captive subpopulations.
13.11 Establish additional subpopulations.
14. Organisations responsible for conservation of species
14.1 WA Department of Environment and Conservation (DEC).
14.2 NT Department of Natural Resources, Environment, the Arts and Sport (NRETAS).
15. Other organisations involved
15.1 Australian Wildlife Conservancy (AWC).
16. Staff and other resources required for recovery to be carried out
16.1 No dedicated staff required.
17. Action costs
17.1 Total cost over 10 years exceeds A$17 million.
18. Notes
18.1 None.
19. References
Burbidge, A. (2004). Lagorchestes hirsutus hirsutus. Threatened animals of Western Australia. Page 42. Kensington, Western Australia: Department of Conservation and Land Management.
Department of the Environment, Water, Heritage and the Arts (2010a) Lagorchestes hirsutus bernieri. In: Species Profile and Threats (SPRAT) Database. Department of the Environment, Water, Heritage and the Arts, Canberra. http://www.environment.gov.au/sprat. Accessed 27 October 2010.
Department of the Environment, Water, Heritage and the Arts (2010b) Lagorchestes hirsutus dorreae. In: Species Profile and Threats (SPRAT) Database. Department of the Environment, Water, Heritage and the Arts, Canberra. http://www.environment.gov.au/sprat. Accessed 27 October 2010.
Department of the Environment, Water, Heritage and the Arts (2010c) Lagorchestes hirsutus hirsutus. In: Species Profile and Threats (SPRAT) Database. Department of the Environment, Water, Heritage and the Arts, Canberra. http://www.environment.gov.au/sprat. Accessed 27 October 2010.
Department of the Environment, Water, Heritage and the Arts (2010d) Lagorchestes hirsutus unnamed subsp. In: Species Profile and Threats (SPRAT) Database. Department of the Environment, Water, Heritage and the Arts, Canberra. http://www.environment.gov.au/sprat. Accessed 27 October 2010.
IUCN (2010) IUCN Red List of Threatened Species. Version 2010.3. http://www.iucnredlist.org. Accessed 19 October 2010.
Johnson, KA and Burbidge, AA (2008) Rufous Hare Wallaby, Lagorchestes hirsutus. In The Mammals of Australia. (Eds. Van Dyck, S and Strahan, R).
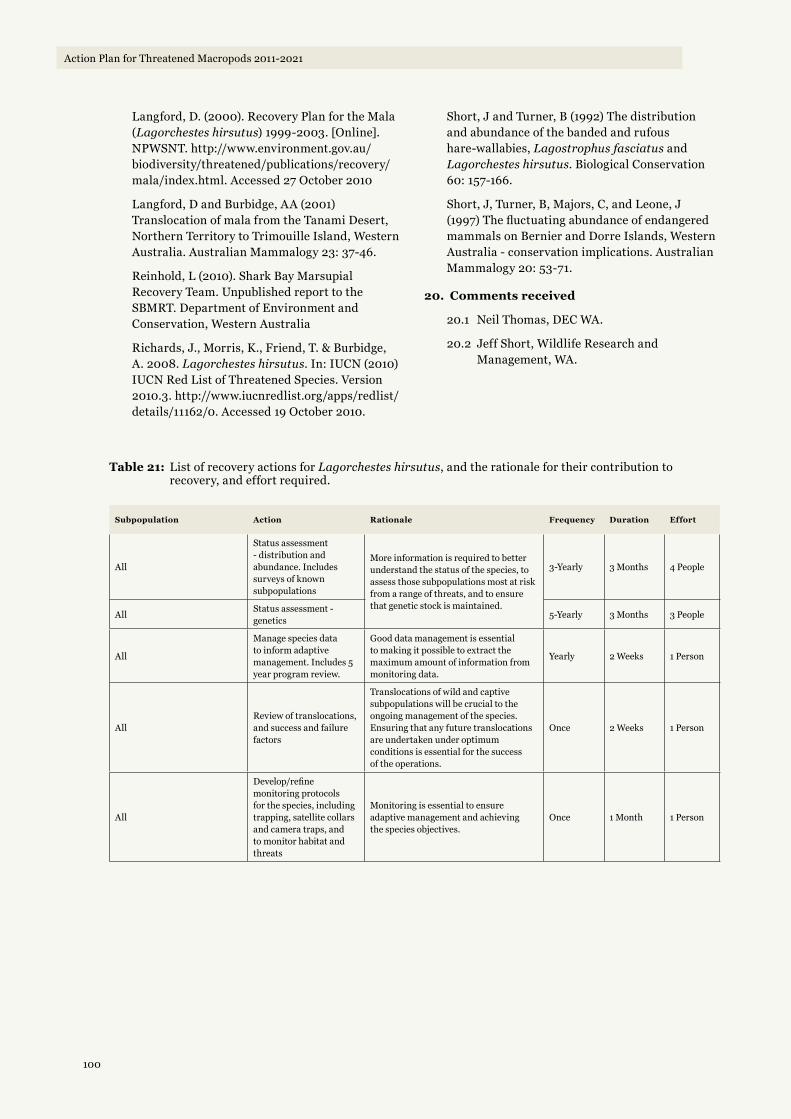
100
Action Plan for Threatened Macropods 2011-2021
Langford, D. (2000). Recovery Plan for the Mala (Lagorchestes hirsutus) 1999-2003. [Online]. NPWSNT. http://www.environment.gov.au/biodiversity/threatened/publications/recovery/mala/index.html. Accessed 27 October 2010
Langford, D and Burbidge, AA (2001) Translocation of mala from the Tanami Desert, Northern Territory to Trimouille Island, Western Australia. Australian Mammalogy 23: 37-46.
Reinhold, L (2010). Shark Bay Marsupial Recovery Team. Unpublished report to the SBMRT. Department of Environment and Conservation, Western Australia
Richards, J., Morris, K., Friend, T. & Burbidge, A. 2008. Lagorchestes hirsutus. In: IUCN (2010) IUCN Red List of Threatened Species. Version 2010.3. http://www.iucnredlist.org/apps/redlist/details/11162/0. Accessed 19 October 2010.
Short, J and Turner, B (1992) The distribution and abundance of the banded and rufous hare-wallabies, Lagostrophus fasciatus and Lagorchestes hirsutus. Biological Conservation 60: 157-166.
Short, J, Turner, B, Majors, C, and Leone, J (1997) The fluctuating abundance of endangered mammals on Bernier and Dorre Islands, Western Australia - conservation implications. Australian Mammalogy 20: 53-71.
20. Comments received
20.1 Neil Thomas, DEC WA.
20.2 Jeff Short, Wildlife Research and Management, WA.
Table 21: List of recovery actions for Lagorchestes hirsutus, and the rationale for their contribution to recovery, and effort required.
Subpopulation Action Rationale Frequency Duration Effort
All
Status assessment - distribution and abundance. Includes surveys of known subpopulations
More information is required to better understand the status of the species, to assess those subpopulations most at risk from a range of threats, and to ensure that genetic stock is maintained.
3-Yearly 3 Months 4 People
AllStatus assessment - genetics
5-Yearly 3 Months 3 People
All
Manage species data to inform adaptive management. Includes 5 year program review.
Good data management is essential to making it possible to extract the maximum amount of information from monitoring data.
Yearly 2 Weeks 1 Person
AllReview of translocations, and success and failure factors
Translocations of wild and captive subpopulations will be crucial to the ongoing management of the species. Ensuring that any future translocations are undertaken under optimum conditions is essential for the success of the operations.
Once 2 Weeks 1 Person
All
Develop/refine monitoring protocols for the species, including trapping, satellite collars and camera traps, and to monitor habitat and threats
Monitoring is essential to ensure adaptive management and achieving the species objectives.
Once 1 Month 1 Person

101
Action Plan for Threatened Macropods 2011-2021
Subpopulation Action Rationale Frequency Duration Effort
Bernier and Dorre Islands
Implement monitoring protocols for species activity, predator activity, and effectiveness of management intervention.
Monitoring is essential to ensure adaptive management and achieving the species objectives.
6-Monthly 3 weeks 4 People
Trimouille Island Yearly 1 Week 4 People
Peron Captive Breeding Facility
6-Monthly 1 Week 2 People
Scotia Sanctuary 6-Monthly 1 Week 2 People
Alice Springs Desert Park 3-Monthly 2 days 2 People
Watarrka National Park 3-Monthly 1 Week 2 People
Uluru-Kata Tjuta National Park
3-Monthly 2 days 2 People
Translocation Site 1 - Mt Gibson
6-Monthly 2 Weeks 4 People
Translocation Site 2 - TBC 6-Monthly 2 Weeks 4 People
Bernier and Dorre Islands
Implement monitoring protocols for fire management and habitat condition, and effectiveness of management intervention.
Monitoring is essential to ensure adaptive management and achieving the species objectives.
Yearly 2 Weeks 4 People
Trimouille Island Yearly 1 Week 4 People
Peron Captive Breeding Facility
Yearly 1 Day 2 People
Scotia Sanctuary Yearly 1 Week 2 People
Alice Springs Desert Park Yearly 1 Day 2 People
Watarrka National Park Yearly 1 Day 2 People
Uluru-Kata Tjuta National Park
Yearly 1 Day 2 People
Translocation Site 1 - Mt Gibson
Yearly 1 Week 4 People
Translocation Site 2 - TBC Yearly 1 Week 4 People
Bernier Island Prevent unauthorised human visitation to exclude invasive predators and competitors, and to prevent wildfires and disease incursion
The influx of unauthorised visitors to these islands could introduce feral species or contribute to habitat degradation through fire and other stressors.
Monthly 1 Week 2 People
Dorre Island Monthly 1 Week 2 People
Trimouille Island Monthly 1 Week 2 People
Island Predator Removal Predator control
The combination of wildfire and fox predation was responsible for the final demise of the wild Tanami Desert populations of the rufous hare-wallaby. Feral cats consume a wide variety of native and introduced mammals, and have been found to consume bandicoots, bettongs and hare-wallabies when available.
Unknown 6 Months 4 People
Island Competitor Removal Competitor control
There is no information available about interactions between hare-wallabies and rabbits. Despite these observations, where possible, rabbits should be controlled or eradicated to facilitate recreating past habitats and avoid the potential for intra-specific competition.
Unknown 6 Months 4 People
Bernier Island
Implement appropriate fire management to avoid catastrophic wildfires and maintain suitable mala habitat.
Changes in the mosaic of burnt and unburnt habitat due to changes in fire regimes have been implicated in the demise of the rufous hare-wallaby from the spinifex deserts of central Australia. The persistence of rufous hare-wallabies on Bernier and Dorre Islands, with their very different fire histories, suggests that a fire mosaic is not important on islands. The combination of wildfire and fox predation was responsible for the final demise of the wild Tanami Desert populations. The risk of fire on Trimouille Island is low, due to the lack of Triodia grassland, and separation of more densely vegetated areas by sand blows and sparsely vegetated dunes. No wildfires have occurred on the island since nuclear testing occurred in the 1950s.
Yearly 2 days 4 People
Dorre Island Yearly 2 days 4 People
Trimouille Island Yearly 2 days 4 People
Translocation Site 1 - Mt Gibson
Yearly 3 weeks 4 People
Translocation Site 2 - TBC Yearly 3 weeks 4 People
Peron Captive Breeding Facility
Fire Management of enclosures and sanctuaries to avoid catastrophic wildfires and maintain suitable mala habitat.
Yearly 1 Day 3 People
Scotia Sanctuary Yearly 1 Week 4 People
Alice Springs Desert Park Yearly 1 Day 3 People
Watarrka National Park Yearly 2 days 5 People
Uluru-Kata Tjuta National Park Yearly 1 Day 3 People

102
Action Plan for Threatened Macropods 2011-2021
Subpopulation Action Rationale Frequency Duration Effort
Bernier Island
Disease management and quarantine procedures to prevent disease incursion and spread
The extent of the threat of disease is unknown, however diseases in native wildlife can contribute to poor population health and reduced fertility.
Unknown 1 Month 4 People
Dorre Island Unknown 1 Month 4 People
Trimouille Island Unknown 1 Month 4 People
Translocation Site 1 - Mt Gibson
Unknown 1 Month 4 People
Translocation Site 2 - TBC Unknown 1 Month 4 People
Peron Captive Breeding Facility
Disease management in enclosures and sanctuaries, principally quarantine procedures.
Daily 1 Hour 1 Person
Scotia Sanctuary Weekly 4 Hours 1 Person
Alice Springs Desert Park Daily 1 Hour 1 Person
Watarrka National Park Daily 1 Hour 1 Person
Uluru-Kata Tjuta National Park
Daily 1 Hour 1 Person
Peron Captive Breeding Facility
Enclosure fence inspection
Captive subpopulations must be protected from feral predators. Well-maintained enclosure fences are the best means of ensuring this security.
Weekly 4 Hours 1 Person
Scotia Sanctuary Weekly 4 Hours 1 Person
Alice Springs Desert Park Weekly 4 Hours 1 Person
Watarrka National Park Weekly 4 Hours 1 Person
Uluru-Kata Tjuta National Park
Weekly 4 Hours 1 Person
Dryandra Captive Breeding Facility
Enclosure fence repairs to prevent predator/competitor ingress and escape of captive animals.
Yearly 2 days 2 People
Peron Captive Breeding Facility
Yearly 2 days 2 People
Scotia Sanctuary Yearly 2 days 2 People
Alice Springs Desert Park Yearly 2 days 2 People
Watarrka National Park Yearly 2 days 2 People
Uluru-Kata Tjuta National Park
Yearly 2 days 2 People
Peron Captive Breeding Facility
Artificial feeding/watering to stabilise captive subpopulation
Some sanctuaries and captive breeding centres may not have sufficient habitat to ensure consistent food availability.
Daily 1 Hour 1 Person
Scotia Sanctuary Weekly 4 Hours 1 Person
Alice Springs Desert Park Weekly 4 Hours 1 Person
Watarrka National Park Weekly 4 Hours 1 Person
Uluru-Kata Tjuta National Park
Weekly 4 Hours 1 Person
Translocation Site 1 - Mt Gibson
Establish secure areas of habitat for future translocations, including any necessary fencing and predator/ competitor removal
Additional subpopulations need to be established in order to meet the recovery objective of down-listing on the IUCN Red List. A minimum of ten secure subpopulations, and a corresponding increase in area of occupancy, are required for the Mala to no longer meet IUCN criterion D2.
Once 6 Months 5 People
Translocation Site 2 - TBC Once 6 Months 5 People
Translocation Site 1 - Mt Gibson
Translocation of mala to secure and managed areas of habitat
Once 3 Weeks 5 People
Translocation Site 2 - TBC Once 3 Weeks 5 People
Translocation Site 1 - Mt Gibson
Ongoing management of translocated subpopulations, including resource supplementation as required
Monthly 1 Day 2 People
Translocation Site 2 - TBC Monthly 1 Day 2 People
All
Enhance public participation and education in Mala recovery efforts
Yearly 2 days 1 Person

103
Action Plan for Threatened Macropods 2011-2021
Tab
le 2
2: L
ist o
f rec
over
y ac
tion
s fo
r La
gorc
hest
es h
irsu
tus,
and
the
ir c
osts
Su
bp
op
ula
tio
nA
ctio
nY
ear
1#Y
ear
2Y
ear
3Y
ear
4Y
ear
5Y
ear
6Y
ear
7Y
ear
8Y
ear
9Y
ear
10
All
Stat
us a
sses
smen
t - d
istr
ibut
ion
and
abun
danc
e.
Incl
udes
sur
veys
of k
now
n su
bpop
ulat
ions
$60,
000
$0$0
$65,
564
$0$0
$71,
644
$0$0
$78,
287
All
Stat
us a
sses
smen
t - g
enet
ics
$30,
000
$0$0
$0$3
3,76
5$0
$0$0
$0$3
9,14
3
All
Man
age
spec
ies
data
to in
form
ada
ptiv
e m
anag
emen
t. In
clud
es 5
yea
r pro
gram
rev
iew
.$5
,000
$5,1
50$5
,305
$5,4
64$2
5,62
8$5
,796
$5,9
70$6
,149
$6,3
33$2
6,52
3
All
Rev
iew
of t
rans
loca
tion
s, a
nd s
ucce
ss a
nd fa
ilure
fa
ctor
s$0
$5,0
00$0
$0$0
$0$0
$0$0
$0
All
Dev
elop
/refi
ne m
onito
ring
pro
toco
ls fo
r the
sp
ecie
s, in
clud
ing
trap
ping
, sat
ellit
e co
llars
and
ca
mer
a tr
aps,
and
to m
onito
r hab
itat
and
thre
ats
$10,
000
$0$0
$0$0
$0$0
$0$0
$0
Ber
nier
and
Dor
re Is
land
s
Impl
emen
t mon
itori
ng p
roto
cols
for s
peci
es
acti
vity
, pre
dato
r act
ivit
y, a
nd e
ffec
tive
ness
of
man
agem
ent i
nter
vent
ion.
$60,
000
$61,
800
$63,
654
$65,
564
$67,
531
$69,
556
$71,
643
$73,
792
$76,
006
$78,
286
Trim
ouill
e Is
land
$60,
000
$61,
800
$63,
654
$65,
564
$67,
531
$69,
556
$71,
643
$73,
792
$76,
006
$78,
286
Pero
n C
apti
ve B
reed
ing
Faci
lity
$10,
000
$10,
300
$10,
609
$10,
927
$11,
255
$11,
593
$11,
941
$12,
299
$12,
668
$13,
048
Scot
ia S
anct
uary
$20,
000
$20,
600
$21,
218
$21,
855
$22,
510
$23,
185
$23,
881
$24,
597
$25,
335
$26,
095
Alic
e Sp
ring
s D
eser
t Par
k$1
0,00
0$1
0,30
0$1
0,60
9$1
0,92
7$1
1,25
5$1
1,59
3$1
1,94
1$1
2,29
9$1
2,66
8$1
3,04
8
Wat
arrk
a N
atio
nal P
ark
$10,
000
$10,
300
$10,
609
$10,
927
$11,
255
$11,
593
$11,
941
$12,
299
$12,
668
$13,
048
Ulu
ru-K
ataT
juta
Nat
iona
l Pa
rk$1
0,00
0$1
0,30
0$1
0,60
9$1
0,92
7$1
1,25
5$1
1,59
3$1
1,94
1$1
2,29
9$1
2,66
8$1
3,04
8
Tran
sloc
atio
n Si
te 1
- M
t G
ibso
n$0
$0$3
1,82
7$3
2,78
2$3
3,76
5$3
4,77
8$3
5,82
2$3
6,89
6$3
8,00
3$3
9,14
3
Tran
sloc
atio
n Si
te 2
- T
BC
$0$0
$0$3
2,78
2$3
3,76
5$3
4,77
8$3
5,82
2$3
6,89
6$3
8,00
3$3
9,14
3
Ber
nier
and
Dor
re Is
land
s
Impl
emen
t mon
itori
ng p
roto
cols
for fi
re
man
agem
ent a
nd h
abit
at c
ondi
tion
, and
ef
fect
iven
ess
of m
anag
emen
t int
erve
ntio
n.
$30,
000
$30,
900
$31,
827
$32,
782
$33,
765
$34,
778
$35,
822
$36,
896
$38,
003
$39,
143
Trim
ouill
e Is
land
$30,
000
$30,
900
$31,
827
$32,
782
$33,
765
$34,
778
$35,
822
$36,
896
$38,
003
$39,
143
Pero
n C
apti
ve B
reed
ing
Faci
lity
$500
$515
$530
$546
$563
$580
$597
$615
$633
$652
Scot
ia S
anct
uary
$5,0
00$5
,150
$5,3
05$5
,464
$5,6
28$5
,796
$5,9
70$6
,149
$6,3
34$6
,524
Alic
e Sp
ring
s D
eser
t Par
k$5
00$5
15$5
30$5
46$5
63$5
80$5
97$6
15$6
33$6
52
Wat
arrk
a N
atio
nal P
ark
$2,0
00$2
,060
$2,1
22$2
,185
$2,2
51$2
,319
$2,3
88$2
,460
$2,5
34$2
,610
Ulu
ru-K
ataT
juta
Nat
iona
l Pa
rk$1
,000
$1,0
30$1
,061
$1,0
93$1
,126
$1,1
59$1
,194
$1,2
30$1
,267
$1,3
05
Tran
sloc
atio
n Si
te 1
- M
t G
ibso
n$1
0,00
0$1
0,30
0$1
0,60
9$1
0,92
7$1
1,25
5$1
1,59
3$1
1,94
1$1
2,29
9$1
2,66
8$1
3,04
8
Tran
sloc
atio
n Si
te 2
- T
BC
$10,
000
$10,
300
$10,
609
$10,
927
$11,
255
$11,
593
$11,
941
$12,
299
$12,
668
$13,
048

104
Action Plan for Threatened Macropods 2011-2021
Su
bp
op
ula
tio
nA
ctio
nY
ear
1#Y
ear
2Y
ear
3Y
ear
4Y
ear
5Y
ear
6Y
ear
7Y
ear
8Y
ear
9Y
ear
10
Ber
nier
Isla
ndPr
even
t una
utho
rise
d hu
man
vis
itat
ion
to e
xclu
de
inva
sive
pre
dato
rs a
nd c
ompe
tito
rs, a
nd to
pre
vent
w
ildfir
es a
nd d
isea
se in
curs
ion
$60,
000
$61,
800
$63,
654
$65,
564
$67,
531
$69,
556
$71,
643
$73,
792
$76,
006
$78,
286
Dor
re Is
land
$60,
000
$61,
800
$63,
654
$65,
564
$67,
531
$69,
556
$71,
643
$73,
792
$76,
006
$78,
286
Trim
ouill
e Is
land
$80,
000
$82,
400
$84,
872
$87,
418
$90,
041
$92,
742
$95,
524
$98,
390
$101
,342
$104
,382
Isla
nd P
reda
tor R
emov
alPr
edat
or c
ontr
ol$0
$0$0
$0$2
50,0
00$4
0,00
0$0
$0$0
$0
Isla
nd C
ompe
tito
r Rem
oval
Com
peti
tor c
ontr
ol$0
$0$0
$0$0
$0$1
20,0
00$2
0,00
0$0
$0
Ber
nier
Isla
nd
Impl
emen
t app
ropr
iate
fire
man
agem
ent t
o av
oid
cata
stro
phic
wild
fires
and
mai
ntai
n su
itab
le
mal
a ha
bita
t.
$30,
000
$30,
900
$31,
827
$32,
782
$33,
765
$34,
778
$35,
822
$36,
896
$38,
003
$39,
143
Dor
re Is
land
$30,
000
$30,
900
$31,
827
$32,
782
$33,
765
$34,
778
$35,
822
$36,
896
$38,
003
$39,
143
Trim
ouill
e Is
land
$40,
000
$41,
200
$42,
436
$43,
709
$45,
020
$46,
371
$47,
762
$49,
195
$50,
671
$52,
191
Tran
sloc
atio
n Si
te 1
- M
t G
ibso
n$2
5,00
0$2
5,75
0$2
6,52
3$2
7,31
8$2
8,13
8$2
8,98
2$2
9,85
1$3
0,74
7$3
1,66
9$3
2,61
9
Tran
sloc
atio
n Si
te 2
- T
BC
$25,
000
$25,
750
$26,
523
$27,
318
$28,
138
$28,
982
$29,
851
$30,
747
$31,
669
$32,
619
Pero
n C
apti
ve B
reed
ing
Faci
lity
Fire
Man
agem
ent o
f enc
losu
res
and
sanc
tuar
ies
to
avoi
d ca
tast
roph
ic w
ildfir
es a
nd m
aint
ain
suit
able
m
ala
habi
tat.
$1,0
00$1
,030
$1,0
61$1
,093
$1,1
26$1
,159
$1,1
94$1
,230
$1,2
67$1
,305
Scot
ia S
anct
uary
$10,
000
$10,
300
$10,
609
$10,
927
$11,
255
$11,
593
$11,
941
$12,
299
$12,
668
$13,
048
Alic
e Sp
ring
s D
eser
t Par
k$1
,000
$1,0
30$1
,061
$1,0
93$1
,126
$1,1
59$1
,194
$1,2
30$1
,267
$1,3
05
Wat
arrk
a N
atio
nal P
ark
$1,0
00$1
,030
$1,0
61$1
,093
$1,1
26$1
,159
$1,1
94$1
,230
$1,2
67$1
,305
Ulu
ru-K
ataT
juta
Nat
iona
l Pa
rk$1
,000
$1,0
30$1
,061
$1,0
93$1
,126
$1,1
59$1
,194
$1,2
30$1
,267
$1,3
05
Ber
nier
Isla
nd
Dis
ease
man
agem
ent a
nd q
uara
ntin
e pr
oced
ures
to
pre
vent
dis
ease
incu
rsio
n an
d sp
read
$10,
000
$10,
300
$10,
609
$10,
927
$11,
255
$11,
593
$11,
941
$12,
299
$12,
668
$13,
048
Dor
re Is
land
$10,
000
$10,
300
$10,
609
$10,
927
$11,
255
$11,
593
$11,
941
$12,
299
$12,
668
$13,
048
Trim
ouill
e Is
land
$10,
000
$10,
300
$10,
609
$10,
927
$11,
255
$11,
593
$11,
941
$12,
299
$12,
668
$13,
048
Tran
sloc
atio
n Si
te 1
- M
t G
ibso
n$5
,000
$5,1
50$5
,305
$5,4
64$5
,628
$5,7
96$5
,970
$6,1
49$6
,334
$6,5
24
Tran
sloc
atio
n Si
te 2
- T
BC
$5,0
00$5
,150
$5,3
05$5
,464
$5,6
28$5
,796
$5,9
70$6
,149
$6,3
34$6
,524
Pero
n C
apti
ve B
reed
ing
Faci
lity
Dis
ease
man
agem
ent i
n en
clos
ures
and
sa
nctu
arie
s, p
rinc
ipal
ly q
uara
ntin
e pr
oced
ures
.
$1,0
00$1
,030
$1,0
61$1
,093
$1,1
26$1
,159
$1,1
94$1
,230
$1,2
67$1
,305
Scot
ia S
anct
uary
$1,0
00$1
,030
$1,0
61$1
,093
$1,1
26$1
,159
$1,1
94$1
,230
$1,2
67$1
,305
Alic
e Sp
ring
s D
eser
t Par
k$1
,000
$1,0
30$1
,061
$1,0
93$1
,126
$1,1
59$1
,194
$1,2
30$1
,267
$1,3
05
Wat
arrk
a N
atio
nal P
ark
$1,0
00$1
,030
$1,0
61$1
,093
$1,1
26$1
,159
$1,1
94$1
,230
$1,2
67$1
,305
Ulu
ru-K
ataT
juta
Nat
iona
l Pa
rk$1
,000
$1,0
30$1
,061
$1,0
93$1
,126
$1,1
59$1
,194
$1,2
30$1
,267
$1,3
05

105
Action Plan for Threatened Macropods 2011-2021
Su
bp
op
ula
tio
nA
ctio
nY
ear
1#Y
ear
2Y
ear
3Y
ear
4Y
ear
5Y
ear
6Y
ear
7Y
ear
8Y
ear
9Y
ear
10
Pero
n C
apti
ve B
reed
ing
Faci
lity
Enc
losu
re fe
nce
insp
ecti
on
$1,0
00$1
,030
$1,0
61$1
,093
$1,1
26$1
,159
$1,1
94$1
,230
$1,2
67$1
,305
Scot
ia S
anct
uary
$2,0
00$2
,060
$2,1
22$2
,185
$2,2
51$2
,319
$2,3
88$2
,460
$2,5
34$2
,610
Alic
e Sp
ring
s D
eser
t Par
k$1
,000
$1,0
30$1
,061
$1,0
93$1
,126
$1,1
59$1
,194
$1,2
30$1
,267
$1,3
05
Wat
arrk
a N
atio
nal P
ark
$1,0
00$1
,030
$1,0
61$1
,093
$1,1
26$1
,159
$1,1
94$1
,230
$1,2
67$1
,305
Ulu
ru-K
ataT
juta
Nat
iona
l Pa
rk$1
,000
$1,0
30$1
,061
$1,0
93$1
,126
$1,1
59$1
,194
$1,2
30$1
,267
$1,3
05
Pero
n C
apti
ve B
reed
ing
Faci
lity
Enc
losu
re fe
nce
repa
irs
to p
reve
nt p
reda
tor/
com
peti
tor i
ngre
ss a
nd e
scap
e of
cap
tive
ani
mal
s.
$10,
000
$10,
300
$10,
609
$10,
927
$11,
255
$11,
593
$11,
941
$12,
299
$12,
668
$13,
048
Scot
ia S
anct
uary
$20,
000
$20,
600
$21,
218
$21,
855
$22,
510
$23,
185
$23,
881
$24,
597
$25,
335
$26,
095
Alic
e Sp
ring
s D
eser
t Par
k$1
0,00
0$1
0,30
0$1
0,60
9$1
0,92
7$1
1,25
5$1
1,59
3$1
1,94
1$1
2,29
9$1
2,66
8$1
3,04
8
Wat
arrk
a N
atio
nal P
ark
$10,
000
$10,
300
$10,
609
$10,
927
$11,
255
$11,
593
$11,
941
$12,
299
$12,
668
$13,
048
Ulu
ru-K
ataT
juta
Nat
iona
l Pa
rk$1
0,00
0$1
0,30
0$1
0,60
9$1
0,92
7$1
1,25
5$1
1,59
3$1
1,94
1$1
2,29
9$1
2,66
8$1
3,04
8
Pero
n C
apti
ve B
reed
ing
Faci
lity
Art
ifici
al fe
edin
g/w
ater
ing
to m
aint
ain
capt
ive
subp
opul
atio
n
$2,0
00$2
,060
$2,1
22$0
$0$0
$0$0
$0$0
Scot
ia S
anct
uary
$5,0
00$5
,150
$5,3
05$0
$0$0
$0$0
$0$0
Alic
e Sp
ring
s D
eser
t Par
k$2
,000
$2,0
60$2
,122
$0$0
$0$0
$0$0
$0
Wat
arrk
a N
atio
nal P
ark
$2,0
00$2
,060
$2,1
22$0
$0$0
$0$0
$0$0
Ulu
ru-K
ataT
juta
Nat
iona
l Pa
rk$2
,000
$2,0
60$2
,122
$0$0
$0$0
$0$0
$0
Tran
sloc
atio
n Si
te 1
- M
t G
ibso
nE
stab
lish
secu
re a
reas
of h
abit
at fo
r fut
ure
tran
sloc
atio
ns, i
nclu
ding
any
nec
essa
ry fe
ncin
g an
d pr
edat
or/
com
peti
tor r
emov
al
$0$0
$1,0
60,9
00$1
,092
,727
$1,1
25,5
09$0
$0$0
$0$0
Tran
sloc
atio
n Si
te 2
- T
BC
$0$0
$0$1
,092
,727
$1,1
25,5
09$1
,159
,274
$0$0
$0$0
Tran
sloc
atio
n Si
te 1
- M
t G
ibso
nTr
ansl
ocat
ion
of m
ala
to s
ecur
e an
d m
anag
ed
area
s of
hab
itat
$0$0
$0$0
$60,
000
$0$0
$0$0
$0
Tran
sloc
atio
n Si
te 2
- T
BC
$0$0
$0$0
$0$6
1,80
0$0
$0$0
$0
Tran
sloc
atio
n Si
te 1
- M
t G
ibso
nO
ngoi
ng m
anag
emen
t of t
rans
loca
ted
subp
opul
atio
ns, i
nclu
ding
res
ourc
e su
pple
men
tati
on a
s re
quir
ed
$0$0
$0$0
$60,
000
$30,
000
$30,
900
$31,
827
$32,
782
$33,
765
Tran
sloc
atio
n Si
te 2
- T
BC
$0$0
$0$0
$0$6
1,80
0$3
0,90
0$3
1,82
7$3
2,78
2$3
3,76
5
All
Enh
ance
pub
lic p
arti
cipa
tion
and
edu
cati
on in
M
ala
reco
very
eff
orts
$5,0
00$5
,150
$5,3
05$5
,464
$5,6
28$5
,796
$5,9
70$6
,149
$6,3
34$6
,524
YE
AR
LY
TO
TA
LS
$867
,000
$795
,010
$1,9
06,4
37$3
,140
,498
$3,5
90,9
47$2
,296
,523
$1,2
25,4
02$1
,084
,771
$1,0
96,7
14$1
,267
,045
GR
AN
D T
OT
AL
$17,
270
,34
9
#Not
e th
at a
n in
dex
of 3
% h
as b
een
appl
ied
to e
ach
succ
essi
ve y
ear o
f fun
ding
to a
ccou
nt fo
r CP
I
*Inc
lude
s 5-
year
pro
gram
revi
ew

106
Action Plan for Threatened Macropods 2011-2021
Recovery Outline - Lagostrophus fasciatus
1. Family Macropodidae
2. Scientific name: Lagostrophus fasciatus (Péron & Lesueur,1807)
3. Common name: Banded hare-wallaby, Munning
4. Conservation status (IUCN): Endangered; B1ac(iv)+2ac(iv)
5. Reasons for listing
Listed as Endangered in view of its extent of occurrence of less than 5,000 km2 and area of occupancy of less than 500 km2, with all individuals in fewer than six locations, and extreme fluctuations in the number of mature individuals due to periods of severe drought. Additional potential threats that are major include: the accidental introduction of predators (introduced cats and foxes), extensive fire, and disease (Richards et al. 2008).
Listed as Vulnerable under the EPBC Act 1999 (DEWHA 2010).
6. Infraspecific Taxa
6.1 Lagostrophus fasciatus fasciatus - Bernier and Dorre Islands
6.2 Lagostrophus fasciatus albipilis - south-western Western Australia (extinct)
6.3 Lagostrophus fasciatus baudinettei - South Australia (extinct)
7. Range and abundance
This species is endemic to Australia, where it was formerly present on the mainland from south-western parts of the country to the lower Murray River region. It is now restricted to the offshore Bernier and Dorre Islands in Shark Bay, Western Australia (Short & Turner 1992). A small population was recently reintroduced to Faure Island (Prince and Richards 2008).
Figure 9: Known distribution of Lagostrophus fasciatus from the 2008 Global Mammal Assessment (IUCN 2010; Landsat imagery ©Commonwealth of Australia - Geoscience Australia).
Recent surveys for this species estimate the number on Bernier Island as 1807 individuals and on Dorre Is as 2294 individuals (Reinhold 2010). Surveys in 1988/89 indicated a total population of about 7,700
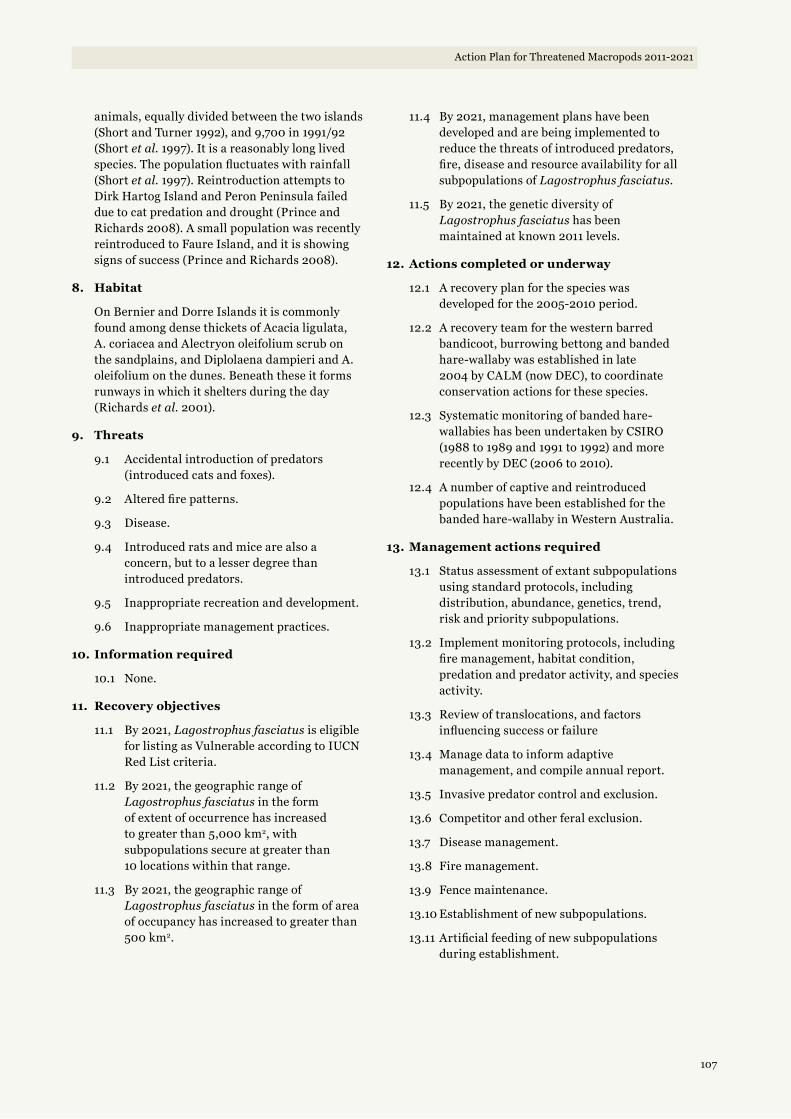
107
Action Plan for Threatened Macropods 2011-2021
animals, equally divided between the two islands (Short and Turner 1992), and 9,700 in 1991/92 (Short et al. 1997). It is a reasonably long lived species. The population fluctuates with rainfall (Short et al. 1997). Reintroduction attempts to Dirk Hartog Island and Peron Peninsula failed due to cat predation and drought (Prince and Richards 2008). A small population was recently reintroduced to Faure Island, and it is showing signs of success (Prince and Richards 2008).
8. Habitat
On Bernier and Dorre Islands it is commonly found among dense thickets of Acacia ligulata, A. coriacea and Alectryon oleifolium scrub on the sandplains, and Diplolaena dampieri and A. oleifolium on the dunes. Beneath these it forms runways in which it shelters during the day (Richards et al. 2001).
9. Threats
9.1 Accidental introduction of predators (introduced cats and foxes).
9.2 Altered fire patterns.
9.3 Disease.
9.4 Introduced rats and mice are also a concern, but to a lesser degree than introduced predators.
9.5 Inappropriate recreation and development.
9.6 Inappropriate management practices.
10. Information required
10.1 None.
11. Recovery objectives
11.1 By 2021, Lagostrophus fasciatus is eligible for listing as Vulnerable according to IUCN Red List criteria.
11.2 By 2021, the geographic range of Lagostrophus fasciatus in the form of extent of occurrence has increased to greater than 5,000 km2, with subpopulations secure at greater than 10 locations within that range.
11.3 By 2021, the geographic range of Lagostrophus fasciatus in the form of area of occupancy has increased to greater than 500 km2.
11.4 By 2021, management plans have been developed and are being implemented to reduce the threats of introduced predators, fire, disease and resource availability for all subpopulations of Lagostrophus fasciatus.
11.5 By 2021, the genetic diversity of Lagostrophus fasciatus has been maintained at known 2011 levels.
12. Actions completed or underway
12.1 A recovery plan for the species was developed for the 2005-2010 period.
12.2 A recovery team for the western barred bandicoot, burrowing bettong and banded hare-wallaby was established in late 2004 by CALM (now DEC), to coordinate conservation actions for these species.
12.3 Systematic monitoring of banded hare-wallabies has been undertaken by CSIRO (1988 to 1989 and 1991 to 1992) and more recently by DEC (2006 to 2010).
12.4 A number of captive and reintroduced populations have been established for the banded hare-wallaby in Western Australia.
13. Management actions required
13.1 Status assessment of extant subpopulations using standard protocols, including distribution, abundance, genetics, trend, risk and priority subpopulations.
13.2 Implement monitoring protocols, including fire management, habitat condition, predation and predator activity, and species activity.
13.3 Review of translocations, and factors influencing success or failure
13.4 Manage data to inform adaptive management, and compile annual report.
13.5 Invasive predator control and exclusion.
13.6 Competitor and other feral exclusion.
13.7 Disease management.
13.8 Fire management.
13.9 Fence maintenance.
13.10 Establishment of new subpopulations.
13.11 Artificial feeding of new subpopulations during establishment.

108
Action Plan for Threatened Macropods 2011-2021
14. Organisations responsible for conservation of species
14.1 Department of Environment and Conservation (DEC) WA.
15. Other organisations involved
15.1 Australian Wildlife Conservancy (AWC).
16. Staff and other resources required for recovery to be carried out
16.1 No dedicated staff required.
17. Action costs
17.1 Total cost over 10 years exceeds A$19 million.
18. Notes
18.1 None.
19. References
Department of the Environment, Water, Heritage and the Arts (DEWHA) (2010) Lagostrophus fasciatus. In: Species Profile and Threats (SPRAT) Database. Department of the Environment, Water, Heritage and the Arts, Canberra. http://www.environment.gov.au/sprat. Accessed 27 October 2010.
IUCN (2010) IUCN Red List of Threatened Species. Version 20103. http://www.iucnredlist.org. Accessed 28 September 2010.
Prince, RIT and Richards, JD (2008) Banded Hare Wallaby, Lagostrophus fasciatus. In The Mammals of Australia. (Eds. Van Dyck, S and Strahan, R).
Reinhold, L (2010). Shark Bay Marsupial Recovery Team. Unpublished report to the SBMRT. Department of Environment and Conservation, Western Australia
Richards, J, Morris, K, Burbidge, A & Friend, T (2008) Lagostrophus fasciatus. In: IUCN 2010. IUCN Red List of Threatened Species. Version 2010.3
http://www.iucnredlist.org/apps/redlist/details/11171/0. Accessed 27 September 2010.
Richards, J (2007) Western Barred Bandicoot Perameles bougainville, Burrowing Bettong Bettongia lesueur and Banded Hare-Wallaby Lagostrophus fasciatus Recovery Plan 2007 -2011. Department of Environment and Conservation, Western Australia.
Richards, JD, Short, J, Prince, RIT, Friend, JA, and Courtenay, JM (2001) Biology of banded and rufous hare-wallabies (Lagostrophus fasciatus and Lagorchestes hirsutus) (Diprotodontia: Macropodidae) on Dorre and Bernier Islands, Western Australia. Wildlife Research 28: 311-322.
Short, J (2009) The characteristics and success of vertebrate translocations within Australia. Report to the Department of Agriculture, Fisheries and Forestry.
Short, J, Bradshaw, SD, Giles, JR, Prince, RIT, and Wilson, GR (1992) Reintroduction of macropods (Marsupialia: Macropodoidea) in Australia - a review. Biological Conservation 62: 189-204.
Short, J and Turner, B (1992) The distribution and abundance of the banded and rufous hare-wallabies, Lagostrophus fasciatus and Lagorchestes hirsutus. Biological Conservation 60: 157–166.
Short, J, Turner, B, Majors, C and Leone, J (1997) The fluctuating abundance of endangered mammals on Bernier and Dorre Islands, Western Australia - conservation implications. Australian Mammalogy 20: 53-61.
20. Comments received
20.1 Jeff Short, Wildlife Research and Management, WA.
20.2 Neil Thomas, DEC WA.
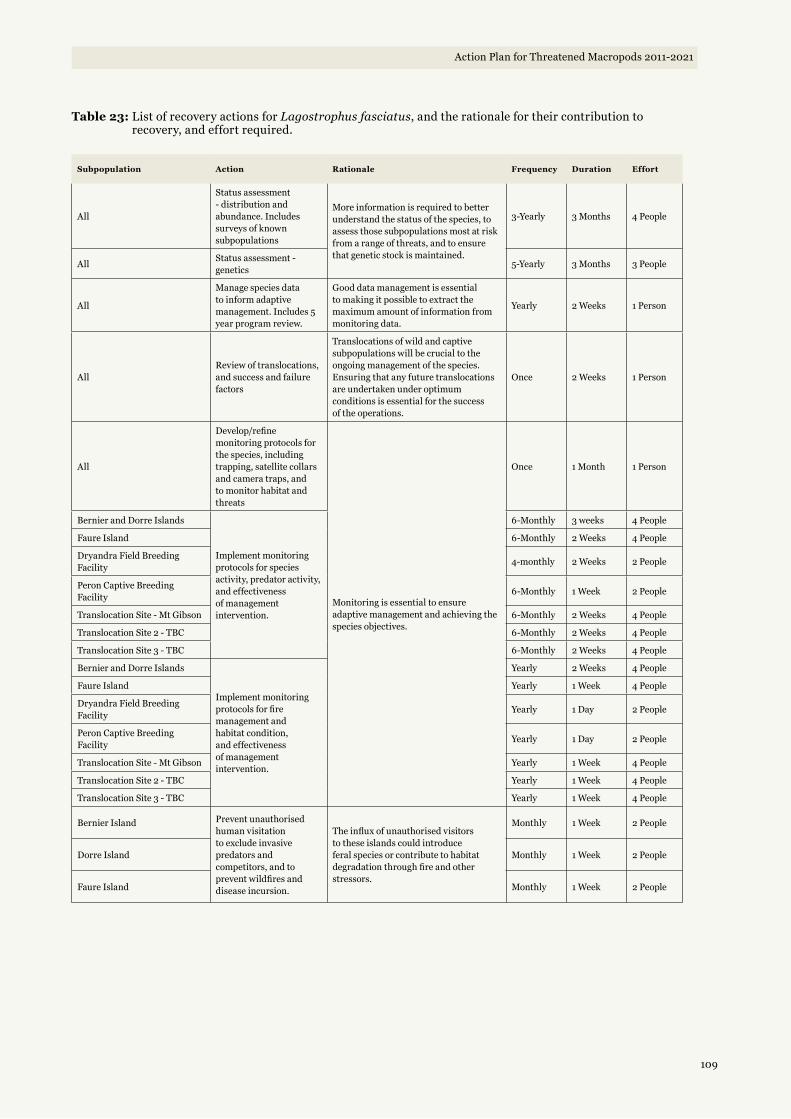
109
Action Plan for Threatened Macropods 2011-2021
Table 23: List of recovery actions for Lagostrophus fasciatus, and the rationale for their contribution to recovery, and effort required.
Subpopulation Action Rationale Frequency Duration Effort
All
Status assessment - distribution and abundance. Includes surveys of known subpopulations
More information is required to better understand the status of the species, to assess those subpopulations most at risk from a range of threats, and to ensure that genetic stock is maintained.
3-Yearly 3 Months 4 People
AllStatus assessment - genetics
5-Yearly 3 Months 3 People
All
Manage species data to inform adaptive management. Includes 5 year program review.
Good data management is essential to making it possible to extract the maximum amount of information from monitoring data.
Yearly 2 Weeks 1 Person
AllReview of translocations, and success and failure factors
Translocations of wild and captive subpopulations will be crucial to the ongoing management of the species. Ensuring that any future translocations are undertaken under optimum conditions is essential for the success of the operations.
Once 2 Weeks 1 Person
All
Develop/refine monitoring protocols for the species, including trapping, satellite collars and camera traps, and to monitor habitat and threats
Monitoring is essential to ensure adaptive management and achieving the species objectives.
Once 1 Month 1 Person
Bernier and Dorre Islands
Implement monitoring protocols for species activity, predator activity, and effectiveness of management intervention.
6-Monthly 3 weeks 4 People
Faure Island 6-Monthly 2 Weeks 4 People
Dryandra Field Breeding Facility
4-monthly 2 Weeks 2 People
Peron Captive Breeding Facility
6-Monthly 1 Week 2 People
Translocation Site - Mt Gibson 6-Monthly 2 Weeks 4 People
Translocation Site 2 - TBC 6-Monthly 2 Weeks 4 People
Translocation Site 3 - TBC 6-Monthly 2 Weeks 4 People
Bernier and Dorre Islands
Implement monitoring protocols for fire management and habitat condition, and effectiveness of management intervention.
Yearly 2 Weeks 4 People
Faure Island Yearly 1 Week 4 People
Dryandra Field Breeding Facility
Yearly 1 Day 2 People
Peron Captive Breeding Facility
Yearly 1 Day 2 People
Translocation Site - Mt Gibson Yearly 1 Week 4 People
Translocation Site 2 - TBC Yearly 1 Week 4 People
Translocation Site 3 - TBC Yearly 1 Week 4 People
Bernier Island Prevent unauthorised human visitation to exclude invasive predators and competitors, and to prevent wildfires and disease incursion.
The influx of unauthorised visitors to these islands could introduce feral species or contribute to habitat degradation through fire and other stressors.
Monthly 1 Week 2 People
Dorre Island Monthly 1 Week 2 People
Faure Island Monthly 1 Week 2 People

110
Action Plan for Threatened Macropods 2011-2021
Subpopulation Action Rationale Frequency Duration Effort
Island Predator Removal Predator control
The decline of the banded hare-wallaby from the mainland was likely to be due to a combination of predation by feral cats and habitat destruction.
Unknown 6 Months 4 People
Island Competitor Removal Competitor control
The introduction of rabbits, rats and mice poses a threat to banded hare-wallabies on islands. Introduced herbivores had altered the vegetation so that refuge areas during periods of drought were no longer available. This habitat degradation, combined with the impact of introduced predators and changes in fire regimes in some areas, was thought to have increased the risk of local extinctions of native mammals. There is no information available about interactions between banded hare-wallabies and rabbits. Despite these observations, where possible, rabbits should be excluded to facilitate recreating past habitats, and avoid the potential for intra-specific competition.
Unknown 6 Months 4 People
Bernier Island
Implement appropriate fire management to avoid catastrophic wildfires and maintain suitable hare-wallaby habitat.
The persistence of banded hare-wallabies on Bernier and Dorre Islands, with their very different fire histories, the infrequent nature of fire in the region, and the lack of introduced predators, suggests that a fire mosaic is not important on islands.
Yearly 1 Week 4 People
Dorre Island Yearly 1 Week 4 People
Faure Island Yearly 1 Week 4 People
Translocation Site - Mt Gibson Yearly 2 Weeks 4 People
Translocation Site 2 - TBC Yearly 2 Weeks 4 People
Translocation Site 3 - TBC Yearly 2 Weeks 4 People
Dryandra Captive Breeding Facility
Fire management of enclosures and sanctuaries to avoid catastrophic wildfires and maintain suitable hare-wallaby habitat.
Fire is more of an issue at sites such as Dryandra Woodland and Scotia Wildlife Sanctuary, however DEC and AWC have implemented fire management regimes in these areas.
Yearly 2 days 5 People
Peron Captive Breeding Facility
Yearly 1 Day 3 People
Bernier Island Disease management and quarantine procedures to prevent disease incursion and spread
The extent of the threat of disease is unknown, however diseases in native wildlife can contribute to poor population health and reduced fertility.
Unknown 1 Month 4 People
Dorre Island Unknown 1 Month 4 People
Faure Island Unknown 1 Month 4 People
Dryandra Captive Breeding Facility
Disease management in enclosures and sanctuaries, principally quarantine procedures.
Daily 1 Hour 1 Person
Peron Captive Breeding Facility
Daily 1 Hour 1 Person
Dryandra Captive Breeding Facility Enclosure fence
inspection Captive subpopulations must be protected from feral predators. Well-maintained enclosure fences are the best means of ensuring this security.
Weekly 4 Hours 1 Person
Peron Captive Breeding Facility
Weekly 4 Hours 1 Person
Dryandra Captive Breeding Facility
Enclosure fence repairs to prevent predator/competitor ingress and escape of captive animals.
Yearly 2 days 2 People
Peron Captive Breeding Facility
Yearly 2 days 2 People
Dryandra Captive Breeding Facility Artificial feeding/
watering to establish captive subpopulations
Some sanctuaries and captive breeding centres may not have sufficient habitat to ensure consistent food availability.
Weekly 4 Hours 1 Person
Peron Captive Breeding Facility
Daily 1 Hour 1 Person

111
Action Plan for Threatened Macropods 2011-2021
Subpopulation Action Rationale Frequency Duration Effort
Translocation Site - Mt Gibson Establish secure areas of habitat for future translocations, including any necessary fencing and predator/ competitor removal
Additional subpopulations need to be established in order to achieve eligibility to be down-listed to Near Threatened. A minimum of ten secure subpopulations will ensure that the banded hare-wallaby no longer meets the IUCN criteria B1 and B2, as long as the establishment increases the 2011 area of occupancy and extent of occurrence of the species. Captive source subpopulations are essential to increase wild and translocated subpopulations to a minimum viable number. The 6000 ha Stage 3 at Scotia is planned for fencing in the near future. This will provide an increased carrying capacity at Scotia. Similarly, Mount Gibson Sanctuary will have a 6000 ha fenced and feral free section within the next 3 years.
Once 6 Months 5 People
Translocation Site 2 - TBC Once 6 Months 5 People
Translocation Site 3 - TBC Once 6 Months 5 People
Translocation Site - Mt GibsonTranslocation of hare-wallabies to secure and managed areas of habitat
Once 3 Weeks 5 People
Translocation Site 2 - TBC Once 3 Weeks 5 People
Translocation Site 3 - TBC Once 3 Weeks 5 People
Translocation Site - Mt Gibson Ongoing management of translocated subpopulations, including resource supplementation as required
Monthly 1 Day 2 People
Translocation Site 2 - TBC Monthly 1 Day 2 People
Translocation Site 3 - TBC Monthly 1 Day 2 People
All
Enhance public participation and education in banded hare-wallaby recovery efforts
Yearly 2 days 1 Person

112
Action Plan for Threatened Macropods 2011-2021
Tab
le 2
4: L
ist o
f rec
over
y ac
tion
s La
gost
roph
us fa
scia
tus,
and
the
ir c
osts
Su
bp
op
ula
tio
nA
ctio
nY
ear
1#Y
ear
2Y
ear
3Y
ear
4Y
ear
5Y
ear
6Y
ear
7Y
ear
8Y
ear
9Y
ear
10
All
Stat
us a
sses
smen
t - d
istr
ibut
ion
and
abun
danc
e.
Incl
udes
sur
veys
of k
now
n su
bpop
ulat
ions
$60,
000
$0$0
$65,
564
$0$0
$71,
644
$0$0
$78,
287
All
Stat
us a
sses
smen
t - g
enet
ics
$30,
000
$0$0
$0$3
3,76
5$0
$0$0
$0$3
9,14
3
All
Man
age
spec
ies
data
to in
form
ada
ptiv
e m
anag
emen
t. In
clud
es 5
yea
r pro
gram
rev
iew
.$5
,000
$5,1
50$5
,305
$5,4
64$2
5,62
8*$5
,796
$5,9
70$6
,149
$6,3
33$2
6,52
3*
All
Rev
iew
of t
rans
loca
tion
s, a
nd s
ucce
ss a
nd fa
ilure
fa
ctor
s$0
$5,0
00$0
$0$0
$0$0
$0$0
$0
All
Dev
elop
/refi
ne m
onito
ring
pro
toco
ls fo
r the
sp
ecie
s, in
clud
ing
trap
ping
, sat
ellit
e co
llars
and
ca
mer
a tr
aps,
and
to m
onito
r hab
itat
and
thre
ats
$10,
000
$0$0
$0$0
$5,0
00$0
$0$0
$0
Ber
nier
and
Dor
re Is
land
s
Impl
emen
t mon
itori
ng p
roto
cols
for s
peci
es
acti
vity
, pre
dato
r act
ivit
y, a
nd e
ffec
tive
ness
of
man
agem
ent i
nter
vent
ion.
$60,
000
$61,
800
$63,
654
$65,
564
$67,
531
$69,
556
$71,
643
$73,
792
$76,
006
$78,
286
Faur
e Is
land
$40,
000
$41,
200
$42,
436
$43,
709
$45,
020
$46,
371
$47,
762
$49,
195
$50,
671
$52,
191
Dry
andr
a Fi
eld
Bre
edin
g Fa
cilit
y$1
0,00
0$1
0,30
0$1
0,60
9$1
0,92
7$1
1,25
5$1
1,59
3$1
1,94
1$1
2,29
9$1
2,66
8$1
3,04
8
Pero
n C
apti
ve B
reed
ing
Faci
lity
$10,
000
$10,
300
$10,
609
$10,
927
$11,
255
$11,
593
$11,
941
$12,
299
$12,
668
$13,
048
Tran
sloc
atio
n Si
te -
Mt G
ibso
n$0
$0$3
1,82
7$3
2,78
2$3
3,76
5$3
4,77
8$3
5,82
2$3
6,89
6$3
8,00
3$3
9,14
3
Tran
sloc
atio
n Si
te 2
- T
BC
$0$0
$0$3
2,78
2$3
3,76
5$3
4,77
8$3
5,82
2$3
6,89
6$3
8,00
3$3
9,14
3
Tran
sloc
atio
n Si
te 3
- T
BC
$0$0
$0$0
$33,
765
$34,
778
$35,
821
$36,
896
$38,
003
$39,
143
Ber
nier
and
Dor
re Is
land
s
Impl
emen
t mon
itori
ng p
roto
cols
for fi
re
man
agem
ent a
nd h
abit
at c
ondi
tion
, and
ef
fect
iven
ess
of m
anag
emen
t int
erve
ntio
n.
$30,
000
$30,
900
$31,
827
$32,
782
$33,
765
$34,
778
$35,
822
$36,
896
$38,
003
$39,
143
Faur
e Is
land
$20,
000
$20,
600
$21,
218
$21,
855
$22,
510
$23,
185
$23,
881
$24,
597
$25,
335
$26,
095
Dry
andr
a Fi
eld
Bre
edin
g Fa
cilit
y$5
,000
$5,1
50$5
,305
$5,4
64$5
,628
$5,7
96$5
,970
$6,1
49$6
,334
$6,5
24
Pero
n C
apti
ve B
reed
ing
Faci
lity
$500
$515
$530
$546
$563
$580
$597
$615
$633
$652
Tran
sloc
atio
n Si
te -
Mt G
ibso
n$1
0,00
0$1
0,30
0$1
0,60
9$1
0,92
7$1
1,25
5$1
1,59
3$1
1,94
1$1
2,29
9$1
2,66
8$1
3,04
8
Tran
sloc
atio
n Si
te 2
- T
BC
$10,
000
$10,
300
$10,
609
$10,
927
$11,
255
$11,
593
$11,
941
$12,
299
$12,
668
$13,
048
Tran
sloc
atio
n Si
te 3
- T
BC
$10,
000
$10,
300
$10,
609
$10,
927
$11,
255
$11,
593
$11,
941
$12,
299
$12,
668
$13,
048

113
Action Plan for Threatened Macropods 2011-2021
Su
bp
op
ula
tio
nA
ctio
nY
ear
1#Y
ear
2Y
ear
3Y
ear
4Y
ear
5Y
ear
6Y
ear
7Y
ear
8Y
ear
9Y
ear
10
Ber
nier
Isla
ndPr
even
t una
utho
rise
d hu
man
vis
itat
ion
to e
xclu
de
inva
sive
pre
dato
rs a
nd c
ompe
tito
rs, a
nd to
pre
vent
w
ildfir
es a
nd d
isea
se in
curs
ion.
$60,
000
$61,
800
$63,
654
$65,
564
$67,
531
$69,
556
$71,
643
$73,
792
$76,
006
$78,
286
Dor
re Is
land
$60,
000
$61,
800
$63,
654
$65,
564
$67,
531
$69,
556
$71,
643
$73,
792
$76,
006
$78,
286
Faur
e Is
land
$40,
000
$41,
200
$42,
436
$43,
709
$45,
020
$46,
371
$47,
762
$49,
195
$50,
671
$52,
191
Isla
nd P
reda
tor R
emov
alPr
edat
or c
ontr
ol$0
$0$0
$0$2
50,0
00$4
0,00
0$0
$0$0
$0
Isla
nd C
ompe
tito
r Rem
oval
Com
peti
tor c
ontr
ol$0
$0$0
$0$0
$0$1
20,0
00$2
0,00
0$0
$0
Ber
nier
Isla
nd
Impl
emen
t app
ropr
iate
fire
man
agem
ent t
o av
oid
cata
stro
phic
wild
fires
and
mai
ntai
n su
itab
le h
are-
wal
laby
hab
itat
.
$30,
000
$30,
900
$31,
827
$32,
782
$33,
765
$34,
778
$35,
822
$36,
896
$38,
003
$39,
143
Dor
re Is
land
$30,
000
$30,
900
$31,
827
$32,
782
$33,
765
$34,
778
$35,
822
$36,
896
$38,
003
$39,
143
Faur
e Is
land
$30,
000
$30,
900
$31,
827
$32,
782
$33,
765
$34,
778
$35,
822
$36,
896
$38,
003
$39,
143
Tran
sloc
atio
n Si
te -
Mt G
ibso
n$0
$0$3
1,82
7$3
2,78
2$3
3,76
5$3
4,77
8$3
5,82
2$3
6,89
6$3
8,00
3$3
9,14
3
Tran
sloc
atio
n Si
te 2
- T
BC
$0$0
$0$3
2,78
2$3
3,76
5$3
4,77
8$3
5,82
2$3
6,89
6$3
8,00
3$3
9,14
3
Tran
sloc
atio
n Si
te 3
- T
BC
$0$0
$0$0
$33,
765
$34,
778
$35,
821
$36,
896
$38,
003
$39,
143
Dry
andr
a C
apti
ve B
reed
ing
Faci
lity
Fire
Man
agem
ent o
f enc
losu
res
and
sanc
tuar
ies
to
avoi
d ca
tast
roph
ic w
ildfir
es a
nd m
aint
ain
suit
able
ha
re-w
alla
by h
abit
at.
$1,0
00$1
,030
$1,0
61$1
,093
$1,1
26$1
,159
$1,1
94$1
,230
$1,2
67$1
,305
Pero
n C
apti
ve B
reed
ing
Faci
lity
$1,0
00$1
,030
$1,0
61$1
,093
$1,1
26$1
,159
$1,1
94$1
,230
$1,2
67$1
,305
Ber
nier
Isla
ndD
isea
se m
anag
emen
t and
qua
rant
ine
proc
edur
es
to p
reve
nt d
isea
se in
curs
ion
and
spre
ad
$10,
000
$10,
300
$10,
609
$10,
927
$11,
255
$11,
593
$11,
941
$12,
299
$12,
668
$13,
048
Dor
re Is
land
$10,
000
$10,
300
$10,
609
$10,
927
$11,
255
$11,
593
$11,
941
$12,
299
$12,
668
$13,
048
Faur
e Is
land
$10,
000
$10,
300
$10,
609
$10,
927
$11,
255
$11,
593
$11,
941
$12,
299
$12,
668
$13,
048
Dry
andr
a C
apti
ve B
reed
ing
Faci
lity
Dis
ease
man
agem
ent i
n en
clos
ures
and
sa
nctu
arie
s, p
rinc
ipal
ly q
uara
ntin
e pr
oced
ures
.
$1,0
00$1
,030
$1,0
61$1
,093
$1,1
26$1
,159
$1,1
94$1
,230
$1,2
67$1
,305
Pero
n C
apti
ve B
reed
ing
Faci
lity
$1,0
00$1
,030
$1,0
61$1
,093
$1,1
26$1
,159
$1,1
94$1
,230
$1,2
67$1
,305
Dry
andr
a C
apti
ve B
reed
ing
Faci
lity
Enc
losu
re fe
nce
insp
ecti
on
$1,0
00$1
,030
$1,0
61$1
,093
$1,1
26$1
,159
$1,1
94$1
,230
$1,2
67$1
,305
Pero
n C
apti
ve B
reed
ing
Faci
lity
$1,0
00$1
,030
$1,0
61$1
,093
$1,1
26$1
,159
$1,1
94$1
,230
$1,2
67$1
,305
Dry
andr
a C
apti
ve B
reed
ing
Faci
lity
Enc
losu
re fe
nce
repa
irs
to p
reve
nt p
reda
tor/
com
peti
tor i
ngre
ss a
nd e
scap
e of
cap
tive
ani
mal
s.
$10,
000
$10,
300
$10,
609
$10,
927
$11,
255
$11,
593
$11,
941
$12,
299
$12,
668
$13,
048
Pero
n C
apti
ve B
reed
ing
Faci
lity
$10,
000
$10,
300
$10,
609
$10,
927
$11,
255
$11,
593
$11,
941
$12,
299
$12,
668
$13,
048
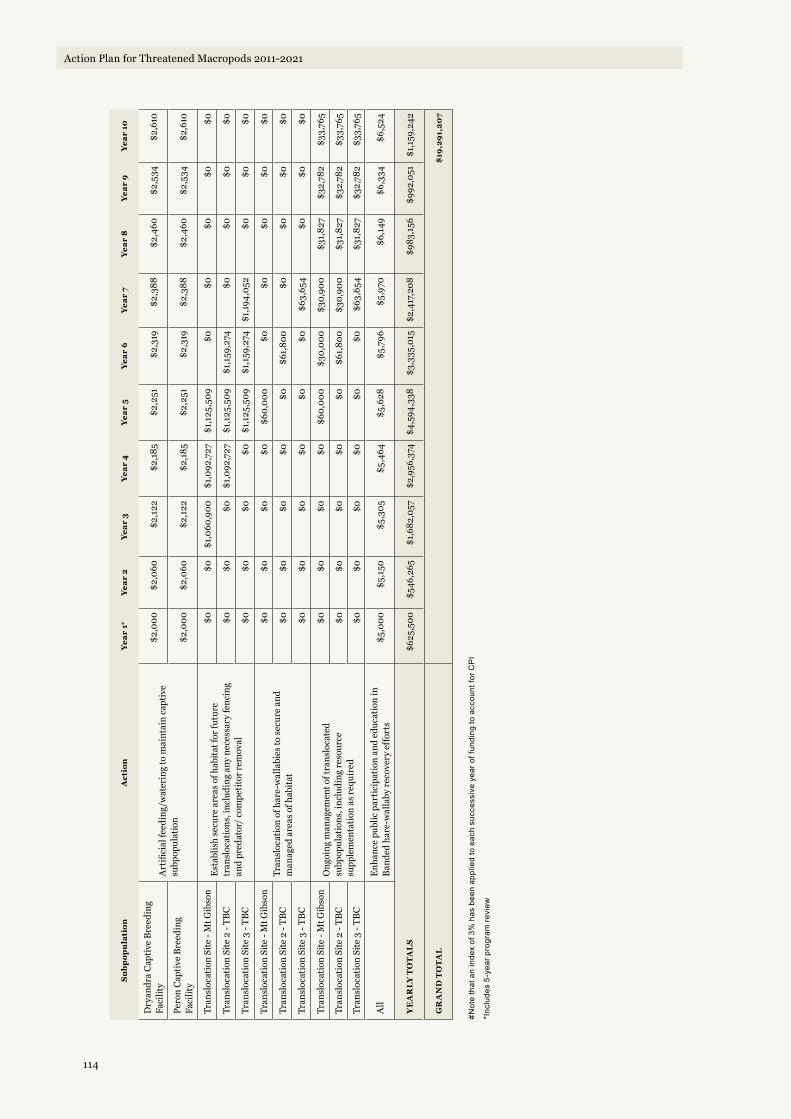
114
Action Plan for Threatened Macropods 2011-2021
Su
bp
op
ula
tio
nA
ctio
nY
ear
1#Y
ear
2Y
ear
3Y
ear
4Y
ear
5Y
ear
6Y
ear
7Y
ear
8Y
ear
9Y
ear
10
Dry
andr
a C
apti
ve B
reed
ing
Faci
lity
Art
ifici
al fe
edin
g/w
ater
ing
to m
aint
ain
capt
ive
subp
opul
atio
n
$2,0
00$2
,060
$2,1
22$2
,185
$2,2
51$2
,319
$2,3
88$2
,460
$2,5
34$2
,610
Pero
n C
apti
ve B
reed
ing
Faci
lity
$2,0
00$2
,060
$2,1
22$2
,185
$2,2
51$2
,319
$2,3
88$2
,460
$2,5
34$2
,610
Tran
sloc
atio
n Si
te -
Mt G
ibso
nE
stab
lish
secu
re a
reas
of h
abit
at fo
r fut
ure
tran
sloc
atio
ns, i
nclu
ding
any
nec
essa
ry fe
ncin
g an
d pr
edat
or/
com
peti
tor r
emov
al
$0$0
$1,0
60,9
00$1
,092
,727
$1,1
25,5
09$0
$0$0
$0$0
Tran
sloc
atio
n Si
te 2
- T
BC
$0$0
$0$1
,092
,727
$1,1
25,5
09$1
,159
,274
$0$0
$0$0
Tran
sloc
atio
n Si
te 3
- T
BC
$0$0
$0$0
$1,1
25,5
09$1
,159
,274
$1,1
94,0
52$0
$0$0
Tran
sloc
atio
n Si
te -
Mt G
ibso
nTr
ansl
ocat
ion
of h
are-
wal
labi
es to
sec
ure
and
man
aged
are
as o
f hab
itat
$0$0
$0$0
$60,
000
$0$0
$0$0
$0
Tran
sloc
atio
n Si
te 2
- T
BC
$0$0
$0$0
$0$6
1,80
0$0
$0$0
$0
Tran
sloc
atio
n Si
te 3
- T
BC
$0$0
$0$0
$0$0
$63,
654
$0$0
$0
Tran
sloc
atio
n Si
te -
Mt G
ibso
nO
ngoi
ng m
anag
emen
t of t
rans
loca
ted
subp
opul
atio
ns, i
nclu
ding
res
ourc
e su
pple
men
tati
on a
s re
quir
ed
$0$0
$0$0
$60,
000
$30,
000
$30,
900
$31,
827
$32,
782
$33,
765
Tran
sloc
atio
n Si
te 2
- T
BC
$0$0
$0$0
$0$6
1,80
0$3
0,90
0$3
1,82
7$3
2,78
2$3
3,76
5
Tran
sloc
atio
n Si
te 3
- T
BC
$0$0
$0$0
$0$0
$63,
654
$31,
827
$32,
782
$33,
765
All
Enh
ance
pub
lic p
arti
cipa
tion
and
edu
cati
on in
B
ande
d ha
re-w
alla
by r
ecov
ery
effo
rts
$5,0
00$5
,150
$5,3
05$5
,464
$5,6
28$5
,796
$5,9
70$6
,149
$6,3
34$6
,524
YE
AR
LY
TO
TA
LS
$625
,500
$546
,265
$1,6
82,0
57$2
,956
,374
$4,5
94,3
38$3
,335
,015
$2,4
17,2
08$9
83,1
56$9
92,0
51$1
,159
,242
GR
AN
D T
OT
AL
$19
,291
,20
7
#Not
e th
at a
n in
dex
of 3
% h
as b
een
appl
ied
to e
ach
succ
essi
ve y
ear o
f fun
ding
to a
ccou
nt fo
r CP
I
*Inc
lude
s 5-
year
pro
gram
revi
ew

115
Action Plan for Threatened Macropods 2011-2021
Recovery Outline - Macropus bernardus
1. Family Macropodidae
2. Scientific name: Macropus bernardus (Rothschild, 1904)
3. Common name: Black wallaroo, Bernard’s wallaroo, black kangaroo, northern black wallaroo. Indigenous names: Barrk (male), Djukerre (female) (local Bininj Kunwok dialects)
4. Conservation status (IUCN): Near Threatened
5. Reasons for listing
Listed as Near Threatened because this species possibly has a global population of less 10,000 mature individuals, and although anecdotal information suggests that the population is stable, little is known about its population trends. There are no known major threats to the species, however, changes to the fire regime are potentially a serious problem. Should the population be shown to be indeed less than 10,000, even a relatively small downward trend could qualify this species as Vulnerable under criterion C (Woinarski 2008).
6. Infraspecific Taxa
6.1 None.
7. Range and abundance
Figure 10: Known distribution of Macropus bernardus from the 2008 Global Mammal Assessment (IUCN 2010; Landsat imagery ©Commonwealth of Australia - Geoscience Australia).
The species is restricted to the sandstone escarpment and plateau of western Arnhem Land, Northern Territory. Among the steep, rocky escarpments and tops of the deeply dissected plateau, it uses habitats dominated by spinifex grassland, sandstone heath, eucalypt woodland and patches of rainforest.
Its range is about 30,000 km2, which is unusually small for a mammal of its size (Telfer & Calaby 2008). Much of its range lies within Kakadu National Park.
There are no estimates of total population numbers; however, neither is there any evidence of a decline in range or abundance. Its elusive behaviour and habitat of rugged terrain make it a difficult species to survey (Telfer & Calaby 2008). This species is common within suitable habitat, but its habitat is limited (Telfer & Calaby 2008). Aboriginal informants have provided information that suggest the population is stable (Woinarski 2008).

116
Action Plan for Threatened Macropods 2011-2021
8. Habitat
A range of vegetation types from closed forests and Eucalyptus open forests to heaths and hummock grasslands, but almost always in areas characterised by large boulders.
9. Threats
9.1 Recent changes in fire regimes may have led to alteration of vegetation structure or floristic composition in the sandstone massif.
10. Information required
10.1 Estimation of the global population of this species.
10.2 Monitoring of the abundance of the species across a range of sites of varying fire history.
11. Recovery objectives
11.1 By 2021, Macropus bernardus is eligible for listing as Least Concern according to IUCN Red List criteria.
11.2 By 2021, research, surveys and monitoring confirm the population trend of Macropus bernardus as stable.
11.3 By 2021, the number of distinct secure* subpopulations of Macropus bernardus is greater than 10, and the population is estimated to number greater than 10,000 mature individuals, thus making it ineligible to qualify as Vulnerable under IUCN criteria B or C.
11.4 By 2021, research has confirmed the impacts of altered fire regimes and predation on Macropus bernardus, and where those factors present a threat to Macropus bernardus subpopulations, management plans have been developed and are being implemented to mitigate those threats.
11.5 By 2021, the genetic diversity of Macropus bernardus has been maintained at known 2011 levels.
12. Actions completed or underway
12.1 None
13. Management actions required
13.1 Status assessment of the species, including genetics, abundance, distribution, trend and risks. Includes surveys.
13.2 Implement monitoring protocols, including fire management, habitat condition, and species activity.
13.3 Assess threat of altered fire regimes to the species and its preferred habitat, and undertake fire management where necessary.
13.4 Assess the need to augment the known number of subpopulations through translocation, or the number of mature individuals through captive breeding.
13.5 Research species biology, ecology and conservation requirements.
13.6 Manage data to inform adaptive management.
14. Organisations responsible for conservation of species
14.1 Northern Territory Department of Natural Resources, Environment, the Arts and Sport (NRETAS)
15. Other organisations involved
15.1 None.
16. Staff and other resources required for recovery to be carried out
16.1 No dedicated staff required.
17. Action costs
17.1 Total cost over 10 years exceeds A$2.7 million.
18. Notes
18.1 None.
19. References
IUCN (2010) IUCN Red List of Threatened Species. Version 2010.3. http://www.iucnredlist.org. Accessed 28 September 2010.
Woinarski, J (2008) Macropus bernardus. In: IUCN 2010. IUCN Red List of Threatened Species. Version 2010.3.
http://www.iucnredlist.org/apps/redlist/details/12620/0 Accessed 28 September 2010.
Telfer, WR, and Calaby, JH, (2008). Black Wallaroo, Macropus bernardus. In The Mammals of Australia. (Eds. Van Dyck, S and Strahan, R).
20. Comments received
20.1 None

117
Action Plan for Threatened Macropods 2011-2021
Table 25: List of recovery actions for Macropus bernardus, and the rationale for their contribution to recovery, and effort required.
Subpopulation Action Rationale Frequency Duration Effort
AllStatus assessment of the species - distribution and abundance
There is very little known about this species. Information is required to assess the distribution and abundance of the species, which subpopulations are most at risk from a range of threats, and to ensure that genetic stock is maintained.
3-Yearly 3 Months 5 People
AllStatus assessment of the species - genetics
5-Yearly 2 Months 3 People
All
Status assessment of the species - identify important subpopulations, and those subject to specific threats including fire
Little is known about which subpopulations should be targeted for intensive management.
5-Yearly 2 Weeks 1 Person
AllManage data to inform adaptive management
Good data management is essential to making it possible to extract the maximum amount of information from monitoring data.
6-Monthly 1 Week 1 Person
Priority subpopulations (as identified in status assessment)
Develop management plans for those subpopulations subject to threat of altered fire regimes
Changes to vegetation composition and structure as a result of altered fire regimes are thought to be the greatest threat facing black wallaroos.
Once 3 Months 1 Person
Priority subpopulations (as identified in status assessment)
Implement management actions to reduce the threat of fire
Yearly 1 Month 10 People
All
Conduct research into species biology, ecology and conservation requirements
Very little is known about this species, and urgent research is required to inform adaptive conservation measures.
Once Unknown 2 People
All
Implement monitoring protocols for species activity, and effectiveness of management intervention.
Monitoring is essential to ensure adaptive management and achieving the species objectives.
6-Monthly 2 Weeks 4 People
All
Implement monitoring protocols for fire management and habitat condition, and effectiveness of management intervention.
Yearly 1 Month 5 People
All
Investigate need to undertake translocations or captive breeding to increase the number of extant subpopulations
Once surveys provide a clearer understanding of the species' status, it may be necessary to establish new subpopulations or increase the number of mature individuals to ensure it does not meet the criteria to be listed as threatened on the IUCN Red List.
5-Yearly 3 Months 1 Person

118
Action Plan for Threatened Macropods 2011-2021
Tab
le 2
6: L
ist o
f rec
over
y ac
tion
s M
acro
pus
bern
ardu
s, a
nd t
heir
cos
ts
Su
bp
op
ula
tio
nA
ctio
nY
ear
1#Y
ear
2Y
ear
3Y
ear
4Y
ear
5Y
ear
6Y
ear
7Y
ear
8Y
ear
9Y
ear
10
All
Stat
us a
sses
smen
t of t
he s
peci
es -
dist
ribu
tion
and
ab
unda
nce
$120
,000
$0$0
$65,
564
$0$0
$71,
644
$0$0
$78,
287
All
Stat
us a
sses
smen
t of t
he s
peci
es -
gene
tics
$30,
000
$0$0
$0$3
3,76
5$0
$0$0
$0$3
9,14
3
All
Stat
us a
sses
smen
t of t
he s
peci
es -
iden
tify
im
port
ant s
ubpo
pula
tion
s, a
nd th
ose
subj
ect t
o sp
ecifi
c th
reat
s in
clud
ing
fire
$20,
000
$0$0
$0$2
2,51
0$0
$0$0
$0$0
All
Man
age
data
to in
form
ada
ptiv
e m
anag
emen
t$5
,000
$5,1
50$5
,305
$5,4
64$2
5,62
8*$5
,796
$5,9
70$6
,149
$6,3
33$2
6,52
4*
Prio
rity
sub
popu
lati
ons
(as
iden
tifie
d in
sta
tus
asse
ssm
ent)
Dev
elop
man
agem
ent p
lans
for t
hose
su
bpop
ulat
ions
sub
ject
to th
reat
of a
ltere
d fir
e re
gim
es$0
$25,
000
$0$0
$0$1
0,00
0$0
$0$0
$0
Prio
rity
sub
popu
lati
ons
(as
iden
tifie
d in
sta
tus
asse
ssm
ent)
Impl
emen
t man
agem
ent a
ctio
ns to
red
uce
the
thre
at o
f fire
$0$1
00,0
00$1
03,0
00$1
06,0
90$1
09,2
73$1
12,5
51$1
15,9
27$1
19,4
05$1
22,9
87$1
26,6
77
All
Con
duct
res
earc
h in
to s
peci
es b
iolo
gy, e
colo
gy a
nd
cons
erva
tion
req
uire
men
ts$0
$0$3
0,00
0$3
0,90
0$3
1,82
7$0
$0$0
$0$0
All
Impl
emen
t mon
itori
ng p
roto
cols
for s
peci
es
acti
vity
, and
eff
ecti
vene
ss o
f man
agem
ent
inte
rven
tion
.$6
0,00
0$6
1,80
0$6
3,65
4$6
5,56
4$6
7,53
1$6
9,55
6$7
1,64
3$7
3,79
2$7
6,00
6$7
8,28
6
All
Impl
emen
t mon
itori
ng p
roto
cols
for fi
re
man
agem
ent a
nd h
abit
at c
ondi
tion
, and
ef
fect
iven
ess
of m
anag
emen
t int
erve
ntio
n.$3
0,00
0$3
0,90
0$3
1,82
7$3
2,78
2$3
3,76
5$3
4,77
8$3
5,82
2$3
6,89
6$3
8,00
3$3
9,14
3
All
Inve
stig
ate
need
to u
nder
take
tran
sloc
atio
ns o
r ca
ptiv
e br
eedi
ng to
incr
ease
the
num
ber o
f ext
ant
subp
opul
atio
ns$0
$0$0
$20,
000
$0$0
$0$0
$0$0
YE
AR
LY
TO
TA
LS
$265
,000
$222
,850
$233
,786
$326
,363
$324
,298
$232
,682
$301
,006
$236
,243
$243
,330
$388
,061
GR
AN
D T
OT
AL
$2
,773
,618
#Not
e th
at a
n in
dex
of 3
% h
as b
een
appl
ied
to e
ach
succ
essi
ve y
ear o
f fun
ding
to a
ccou
nt fo
r CP
I
*Inc
lude
s 5-
year
pro
gram
revi
ew

119
Action Plan for Threatened Macropods 2011-2021
Recovery Outline - Macropus parma
1. Family Macropodidae
2. Scientific name: Macropus parma (Waterhouse, 1845)
3. Common name: Parma wallaby, White-throated Pademelon, White-throated Wallaby.
4. Conservation status (IUCN): Near Threatened
5. Reasons for listing
Listed as Near Threatened as the species is estimated to number less than 10,000 mature individuals, but there is no evidence of a continuing decline at present (subpopulation structure is not well known). Almost qualifies as threatened under criterion C2 (Lunney & McKenzie 2008).
6. Infraspecific Taxa
6.1 None.
7. Range and abundance
This species is endemic to Australia, where it occurs in New South Wales (formerly as far south as the Illawarra). It is present in suitable forests scattered throughout the escarpment, but it is no longer found in coastal forests. Upper altitudinal sites include the Dorrigo Plateau, Gibraltar Range, and Barrington Tops. It occurs up to 1,000 m above sea level. Feral populations exist on Kauwau Island, New Zealand (Maynes 2008). It is rare and patchily distributed. There are no recent population estimates. In 1992, the total number of adults was estimated at between 1,000 and 10,000 individuals. There appears to be no evidence of a decline. (IUCN 2010)
Figure 11: Known distribution of Macropus parma from the 2008 Global Mammal Assessment (IUCN 2010; Landsat imagery ©Commonwealth of Australia - Geoscience Australia).

120
Action Plan for Threatened Macropods 2011-2021
8. Habitat
It is found within wet sclerophyll forest with dense understorey, but with access to forest with a grassy understorey. The species is often found in dry sclerophyll forests and rainforest (Maynes 2008).
9. Threats
9.1 Forest fragmentation combined with predation from foxes appear to be the principal reasons for the decline of the species.
9.2 Grazing and burning regimes that affect availability of shelter are a disadvantage to populations.
9.3 Reintroductions of the species have been unsuccessful due to fox predation.
10. Information required
10.1 Studies to determine optimal survey methods.
10.2 Detailed survey of populations.
10.3 Review recent survey work by NSW NPWS and others to establish a predicted modelled range, as a guide to detailed surveying.
10.4 Define precise habitat requirements and manage for them. This can be combined with fine-grained survey to establish limits of current distribution and inter-connectedness of subpopulations.
11. Recovery objectives
11.1 By 2021, Macropus parma is eligible for listing as Least Concern according to IUCN Red List criteria.
11.2 By 2021, research, surveys and monitoring confirm the population trend of Macropus parma as stable.
11.3 By 2021, numbers of mature Macropus parma in the wild are considered stable or increasing based on an index of abundance appropriate to the species.
11.4 By 2021, research has confirmed the impacts of forest fragmentation and fox predation on Macropus parma, and where those factors present a threat to Macropus parma subpopulations, management plans have been developed and are being implemented to mitigate those threats.
11.5 By 2021, the genetic diversity of Macropus parma has been maintained at known 2011 levels.
12. Actions completed or underway
12.1 Survey work by NSW NPWS.
13. Management actions required
13.1 Status assessment of the species, including genetics, abundance, distribution, trend and risks.
13.2 Identify areas where fox predation, cattle grazing and altered fire regimes pose significant threats to the species and develop management plans for those subpopulations.
13.3 Conduct adaptive management fox control program.
13.4 Cattle grazing management.
13.5 Fire management.
13.6 Reserve suitable habitats for the species.
13.7 Conduct research to determine the relative impacts of fox predation, cattle grazing and altered fire regimes on the species.
13.8 Implement monitoring protocols, including fire management, grazing, habitat condition, predation and predator activity, and species activity.
13.9 Manage data to inform adaptive management.
14. Organisations responsible for conservation of species
14.1 NSW Department of Environment, Climate Change and Water.
15. Other organisations involved
15.1 None.
16. Staff and other resources required for recovery to be carried out
16.1 No dedicated staff are required.
17. Action costs
17.1 Total cost over 10 years exceeds $9 million.
18. Notes
18.1 None.
19. References
IUCN (2010) IUCN Red List of Threatened Species. Version 2010.3. http://www.iucnredlist.org. Accessed 19 October 2010.
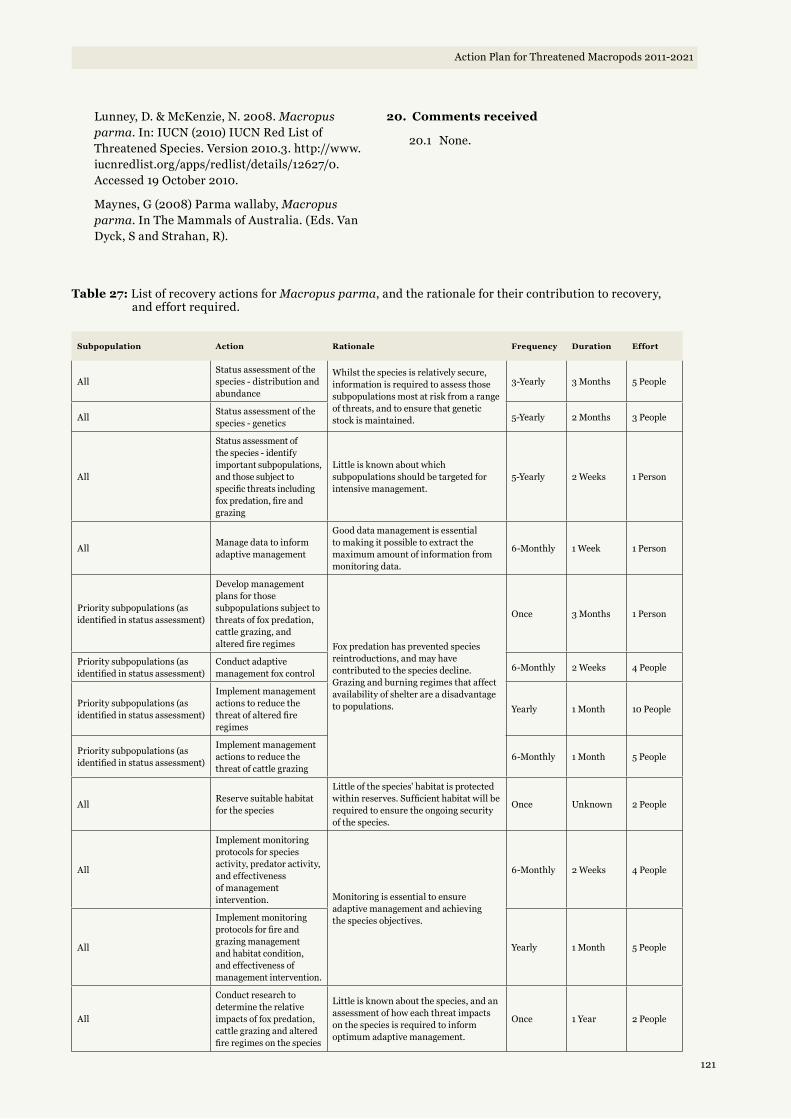
121
Action Plan for Threatened Macropods 2011-2021
Lunney, D. & McKenzie, N. 2008. Macropus parma. In: IUCN (2010) IUCN Red List of Threatened Species. Version 2010.3. http://www.iucnredlist.org/apps/redlist/details/12627/0. Accessed 19 October 2010.
Maynes, G (2008) Parma wallaby, Macropus parma. In The Mammals of Australia. (Eds. Van Dyck, S and Strahan, R).
20. Comments received
20.1 None.
Table 27: List of recovery actions for Macropus parma, and the rationale for their contribution to recovery, and effort required.
Subpopulation Action Rationale Frequency Duration Effort
AllStatus assessment of the species - distribution and abundance
Whilst the species is relatively secure, information is required to assess those subpopulations most at risk from a range of threats, and to ensure that genetic stock is maintained.
3-Yearly 3 Months 5 People
AllStatus assessment of the species - genetics
5-Yearly 2 Months 3 People
All
Status assessment of the species - identify important subpopulations, and those subject to specific threats including fox predation, fire and grazing
Little is known about which subpopulations should be targeted for intensive management.
5-Yearly 2 Weeks 1 Person
AllManage data to inform adaptive management
Good data management is essential to making it possible to extract the maximum amount of information from monitoring data.
6-Monthly 1 Week 1 Person
Priority subpopulations (as identified in status assessment)
Develop management plans for those subpopulations subject to threats of fox predation, cattle grazing, and altered fire regimes Fox predation has prevented species
reintroductions, and may have contributed to the species decline. Grazing and burning regimes that affect availability of shelter are a disadvantage to populations.
Once 3 Months 1 Person
Priority subpopulations (as identified in status assessment)
Conduct adaptive management fox control
6-Monthly 2 Weeks 4 People
Priority subpopulations (as identified in status assessment)
Implement management actions to reduce the threat of altered fire regimes
Yearly 1 Month 10 People
Priority subpopulations (as identified in status assessment)
Implement management actions to reduce the threat of cattle grazing
6-Monthly 1 Month 5 People
AllReserve suitable habitat for the species
Little of the species' habitat is protected within reserves. Sufficient habitat will be required to ensure the ongoing security of the species.
Once Unknown 2 People
All
Implement monitoring protocols for species activity, predator activity, and effectiveness of management intervention. Monitoring is essential to ensure
adaptive management and achieving the species objectives.
6-Monthly 2 Weeks 4 People
All
Implement monitoring protocols for fire and grazing management and habitat condition, and effectiveness of management intervention.
Yearly 1 Month 5 People
All
Conduct research to determine the relative impacts of fox predation, cattle grazing and altered fire regimes on the species
Little is known about the species, and an assessment of how each threat impacts on the species is required to inform optimum adaptive management.
Once 1 Year 2 People

122
Action Plan for Threatened Macropods 2011-2021
Tab
le 2
8: L
ist o
f rec
over
y ac
tion
s fo
r M
acro
pus
parm
a, a
nd t
heir
cos
ts
Su
bp
op
ula
tio
nA
ctio
nY
ear
1#Y
ear
2Y
ear
3Y
ear
4Y
ear
5Y
ear
6Y
ear
7Y
ear
8Y
ear
9Y
ear
10
All
Stat
us a
sses
smen
t of t
he s
peci
es -
dist
ribu
tion
and
ab
unda
nce
$60,
000
$0$0
$65,
564
$0$0
$71,
644
$0$0
$78,
287
All
Stat
us a
sses
smen
t of t
he s
peci
es -
gene
tics
$30,
000
$0$0
$0$3
3,76
5$0
$0$0
$0$3
9,14
3
All
Stat
us a
sses
smen
t of t
he s
peci
es -
iden
tify
im
port
ant s
ubpo
pula
tion
s, a
nd th
ose
subj
ect t
o sp
ecifi
c th
reat
s in
clud
ing
fox
pred
atio
n, fi
re a
nd
graz
ing
$20,
000
$0$0
$0$2
2,51
0$0
$0$0
$0$0
All
Man
age
data
to in
form
ada
ptiv
e m
anag
emen
t$5
,000
$5,1
50$5
,305
$5,4
64$2
5,62
8*$5
,796
$5,9
70$6
,149
$6,3
33$2
6,52
3*
Prio
rity
sub
popu
lati
ons
(as
iden
tifie
d in
sta
tus
asse
ssm
ent)
Dev
elop
man
agem
ent p
lans
for t
hose
su
bpop
ulat
ions
sub
ject
to th
reat
s of
fox
pred
atio
n,
catt
le g
razi
ng, a
nd a
ltere
d fir
e re
gim
es$0
$25,
000
$0$0
$0$1
0,00
0$0
$0$0
$0
Prio
rity
sub
popu
lati
ons
(as
iden
tifie
d in
sta
tus
asse
ssm
ent)
Con
duct
ada
ptiv
e m
anag
emen
t fox
con
trol
$0$4
00,0
00$4
12,0
00$4
24,3
60$4
37,0
91$4
50,2
04$4
63,7
10$4
77,6
21$4
91,9
50$5
06,7
08
Prio
rity
sub
popu
lati
ons
(as
iden
tifie
d in
sta
tus
asse
ssm
ent)
Impl
emen
t man
agem
ent a
ctio
ns to
red
uce
the
thre
at o
f alte
red
fire
regi
mes
$0$2
00,0
00$2
06,0
00$2
12,1
80$2
18,5
45$2
25,1
02$2
31,8
55$2
38,8
10$2
45,9
75$2
53,3
54
Prio
rity
sub
popu
lati
ons
(as
iden
tifie
d in
sta
tus
asse
ssm
ent)
Impl
emen
t man
agem
ent a
ctio
ns to
red
uce
the
thre
at o
f cat
tle
graz
ing
$0$5
0,00
0$5
1,50
0$5
3,04
5$5
4,63
6$5
6,27
5$5
7,96
4$5
9,70
3$6
1,49
4$6
3,33
9
All
Res
erve
sui
tabl
e ha
bita
t for
the
spec
ies
$0$0
$250
,000
$0$0
$0$2
81,3
77$0
$0$0
All
Impl
emen
t mon
itori
ng p
roto
cols
for s
peci
es
acti
vity
, pre
dato
r act
ivit
y, a
nd e
ffec
tive
ness
of
man
agem
ent i
nter
vent
ion.
$60,
000
$61,
800
$63,
654
$65,
564
$67,
531
$69,
556
$71,
643
$73,
792
$76,
006
$78,
286
All
Impl
emen
t mon
itori
ng p
roto
cols
for fi
re a
nd
graz
ing
man
agem
ent a
nd h
abit
at c
ondi
tion
, and
ef
fect
iven
ess
of m
anag
emen
t int
erve
ntio
n.$6
0,00
0$6
1,80
0$6
3,65
4$6
5,56
4$6
7,53
1$6
9,55
6$7
1,64
3$7
3,79
2$7
6,00
6$7
8,28
6
All
Con
duct
res
earc
h to
det
erm
ine
the
rela
tive
im
pact
s of
fox
pred
atio
n, c
attl
e gr
azin
g an
d al
tere
d fir
e re
gim
es o
n th
e sp
ecie
s$0
$30,
000
$30,
900
$31,
827
$32,
782
$0$0
$0$0
$0
YE
AR
LY
TO
TA
LS
$235
,000
$833
,750
$1,0
83,0
13$9
23,5
67$9
60,0
18$8
86,4
90$1
,255
,805
$929
,868
$957
,764
$1,1
23,9
26
GR
AN
D T
OT
AL
$9
,18
9,2
01
#Not
e th
at a
n in
dex
of 3
% h
as b
een
appl
ied
to e
ach
succ
essi
ve y
ear o
f fun
ding
to a
ccou
nt fo
r CP
I
*Inc
lude
s 5-
year
pro
gram
revi
ew

123
Action Plan for Threatened Macropods 2011-2021
Recovery Outline - Onychogalea fraenata
1. Family Macropodidae
2. Scientific name: Onychogalea fraenata (Gould, 1841)
3. Common name: Bridled nailtail wallaby, Bridled nail-tailed wallaby, Bridled Wallaby, Merrin, Flashjack
4. Conservation status (IUCN): Endangered; B1ab(iii)
5. Reasons for listing
Listed as Endangered because the extent of occurrence is less than 5,000 km2, all self-sustaining populations are within three locations, and there is a continuing decline in the quality of habitat due to introduced weeds (McKnight 2008).
Listed as Endangered under the EPBC Act 1999 (DEWHA 2010).
6. Infraspecific Taxa
6.1 None.
7. Range and abundance
The bridled nailtail wallaby is endemic to Australia, where it occurs naturally in Taunton National Park (Scientific) near Dingo in central Queensland. Two self-sustaining translocated populations also exist: Idalia National Park (Queensland) and Avocet Nature Refuge (Queensland) (Lundie-Jenkins & Lowry 2005).
It is thought that there are less than 1,100 mature individuals in the wild. The population at Taunton has been stable (Lundie-Jenkins and Lowry 2005) or increasing (Evans and Gordon 2008) since the mid 1990s when it was at its lowest point of 450 individuals. The population at Taunton rose following the exclusion of cattle to about 1,400 in December 1991 (Davidson 1991). Then a severe drought in the early 1990s reduced the population (Clancy and Porter 1994; Lundie-Jenkins and Lowry 2005; Evans & Gordon 2008). More recently (2002/2003) another severe drought struck, and populations may periodically fluctuate in response to rainfall, or the droughts could mark major stochastic events (IUCN 2010)
Figure 12: Known distribution of Onychogalea fraenata from the 2008 Global Mammal Assessment (IUCN 2010; Landsat imagery ©Commonwealth of Australia - Geoscience Australia).

124
Action Plan for Threatened Macropods 2011-2021
8. Habitat
Open, edge habitats of eucalypt forest and brigalow scrub and grasses. Based on the surveys of the Dingo region, Gordon & Lawrie (1980) concluded that the species had a preference for Brigalow areas and the larger alluvial flats, the more fertile areas of the region. On the northern portion of Taunton, bridled nailtail wallabies are found in all four of the major vegetation types present (Tierney 1985):
• Open grassy eucalypt woodland dominated by Poplar Box Eucalyptus populnea.
• Dense acacia forest dominated by Brigalow Acacia harpophylla.
• Transitional vegetation intermediate between the woodland and forest
• Areas of very dense Brigalow regrowth.
9. Threats
9.1 Introduced predators including foxes, cats and wild dogs.
9.2 Invasive weeds, specifically buffel grass.
9.3 Small population size.
9.4 Potential risks from severe drought, extreme fire, and disease.
9.5 Competition for resources, especially with sheep (minor threat).
9.6 Artificial watering points in South West NRM region that may extend range of cats and foxes (minor threat).
10. Information required
10.1 Methods to control buffel grass in wallaby habitat.
11. Recovery objectives
11.1 By 2021, Onychogalea fraenata is eligible for listing as Vulnerable according to IUCN Red List criteria.
11.2 By 2021, the geographic range of Onychogalea fraenata in the form of extent of occurrence has increased to greater than 5,000 km2, with subpopulations secure* at greater than five locations within that range.
11.3 By 2021, management plans have been developed and are being implemented to reduce the threats of drought, fire and introduced predators, and to increase the area, extent and quality of habitat, for all Onychogalea fraenata subpopulations.
11.4 By 2021, the genetic diversity of Onychogalea fraenata has been maintained at known 2011 levels.
12. Actions completed or underway
12.1 Captive breeding.
12.2 Translocation.
13. Management actions required
13.1 Status assessment of extant subpopulations using standard protocols, including distribution, genetics, trend, and priority subpopulations.
13.2 Manage species data to inform adaptive management.
13.3 Implement monitoring protocols, including fire management, habitat condition, predation and predator activity, and species activity.
13.4 Predator control, including foxes, cats and wild dogs.
13.5 Fire management.
13.6 Buffel grass management, including investigation of optimal management techniques.
13.7 Provision of emergency fodder during periods of extended drought.
13.8 Maintenance and genetic management of captive subpopulations for translocations and reintroductions.
13.9 Identify sites for translocation or reintroduction based on habitat mapping and/or on-ground assessment.
13.10 Establish a new translocated population.
13.11 Identify sites for range expansion around existing subpopulations, and conduct habitat restoration.
14. Organisations responsible for conservation of species
14.1 Department of Environment and Resource Management (DERM) Queensland.
15. Other organisations involved
15.1 Australian Wildlife Conservancy (AWC).
15.2 Hugo Spooner, landholder of Avocet Nature Reserve.
15.3 Australian Animals Care and Education (Inc.).
125
Action Plan for Threatened Macropods 2011-2021
15.4 Conservation and Wildlife Management (a division of Sporting Shooters Association of Australia, Queensland).
16. Staff and other resources required for recovery to be carried out
16.1 A dedicated recovery coordinator may be required to implement this program of work.
17. Action costs
17.1 Total cost over 10 years exceeds A$11 million.
18. Notes
18.1 None.
19. References
Davidson, C (1991) Recovery plan for the bridled nailtail wallaby (Onychogalea fraenata). ANPWS Endangered Species Program. Unpublished report to ANPWS.
Department of the Environment, Water, Heritage and the Arts (2010) Onychogalea fraenata. In: Species Profile and Threats (SPRAT) Database. Department of the Environment, Water, Heritage and the Arts, Canberra. http://www.environment.gov.au/sprat. Accessed 27 October 2010.
Evans, M and Gordon, G (2008) Bridled Nailtail Wallaby, Onychogalea fraenata. In The Mammals of Australia (Eds. Van Dyck, S & Strahan, R).
Gordon, G & Lawrie, BC (1980). The rediscovery of the bridled nail-tailed wallaby, Onychogalea fraenata (Gould) (Marsupialia: Macropodidae) in Queensland. Australian Wildlife Research 7: 339-345.
Horsup, A and Evans, M (1992) Predation by Feral Cats, Felis catus, on an endangered marsupial, the Bridled Nail-tail Wallaby, Onychogalea fraenata. Australian Mammalogy 16: 85-86.
IUCN (2010) IUCN Red List of Threatened Species. Version 2010.3. http://www.iucnredlist.org. Accessed 19 October 2010.
Lundie-Jenkins, G, and Lowry, J (2005) Recovery plan for the bridled nailtail wallaby (Onychogalea fraenata) 2005-2009. Report to the Department of Environment and Heritage (DEH), Canberra. Environmental Protection Agency/Queensland Parks and Wildlife Service, Brisbane.
McKnight, M. 2008. Onychogalea fraenata. In: IUCN (2010) IUCN Red List of Threatened Species. Version 2010.3. http://www.iucnredlist.org/apps/redlist/details/15330/0. Accessed 19 October 2010.
Tierney, PJ (1985) Habitat and ecology of the bridled nailtail wallaby with implications for management. M.Sc. Thesis. Queensland Institute of Technology.
20. Comments received
20.1 Rhonda Melzer, DERM QLD.
20.2 Matt Hayward, AWC.
20.3 Janelle Lowry, DERM QLD.

126
Action Plan for Threatened Macropods 2011-2021
Table 29: List of recovery actions for Onychogalea fraenata, and the rationale for their contribution to recovery, and effort required.
Subpopulation Action Rationale Frequency Duration Effort
All
Status assessment - distribution and abundance. Includes surveys of known subpopulations
More information is required to better understand the status of the species, to assess those subpopulations most at risk from a range of threats, and to ensure that genetic stock is maintained.
3-Yearly 1 Month 5 People
AllStatus assessment - genetics
5-Yearly 3 Months 3 People
All
Manage species data to inform adaptive management. Includes 5 year program review.
Good data management is essential to making it possible to extract the maximum amount of information from monitoring data.
6-Monthly 1 Week 2 People
All
Develop/refine monitoring protocols for the species, including trapping, satellite collars and camera traps, and to monitor habitat and threats
Monitoring is essential to ensure adaptive management and achieving the species objectives.
Once 2 Weeks 1 Person
Taunton National Park
Conduct adaptive management fox and wild dog control program including ground baiting
Wild dog predation is thought to be the principal cause of death to wallabies in Taunton National Park. Foxes and cats are likely to be a problem.
6-Monthly 2 Weeks 4 People
Idalia National Park 6-Monthly 2 Weeks 4 People
Avocet Nature Refuge 6-Monthly 2 Weeks 10 People
Translocation site 1 - Scotia 6-Monthly 2 Weeks 4 People
Translocation site 2 - Bowra 6-Monthly 2 Weeks 4 People
Taunton National Park
Conduct strategic cat and wild dog shooting program
Monthly 1 Day 2 People
Idalia National Park Monthly 1 Day 2 People
Avocet Nature Refuge Monthly 1 Day 2 People
Translocation site 1 - Scotia Monthly 1 Day 2 People
Translocation site 2 - Bowra Monthly 1 Day 2 People
Taunton National Park
Implement fire management program - maintain control lines Several key habitat associations
including brigalow are fire sensitive. As such fire management is important in limiting the extent and intensity of wild fires to ensure sufficient habitat remains. Fire may also play a role in promoting fodder species.
Yearly 1 Week 2 People
Idalia National Park Yearly 1 Week 2 People
Avocet Nature Refuge Yearly 1 Week 2 People
Translocation site 1 Yearly 1 Week 2 People
Translocation site 2 Yearly 1 Week 2 People
Taunton National Park
Implement fire management program - patch burns
Yearly 2 Weeks 5 People
Idalia National Park Yearly 2 Weeks 5 People
Avocet Nature Refuge Yearly 2 Weeks 5 People
Translocation site 1 - Scotia Yearly 2 Weeks 5 People
Translocation site 2 - Bowra Yearly 2 Weeks 5 People
Taunton National Park
Conduct weed control
Encroachment of weeds such as buffel grass can encroach on wallaby habitat, reducing the preferred fodder species plants of the wallabies and altering the fire regimes such that shelter habitat is lost.
2-Monthly 1 Week 5 People
Avocet Nature Refuge 2-Monthly 1 Week 5 People
Idalia National Park 2-Monthly 1 Week 5 People
Translocation site 1 - Scotia 2-Monthly 1 Week 5 People
Translocation site 2 - Bowra 2-Monthly 1 Week 5 People
Taunton National Park
Provision of emergency fodder
During times of drought or low food availability, there may be a need to augment food supplies, given the small size of the population.
5-Yearly 3 Months 1 Person
Idalia National Park 5-Yearly 3 Months 1 Person
Avocet Nature Refuge 5-Yearly 3 Months 1 Person
Translocation site 1 - Scotia 5-Yearly 3 Months 1 Person
Translocation site 2 - Bowra 5-Yearly 3 Months 1 Person

127
Action Plan for Threatened Macropods 2011-2021
Subpopulation Action Rationale Frequency Duration Effort
Translocation site 1 - Scotia
Translocation of species to secure areas
With limited habitat available within the current sites new sites are required to increase the size of the overall population and to provide some capacity to ride out stochastic events.
Once 2 Weeks 4 People
Translocation site 2 - Bowra Once 2 Months 5 People
Taunton National ParkImplement monitoring protocols for species and predator activity, and effectiveness of management intervention.
Monitoring is essential to ensure adaptive management and achieving the species objectives.
6-Monthly 2 Weeks 4 People
Idalia National Park 6-Monthly 2 Weeks 4 People
Avocet Nature Refuge 6-Monthly 2 Weeks 4 People
Scotia Sanctuary 6-Monthly 1 Week 2 People
Translocation site 1 - Scotia 6-Monthly 2 Weeks 4 People
Translocation site 2 - Bowra 6-Monthly 2 Weeks 4 People
Taunton National Park Implement monitoring protocols for fire management, habitat condition, resource availability, and effectiveness of management intervention.
Yearly 1 Week 2 People
Idalia National Park Yearly 1 Week 2 People
Avocet Nature Refuge Yearly 1 Week 2 People
Scotia Sanctuary Yearly 1 Week 2 People
Translocation site 1 - Scotia Yearly 1 Week 2 People
Translocation site 2 - Bowra Yearly 1 Week 2 People
Taunton National ParkConduct research on buffel grass control
Buffel grass represents a threat to the food availability of the species, and further research is required to manage infestations.
Once 2 Years 1 Person
Scotia Sanctuary Maintain enclosure fence
Captive subpopulations must be protected from feral predators. Well-maintained enclosure fences are the best means of ensuring this security.
6-Monthly 2 Weeks 2 People
Kial Property and Scotia Sanctuary
Ongoing maintenance and monitoring for release of captive animals
There is a need for genetically viable and demographically stable source subpopulations to ensure future translocations and reintroductions are successful. Captive stock may also be used for specific research to aid future recovery efforts.
Yearly 2 Months 2 People
NA
Conduct habitat modelling and surveys for potential future translocations or range expansion
With limited habitat available within the current sites new sites are required to increase the size of the overall population and to provide some capacity to ride out stochastic events.
Once 1 Year 1 Person

128
Action Plan for Threatened Macropods 2011-2021
Tab
le 3
0: L
ist o
f rec
over
y ac
tion
s fo
r O
nych
ogal
ea fr
aena
ta, a
nd t
heir
cos
ts
Su
bp
op
ula
tio
nA
ctio
nY
ear
1#Y
ear
2Y
ear
3Y
ear
4Y
ear
5Y
ear
6Y
ear
7Y
ear
8Y
ear
9Y
ear
10
All
Stat
us a
sses
smen
t - d
istr
ibut
ion
and
abun
danc
e.
Incl
udes
sur
veys
of k
now
n su
bpop
ulat
ions
$3
0,00
0$0
$0$3
2,78
2$0
$0$3
5,82
1$0
$0$3
9,14
3
All
Stat
us a
sses
smen
t - g
enet
ics
$25,
000
$0$0
$0$2
8,13
8$0
$0$0
$0$3
2,62
0
All
Man
age
spec
ies
data
to in
form
ada
ptiv
e m
anag
emen
t. In
clud
es 5
yea
r pro
gram
rev
iew
.$5
,000
$5,1
50$5
,305
$5,4
64$2
5,62
8*$5
,796
$5,9
70$6
,149
$6,3
33$2
6,52
3*
All
Dev
elop
/refi
ne m
onito
ring
pro
toco
ls fo
r the
sp
ecie
s, in
clud
ing
trap
ping
, sat
ellit
e co
llars
and
ca
mer
a tr
aps,
and
to m
onito
r hab
itat
and
thre
ats
$8,0
00$0
$0$0
$0$0
$0$0
$0$0
Taun
ton
Nat
iona
l Par
k
Con
duct
ada
ptiv
e m
anag
emen
t fox
and
wild
dog
co
ntro
l pro
gram
incl
udin
g gr
ound
bai
ting
$80,
000
$82,
400
$84,
872
$87,
418
$90,
041
$92,
742
$95,
524
$98,
390
$101
,342
$104
,382
Idal
ia N
atio
nal P
ark
$85,
000
$87,
550
$90,
177
$92,
882
$95,
668
$98,
538
$101
,494
$104
,539
$107
,675
$110
,906
Avo
cet N
atur
e R
efug
e$7
5,00
0$7
7,25
0$7
9,56
8$8
1,95
5$8
4,41
3$8
6,94
6$8
9,55
4$9
2,24
1$9
5,00
8$9
7,85
8
Tran
sloc
atio
n si
te 1
- Sc
otia
$30,
000
$30,
900
$31,
827
$32,
782
$33,
765
$34,
778
$35,
822
$36,
896
$38,
003
$39,
143
Tran
sloc
atio
n si
te 2
- B
owra
$30,
000
$30,
900
$31,
827
$32,
782
$33,
765
$34,
778
$35,
822
$36,
896
$38,
003
$39,
143
Taun
ton
Nat
iona
l Par
k
Con
duct
str
ateg
ic c
at a
nd w
ild d
og s
hoot
ing
prog
ram
$25,
000
$25,
750
$26,
523
$27,
318
$28,
138
$28,
982
$29,
851
$30,
747
$31,
669
$32,
619
Idal
ia N
atio
nal P
ark
$25,
000
$25,
750
$26,
523
$27,
318
$28,
138
$28,
982
$29,
851
$30,
747
$31,
669
$32,
619
Avo
cet N
atur
e R
efug
e$2
5,00
0$2
5,75
0$2
6,52
3$2
7,31
8$2
8,13
8$2
8,98
2$2
9,85
1$3
0,74
7$3
1,66
9$3
2,61
9
Tran
sloc
atio
n si
te 1
- Sc
otia
$12,
000
$12,
360
$12,
731
$13,
113
$13,
506
$13,
911
$14,
329
$14,
758
$15,
201
$15,
657
Tran
sloc
atio
n si
te 2
- B
owra
$12,
000
$12,
360
$12,
731
$13,
113
$13,
506
$13,
911
$14,
329
$14,
758
$15,
201
$15,
657
Taun
ton
Nat
iona
l Par
k
Impl
emen
t fire
man
agem
ent p
rogr
am -
mai
ntai
n co
ntro
l lin
es
$10,
000
$10,
300
$10,
609
$10,
927
$11,
255
$11,
593
$11,
941
$12,
299
$12,
668
$13,
048
Idal
ia N
atio
nal P
ark
$10,
000
$10,
300
$10,
609
$10,
927
$11,
255
$11,
593
$11,
941
$12,
299
$12,
668
$13,
048
Avo
cet N
atur
e R
efug
e$1
0,00
0$1
0,30
0$1
0,60
9$1
0,92
7$1
1,25
5$1
1,59
3$1
1,94
1$1
2,29
9$1
2,66
8$1
3,04
8
Tran
sloc
atio
n si
te 1
$5,0
00$5
,150
$5,3
05$5
,464
$5,6
28$5
,796
$5,9
70$6
,149
$6,3
34$6
,524
Tran
sloc
atio
n si
te 2
$5,0
00$5
,150
$5,3
05$5
,464
$5,6
28$5
,796
$5,9
70$6
,149
$6,3
34$6
,524
Taun
ton
Nat
iona
l Par
k
Impl
emen
t fire
man
agem
ent p
rogr
am -
patc
h bu
rns
$20,
000
$20,
600
$21,
218
$21,
855
$22,
510
$23,
185
$23,
881
$24,
597
$25,
335
$26,
095
Idal
ia N
atio
nal P
ark
$20,
000
$20,
600
$21,
218
$21,
855
$22,
510
$23,
185
$23,
881
$24,
597
$25,
335
$26,
095
Avo
cet N
atur
e R
efug
e$2
0,00
0$2
0,60
0$2
1,21
8$2
1,85
5$2
2,51
0$2
3,18
5$2
3,88
1$2
4,59
7$2
5,33
5$2
6,09
5
Tran
sloc
atio
n si
te 1
- Sc
otia
$15,
000
$15,
450
$15,
914
$16,
391
$16,
883
$17,
389
$17,
911
$18,
448
$19,
002
$19,
572
Tran
sloc
atio
n si
te 2
- B
owra
$15,
000
$15,
450
$15,
914
$16,
391
$16,
883
$17,
389
$17,
911
$18,
448
$19,
002
$19,
572
Taun
ton
Nat
iona
l Par
k
Con
duct
wee
d co
ntro
l
$10,
000
$10,
300
$10,
609
$10,
927
$11,
255
$11,
593
$11,
941
$12,
299
$12,
668
$13,
048
Avo
cet N
atur
e R
efug
e$1
0,00
0$1
0,30
0$1
0,60
9$1
0,92
7$1
1,25
5$1
1,59
3$1
1,94
1$1
2,29
9$1
2,66
8$1
3,04
8
Idal
ia N
atio
nal P
ark
$10,
000
$10,
300
$10,
609
$10,
927
$11,
255
$11,
593
$11,
941
$12,
299
$12,
668
$13,
048
Tran
sloc
atio
n si
te 1
- Sc
otia
$5,0
00$5
,150
$5,3
05$5
,464
$5,6
28$5
,796
$5,9
70$6
,149
$6,3
34$6
,524
Tran
sloc
atio
n si
te 2
- B
owra
$5,0
00$5
,150
$5,3
05$5
,464
$5,6
28$5
,796
$5,9
70$6
,149
$6,3
34$6
,524
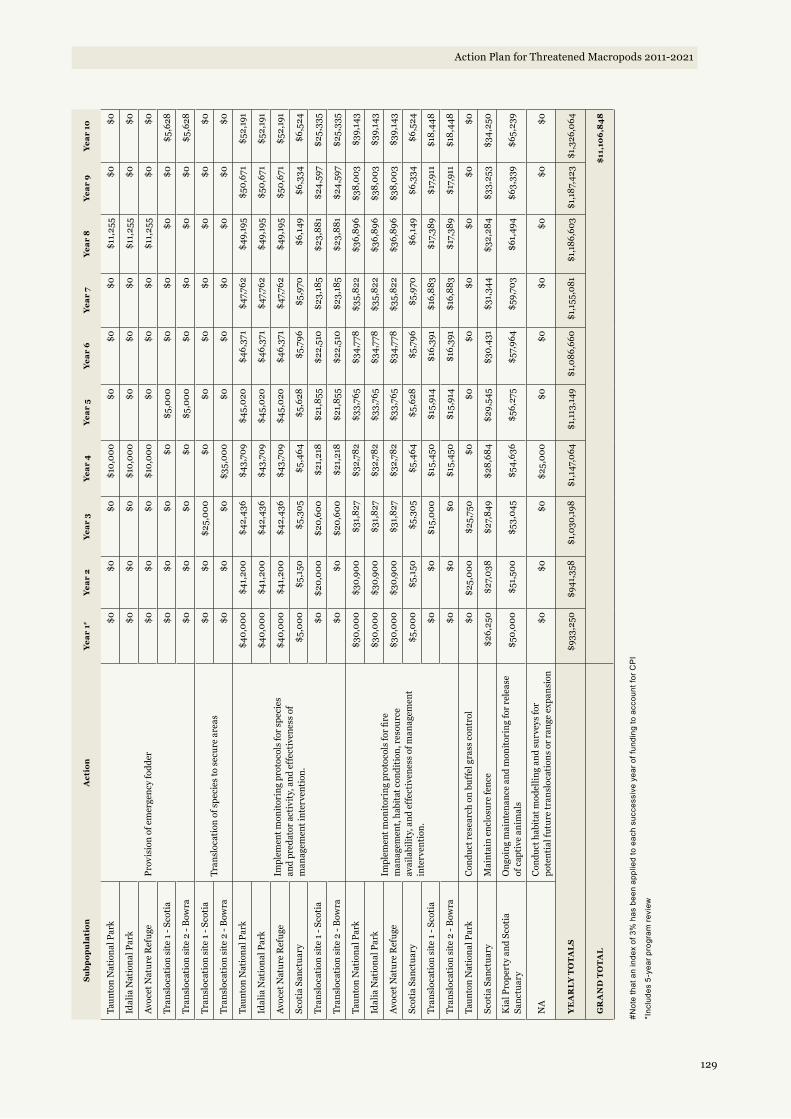
129
Action Plan for Threatened Macropods 2011-2021
Su
bp
op
ula
tio
nA
ctio
nY
ear
1#Y
ear
2Y
ear
3Y
ear
4Y
ear
5Y
ear
6Y
ear
7Y
ear
8Y
ear
9Y
ear
10
Taun
ton
Nat
iona
l Par
k
Prov
isio
n of
em
erge
ncy
fodd
er
$0$0
$0$1
0,00
0$0
$0$0
$11,
255
$0$0
Idal
ia N
atio
nal P
ark
$0$0
$0$1
0,00
0$0
$0$0
$11,
255
$0$0
Avo
cet N
atur
e R
efug
e$0
$0$0
$10,
000
$0$0
$0$1
1,25
5$0
$0
Tran
sloc
atio
n si
te 1
- Sc
otia
$0$0
$0$0
$5,0
00$0
$0$0
$0$5
,628
Tran
sloc
atio
n si
te 2
- B
owra
$0$0
$0$0
$5,0
00$0
$0$0
$0$5
,628
Tran
sloc
atio
n si
te 1
- Sc
otia
Tran
sloc
atio
n of
spe
cies
to s
ecur
e ar
eas
$0$0
$25,
000
$0$0
$0$0
$0$0
$0
Tran
sloc
atio
n si
te 2
- B
owra
$0$0
$0$3
5,00
0$0
$0$0
$0$0
$0
Taun
ton
Nat
iona
l Par
k
Impl
emen
t mon
itori
ng p
roto
cols
for s
peci
es
and
pred
ator
act
ivit
y, a
nd e
ffec
tive
ness
of
man
agem
ent i
nter
vent
ion.
$40,
000
$41,
200
$42,
436
$43,
709
$45,
020
$46,
371
$47,
762
$49,
195
$50,
671
$52,
191
Idal
ia N
atio
nal P
ark
$40,
000
$41,
200
$42,
436
$43,
709
$45,
020
$46,
371
$47,
762
$49,
195
$50,
671
$52,
191
Avo
cet N
atur
e R
efug
e$4
0,00
0$4
1,20
0$4
2,43
6$4
3,70
9$4
5,02
0$4
6,37
1$4
7,76
2$4
9,19
5$5
0,67
1$5
2,19
1
Scot
ia S
anct
uary
$5,0
00$5
,150
$5,3
05$5
,464
$5,6
28$5
,796
$5,9
70$6
,149
$6,3
34$6
,524
Tran
sloc
atio
n si
te 1
- Sc
otia
$0$2
0,00
0$2
0,60
0$2
1,21
8$2
1,85
5$2
2,51
0$2
3,18
5$2
3,88
1$2
4,59
7$2
5,33
5
Tran
sloc
atio
n si
te 2
- B
owra
$0$0
$20,
600
$21,
218
$21,
855
$22,
510
$23,
185
$23,
881
$24,
597
$25,
335
Taun
ton
Nat
iona
l Par
k
Impl
emen
t mon
itori
ng p
roto
cols
for fi
re
man
agem
ent,
habi
tat c
ondi
tion
, res
ourc
e av
aila
bilit
y, a
nd e
ffec
tive
ness
of m
anag
emen
t in
terv
enti
on.
$30,
000
$30,
900
$31,
827
$32,
782
$33,
765
$34,
778
$35,
822
$36,
896
$38,
003
$39,
143
Idal
ia N
atio
nal P
ark
$30,
000
$30,
900
$31,
827
$32,
782
$33,
765
$34,
778
$35,
822
$36,
896
$38,
003
$39,
143
Avo
cet N
atur
e R
efug
e$3
0,00
0$3
0,90
0$3
1,82
7$3
2,78
2$3
3,76
5$3
4,77
8$3
5,82
2$3
6,89
6$3
8,00
3$3
9,14
3
Scot
ia S
anct
uary
$5,0
00$5
,150
$5,3
05$5
,464
$5,6
28$5
,796
$5,9
70$6
,149
$6,3
34$6
,524
Tran
sloc
atio
n si
te 1
- Sc
otia
$0$0
$15,
000
$15,
450
$15,
914
$16,
391
$16,
883
$17,
389
$17,
911
$18,
448
Tran
sloc
atio
n si
te 2
- B
owra
$0$0
$0$1
5,45
0$1
5,91
4$1
6,39
1$1
6,88
3$1
7,38
9$1
7,91
1$1
8,44
8
Taun
ton
Nat
iona
l Par
kC
ondu
ct r
esea
rch
on b
uffe
l gra
ss c
ontr
ol$0
$25,
000
$25,
750
$0$0
$0$0
$0$0
$0
Scot
ia S
anct
uary
Mai
ntai
n en
clos
ure
fenc
e$2
6,25
0$2
7,03
8$2
7,84
9$2
8,68
4$2
9,54
5$3
0,43
1$3
1,34
4$3
2,28
4$3
3,25
3$3
4,25
0
Kia
l Pro
pert
y an
d Sc
otia
Sa
nctu
ary
Ong
oing
mai
nten
ance
and
mon
itori
ng fo
r rel
ease
of
cap
tive
ani
mal
s$5
0,00
0$5
1,50
0$5
3,04
5$5
4,63
6$5
6,27
5$5
7,96
4$5
9,70
3$6
1,49
4$6
3,33
9$6
5,23
9
NA
Con
duct
hab
itat
mod
ellin
g an
d su
rvey
s fo
r po
tent
ial f
utur
e tr
ansl
ocat
ions
or r
ange
exp
ansi
on$0
$0$0
$25,
000
$0$0
$0$0
$0$0
YE
AR
LY
TO
TA
LS
$933
,250
$941
,358
$1,0
30,1
98$1
,147
,064
$1,1
13,1
49$1
,086
,660
$1,1
55,0
81$1
,186
,603
$1,1
87,4
23$1
,326
,064
GR
AN
D T
OT
AL
$11,
106
,84
8
#Not
e th
at a
n in
dex
of 3
% h
as b
een
appl
ied
to e
ach
succ
essi
ve y
ear o
f fun
ding
to a
ccou
nt fo
r CP
I
*Inc
lude
s 5-
year
pro
gram
revi
ew

130
Action Plan for Threatened Macropods 2011-2021
Recovery Outline - Petrogale burbidgei
1. Family Macropodidae
2. Scientific name: Petrogale burbidgei (Kitchener & Sanson, 1978)
3. Common name: Monjon, Warabi14
4. Conservation status (IUCN): Endangered; B1ab(iii)
5. Reasons for listing
Listed as Near Threatened because it has a relatively small distribution and might be declining. More research is needed into the distribution, abundance, and potential threats to this species. There is some evidence that changing fire regimes could pose a threat to this species, however, there is no current research of its affects on the populations. The species approaches Vulnerable under criterion B, and could qualify if more evidence on threats is presented (Burbidge et al. 2008).
6. Infraspecific Taxa
6.1 None.
7. Range and abundance
14 The common name Warabi is possibly misplaced, being a mispronunciation of the word ‘wallaby’.
Figure 13: Known distribution of Petrogale burbidgei from the 2008 Global Mammal Assessment (IUCN 2010; Landsat imagery ©Commonwealth of Australia - Geoscience Australia).
This species is found in some of the most remote and rugged areas of the north-west Kimberley of Western Australia. It is present on a few nearby islands: Bigge, Boongaree, Katers, and possibly Wollaston (based on a sight record). The only known localities on the mainland are in and around the Prince Regent Nature Reserve to the Mitchell Plateau (Pearson et al. 2008). There have been detailed surveys of the largest Kimberley islands during 2008-10 by DEC and other previous surveys by CALM and the WA Museum, which suggests that monjons probably occur on just these few islands (D. Pearson, pers. comm.).
There is abundant habitat but monjons occupy a small range for reasons that are not readily apparent, i.e. they only occur in the very high rainfall areas of the north Kimberley (D. Pearson, pers. comm.). The population is abundant on Bigge Island (ca. 18,000 ha) (Burbidge et al. 2008).

131
Action Plan for Threatened Macropods 2011-2021
8. Habitat
During the day, Monjon can be found in rugged sandstone areas, screes and rock piles. At dusk, Monjon move from their daytime caves and crevices to forage in neighbouring vegetation such as low open woodland of eucalypts, acacias, figs, Terminalia and Owenia or vine thickets among boulders.
9. Threats
9.1 Unknown
9.2 Predation by feral cats may be affecting abundance on the mainland.
9.3 Changed fire regimes may also be affecting the species.
10. Information required
10.1 Survey to clarify distribution, abundance, and habitat requirements, especially on the mainland.
10.2 Identify populations for regular monitoring.
10.3 Conduct research aimed at understanding the species biology and threats, especially the loss of preferred food plants due to frequent fires.
11. Recovery objectives
11.1 By 2021, Petrogale burbidgei is eligible for listing as Least Concern according to IUCN Red List criteria.
11.2 By 2021, research, surveys and monitoring confirm the population trend of Petrogale burbidgei as stable.
11.3 By 2021, research has investigated the impacts of changing fire regimes, cattle grazing and feral cats on Petrogale burbidgei, and where those present a threat to Petrogale burbidgei subpopulations, management plans have been developed and are being implemented to mitigate those threats.
11.4 By 2021, the genetic diversity of Petrogale burbidgei has been maintained at known 2011 levels.
12. Actions completed or underway
12.1 Kimberley islands survey (DEC 2008-2010) confirmed the presence of monjons on Bigge, Katers and Boongaree islands, but they were not located on any of the other 30 largest islands surveyed (D. Pearson, pers. comm.).
13. Management actions required
13.1 Status assessment of the species – distribution and abundance.
13.2 Status assessment – genetic diversity.
13.3 Status assessment of the species – identify important subpopulations, and those subject to specific threats including fire and feral cats.
13.4 Develop a management plan for those subpopulations subject to threats of altered fire regimes, feral cat predation, and possible infrastructure development.
13.5 Implement management actions to reduce the threat of altered fire regimes.
13.6 Implement management actions to reduce the threat of feral cat predation if they are shown to be a threat.
13.7 Reserve suitable habitat for the species.
13.8 Conduct habitat assessment and modelling to determine current habitat condition and possibilities for future range expansion.
13.9 Conduct research into species biology, ecology, conservation requirements and preferred fire regime.
13.10 Implement monitoring protocols for species activity, and effectiveness of management intervention.
13.11 Implement monitoring protocols for fire management and habitat condition, and effectiveness of management intervention.
13.12 Manage data to inform adaptive management.
14. Organisations responsible for conservation of species
14.1 West Australian Department of Environment and Conservation
15. Other organisations involved
15.1 Kimberley Land Council.
16. Staff and other resources required for recovery to be carried out
16.1 No dedicated staff required.
17. Action costs
17.1 Total cost over 10 years exceeds A$3.8 million.
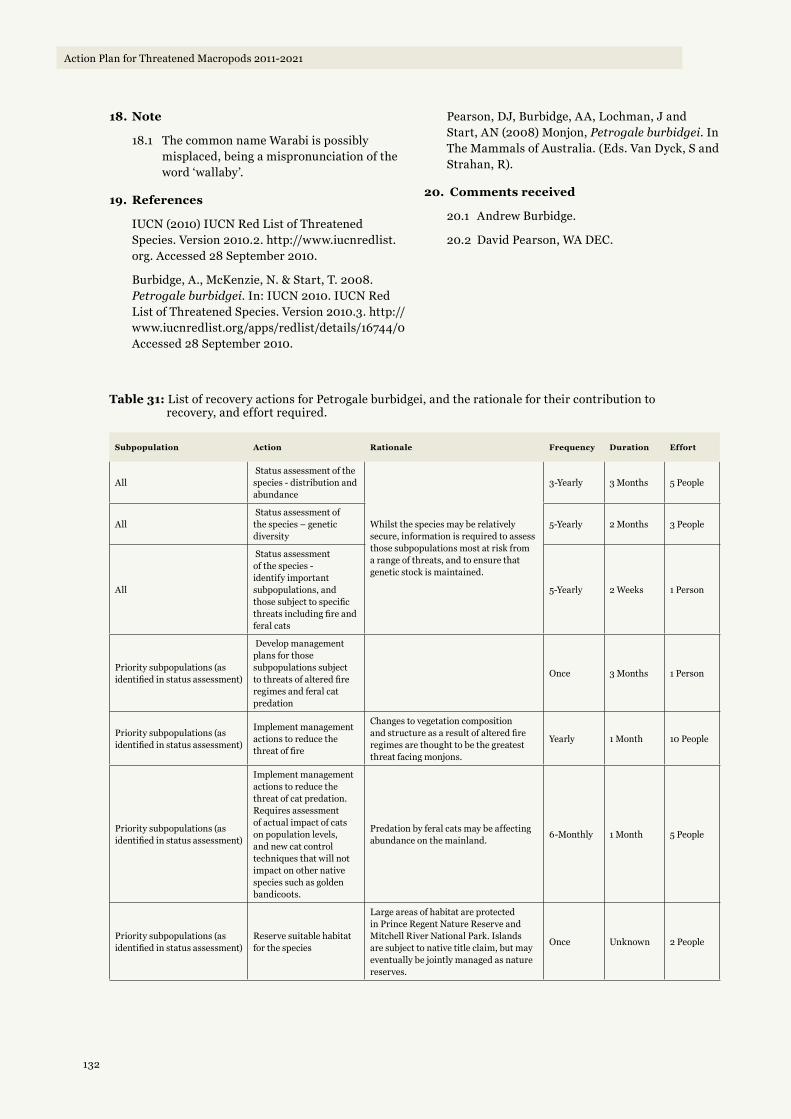
132
Action Plan for Threatened Macropods 2011-2021
18. Note
18.1 The common name Warabi is possibly misplaced, being a mispronunciation of the word ‘wallaby’.
19. References
IUCN (2010) IUCN Red List of Threatened Species. Version 2010.2. http://www.iucnredlist.org. Accessed 28 September 2010.
Burbidge, A., McKenzie, N. & Start, T. 2008. Petrogale burbidgei. In: IUCN 2010. IUCN Red List of Threatened Species. Version 2010.3. http://www.iucnredlist.org/apps/redlist/details/16744/0 Accessed 28 September 2010.
Pearson, DJ, Burbidge, AA, Lochman, J and Start, AN (2008) Monjon, Petrogale burbidgei. In The Mammals of Australia. (Eds. Van Dyck, S and Strahan, R).
20. Comments received
20.1 Andrew Burbidge.
20.2 David Pearson, WA DEC.
Table 31: List of recovery actions for Petrogale burbidgei, and the rationale for their contribution to recovery, and effort required.
Subpopulation Action Rationale Frequency Duration Effort
All Status assessment of the species - distribution and abundance
Whilst the species may be relatively secure, information is required to assess those subpopulations most at risk from a range of threats, and to ensure that genetic stock is maintained.
3-Yearly 3 Months 5 People
All Status assessment of the species – genetic diversity
5-Yearly 2 Months 3 People
All
Status assessment of the species - identify important subpopulations, and those subject to specific threats including fire and feral cats
5-Yearly 2 Weeks 1 Person
Priority subpopulations (as identified in status assessment)
Develop management plans for those subpopulations subject to threats of altered fire regimes and feral cat predation
Once 3 Months 1 Person
Priority subpopulations (as identified in status assessment)
Implement management actions to reduce the threat of fire
Changes to vegetation composition and structure as a result of altered fire regimes are thought to be the greatest threat facing monjons.
Yearly 1 Month 10 People
Priority subpopulations (as identified in status assessment)
Implement management actions to reduce the threat of cat predation. Requires assessment of actual impact of cats on population levels, and new cat control techniques that will not impact on other native species such as golden bandicoots.
Predation by feral cats may be affecting abundance on the mainland.
6-Monthly 1 Month 5 People
Priority subpopulations (as identified in status assessment)
Reserve suitable habitat for the species
Large areas of habitat are protected in Prince Regent Nature Reserve and Mitchell River National Park. Islands are subject to native title claim, but may eventually be jointly managed as nature reserves.
Once Unknown 2 People

133
Action Plan for Threatened Macropods 2011-2021
Subpopulation Action Rationale Frequency Duration Effort
All
Conduct habitat assessment and modelling to determine current habitat condition and possibilities for future range expansion.
To qualify for Least Concern, the species range in the form of extent of occurrence may need to be expanded, and an understanding of potential habitat surrounding extant subpopulations will be required. There is no need to include range expansion until we know population trends and whether range has declined.
5-Yearly 6 Months 1 Person
All
Conduct research into species biology, ecology and conservation requirements
Very little is known about this species, and urgent research is required to inform adaptive conservation measures.
Once Unknown 2 People
Priority subpopulations (as identified in status assessment)
Implement monitoring protocols for species activity, and effectiveness of management intervention.
Monitoring is essential to ensure adaptive management and achieving the species objectives.
6-Monthly 2 Weeks 4 People
Priority subpopulations (as identified in status assessment)
Implement monitoring protocols for fire management and effectiveness of management intervention.
Yearly 1 Month 5 People
All
Investigate need to undertake translocations to increase the species' extent of occurrence above 20,000 km2.
To qualify for Least Concern, the species range in the form of extent of occurrence may need to be expanded, and an understanding of potential habitat surrounding extant subpopulations will be required.
Once 3 Months 1 Person
AllManage data to inform adaptive management
Good data management is essential to making it possible to extract the maximum amount of information from monitoring data.
6-Monthly 1 Week 1 Person

134
Action Plan for Threatened Macropods 2011-2021
Tab
le 3
2: L
ist o
f rec
over
y ac
tion
s fo
r Pe
trog
ale
burb
idge
i , a
nd t
heir
cos
ts
Su
bp
op
ula
tio
nA
ctio
nY
ear
1#Y
ear
2Y
ear
3Y
ear
4Y
ear
5Y
ear
6Y
ear
7Y
ear
8Y
ear
9Y
ear
10
All
Sta
tus
asse
ssm
ent o
f the
spe
cies
- di
stri
buti
on
and
abun
danc
e$1
50,0
00$0
$0$6
5,56
4$0
$0$7
1,64
4$0
$0$7
8,28
7
All
Sta
tus
asse
ssm
ent o
f the
spe
cies
– g
enet
ic
dive
rsit
y$3
0,00
0$0
$0$0
$33,
765
$0$0
$0$0
$39,
143
All
Sta
tus
asse
ssm
ent o
f the
spe
cies
- id
enti
fy
impo
rtan
t sub
popu
lati
ons,
and
thos
e su
bjec
t to
spec
ific
thre
ats
incl
udin
g fir
e an
d fe
ral c
ats
$20,
000
$0$0
$0$2
2,51
0$0
$0$0
$0$0
Prio
rity
sub
popu
lati
ons
(as
iden
tifie
d in
sta
tus
asse
ssm
ent)
Dev
elop
man
agem
ent p
lans
for t
hose
su
bpop
ulat
ions
sub
ject
to th
reat
s of
alte
red
fire
regi
mes
and
fera
l cat
pre
dati
on$0
$25,
000
$0$0
$0$1
0,00
0$0
$0$0
$0
Prio
rity
sub
popu
lati
ons
(as
iden
tifie
d in
sta
tus
asse
ssm
ent)
Impl
emen
t man
agem
ent a
ctio
ns to
red
uce
the
thre
at o
f fire
$0$1
00,0
00$1
03,0
00$1
06,0
90$1
09,2
73$1
12,5
51$1
15,9
27$1
19,4
05$1
22,9
87$1
26,6
77
Prio
rity
sub
popu
lati
ons
(as
iden
tifie
d in
sta
tus
asse
ssm
ent)
Impl
emen
t man
agem
ent a
ctio
ns to
red
uce
the
thre
at o
f cat
pre
dati
on$0
$40,
000
$41,
200
$42,
436
$43,
709
$45,
020
$46,
371
$47,
762
$49,
195
$50,
671
Prio
rity
sub
popu
lati
ons
(as
iden
tifie
d in
sta
tus
asse
ssm
ent)
Res
erve
sui
tabl
e ha
bita
t for
the
spec
ies
$0$0
$250
,000
$0$0
$0$2
81,3
77$0
$0$0
All
Con
duct
hab
itat
ass
essm
ent a
nd m
odel
ling
to d
eter
min
e cu
rren
t hab
itat
con
diti
on a
nd
poss
ibili
ties
for f
utur
e ra
nge
expa
nsio
n.$0
$30,
000
$30,
900
$31,
827
$0$0
$0$0
$0$0
All
Con
duct
res
earc
h in
to s
peci
es b
iolo
gy, e
colo
gy a
nd
cons
erva
tion
req
uire
men
ts$0
$0$3
0,00
0$3
0,90
0$3
1,82
7$0
$0$0
$0$0
Prio
rity
sub
popu
lati
ons
(as
iden
tifie
d in
sta
tus
asse
ssm
ent)
Impl
emen
t mon
itori
ng p
roto
cols
for s
peci
es
acti
vity
, pre
dato
r act
ivit
y, a
nd e
ffec
tive
ness
of
man
agem
ent i
nter
vent
ion.
$60,
000
$61,
800
$63,
654
$65,
564
$67,
531
$69,
556
$71,
643
$73,
792
$76,
006
$78,
286
Prio
rity
sub
popu
lati
ons
(as
iden
tifie
d in
sta
tus
asse
ssm
ent)
Impl
emen
t mon
itori
ng p
roto
cols
for fi
re
man
agem
ent a
nd h
abit
at c
ondi
tion
, and
ef
fect
iven
ess
of m
anag
emen
t int
erve
ntio
n.$3
0,00
0$3
0,90
0$3
1,82
7$3
2,78
2$3
3,76
5$3
4,77
8$3
5,82
2$3
6,89
6$3
8,00
3$3
9,14
3
All
Inve
stig
ate
need
to u
nder
take
tran
sloc
atio
ns to
in
crea
se th
e sp
ecie
s' ex
tent
of o
ccur
renc
e ab
ove
20,0
00 k
m2.
$0$0
$0$2
0,00
0$0
$0$0
$0$0
$0
All
Man
age
data
to in
form
ada
ptiv
e m
anag
emen
t$5
,000
$5,1
50$5
,305
$5,4
64$2
5,62
8*$5
,796
$5,9
70$6
,149
$6,3
33$2
6,52
3*
YE
AR
LY
TO
TA
LS
$295
,000
$292
,850
$555
,886
$400
,626
$368
,008
$277
,702
$628
,754
$284
,005
$292
,525
$438
,730
GR
AN
D T
OT
AL
$3,8
34
,08
5
#Not
e th
at a
n in
dex
of 3
% h
as b
een
appl
ied
to e
ach
succ
essi
ve y
ear o
f fun
ding
to a
ccou
nt fo
r CP
I
*Inc
lude
s 5-
year
pro
gram
revi
ew

135
Action Plan for Threatened Macropods 2011-2021
Recovery Outline - Petrogale coenensis
1. Family Macropodidae
2. Scientific name: Petrogale coenensis (Eldridge & Close, 1992)
3. Common name: Cape York Rock Wallaby
4. Conservation status (IUCN): Near Threatened
5. Reasons for listing
Listed as Near Threatened because its extent of occurrence is less than 20,000 km2, and there is a serious decline in the quality of its habitat in parts of its range due cattle grazing and changes to the fire regime, thus making the species close to qualifying for Vulnerable under criterion B1 (Winter et al. 2008).
6. Infraspecific Taxa
6.1 None
7. Range and abundance
This species is restricted to a small area of the eastern Cape York Peninsula, Australia. It ranges from Musgrave to the Pascoe River in elevation from sea level to 400 m above sea level.
This species is rare, but recent surveys have found four new populations, and it might be underestimated (Eldridge et al. 2008).
Figure 14: Known distribution of Petrogale coenensis from the 2008 Global Mammal Assessment (IUCN 2010; Landsat imagery ©Commonwealth of Australia - Geoscience Australia).
8. Habitat
The habitat of this species includes rocky outcrops, rocky gullies, and boulder piles, dry creek beds, usually within open woodland.

136
Action Plan for Threatened Macropods 2011-2021
9. Threats
9.1 The habitat near some populations is adversely affected by cattle grazing and fire.
9.2 Feral cats may take a few young animals.
10. Information required
10.1 Survey to clarify distribution, abundance and habitat requirements.
10.2 Identify populations for regular monitoring.
10.3 Conduct research aimed at understanding biology, ecology, and conservation requirements.
11. Recovery objectives
11.1 By 2021, Petrogale coenensis is eligible for listing as Least Concern according to IUCN Red List criteria.
11.2 By 2021, research, surveys and monitoring confirm the population trend of Petrogale coenensis as stable.
11.3 By 2021, the geographic range of Petrogale coenensis in the form of extent of occurrence has increased to greater than 20,000 km2.
11.4 By 2021, research has confirmed the impacts of changing fire regimes and cattle grazing on Petrogale coenensis, and where those regimes present a threat to Petrogale coenensis subpopulations, management plans have been developed and are being implemented to mitigate those threats.
11.5 By 2021, the genetic diversity of Petrogale coenensis has been maintained at known 2011 levels.
12. Actions completed or underway
12.1 Recent surveys have detected at least four new populations near the town of Coen and the species may not be as rare as previously thought (Eldridge et al. 2008).
13. Management actions required
13.1 Status assessment of the species, including genetics, abundance, distribution, trend and risks.
13.2 Identify areas where excessive grazing and altered fire regimes pose significant threats to rock wallabies and develop management plans for those subpopulations.
13.3 Assess threat of feral cats to juvenile rock wallabies and conduct cat control where necessary.
13.4 Reserve suitable habitats for the species.
13.5 Habitat assessment and modelling to determine current habitat condition and possibilities for future range expansion.
13.6 Implement monitoring protocols, including fire management, grazing, habitat condition, predation and predator activity, and species activity.
13.7 Research species biology, ecology and conservation requirements.
13.8 Manage data to inform adaptive management.
14. Organisations responsible for conservation of species
14.1 Queensland Department of Environment and Resource Management.
15. Other organisations involved
15.1 None.
16. Staff and other resources required for recovery to be carried out
16.1 No dedicated staff required.
17. Action costs
17.1 Total cost over 10 years exceeds A$4.2 million.
18. Notes
18.1 None.
19. References
Eldridge, MDB, Moore, LA and Close, RL (2008) Cape York Rock Wallaby (Petrogale coenensis). In The Mammals of Australia. (Eds. Van Dyck, S and Strahan, R).
IUCN (2010) IUCN Red List of Threatened Species. Version 2010.3. http://www.iucnredlist.org. Accessed 19 October 2010.
Winter, J., Burnett, S. & Martin, R. 2008. Petrogale coenensis. In: IUCN (2010) IUCN Red List of Threatened Species. Version 2010.3. http://www.iucnredlist.org/apps/redlist/details/16752/0 . Accessed 19 October 2010.
Van Dyck, S & Strahan, R (eds.) (2008) The Mammals of Australia. New Holland Publishers, Sydney.
20. Comments received from
20.1 None

137
Action Plan for Threatened Macropods 2011-2021
Table 33: List of recovery actions for Petrogale coenensis, and the rationale for their contribution to recovery, and effort required.
Subpopulation Action Rationale Frequency Duration Effort
AllStatus assessment of the species - distribution and abundance
Whilst the species is relatively secure, information is required to assess those subpopulations most at risk from a range of threats, and to ensure that genetic stock is maintained.
3-Yearly 3 Months 5 People
AllStatus assessment of the species - genetics
5-Yearly 2 Months 3 People
All
Status assessment of the species - identify important subpopulations, and those subject to specific threats including grazing, fire and cats
Little is known about which subpopulations should be targeted for intensive management.
5-Yearly 2 Weeks 1 Person
AllManage data to inform adaptive management
Good data management is essential to making it possible to extract the maximum amount of information from monitoring data.
6-Monthly 1 Week 1 Person
Priority subpopulations (as identified in status assessment)
Develop management plans for those subpopulations subject to threats of cattle grazing, altered fire regimes and feral cat predation
The woodlands surrounding some populations are significantly impacted by cattle grazing and fire. Here, rock wallaby activity appears limited to areas on the ridges and among outcrops that escape serious impact. Consequently those populations located in smaller isolated outcrops and ridges may be at risk from the direct impacts of grazing, as well as fire regimes altered to favour pastoral objectives.
Once 3 Months 1 Person
Priority subpopulations (as identified in status assessment)
Implement management actions to reduce the threat of cattle grazing
6-Monthly 2 Weeks 4 People
Priority subpopulations (as identified in status assessment)
Implement management actions to reduce the threat of fire
Yearly 1 Month 10 People
Priority subpopulations (as identified in status assessment)
Implement management actions to reduce the threat of cat predation
6-Monthly 1 Month 5 People
AllReserve suitable habitat for the species
Little of the rock wallaby's habitat is protected within reserves. Sufficient habitat will be required to ensure the ongoing security of the species.
Once Unknown 2 People
All
Conduct habitat assessment and modelling to determine current habitat condition and possibilities for future range expansion.
To qualify for Least Concern, the species range in the form of extent of occurrence may need to be expanded, and an understanding of potential habitat surrounding extant subpopulations will be required.
5-Yearly 6 Months 1 Person
All
Conduct research into species biology, ecology and conservation requirements
Very little is known about this species, and urgent research is required to inform adaptive conservation measures.
Once Unknown 2 People
All
Implement monitoring protocols for species activity, predator activity, and effectiveness of management intervention. Monitoring is essential to ensure
adaptive management and achieving the species objectives.
6-Monthly 2 Weeks 4 People
All
Implement monitoring protocols for fire and grazing management and habitat condition, and effectiveness of management intervention.
Yearly 1 Month 5 People
All
Investigate need to undertake translocations to increase the species' extent of occurrence above 20,000 km2.
Once secure habitat is identified outside the current species range, it may be necessary to translocate animals to create a new subpopulation, thus bolstering the future security of the species.
Once 3 Months 1 Person

138
Action Plan for Threatened Macropods 2011-2021
Tab
le 3
4: L
ist o
f rec
over
y ac
tion
s fo
r Pe
trog
ale
coen
ensi
s, a
nd t
heir
cos
ts
Su
bp
op
ula
tio
nA
ctio
nY
ear
1#Y
ear
2Y
ear
3Y
ear
4Y
ear
5Y
ear
6Y
ear
7Y
ear
8Y
ear
9Y
ear
10
All
Stat
us a
sses
smen
t of t
he s
peci
es -
dist
ribu
tion
and
ab
unda
nce
$60,
000
$0$0
$65,
564
$0$0
$71,
644
$0$0
$78,
287
All
Stat
us a
sses
smen
t of t
he s
peci
es -
gene
tics
$30,
000
$0$0
$0$3
3,76
5$0
$0$0
$0$3
9,14
3
All
Stat
us a
sses
smen
t of t
he s
peci
es -
iden
tify
im
port
ant s
ubpo
pula
tion
s, a
nd th
ose
subj
ect t
o sp
ecifi
c th
reat
s in
clud
ing
graz
ing,
fire
and
cat
s$2
0,00
0$0
$0$0
$22,
510
$0$0
$0$0
$0
All
Man
age
data
to in
form
ada
ptiv
e m
anag
emen
t$5
,000
$5,1
50$5
,305
$5,4
64$2
5,62
8*$5
,796
$5,9
70$6
,149
$6,3
33$2
6,52
3*
Prio
rity
sub
popu
lati
ons
(as
iden
tifie
d in
sta
tus
asse
ssm
ent)
Dev
elop
man
agem
ent p
lans
for t
hose
su
bpop
ulat
ions
sub
ject
to th
reat
s of
cat
tle
graz
ing,
al
tere
d fir
e re
gim
es a
nd fe
ral c
at p
reda
tion
$0$2
5,00
0$0
$0$0
$10,
000
$0$0
$0$0
Prio
rity
sub
popu
lati
ons
(as
iden
tifie
d in
sta
tus
asse
ssm
ent)
Impl
emen
t man
agem
ent a
ctio
ns to
red
uce
the
thre
at o
f cat
tle
graz
ing
$0$5
0,00
0$5
1,50
0$5
3,04
5$5
4,63
6$5
6,27
5$5
7,96
4$5
9,70
3$6
1,49
4$6
3,33
9
Prio
rity
sub
popu
lati
ons
(as
iden
tifie
d in
sta
tus
asse
ssm
ent)
Impl
emen
t man
agem
ent a
ctio
ns to
red
uce
the
thre
at o
f fire
$0$1
00,0
00$1
03,0
00$1
06,0
90$1
09,2
73$1
12,5
51$1
15,9
27$1
19,4
05$1
22,9
87$1
26,6
77
Prio
rity
sub
popu
lati
ons
(as
iden
tifie
d in
sta
tus
asse
ssm
ent)
Impl
emen
t man
agem
ent a
ctio
ns to
red
uce
the
thre
at o
f cat
pre
dati
on$0
$40,
000
$41,
200
$42,
436
$43,
709
$45,
020
$46,
371
$47,
762
$49,
195
$50,
671
All
Res
erve
sui
tabl
e ha
bita
t for
the
spec
ies
$0$1
25,0
00$1
28,7
50$1
32,6
13$1
36,5
91$0
$0$0
$0$0
All
Con
duct
hab
itat
ass
essm
ent a
nd m
odel
ling
to d
eter
min
e cu
rren
t hab
itat
con
diti
on a
nd
poss
ibili
ties
for f
utur
e ra
nge
expa
nsio
n.$0
$30,
000
$30,
900
$31,
827
$0$0
$0$0
$0$0
All
Con
duct
res
earc
h in
to s
peci
es b
iolo
gy, e
colo
gy a
nd
cons
erva
tion
req
uire
men
ts$0
$0$3
0,00
0$3
0,90
0$3
1,82
7$0
$0$0
$0$0
All
Impl
emen
t mon
itori
ng p
roto
cols
for s
peci
es
acti
vity
, pre
dato
r act
ivit
y, a
nd e
ffec
tive
ness
of
man
agem
ent i
nter
vent
ion.
$60,
000
$61,
800
$63,
654
$65,
564
$67,
531
$69,
556
$71,
643
$73,
792
$76,
006
$78,
286
All
Impl
emen
t mon
itori
ng p
roto
cols
for fi
re a
nd
graz
ing
man
agem
ent a
nd h
abit
at c
ondi
tion
, and
ef
fect
iven
ess
of m
anag
emen
t int
erve
ntio
n.$3
0,00
0$3
0,90
0$3
1,82
7$3
2,78
2$3
3,76
5$3
4,77
8$3
5,82
2$3
6,89
6$3
8,00
3$3
9,14
3
All
Inve
stig
ate
need
to u
nder
take
tran
sloc
atio
ns to
in
crea
se th
e sp
ecie
s' ex
tent
of o
ccur
renc
e ab
ove
20,0
00 k
m2 .
$0$0
$0$2
0,00
0$0
$0$0
$0$0
$0
YE
AR
LY
TO
TA
LS
$205
,000
$467
,850
$486
,136
$586
,284
$559
,235
$333
,977
$405
,341
$343
,708
$354
,019
$502
,069
GR
AN
D T
OT
AL
$4
,24
3,6
17
#Not
e th
at a
n in
dex
of 3
% h
as b
een
appl
ied
to e
ach
succ
essi
ve y
ear o
f fun
ding
to a
ccou
nt fo
r CP
I
*Inc
lude
s 5-
year
pro
gram
revi
ew
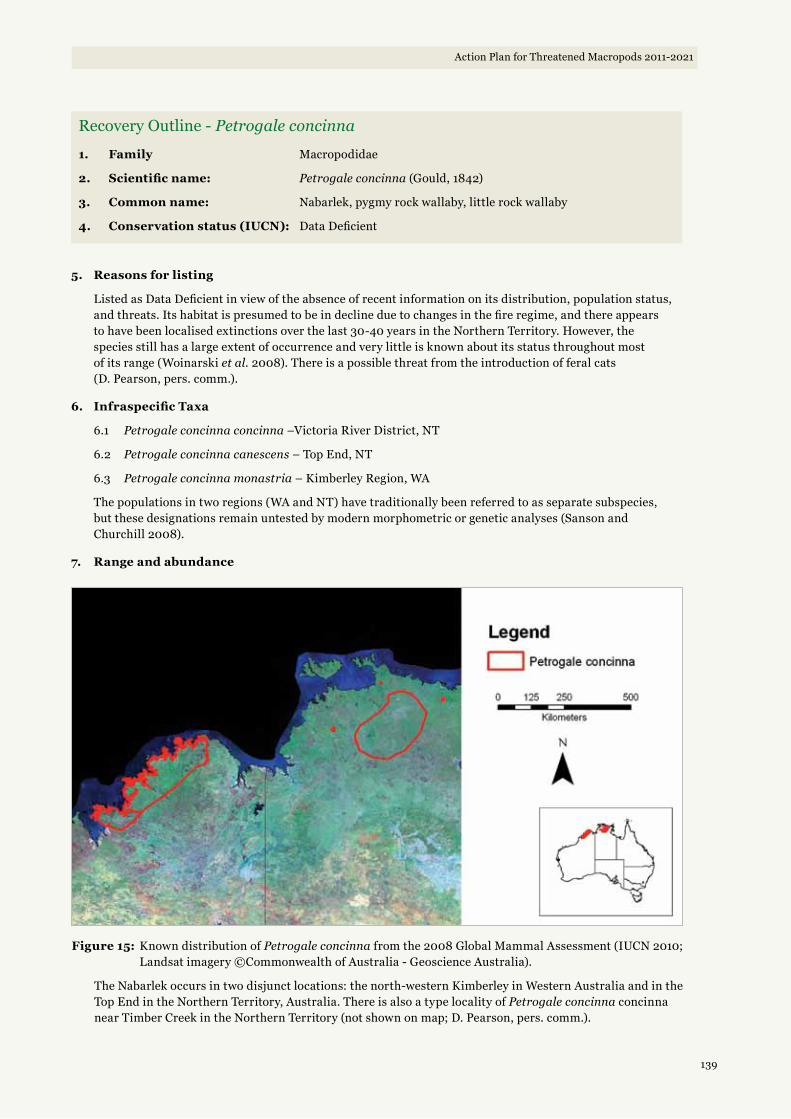
139
Action Plan for Threatened Macropods 2011-2021
Recovery Outline - Petrogale concinna
1. Family Macropodidae
2. Scientific name: Petrogale concinna (Gould, 1842)
3. Common name: Nabarlek, pygmy rock wallaby, little rock wallaby
4. Conservation status (IUCN): Data Deficient
5. Reasons for listing
Listed as Data Deficient in view of the absence of recent information on its distribution, population status, and threats. Its habitat is presumed to be in decline due to changes in the fire regime, and there appears to have been localised extinctions over the last 30-40 years in the Northern Territory. However, the species still has a large extent of occurrence and very little is known about its status throughout most of its range (Woinarski et al. 2008). There is a possible threat from the introduction of feral cats (D. Pearson, pers. comm.).
6. Infraspecific Taxa
6.1 Petrogale concinna concinna –Victoria River District, NT
6.2 Petrogale concinna canescens – Top End, NT
6.3 Petrogale concinna monastria – Kimberley Region, WA
The populations in two regions (WA and NT) have traditionally been referred to as separate subspecies, but these designations remain untested by modern morphometric or genetic analyses (Sanson and Churchill 2008).
7. Range and abundance
Figure 15: Known distribution of Petrogale concinna from the 2008 Global Mammal Assessment (IUCN 2010; Landsat imagery ©Commonwealth of Australia - Geoscience Australia).
The Nabarlek occurs in two disjunct locations: the north-western Kimberley in Western Australia and in the Top End in the Northern Territory, Australia. There is also a type locality of Petrogale concinna concinna near Timber Creek in the Northern Territory (not shown on map; D. Pearson, pers. comm.).

140
Action Plan for Threatened Macropods 2011-2021
The species is very patchily distributed, though it can be locally abundant. There seem to have been localised extinctions from the Northern Territory within the last 30-40 years. In Western Australia, the species is found on several offshore islands but is apparently very restricted, and on the mainland it occurs as scattered populations. There is no sound evidence of an overall population decline in Northern Territory over the last ten years (Woinarski et al. 2008). The presence of Nabarlek on Augustus, Borda, Hidden and Long islands was confirmed during the Kimberley Island survey (DEC 2008-2010) and rock-wallabies on Darcy Island are probably this species (D. Pearson, pers. comm.).
8. Habitat
Sandstone and granite hills and escarpments. It is known to spend its days in caves and crevices. Being mostly nocturnal the nights are spent foraging in a variety of habitats from monsoon rainforests and vine thickets to open woodland and hummock grass (Sanson & Churchill 2008).
9. Threats
9.1 Largely unknown.
9.2 Habitat change as a result of altered fire.
9.3 Introduced cats probably prey on nabarleks, but it is unknown whether or not this constitutes a major threat. All four offshore islands and Darcy island do not have cats.
10. Information required
10.1 Surveys are needed for a more accurate picture of its distribution and population status.
10.2 Examine ecology at one or more populations.
10.3 Undertake surveys of sites where localised declines or extinctions are thought to have occurred (e.g. western Top End, upper Mary and upper Daly Rivers, Ord and Victoria River districts).
11. Recovery objectives
11.1 By 2021, Petrogale concinna is eligible for listing as Least Concern according to IUCN Red List criteria.
11.2 By 2021, research, surveys and monitoring confirm the population trend of Petrogale concinna as stable.
11.3 By 2021, research has investigated the impacts of changing fire regimes and cattle grazing on Petrogale concinna, and where those regimes present a threat to Petrogale concinna subpopulations, management plans have been developed and are being implemented to mitigate those threats.
11.4 By 2021, the genetic diversity of Petrogale concinna has been maintained at known 2011 levels.
12. Actions completed or underway
12.1 Surveys failed to relocate populations in the Litchfield National Park area and in parts of the upper Mary River (Sanson et al. 1985).
13. Management actions required
13.1 Status assessment of the species, including genetics, abundance, distribution, trend and risks. Includes surveys.
13.2 Manage data to inform adaptive management.
13.3 Implement monitoring protocols, including fire management, grazing, habitat condition, predation and predator activity, and species activity.
13.4 Assess threat of feral cats to juvenile rock wallabies and conduct cat control where necessary.
13.5 Research preferred fire regimes for P. concinna and its habitat, and undertake fire management where necessary.
13.6 Assess the need to augment the known number of subpopulations through translocation.
13.7 Research species biology, ecology and conservation requirements.
14. Organisations responsible for conservation of species
14.1 Department of Environment and Conservation (DEC), Western Australia.
14.2 Department of Natural Resources, Environment, The Arts and Sport (NRETAS), Northern Territory.
15. Other organisations involved
15.1 None.

141
Action Plan for Threatened Macropods 2011-2021
16. Staff and other resources required for recovery to be carried out
16.1 None.
17. Action costs
17.1 Total cost over 10 years exceeds A$3.8 million.
18. Notes
18.1 None.
19. References
IUCN (2010) IUCN Red List of Threatened Species. Version 2010.3. http://www.iucnredlist.org. Accessed 28 September 2010.
Sanson, GD and Churchill, SK (2008) Nabarlek, Petrogale concinna. In The Mammals of Australia (Eds. Van Dyck, S & Strahan, R).
Sanson GD, Nelson JE, and Fell P (1985) Ecology of Peradorcas concinna in Arnhem Land in the wet and dry season. Proceedings of the Ecological Society of Australia 13, 69-72.
Woinarski, J., Burbidge, A., Telfer, W., McKenzie, N. & Start, T. 2008. Petrogale concinna. In: IUCN 2010. IUCN Red List of Threatened Species. Version 2010.3. http://www.iucnredlist.org/ apps/redlist/details/16761/0. Accessed 28 September 2010.
20. Comments received
20.1 David Pearson, WA DEC.
Table 35: List of recovery actions Petrogale concinna, and the rationale for their contribution to recovery, and effort required.
Subpopulation Action Rationale Frequency Duration Effort
AllStatus assessment of the species - distribution and abundance There is very little known about this
species. Information is required to assess the distribution and abundance of the species, which subpopulations are most at risk from a range of threats, and to ensure that genetic stock is maintained. The disjunct subpopulations may be two or more distinct subspecies, and this needs to be clarified.
3-Yearly 3 Months 5 People
AllStatus assessment of the species - genetics
5-Yearly 2 Months 3 People
All
Status assessment of the species - identify important subpopulations, and those subject to specific threats including grazing, fire and cats
5-Yearly 2 Weeks 1 Person
AllManage data to inform adaptive management
Good data management is essential to making it possible to extract the maximum amount of information from monitoring data.
6-Monthly 1 Week 1 Person
Priority subpopulations (as identified in status assessment)
Develop management plans for those subpopulations subject to threats of cattle grazing, altered fire regimes and feral cat predation
Once the nature of threats to the species is better known, management plans will be required to address them.
Once 3 Months 1 Person
Priority subpopulations (as identified in status assessment)
Implement management actions to reduce the threat of cattle grazing
Cattle grazing may impact on the habitat condition of the species.
6-Monthly 2 Weeks 4 People
Priority subpopulations (as identified in status assessment)
Implement management actions to reduce the threat of fire
Changes to vegetation composition and structure as a result of altered fire regimes are thought to be the greatest threat facing Nabarleks.
Yearly 1 Month 10 People

142
Action Plan for Threatened Macropods 2011-2021
Subpopulation Action Rationale Frequency Duration Effort
Priority subpopulations (as identified in status assessment)
Implement management actions to reduce the threat of cat predation
Nabarleks occur north of the range of the introduced red fox but feral cats are probably a predator, given their ability to catch the larger allied rock wallaby (Petrogale assimilis). Feral cats are likely to be a significant conservation threat for smaller rock-wallabies such as the monjon and nabarlek, which are even smaller than P. assimilis, however there are currently no data to indicate the level of threat. All four offshore islands do not have cats.
6-Monthly 1 Month 5 People
All
Conduct research into species biology, ecology and conservation requirements
Very little is known about this species, and urgent research is required to inform adaptive conservation measures.
Once Unknown 2 People
All
Implement monitoring protocols for species activity, predator activity, and effectiveness of management intervention. Monitoring is essential to ensure
adaptive management and achieving the species objectives.
6-Monthly 2 Weeks 4 People
All
Implement monitoring protocols for fire and grazing management and habitat condition, and effectiveness of management intervention.
Yearly 1 Month 5 People
All
Investigate need to undertake translocations to increase the number of extant subpopulations
Once surveys provide a clearer understanding of the species' status, it may be necessary to establish new subpopulations to ensure it does not meet the criteria to be listed as threatened on the IUCN Red List.
Once 3 Months 1 Person

143
Action Plan for Threatened Macropods 2011-2021
Tab
le 3
6: L
ist o
f rec
over
y ac
tion
s fo
r Pe
trog
ale
conc
inna
, and
the
ir c
osts
Su
bp
op
ula
tio
nA
ctio
nY
ear
1#Y
ear
2Y
ear
3Y
ear
4Y
ear
5Y
ear
6Y
ear
7Y
ear
8Y
ear
9Y
ear
10
All
Stat
us a
sses
smen
t of t
he s
peci
es -
dist
ribu
tion
and
ab
unda
nce
$120
,000
$0$0
$65,
564
$0$0
$71,
644
$0$0
$78,
287
All
Stat
us a
sses
smen
t of t
he s
peci
es -
gene
tics
$30,
000
$0$0
$0$3
3,76
5$0
$0$0
$0$3
9,14
3
All
Stat
us a
sses
smen
t of t
he s
peci
es -
iden
tify
im
port
ant s
ubpo
pula
tion
s, a
nd th
ose
subj
ect t
o sp
ecifi
c th
reat
s in
clud
ing
graz
ing,
fire
and
cat
s$2
0,00
0$0
$0$0
$22,
510
$0$0
$0$0
$0
All
Man
age
data
to in
form
ada
ptiv
e m
anag
emen
t$5
,000
$5,1
50$5
,305
$5,4
64$2
5,62
8*$5
,796
$5,9
70$6
,149
$6,3
33$2
6,52
3*
Prio
rity
sub
popu
lati
ons
(as
iden
tifie
d in
sta
tus
asse
ssm
ent)
Dev
elop
man
agem
ent p
lans
for t
hose
su
bpop
ulat
ions
sub
ject
to th
reat
s of
cat
tle
graz
ing,
al
tere
d fir
e re
gim
es a
nd fe
ral c
at p
reda
tion
$0$2
5,00
0$0
$0$0
$10,
000
$0$0
$0$0
Prio
rity
sub
popu
lati
ons
(as
iden
tifie
d in
sta
tus
asse
ssm
ent)
Impl
emen
t man
agem
ent a
ctio
ns to
red
uce
the
thre
at o
f cat
tle
graz
ing
$0$5
0,00
0$5
1,50
0$5
3,04
5$5
4,63
6$5
6,27
5$5
7,96
4$5
9,70
3$6
1,49
4$6
3,33
9
Prio
rity
sub
popu
lati
ons
(as
iden
tifie
d in
sta
tus
asse
ssm
ent)
Impl
emen
t man
agem
ent a
ctio
ns to
red
uce
the
thre
at o
f fire
$0$1
00,0
00$1
03,0
00$1
06,0
90$1
09,2
73$1
12,5
51$1
15,9
27$1
19,4
05$1
22,9
87$1
26,6
77
Prio
rity
sub
popu
lati
ons
(as
iden
tifie
d in
sta
tus
asse
ssm
ent)
Impl
emen
t man
agem
ent a
ctio
ns to
red
uce
the
thre
at o
f cat
pre
dati
on$0
$60,
000
$61,
800
$63,
654
$65,
564
$67,
531
$69,
556
$71,
643
$73,
792
$76,
006
All
Con
duct
res
earc
h in
to s
peci
es b
iolo
gy, e
colo
gy a
nd
cons
erva
tion
req
uire
men
ts$0
$0$3
0,00
0$3
0,90
0$3
1,82
7$0
$0$0
$0$0
All
Impl
emen
t mon
itori
ng p
roto
cols
for s
peci
es
acti
vity
, pre
dato
r act
ivit
y, a
nd e
ffec
tive
ness
of
man
agem
ent i
nter
vent
ion.
$60,
000
$61,
800
$63,
654
$65,
564
$67,
531
$69,
556
$71,
643
$73,
792
$76,
006
$78,
286
All
Impl
emen
t mon
itori
ng p
roto
cols
for fi
re a
nd
graz
ing
man
agem
ent a
nd h
abit
at c
ondi
tion
, and
ef
fect
iven
ess
of m
anag
emen
t int
erve
ntio
n.$3
0,00
0$3
0,90
0$3
1,82
7$3
2,78
2$3
3,76
5$3
4,77
8$3
5,82
2$3
6,89
6$3
8,00
3$3
9,14
3
All
Inve
stig
ate
need
to u
nder
take
tran
sloc
atio
ns to
in
crea
se th
e nu
mbe
r of e
xtan
t sub
popu
lati
ons
$0$0
$0$2
0,00
0$0
$0$0
$0$0
$0
YE
AR
LY
TO
TA
LS
$265
,000
$332
,850
$347
,086
$443
,062
$444
,498
$356
,488
$428
,526
$367
,589
$378
,616
$527
,404
GR
AN
D T
OT
AL
$3,8
91,1
19
#Not
e th
at a
n in
dex
of 3
% h
as b
een
appl
ied
to e
ach
succ
essi
ve y
ear o
f fun
ding
to a
ccou
nt fo
r CP
I
*Inc
lude
s 5-
year
pro
gram
revi
ew

144
Action Plan for Threatened Macropods 2011-2021
Recovery Outline - Petrogale lateralis
1. Family Macropodidae
2. Scientific name: Petrogale lateralis (Gould, 1842)
3. Common name: Black-footed rock wallaby, black-flanked rock wallaby, Warru, Recherche rock wallaby, Pearson Island rock wallaby
4. Conservation status (IUCN): Near Threatened
5. Reasons for listing
Listed as Near Threatened because, although it has a large extent of occurrence, its distribution is very patchy, few (if any) populations are considered secure, the total population is not much greater than 10,000 mature individuals, and it is probably decreasing overall, thus making the species close to qualifying for Vulnerable under criterion C (Burbidge et al. 2008). Many documented extinctions of localised subpopulations (D. Pearson, pers. comm.).
6. Infraspecific Taxa
6.1 Petrogale lateralis hacketti - Recherche Rock-wallaby, Vulnerable under EPBC Act 1999 (DEWHA 2010).
6.2 Petrogale lateralis lateralis - Black-flanked Rock-wallaby, Vulnerable under EPBC Act 1999 (DEWHA 2010).
6.3 Petrogale lateralis pearsoni - Pearson Island Rock-wallaby. Not Listed under EPBC Act 1999 (DEWHA 2010).
6.4 Petrogale lateralis (MacDonnell Ranges race) - Warru, Black-footed Rock-wallaby (MacDonnell Ranges race), Vulnerable under EPBC Act 1999 (DEWHA 2010).
6.5 Petrogale lateralis (West Kimberley race) - Black-footed Rock-wallaby (West Kimberley race), Vulnerable under EPBC Act 1999 (DEWHA 2010).
7. Range and abundance
The Black-footed Rock-wallaby is a widespread and diverse species, found from temperate rocky islands in the Southern Ocean to spinifex-clad rocky hills in the central deserts and pandanus-lined sandstone gorges in the tropical north-west of Australia (Eldridge and Pearson 2008).
The global population is probably over 10,000 mature individuals. Historically, the MacDonnell race of Black-footed rock wallaby began a steep decline sometime after the 1930s such that by the 1960s it was rare in central Australia (Finlayson 1961) This decline continues today, mainly in the smaller, isolated populations (Eldridge and Pearson 2008). Populations in 21 of 400 sites have disappeared in last 30 years (Gibson 2000), and there are fewer than 100 individuals in South Australia (10 in the north-western population and about 70 in the population further east). The MacDonnell Ranges race, however, remains widespread and common in the Northern Territory, due to a variety of factors, including: widespread, contiguous and variable habitat; an absence of rabbits and foxes, as they are found farther south; an inability of goats to persist; and 1080 baiting programs for dingoes. Likewise the West Kimberley race is described as “conspicuously abundant at several sites” because it is at the northern edge of fox distribution and does not suffer much predation (Eldridge and Pearson 2008).
The remaining subspecies of Black-footed rock wallaby have not fared so well or are very limited in distribution. The Black-footed rock wallaby in south-western Western Australia have declined massively during the 20th century, and many local populations have gone extinct (Pearson and Kinnear 1997; Eldridge and Pearson 2008). Barrow Island may hold about 100 individuals, though recent work suggests this population is much smaller (A. Burbidge pers. comm.). Both P. l. hacketti and P. l. pearsoni are common within their tiny ranges. Estimates for P. l. pearsoni include approximately 500 individuals on Thistle Island and 200 on Wedge Island (both are introduced populations).

145
Action Plan for Threatened Macropods 2011-2021
Figure 16: Known distribution of Petrogale lateralis from the 2008 Global Mammal Assessment (IUCN 2010; Landsat imagery ©Commonwealth of Australia - Geoscience Australia).
8. Habitat
This species is found in a variety of steep and rocky habitats. The vegetation in these areas varies widely from temperate rocky islands to pandanus lined gorges and spinifex covered hills in the central deserts (Eldridge and Pearson 2008).
9. Threats
9.1 Predation from introduced foxes and feral cats.
9.2 Competition with domestic and introduced herbivores (primarily sheep and rabbits, and potentially euros).
9.3 Loss of habitat due to changes in the fire regimes and the spread of introduced grasses.
9.4 Disease.
The various subspecies of Black-footed rock wallaby face various threats.
10. Information required
10.1 Some of the island populations should be sampled genetically – not all have been sampled and the subpopulation on Barrow island is suspected to be inbreeding with a speculated decrease in reproductive rate (D. Pearson, pers. comm.).
10.2 Conduct research to improve knowledge of diseases and parasites affecting P. lateralis.
10.3 Conduct research into the predation impact of feral cats on P. lateralis.
11. Recovery objectives
11.1 By 2021, Petrogale lateralis is eligible for listing as Least Concern according to IUCN Red List criteria.
11.2 By 2021, the number of distinct secure subpopulations of Petrogale lateralis is greater than 10, and the population is estimated to number greater than 10,000 mature individuals, thus making it ineligible to qualify as Vulnerable under IUCN criteria B or C.
11.3 By 2021, management plans have been developed and are being implemented to reduce the threats of low resource availability, introduced predators, fire and disease for priority Petrogale lateralis subpopulations.
11.4 By 2021, the genetic diversity of Petrogale lateralis has been maintained at known 2011 levels.

146
Action Plan for Threatened Macropods 2011-2021
12. Actions completed or underway
12.1 A number of reintroductions of have been carried out to date.
12.2 P. l. lateralis has been reintroduced to Avon Valley National Park (2001), Paruna Sanctuary (2001), Walyunga National Park (2002), and Cape Le Grand National Park (2003) (Davies et al. 2007).
12.3 Further reintroductions and translocations are planned.
12.4 Predator control in various locations.
13. Management actions required
13.1 Status assessment of the species, including genetics, abundance, distribution, trend and risks. Identify those subpopulations that will be the most efficient to manage, and that capture the full genetic diversity of the species for future conservation.
13.2 Manage data to inform adaptive management.
13.3 Refine and implement monitoring protocols, including species and predator activity, grazing pressure, predation, and resource availability.
13.4 Conduct strategic and targeted fox baiting on-ground, and increase baiting in response to an increase in predator sightings or predation incidents and during droughts.
13.5 Undertake aerial baiting in priority areas (as determined by status assessment), and those areas that are remote and difficult to access from the ground.
13.6 Conduct competitor control operations for goats and rabbits in and around rock wallaby habitat, and increase during droughts and prolonged dry periods.
13.7 Conduct competitor control operations for livestock and camels in and around rock wallaby habitat, and increase during droughts and prolonged dry periods.
13.8 Exclude feral predators and competitors from islands inhabited by rock wallabies.
13.9 Manage development where it impacts rock wallaby habitat.
13.10 Develop and implement fire management plans for rock wallaby habitat.
13.11 Control invasive weeds in and around rock wallaby habitat.
13.12 Engage local landholders and traditional owners in management of P. lateralis habitat on private and traditional lands.
13.13 Review translocation of black-footed rock wallabies, including feasibility of future operations.
13.14 Translocate individuals or subpopulations to viable secure habitat if overpopulation occurs, or if habitat is unmanageable.
13.15 Use captive breeding and cross-fostering to conserve genetic diversity.
13.16 Those subpopulations not high priority or at key monitoring sites are to be left in situ, and undergo minimum monitoring at least every five years.
14. Organisations responsible for conservation of species
14.1 Department of Environment and Conservation (DEC) Western Australia.
14.2 Department of Natural Resources, Environment, the Arts and Sport (NRETAS), Northern Territory.
14.3 Department of Environment and Heritage (DEH), South Australia.
15. Other organisations involved
15.1 None.
16. Staff and other resources required for recovery to be carried out
16.1 No dedicated staff required.
17. Action costs
17.1 Total cost over 10 years exceeds A$27 million.
18. Notes
18.1 None.
19. References
Burbidge, A, Woinarski, J, Reed, J, van Weenen, J, Moseby, KE & Morris, K (2008) Petrogale lateralis. In: IUCN (2010) IUCN Red List of Threatened Species. Version 2010.2. http://www.iucnredlist.org/apps/redlist/details/16751/0. Accessed 19 October 2010.
Davies, M, Newsome, D, Moncrieff, D and Smith, A (2007) Conserving the Black-flanked rock wallaby (Petrogale lateralis lateralis) through tourism: Development of a habitat ranking system for translocated animals and the need

147
Action Plan for Threatened Macropods 2011-2021
for on-going management. Conservation Science Western Australia 6: 1-12.
Department of the Environment, Water, Heritage and the Arts (2010) Petrogale lateralis. In: Species Profile and Threats (SPRAT) Database. Department of the Environment, Water, Heritage and the Arts, Canberra. http://www.environment.gov.au/sprat. Accessed 27 October 2010.
Department of Environment and Conservation Western Australia (2009) Black-Flanked Rock-Wallaby (Petrogale lateralis lateralis) DRAFT Conservation Plan for the Central Wheatbelt Populations, 2009-2014.
Eldridge, MDB and Pearson, DJ (2008) Black-footed rock wallaby, Petrogale lateralis. In The Mammals of Australia (Eds. Van Dyck, S & Strahan, R).
Finlayson, HH, (1961) On central Australian mammals. IV: The distribution and status of central
Australian species. Records of the South Australian Museum 14: 141-191.
Gibson, DF (2000) Distribution and conservation status of the black-footed rock-wallaby, Petrogale lateralis (MacDonnell Ranges race), in the Northern Territory. Australian Mammalogy 21: 213-236.
IUCN (2010) IUCN Red List of Threatened Species. Version 2010.3. http://www.iucnredlist.org. Accessed 19 October 2010.
Pearson, DJ and Kinnear, JE (1997) A review of the distribution, status and conservation of rock wallabies in Western Australia. Australian Mammalogy 19:137-152.
20. Comments received
20.1 David Pearson, DEC WA.
Table 37: List of recovery actions Petrogale lateralis, and the rationale for their contribution to recovery, and effort required.
Subpopulation Action Rationale Frequency Duration Effort
NT priority subpopulations Status assessment of the species - distribution and abundance, including ground survey and population monitoring
While some subpopulations are well-studied, there are many for which very little information exists. Surveys, including genetics, will be essential to an understanding of exactly which are the priority subpopulations that require management to achieve down-listing on the IUCN Red List.
3-Yearly 3 Months 5 People
SA priority subpopulations 3-Yearly 2 Weeks 5 People
WA priority subpopulations 3-Yearly 2 Weeks 5 People
NT priority subpopulationsStatus assessment of the species - genetics
5-Yearly 2 Months 3 People
SA priority subpopulations 5-Yearly 2 Weeks 3 People
WA priority subpopulations 5-Yearly 2 Weeks 3 People
NT priority subpopulationsStatus assessment of the species - identify important subpopulations representing full genetic diversity of species for concerted management actions
5-Yearly 1 Month 2 People
SA priority subpopulations 5-Yearly 1 Day 1 Person
WA priority subpopulations 5-Yearly 1 Day 1 Person
NT priority subpopulations Manage data to inform adaptive management. Includes 5 year program review.
Good data management is essential to making it possible to extract the maximum amount of information from monitoring data.
3-Monthly 1 Week 1 Person
SA priority subpopulations 3-Monthly 1 Day 1 Person
WA priority subpopulations 3-Monthly 1 Day 1 Person
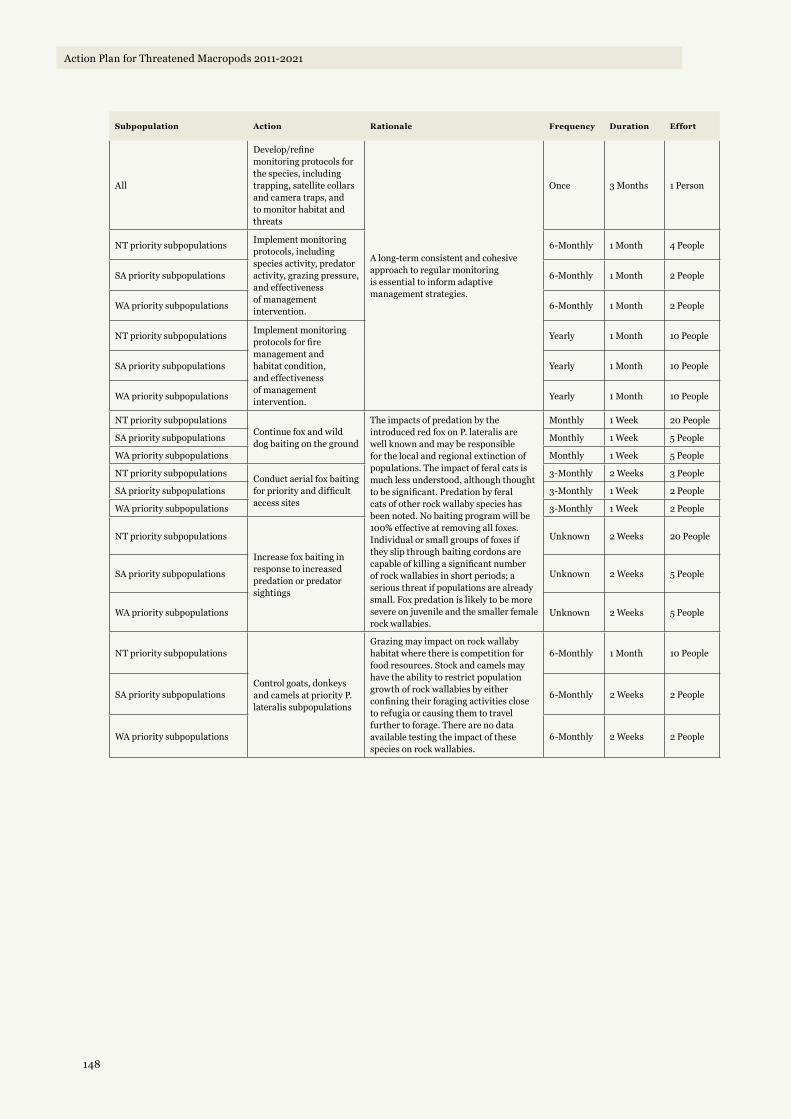
148
Action Plan for Threatened Macropods 2011-2021
Subpopulation Action Rationale Frequency Duration Effort
All
Develop/refine monitoring protocols for the species, including trapping, satellite collars and camera traps, and to monitor habitat and threats
A long-term consistent and cohesive approach to regular monitoring is essential to inform adaptive management strategies.
Once 3 Months 1 Person
NT priority subpopulations Implement monitoring protocols, including species activity, predator activity, grazing pressure, and effectiveness of management intervention.
6-Monthly 1 Month 4 People
SA priority subpopulations 6-Monthly 1 Month 2 People
WA priority subpopulations 6-Monthly 1 Month 2 People
NT priority subpopulations Implement monitoring protocols for fire management and habitat condition, and effectiveness of management intervention.
Yearly 1 Month 10 People
SA priority subpopulations Yearly 1 Month 10 People
WA priority subpopulations Yearly 1 Month 10 People
NT priority subpopulationsContinue fox and wild dog baiting on the ground
The impacts of predation by the introduced red fox on P. lateralis are well known and may be responsible for the local and regional extinction of populations. The impact of feral cats is much less understood, although thought to be significant. Predation by feral cats of other rock wallaby species has been noted. No baiting program will be 100% effective at removing all foxes. Individual or small groups of foxes if they slip through baiting cordons are capable of killing a significant number of rock wallabies in short periods; a serious threat if populations are already small. Fox predation is likely to be more severe on juvenile and the smaller female rock wallabies.
Monthly 1 Week 20 People
SA priority subpopulations Monthly 1 Week 5 People
WA priority subpopulations Monthly 1 Week 5 People
NT priority subpopulations Conduct aerial fox baiting for priority and difficult access sites
3-Monthly 2 Weeks 3 People
SA priority subpopulations 3-Monthly 1 Week 2 People
WA priority subpopulations 3-Monthly 1 Week 2 People
NT priority subpopulations
Increase fox baiting in response to increased predation or predator sightings
Unknown 2 Weeks 20 People
SA priority subpopulations Unknown 2 Weeks 5 People
WA priority subpopulations Unknown 2 Weeks 5 People
NT priority subpopulations
Control goats, donkeys and camels at priority P. lateralis subpopulations
Grazing may impact on rock wallaby habitat where there is competition for food resources. Stock and camels may have the ability to restrict population growth of rock wallabies by either confining their foraging activities close to refugia or causing them to travel further to forage. There are no data available testing the impact of these species on rock wallabies.
6-Monthly 1 Month 10 People
SA priority subpopulations 6-Monthly 2 Weeks 2 People
WA priority subpopulations 6-Monthly 2 Weeks 2 People

149
Action Plan for Threatened Macropods 2011-2021
Subpopulation Action Rationale Frequency Duration Effort
NT priority subpopulations Control rabbits at priority P. lateralis subpopulations
Possible competition with vertebrate herbivores is known, with overlaps noted in the diets of P. lateralis, euros, feral goats and cattle. While these species may not exert a constant pressure on rock wallabies, droughts or dry summer months could result in strong resource competition. The more extensive foraging ranges of goats and euros and their superior reach to obtain browse may also favour these species over rock wallabies. The relative importance of rabbit grazing in limiting the carrying capacity of habitat for rock-wallabies is not known, but it may be considerable in some areas. High rabbit numbers support higher predator populations, particularly of foxes and feral cats. Some rabbit control around WA Wheatbelt outcrops may lead to increases in the potential carrying capacity for rock wallabies.
6-Monthly 2 Weeks 5 People
SA priority subpopulations 6-Monthly 1 Week 2 People
WA priority subpopulations 6-Monthly 1 Week 2 People
NT priority subpopulations
Control stock grazing at priority P. lateralis subpopulations
6-Monthly 2 Weeks 5 People
SA priority subpopulations 6-Monthly 1 Week 2 People
WA priority subpopulations 6-Monthly 1 Week 2 People
SA priority island subpopulations
Prevent unauthorised human visitation to islands to exclude invasive predators and competitors, and to prevent wildfires and disease incursion.
Island subpopulations not currently subject to predation may represent some of the most secure groups of the species. It is important to maintain this security.
3-Monthly 1 Week 2 People
WA priority island subpopulations
3-Monthly 1 Week 2 People
NT priority subpopulations Develop and implement fire management plans for priority P. lateralis habitat
Research into the most appropriate ways to manage fire around rock-wallaby colonies is required.
Yearly 1 Month 10 People
SA priority subpopulations Yearly 2 Weeks 5 People
WA priority subpopulations Yearly 2 Weeks 5 People
NT priority subpopulations
Control invasive weeds in and around P. lateralis habitat
Little is known about the ingression of weeds into rock-wallaby habitats and its long-term effect on rock-wallabies. Concern has been raised about the impact of the spread of buffel grass (Cenchrus ciliaris) into rock-wallaby habitat (P. lateralis MacDonnell Ranges race) in SA (and this is also occurring in the NT and WA).
Yearly 2 Weeks 5 People
SA priority subpopulations Yearly 2 Weeks 5 People
WA priority subpopulations Yearly 2 Weeks 5 People
All priority subpopulations
Develop contingency plans for catastrophic events including wildfires and drought
Where priority subpopulations could be wiped out by a natural event, contingency plans should be put in place to avoid such disasters.
Once 2 Weeks 1 Person
NT priority subpopulations Engage local landholders and traditional owners in management of P. lateralis habitat on private and traditional lands
Some rock wallaby colonies are on or adjacent to private or traditional lands. Community involvement is an important aspect of conservation both in and outside national parks and reserves.
Yearly 1 Year 2 People
SA priority subpopulations Yearly 1 Year 1 Person
WA priority subpopulations Yearly 1 Year 1 Person
All
Review translocation of P. lateralis, including feasibility of future operations
Translocations of wild animals rely on a suite of factors for their success. Full understanding of past translocation efforts, and their contribution to success or failure, is essential if future attempts are to be successful.
Once 1 Month 1 Person

150
Action Plan for Threatened Macropods 2011-2021
Subpopulation Action Rationale Frequency Duration Effort
NT priority subpopulationsTranslocate individuals or subpopulations to viable secure habitat if overpopulation occurs, for consolidation purposes, or if existing habitat is unmanageable.
The increased likelihood of inbreeding when rock wallaby populations are small may result in reduced variability, the expression of recessive genes or suppressed reproductive rates. Translocation of small subpopulations to larger colonies may be the most viable means of managing them. Furthermore, once threats are removed, rock wallaby numbers may exceed available resources, and translocation may be the most effective means of managing numbers.
3-Yearly 2 Weeks 5 People
SA priority subpopulations 3-Yearly 2 Weeks 5 People
WA priority subpopulations 3-Yearly 2 Weeks 5 People
SA subpopulations
Use captive breeding and cross-fostering to conserve genetic diversity.
Captive breeding and cross-fostering may be the most effective methods of ensuring genetic diversity is maintained for the species, especially where some subspecies are extremely limited in numbers.
Yearly 1 Year 2 People
All
Conduct research to improve knowledge of diseases and parasites affecting P. lateralis.
Little is known about the parasites and diseases of rock-wallabies. Fleas and lice are found on many wild caught P. lateralis.
Once 3 Years 1 Person
AllConduct research into the predation impact of feral cats on P. lateralis
The impact of feral cats is much less understood than foxes, although thought to be significant. Predation by feral cats of other rock wallaby species has been noted.
Once 3 Years 1 Person
Low priority subpopulations (x 20)
Minimal monitoring of those subpopulations that are not considered high priority for achieving the conservation objectives, and that are not consolidated through translocation.
There are many small subpopulations of P. lateralis that present management challenges, and that would not add significantly to the conservation objectives, from the perspective of abundance and/or genetic diversity. It would be extremely resource-intensive to manage these subpopulations, with little prospective return. Also there is the possibility that human intervention could inadvertently cause more harm in attempting to manage these subpopulations.
5-Yearly 2 Months 20 People

151
Action Plan for Threatened Macropods 2011-2021
Tab
le 3
8: L
ist o
f rec
over
y ac
tion
s fo
r Pe
trog
ale
late
ralis
, and
the
ir c
osts
Su
bp
op
ula
tio
nA
ctio
nY
ear
1#Y
ear
2Y
ear
3Y
ear
4Y
ear
5Y
ear
6Y
ear
7Y
ear
8Y
ear
9Y
ear
10
NT
prio
rity
sub
popu
lati
ons
Stat
us a
sses
smen
t of t
he s
peci
es -
dist
ribu
tion
an
d ab
unda
nce,
incl
udin
g gr
ound
sur
vey
and
popu
lati
on m
onito
ring
$100
,000
$0$0
$109
,273
$0$0
$119
,405
$0$0
$130
,477
SA p
rior
ity
subp
opul
atio
ns$6
0,00
0$0
$0$6
5,56
4$0
$0$7
1,64
3$0
$0$7
8,28
6
WA
pri
orit
y su
bpop
ulat
ions
$80,
000
$0$0
$87,
418
$0$0
$95,
524
$0$0
$104
,382
NT
prio
rity
sub
popu
lati
ons
Stat
us a
sses
smen
t of t
he s
peci
es -
gene
tics
$60,
000
$0$0
$0$6
7,53
1$0
$0$0
$0$7
8,28
7
SA p
rior
ity
subp
opul
atio
ns$4
0,00
0$0
$0$0
$45,
020
$0$0
$0$0
$52,
191
WA
pri
orit
y su
bpop
ulat
ions
$50,
000
$0$0
$0$5
6,27
5$0
$0$0
$0$6
5,23
8
NT
prio
rity
sub
popu
lati
ons
Stat
us a
sses
smen
t of t
he s
peci
es -
iden
tify
im
port
ant s
ubpo
pula
tion
s re
pres
enti
ng fu
ll ge
neti
c di
vers
ity
of s
peci
es fo
r con
cert
ed
man
agem
ent a
ctio
ns
$5,0
00$0
$0$0
$5,6
28$0
$0$0
$0$6
,524
SA p
rior
ity
subp
opul
atio
ns$5
,000
$0$0
$0$5
,628
$0$0
$0$0
$6,5
24
WA
pri
orit
y su
bpop
ulat
ions
$5,0
00$0
$0$0
$5,6
28$0
$0$0
$0$6
,524
NT
prio
rity
sub
popu
lati
ons
Man
age
data
to in
form
ada
ptiv
e m
anag
emen
t. In
clud
es 5
yea
r pro
gram
rev
iew
.
$5,0
00$5
,150
$5,3
05$5
,464
$25,
628*
$5,7
96$5
,970
$6,1
49$6
,333
$26,
523*
SA p
rior
ity
subp
opul
atio
ns$5
,000
$5,1
50$5
,305
$5,4
64$2
5,62
8*$5
,796
$5,9
70$6
,149
$6,3
33$2
6,52
3*
WA
pri
orit
y su
bpop
ulat
ions
$5,0
00$5
,150
$5,3
05$5
,464
$25,
628*
$5,7
96$5
,970
$6,1
49$6
,333
$26,
523*
All
Dev
elop
/refi
ne m
onito
ring
pro
toco
ls fo
r the
sp
ecie
s, in
clud
ing
trap
ping
, sat
ellit
e co
llars
and
ca
mer
a tr
aps,
and
to m
onito
r hab
itat
and
thre
ats
$30,
000
$20,
000
$0$0
$0$1
0,00
0$0
$0$0
$0
NT
prio
rity
sub
popu
lati
ons
Impl
emen
t mon
itori
ng p
roto
cols
, inc
ludi
ng
spec
ies
acti
vity
, pre
dato
r act
ivit
y, g
razi
ng
pres
sure
, and
eff
ecti
vene
ss o
f man
agem
ent
inte
rven
tion
.
$100
,000
$103
,000
$106
,090
$109
,273
$112
,551
$115
,927
$119
,405
$122
,987
$126
,677
$130
,477
SA p
rior
ity
subp
opul
atio
ns$6
0,00
0$6
1,80
0$6
3,65
4$6
5,56
4$6
7,53
1$6
9,55
6$7
1,64
3$7
3,79
2$7
6,00
6$7
8,28
6
WA
pri
orit
y su
bpop
ulat
ions
$75,
000
$77,
250
$79,
568
$81,
955
$84,
413
$86,
946
$89,
554
$92,
241
$95,
008
$97,
858
NT
prio
rity
sub
popu
lati
ons
Impl
emen
t mon
itori
ng p
roto
cols
for fi
re
man
agem
ent a
nd h
abit
at c
ondi
tion
, and
ef
fect
iven
ess
of m
anag
emen
t int
erve
ntio
n.
$50,
000
$51,
500
$53,
045
$54,
636
$56,
275
$57,
964
$59,
703
$61,
494
$63,
339
$65,
239
SA p
rior
ity
subp
opul
atio
ns$3
0,00
0$3
0,90
0$3
1,82
7$3
2,78
2$3
3,76
5$3
4,77
8$3
5,82
2$3
6,89
6$3
8,00
3$3
9,14
3
WA
pri
orit
y su
bpop
ulat
ions
$40,
000
$41,
200
$42,
436
$43,
709
$45,
020
$46,
371
$47,
762
$49,
195
$50,
671
$52,
191
NT
prio
rity
sub
popu
lati
ons
Con
tinu
e fo
x an
d w
ild d
og b
aiti
ng o
n th
e gr
ound
$400
,000
$412
,000
$424
,360
$437
,091
$450
,204
$463
,710
$477
,621
$491
,950
$506
,708
$521
,909
SA p
rior
ity
subp
opul
atio
ns$1
00,0
00$1
03,0
00$1
06,0
90$1
09,2
73$1
12,5
51$1
15,9
27$1
19,4
05$1
22,9
87$1
26,6
77$1
30,4
77
WA
pri
orit
y su
bpop
ulat
ions
$100
,000
$103
,000
$106
,090
$109
,273
$112
,551
$115
,927
$119
,405
$122
,987
$126
,677
$130
,477

152
Action Plan for Threatened Macropods 2011-2021
Su
bp
op
ula
tio
nA
ctio
nY
ear
1#Y
ear
2Y
ear
3Y
ear
4Y
ear
5Y
ear
6Y
ear
7Y
ear
8Y
ear
9Y
ear
10
NT
prio
rity
sub
popu
lati
ons
Con
duct
aer
ial f
ox b
aiti
ng fo
r pri
orit
y an
d di
fficu
lt ac
cess
site
s
$100
,000
$103
,000
$106
,090
$109
,273
$112
,551
$115
,927
$119
,405
$122
,987
$126
,677
$130
,477
SA p
rior
ity
subp
opul
atio
ns$1
00,0
00$1
03,0
00$1
06,0
90$1
09,2
73$1
12,5
51$1
15,9
27$1
19,4
05$1
22,9
87$1
26,6
77$1
30,4
77
WA
pri
orit
y su
bpop
ulat
ions
$100
,000
$103
,000
$106
,090
$109
,273
$112
,551
$115
,927
$119
,405
$122
,987
$126
,677
$130
,477
NT
prio
rity
sub
popu
lati
ons
Incr
ease
fox
bait
ing
in r
espo
nse
to in
crea
sed
pred
atio
n or
pre
dato
r sig
htin
gs
$0$5
0,00
0$0
$0$5
4,63
6$0
$0$5
9,70
2$0
$0
SA p
rior
ity
subp
opul
atio
ns$0
$50,
000
$0$0
$54,
636
$0$0
$59,
702
$0$0
WA
pri
orit
y su
bpop
ulat
ions
$0$5
0,00
0$0
$0$5
4,63
6$0
$0$5
9,70
2$0
$0
NT
prio
rity
sub
popu
lati
ons
Con
trol
goa
ts, d
onke
ys a
nd c
amel
s at
pri
orit
y P.
la
tera
lis s
ubpo
pula
tion
s
$80,
000
$82,
400
$84,
872
$87,
418
$90,
041
$92,
742
$95,
524
$98,
390
$101
,342
$104
,382
SA p
rior
ity
subp
opul
atio
ns$6
0,00
0$6
1,80
0$6
3,65
4$6
5,56
4$6
7,53
1$6
9,55
6$7
1,64
3$7
3,79
2$7
6,00
6$7
8,28
6
WA
pri
orit
y su
bpop
ulat
ions
$30,
000
$30,
900
$31,
827
$32,
782
$33,
765
$34,
778
$35,
822
$36,
896
$38,
003
$39,
143
NT
prio
rity
sub
popu
lati
ons
Con
trol
rab
bits
at p
rior
ity
P. la
tera
lis
subp
opul
atio
ns
$30,
000
$30,
900
$31,
827
$32,
782
$33,
765
$34,
778
$35,
822
$36,
896
$38,
003
$39,
143
SA p
rior
ity
subp
opul
atio
ns$1
0,00
0$1
0,30
0$1
0,60
9$1
0,92
7$1
1,25
5$1
1,59
3$1
1,94
1$1
2,29
9$1
2,66
8$1
3,04
8
WA
pri
orit
y su
bpop
ulat
ions
$10,
000
$10,
300
$10,
609
$10,
927
$11,
255
$11,
593
$11,
941
$12,
299
$12,
668
$13,
048
NT
prio
rity
sub
popu
lati
ons
Con
trol
sto
ck g
razi
ng a
t pri
orit
y P.
late
ralis
su
bpop
ulat
ions
$20,
000
$20,
600
$21,
218
$21,
855
$22,
510
$23,
185
$23,
881
$24,
597
$25,
335
$26,
095
SA p
rior
ity
subp
opul
atio
ns$1
0,00
0$1
0,30
0$1
0,60
9$1
0,92
7$1
1,25
5$1
1,59
3$1
1,94
1$1
2,29
9$1
2,66
8$1
3,04
8
WA
pri
orit
y su
bpop
ulat
ions
$10,
000
$10,
300
$10,
609
$10,
927
$11,
255
$11,
593
$11,
941
$12,
299
$12,
668
$13,
048
SA p
rior
ity
isla
nd
subp
opul
atio
nsPr
even
t una
utho
rise
d hu
man
vis
itat
ion
to is
land
s to
exc
lude
inva
sive
pre
dato
rs a
nd c
ompe
tito
rs, a
nd
to p
reve
nt w
ildfir
es a
nd d
isea
se in
curs
ion.
$40,
000
$41,
200
$42,
436
$43,
709
$45,
020
$46,
371
$47,
762
$49,
195
$50,
671
$52,
191
WA
pri
orit
y is
land
su
bpop
ulat
ions
$30,
000
$30,
900
$31,
827
$32,
782
$33,
765
$34,
778
$35,
822
$36,
896
$38,
003
$39,
143
NT
prio
rity
sub
popu
lati
ons
Dev
elop
and
impl
emen
t fire
man
agem
ent p
lans
for
prio
rity
P. l
ater
alis
hab
itat
$20,
000
$20,
600
$21,
218
$21,
855
$22,
510
$23,
185
$23,
881
$24,
597
$25,
335
$26,
095
SA p
rior
ity
subp
opul
atio
ns$2
0,00
0$2
0,60
0$2
1,21
8$2
1,85
5$2
2,51
0$2
3,18
5$2
3,88
1$2
4,59
7$2
5,33
5$2
6,09
5
WA
pri
orit
y su
bpop
ulat
ions
$20,
000
$20,
600
$21,
218
$21,
855
$22,
510
$23,
185
$23,
881
$24,
597
$25,
335
$26,
095
NT
prio
rity
sub
popu
lati
ons
Con
trol
inva
sive
wee
ds in
and
aro
und
P. la
tera
lis
habi
tat
$50,
000
$51,
500
$53,
045
$54,
636
$56,
275
$57,
964
$59,
703
$61,
494
$63,
339
$65,
239
SA p
rior
ity
subp
opul
atio
ns$5
0,00
0$5
1,50
0$5
3,04
5$5
4,63
6$5
6,27
5$5
7,96
4$5
9,70
3$6
1,49
4$6
3,33
9$6
5,23
9
WA
pri
orit
y su
bpop
ulat
ions
$50,
000
$51,
500
$53,
045
$54,
636
$56,
275
$57,
964
$59,
703
$61,
494
$63,
339
$65,
239
All
prio
rity
sub
popu
lati
ons
Dev
elop
con
ting
ency
pla
ns fo
r cat
astr
ophi
c ev
ents
in
clud
ing
wild
fires
and
dro
ught
$5,0
00$0
$0$0
$5,6
28$0
$0$0
$0$0
Prio
rity
sub
popu
lati
ons
subj
ect t
o de
velo
pmen
t pr
essu
res
Dev
elop
and
impl
emen
t man
agem
ent a
ctio
ns
to m
itig
ate
impa
cts
of in
dust
rial
and
min
ing
deve
lopm
ent
$5,0
00$0
$0$0
$0$0
$0$0
$0$0

153
Action Plan for Threatened Macropods 2011-2021
Su
bp
op
ula
tio
nA
ctio
nY
ear
1#Y
ear
2Y
ear
3Y
ear
4Y
ear
5Y
ear
6Y
ear
7Y
ear
8Y
ear
9Y
ear
10
NT
prio
rity
sub
popu
lati
ons
Eng
age
loca
l lan
dhol
ders
and
trad
itio
nal o
wne
rs
in m
anag
emen
t of P
. lat
eral
is h
abit
at o
n pr
ivat
e an
d tr
adit
iona
l lan
ds
$60,
000
$61,
800
$63,
654
$65,
564
$67,
531
$69,
556
$71,
643
$73,
792
$76,
006
$78,
286
SA p
rior
ity
subp
opul
atio
ns$6
0,00
0$6
1,80
0$6
3,65
4$6
5,56
4$6
7,53
1$6
9,55
6$7
1,64
3$7
3,79
2$7
6,00
6$7
8,28
6
WA
pri
orit
y su
bpop
ulat
ions
$60,
000
$61,
800
$63,
654
$65,
564
$67,
531
$69,
556
$71,
643
$73,
792
$76,
006
$78,
286
All
Rev
iew
tran
sloc
atio
n of
P. l
ater
alis
, inc
ludi
ng
feas
ibili
ty o
f fut
ure
oper
atio
ns$5
,000
$0$0
$0$5
,628
$0$0
$0$0
$0
NT
prio
rity
sub
popu
lati
ons
Tran
sloc
ate
indi
vidu
als
or s
ubpo
pula
tion
s to
vi
able
sec
ure
habi
tat i
f ove
rpop
ulat
ion
occu
rs, f
or
cons
olid
atio
n pu
rpos
es, o
r if e
xist
ing
habi
tat i
s un
man
agea
ble.
$0$0
$53,
045
$0$0
$57,
964
$0$0
$0$6
5,23
9
SA p
rior
ity
subp
opul
atio
ns$0
$51,
500
$0$0
$56,
275
$0$0
$0$6
3,33
8$0
WA
pri
orit
y su
bpop
ulat
ions
$0$0
$0$5
4,63
6$0
$0$5
9,70
2$0
$0$6
5,23
8
SA s
ubpo
pula
tion
sU
se c
apti
ve b
reed
ing
and
cros
s-fo
ster
ing
to
cons
erve
gen
etic
div
ersi
ty.
$80,
000
$82,
400
$84,
872
$87,
418
$90,
041
$92,
742
$95,
524
$98,
390
$101
,342
$104
,382
All
Con
duct
res
earc
h to
impr
ove
know
ledg
e of
di
seas
es a
nd p
aras
ites
affe
ctin
g P.
late
ralis
.$0
$0$3
0,00
0$3
0,90
0$3
1,82
7$0
$0$0
$0$0
All
Con
duct
res
earc
h in
to th
e pr
edat
ion
impa
ct o
f fe
ral c
ats
on P
. lat
eral
is
$0$0
$30,
000
$30,
900
$31,
827
$0$0
$0$0
$0
Low
pri
orit
y su
bpop
ulat
ions
(x
20)
Min
imal
mon
itori
ng o
f tho
se s
ubpo
pula
tion
s th
at
are
not c
onsi
dere
d hi
gh p
rior
ity
for a
chie
ving
th
e co
nser
vati
on o
bjec
tive
s, a
nd th
at a
re n
ot
cons
olid
ated
thro
ugh
tran
sloc
atio
n.
$0$0
$0$0
$200
,000
$0$0
$0$0
$231
,855
YE
AR
LY
TO
TA
LS
$2,5
20,0
00$2
,353
,600
$2,3
09,1
08$2
,640
,636
$3,0
70,6
08$2
,467
,660
$2,8
17,9
61$2
,724
,944
$2,6
85,5
51$3
,651
,643
GR
AN
D T
OT
AL
$27
,24
1,71
0
#Not
e th
at a
n in
dex
of 3
% h
as b
een
appl
ied
to e
ach
succ
essi
ve y
ear o
f fun
ding
to a
ccou
nt fo
r CP
I
*Inc
lude
s 5-
year
pro
gram
revi
ew

154
Action Plan for Threatened Macropods 2011-2021
Recovery Outline - Petrogale penicillata
1. Family Macropodidae
2. Scientific name: Petrogale penicillata (Gray, 1827)
3. Common name: Brush-tailed rock wallaby, western rock wallaby
4. Conservation status (IUCN): Near Threatened
5. Reasons for listing
Listed as Near Threatened because this species is in significant decline (but at a rate of less than 30% over ten years) due to predation by, and competition with, introduced species and by fragmentation that has led to increasingly isolated populations that are prone to extinction, making the species close to qualifying for Vulnerable under criterion A (Taggart et al. 2008).
Listed as Vulnerable under the EPBC Act 1999 (DEWHA 2010).
6. Infraspecific Taxa
6.1 None. See section 18 below for discussion of ecologically significant units (ESUs).
7. Range and abundance
The brush-tailed rock wallaby is endemic to south-eastern Australia, where it occurs in south-eastern Queensland, eastern New South Wales, and as a tiny subpopulation in the East Gippsland of eastern Victoria.
This species is sparsely distributed within abundant suitable habitat (Eldridge and Close 2008). It is difficult to estimate population sizes because it is nocturnal, and occurs in very rugged terrain. The species is declining at many localities and the overall population is in decline. The total population size is estimated to be between 15,000 and 30,000 individuals (DECC 2008). The stronghold for the species is within north-eastern New South Wales, containing as much as 80% of the total population – most of which is within the Macleay River and Clarence River gorges (DECC 2008). An estimated 2% of the population occurs elsewhere in New South Wales, 17% within Queensland, and less than 1% in Victoria (DECC 2008).
Figure 17: Known distribution of Petrogale penicillata from the 2008 Global Mammal Assessment (IUCN 2010; Landsat imagery © Commonwealth of Australia - Geoscience Australia).

155
Action Plan for Threatened Macropods 2011-2021
8. Habitat
Found in structurally complex rocky habitats. Often these areas are gorges, cliffs, rock outcrops, or boulder piles. Most of these sites have a northerly aspect, but this appears not to be as important as rock complexity that contains a number of refuges from predators (Murray et al. 2008). The rocky environments occur within a variety of vegetated landscapes from dense rainforest to dry sclerophyll or open woodland (Eldridge and Close 2008).
Brush-tailed rock wallabies typically shelter during the day in rock crevices, caves and overhangs, yet often bask in exposed sunny spots (Sharman & Maynes 1983). Within their home range, rock wallabies habitually use the same refuges, sunning spots, feeding areas and pathways (Joblin 1983) and these are often defended vigorously (Bayne 1994).
9. Threats
9.1 Predation by introduced foxes. Foxes prey on young rock wallabies and probably limit dispersal as well as recruitment.
9.2 Competition with introduced goats.
9.3 Introduced dogs and cats are also probably threats.
9.4 Habitat fragmentation and land clearance between colonies.
9.5 Colony isolation increases the risk of inbreeding.
9.6 Bioclimatic changes.
9.7 Disease.
10. Information required
10.1 There is a lack of data about the threats to the Brush-tailed rock wallaby.
10.2 More detailed knowledge about the species’ habitat and biology is needed to make informed decisions on how to address these threats and thus how best to manage this species.
10.3 Population monitoring, genetic and floristic analyses are key elements to this threat abatement process.
10.4 Detailed studies of the effects of fire on habitat regeneration are needed.
11. Recovery objectives
11.1 By 2021, Petrogale penicillata is eligible for listing as Least Concern according to IUCN Red List criteria.
11.2 By 2021, the number of distinct secure subpopulations of Petrogale penicillata is greater than 10, and the population is estimated to number greater than 10,000 mature individuals, thus making it ineligible to qualify as Vulnerable under IUCN criteria B or C.
11.3 By 2021, management plans have been developed and are being implemented to reduce the threats of low resource availability, introduced predators, fire and disease for key Petrogale penicillata subpopulations.
11.4 By 2021, the genetic diversity of Petrogale penicillata has been maintained at known 2011 levels.
12. Actions completed or underway
12.1 A program to arrest the continuing decline of the brush-tailed rock wallaby in NSW was instigated by the NPWS in 1993.
12.2 Research into the genetics of brush-tailed rock wallaby has been undertaken by a number of researchers. This work involved genetic surveys, captive breeding and assisted reproduction strategies, establishment of protected breeding colonies and reintroduction trials.
12.3 Historical research into the timetable and causes of decline in brush-tailed rock wallaby in NSW extend the historical range of the species and indicated greater continuity in its distribution than previously recorded. It also identified the extent and relevance of commercially driven hunting to the early and steep decline of the species.
12.4 Research and studies on the behaviour and ecology of brush-tailed rock wallaby have also been undertaken.
12.5 A threat abatement plan (TAP) for predation of threatened fauna, including the brush-tailed rock wallaby, by the red fox was prepared in 2001.

156
Action Plan for Threatened Macropods 2011-2021
12.6 Brush-tailed rock wallabies were used in a recent cross-fostering study at Tidbinbilla Nature Reserve (ACT). The study demonstrated that the removal of pouch young (bred in captivity) and cross-fostering can be used to accelerate breeding and recruitment in the brush-tailed rock wallaby.
12.7 For a fuller account of these and other activities, see DEWHA (2010).
13. Management actions required
13.1 Status assessment of the species, including genetics, abundance, distribution, trend and risks. Identify those subpopulations that will be the most efficient to manage, and that capture the full genetic diversity of the species for future conservation.
13.2 Manage data to inform adaptive management.
13.3 Refine and implement monitoring protocols, including species and predator activity, grazing pressure, predation, and resource availability.
13.4 Conduct strategic and targeted fox baiting on-ground, and increase baiting in response to an increase in predator sightings or predation incidents and during droughts.
13.5 Undertake aerial baiting in priority areas (as determined by status assessment), and those areas that are remote and difficult to access from the ground.
13.6 Conduct competitor control operations for goats and rabbits in and around rock wallaby habitat, and increase during droughts and prolonged dry periods.
13.7 Develop and implement fire management plans for rock wallaby habitat.
13.8 Investigate the potential impacts of flooding on resource availability.
13.9 Control invasive weeds in and around rock wallaby habitat.
13.10 Engage local landholders and traditional owners in management of P. penicillata habitat on private and traditional lands.
13.11 Maintain captive breeding and cross-fostering programs to ensure genetic stock is maintained.
13.12 Review translocation of brush-tailed rock wallabies and prepare a strategy, including feasibility, for future operations.
13.13 Identify sites for translocation or reintroduction based on habitat mapping and/or on-ground assessment.
13.14 Translocate individuals or subpopulations to viable secure habitat if overpopulation occurs, or if habitat is unmanageable.
13.15 Those subpopulations not high priority or at key monitoring sites are to be left in situ, and undergo minimum monitoring at least every five years.
13.16 Conduct research to improve knowledge of diseases and parasites affecting P. penicillata.
13.17 Conduct research into the predation impact of feral cats on P. penicillata.
14. Organisations responsible for conservation of species
14.1 Department of Environment, Climate Change and Water (DECCW) New South Wales.
14.2 Department of Environment and Resource Management (DERM) Queensland.
14.3 Department of Sustainability and Environment (DSE) Victoria.
15. Other organisations involved
15.1 Various.
16. Staff and other resources required for recovery to be carried out
16.1 A dedicated recovery coordinator is required to oversee this complex recovery program.
17. Action costs
17.1 Total cost over 10 years exceeds A$31 million.

157
Action Plan for Threatened Macropods 2011-2021
18. Notes
18.1 Within the Brush-tailed rock-wallaby species there are three ecologically significant units (ESUs):
• Northern ESU (north-eastern NSW and south-eastern Queensland populations)
• Central ESU (central NSW population)
• Southern ESU (Victorian population).
It was estimated (DEC 2005) that 10,000 to 25,000+ individuals remain in Northern ESU, 1,000 in Central ESU and less than 10 in Southern ESU. All estimates refer to individuals remaining in the wild. It is likely that there is significant variation in genetic stock between ESUs, and it is likely that they will need to be managed accordingly.
19. References
Bayne, P (1994) Behaviour of the Brush-tailed Rock-wallaby, Petrogale penicillata, and the recognition of individuals. M.Sc. Thesis. University of New England, Armidale.
Department of Environment and Climate Change (New South Wales) (2008) Recovery plan for the brush-tailed rock-wallaby (Petrogale penicillata). Department of Environment and Climate Change New South Wales, Sydney South, Australia.
Department of Environment and Conservation (NSW) (DEC) (2005). Draft Recovery Plan for the Brush-tailed Rock-wallaby, Petrogale penicillata. Department of Environment and Conservation, Sydney.
Department of the Environment, Water, Heritage and the Arts (2010) Petrogale penicillata. In: Species Profile and Threats (SPRAT) Database. Department of the Environment, Water, Heritage and the Arts, Canberra. http://www.environment.gov.au/sprat. Accessed 27 October 2010.
Eldridge, MDB and Close, RL (2008) Brush-tailed rock wallaby, Petrogale penicillata. In The Mammals of Australia (Eds. Van Dyck, S & Strahan, R).
IUCN (2010) IUCN Red List of Threatened Species. Version 2010.3. http://www.iucnredlist.org. Accessed 19 October 2010.
Joblin, KPW (1983) Behaviour and ecology of the brush-tailed rock wallaby, Petrogale penicillata, in the New England Region. M.Sc. Thesis. Department of Ecosystem Management, University of New England, Armidale.
Murray, JV, Low Choy, S, McAlpine, CA, Possingham, HP and Goldizen, AW (2008) The importance of ecological scale for wildlife conservation in naturally fragmented environments: A case study of the brush-tailed rock-wallaby (Petrogale penicillata). Biological Conservation 141: 7-22.
Sharman, GB and Maynes, GM (1983) Rock-wallabies. In: Complete Book of Australian Mammals (Strahan R, ed.). Angus and Robertson, Sydney.
Taggart, D, Menkhorst, P and Lunney, D (2008) In: IUCN (2010) IUCN Red List of Threatened Species. Version 2010.3. http://www.iucnredlist.org/apps/redlist/details/16746/0. Accessed 19 October 2010.
20. Comments received
20.1 None.

158
Action Plan for Threatened Macropods 2011-2021
Table 39: List of recovery actions for Petrogale penicillata, and the rationale for their contribution to recovery, and effort required.
Subpopulation Action Rationale Frequency Duration Effort
AllProject manager coordinates project
The brush-tailed rock wallaby occupies a large biogeographic range and occurs across a wide array of administrative, tenure, and land management areas. It is therefore vital that recovery actions are coordinated at site, regional, ESU, state and national levels. Such coordination will require the continuation of current staff resources.
Yearly 1 Year 1 Person
Northern ESU priority subpopulations Status assessment of the
species - distribution and abundance, including ground survey
While some subpopulations are well-studied, there are many for which very little information exists. Surveys, including genetics, will be essential to an understanding of exactly which are the priority subpopulations that require management to achieve down-listing.
3-Yearly 3 Months 5 People
Central ESU priority subpopulations
3-Yearly 2 Weeks 5 People
Southern ESU priority subpopulations
3-Yearly 2 Weeks 5 People
Northern ESU priority subpopulations
Status assessment of the species - genetics
5-Yearly 2 Months 3 People
Central ESU priority subpopulations
5-Yearly 2 Weeks 3 People
Southern ESU priority subpopulations
5-Yearly 2 Weeks 3 People
Northern ESU priority subpopulations
Status assessment of the species - identify important subpopulations representing full genetic diversity of species for concerted management actions
5-Yearly 1 Month 2 People
Central ESU priority subpopulations
5-Yearly 1 Day 1 Person
Southern ESU priority subpopulations
5-Yearly 1 Day 1 Person
Northern ESU priority subpopulations Manage data to inform
adaptive management. Includes 5 year program review.
Good data management is essential to making it possible to extract the maximum amount of information from monitoring data.
3-Monthly 1 Week 1 Person
Central ESU priority subpopulations
3-Monthly 1 Day 1 Person
Southern ESU priority subpopulations
3-Monthly 1 Day 1 Person
All
Develop/refine monitoring protocols for the species, including trapping, satellite collars and camera traps, and to monitor habitat and threats.
A long-term consistent and cohesive approach to regular monitoring is essential to inform adaptive management strategies.
5-Yearly 3 Months 1 Person
Northern ESU priority subpopulations
Implement monitoring protocols, including species activity, predator activity, grazing pressure, and effectiveness of management intervention.
6-Monthly 1 Month 4 People
Central ESU priority subpopulations
6-Monthly 1 Month 2 People
Southern ESU priority subpopulations
6-Monthly 1 Month 2 People
Northern ESU priority subpopulations
Implement monitoring protocols for fire management and habitat condition, and effectiveness of management intervention.
Yearly 1 Month 10 People
Central ESU priority subpopulations
Yearly 1 Month 10 People
Southern ESU priority subpopulations
Yearly 1 Month 10 People

159
Action Plan for Threatened Macropods 2011-2021
Subpopulation Action Rationale Frequency Duration Effort
Northern ESU priority subpopulations
Continue fox and wild dog baiting on the ground
Predation is thought to have a significant, if not the greatest, impact on brush-tailed rock wallaby populations, through loss of young wallabies that have just left the pouch and of dispersing young wallabies. Circumstantial and anecdotal evidence indicates that brush-tailed rock wallabies are eaten by introduced foxes and dogs. Foxes are agile climbers known to access refuge areas. Wild dogs are less likely to invade refuge areas but are a threat to brush-tailed rock wallabies while they forage.
Monthly 1 Week 20 People
Central ESU priority subpopulations
Monthly 1 Week 5 People
Southern ESU priority subpopulations
Monthly 1 Week 5 People
Northern ESU priority subpopulations
Conduct aerial fox baiting for priority and difficult access sites
3-Monthly 2 Weeks 3 People
Central ESU priority subpopulations
3-Monthly 1 Week 2 People
Southern ESU priority subpopulations
3-Monthly 1 Week 2 People
Northern ESU priority subpopulations Increase fox baiting in
response to increased predation or predator sightings
Unknown 2 Weeks 20 People
Central ESU priority subpopulations
Unknown 2 Weeks 5 People
Southern ESU priority subpopulations
Unknown 2 Weeks 5 People
Northern ESU priority subpopulations
Control introduced herbivores
The level of competition between rock wallabies and other herbivores is generally poorly understood. Competition with native animals has been speculated as potentially affecting brush-tailed rock wallaby ecology and habitat use. Competition between brush-tailed rock wallabies and feral goats for refuge areas may occur in some areas. While competition with herbivores other than goats is difficult to demonstrate, the impact of habitat alteration may be significant. For example, Pearson (1992) considered rabbits were a major factor in altering the habitat of black-footed rock-wallabies. The effect of rabbits may be spasmodic, and may only be significant during a drought.
6-Monthly 2 Weeks 5 People
Central ESU priority subpopulations
6-Monthly 1 Week 2 People
Southern ESU priority subpopulations
6-Monthly 1 Week 2 People
Northern ESU priority subpopulations
Develop and implement fire management plans for priority P. penicillata habitat
Research into the most appropriate ways to manage fire around rock wallaby colonies is required. The impact of fire on brush-tailed rock wallaby populations is uncertain. brush-tailed rock wallabies have been variously reported to disappear, move from, and remain in their habitat during fire. Fire alters the structure and floristics of vegetation, and possibly the suitability of the vegetation as habitat or food
Yearly 1 Month 10 People
Central ESU priority subpopulations
Yearly 2 Weeks 5 People
Southern ESU priority subpopulations
Yearly 2 Weeks 5 People
Northern ESU priority subpopulations
Control invasive weeds in and around P. penicillata habitat
Little is known about the ingression of weeds into rock wallaby habitats and its long-term effect on rock wallabies. Weed infestation of particularly woody or shrubby weeds, such as lantana, may both provide and exclude refuge areas, depending on the extent and intensity of the infestation.
Yearly 2 Weeks 5 People
Central ESU priority subpopulations
Yearly 2 Weeks 5 People
Southern ESU priority subpopulations
Yearly 2 Weeks 5 People
All priority subpopulations
Develop contingency plans for catastrophic events including wildfires and drought
Where priority subpopulations could be wiped out by a natural event, contingency plans should be put in place to avoid such disasters.
Once 2 Weeks 1 Person

160
Action Plan for Threatened Macropods 2011-2021
Subpopulation Action Rationale Frequency Duration Effort
Northern ESU priority subpopulations
Engage local landholders and traditional owners in management of P. penicillata habitat on private and traditional lands
Some BTRW colonies are on private lands, or adjacent to private lands. Community involvement is an important aspect of conservation both in and outside national parks and reserves.
Yearly 1 Year 2 People
Central ESU priority subpopulations
Yearly 1 Year 1 Person
Southern ESU priority subpopulations
Yearly 1 Year 1 Person
All
Review translocation of P. penicillata including feasibility of future operations
Translocations of wild animals rely on a suite of factors for their success. Full understanding of past translocation efforts, and their contribution to success or failure, is essential if future attempts are to be successful.
Once 1 Month 1 Person
Northern ESU priority subpopulations
Translocate individuals or subpopulations to viable secure habitat if overpopulation occurs, for consolidation purposes, or if existing habitat is unmanageable.
The increased likelihood of inbreeding when rock wallaby populations are small may result in reduced variability, the expression of recessive genes or suppressed reproductive rates. Translocation of small subpopulations to larger colonies may be the most viable means of managing them. Furthermore, once threats are removed, rock wallaby numbers may exceed available resources, and translocation may be the most effective means of managing numbers.
3-Yearly 2 Weeks 5 People
Central ESU priority subpopulations
3-Yearly 2 Weeks 5 People
Southern ESU priority subpopulations
3-Yearly 2 Weeks 5 People
All
Use captive breeding and cross-fostering to conserve genetic diversity.
Captive breeding and cross-fostering may be the most effective methods of ensuring genetic diversity is maintained for the species, especially where the southern ESU is extremely limited in numbers.
Yearly 1 Year 2 People
All
Conduct research to improve knowledge of diseases and parasites affecting P. penicillata
Little is known about disease in wild populations of brush-tailed rock wallaby, although this species is probably susceptible to the same diseases found in other macropods.
Once 3 Years 1 Person
AllConduct research into the predation impact of feral cats on P. penicillata
Feral cats are possible rock-wallaby predators, and declines in other species of rock wallabies have been attributed to predation by feral cats.
Once 3 Years 1 Person
Low priority subpopulations
Minimal monitoring of those subpopulations that are not considered high priority for achieving the conservation objectives, and that are not consolidated through translocation.
There are many small subpopulations of P. penicillata that present management challenges, and that would not add significantly to the conservation objectives, from the perspective of abundance and/or genetic diversity. It would be extremely resource-intensive to manage these subpopulations, with little prospective return. Also there is the possibility that human intervention could inadvertently cause more harm in attempting to manage these subpopulations.
5-Yearly 2 Months 20 People

161
Action Plan for Threatened Macropods 2011-2021
Tab
le 4
0: L
ist o
f rec
over
y ac
tion
s fo
r Pe
trog
ale
peni
cilla
ta, a
nd t
heir
cos
ts
Su
bp
op
ula
tio
nA
ctio
nY
ear
1#Y
ear
2Y
ear
3Y
ear
4Y
ear
5Y
ear
6Y
ear
7Y
ear
8Y
ear
9Y
ear
10
All
Proj
ect m
anag
er c
oord
inat
es p
roje
ct$1
00,0
00$1
03,0
00$1
06,0
90$1
09,2
73$1
12,5
51$1
15,9
27$1
19,4
05$1
22,9
87$1
26,6
77$1
30,4
77
Nor
ther
n E
SU p
rior
ity
subp
opul
atio
ns
Stat
us a
sses
smen
t of t
he s
peci
es -
dist
ribu
tion
and
ab
unda
nce,
incl
udin
g gr
ound
sur
vey
$120
,000
$0$0
$131
,127
$0$0
$143
,286
$0$0
$156
,573
Cen
tral
ESU
pri
orit
y su
bpop
ulat
ions
$40,
000
$0$0
$43,
709
$0$0
$47,
762
$0$0
$52,
191
Sout
hern
ESU
pri
orit
y su
bpop
ulat
ions
$5,0
00$0
$0$5
,464
$0$0
$5,9
70$0
$0$6
,524
Nor
ther
n E
SU p
rior
ity
subp
opul
atio
ns
Stat
us a
sses
smen
t of t
he s
peci
es -
gene
tics
$60,
000
$0$0
$0$6
7,53
1$0
$0$0
$0$7
8,28
7
Cen
tral
ESU
pri
orit
y su
bpop
ulat
ions
$10,
000
$0$0
$0$1
1,25
5$0
$0$0
$0$1
3,04
8
Sout
hern
ESU
pri
orit
y su
bpop
ulat
ions
$5,0
00$0
$0$0
$5,6
28$0
$0$0
$0$6
,524
Nor
ther
n E
SU p
rior
ity
subp
opul
atio
nsSt
atus
ass
essm
ent o
f the
spe
cies
- id
enti
fy
impo
rtan
t sub
popu
lati
ons
repr
esen
ting
full
gene
tic
dive
rsit
y of
spe
cies
for c
once
rted
m
anag
emen
t act
ions
$10,
000
$0$0
$0$1
1,25
5$0
$0$0
$0$0
Cen
tral
ESU
pri
orit
y su
bpop
ulat
ions
$2,0
00$0
$0$0
$2,2
51$0
$0$0
$0$0
Sout
hern
ESU
pri
orit
y su
bpop
ulat
ions
$0$0
$0$0
$0$0
$0$0
$0$0
Nor
ther
n E
SU p
rior
ity
subp
opul
atio
ns
Man
age
data
to in
form
ada
ptiv
e m
anag
emen
t. In
clud
es 5
yea
r pro
gram
rev
iew
.
$0$0
$0$0
$25,
000*
$0$0
$0$0
$28,
138*
Cen
tral
ESU
pri
orit
y su
bpop
ulat
ions
$0$0
$0$0
$0$0
$0$0
$0$0
Sout
hern
ESU
pri
orit
y su
bpop
ulat
ions
$0$0
$0$0
$0$0
$0$0
$0$0
All
Dev
elop
/refi
ne m
onito
ring
pro
toco
ls fo
r the
sp
ecie
s, in
clud
ing
trap
ping
, sat
ellit
e co
llars
and
ca
mer
a tr
aps,
and
to m
onito
r hab
itat
and
thre
ats.
$50,
000
$51,
500
$0$0
$56,
275
$0$0
$0$0
$0
Nor
ther
n E
SU p
rior
ity
subp
opul
atio
nsIm
plem
ent m
onito
ring
pro
toco
ls, i
nclu
ding
sp
ecie
s ac
tivi
ty, p
reda
tor a
ctiv
ity,
gra
zing
pr
essu
re, a
nd e
ffec
tive
ness
of m
anag
emen
t in
terv
enti
on.
$150
,000
$154
,500
$159
,135
$163
,909
$168
,826
$173
,891
$179
,108
$184
,481
$190
,016
$195
,716
Cen
tral
ESU
pri
orit
y su
bpop
ulat
ions
$60,
000
$61,
800
$63,
654
$65,
564
$67,
531
$69,
556
$71,
643
$73,
792
$76,
006
$78,
286
Sout
hern
ESU
pri
orit
y su
bpop
ulat
ions
$20,
000
$20,
600
$21,
218
$21,
855
$22,
510
$23,
185
$23,
881
$24,
597
$25,
335
$26,
095

162
Action Plan for Threatened Macropods 2011-2021
Su
bp
op
ula
tio
nA
ctio
nY
ear
1#Y
ear
2Y
ear
3Y
ear
4Y
ear
5Y
ear
6Y
ear
7Y
ear
8Y
ear
9Y
ear
10
Nor
ther
n E
SU p
rior
ity
subp
opul
atio
nsIm
plem
ent m
onito
ring
pro
toco
ls fo
r fire
m
anag
emen
t and
hab
itat
con
diti
on, a
nd
effe
ctiv
enes
s of
man
agem
ent i
nter
vent
ion.
$50,
000
$51,
500
$53,
045
$54,
636
$56,
275
$57,
964
$59,
703
$61,
494
$63,
339
$65,
239
Cen
tral
ESU
pri
orit
y su
bpop
ulat
ions
$15,
000
$15,
450
$15,
914
$16,
391
$16,
883
$17,
389
$17,
911
$18,
448
$19,
002
$19,
572
Sout
hern
ESU
pri
orit
y su
bpop
ulat
ions
$5,0
00$5
,150
$5,3
05$5
,464
$5,6
28$5
,796
$5,9
70$6
,149
$6,3
34$6
,524
Nor
ther
n E
SU p
rior
ity
subp
opul
atio
ns
Con
tinu
e fo
x an
d w
ild d
og b
aiti
ng o
n th
e gr
ound
$400
,000
$412
,000
$424
,360
$437
,091
$450
,204
$463
,710
$477
,621
$491
,950
$506
,708
$521
,909
Cen
tral
ESU
pri
orit
y su
bpop
ulat
ions
$400
,000
$412
,000
$424
,360
$437
,091
$450
,204
$463
,710
$477
,621
$491
,950
$506
,708
$521
,909
Sout
hern
ESU
pri
orit
y su
bpop
ulat
ions
$400
,000
$412
,000
$424
,360
$437
,091
$450
,204
$463
,710
$477
,621
$491
,950
$506
,708
$521
,909
Nor
ther
n E
SU p
rior
ity
subp
opul
atio
ns
Con
duct
aer
ial f
ox b
aiti
ng fo
r pri
orit
y an
d di
fficu
lt ac
cess
site
s
$100
,000
$103
,000
$106
,090
$109
,273
$112
,551
$115
,927
$119
,405
$122
,987
$126
,677
$130
,477
Cen
tral
ESU
pri
orit
y su
bpop
ulat
ions
$100
,000
$103
,000
$106
,090
$109
,273
$112
,551
$115
,927
$119
,405
$122
,987
$126
,677
$130
,477
Sout
hern
ESU
pri
orit
y su
bpop
ulat
ions
$100
,000
$103
,000
$106
,090
$109
,273
$112
,551
$115
,927
$119
,405
$122
,987
$126
,677
$130
,477
Nor
ther
n E
SU p
rior
ity
subp
opul
atio
ns
Incr
ease
fox
bait
ing
in r
espo
nse
to in
crea
sed
pred
atio
n or
pre
dato
r sig
htin
gs
$0$5
0,00
0$0
$0$5
4,63
6$0
$0$5
9,70
2$0
$0
Cen
tral
ESU
pri
orit
y su
bpop
ulat
ions
$0$5
0,00
0$0
$0$5
4,63
6$0
$0$5
9,70
2$0
$0
Sout
hern
ESU
pri
orit
y su
bpop
ulat
ions
$0$5
0,00
0$0
$0$5
4,63
6$0
$0$5
9,70
2$0
$0
Nor
ther
n E
SU p
rior
ity
subp
opul
atio
ns
Con
trol
intr
oduc
ed h
erbi
vore
s
$80,
000
$82,
400
$84,
872
$87,
418
$90,
041
$92,
742
$95,
524
$98,
390
$101
,342
$104
,382
Cen
tral
ESU
pri
orit
y su
bpop
ulat
ions
$60,
000
$61,
800
$63,
654
$65,
564
$67,
531
$69,
556
$71,
643
$73,
792
$76,
006
$78,
286
Sout
hern
ESU
pri
orit
y su
bpop
ulat
ions
$30,
000
$30,
900
$31,
827
$32,
782
$33,
765
$34,
778
$35,
822
$36,
896
$38,
003
$39,
143
Nor
ther
n E
SU p
rior
ity
subp
opul
atio
ns
Dev
elop
and
impl
emen
t fire
man
agem
ent p
lans
for
prio
rity
P. p
enic
illat
a ha
bita
t
$40,
000
$41,
200
$42,
436
$43,
709
$45,
020
$46,
371
$47,
762
$49,
195
$50,
671
$52,
191
Cen
tral
ESU
pri
orit
y su
bpop
ulat
ions
$20,
000
$20,
600
$21,
218
$21,
855
$22,
510
$23,
185
$23,
881
$24,
597
$25,
335
$26,
095
Sout
hern
ESU
pri
orit
y su
bpop
ulat
ions
$10,
000
$10,
300
$10,
609
$10,
927
$11,
255
$11,
593
$11,
941
$12,
299
$12,
668
$13,
048

163
Action Plan for Threatened Macropods 2011-2021
Su
bp
op
ula
tio
nA
ctio
nY
ear
1#Y
ear
2Y
ear
3Y
ear
4Y
ear
5Y
ear
6Y
ear
7Y
ear
8Y
ear
9Y
ear
10
Nor
ther
n E
SU p
rior
ity
subp
opul
atio
ns
Con
trol
inva
sive
wee
ds in
and
aro
und
P.
peni
cilla
ta h
abit
at
$50,
000
$51,
500
$53,
045
$54,
636
$56,
275
$57,
964
$59,
703
$61,
494
$63,
339
$65,
239
Cen
tral
ESU
pri
orit
y su
bpop
ulat
ions
$30,
000
$30,
900
$31,
827
$32,
782
$33,
765
$34,
778
$35,
822
$36,
896
$38,
003
$39,
143
Sout
hern
ESU
pri
orit
y su
bpop
ulat
ions
$10,
000
$10,
300
$10,
609
$10,
927
$11,
255
$11,
593
$11,
941
$12,
299
$12,
668
$13,
048
All
prio
rity
sub
popu
lati
ons
Dev
elop
con
ting
ency
pla
ns fo
r cat
astr
ophi
c ev
ents
in
clud
ing
wild
fires
and
dro
ught
$5,0
00$0
$0$0
$5,6
28$0
$0$0
$0$0
Nor
ther
n E
SU p
rior
ity
subp
opul
atio
nsE
ngag
e lo
cal l
andh
olde
rs a
nd tr
adit
iona
l ow
ners
in
man
agem
ent o
f P. p
enic
illat
a ha
bita
t on
priv
ate
and
trad
itio
nal l
ands
$60,
000
$61,
800
$63,
654
$65,
564
$67,
531
$69,
556
$71,
643
$73,
792
$76,
006
$78,
286
Cen
tral
ESU
pri
orit
y su
bpop
ulat
ions
$60,
000
$61,
800
$63,
654
$65,
564
$67,
531
$69,
556
$71,
643
$73,
792
$76,
006
$78,
286
Sout
hern
ESU
pri
orit
y su
bpop
ulat
ions
$60,
000
$61,
800
$63,
654
$65,
564
$67,
531
$69,
556
$71,
643
$73,
792
$76,
006
$78,
286
All
Rev
iew
tran
sloc
atio
n of
P. p
enic
illat
a in
clud
ing
feas
ibili
ty o
f fut
ure
oper
atio
ns$5
,000
$0$0
$0$5
,628
$0$0
$0$0
$0
Nor
ther
n E
SU p
rior
ity
subp
opul
atio
nsTr
ansl
ocat
e in
divi
dual
s or
sub
popu
lati
ons
to
viab
le s
ecur
e ha
bita
t if o
verp
opul
atio
n oc
curs
, for
co
nsol
idat
ion
purp
oses
, or i
f exi
stin
g ha
bita
t is
unm
anag
eabl
e.
$0$0
$53,
045
$0$0
$57,
964
$0$0
$0$6
5,23
9
Cen
tral
ESU
pri
orit
y su
bpop
ulat
ions
$0$5
1,50
0$0
$0$5
6,27
5$0
$0$0
$63,
338
$0
Sout
hern
ESU
pri
orit
y su
bpop
ulat
ions
$0$0
$0$5
4,63
6$0
$0$5
9,70
2$0
$0$6
5,23
8
All
Use
cap
tive
bre
edin
g an
d cr
oss-
fost
erin
g to
co
nser
ve g
enet
ic d
iver
sity
.$8
0,00
0$8
2,40
0$8
4,87
2$8
7,41
8$9
0,04
1$9
2,74
2$9
5,52
4$9
8,39
0$1
01,3
42$1
04,3
82
All
Con
duct
res
earc
h to
impr
ove
know
ledg
e of
di
seas
es a
nd p
aras
ites
affe
ctin
g P.
pen
icill
ata
$0$0
$30,
000
$30,
900
$31,
827
$0$0
$0$0
$0
All
Con
duct
res
earc
h in
to th
e pr
edat
ion
impa
ct o
f fe
ral c
ats
on P
. pen
icill
ata
$0$0
$30,
000
$30,
900
$31,
827
$0$0
$0$0
$0
Low
pri
orit
y su
bpop
ulat
ions
Min
imal
mon
itori
ng o
f tho
se s
ubpo
pula
tion
s th
at
are
not c
onsi
dere
d hi
gh p
rior
ity
for a
chie
ving
th
e co
nser
vati
on o
bjec
tive
s, a
nd th
at a
re n
ot
cons
olid
ated
thro
ugh
tran
sloc
atio
n.
$0$0
$0$0
$200
,000
$0$0
$0$0
$231
,855
YE
AR
LY
TO
TA
LS
$2,8
02,0
00$2
,817
,700
$2,7
54,6
86$3
,017
,626
$3,4
76,8
05$2
,944
,556
$3,2
29,9
11$3
,241
,492
$3,2
17,5
96$3
,952
,502
GR
AN
D T
OT
AL
$31,
454
,873
#Not
e th
at a
n in
dex
of 3
% h
as b
een
appl
ied
to e
ach
succ
essi
ve y
ear o
f fun
ding
to a
ccou
nt fo
r CP
I
*Inc
lude
s 5-
year
pro
gram
revi
ew

164
Action Plan for Threatened Macropods 2011-2021
Recovery Outline - Petrogale persephone
1. Family Macropodidae
2. Scientific name: Petrogale persephone (Maynes, 1982)
3. Common name: Proserpine rock wallaby
4. Conservation status (IUCN): Endangered; B1ab(iii, v)
5. Reasons for listing
Listed as Endangered because its extent of occurrence is less than 5,000 km2, its distribution is severely fragmented, and there is a continuing decline in the extent and or quality of the habitat and the numbers of mature individuals (due primarily to road kills and domestic dogs) (Burnett & Winter 2008).
Listed as Endangered under the EPBC Act 1999.
6. Infraspecific Taxa
6.1 None described
7. Range and abundance
Figure 18: Known distribution of Petrogale persephone from the 2008 Global Mammal Assessment (IUCN 2010; Landsat imagery ©Commonwealth of Australia - Geoscience Australia).
The Proserpine rock wallaby has the smallest known distribution of any rock-wallaby, and is limited to near the towns of Proserpine and Airlie Beach, in the Whitsunday Shire of northern Queensland (Nolan & Johnson 2000).
Today it is restricted to 14,500 hectares of naturally fragmented habitat within the Whitsunday region of central coastal Queensland (Johnson & Eldridge 2008). Under recovery plan guidelines for this species, 27 captive-bred Proserpine rock wallabies were introduced to nearby Hayman Island between 1998 and 2002, and monitoring programs have shown that in spite of predation by wedge-tailed eagles, this population is breeding successfully (Johnson & Eldridge 2008).
The population size of the Proserpine rock wallaby is small, because it occurs in limited habitat within a small geographical area (DEWHA 2010).
165
Action Plan for Threatened Macropods 2011-2021
8. Habitat
On the mainland, the Proserpine rock wallaby lives in rocky outcrops and boulder piles, usually within semi-deciduous vine thickets, but sometimes on the outer margins of rainforest or in areas where the forest has been disturbed. These habitats provide a high diversity of food plants, as well as shelter within the dense understorey and inside the caves and crevices of the rock piles (Johnson & Eldridge 2008).
The Proserpine rock wallaby is the only species of rock wallaby to live exclusively in rainforest (Winkel 1997a). It lives in sites with large boulder piles and perched boulders creating crevices, tunnels and overhangs (Winkel 1997b). On the mainland, it inhabits boulder outcrops in pockets of semi-deciduous, semi-evergreen or complex microphyll or notophyll vine forest (Nolan 1997).
In Gloucester Island National Park, the Proserpine rock wallaby prefers littoral (beachside) habitat. It uses rocky outcrops and rock piles covered with dry vine scrub, usually associated with beach scrub. At higher elevations, its habitat is rocky outcrops, rock piles and rocky creeks within an Acacia open forest (Nolan 1997; Nolan & Johnson 2000). On Hayman Island, where the wallaby has been translocated, it occurs in association with boulder piles covered with vine thicket or vine forest (Schaper & Nolan 2000).
9. Threats
9.1 Loss and fragmentation of habitat, often due to clearing for housing.
9.2 Predation by domestic and feral dogs.
9.3 Road kills from vehicle collisions.
9.4 Increased tourist development and urbanisation.
9.5 Toxoplasmosis, transferred by domestic and feral cats.
9.6 Hydatid tapeworm, spread by dogs.
9.7 Consumption of introduced toxic plants.
9.8 Hybridisation with Petrogale inornata (Unadorned rock wallaby).
9.9 Fire has the potential to destroy entire subpopulations.
9.10 Climate Change is a possible threat due to the extremely specific habitat requirements and limited distribution (Clancy and Close 1997).
10. Information required
10.1 Map the distribution of hydatidosis and Toxoplasmosis gondii in the Proserpine rock wallaby.
10.2 Improved understanding of habitat requirements of the Proserpine rock wallaby, including patch size, connectivity and condition, and provision of guidelines to reduce habitat fragmentation in Mackay Whitsunday NRM region.
11. Recovery objectives
11.1 By 2021, Petrogale persephone is eligible for listing as Vulnerable according to IUCN Red List criteria.
11.2 By 2021, the geographic range of Petrogale persephone in the form of extent of occurrence has increased to greater than 5,000 km2, with subpopulations secure* at greater than 5 locations within that range.
11.3 By 2021, numbers of mature Petrogale persephone in the wild are considered stable or increasing based on an index of abundance appropriate to the taxon.
11.4 By 2021, management plans have been developed and are being implemented to reduce the threats of road kills and domestic dogs, and to improve habitat area, extent and quality, for all Petrogale persephone subpopulations.
11.5 By 2021, the genetic diversity of Petrogale persephone has been maintained at known 2011 levels.
12. Actions completed or underway
12.1 Essential habitat mapping for the species is complete (DERM 2009).
12.2 DERM has produced brochures for the general public titled ‘Creating habitat for the Proserpine rock-wallaby!’ and ‘Help save the Proserpine rock-wallaby!’ which include guidelines for revegetation and encourage the creation of habitat linkages.
12.3 One translocated/introduced population has been established on Hayman Island from captive bred stock with additions required to this population from captive bred stock over the next 4 years (B. Nolan pers. comm.).
12.4 Studies of reproduction and aging of pouch young have been completed for this species in captivity (B. Nolan pers. comm.).

166
Action Plan for Threatened Macropods 2011-2021
12.5 A draft recovery plan is in place (DERM 2009).
13. Management actions required
13.1 Status assessment of extant subpopulations using standard protocols, including distribution, abundance, genetics, trend, risk and priority subpopulations.
13.2 Manage species data to inform adaptive management.
13.3 Refine and implement monitoring protocols, including fire management, habitat condition, predation and predator activity, and species activity.
13.4 Update Proserpine rock wallaby habitat mapping throughout range, including future translocation sites. Include definition of important habitat areas for the rock wallaby in terms of size, linkages and configuration to guide actions to address habitat fragmentation.
13.5 Address ongoing land clearing and habitat fragmentation through protecting known habitat by establishing reserves on public land, or conservation covenants and nature refuges on private land. Use market-based incentives and focus on rural-residential or farming areas.
13.6 Establish vegetation corridors between the most isolated patches of habitat.
13.7 Protect native vegetation along creek lines to maintain species dispersal routes.
13.8 Remove fences in rock wallaby habitat that may serve as barriers against which they may be trapped when fleeing dogs
13.9 Control feral cats and wild dogs in and around Proserpine rock wallaby habitat.
13.10 Address growing numbers of domestic cats and dogs surrounding Proserpine rock wallaby habitat, including implementation of the Whitsunday Regional Council dog registration program
13.11 Control wild dogs around Proserpine rock wallaby sites.
13.12 Actions to reduce road mortality, including installation of roadside reflectors along roads where Proserpine rock wallabies are known to frequent.
13.13 Weed management in and around Proserpine rock wallaby habitat. Control Pink Periwinkle and Guinea Grass within
Proserpine rock wallaby habitat and along roadsides margins.
13.14 Develop and implement weed control strategies on Gloucester Island
13.15 Implement revegetation of habitat plants for the Proserpine rock wallaby, including actions to protect and manage key remnant coastal and urban vegetation that provide habitat for the Proserpine rock wallaby.
13.16 Revise and implement the Proserpine rock wallaby Contact Plan to gain landholder support of recovery actions, and improving developers’ awareness of and compliance with recovery actions.
13.17 Increase the awareness of rural and urban landholders in areas with Proserpine rock wallabies of the importance of controlling domestic dogs, including the threat of hydatid parasites.
13.18 Maintain appropriate fire management procedures in and around Proserpine rock wallaby habitat, including Hayman Island.
13.19 Identify sites for translocation or reintroduction based on habitat mapping and/or on-ground assessment.
13.20 Establish and manage secure areas of habitat for future translocations.
13.21 Translocation of Proserpine rock wallabies to secure and managed areas of habitat.
13.22 Ongoing management of translocated subpopulations.
14. Organisations responsible for conservation of species
14.1 Department of Environment and Resource Management (DERM) Queensland.
14.2 Whitsunday Regional Council.
15. Other organisations involved
15.1 James Cook University.
16. Staff and other resources required for recovery to be carried out
16.1 The recovery program is sufficiently complex to warrant the employment of a full time recovery coordinator.
17. Action costs
17.1 Total cost over 10 years exceeds A$10 million.

167
Action Plan for Threatened Macropods 2011-2021
18. Notes
18.1 None.
19. References
Burnett, S and Winter, J (2008) Petrogale persephone. In: IUCN (2010) IUCN Red List of Threatened Species. Version 2010.2. http://www.iucnredlist.org/apps/redlist/details/16747/0. Accessed 29 June 2010.
IUCN (2010) IUCN Red List of Threatened Species. Version 2010.2. http://www.iucnredlist.org. Accessed 29 June 2010.
Department of Environment and Resource Management (2009) National Draft recovery plan for the Proserpine rock-wallaby Petrogale persephone. Report to Department of the Environment, Water, Heritage and the Arts, Canberra. Queensland Department of Environment and Resource Management, Brisbane.
Department of the Environment, Water, Heritage and the Arts (2010) Petrogale persephone. In: Species Profile and Threats (SPRAT) Database. Department of the Environment, Water, Heritage and the Arts, Canberra. http://www.environment.gov.au/sprat. Accessed 1 November 2010.
Johnson, PM & Eldridge, MDB (2008) in Van Dyck, S & Strahan, R (eds.) The Mammals of Australia. New Holland Publishers, Sydney.
Nolan, B (1997) An update of the Proserpine rock-wallaby Petrogale persephone Recovery Plan. Australian Mammalogy. 19: 309-313.
Nolan, B & Johnson, P (2000) Recovery Plan for the Proserpine rock-wallaby Petrogale persephone 2000-2004. Queensland Parks and Wildlife, Brisbane.
Schaper, D. & B. Nolan (2000). Final report on phase two of the recovery plan for the Proserpine Rock-wallaby Petrogale persephone. Brisbane: Environmental Protection Agency.
Winkel, P (1997a) Proserpine Rock-wallaby: Rare and endangered. Nature Australia. 26(3):20-21.
Winkel, P (1997b) The ecology and management of the Proserpine Rock-wallaby, Petrogale persephone. Report to the Queensland Department of Environment, Brisbane.
20. Comments received
20.1 Barry Nolan, DERM.
Table 41: List of recovery actions for Petrogale persephone, and the rationale for their contribution to recovery, and effort required.
Subpopulation Action Rationale Frequency Duration Effort
AllProject coordinator manages project
Current recovery actions are ad hoc and opportunistic, and the recovery program is of sufficient complexity to warrant a dedicated manager.
Yearly 1 Year 1 Person
All
Status assessment - distribution and abundance. Includes surveys of known subpopulations
More information is required to better understand the status of the species, to assess those subpopulations most at risk from a range of threats, and to ensure that genetic stock is maintained.
3-Yearly 3 Months 10 People
AllStatus assessment - genetics
5-Yearly 2 Months 3 People
All
Status assessment - most important subpopulations for management, and the threats facing them. Includes identification of areas subject to grazing, weeds or fire.
Little is known about which subpopulations should be targeted for intensive management.
3-Yearly 1 Month 1 Person

168
Action Plan for Threatened Macropods 2011-2021
Subpopulation Action Rationale Frequency Duration Effort
Unconfirmed or suspected subpopulations
Survey to confirm rock wallaby presence
The species relies on large rock piles to provide them with protection from predators and environmental extremes. Only a few of these critical refuge sites are known, and surveys are therefore required to locate and map important rock piles in remaining habitat areas. Changes to the regional ecosystem classification may affect priority sites for protection, restoration and management including corridors between areas of habitat that are important in maintaining the population.
Yearly 1 Month 5 People
All
Manage species data to inform adaptive management. Includes 5 year program review.
Good data management is essential to making it possible to extract the maximum amount of information from monitoring data.
6-Monthly 1 Week 1 Person
AllUpdate species habitat mapping
Mapping is required to ensure that the complex distribution of this species is kept up to date.
5-Yearly 3 Months 1 Person
AllReview of translocations, and success and failure factors
Translocations of wild and captive subpopulations will be crucial to the ongoing management of the species. Ensuring that any future translocations are undertaken under optimum conditions is essential for the success of the operations.
Once 2 Weeks 1 Person
All
Develop/refine monitoring protocols for the species, including trapping, satellite collars and camera traps, and to monitor habitat and threats
Monitoring is essential to ensure adaptive management and achieving the species objectives.
Once 2 Months 1 Person
Location 1
Implement monitoring protocols for species activity, predator activity, road interactions, and effectiveness of management intervention.
3-Monthly 2 Weeks 5 People
Location 2 3-Monthly 2 Weeks 5 People
Location 3 3-Monthly 2 Weeks 5 People
Location 4 3-Monthly 2 Weeks 5 People
Gloucester Island 3-Monthly 2 Weeks 5 People
Hayman Island 3-Monthly 2 Weeks 6 People
Translocation Site 1 3-Monthly 2 Weeks 5 People
Translocation Site 2 3-Monthly 2 Weeks 5 People
Location 1
Implement monitoring protocols for weed control and habitat condition, and effectiveness of management intervention.
Yearly 2 Weeks 3 People
Location 2 Yearly 2 Weeks 3 People
Location 3 Yearly 2 Weeks 3 People
Location 4 Yearly 2 Weeks 3 People
Gloucester Island Yearly 2 Weeks 3 People
Hayman Island Yearly 2 Weeks 3 People
Translocation Site 1 Yearly 2 Weeks 3 People
Translocation Site 2 Yearly 2 Weeks 3 People
Hayman Island
Conduct adaptive fire management to maintain Proserpine rock wallaby habitat
To maintain suitable habitat for the species, ongoing dialogue and cooperative assistance will have to be maintained with the island staff. The current fire management plan will need to be reviewed by DERM and Hayman Island Resort.
Yearly 2 Weeks 5 People
AllProtect habitat by declaring new reserves or conservation areas
Little of the rock wallaby's habitat is protected within reserves. Sufficient habitat will be required to ensure the ongoing security of the species.
Once 1 Year 2 People

169
Action Plan for Threatened Macropods 2011-2021
Subpopulation Action Rationale Frequency Duration Effort
All
Identify unreserved Proserpine rock wallaby habitat on private land and run extension program to engage landholders to better manage or reserve land
With high densities occurring on or adjacent to private land, it is important that property owners manage remaining vegetation to allow the continued existence of the species. The awareness of local residents, developers and local government employees about the issues facing Proserpine rock wallabies is seen as an important step in facilitating the recovery actions for the species, given its proximity to urban and developing areas.
Yearly 1 Year 1 Person
Mainland subpopulationsContinue to implement Rural Feral and Stray Cat Management Plan
Domestic and feral cats spread Toxoplasmosis gondii which has been documented to cause blindness and death in rock-wallabies.
Yearly 2 Months 1 Person
Mainland subpopulations
Continue to implement Whitsunday Regional Council dog registration program
The residential development boom has led to an increase in domestic dogs and cats within and adjacent to habitat areas. This has led to an increase in the number of dog attacks and fatalities on rock-wallabies.
Yearly 2 Months 1 Person
Mainland subpopulationsPromote fencing and dog control in and adjacent to wallaby habitat.
Yearly 2 Weeks 1 Person
Mainland subpopulationsRestrict dog access in areas of known PRW habitat
Once 3 Months 1 Person
Mainland subpopulationsMap areas suitable for 1080 use, and develop wild dog control program
Control of feral dogs is presently difficult due to limitations placed on where registered poisons (1080) can be utilised. This is primarily due to the proximity of large areas of Proserpine rock wallaby habitat to expanding residential developments. Feral dogs which have crossbred with dingoes are also present in habitat areas and have been responsible for rock wallaby mortalities. Hydatids, a type of cyst formed by tapeworm larvae, may also be contracted from dogs and has proven fatal for the Proserpine rock wallaby.
Once 2 Months 1 Person
Location 1
Implement feral animal control program targeting wild dogs
3-Monthly 2 Weeks 4 People
Location 2 3-Monthly 2 Weeks 4 People
Location 3 3-Monthly 2 Weeks 4 People
Location 4 3-Monthly 2 Weeks 4 People
Island subpopulations
Prevent entry or establishment of cats and dogs to islands where Proserpine rock wallabies exist
Islands represent predator-free areas for the species, and the introduction of dogs and cats could prove disastrous for rock wallaby populations.
6-Monthly 2 Weeks 1 Person
Gloucester IslandDevelop and implement weed control strategy on Gloucester Island
The propagation of introduced toxic plants poses a serious threat to the Proserpine rock wallaby which is known to graze in household gardens, especially during the drier months. Invasion of palatable toxic species such as pink periwinkle (Catharanthus roseus) into habitat areas on Gloucester Island may pose a considerable poisoning threat.
Yearly 2 Weeks 3 People
Urban areas surrounding known subpopulations
Replace toxic plants with native plants in domestic and government garden areas
Yearly 1 Month 1 Person
Shute Harbour Rd, Mandalay Road and Staniland Drive
Spray guinea grass on road verges
Yearly 2 Weeks 1 Person

170
Action Plan for Threatened Macropods 2011-2021
Subpopulation Action Rationale Frequency Duration Effort
AllUse 1.5m diameter culverts under new roads
Urban development has also led to roads being constructed through areas of Proserpine rock wallaby habitat, resulting in road kills. The mortality of rock wallabies usually peaks during the dry season, from September to November, as green pick in the bush becomes less available and animals wander to roadside verges to feed. Given increasing residential development and traffic volume, this could significantly impact on populations. Most road deaths occur where road speeds are of 80km/h or greater and/or where there is feeding areas in close proximity to roads.
Unknown 1 Day 2 People
Urban subpopulations
Conduct research to determine home range for colonies in close proximity to residential expansion
Knowledge of the rock wallabies’ movement could aid future management decisions, including the placement of new roads and housing developments.
Once 1 Year 1 Person
All
Map the distribution of Toxoplasmosis gondii and hydatidosis in the Proserpine rock wallaby population
Little is known about the impacts of these diseases on the Proserpine rock wallaby, and any resulting mortality.
Once 1 Year 1 Person
All
Study the interactions between the Proserpine rock wallaby and the unadorned rock wallaby where populations are adjacent.
Little is known about the level of competition for resources between these species. Interbreeding may also be an ongoing concern.
Once 1 Year 1 Person
New subpopulations
Identify sites for translocation or reintroduction based on habitat mapping and/or on-ground assessment
In order to achieve an increase in area of occupancy and extent of occurrence, new or previously occupied sites will need to be identified, secured, and used as translocation sites. Hayman Island may become a suitable source of Proserpine rock wallabies to be translocated to the mainland.
Once 6 Months 1 Person
Translocation Site 1Establish secure areas of habitat for future translocations, including any necessary fencing and predator/weed removal
Once 6 Months 4 People
Translocation Site 2 Once 6 Months 4 People
Translocation Site 1 Translocation of Proserpine rock wallabies to secure and managed areas of habitat
Once 3 Weeks 5 People
Translocation Site 2 Once 3 Weeks 5 People
Translocation Site 1 Ongoing management of translocated subpopulations, including resource supplementation as required
Monthly 1 Day 2 People
Translocation Site 2 Monthly 1 Day 2 People
All
Incorporate updated habitat knowledge into plans for habitat continuity under potential climate change scenarios
The current recovery plan has identified future climate change as a potential threat to the species. The cross-over of boundaries of various species of Petrogale in Queensland may be influenced by climate.
3-Yearly 3 Months 1 Person

171
Action Plan for Threatened Macropods 2011-2021
Tab
le 4
2: L
ist o
f rec
over
y ac
tion
s fo
r Pe
trog
ale
pers
epho
ne, a
nd t
heir
cos
ts
Su
bp
op
ula
tio
nA
ctio
nY
ear
1#Y
ear
2Y
ear
3Y
ear
4Y
ear
5Y
ear
6Y
ear
7Y
ear
8Y
ear
9Y
ear
10
All
Proj
ect c
oord
inat
or m
anag
es p
roje
ct
$100
,000
$103
,000
$106
,090
$109
,273
$112
,551
$115
,927
$119
,405
$122
,987
$126
,677
$130
,477
All
Stat
us a
sses
smen
t - d
istr
ibut
ion
and
abun
danc
e.
Incl
udes
sur
veys
of k
now
n su
bpop
ulat
ions
$60,
000
$0$0
$65,
564
$0$0
$71,
644
$0$0
$78,
287
All
Stat
us a
sses
smen
t - g
enet
ics
$30,
000
$0$0
$0$3
3,76
5$0
$0$0
$0$3
9,14
3
All
Stat
us a
sses
smen
t - m
ost i
mpo
rtan
t su
bpop
ulat
ions
for m
anag
emen
t, an
d th
e th
reat
s fa
cing
them
. Inc
lude
s id
enti
ficat
ion
of a
reas
su
bjec
t to
graz
ing,
wee
ds o
r fire
.
$0$0
$0$0
$0$0
$0$0
$0$0
Unc
onfir
med
or s
uspe
cted
su
bpop
ulat
ions
Surv
ey to
con
firm
roc
k w
alla
by p
rese
nce
$45,
000
$46,
350
$47,
741
$49,
173
$50,
648
$0$0
$0$0
$0
All
Man
age
spec
ies
data
to in
form
ada
ptiv
e m
anag
emen
t. In
clud
es 5
yea
r pro
gram
rev
iew
.$0
$0$0
$0$2
0,00
0*$0
$0$0
$0$2
2,51
5*
All
Upd
ate
spec
ies
habi
tat m
appi
ng$1
0,00
0$0
$0$0
$11,
255
$0$0
$0$0
$13,
048
All
Rev
iew
of t
rans
loca
tion
s, a
nd s
ucce
ss a
nd fa
ilure
fa
ctor
s$0
$0$0
$0$0
$0$0
$0$0
$0
All
Dev
elop
/refi
ne m
onito
ring
pro
toco
ls fo
r the
sp
ecie
s, in
clud
ing
trap
ping
, sat
ellit
e co
llars
and
ca
mer
a tr
aps,
and
to m
onito
r hab
itat
and
thre
ats
$0$0
$0$0
$0$0
$0$0
$0$0
Loc
atio
n 1
Impl
emen
t mon
itori
ng p
roto
cols
for s
peci
es
acti
vity
, pre
dato
r act
ivit
y, r
oad
inte
ract
ions
, and
ef
fect
iven
ess
of m
anag
emen
t int
erve
ntio
n.
$30,
000
$30,
900
$31,
827
$32,
782
$33,
765
$34,
778
$35,
822
$36,
896
$38,
003
$39,
143
Loc
atio
n 2
$20,
000
$20,
600
$21,
218
$21,
855
$22,
510
$23,
185
$23,
881
$24,
597
$25,
335
$26,
095
Loc
atio
n 3
$20,
000
$20,
600
$21,
218
$21,
855
$22,
510
$23,
185
$23,
881
$24,
597
$25,
335
$26,
095
Loc
atio
n 4
$15,
000
$15,
450
$15,
914
$16,
391
$16,
883
$17,
389
$17,
911
$18,
448
$19,
002
$19,
572
Glo
uces
ter I
slan
d$3
0,00
0$3
0,90
0$3
1,82
7$3
2,78
2$3
3,76
5$3
4,77
8$3
5,82
2$3
6,89
6$3
8,00
3$3
9,14
3
Hay
man
Isla
nd$2
0,00
0$2
0,60
0$2
1,21
8$2
1,85
5$2
2,51
0$2
3,18
5$2
3,88
1$2
4,59
7$2
5,33
5$2
6,09
5
Tran
sloc
atio
n Si
te 1
$15,
000
$15,
450
$15,
914
$16,
391
$16,
883
$17,
389
$17,
911
$18,
448
$19,
002
$19,
572
Tran
sloc
atio
n Si
te 2
$15,
000
$15,
450
$15,
914
$16,
391
$16,
883
$17,
389
$17,
911
$18,
448
$19,
002
$19,
572

172
Action Plan for Threatened Macropods 2011-2021
Su
bp
op
ula
tio
nA
ctio
nY
ear
1#Y
ear
2Y
ear
3Y
ear
4Y
ear
5Y
ear
6Y
ear
7Y
ear
8Y
ear
9Y
ear
10
Loc
atio
n 1
Impl
emen
t mon
itori
ng p
roto
cols
for w
eed
cont
rol
and
habi
tat c
ondi
tion
, and
eff
ecti
vene
ss o
f m
anag
emen
t int
erve
ntio
n.
$15,
000
$15,
450
$15,
914
$16,
391
$16,
883
$17,
389
$17,
911
$18,
448
$19,
002
$19,
572
Loc
atio
n 2
$10,
000
$10,
300
$10,
609
$10,
927
$11,
255
$11,
593
$11,
941
$12,
299
$12,
668
$13,
048
Loc
atio
n 3
$10,
000
$10,
300
$10,
609
$10,
927
$11,
255
$11,
593
$11,
941
$12,
299
$12,
668
$13,
048
Loc
atio
n 4
$10,
000
$10,
300
$10,
609
$10,
927
$11,
255
$11,
593
$11,
941
$12,
299
$12,
668
$13,
048
Glo
uces
ter I
slan
d$1
5,00
0$1
5,45
0$1
5,91
4$1
6,39
1$1
6,88
3$1
7,38
9$1
7,91
1$1
8,44
8$1
9,00
2$1
9,57
2
Hay
man
Isla
nd$1
0,00
0$1
0,30
0$1
0,60
9$1
0,92
7$1
1,25
5$1
1,59
3$1
1,94
1$1
2,29
9$1
2,66
8$1
3,04
8
Tran
sloc
atio
n Si
te 1
$10,
000
$10,
300
$10,
609
$10,
927
$11,
255
$11,
593
$11,
941
$12,
299
$12,
668
$13,
048
Tran
sloc
atio
n Si
te 2
$10,
000
$10,
300
$10,
609
$10,
927
$11,
255
$11,
593
$11,
941
$12,
299
$12,
668
$13,
048
Hay
man
Isla
ndC
ondu
ct a
dapt
ive
fire
man
agem
ent t
o m
aint
ain
Pros
erpi
ne r
ock
wal
laby
hab
itat
$50,
000
$51,
500
$53,
045
$54,
636
$56,
275
$57,
964
$59,
703
$61,
494
$63,
339
$65,
239
All
Prot
ect h
abit
at b
y de
clar
ing
new
res
erve
s or
co
nser
vati
on a
reas
$0$0
$0$0
$0$0
$0$0
$0$0
All
Iden
tify
unr
eser
ved
Pros
erpi
ne r
ock
wal
laby
ha
bita
t and
run
ext
ensi
on p
rogr
am to
eng
age
land
hold
ers
to b
ette
r man
age
or r
eser
ve la
nd$0
$10,
000
$120
,000
$123
,600
$127
,308
$131
,127
$135
,061
$139
,113
$143
,286
$147
,585
Mai
nlan
d su
bpop
ulat
ions
Con
tinu
e to
impl
emen
t Rur
al F
eral
and
Str
ay C
at
Man
agem
ent P
lan
$5,0
00$5
,150
$5,3
05$5
,464
$5,6
28$5
,796
$5,9
70$6
,149
$6,3
34$6
,524
Mai
nlan
d su
bpop
ulat
ions
Con
tinu
e to
impl
emen
t Whi
tsun
day
Reg
iona
l C
ounc
il do
g re
gist
rati
on p
rogr
am$5
,000
$5,1
50$5
,305
$5,4
64$5
,628
$5,7
96$5
,970
$6,1
49$6
,334
$6,5
24
Mai
nlan
d su
bpop
ulat
ions
Prom
ote
fenc
ing
and
dog
cont
rol i
n an
d ad
jace
nt
to w
alla
by h
abit
at.
$2,0
00$2
,060
$2,1
22$2
,185
$2,2
51$2
,319
$2,3
88$2
,460
$2,5
34$2
,610
Mai
nlan
d su
bpop
ulat
ions
Res
tric
t dog
acc
ess
in a
reas
of k
now
n Pr
oser
pine
ro
ck w
alla
by h
abit
at$1
0,00
0$0
$0$0
$11,
255
$0$0
$0$0
$0
Mai
nlan
d su
bpop
ulat
ions
Map
are
as s
uita
ble
for 1
080
use,
and
dev
elop
wild
do
g co
ntro
l pro
gram
$0$1
5,00
0$1
0,00
0$0
$0$0
$0$0
$0$0
Loc
atio
n 1
Impl
emen
t fer
al a
nim
al c
ontr
ol p
rogr
am ta
rget
ing
wild
dog
s
$50,
000
$51,
500
$53,
045
$54,
636
$56,
275
$57,
964
$59,
703
$61,
494
$63,
339
$65,
239
Loc
atio
n 2
$40,
000
$41,
200
$42,
436
$43,
709
$45,
020
$46,
371
$47,
762
$49,
195
$50,
671
$52,
191
Loc
atio
n 3
$40,
000
$41,
200
$42,
436
$43,
709
$45,
020
$46,
371
$47,
762
$49,
195
$50,
671
$52,
191
Loc
atio
n 4
$40,
000
$41,
200
$42,
436
$43,
709
$45,
020
$46,
371
$47,
762
$49,
195
$50,
671
$52,
191
Isla
nd s
ubpo
pula
tion
sPr
even
t ent
ry o
r est
ablis
hmen
t of c
ats
and
dogs
to
isla
nds
whe
re P
rose
rpin
e ro
ck w
alla
bies
exi
st$1
0,00
0$1
0,30
0$1
0,60
9$1
0,92
7$1
1,25
5$1
1,59
3$1
1,94
1$1
2,29
9$1
2,66
8$1
3,04
8
Glo
uces
ter I
slan
dD
evel
op a
nd im
plem
ent w
eed
cont
rol s
trat
egy
on
Glo
uces
ter I
slan
d$5
,000
$40,
000
$41,
200
$42,
436
$43,
709
$45,
020
$15,
000
$15,
450
$15,
914
$16,
391
Urb
an a
reas
sur
roun
ding
kn
own
subp
opul
atio
nsR
epla
ce to
xic
plan
ts w
ith
nati
ve p
lant
s in
dom
esti
c an
d go
vern
men
t gar
den
area
s$5
,000
$10,
000
$10,
300
$10,
609
$10,
927
$11,
255
$11,
593
$11,
941
$12,
299
$12,
668

173
Action Plan for Threatened Macropods 2011-2021
Su
bp
op
ula
tio
nA
ctio
nY
ear
1#Y
ear
2Y
ear
3Y
ear
4Y
ear
5Y
ear
6Y
ear
7Y
ear
8Y
ear
9Y
ear
10
Shut
e H
arbo
ur R
d, M
anda
lay
Roa
d an
d St
anila
nd D
rive
Spra
y gu
inea
gra
ss o
n ro
ad v
erge
s$1
5,00
0$1
5,45
0$1
5,91
4$1
6,39
1$1
6,88
3$1
7,38
9$1
7,91
1$1
8,44
8$1
9,00
2$1
9,57
2
All
Use
1.5
m d
iam
eter
cul
vert
s un
der n
ew r
oads
$0$0
$0$0
$50,
000
$0$0
$0$0
$0
Urb
an s
ubpo
pula
tion
sC
ondu
ct r
esea
rch
to d
eter
min
e ho
me
rang
e fo
r col
onie
s in
clo
se p
roxi
mit
y to
res
iden
tial
ex
pans
ion
$0$2
0,00
0$2
0,60
0$2
1,21
8$0
$0$0
$0$0
$0
All
Map
the
dist
ribu
tion
of T
oxop
lasm
osis
gon
dii
and
hyda
tido
sis
in th
e Pr
oser
pine
roc
k w
alla
by
popu
lati
on$0
$30,
000
$30,
900
$31,
827
$0$0
$0$0
$0$0
All
Stud
y th
e in
tera
ctio
ns b
etw
een
the
Pros
erpi
ne
rock
wal
laby
and
the
unad
orne
d ro
ck w
alla
by
whe
re p
opul
atio
ns a
re a
djac
ent.
Com
peti
tion
for
reso
urce
s an
d in
terb
reed
ing
are
the
key
issu
es.
$0$2
5,00
0$2
5,75
0$2
6,52
3$0
$0$0
$0$0
$0
New
sub
popu
lati
ons
Iden
tify
site
s fo
r tra
nslo
cati
on o
r rei
ntro
duct
ion
base
d on
hab
itat
map
ping
and
/or o
n-gr
ound
as
sess
men
t$0
$0$0
$10,
000
$10,
300
$0$0
$0$0
$0
Tran
sloc
atio
n Si
te 1
Est
ablis
h se
cure
are
as o
f hab
itat
for f
utur
e tr
ansl
ocat
ions
, inc
ludi
ng a
ny n
eces
sary
fenc
ing
and
pred
ator
/wee
d re
mov
al$0
$0$0
$0$0
$60,
000
$20,
000
$0$0
$0
Tran
sloc
atio
n Si
te 2
$0$0
$0$0
$0$8
0,00
0$3
0,00
0$0
$0$0
Tran
sloc
atio
n Si
te 1
Tran
sloc
atio
n of
Pro
serp
ine
rock
wal
labi
es to
se
cure
and
man
aged
are
as o
f hab
itat
$0$0
$0$0
$0$0
$50,
000
$0$0
$0
Tran
sloc
atio
n Si
te 2
$0$0
$0$0
$0$0
$50,
000
$0$0
$0
Tran
sloc
atio
n Si
te 1
Ong
oing
man
agem
ent o
f tra
nslo
cate
d su
bpop
ulat
ions
, inc
ludi
ng r
esou
rce
supp
lem
enta
tion
as
requ
ired
$0$0
$0$0
$0$0
$30,
000
$30,
900
$31,
827
$32,
782
Tran
sloc
atio
n Si
te 2
$0$0
$0$0
$0$0
$30,
000
$30,
900
$31,
827
$32,
782
All
Inco
rpor
ate
upda
ted
habi
tat k
now
ledg
e in
to p
lans
fo
r hab
itat
con
tinu
ity
unde
r pot
enti
al c
limat
e ch
ange
sce
nari
os$0
$0$0
$0$0
$15,
000
$15,
450
$15,
914
$0$0
YE
AR
LY
TO
TA
LS
$777
,000
$826
,710
$955
,761
$1,0
49,6
98$1
,057
,979
$1,0
51,8
78$1
,189
,508
$996
,900
$1,0
10,4
16$1
,193,
721
GR
AN
D T
OT
AL
$10
,10
9,5
71
#Not
e th
at a
n in
dex
of 3
% h
as b
een
appl
ied
to e
ach
succ
essi
ve y
ear o
f fun
ding
to a
ccou
nt fo
r CP
I
*Inc
lude
s 5-
year
pro
gram
revi
ew

174
Action Plan for Threatened Macropods 2011-2021
Recovery Outline - Petrogale sharmani
1. Family Macropodidae
2. Scientific name: Petrogale sharmani (Eldridge & Close, 1992)
3. Common name: Mountain claro rock wallaby, Sharman’s rock wallaby
4. Conservation status (IUCN): Near Threatened
5. Reasons for listing
IUCN Red List
Listed as Near Threatened because its extent of occurrence is less than 20,000 km2, and there is concern over threats from introduced herbivores, which may have an effect on the species. However, the species’ habitat and populations are not very fragmented and there is currently no decline in numbers or in quality or extent of habitat. Almost qualifies as threatened under criterion B1 (Winter et al. 2008).
6. Infraspecific Taxa
6.1 None.
7. Range and abundance
Figure 19: Known distribution of Petrogale sharmani from the 2008 Global Mammal Assessment (IUCN 2010; Landsat imagery ©Commonwealth of Australia - Geoscience Australia).
Endemic to the Seaview and Coane Ranges, west of Ingham in north-eastern Queensland, Australia. It is common within its restricted range.
8. Habitat
Rocky outcrops, boulder piles, gorges, cliff lines, and rocky slopes.
9. Threats
9.1 Habitat loss due to development.
9.2 Competition from domestic and wild introduced herbivores.
9.3 Increased pastoralism in the western part of its range.
9.4 Vulnerable to possible effects of climate change which may favour more populous species of rock-wallabies in adjacent regions.

175
Action Plan for Threatened Macropods 2011-2021
10. Information required
10.1 Surveys are needed to determine the distribution and status of the species across its range.
10.2 Populations should be identified for regular monitoring programmes.
10.3 Studies are needed to understand the species biology and ecology, especially to determine its interaction with introduced herbivores.
11. Recovery objectives
11.1 By 2021, Petrogale sharmani is eligible for listing as Least Concern according to IUCN Red List criteria.
11.2 By 2021, research, surveys and monitoring confirm the population trend of Petrogale sharmani as stable.
11.3 By 2021, research has confirmed the impacts of grazing competition and increased pastoralism on Petrogale sharmani, and where competition presents a threat to P. sharmani subpopulations, management plans have been developed and are being implemented to mitigate those threats.
11.4 By 2021, the geographic range of Petrogale sharmani in the form of extent of occurrence is greater than 20,000 km2, with subpopulations secure* at greater than 10 locations within that range, thus making it ineligible to qualify as Vulnerable under IUCN criteria B15.
11.5 By 2021, the genetic diversity of Petrogale sharmani has been maintained at known 2011 levels.
12. Actions completed or underway
12.1 None.
13. Management actions required
13.1 Status assessment of the species, including genetics, abundance, distribution, trend and threats.
13.2 Manage data to inform adaptive management.
13.3 Implement monitoring protocols, including, grazing, habitat condition, predation and predator activity, and species activity.
13.4 Research into the species’ ecology and biology, particularly its interaction with competitors and predators.
13.5 Reserve suitable habitat for the species.
13.6 Habitat assessment and modelling to determine current habitat condition and possibilities for future range expansion.
13.7 Implement management actions once priority actions and subpopulations have been identified.
13.8 Identify sites for translocation or reintroduction based on habitat mapping and/or on-ground assessment.
13.9 Establish and manage secure areas of habitat for future translocations.
13.10 Translocation of species to secure and managed areas of habitat.
13.11 Ongoing management of translocated subpopulations.
14. Organisations responsible for conservation of species
14.1 Department of Environment and Resource Management (DERM), Queensland.
15. Other organisations involved
15.1 None.
16. Staff and other resources required for recovery to be carried out
16.1 No dedicated staff required.
17. Action costs
17.1 Total cost over 10 years exceeds A$3.7 million.
18. Notes
18.1 None.
19. References
IUCN (2010) IUCN Red List of Threatened Species. Version 2010.3. http://www.iucnredlist.org. Accessed 28 September 2010.
Winter, J., Burnett, S. & Martin, R. 2008. Petrogale sharmani. In: IUCN 2010. IUCN Red List of Threatened Species. Version 2010.3 http://www.iucnredlist.org/apps/redlist/details/16753/0. Accessed 28 September 2010.
20. Comments received
20.1 None.
15 This objective may not be possible, given the current estimated extent of occurrence of ~2000 km2. One solution would be to establish a secure subpopulation far outside the species’ current distribution.

176
Action Plan for Threatened Macropods 2011-2021
Table 43: List of recovery actions for Petrogale sharmani, and the rationale for their contribution to recovery, and effort required.
Subpopulation Action Rationale Frequency Duration Effort
All
Status assessment of distribution and abundance, including surveys Whilst the species is relatively secure,
information is required to assess those subpopulations most at risk from a range of threats, and to ensure that genetic stock is maintained.
3-Yearly 3 Months 3 People
AllStatus assessment of genetic diversity
5-Yearly 2 Months 3 People
All
Assessment of grazing competition and altered fire regimes as threats to the species.
Once 2 Years 1 Person
All
Conduct research into species biology, ecology and conservation requirements.
Very little is known of the species, and the research is important to better understand its conservation needs.
Once 2 Years 2 People
AllHabitat modelling to assess suitability for range expansion.
To qualify for Least concern, the species range in the form of extent of occurrence may need to be expanded, and an understanding of potential habitat surrounding extant subpopulations will be required.
Once 2 Years 1 Person
AllManage data to inform adaptive management.
Good data management is essential to making it possible to extract the maximum amount of information from monitoring data.
6-Monthly 1 Week 1 Person
All
Implement monitoring protocols for species activity, predator activity, and effectiveness of management intervention. Monitoring is essential to ensure
adaptive management and achieving the species objectives
6-Monthly 2 Weeks 4 People
All
Implement monitoring protocols for fire and grazing management and habitat condition, and effectiveness of management intervention.
Yearly 1 Month 5 People
AllReserve suitable habitat for the species.
Little of the species' habitat is protected within reserves. Sufficient habitat will be required to ensure the ongoing security of the species.
Once Unknown 2 People
All
Implement management actions once priority actions and subpopulations have been identified.
The nature of required management actions is as yet unknown.
Yearly Unknown 5 People
New subpopulation
Identify sites for translocation or reintroduction based on habitat mapping and/or on-ground assessment
In order to achieve an increase in area of occupancy and extent of occurrence, new or previously occupied sites will need to be identified, secured, and used as translocation sites.
Once 6 Months 1 Person
Translocation Site 1
Establish secure areas of habitat for future translocations, including any necessary fencing and predator/weed removal
Once 6 Months 4 People
Translocation of P. sharmani to secure and managed areas of habitat
Once 3 Weeks 5 People
Ongoing management of translocated subpopulations, including resource supplementation as required.
Monthly 1 Day 2 People

177
Action Plan for Threatened Macropods 2011-2021
Tab
le 4
4: L
ist o
f rec
over
y ac
tion
s fo
r Pe
trog
ale
shar
man
i, an
d th
eir
cost
s
Su
bp
op
ula
tio
nA
ctio
nY
ear
1#Y
ear
2Y
ear
3Y
ear
4Y
ear
5Y
ear
6Y
ear
7Y
ear
8Y
ear
9Y
ear
10
All
Stat
us a
sses
smen
t of d
istr
ibut
ion
and
abun
danc
e,
incl
udin
g su
rvey
s$6
0,00
0$0
$0$6
5,56
4$0
$0$7
1,64
4$0
$0$7
8,28
7
All
Stat
us a
sses
smen
t of g
enet
ic d
iver
sity
$30,
000
$0$0
$0$3
3,76
5$0
$0$0
$0$3
9,14
3
All
Ass
essm
ent o
f gra
zing
com
peti
tion
and
alte
red
fire
regi
mes
as
thre
ats
to th
e sp
ecie
s.$0
$0$6
0,00
0$6
1,80
0$6
3,65
4$0
$0$0
$0$0
All
Con
duct
res
earc
h in
to s
peci
es b
iolo
gy, e
colo
gy a
nd
cons
erva
tion
req
uire
men
ts.
$0$0
$30,
000
$30,
900
$31,
827
$0$0
$0$0
$0
All
Hab
itat
mod
ellin
g to
ass
ess
suit
abili
ty fo
r ran
ge
expa
nsio
n.$0
$0$3
0,00
0$3
0,90
0$3
1,82
7$0
$0$0
$0$0
All
Man
age
data
to in
form
ada
ptiv
e m
anag
emen
t.$5
,000
$5,1
50$5
,305
$5,4
64$2
5,62
8*$5
,796
$5,9
70$6
,149
$6,3
33$2
6,52
3*
All
Impl
emen
t mon
itori
ng p
roto
cols
for s
peci
es
acti
vity
, pre
dato
r act
ivit
y, a
nd e
ffec
tive
ness
of
man
agem
ent i
nter
vent
ion.
$60,
000
$61,
800
$63,
654
$65,
564
$67,
531
$69,
556
$71,
643
$73,
792
$76,
006
$78,
286
All
Impl
emen
t mon
itori
ng p
roto
cols
for fi
re a
nd
graz
ing
man
agem
ent a
nd h
abit
at c
ondi
tion
, and
ef
fect
iven
ess
of m
anag
emen
t int
erve
ntio
n.$3
0,00
0$3
0,90
0$3
1,82
7$3
2,78
2$3
3,76
5$3
4,77
8$3
5,82
2$3
6,89
6$3
8,00
3$3
9,14
3
All
Res
erve
sui
tabl
e ha
bita
t for
the
spec
ies.
$0$1
25,0
00$1
28,7
50$1
32,6
13$1
36,5
91$0
$0$0
$0$0
All
Impl
emen
t man
agem
ent a
ctio
ns o
nce
prio
rity
ac
tion
s an
d su
bpop
ulat
ions
hav
e be
en id
enti
fied.
$0$1
00,0
00$1
03,0
00$1
06,0
90$1
09,2
73$1
12,5
51$1
15,9
27$1
19,4
05$1
22,9
87$1
26,6
77
New
sub
popu
lati
onId
enti
fy s
ites
for t
rans
loca
tion
or r
eint
rodu
ctio
n ba
sed
on h
abit
at m
appi
ng a
nd/o
r on-
grou
nd
asse
ssm
ent
$0$0
$0$1
0,00
0$1
0,30
0$0
$0$0
$0$0
Tran
sloc
atio
n Si
te 1
Est
ablis
h se
cure
are
as o
f hab
itat
for f
utur
e tr
ansl
ocat
ions
, inc
ludi
ng a
ny n
eces
sary
fenc
ing
and
pred
ator
/wee
d re
mov
al$0
$0$0
$0$0
$120
,000
$20,
000
$0$0
$0
Tran
sloc
atio
n of
P. s
harm
ani t
o se
cure
and
m
anag
ed a
reas
of h
abit
at$0
$0$0
$0$0
$0$5
0,00
0$0
$0$0
Ong
oing
man
agem
ent o
f tra
nslo
cate
d su
bpop
ulat
ions
, inc
ludi
ng r
esou
rce
supp
lem
enta
tion
as
requ
ired
.$0
$0$0
$0$0
$0$3
0,00
0$3
0,90
0$3
1,82
7$3
2,78
2
YE
AR
LY
TO
TA
LS
$185
,000
$322
,850
$452
,536
$541
,676
$544
,160
$342
,682
$401
,00
6$2
67,1
43$2
75,1
57$4
20,8
41
GR
AN
D T
OT
AL
$3,7
53,0
50
#Not
e th
at a
n in
dex
of 3
% h
as b
een
appl
ied
to e
ach
succ
essi
ve y
ear o
f fun
ding
to a
ccou
nt fo
r CP
I
*Inc
lude
s 5-
year
pro
gram
revi
ew

178
Action Plan for Threatened Macropods 2011-2021
Recovery Outline - Petrogale xanthopus
1. Family Macropodidae
2. Scientific name: Petrogale xanthopus (Gray, 1855)
3. Common name: Yellow-footed rock wallaby, Ring-tailed rock wallaby
4. Conservation status (IUCN): Near Threatened
5. Reasons for listing
Listed as Near Threatened because its extent of occurrence is probably not much greater than 20,000 km2 and is highly fragmented, its habitat is declining in much of its range, and its population is likely to be less than 10,000 mature individuals, making the species close to qualifying for Vulnerable under criterion B1b(iii) (Copley et al. 2008).
Listed as Vulnerable under the EPBC Act 1999 (DEWHA 2010).
6. Infraspecific Taxa
6.1 Petrogale xanthopus xanthopus - Flinders Ranges, Gawler Ranges and Olary Hills, SA; Gap and Coturaundee Ranges, NSW. Vulnerable on the EPBC Act 1999 (DEWHA 2010).
6.2 Petrogale xanthopus celeris- Gowan, Grey, Cheviot, Yangang and Macedon Ranges, bounded by Adavale. Not listed on the EPBC Act 1999 (DEWHA 2010).
7. Range and abundance
This species is endemic to Australia, where it has a highly disjunct and patchy distribution in South Australia, New South Wales and Queensland.
In South Australia, colonies persist in the Gawler Ranges, Flinders Ranges and Olary Hills. At least 24 colonies are known to have become extinct in South Australia. Most of these represent at least half of the known colonies in the Olary Hills and Gawler Ranges regions (DEH 2008).
Figure 20: Known distribution of Petrogale xanthopus from the 2008 Global Mammal Assessment (IUCN 2010; Landsat imagery ©Commonwealth of Australia - Geoscience Australia).
In NSW, colonies have been found at three localities in the Gap Range and seven localities in the Cotauraundee Range (Lim & Giles 1987). No populations are known to remain outside these areas
179
Action Plan for Threatened Macropods 2011-2021
(Maxwell et al. 1996). These colonies are thought to be the remnants of larger and more widespread populations (Sharman et al. 1998).
The population of Yellow-footed Rock Wallabies fluctuates depending on rainfall. There are estimated to be less than 10,000 mature individuals in the wild. A large section of the species range in South Australia has been surveyed (most years from 1993-2008), indicating that there are on the order of 6,000 individuals currently in South Australia. There are less than 100 individuals in New South Wales and the size of the population in Queensland is unknown (Copley et al. 2008).
8. Habitat
This species inhabits rocky outcrops in semi-arid country. The rocky outcrops range from limestone, sandstone and conglomerates to granites and is often associated with permanent or semi-permanent water sources (Copley et al. 2008).
9. Threats
9.1 Predation from introduced foxes is the greatest threat
9.2 Predation by feral cats
9.3 Competition with domestic and introduced herbivores (particularly goats, rabbits, and sheep)
9.4 Wildfire
9.5 Habitat destruction
10. Information required
10.1 Further research into movements, home ranges and habitat use.
10.2 Impacts of predation.
10.3 Population ecology of browse species.
10.4 Interaction with other herbivores.
10.5 Water and nutritional requirements.
11. Recovery objectives
11.1 By 2021, Petrogale xanthopus is eligible for listing as Least Concern according to IUCN Red List criteria.
11.2 By 2021, the geographic range of Petrogale xanthopus in the form of extent of occurrence remains greater than 20,000 km2, with subpopulations secure at greater than 10 locations within that range.
11.3 By 2021, the total population of Petrogale xanthopus is estimated to number greater than 10,000 mature individuals.
11.4 By 2021, management plans have been developed and are being implemented to reduce the threats of low resource availability, introduced predators, fire and disease for key Petrogale xanthopus subpopulations.
11.5 By 2021, the genetic diversity of Petrogale xanthopus has been maintained at known 2011 levels.
12. Actions completed or underway
12.1 Reintroductions of captive-bred Yellow-footed Rock Wallabies to sites in Queensland and South Australia (Lapidge 2000, 2005).
12.2 Establishment of a feral animal control program that targets feral herbivores (goats and rabbits) and feral predators (cats and foxes) (Buckaringa Wildlife Sanctuary, AWC).
12.3 Controlling erosion, restoring native vegetation and natural springs (Buckaringa Wildlife Sanctuary, AWC).
12.4 Recovery is a major focus of Operation Bounceback in the Olary Hills, and the Flinders and Gawler Ranges (South Australia). These efforts have resulted in major population increases in the Olary Ranges and parts of the Flinders Ranges.
13. Management actions required
13.1 Status assessment of the species, including genetics, abundance, distribution, trend and risks. Calculate the long-term average size of monitored rock wallaby subpopulations.
13.2 Manage data to inform adaptive management.
13.3 Implement monitoring protocols, including grazing pressure, predation, and resource availability.
13.4 Review translocation of yellow-footed rock wallabies, including feasibility of future operations.
13.5 Maintain natural watering points (e.g. de-silting, removal of contaminants).
13.6 Identify and maintain artificial watering points of significance to yellow-footed rock wallabies outside reserves.

180
Action Plan for Threatened Macropods 2011-2021
13.7 Conduct competitor control operations for goats and rabbits in and around yellow-footed rock wallaby habitat, and increase during droughts and prolonged dry periods.
13.8 Decommission artificial watering points on reserves that are not required for yellow-footed rock wallabies but still support elevated populations of feral goats and euros.
13.9 Continue fox baiting, and increase baiting in response to an increase in predator sightings or predation incidents and during droughts.
13.10 Undertake aerial baiting in priority areas (as determined by status assessment), and those areas that are remote and difficult to access from the ground.
13.11 Develop and implement fire management plans for priority yellow-footed rock wallaby habitat.
13.12 Develop contingency plans for catastrophic events such as wildfires or major droughts.
13.13 Engage local landholders in management of yellow-footed rock wallaby habitat on private land.
13.14 Review mark-recapture sites.
14. Organisations responsible for conservation of species
14.1 Department of Environment and Heritage (DEH), South Australia.
14.2 Department of Environment, Climate Change and Water (DECCW), New South Wales.
14.3 Department of Environment and Resource Management (DERM), Queensland.
15. Other organisations involved
15.1 None.
16. Staff and other resources required for recovery to be carried out
16.1 A dedicated recovery coordinator is required to manage this complex recovery program.
17. Action costs
17.1 Total cost over 10 years exceeds A$20 million.
18. Notes
18.1 None.
19. References
IUCN (2010) IUCN Red List of Threatened Species. Version 2010.3. http://www.iucnredlist.org. Accessed 19 October 2010.
Copley, P, Ellis, M & van Weenen, J (2008) Petrogale xanthopus. In: IUCN (2010) IUCN Red List of Threatened Species. Version 2010.3. http://www.iucnredlist.org/apps/redlist/details/16750/0. Accessed 19 October 2010.
Department of Environment and Heritage (2008) Recovery Plan for the Yellow-Footed Rock-Wallaby - Petrogale xanthopus xanthopus (6th Draft). Department of Environment and Heritage, Adelaide.
Department of the Environment, Water, Heritage and the Arts (2010) Petrogale xanthopus xanthopus. In: Species Profile and Threats (SPRAT) Database. Department of the Environment, Water, Heritage and the Arts, Canberra. http://www.environment.gov.au/sprat. Accessed 26 October 2010.
Eldridge, MDB (2008) Yellow-footed rock wallaby, Petrogale xanthopus. In The Mammals of Australia (Eds. Van Dyck, S & Strahan, R).
Lapidge, SJ (2000) Dietary adaptation of reintroduced yellow-footed rock-wallabies, Petrogale xanthopus xanthopus (Marsupialia: Macropodidae), in the northern Flinders Ranges, South Australia. Wildlife Research 27: 195–201.
Lapidge, SJ (2005) Reintroduction increased vitamin E and condition in captive-bred yellow-footed rock wallabies Petrogale xanthopus. Oryx 39: 56-64.
20. Comments received
20.1 None.

181
Action Plan for Threatened Macropods 2011-2021
Table 45: List of recovery actions for Petrogale xanthopus, and the rationale for their contribution to recovery, and effort required.
Subpopulation Action Rationale Frequency Duration Effort
AllProject manager coordinates project
Current recovery actions are ad hoc and opportunistic, and the recovery program is of sufficient complexity to warrant a dedicated manager.
Yearly 1 Year 1 Person
South Australian subpopulations
Status assessment of the species - distribution and abundance, including ground survey and population monitoring
Whilst the species is relatively secure, information is required to assess those subpopulations most at risk from a range of threats, and to ensure that genetic stock is maintained.
3-Yearly 3 Months 5 People
New South Wales subpopulations
3-Yearly 2 Weeks 5 People
Queensland subpopulations 5-Yearly 2 Weeks 5 People
South Australian subpopulations
Annual helicopter surveys
The habitat occupied is extremely remote and rugged, and helicopter surveys are the most efficient means of assessing population trends.
Yearly 2 Weeks 3 People
New South Wales subpopulations
Yearly 1 Week 3 People
Queensland subpopulations Yearly 1 Week 3 People
South Australian subpopulations
Status assessment of the species - genetics
Whilst the species is relatively secure, information is required to assess those subpopulations most at risk from a range of threats, and to ensure that genetic stock is maintained.
5-Yearly 2 Months 3 People
New South Wales subpopulations
5-Yearly 2 Weeks 3 People
Queensland subpopulations 5-Yearly 2 Weeks 3 People
South Australian subpopulations
Status assessment of the species - identify important subpopulations, and those subject to specific threats including competition, drought and fire
5-Yearly 1 Month 2 People
New South Wales subpopulations
5-Yearly 1 Day 1 Person
Queensland subpopulations 5-Yearly 1 Day 1 Person
South Australian subpopulations Manage data to inform
adaptive management. Includes 5 year program review.
Good data management is essential to making it possible to extract the maximum amount of information from monitoring data.
3-Monthly 1 Week 1 Person
New South Wales subpopulations
3-Monthly 1 Day 1 Person
Queensland subpopulations 3-Monthly 1 Day 1 Person
South Australian subpopulations
Continue fox baiting on the ground
Due to their size, adult (6-8 kg), and particularly juvenile (>1 kg) Yellow-footed rock wallabies, are vulnerable to Fox (3-8 kg) predation. Foxes target juvenile Yellow-footed rock wallabies, and are the rock wallabies' main predator in the northern Flinders Ranges.
3-Monthly 2 Weeks 20 People
New South Wales subpopulations
3-Monthly 2 Weeks 5 People
Queensland subpopulations 3-Monthly 2 Weeks 5 People
South Australian subpopulations Conduct aerial fox baiting
for priority and difficult access sites
3-Monthly 2 Weeks 3 People
New South Wales subpopulations
3-Monthly 1 Week 2 People
Queensland subpopulations 3-Monthly 1 Week 2 People
South Australian subpopulations Increase fox baiting in
response to increased predation or predator sightings
Unknown 2 Weeks 20 People
New South Wales subpopulations
Unknown 2 Weeks 5 People
Queensland subpopulations Unknown 2 Weeks 5 People

182
Action Plan for Threatened Macropods 2011-2021
Subpopulation Action Rationale Frequency Duration Effort
South Australian subpopulations Control goats at
priority rock wallaby subpopulations
There is competition between goats and Yellow-footed rock wallabies for food, water and shelter. The diets of the two species overlap considerably. It is highly likely that competition for food resources during periods of scarcity has a significant impact on rock-wallaby numbers. There is also a dietary overlap between Yellow-footed rock wallabies and rabbits. Sheep are probably not major competitors for food. However, there is likely to be some affect of sheep grazing on the flats near ranges, which are important foraging areas for Yellow-footed rock wallabies.
6-Monthly 1 Month 10 People
New South Wales subpopulations
6-Monthly 2 Weeks 2 People
Queensland subpopulations 6-Monthly 2 Weeks 2 People
South Australian subpopulations Increase competitor
control during droughts and prolonged dry periods
Unknown 1 Month 10 People
New South Wales subpopulations
Unknown 2 Weeks 2 People
Queensland subpopulations Unknown 2 Weeks 2 People
South Australian subpopulations Control rabbits at
priority rock wallaby subpopulations
6-Monthly 2 Weeks 5 People
New South Wales subpopulations
6-Monthly 1 Week 2 People
Queensland subpopulations 6-Monthly 1 Week 2 People
South Australian subpopulations Maintain natural
watering points on public land
Yellow-footed rock wallabies are more sensitive to the influence of drought than larger macropod species, probably because the rock wallabies' smaller home range and degree of site fidelity limit their ability to locate scarce food and water sources during droughts.
Yearly 1 Month 2 People
New South Wales subpopulations
Yearly 1 Week 2 People
Queensland subpopulations Yearly 1 Week 2 People
South Australian subpopulations
Identify and maintain artificial watering points on private and public land that are significant for rock wallaby subpopulations
Yearly 1 Month 1 Person
New South Wales subpopulations
Yearly 1 Week 1 Person
Queensland subpopulations Yearly 1 Week 1 Person
South Australian subpopulations
Decommission artificial watering points that are not required for rock wallabies yet still support elevated numbers of goats and/or euros
There is competition between Goats and Yellow-footed Rock-wallabies for food, water and shelter. The diets of the two species overlap considerably. It is highly likely that competition for food resources during periods of scarcity has a significant impact on rock-wallaby numbers. There is also a dietary overlap between Yellow-footed Rock-wallabies and Rabbits. Sheep are probably not major competitors for food. However, there is likely to be some affect of sheep grazing on the flats near ranges, which are important foraging areas for Yellow-footed Rock-wallabies.
Once 2 Months 2 People
New South Wales subpopulations
Once 1 Month 1 Person
Queensland subpopulations Once 1 Month 1 Person
South Australian subpopulations Develop and implement
fire management plans for priority yellow-footed rock wallaby habitat
Most populations of Yellow-footed rock wallabies are at risk from wildfires, but fire has been identified as a particular threat to two populations. In the southern Flinders Ranges, higher fuel loads mean that the animals at Mt Remarkable and nearby Telowie Gorge are potentially at risk. A severe wildfire in the region could impact heavily on the isolated Gawler Ranges colonies.
Yearly 1 Month 10 People
New South Wales subpopulations
Yearly 2 Weeks 5 People
Queensland subpopulations Yearly 2 Weeks 5 People
South Australian subpopulations Develop contingency
plans for catastrophic events including wildfires and drought
Once 2 Weeks 1 Person
New South Wales subpopulations
Once 1 Week 1 Person
Queensland subpopulations Once 1 Week 1 Person

183
Action Plan for Threatened Macropods 2011-2021
Subpopulation Action Rationale Frequency Duration Effort
South Australian subpopulations Engage local landholders
in management of yellow-footed rock wallaby habitat on private land
Yellow-footed rock wallaby habitat extends onto private land, and management is required there to ensure consistent recovery results with efforts on public land.
Yearly 1 Year 2 People
New South Wales subpopulations
Yearly 1 Year 1 Person
Queensland subpopulations Yearly 1 Year 1 Person
South Australian subpopulations
Implement monitoring protocols, including grazing pressure, predation, water points and resource availability
A long-term consistent and cohesive approach to regular monitoring is essential to inform adaptive management strategies.
6-Monthly 1 Month 4 People
New South Wales subpopulations
6-Monthly 1 Month 2 People
Queensland subpopulations 6-Monthly 1 Month 2 People
All
Review translocation of yellow-footed rock wallabies, including feasibility of future operations
Translocations of wild and captive subpopulations will be crucial to the ongoing management of the species. Ensuring that any future translocations are undertaken under optimum conditions is essential for the success of the operations.
Once 1 Month 1 Person
AllReview current mark-recapture sites
Ensure that the most appropriate sites are used for mark-recapture studies.
Once 1 Month 1 Person

184
Action Plan for Threatened Macropods 2011-2021
Tab
le 4
6: L
ist o
f rec
over
y ac
tion
s fo
r Pe
trog
ale
xant
hopu
s, a
nd t
heir
cos
ts
Su
bp
op
ula
tio
nA
ctio
nY
ear
1#Y
ear
2Y
ear
3Y
ear
4Y
ear
5Y
ear
6Y
ear
7Y
ear
8Y
ear
9Y
ear
10
All
Proj
ect m
anag
er c
oord
inat
es p
roje
ct$1
00,0
00$1
03,0
00$1
06,0
90$1
09,2
73$1
12,5
51$1
15,9
27$1
19,4
05$1
22,9
87$1
26,6
77$1
30,4
77
Sout
h A
ustr
alia
n su
bpop
ulat
ions
Stat
us a
sses
smen
t of t
he s
peci
es -
dist
ribu
tion
an
d ab
unda
nce,
incl
udin
g gr
ound
sur
vey
and
popu
lati
on m
onito
ring
$60,
000
$0$0
$65,
564
$0$0
$71,
644
$0$0
$78,
287
New
Sou
th W
ales
su
bpop
ulat
ions
$30,
000
$0$0
$32,
782
$0$0
$35,
822
$0$0
$39,
144
Que
ensl
and
subp
opul
atio
ns$3
0,00
0$0
$0$3
2,78
2$0
$0$3
5,82
2$0
$0$3
9,14
4
Sout
h A
ustr
alia
n su
bpop
ulat
ions
Ann
ual h
elic
opte
r sur
veys
$150
,000
$51,
500
$53,
045
$54,
636
$56,
275
$57,
964
$59,
703
$61,
494
$63,
339
$65,
239
New
Sou
th W
ales
su
bpop
ulat
ions
$0$0
$0$0
$0$0
$0$0
$0$0
Que
ensl
and
subp
opul
atio
ns$0
$0$0
$0$0
$0$0
$0$0
$0
Sout
h A
ustr
alia
n su
bpop
ulat
ions
Stat
us a
sses
smen
t of t
he s
peci
es -
gene
tics
$30,
000
$0$0
$0$3
3,76
5$0
$0$0
$0$3
9,14
4
New
Sou
th W
ales
su
bpop
ulat
ions
$20,
000
$0$0
$0$2
2,51
0$0
$0$0
$0$2
6,09
5
Que
ensl
and
subp
opul
atio
ns$2
0,00
0$0
$0$0
$22,
510
$0$0
$0$0
$26,
095
Sout
h A
ustr
alia
n su
bpop
ulat
ions
Stat
us a
sses
smen
t of t
he s
peci
es -
iden
tify
im
port
ant s
ubpo
pula
tion
s, a
nd th
ose
subj
ect t
o sp
ecifi
c th
reat
s in
clud
ing
com
peti
tion
, dro
ught
an
d fir
e
$5,0
00$0
$0$0
$5,6
28$0
$0$0
$0$6
,524
New
Sou
th W
ales
su
bpop
ulat
ions
$5,0
00$0
$0$0
$5,6
28$0
$0$0
$0$6
,524
Que
ensl
and
subp
opul
atio
ns$5
,000
$0$0
$0$5
,628
$0$0
$0$0
$6,5
24
Sout
h A
ustr
alia
n su
bpop
ulat
ions
Man
age
data
to in
form
ada
ptiv
e m
anag
emen
t. In
clud
es 5
yea
r pro
gram
rev
iew
.
$0$0
$0$0
$25,
628*
$0$0
$0$0
$26,
523*
New
Sou
th W
ales
su
bpop
ulat
ions
$0$0
$0$0
$0$0
$0$0
$0$0
Que
ensl
and
subp
opul
atio
ns$0
$0$0
$0$0
$0$0
$0$0
$0
Sout
h A
ustr
alia
n su
bpop
ulat
ions
Con
tinu
e fo
x ba
itin
g on
the
grou
nd
$400
,000
$412
,000
$424
,360
$437
,091
$450
,204
$463
,710
$477
,621
$491
,950
$506
,708
$521
,909
New
Sou
th W
ales
su
bpop
ulat
ions
$100
,000
$103
,000
$106
,090
$109
,273
$112
,551
$115
,927
$119
,405
$122
,987
$126
,677
$130
,477
Que
ensl
and
subp
opul
atio
ns$1
00,0
00$1
03,0
00$1
06,0
90$1
09,2
73$1
12,5
51$1
15,9
27$1
19,4
05$1
22,9
87$1
26,6
77$1
30,4
77
Sout
h A
ustr
alia
n su
bpop
ulat
ions
Con
duct
aer
ial f
ox b
aiti
ng fo
r pri
orit
y an
d di
fficu
lt ac
cess
site
s
$100
,000
$103
,000
$106
,090
$109
,273
$112
,551
$115
,927
$119
,405
$122
,987
$126
,677
$130
,477
New
Sou
th W
ales
su
bpop
ulat
ions
$0$0
$0$0
$0$0
$0$0
$0$0
Que
ensl
and
subp
opul
atio
ns$0
$0$0
$0$0
$0$0
$0$0
$0

185
Action Plan for Threatened Macropods 2011-2021
Su
bp
op
ula
tio
nA
ctio
nY
ear
1#Y
ear
2Y
ear
3Y
ear
4Y
ear
5Y
ear
6Y
ear
7Y
ear
8Y
ear
9Y
ear
10
Sout
h A
ustr
alia
n su
bpop
ulat
ions
Incr
ease
fox
bait
ing
in r
espo
nse
to in
crea
sed
pred
atio
n or
pre
dato
r sig
htin
gs
$0$5
0,00
0$0
$0$5
4,63
6$0
$0$5
9,70
2$0
$0
New
Sou
th W
ales
su
bpop
ulat
ions
$0$5
0,00
0$0
$0$5
4,63
6$0
$0$5
9,70
2$0
$0
Que
ensl
and
subp
opul
atio
ns$0
$50,
000
$0$0
$54,
636
$0$0
$59,
702
$0$0
Sout
h A
ustr
alia
n su
bpop
ulat
ions
Con
trol
goa
ts a
t pri
orit
y ro
ck w
alla
by
subp
opul
atio
ns
$80,
000
$82,
400
$84,
872
$87,
418
$90,
041
$92,
742
$95,
524
$98,
390
$101
,342
$104
,382
New
Sou
th W
ales
su
bpop
ulat
ions
$30,
000
$30,
900
$31,
827
$32,
782
$33,
765
$34,
778
$35,
822
$36,
896
$38,
003
$39,
143
Que
ensl
and
subp
opul
atio
ns$3
0,00
0$3
0,90
0$3
1,82
7$3
2,78
2$3
3,76
5$3
4,77
8$3
5,82
2$3
6,89
6$3
8,00
3$3
9,14
3
Sout
h A
ustr
alia
n su
bpop
ulat
ions
Incr
ease
com
peti
tor c
ontr
ol d
urin
g dr
ough
ts a
nd
prol
onge
d dr
y pe
riod
s
$0$3
0,00
0$0
$0$3
3,76
5$0
$0$3
6,89
6$0
$0
New
Sou
th W
ales
su
bpop
ulat
ions
$0$3
0,00
0$0
$0$3
3,76
5$0
$0$3
6,89
6$0
$0
Que
ensl
and
subp
opul
atio
ns$0
$30,
000
$0$0
$33,
765
$0$0
$36,
896
$0$0
Sout
h A
ustr
alia
n su
bpop
ulat
ions
Con
trol
rab
bits
at p
rior
ity
rock
wal
laby
su
bpop
ulat
ions
$30,
000
$30,
900
$31,
827
$32,
782
$33,
765
$34,
778
$35,
822
$36,
896
$38,
003
$39,
143
New
Sou
th W
ales
su
bpop
ulat
ions
$10,
000
$10,
300
$10,
609
$10,
927
$11,
255
$11,
593
$11,
941
$12,
299
$12,
668
$13,
048
Que
ensl
and
subp
opul
atio
ns$1
0,00
0$1
0,30
0$1
0,60
9$1
0,92
7$1
1,25
5$1
1,59
3$1
1,94
1$1
2,29
9$1
2,66
8$1
3,04
8
Sout
h A
ustr
alia
n su
bpop
ulat
ions
Mai
ntai
n na
tura
l wat
erin
g po
ints
on
publ
ic la
nd
$5,0
00$5
,150
$5,3
05$5
,464
$5,6
28$5
,796
$5,9
70$6
,149
$6,3
34$6
,524
New
Sou
th W
ales
su
bpop
ulat
ions
$5,0
00$5
,150
$5,3
05$5
,464
$5,6
28$5
,796
$5,9
70$6
,149
$6,3
34$6
,524
Que
ensl
and
subp
opul
atio
ns$5
,000
$5,1
50$5
,305
$5,4
64$5
,628
$5,7
96$5
,970
$6,1
49$6
,334
$6,5
24
Sout
h A
ustr
alia
n su
bpop
ulat
ions
Iden
tify
and
mai
ntai
n ar
tific
ial w
ater
ing
poin
ts o
n pr
ivat
e an
d pu
blic
land
that
are
sig
nific
ant f
or r
ock
wal
laby
sub
popu
lati
ons
$0$0
$20,
000
$20,
600
$21,
218
$0$0
$0$0
$0
New
Sou
th W
ales
su
bpop
ulat
ions
$0$0
$10,
000
$10,
300
$10,
609
$0$0
$0$0
$0
Que
ensl
and
subp
opul
atio
ns$0
$0$1
0,00
0$1
0,30
0$1
0,60
9$0
$0$0
$0$0
Sout
h A
ustr
alia
n su
bpop
ulat
ions
Dec
omm
issi
on a
rtifi
cial
wat
erin
g po
ints
that
are
no
t req
uire
d fo
r roc
k w
alla
bies
yet
sti
ll su
ppor
t el
evat
ed n
umbe
rs o
f goa
ts a
nd/o
r eur
os
$0$0
$20,
000
$20,
600
$21,
218
$0$0
$0$0
$0
New
Sou
th W
ales
su
bpop
ulat
ions
$0$0
$10,
000
$10,
300
$10,
609
$0$0
$0$0
$0
Que
ensl
and
subp
opul
atio
ns$0
$0$1
0,00
0$1
0,30
0$1
0,60
9$0
$0$0
$0$0

186
Action Plan for Threatened Macropods 2011-2021
Su
bp
op
ula
tio
nA
ctio
nY
ear
1#Y
ear
2Y
ear
3Y
ear
4Y
ear
5Y
ear
6Y
ear
7Y
ear
8Y
ear
9Y
ear
10
Sout
h A
ustr
alia
n su
bpop
ulat
ions
Dev
elop
and
impl
emen
t fire
man
agem
ent p
lans
for
prio
rity
yel
low
-foo
ted
rock
wal
laby
hab
itat
$20,
000
$60,
000
$100
,000
$103
,000
$106
,090
$109
,273
$112
,551
$115
,927
$119
,405
$122
,987
New
Sou
th W
ales
su
bpop
ulat
ions
$20,
000
$20,
600
$60,
000
$61,
800
$63,
654
$65,
564
$67,
531
$69,
556
$71,
643
$73,
792
Que
ensl
and
subp
opul
atio
ns$2
0,00
0$2
0,60
0$6
0,00
0$6
1,80
0$6
3,65
4$6
5,56
4$6
7,53
1$6
9,55
6$7
1,64
3$7
3,79
2
Sout
h A
ustr
alia
n su
bpop
ulat
ions
Dev
elop
con
ting
ency
pla
ns fo
r cat
astr
ophi
c ev
ents
in
clud
ing
wild
fires
and
dro
ught
$0$0
$0$0
$0$0
$0$0
$0$0
New
Sou
th W
ales
su
bpop
ulat
ions
$0$0
$0$0
$0$0
$0$0
$0$0
Que
ensl
and
subp
opul
atio
ns$0
$0$0
$0$0
$0$0
$0$0
$0
Sout
h A
ustr
alia
n su
bpop
ulat
ions
Eng
age
loca
l lan
dhol
ders
in m
anag
emen
t of
yello
w-f
oote
d ro
ck w
alla
by h
abit
at o
n pr
ivat
e la
nd
$150
,000
$154
,500
$159
,135
$163
,909
$168
,826
$173
,891
$179
,108
$184
,481
$190
,016
$195
,716
New
Sou
th W
ales
su
bpop
ulat
ions
$60,
000
$61,
800
$63,
654
$65,
564
$67,
531
$69,
556
$71,
643
$73,
792
$76,
006
$78,
286
Que
ensl
and
subp
opul
atio
ns$3
0,00
0$3
0,90
0$3
1,82
7$3
2,78
2$3
3,76
5$3
4,77
8$3
5,82
2$3
6,89
6$3
8,00
3$3
9,14
3
Sout
h A
ustr
alia
n su
bpop
ulat
ions
Impl
emen
t mon
itori
ng p
roto
cols
, inc
ludi
ng
graz
ing
pres
sure
, pre
dati
on, w
ater
poi
nts
and
reso
urce
ava
ilabi
lity
$50,
000
$51,
500
$53,
045
$54,
636
$56,
275
$57,
964
$59,
703
$61,
494
$63,
339
$65,
239
New
Sou
th W
ales
su
bpop
ulat
ions
$20,
000
$20,
600
$21,
218
$21,
855
$22,
510
$23,
185
$23,
881
$24,
597
$25,
335
$26,
095
Que
ensl
and
subp
opul
atio
ns$2
0,00
0$2
0,60
0$2
1,21
8$2
1,85
5$2
2,51
0$2
3,18
5$2
3,88
1$2
4,59
7$2
5,33
5$2
6,09
5
All
Rev
iew
tran
sloc
atio
n of
yel
low
-foo
ted
rock
w
alla
bies
, inc
ludi
ng fe
asib
ility
of f
utur
e op
erat
ions
$0$0
$0$0
$0$0
$0$0
$0$0
All
Rev
iew
cur
rent
mar
k-re
capt
ure
site
s$0
$0$0
$0$0
$0$0
$0$0
$0
YE
AR
LY
TO
TA
LS
$1,7
50,0
00$1
,767
,750
$1,7
69,3
47$1
,953
,555
$2,2
63,6
00$1
,845
,995
$2,0
44,6
62$2
,248
,210
$2,0
17,1
68$2
,371
,687
GR
AN
D T
OT
AL
$20
,031
,973
#Not
e th
at a
n in
dex
of 3
% h
as b
een
appl
ied
to e
ach
succ
essi
ve y
ear o
f fun
ding
to a
ccou
nt fo
r CP
I
*Inc
lude
s 5-
year
pro
gram
revi
ew

187
Action Plan for Threatened Macropods 2011-2021
Recovery Outline - Potorous gilbertii
1. Family Potoroidae
2. Scientific name: Potorous gilbertii (Gould , 1841)
3. Common name: Gilbert’s potoroo, Ngilgyte (Indigenous name)
4. Conservation status (IUCN): Critically Endangered
5. Reasons for listing
Listed as Critically Endangered because there are currently less than 50 mature individuals. The population of the species appears to be stable, but it is known only from a tiny area, which it appears to fully occupy (Friend & Burbidge 2008).
Listed as Critically Endangered under the EPBC Act 1999 (DEWHA 2010).
6. Infraspecific Taxa
6.1 None
7. Range and abundance
Gilbert’s Potoroo is endemic to south-western, Western Australia and is known to occur in the wild at one very small site on the Mount Gardner headland in Two Peoples Bay Nature Reserve (TSSC 2004). The species was thought to be extinct from the early 1900s, until it was rediscovered in 1994 on the Mount Gardner headland (Sinclair et al. 1996; Friend 2008). It is also known from a captive population in Two Peoples Bay Nature Reserve and a translocated population on Bald Island Nature Reserve, about 50 km east of Albany (Friend, T, Pers. comm.).
There are an estimated 30–40 individuals in the Mount Gardner (wild) population (Friend 2008). Eleven Gilbert’s potoroos were released onto Bald Island in two separate releases between 2005–2007 (WA DEC 2009). There are indications that these animals are breeding and that the island can sustain a population of this species (Friend 2008); by mid 2010 the population of Gilbert’s Potoroo on Bald Island had reached an estimated 35 individuals (Friend, T, Pers. comm.).
Figure 21: Known distribution of Potorous gilbertii from the 2008 Global Mammal Assessment (IUCN 2010; Landsat imagery ©Commonwealth of Australia - Geoscience Australia).
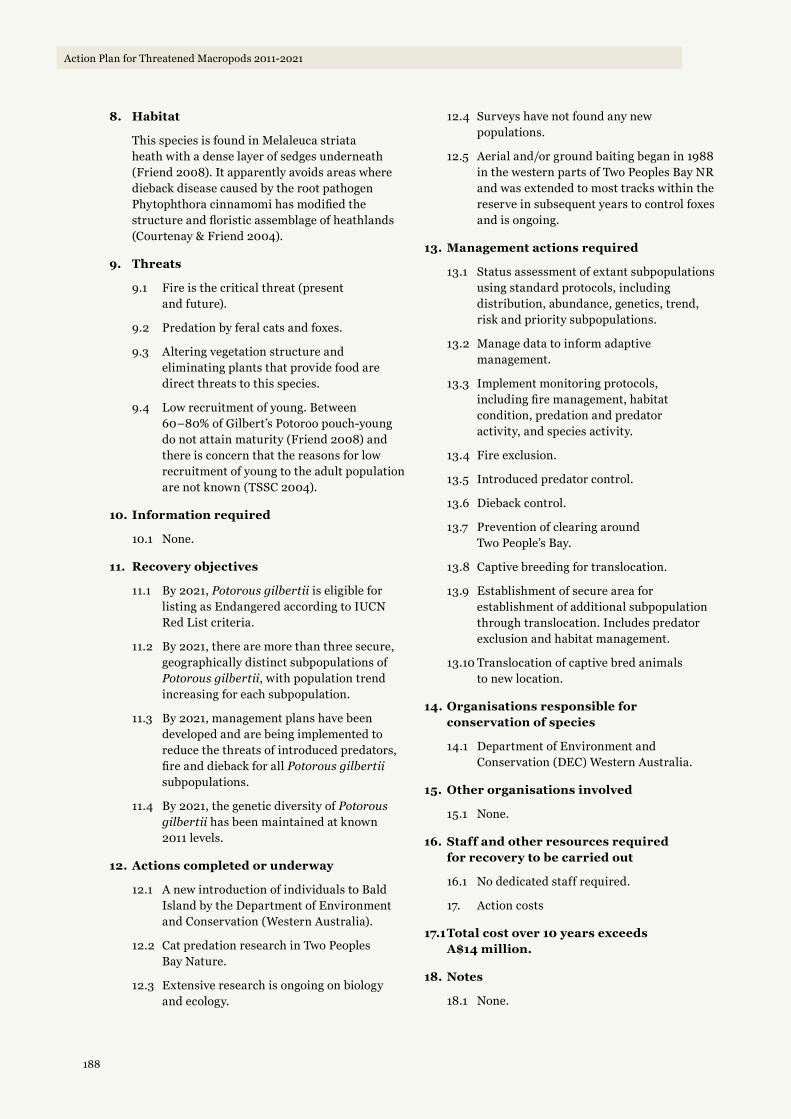
188
Action Plan for Threatened Macropods 2011-2021
8. Habitat
This species is found in Melaleuca striata heath with a dense layer of sedges underneath (Friend 2008). It apparently avoids areas where dieback disease caused by the root pathogen Phytophthora cinnamomi has modified the structure and floristic assemblage of heathlands (Courtenay & Friend 2004).
9. Threats
9.1 Fire is the critical threat (present and future).
9.2 Predation by feral cats and foxes.
9.3 Altering vegetation structure and eliminating plants that provide food are direct threats to this species.
9.4 Low recruitment of young. Between 60–80% of Gilbert’s Potoroo pouch-young do not attain maturity (Friend 2008) and there is concern that the reasons for low recruitment of young to the adult population are not known (TSSC 2004).
10. Information required
10.1 None.
11. Recovery objectives
11.1 By 2021, Potorous gilbertii is eligible for listing as Endangered according to IUCN Red List criteria.
11.2 By 2021, there are more than three secure, geographically distinct subpopulations of Potorous gilbertii, with population trend increasing for each subpopulation.
11.3 By 2021, management plans have been developed and are being implemented to reduce the threats of introduced predators, fire and dieback for all Potorous gilbertii subpopulations.
11.4 By 2021, the genetic diversity of Potorous gilbertii has been maintained at known 2011 levels.
12. Actions completed or underway
12.1 A new introduction of individuals to Bald Island by the Department of Environment and Conservation (Western Australia).
12.2 Cat predation research in Two Peoples Bay Nature.
12.3 Extensive research is ongoing on biology and ecology.
12.4 Surveys have not found any new populations.
12.5 Aerial and/or ground baiting began in 1988 in the western parts of Two Peoples Bay NR and was extended to most tracks within the reserve in subsequent years to control foxes and is ongoing.
13. Management actions required
13.1 Status assessment of extant subpopulations using standard protocols, including distribution, abundance, genetics, trend, risk and priority subpopulations.
13.2 Manage data to inform adaptive management.
13.3 Implement monitoring protocols, including fire management, habitat condition, predation and predator activity, and species activity.
13.4 Fire exclusion.
13.5 Introduced predator control.
13.6 Dieback control.
13.7 Prevention of clearing around Two People’s Bay.
13.8 Captive breeding for translocation.
13.9 Establishment of secure area for establishment of additional subpopulation through translocation. Includes predator exclusion and habitat management.
13.10 Translocation of captive bred animals to new location.
14. Organisations responsible for conservation of species
14.1 Department of Environment and Conservation (DEC) Western Australia.
15. Other organisations involved
15.1 None.
16. Staff and other resources required for recovery to be carried out
16.1 No dedicated staff required.
17. Action costs
17.1 Total cost over 10 years exceeds A$14 million.
18. Notes
18.1 None.
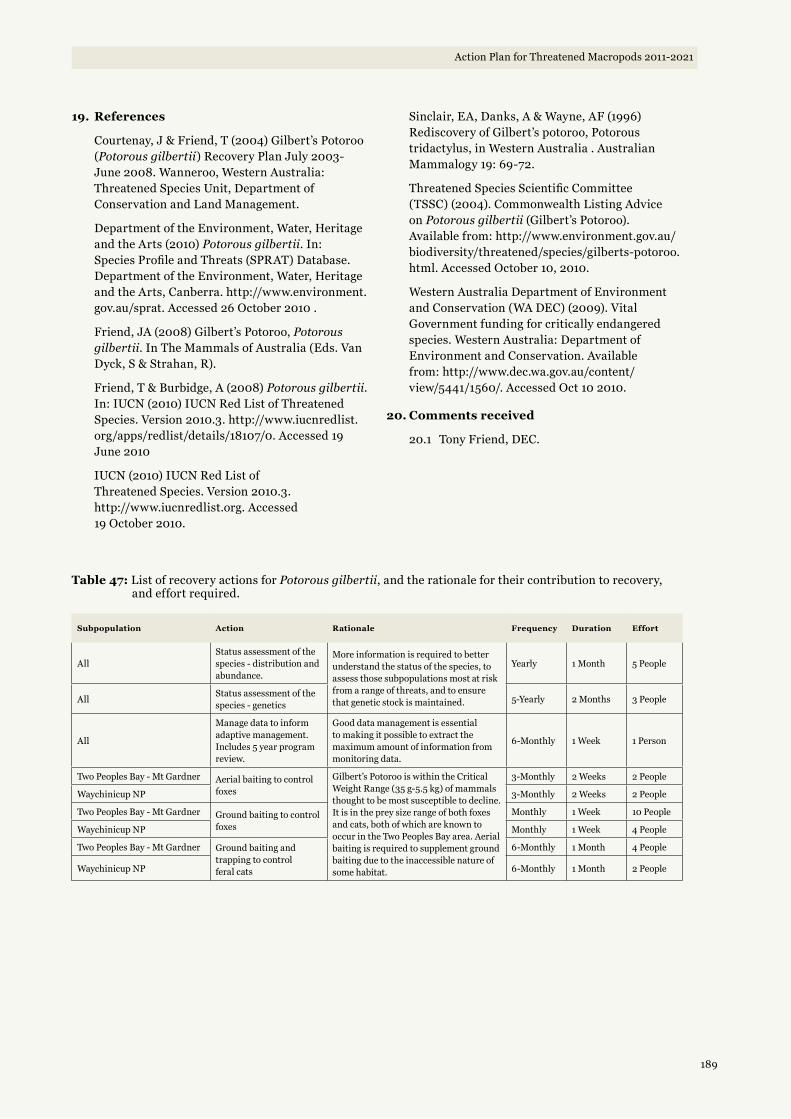
189
Action Plan for Threatened Macropods 2011-2021
19. References
Courtenay, J & Friend, T (2004) Gilbert’s Potoroo (Potorous gilbertii) Recovery Plan July 2003-June 2008. Wanneroo, Western Australia: Threatened Species Unit, Department of Conservation and Land Management.
Department of the Environment, Water, Heritage and the Arts (2010) Potorous gilbertii. In: Species Profile and Threats (SPRAT) Database. Department of the Environment, Water, Heritage and the Arts, Canberra. http://www.environment.gov.au/sprat. Accessed 26 October 2010 .
Friend, JA (2008) Gilbert’s Potoroo, Potorous gilbertii. In The Mammals of Australia (Eds. Van Dyck, S & Strahan, R).
Friend, T & Burbidge, A (2008) Potorous gilbertii. In: IUCN (2010) IUCN Red List of Threatened Species. Version 2010.3. http://www.iucnredlist.org/apps/redlist/details/18107/0. Accessed 19 June 2010
IUCN (2010) IUCN Red List of Threatened Species. Version 2010.3. http://www.iucnredlist.org. Accessed 19 October 2010.
Sinclair, EA, Danks, A & Wayne, AF (1996) Rediscovery of Gilbert’s potoroo, Potorous tridactylus, in Western Australia . Australian Mammalogy 19: 69-72.
Threatened Species Scientific Committee (TSSC) (2004). Commonwealth Listing Advice on Potorous gilbertii (Gilbert’s Potoroo). Available from: http://www.environment.gov.au/biodiversity/threatened/species/gilberts-potoroo.html. Accessed October 10, 2010.
Western Australia Department of Environment and Conservation (WA DEC) (2009). Vital Government funding for critically endangered species. Western Australia: Department of Environment and Conservation. Available from: http://www.dec.wa.gov.au/content/view/5441/1560/. Accessed Oct 10 2010.
20. Comments received
20.1 Tony Friend, DEC.
Table 47: List of recovery actions for Potorous gilbertii, and the rationale for their contribution to recovery, and effort required.
Subpopulation Action Rationale Frequency Duration Effort
AllStatus assessment of the species - distribution and abundance.
More information is required to better understand the status of the species, to assess those subpopulations most at risk from a range of threats, and to ensure that genetic stock is maintained.
Yearly 1 Month 5 People
AllStatus assessment of the species - genetics
5-Yearly 2 Months 3 People
All
Manage data to inform adaptive management. Includes 5 year program review.
Good data management is essential to making it possible to extract the maximum amount of information from monitoring data.
6-Monthly 1 Week 1 Person
Two Peoples Bay - Mt Gardner Aerial baiting to control foxes
Gilbert’s Potoroo is within the Critical Weight Range (35 g-5.5 kg) of mammals thought to be most susceptible to decline. It is in the prey size range of both foxes and cats, both of which are known to occur in the Two Peoples Bay area. Aerial baiting is required to supplement ground baiting due to the inaccessible nature of some habitat.
3-Monthly 2 Weeks 2 People
Waychinicup NP 3-Monthly 2 Weeks 2 People
Two Peoples Bay - Mt Gardner Ground baiting to control foxes
Monthly 1 Week 10 People
Waychinicup NP Monthly 1 Week 4 People
Two Peoples Bay - Mt Gardner Ground baiting and trapping to control feral cats
6-Monthly 1 Month 4 People
Waychinicup NP 6-Monthly 1 Month 2 People
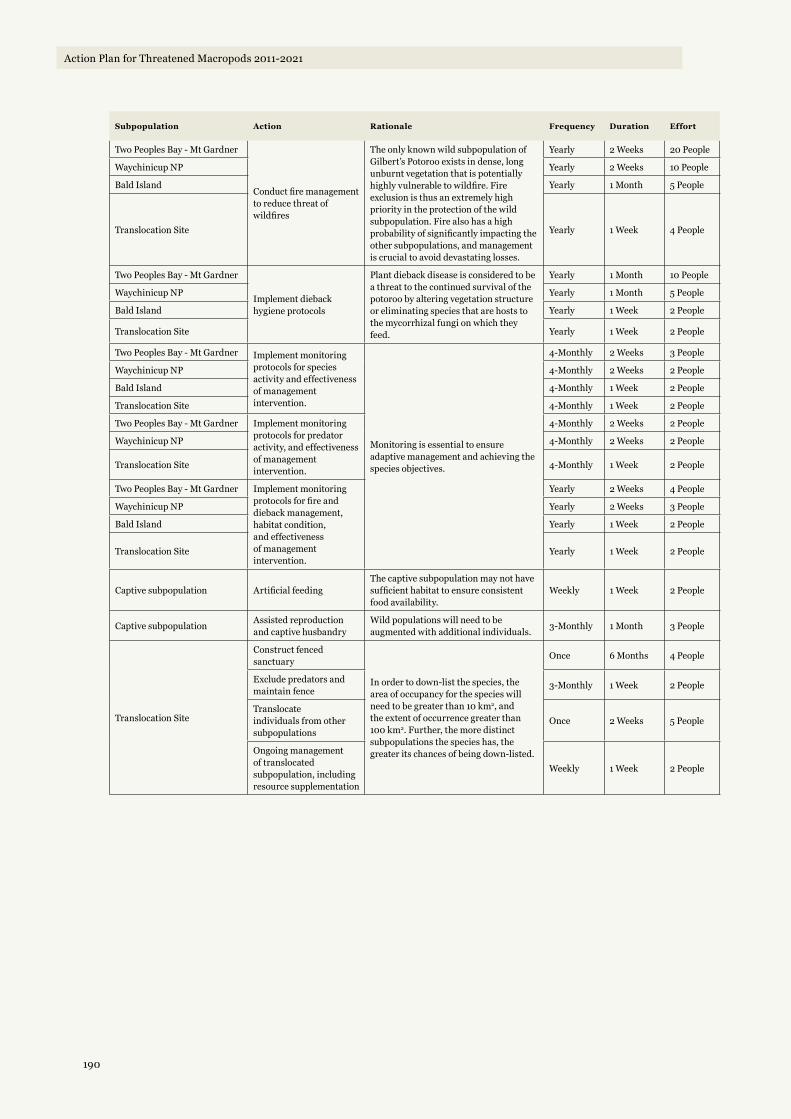
190
Action Plan for Threatened Macropods 2011-2021
Subpopulation Action Rationale Frequency Duration Effort
Two Peoples Bay - Mt Gardner
Conduct fire management to reduce threat of wildfires
The only known wild subpopulation of Gilbert’s Potoroo exists in dense, long unburnt vegetation that is potentially highly vulnerable to wildfire. Fire exclusion is thus an extremely high priority in the protection of the wild subpopulation. Fire also has a high probability of significantly impacting the other subpopulations, and management is crucial to avoid devastating losses.
Yearly 2 Weeks 20 People
Waychinicup NP Yearly 2 Weeks 10 People
Bald Island Yearly 1 Month 5 People
Translocation Site Yearly 1 Week 4 People
Two Peoples Bay - Mt Gardner
Implement dieback hygiene protocols
Plant dieback disease is considered to be a threat to the continued survival of the potoroo by altering vegetation structure or eliminating species that are hosts to the mycorrhizal fungi on which they feed.
Yearly 1 Month 10 People
Waychinicup NP Yearly 1 Month 5 People
Bald Island Yearly 1 Week 2 People
Translocation Site Yearly 1 Week 2 People
Two Peoples Bay - Mt Gardner Implement monitoring protocols for species activity and effectiveness of management intervention.
Monitoring is essential to ensure adaptive management and achieving the species objectives.
4-Monthly 2 Weeks 3 People
Waychinicup NP 4-Monthly 2 Weeks 2 People
Bald Island 4-Monthly 1 Week 2 People
Translocation Site 4-Monthly 1 Week 2 People
Two Peoples Bay - Mt Gardner Implement monitoring protocols for predator activity, and effectiveness of management intervention.
4-Monthly 2 Weeks 2 People
Waychinicup NP 4-Monthly 2 Weeks 2 People
Translocation Site 4-Monthly 1 Week 2 People
Two Peoples Bay - Mt Gardner Implement monitoring protocols for fire and dieback management, habitat condition, and effectiveness of management intervention.
Yearly 2 Weeks 4 People
Waychinicup NP Yearly 2 Weeks 3 People
Bald Island Yearly 1 Week 2 People
Translocation Site Yearly 1 Week 2 People
Captive subpopulation Artificial feedingThe captive subpopulation may not have sufficient habitat to ensure consistent food availability.
Weekly 1 Week 2 People
Captive subpopulationAssisted reproduction and captive husbandry
Wild populations will need to be augmented with additional individuals.
3-Monthly 1 Month 3 People
Translocation Site
Construct fenced sanctuary
In order to down-list the species, the area of occupancy for the species will need to be greater than 10 km2, and the extent of occurrence greater than 100 km2. Further, the more distinct subpopulations the species has, the greater its chances of being down-listed.
Once 6 Months 4 People
Exclude predators and maintain fence
3-Monthly 1 Week 2 People
Translocate individuals from other subpopulations
Once 2 Weeks 5 People
Ongoing management of translocated subpopulation, including resource supplementation
Weekly 1 Week 2 People

191
Action Plan for Threatened Macropods 2011-2021
Tab
le 4
8: L
ist o
f rec
over
y ac
tion
s fo
r Po
toro
us g
ilber
tii,
and
thei
r co
sts
Su
bp
op
ula
tio
nA
ctio
nY
ear
1#Y
ear
2Y
ear
3Y
ear
4Y
ear
5Y
ear
6Y
ear
7Y
ear
8Y
ear
9Y
ear
10
All
Stat
us a
sses
smen
t of t
he s
peci
es -
dist
ribu
tion
and
ab
unda
nce.
$10,
000
$10,
300
$10,
609
$10,
927
$11,
255
$11,
593
$11,
941
$12,
299
$12,
668
$13,
048
All
Stat
us a
sses
smen
t of t
he s
peci
es -
gene
tics
$15,
000
$0$0
$0$1
6,88
3$0
$0$0
$0$1
9,57
2
All
Man
age
data
to in
form
ada
ptiv
e m
anag
emen
t. In
clud
es 5
yea
r pro
gram
rev
iew
.$5
,000
$5,1
50$5
,305
$5,4
64$2
5,62
8*$5
,796
$5,9
70$6
,149
$6,3
33$2
6,52
3*
Two
Peop
les
Bay
- M
t Gar
dner
Aer
ial b
aiti
ng to
con
trol
foxe
s$1
00,0
00$1
03,0
00$1
06,0
90$1
09,2
73$1
12,5
51$1
15,9
27$1
19,4
05$1
22,9
87$1
26,6
77$1
30,4
77
Way
chin
icup
NP
$100
,000
$103
,000
$106
,090
$109
,273
$112
,551
$115
,927
$119
,405
$122
,987
$126
,677
$130
,477
Two
Peop
les
Bay
- M
t Gar
dner
Gro
und
bait
ing
to c
ontr
ol fo
xes
$90,
000
$92,
700
$95,
481
$98,
345
$101
,296
$104
,335
$107
,465
$110
,689
$114
,009
$117
,430
Way
chin
icup
NP
$75,
000
$77,
250
$79,
568
$81,
955
$84,
413
$86,
946
$89,
554
$92,
241
$95,
008
$97,
858
Two
Peop
les
Bay
- M
t Gar
dner
Gro
und
bait
ing
and
trap
ping
to c
ontr
ol fe
ral c
ats
$50,
000
$51,
500
$53,
045
$54,
636
$56,
275
$57,
964
$59,
703
$61,
494
$63,
339
$65,
239
Way
chin
icup
NP
$40,
000
$41,
200
$42,
436
$43,
709
$45,
020
$46,
371
$47,
762
$49,
195
$50,
671
$52,
191
Two
Peop
les
Bay
- M
t Gar
dner
Con
duct
fire
man
agem
ent t
o re
duce
thre
at o
f w
ildfir
es
$150
,000
$154
,500
$159
,135
$163
,909
$168
,826
$173
,891
$179
,108
$184
,481
$190
,016
$195
,716
Way
chin
icup
NP
$120
,000
$123
,600
$127
,308
$131
,127
$135
,061
$139
,113
$143
,286
$147
,585
$152
,012
$156
,573
Bal
d Is
land
$60,
000
$61,
800
$63,
654
$65,
564
$67,
531
$69,
556
$71,
643
$73,
792
$76,
006
$78,
286
Tran
sloc
atio
n Si
te$1
2,00
0$1
2,36
0$1
2,73
1$1
3,11
3$1
3,50
6$1
3,91
1$1
4,32
9$1
4,75
8$1
5,20
1$1
5,65
7
Two
Peop
les
Bay
- M
t Gar
dner
Impl
emen
t die
back
hyg
iene
pro
toco
ls
$20,
000
$20,
600
$21,
218
$60,
000
$22,
510
$23,
185
$65,
000
$24,
597
$25,
335
$26,
095
Way
chin
icup
NP
$15,
000
$15,
450
$15,
914
$60,
000
$16,
883
$17,
389
$65,
000
$18,
448
$19,
002
$19,
572
Bal
d Is
land
$10,
000
$10,
300
$10,
609
$10,
927
$11,
255
$11,
593
$11,
941
$12,
299
$12,
668
$13,
048
Tran
sloc
atio
n Si
te$1
0,00
0$1
0,30
0$1
0,60
9$1
0,92
7$1
1,25
5$1
1,59
3$1
1,94
1$1
2,29
9$1
2,66
8$1
3,04
8
Two
Peop
les
Bay
- M
t Gar
dner
Impl
emen
t mon
itori
ng p
roto
cols
for s
peci
es
acti
vity
and
eff
ecti
vene
ss o
f man
agem
ent
inte
rven
tion
.
$25,
000
$25,
750
$26,
523
$27,
318
$28,
138
$28,
982
$29,
851
$30,
747
$31,
669
$32,
619
Way
chin
icup
NP
$18,
000
$18,
540
$19,
096
$19,
669
$20,
259
$20,
867
$21,
493
$22,
138
$22,
802
$23,
486
Bal
d Is
land
$45,
000
$46,
350
$47,
741
$49,
173
$50,
648
$52,
167
$53,
732
$55,
344
$57,
005
$58,
715
Tran
sloc
atio
n Si
te$8
,000
$8,2
40$8
,487
$8,7
42$9
,004
$9,2
74$9
,552
$9,8
39$1
0,13
4$1
0,43
8
Two
Peop
les
Bay
- M
t Gar
dner
Impl
emen
t mon
itori
ng p
roto
cols
for p
reda
tor
acti
vity
, and
eff
ecti
vene
ss o
f man
agem
ent
inte
rven
tion
.
$30,
000
$30,
900
$31,
827
$32,
782
$33,
765
$34,
778
$35,
822
$36,
896
$38,
003
$39,
143
Way
chin
icup
NP
$25,
000
$25,
750
$26,
523
$27,
318
$28,
138
$28,
982
$29,
851
$30,
747
$31,
669
$32,
619
Tran
sloc
atio
n Si
te$2
,000
$2,0
60$2
,122
$2,1
85$2
,251
$2,3
19$2
,388
$2,4
60$2
,534
$2,6
10

192
Action Plan for Threatened Macropods 2011-2021
Su
bp
op
ula
tio
nA
ctio
nY
ear
1#Y
ear
2Y
ear
3Y
ear
4Y
ear
5Y
ear
6Y
ear
7Y
ear
8Y
ear
9Y
ear
10
Two
Peop
les
Bay
- M
t Gar
dner
Impl
emen
t mon
itori
ng p
roto
cols
for fi
re a
nd
dieb
ack
man
agem
ent,
habi
tat c
ondi
tion
, and
ef
fect
iven
ess
of m
anag
emen
t int
erve
ntio
n.
$30,
000
$30,
900
$31,
827
$32,
782
$33,
765
$34,
778
$35,
822
$36,
896
$38,
003
$39,
143
Way
chin
icup
NP
$25,
000
$25,
750
$26,
523
$27,
318
$28,
138
$28,
982
$29,
851
$30,
747
$31,
669
$32,
619
Bal
d Is
land
$30,
000
$30,
900
$31,
827
$32,
782
$33,
765
$34,
778
$35,
822
$36,
896
$38,
003
$39,
143
Tran
sloc
atio
n Si
te$5
,000
$5,1
50$5
,305
$5,4
64$5
,628
$5,7
96$5
,970
$6,1
49$6
,334
$6,5
24
Cap
tive
sub
popu
lati
onA
rtifi
cial
feed
ing
$25,
000
$25,
750
$26,
523
$27,
318
$28,
138
$28,
982
$29,
851
$30,
747
$31,
669
$32,
619
Cap
tive
sub
popu
lati
onA
ssis
ted
repr
oduc
tion
and
cap
tive
hus
band
ry$6
0,00
0$6
1,80
0$6
3,65
4$6
5,56
4$6
7,53
1$6
9,55
6$7
1,64
3$7
3,79
2$7
6,00
6$7
8,28
6
Tran
sloc
atio
n Si
te
Con
stru
ct fe
nced
san
ctua
ry$0
$0$0
$80,
000
$0$0
$0$0
$0$0
Exc
lude
pre
dato
rs a
nd m
aint
ain
fenc
e$0
$0$0
$5,0
00$2
5,00
0$2
5,75
0$2
6,52
3$2
7,31
8$2
8,13
8$2
8,98
2
Tran
sloc
ate
indi
vidu
als
from
oth
er s
ubpo
pula
tion
s$0
$0$0
$0$4
0,00
0$0
$0$0
$0$0
Ong
oing
man
agem
ent o
f tra
nslo
cate
d su
bpop
ulat
ion,
incl
udin
g re
sour
ce
supp
lem
enta
tion
$0$0
$0$0
$10,
000
$25,
000
$25,
750
$26,
523
$27,
318
$28,
138
YE
AR
LY
TO
TA
LS
$1,2
10,0
00$1
,230
,850
$1,2
67,7
76$1
,472
,563
$1,4
56,8
66$1
,436
,082
$1,5
67,3
73$1
,523
,539
$1,5
69,2
45$1
,655
,894
GR
AN
D T
OT
AL
$14
,39
0,1
88
#Not
e th
at a
n in
dex
of 3
% h
as b
een
appl
ied
to e
ach
succ
essi
ve y
ear o
f fun
ding
to a
ccou
nt fo
r CP
I
*Inc
lude
s 5-
year
pro
gram
revi
ew

193
Action Plan for Threatened Macropods 2011-2021
Recovery Outline - Potorous longipes
1. Family Potoroidae
2. Scientific name: Potorous longipes (Seebeck & Johnston, 1980)
3. Common name: Long-footed potoroo
4. Conservation status (IUCN): Endangered; B1ab(v)
5. Reasons for listing
Listed as Endangered (IUCN Red List) because its extent of occurrence is less than 5,000 km2, its distribution is severely fragmented, and there is probably a continuing decline in the number of mature individuals due to introduced predators and competition for its specialized food resources from introduced pigs (McKnight 2008).
Listed as Endangered under the EPBC Act 1999.
6. Infraspecific Taxa
6.1 None.
7. Range and abundance
This species is endemic to Australia, where it is known from three disjunct, fragmented populations:
• the catchments of the Brodribb, Bemm, Rodger and Yalmy Rivers in East Gippsland;
• the headwaters of the Buffalo, Buckland and Wonnangatta Rivers in north-eastern Victoria;
• the South East Forests National Park and Yambulla State Forest in far south-eastern NSW.
Altitudes range from 100 metres in East Gippsland to 1100 metres in the Barry Mountains. The Long-footed Potoroo is only known only through death as no live specimens have ever been caught. The most recent National Recovery Plan refrains from estimating the population size of the species due these factors, but states that it is unlikely to be more than a few thousand individuals, and it might only be a few hundred (NSW NPWS 2002).
Figure 22: Known distribution of Potorous longipes from the 2008 Global Mammal Assessment (IUCN 2010; Landsat imagery ©Commonwealth of Australia - Geoscience Australia).

194
Action Plan for Threatened Macropods 2011-2021
8. Habitat
The species occurs in a variety of forest types ranging from montane wet sclerophyll forests at over 1,000 metres altitude, to lowland sclerophyll forest at 100 metres altitude. It is apparently confined to sites with a high soil moisture content throughout the year. The primary requirements of Long-footed potoroos are a diverse and abundant supply of hypogeal fungal sporocarps throughout the year and dense cover to provide shelter and protection from predators (Menkhorst and Seebeck 2008).
9. Threats
9.1 Predation from foxes, dingoes, and feral dogs.
9.2 Introduced pigs might be competitors for this species’ specialised food requirements.
9.3 Inappropriate fire regimes might also affect the fungi on which this species depends.
9.4 Logging activities appear to be detrimental to the species.
9.5 Chance events. Because the Long-footed Potoroo has a very restricted distribution (especially in NSW), and a small population size, it is threatened by chance breeding failure (for example, caused by the death of too many adults of a particular sex) and localised disasters such as severe fires and disease, which could exterminate colonies (NSW NPWS 2002).
10. Information required
10.1 Further research is required into logging for confirmation of it’s level of threat.
10.2 Establish the distribution and abundance of the species (perhaps with new survey techniques).
10.3 Research the effects of habitat disturbance from timber harvesting and fire.
10.4 Research the biology of hypogeous fungi that the species depends on for food.
11. Recovery objectives
11.1 By 2021, Potorous longipes is eligible for listing as Vulnerable according to IUCN Red List criteria.
11.2 By 2021, the geographic range of Potorous longipes in the form of extent of occurrence has increased to greater than 5,000 km2, with subpopulations secure* at greater than 5 locations within that range.
11.3 By 2021, numbers of mature Potorous longipes in the wild are considered stable or increasing based on an index of abundance appropriate to the taxon.
11.4 By 2021, management plans have been developed and are being implemented to reduce the threats of predation, altered fire regimes, feral pigs, and to improve habitat area, extent and quality, for all Potorous longipes subpopulations.
11.5 By 2021, the genetic diversity of Potorous longipes has been maintained at known 2011 levels.
12. Actions completed or underway
12.1 Protection of suitable habitat for the species.
12.2 Control of predators through the use of 1080 baiting.
12.3 Control of introduced pigs and cats through trapping.
13. Management actions required
13.1 Status assessment of extant subpopulations using standard protocols, including distribution, abundance, genetics, trend, risk and priority subpopulations.
13.2 Manage data to inform adaptive management, and compile annual report. Includes creation of a spatial database identifying the mosaic of key micro-habitats for the species across its known range, and future population modelling.
13.3 Refine and implement monitoring protocols, including fire management, habitat condition, predation and predator activity, and species activity. Includes developing a protocol specifying trigger points to initiate dog or cat control measures.
13.4 Conduct strategic feral predator control to manage fox and feral dog predation over the entire known range of the species.
13.5 Conduct opportunistic feral cat control until an effective broad-scale control technique is available.
13.6 Develop and implement fire management plans for priority long-footed potoroo habitat.
13.7 Conduct targeted feral pig control where they compete for food resources with long-footed potoroos.

195
Action Plan for Threatened Macropods 2011-2021
13.8 Implement Long-footed Potoroo Core Protected Areas for East Gippsland and Great Dividing Range regions.
13.9 Ensure that potoroo management actions are incorporated into plans for parks or reserves where they or their habitat occur.
13.10 Establish additional protected areas where Long-footed Potoroos have been detected in State forest or other public land outside the Core Protected Area.
13.11 Identify unreserved long-footed potoroo habitat on private land and run extension programs to engage landholders to better manage or reserve land. Provide incentives.
13.12 Identify sites for translocation or reintroduction based on habitat mapping and/or on-ground assessment.
13.13 Establish and manage secure areas of habitat for future translocations.
13.14 Translocation of potoroos to secure and managed areas of habitat.
13.15 Ongoing management of translocated subpopulations, including resource supplementation as required.
13.16 Conduct research into optimal fire management practices to maintain potoroo habitat, including food resources.
13.17 Conduct studies on the extent of food resource competition between long-footed potoroos and feral pigs.
13.18 Avoid establishing new captive subpopulation, unless case is developed following rigorous assessment of conservation and animal welfare risks and benefits.
13.19 Develop and distribute community awareness materials to appropriate targets.
14. Organisations responsible for conservation of species
14.1 NSW Department of Environment, Climate Change and Water (DECCW).
14.2 Victorian Department of Sustainability and Environment (DSE).
15. Other organisations involved
15.1 None.
16. Staff and other resources required for recovery to be carried out
16.1 A dedicated recovery coordinator is required to undertake this program.
17. Action costs
17.1 Total cost over 10 years exceeds A$19 million.
18. Notes
18.1 None
19. References
IUCN (2010) IUCN Red List of Threatened Species. Version 2010.3. http://www.iucnredlist.org. Accessed 20 October 2010.
McKnight, M. 2008. Potorous longipes. In: IUCN (2010) IUCN Red List of Threatened Species. Version 2010.3. http://www.iucnredlist.org/apps/redlist/details/18102/0. Accessed 20 October 2010.
Department of the Environment, Water, Heritage and the Arts (2010) Potorous longipes. In: Species Profile and Threats (SPRAT) Database. Department of the Environment, Water, Heritage and the Arts, Canberra. http://www.environment.gov.au/sprat. Accessed 26 October 2010 .
Menkhorst, PW and Seebeck, JH (2008) Long-footed potoroo, Potorous longipes. In The Mammals of Australia. (Eds. Van Dyck, S and Strahan, R).
NSW National Parks and Wildlife Service (2002) Approved Recovery Plan for the Long-footed Potoroo (Potorous longipes). NSW National Parks and Wildlife Service, Hurstville NSW.
20. Comments received
20.1 None.

196
Action Plan for Threatened Macropods 2011-2021
Table 49: List of recovery actions for Potorous longipes, and the rationale for their contribution to recovery, and effort required.
Subpopulation Action Rationale Frequency Duration Effort
AllProject coordinator manages project
Current recovery actions are ad hoc and opportunistic, and the recovery program is of sufficient complexity to warrant a dedicated manager.
Yearly 1 Year 1 Person
All
Status assessment - distribution and abundance. Includes surveys of known subpopulations
More information is required to better understand the status of the species, to assess those subpopulations most at risk from a range of threats, and to ensure that genetic stock is maintained. Surveys are required to confirm the presence of potoroos at a range of locations.
3-Yearly 3 Months 10 People
AllStatus assessment - genetics
5-Yearly 2 Months 3 People
All
Manage species data to inform adaptive management. Includes 5 year program review.
Good data management is essential to making it possible to extract the maximum amount of information from monitoring data.
3-Monthly 1 Week 1 Person
Sites of unverified reports of potoroo presence
Surveys to confirm potoroo presence
The confirmation of potoroo presence is essential to informing all other management actions.
Yearly 3 Months 3 People
All
Refine monitoring protocols for the species, including trapping, satellite collars and camera traps, and to monitor habitat and threats.
It will be critical to improve our ability to detect this species in the wild if we are to improve our management of the species and its habitat.
Once 6 Months 2 People
Location 1Implement monitoring protocols for species activity, predator and pig activity, and effectiveness of management intervention.
Monitoring is essential to ensure adaptive management and achieving the species objectives
3-Monthly 2 Weeks 5 People
Location 2 3-Monthly 2 Weeks 3 People
Location 3 3-Monthly 2 Weeks 3 People
Location 4 3-Monthly 2 Weeks 3 People
Location 5 3-Monthly 2 Weeks 2 People
New subpopulation 3-Monthly 2 Weeks 2 People
Location 1Implement monitoring protocols for fire management and habitat condition, and effectiveness of management intervention.
Yearly 3 Weeks 4 People
Location 2 Yearly 2 Weeks 3 People
Location 3 Yearly 2 Weeks 3 People
Location 4 Yearly 2 Weeks 3 People
Location 5 Yearly 1 Week 3 People
New subpopulation Yearly 1 Week 3 People
Location 1Conduct strategic feral predator control to manage fox and feral dog predation over the entire known range of the species
Predation, particularly by canids and possibly feral cats, is suspected to be an important factor limiting the distribution and abundance of the long-footed potoroo. The red fox, the dingo and feral dog are recognised predators of the long-footed potoroo. Approximately 26 percent of the 300 records of the long-footed potoroo are from remains in canid scats and it is assumed that most of these are the result of predation rather than scavenging.
2-Monthly 2 Weeks 10 People
Location 2 2-Monthly 2 Weeks 5 People
Location 3 2-Monthly 2 Weeks 5 People
Location 4 2-Monthly 2 Weeks 5 People
Location 5 2-Monthly 2 Weeks 4 People
New subpopulation 2-Monthly 2 Weeks 4 People
Location 1
Conduct opportunistic feral cat control until an effective broad-scale control technique is available.
3-Monthly 1 Week 2 People
Location 2 3-Monthly 1 Week 2 People
Location 3 3-Monthly 1 Week 2 People
Location 4 3-Monthly 1 Week 2 People
Location 5 3-Monthly 1 Week 2 People
New subpopulation 3-Monthly 1 Week 2 People

197
Action Plan for Threatened Macropods 2011-2021
Subpopulation Action Rationale Frequency Duration Effort
Location 1
Develop and implement fire management plans for priority long-footed potoroo habitat
The entire distribution of the long-footed potoroo is in forest vulnerable to periodic wildfires. Fires of such magnitude and intensity clearly have the potential to cause local extinctions in sub-populations. Fuel reduction burning reduces cover, increases risk of exposure to predators, may cause direct mortality and probably disrupts food availability and social structure.
Yearly 1 Month 10 People
Location 2 Yearly 1 Month 10 People
Location 3 Yearly 1 Month 10 People
Location 4 Yearly 1 Month 10 People
Location 5 Yearly 1 Month 10 People
New subpopulation Yearly 1 Month 10 People
Location 1
Conduct targeted feral pig control where they compete for food resources with long-footed potoroos.
Feral pigs are known to compete with other mycophagous species, and it is predicted that pigs may have some impact on the food resources of long-footed potoroos.
6-Monthly 3 Weeks 3 People
Location 2 6-Monthly 2 Weeks 3 People
Location 3 6-Monthly 2 Weeks 3 People
Location 4 6-Monthly 2 Weeks 3 People
Location 5 6-Monthly 2 Weeks 3 People
New subpopulation 6-Monthly 2 Weeks 3 People
East Gippsland and Great Dividing Range regions
Implement long-footed potoroo Core Protected Areas for East Gippsland and Great Dividing Range regions.
A network of protected areas of primary habitat has been identified, comprising in excess of 40,000 ha of conservation reserves and State forest Special Protected Zones. This Core Protected Area will replace the current SMA-based approach and will consist of existing conservation reserves, existing and proposed SPZs and proposed new and expanded conservation reserves.
Once 1 Year 2 People
All
Ensure that potoroo management actions are incorporated into plans for parks or reserves where they or their habitat occur.
Ensure that park and reserve management plans recognise and protect areas of habitat identified in Core Protected Areas. New roads and facilities should not be constructed close to Long-footed Potoroo detection sites.
Once 1 Year 1 Person
All
Establish additional protected areas where Long-footed Potoroos have been detected in State forest or other public land outside the Core Protected Area.
The localised habitat disturbance that accompanies intensive timber harvesting has the potential to harm resident animals at least until dense cover is re-established. Timber harvesting and road construction increase access for predators such as foxes. Accordingly, areas of important habitat that are not protected and are subject to future timber harvesting should be protected.
Once 1 Year 1 Person
AllIdentify unreserved long-footed potoroo habitat on private land.
There may be important habitat on private land that is subject to a range of unsustainable management regimes. Landholder engagement is required to better manage these areas for long-footed potoroos.
Once 1 Year 1 Person
Subject to identification of suitable areas
Run extension programs to engage landholders to better manage or reserve land. Provide incentives.
Once critical potoroo habitat has been identified, there may be significant overlap with private land, in which case landholder engagement will be essential to the appropriate management of that land.
Yearly 1 Year 2 People

198
Action Plan for Threatened Macropods 2011-2021
Subpopulation Action Rationale Frequency Duration Effort
New subpopulations
Identify sites for translocation or reintroduction based on habitat mapping and/or on-ground assessment
In order to achieve an increase in area of occupancy and extent of occurrence, new or previously occupied sites will need to be identified, secured, and used as translocation sites.
Once 6 Months 1 Person
New subpopulationsEstablish and manage secure areas of habitat for future translocations
Once 6 Months 4 People
New subpopulationsTranslocation of potoroos to secure and managed areas of habitat.
Once 3 Weeks 5 People
New subpopulations
Ongoing management of translocated subpopulations, including resource supplementation as required.
Monthly 1 Day 2 People
NA
Conduct research into optimal fire management practices to maintain potoroo habitat, including food resources
Fuel reduction burning may reduce the risk of extensive high intensity wildfire impacting on large areas of Long-footed Potoroo habitat. The impacts of fire on the species and the optimum fire mosaic in potoroo habitat remain unclear. The impacts of habitat disturbance on hypogeous fungi also remain unclear.
Once 1 Year 2 People
NA
Conduct studies on the extent of food resource competition between long-footed potoroos and feral pigs
It is uncertain how much pig activity interferes with potoroo food resources, and this needs to be understood in order to better manage pig populations.
Once 1 Year 1 Person
NA
Avoid establishing new captive subpopulation, unless case is developed following rigorous assessment of conservation and animal welfare risks and benefits.
The small captive population from Healesville Sanctuary was diagnosed with avian tuberculosis, but this has not been detected in the wild. The net consequence of the small population, restricted distribution, limited ecological information and the range of threatening processes in operation is that a conservative approach to species management is strongly justified.
Once 1 Hour 1 Person
NA
Develop and distribute community awareness materials to appropriate targets
Liaison with deer hunting associations (and especially hunters who use hounds) will be increased to improve their understanding of the importance of the baiting program for the Great Dividing Range population and to try to develop mechanisms to minimise the risks of baiting to hunters’ dogs.
Yearly 2 Weeks 1 Person

199
Action Plan for Threatened Macropods 2011-2021
Tab
le 5
0: L
ist o
f rec
over
y ac
tion
s fo
r Po
toro
us lo
ngip
es, a
nd t
heir
cos
ts
Su
bp
op
ula
tio
nA
ctio
nY
ear
1#Y
ear
2Y
ear
3Y
ear
4Y
ear
5Y
ear
6Y
ear
7Y
ear
8Y
ear
9Y
ear
10
All
Proj
ect c
oord
inat
or m
anag
es p
roje
ct
$100
,000
$103
,000
$106
,090
$109
,273
$112
,551
$115
,927
$119
,405
$122
,987
$126
,677
$130
,477
All
Stat
us a
sses
smen
t - d
istr
ibut
ion
and
abun
danc
e.
Incl
udes
sur
veys
of k
now
n su
bpop
ulat
ions
$60,
000
$0$0
$65,
564
$0$0
$71,
644
$0$0
$78,
287
All
Stat
us a
sses
smen
t - g
enet
ics
$30,
000
$0$0
$0$3
3,76
5$0
$0$0
$0$3
9,14
3
All
Man
age
spec
ies
data
to in
form
ada
ptiv
e m
anag
emen
t. In
clud
es 5
yea
r pro
gram
rev
iew
.$0
$0$0
$0$2
0,00
0*$0
$0$0
$0$2
2,51
5*
Site
s of
unv
erifi
ed r
epor
ts o
f po
toro
o pr
esen
ceSu
rvey
s to
con
firm
pot
oroo
pre
senc
e$4
5,00
0$4
6,35
0$4
7,74
1$4
9,17
3$5
0,64
8$0
$0$0
$0$0
All
Refi
ne m
onito
ring
pro
toco
ls fo
r the
spe
cies
, in
clud
ing
trap
ping
, sat
ellit
e co
llars
and
cam
era
trap
s, a
nd to
mon
itor h
abit
at a
nd th
reat
s.$0
$0$0
$0$0
$0$0
$0$0
$0
Loc
atio
n 1
Impl
emen
t mon
itori
ng p
roto
cols
for s
peci
es
acti
vity
, pre
dato
r and
pig
act
ivit
y, a
nd
effe
ctiv
enes
s of
man
agem
ent i
nter
vent
ion.
$30,
000
$30,
900
$31,
827
$32,
782
$33,
765
$34,
778
$35,
822
$36,
896
$38,
003
$39,
143
Loc
atio
n 2
$20,
000
$20,
600
$21,
218
$21,
855
$22,
510
$23,
185
$23,
881
$24,
597
$25,
335
$26,
095
Loc
atio
n 3
$20,
000
$20,
600
$21,
218
$21,
855
$22,
510
$23,
185
$23,
881
$24,
597
$25,
335
$26,
095
Loc
atio
n 4
$15,
000
$15,
450
$15,
914
$16,
391
$16,
883
$17,
389
$17,
911
$18,
448
$19,
002
$19,
572
Loc
atio
n 5
$30,
000
$30,
900
$31,
827
$32,
782
$33,
765
$34,
778
$35,
822
$36,
896
$38,
003
$39,
143
New
sub
popu
lati
on$0
$0$0
$16,
391
$16,
883
$17,
389
$17,
911
$18,
448
$19,
002
$19,
572
Loc
atio
n 1
Impl
emen
t mon
itori
ng p
roto
cols
for fi
re
man
agem
ent a
nd h
abit
at c
ondi
tion
, and
ef
fect
iven
ess
of m
anag
emen
t int
erve
ntio
n.
$15,
000
$15,
450
$15,
914
$16,
391
$16,
883
$17,
389
$17,
911
$18,
448
$19,
002
$19,
572
Loc
atio
n 2
$10,
000
$10,
300
$10,
609
$10,
927
$11,
255
$11,
593
$11,
941
$12,
299
$12,
668
$13,
048
Loc
atio
n 3
$10,
000
$10,
300
$10,
609
$10,
927
$11,
255
$11,
593
$11,
941
$12,
299
$12,
668
$13,
048
Loc
atio
n 4
$12,
500
$12,
875
$13,
261
$13,
659
$14,
069
$14,
491
$14,
926
$15,
373
$15,
835
$16,
310
Loc
atio
n 5
$15,
000
$15,
450
$15,
914
$16,
391
$16,
883
$17,
389
$17,
911
$18,
448
$19,
002
$19,
572
New
sub
popu
lati
on$0
$0$0
$16,
391
$16,
883
$17,
389
$17,
911
$18,
448
$19,
002
$19,
572
Loc
atio
n 1
Con
duct
str
ateg
ic fe
ral p
reda
tor c
ontr
ol to
man
age
fox
and
fera
l dog
pre
dati
on o
ver t
he e
ntir
e kn
own
rang
e of
the
spec
ies
$90,
000
$92,
700
$95,
481
$98,
345
$101
,296
$104
,335
$107
,465
$110
,689
$114
,009
$117
,430
Loc
atio
n 2
$75,
000
$77,
250
$79,
568
$81,
955
$84,
413
$86,
946
$89,
554
$92,
241
$95,
008
$97,
858
Loc
atio
n 3
$75,
000
$77,
250
$79,
568
$81,
955
$84,
413
$86,
946
$89,
554
$92,
241
$95,
008
$97,
858
Loc
atio
n 4
$80,
000
$82,
400
$84,
872
$87,
418
$90,
041
$92,
742
$95,
524
$98,
390
$101
,342
$104
,382
Loc
atio
n 5
$90,
000
$92,
700
$95,
481
$98,
345
$101
,296
$104
,335
$107
,465
$110
,689
$114
,009
$117
,430
New
sub
popu
lati
on$0
$0$8
4,87
2$8
7,41
8$9
0,04
1$9
2,74
2$9
5,52
4$9
8,39
0$1
01,3
42$1
04,3
82

200
Action Plan for Threatened Macropods 2011-2021
Su
bp
op
ula
tio
nA
ctio
nY
ear
1#Y
ear
2Y
ear
3Y
ear
4Y
ear
5Y
ear
6Y
ear
7Y
ear
8Y
ear
9Y
ear
10
Loc
atio
n 1
Con
duct
opp
ortu
nist
ic fe
ral c
at c
ontr
ol u
ntil
an e
ffec
tive
bro
ad-s
cale
con
trol
tech
niqu
e is
av
aila
ble.
$25,
000
$25,
750
$26,
523
$27,
318
$28,
138
$28,
982
$29,
851
$30,
747
$31,
669
$32,
619
Loc
atio
n 2
$25,
000
$25,
750
$26,
523
$27,
318
$28,
138
$28,
982
$29,
851
$30,
747
$31,
669
$32,
619
Loc
atio
n 3
$25,
000
$25,
750
$26,
523
$27,
318
$28,
138
$28,
982
$29,
851
$30,
747
$31,
669
$32,
619
Loc
atio
n 4
$25,
000
$25,
750
$26,
523
$27,
318
$28,
138
$28,
982
$29,
851
$30,
747
$31,
669
$32,
619
Loc
atio
n 5
$25,
000
$25,
750
$26,
523
$27,
318
$28,
138
$28,
982
$29,
851
$30,
747
$31,
669
$32,
619
New
sub
popu
lati
on$0
$0$2
6,52
3$2
7,31
9$2
8,13
8$2
8,98
2$2
9,85
2$3
0,74
7$3
1,67
0$3
2,62
0
Loc
atio
n 1
Dev
elop
and
impl
emen
t fire
man
agem
ent p
lans
for
prio
rity
long
-foo
ted
poto
roo
habi
tat
$40,
000
$41,
200
$42,
436
$43,
709
$45,
020
$46,
371
$47,
762
$49,
195
$50,
671
$52,
191
Loc
atio
n 2
$40,
000
$41,
200
$42,
436
$43,
709
$45,
020
$46,
371
$47,
762
$49,
195
$50,
671
$52,
191
Loc
atio
n 3
$40,
000
$41,
200
$42,
436
$43,
709
$45,
020
$46,
371
$47,
762
$49,
195
$50,
671
$52,
191
Loc
atio
n 4
$40,
000
$41,
200
$42,
436
$43,
709
$45,
020
$46,
371
$47,
762
$49,
195
$50,
671
$52,
191
Loc
atio
n 5
$40,
000
$41,
200
$42,
436
$43,
709
$45,
020
$46,
371
$47,
762
$49,
195
$50,
671
$52,
191
New
sub
popu
lati
on$0
$0$4
2,43
6$4
3,70
9$4
5,02
0$4
6,37
1$4
7,76
2$4
9,19
5$5
0,67
1$5
2,19
1
Loc
atio
n 1
Con
duct
targ
eted
fera
l pig
con
trol
whe
re th
ey
com
pete
for f
ood
reso
urce
s w
ith
long
-foo
ted
poto
roos
.
$40,
000
$41,
200
$42,
436
$43,
709
$45,
020
$46,
371
$47,
762
$49,
195
$50,
671
$52,
191
Loc
atio
n 2
$40,
000
$41,
200
$42,
436
$43,
709
$45,
020
$46,
371
$47,
762
$49,
195
$50,
671
$52,
191
Loc
atio
n 3
$40,
000
$41,
200
$42,
436
$43,
709
$45,
020
$46,
371
$47,
762
$49,
195
$50,
671
$52,
191
Loc
atio
n 4
$40,
000
$41,
200
$42,
436
$43,
709
$45,
020
$46,
371
$47,
762
$49,
195
$50,
671
$52,
191
Loc
atio
n 5
$40,
000
$41,
200
$42,
436
$43,
709
$45,
020
$46,
371
$47,
762
$49,
195
$50,
671
$52,
191
New
sub
popu
lati
on$0
$0$4
2,43
6$4
3,70
9$4
5,02
0$4
6,37
1$4
7,76
2$4
9,19
5$5
0,67
1$5
2,19
1
Eas
t Gip
psla
nd a
nd G
reat
D
ivid
ing
Ran
ge r
egio
ns
Impl
emen
t Lon
g-fo
oted
Pot
oroo
Cor
e Pr
otec
ted
Are
as fo
r Eas
t Gip
psla
nd a
nd G
reat
Div
idin
g R
ange
reg
ions
.$0
$0$0
$0$0
$0$0
$0$0
$0
All
Ens
ure
that
pot
oroo
man
agem
ent a
ctio
ns a
re
inco
rpor
ated
into
pla
ns fo
r par
ks o
r res
erve
s w
here
they
or t
heir
hab
itat
occ
ur.
$0$0
$0$0
$0$0
$0$0
$0$0
All
Est
ablis
h ad
diti
onal
pro
tect
ed a
reas
whe
re L
ong-
foot
ed P
otor
oos
have
bee
n de
tect
ed in
Sta
te fo
rest
or
oth
er p
ublic
land
out
side
the
Cor
e Pr
otec
ted
Are
a.
$0$1
25,0
00$1
28,7
50$1
32,6
13$1
36,5
91$0
$0$0
$0$0
All
Iden
tify
unr
eser
ved
long
-foo
ted
poto
roo
habi
tat
on p
riva
te la
nd.
$0$0
$50,
000
$0$0
$0$0
$0$0
$0
Subj
ect t
o id
enti
ficat
ion
of
suit
able
are
asR
un e
xten
sion
pro
gram
s to
eng
age
land
hold
ers
to
bett
er m
anag
e or
res
erve
land
. Pro
vide
ince
ntiv
es.
$0$0
$0$2
50,0
00$2
57,5
00$2
65,2
25$2
73,1
82$2
81,3
77$2
89,8
19$2
98,5
13
201
Action Plan for Threatened Macropods 2011-2021
Su
bp
op
ula
tio
nA
ctio
nY
ear
1#Y
ear
2Y
ear
3Y
ear
4Y
ear
5Y
ear
6Y
ear
7Y
ear
8Y
ear
9Y
ear
10
New
sub
popu
lati
ons
Iden
tify
site
s fo
r tra
nslo
cati
on o
r rei
ntro
duct
ion
base
d on
hab
itat
map
ping
and
/or o
n-gr
ound
as
sess
men
t$0
$25,
000
$25,
000
$0$0
$0$0
$0$0
$0
New
sub
popu
lati
ons
Est
ablis
h an
d m
anag
e se
cure
are
as o
f hab
itat
for
futu
re tr
ansl
ocat
ions
$0$0
$120
,000
$0$0
$0$0
$0$0
$0
New
sub
popu
lati
ons
Tran
sloc
atio
n of
pot
oroo
s to
sec
ure
and
man
aged
ar
eas
of h
abit
at.
$0$0
$0$5
0,00
0$0
$0$0
$0$0
$0
New
sub
popu
lati
ons
Ong
oing
man
agem
ent o
f tra
nslo
cate
d su
bpop
ulat
ions
, inc
ludi
ng r
esou
rce
supp
lem
enta
tion
as
requ
ired
.$0
$0$0
$60,
000
$30,
000
$30,
900
$31,
827
$32,
782
$33,
765
$34,
778
NA
Con
duct
res
earc
h in
to o
ptim
al fi
re m
anag
emen
t pr
acti
ces
to m
aint
ain
poto
roo
habi
tat,
incl
udin
g fo
od r
esou
rces
$0$6
0,00
0$6
1,80
0$6
3,65
4$0
$0$0
$0$0
$0
NA
Con
duct
stu
dies
on
the
exte
nt o
f foo
d re
sour
ce
com
peti
tion
bet
wee
n lo
ng-f
oote
d po
toro
os a
nd
fera
l pig
s$0
$0$3
0,00
0$3
0,90
0$3
1,82
7$0
$0$0
$0$0
NA
Avo
id e
stab
lishi
ng n
ew c
apti
ve s
ubpo
pula
tion
, un
less
cas
e is
dev
elop
ed fo
llow
ing
rigo
rous
as
sess
men
t of c
onse
rvat
ion
and
anim
al w
elfa
re
risk
s an
d be
nefit
s.
$0$0
$0$0
$0$0
$0$0
$0$0
NA
Dev
elop
and
dis
trib
ute
com
mun
ity
awar
enes
s m
ater
ials
to a
ppro
pria
te ta
rget
s$1
,000
$1,0
30$1
,061
$1,0
93$1
,126
$1,1
59$1
,194
$1,2
30$1
,267
$1,3
05
YE
AR
LY
TO
TA
LS
$1,3
48,5
00$1
,506
,255
$1,9
46,9
60$2
,262
,864
$2,1
68,1
21$1
,952
,149
$2,0
82,3
57$2
,071
,035
$2,1
33,1
66$2
,337
,106
GR
AN
D T
OT
AL
$19
,80
8,5
12
#Not
e th
at a
n in
dex
of 3
% h
as b
een
appl
ied
to e
ach
succ
essi
ve y
ear o
f fun
ding
to a
ccou
nt fo
r CP
I
*Inc
lude
s 5-
year
pro
gram
revi
ew

202
Action Plan for Threatened Macropods 2011-2021
Recovery Outline - Setonix brachyurus
1. Family Potoroidae
2. Scientific name: Setonix brachyurus (Quoy & Gaimard, 1830)
3. Common name: Quokka, short-tailed wallaby
4. Conservation status (IUCN): Vulnerable; B1ab(ii,iii)
5. Reasons for listing
Listed as Vulnerable because the extent of occurrence is less than 20,000 km2, the range is severely fragmented, and there is a continuing decline in extent of occurrence and area of occupancy. The species might also meet Criterion C1 for Vulnerable. There may be < 10,000 mature individuals and the continuing decline may be > 10% over three generations (i.e., 12 years). The continuing decline, however, has to be estimated, not inferred or projected, requiring quantitative evidence, and evidence for a 10% decline over the next 12 years is not currently available (de Tores et al. 2008).
Listed as Vulnerable under the EPBC Act 1999 (DEWHA 2010).
6. Infraspecific Taxa
6.1 None.
7. Range and abundance
The quokka is endemic to the south-west of Western Australia, including Rottnest and Bald Islands. It is also found in several sites on the south-west Western Australian mainland, ranging just south of Perth to the Hunter River. There are recently confirmed records of occurrence at the Muddy Lakes from the Swan Coastal Plain, south of Bunbury (Sinclair and Hyder, 2009). In 2007 the range was estimated at 25,190 km². This species is sparsely scattered within abundant suitable habitat (de Tores 2008).
Figure 23: Known distribution of Setonix brachyurus from the 2008 Global Mammal Assessment (IUCN 2010; Landsat imagery ©Commonwealth of Australia - Geoscience Australia).

203
Action Plan for Threatened Macropods 2011-2021
8. Habitat
The main habitat for mainland populations of the Quokka is dense streamside vegetation (Hayward et al. 2005a) but the species is also found in a variety of habitats. On Rottnest Island it lives in thickets (Acacia, Melaleuca and sedges) and scrub habitat. On the mainland, many populations are found close to water such as creeks and swamps. In the northern Jarrah forest they are associated with the presence of the tea-tree Taxandria linearifolia bordering swamps and watercourses and the presence of a complex structural mosaic, largely determined by fire history (de Tores 2008).
9. Threats
9.1 Habitat clearing.
9.2 introduction of foxes and feral cats has led to a past decline of mainland populations.
9.3 Feral pigs are causing habitat degradation and excluding quokkas from swampy areas.
9.4 Prescribed burning and clearing are a problem in much of the forested habitats.
9.5 Recreational activities such as camping and walking tracks increase exposure to predators.
9.6 Road kills.
9.7 Predator avoidance strategy: the quokka is able to expel its pouch young if pursued by foxes, cats or dogs. This survival mechanism can negatively affect population growth over the long term if this strategy is used repeatedly.
9.8 Proximity to residential and mining areas.
9.9 Poor recruitment and limited genetic pool.
10. Information required
10.1 Further work is needed to define subpopulation size and movements between habitat areas.
10.2 Taxonomic study to determine the genetics of all populations.
10.3 Verify unconfirmed reports of quokka presence, and determine conservation significance of existing and any additionally confirmed geographic outlier populations.
11. Recovery objectives
11.1 By 2021, Setonix brachyurus is eligible for listing as Near Threatened according to IUCN Red List criteria.
11.2 By 2021, the geographic range of Setonix brachyurus in the form of extent of occurrence has increased to greater than 20,000 km2, with subpopulations secure at greater than 10 locations within that range.
11.3 By 2021, quantitative evidence confirms that a 10% decline in population size over the next 12 years is unlikely, thus making Setonix brachyurus ineligible to qualify as Vulnerable under IUCN criterion C1.
11.4 By 2021, management plans have been developed and are being implemented to reduce the threats of altered fire regimes and feral predators, and to improve habitat area, extent and quality, for all Setonix brachyurus subpopulations.
11.5 By 2021, the genetic diversity of Setonix brachyurus has been maintained at known 2011 levels.
12. Actions completed or underway
12.1 Research into subpopulation size and structure, diet, and habitat use has been completed for the northern Jarrah forest.
12.2 Rapid surveys of southern forest subpopulations has been conducted.
12.3 Feral pig surveys have been conducted in many locations.
12.4 Fox control programs are ongoing under the Western Shield program.
12.5 Several wildlife parks and sanctuaries in Western Australia have captive populations of quokkas, some of which are part of re-introduction programs.
13. Management actions required
13.1 Status assessment of extant subpopulations using standard protocols, including distribution, abundance, genetics, trend, risk and priority subpopulations. Also identify areas of high conservation value for the quokka.
13.2 Establish key monitoring sites. Develop/refine monitoring protocols, including fire management, habitat condition, predation and predator activity, and species activity. Implement at each site where appropriate.

204
Action Plan for Threatened Macropods 2011-2021
13.3 Review of translocations, and factors influencing success or failure.
13.4 Manage data to inform adaptive management, and compile annual report. Consolidate existing database and other records of quokka occurrence.
13.5 Maintain existing introduced predator baiting programs, including those on private property, and implement new baiting programs at sites where the risks from predation are thought to have increased as a result of wildfire.
13.6 Implement an adaptive fire management strategy in the northern jarrah forest to maintain the existing preferred habitat mosaic and to establish and maintain additional areas supporting the preferred habitat.
13.7 Examine the effect of different fire regimes on the population abundances of quokkas for DEC’s southwest, Warren and South Coast regions and determine the post-fire seral stage(s) and/or mosaic preferred by quokkas.
13.8 Examine the effectiveness of different fox and cat baiting regimes in an adaptive management framework.
13.9 Assess the effect of disturbance from pigs and the conservation outcomes of different methods of pig control.
13.10 Implement pig control programs in an adaptive management framework, with priority given to high conservation value areas for the quokka, and by the potential for the control actions proposed to eradicate localised pig populations and/or to provide a quantifiable reduction in damage caused by pigs to quokka populations and/or quokka habitat.
13.11 Examine the effect of timber harvesting and associated operational activities in close proximity to quokka populations and investigate ways to eliminate and/or mitigate any identified detrimental impacts.
13.12 Investigate the health of quokkas on the mainland, Rottnest and Bald Island and establish ongoing health monitoring and disease screening programs.
13.13 Investigate the diet of mainland quokkas in terms of dietary intake and resource availability.
13.14 Restrict quokka captive breeding programs until further information is available on the genetic structure of mainland and island populations.
13.15 Prevent translocation where this results in, or has the potential to result in, mixing of populations from different sources. Strict monitoring/auditing of the location and fate of all quokkas from Rottnest Island is recommended to ensure none are released into the wild.
13.16 Assess the effects of dieback on quokka subpopulations and distribution.
13.17 Commence habitat modelling studies to address climate change issues and identify the role of translocation in this process.
14. Organisations responsible for conservation of species
14.1 Department of Environment and Conservation (DEC) Western Australia.
15. Other organisations involved
15.1 Rottnest Island Authority (RIA).
16. Staff and other resources required for recovery to be carried out
16.1 A dedicated recovery coordinator is required to coordinate the complex recovery program.
17. Action costs
17.1 Total cost over 10 years exceeds A$18 million.
18. Notes
18.1 None.
19. References
Department of the Environment, Water, Heritage and the Arts (2010) Setonix brachyurus. In: Species Profile and Threats (SPRAT) Database. Department of the Environment, Water, Heritage and the Arts, Canberra. http://www.environment.gov.au/sprat. Accessed 26 October 2010 .
de Tores, PJ (2008) Quokka, Setonix brachyurus. In The Mammals of Australia (Eds. Van Dyck, S & Strahan, R).
de Tores, P, Burbidge, A, Morris, K & Friend, T (2008) Setonix brachyurus. In: IUCN (2010) IUCN Red List of Threatened Species. Version 2010.3. http://www.iucnredlist.org/apps/redlist/details/20165/0. Accessed 20 October 2010.

205
Action Plan for Threatened Macropods 2011-2021
de Tores, PJ and Williams, RJ (2010) Quokka Setonix brachyurus draft Recovery Plan (2010 -2019). Prepared for the Commonwealth of Australia Department of Environment, Water, Heritage and the Arts and the Western Australian Department of Environment and Conservation.
Hayward, MW, de Tores, PJ & Banks, PB (2005) Habitat use of the Quokka, Setonix bracyhurus (Macropodidae: Marsupialia), in the Northern Jarrah Forest of Australia. Journal of Mammalogy 86(4): 683-688.
Hayward, MW, de Tores, PJ, Dillon, MJ and Fox, BJ (2003). Local population structure of a naturally occurring metapopulation of the Quokka (Setonix brachyurus Macropodidae: Marsupialia). Biological Conservation 110: 343-355.
IUCN (2010) IUCN Red List of Threatened Species. Version 2010.3. http://www.iucnredlist.org. Accessed 20 October 2010.
Sinclair, EA & Hyder, BM (2009) Surviving Quokka (Setonix brachyurus) population on the Swan Coastal Plain, Western Australia. Australian Mammalogy 31: 67-69.
20. Comments received
20.1 Paul de Tores, DEC WA
Table 51: List of recovery actions for Setonix brachyurus, and the rationale for their contribution to recovery, and effort required.
Subpopulation Action Rationale Frequency Duration Effort
AllProject Coordinator manages project
Current recovery actions are ad hoc and opportunistic, and the recovery program is of sufficient complexity to warrant a dedicated manager.
Yearly 1 Year 1 Person
All
Status assessment - distribution and abundance. Includes surveys of known subpopulations, and identification of subpopulations of high conservation value.
More information is required to better understand the status of the species, to assess those subpopulations most at risk from a range of threats, and to ensure that genetic stock is maintained.
3-Yearly 3 Months 10 People
AllStatus assessment - genetic population structure.
5-Yearly 2 Months 3 People
AllConsolidate existing databases.
Database records, miscellaneous records and anecdotal undocumented records of quokka occurrence are currently dispersed across a range of locations and are held by a range of custodians. Consolidation of existing records will provide a single point of reference for land use planners and conservation staff.
Once 3 Months 1 Person
All
Manage species data to inform adaptive management. Includes 5 year program review.
Good data management is essential to making it possible to extract the maximum amount of information from monitoring data.
6-Monthly 1 Week 1 Person

206
Action Plan for Threatened Macropods 2011-2021
Subpopulation Action Rationale Frequency Duration Effort
AllVerify unconfirmed reports of quokka sightings.
Surveys are required to confirm the presence of quokkas at a range of locations. Any subpopulations discovered will need to be assessed according to their overall significance, both in terms of numbers, genetic diversity, and local habitat and threats. If verified as accurate, new populations are potentially of high conservation value.
Yearly 2 Weeks 1 Person
All
Determine conservation significance of newly confirmed populations through surveys and genetic assessment.
Yearly 1 Month 1 Person
All
Develop/refine monitoring protocols for the species, including trapping, satellite collars and camera traps, health screening, and to monitor habitat and threats.
Monitoring is essential to ensure adaptive management and achieving the species objectives. A monitoring program of key populations in the four IBRA regions in which quokkas occur is required to provide clear and robust evidence of population size and trends in changes to population size.
Once 2 Months 1 Person
Location 1
Implement monitoring protocols for species activity, predator and pig activity, and effectiveness of management intervention.
3-Monthly 2 Weeks 4 People
Location 2 3-Monthly 2 Weeks 4 People
Location 3 3-Monthly 2 Weeks 4 People
Location 4 3-Monthly 2 Weeks 4 People
Location 5 3-Monthly 2 Weeks 4 People
Location 6 3-Monthly 2 Weeks 4 People
Location 7 3-Monthly 2 Weeks 4 People
Location 8 3-Monthly 2 Weeks 4 People
Location 9 3-Monthly 2 Weeks 4 People
Location 10 3-Monthly 2 Weeks 4 People
Rottnest Island 3-Monthly 2 Weeks 4 People
Bald Island
Health and disease screening.
Disease has not been demonstrated as an important factor in the decline of the quokka, however, it has been implicated as responsible for the deaths of individuals. Potential disease threats include Salmonella infection and Toxoplasmosis. Salmonella infections are believed to be common on Rottnest Island. Toxoplasmosis has been observed to occur in populations of quokka and there have been observations of quokkas dying in large numbers from inexplicable causes prior to the 1940s. Quokkas may also be susceptible to infection with the canary pox virus, which is the basis for the equine influenza vaccine.
Yearly 1 Week 3 People
Rottnest Island Yearly 1 Week 3 People
Rotating mainland location 6-Monthly 2 Weeks 4 People
Location 1
Implement monitoring protocols for fire management and habitat condition, and effectiveness of management intervention.
Monitoring is essential to ensure adaptive management and achieving the species objectives.
Yearly 1 Month 5 People
Location 2 Yearly 1 Month 5 People
Location 3 Yearly 1 Month 5 People
Location 4 Yearly 1 Month 5 People
Location 5 Yearly 1 Month 5 People
Location 6 Yearly 1 Month 5 People
Location 7 Yearly 1 Month 5 People
Location 8 Yearly 1 Month 5 People
Location 9 Yearly 1 Month 5 People
Location 10 Yearly 1 Month 5 People

207
Action Plan for Threatened Macropods 2011-2021
Subpopulation Action Rationale Frequency Duration Effort
Location 1
Conduct strategic feral predator control in quokka habitat.
The fox appears to the most significant factor to have contributed to the decline in quokka numbers on the mainland. Although Hayward et al. (2003) found quokkas had not responded to fox control in the northern jarrah forest, the presence of fox baiting was found to be an important predictor of quokka presence within the northern jarrah forest.
3-Monthly 2 Weeks 4 People
Location 2 3-Monthly 2 Weeks 4 People
Location 3 3-Monthly 2 Weeks 4 People
Location 4 3-Monthly 2 Weeks 4 People
Location 5 3-Monthly 2 Weeks 4 People
Location 6 3-Monthly 2 Weeks 4 People
Location 7 3-Monthly 2 Weeks 4 People
Location 8 3-Monthly 2 Weeks 4 People
Location 9 3-Monthly 2 Weeks 4 People
Location 10 3-Monthly 2 Weeks 4 People
Location 1
Conduct strategic feral pig control in quokka habitat.
Pigs have the potential to indirectly affect quokkas through destruction of habitat. This not only removes food resources from the habitat, but also creates pathways which facilitate access for other feral animals, such as foxes. There are anecdotal reports of quokkas being absent where pigs are present. The effect of pigs on quokka abundance and distribution has not been quantified.
6-Monthly 2 Weeks 2 People
Location 2 6-Monthly 2 Weeks 2 People
Location 3 6-Monthly 2 Weeks 2 People
Location 4 6-Monthly 2 Weeks 2 People
Location 5 6-Monthly 2 Weeks 2 People
Location 6 6-Monthly 2 Weeks 2 People
Location 7 6-Monthly 2 Weeks 2 People
Location 8 6-Monthly 2 Weeks 2 People
Location 9 6-Monthly 2 Weeks 2 People
Location 10 6-Monthly 2 Weeks 2 People
Location 1
Conduct active adaptive fire management to maintain habitat condition.
Within the northern jarrah forest, long-unburnt areas have been identified as important for the persistence of quokkas, as is the presence of recently burnt areas (i.e. burnt within the previous 10 years). However, the upper limit to the long unburnt component of the habitat mosaic is unknown, as is the configuration of the mosaic, i.e. the area required for each component of the mosaic. The relationship(s) between fire and quokkas' preferred habitat elsewhere is known anecdotally only. Wildfire suppression activities also have the potential to lead to the loss of quokka habitat.
Yearly 1 Month 5 People
Location 2 Yearly 1 Month 5 People
Location 3 Yearly 1 Month 5 People
Location 4 Yearly 1 Month 5 People
Location 5 Yearly 1 Month 5 People
Location 6 Yearly 1 Month 5 People
Location 7 Yearly 1 Month 5 People
Location 8 Yearly 1 Month 5 People
Location 9 Yearly 1 Month 5 People
Location 10 Yearly 1 Month 5 People
South-West DEC region Investigate effects of fire on quokka habitat, and optimum regimes to maintain that habitat.
Once 1 Year 2 People
Warren DEC region Once 1 Year 2 People
South Coast DEC region Once 1 Year 2 People
Study Location P
Investigate effect of timber harvesting on quokka habitat.
Of the 711 known and mapped location records, 405 (approximately 57%) are within state forest or timber reserves within the RFA boundary, and 226 records (approximately 32%) are within conservation estate. Of the remaining 80 records, 49 are location records from roads, usually road kill records) within or bounding state forest. Therefore a total of 61% of known and mapped mainland location records fro the quokka are potentially subject to disturbance from harvesting operations.
Once 1 Year 1 Person
Study Location Q Once 3 Months 1 Person
Study Location R Once 3 Months 1 Person

208
Action Plan for Threatened Macropods 2011-2021
Subpopulation Action Rationale Frequency Duration Effort
Study Location S
Conduct research into quokka dietary analysis in concert with vegetation mapping and/or habitat modelling to inform management actions.
Dietary studies are recommended to provide information on the preferred habitat of the quokka. Dietary analyses, when combined with vegetation mapping, study of micro-habitat use, habitat manipulation and introduced predator control, can determine whether these management actions result in provision of an otherwise unavailable and preferred food resource.
Once 1 Year 1 Person
Study Location T Once 3 Months 1 Person
Study Location U Once 3 Months 1 Person
Sanctuary Location Y
Maintain captive quokkas for future translocations.
Translocation of mainland quokkas to other mainland locations supporting naturally occurring populations may be warranted to augment these populations. However, this is not recommended until such time as genetic or other evidence can demonstrate clear conservation benefits from such translocations.
Weekly 1 Day 2 People
Sanctuary Location Z Weekly 1 Day 2 People
All
Translocation modelling, and evaluation of translocation successes and failures.
Translocations of wild and captive subpopulations will be crucial to the ongoing management of the species. Ensuring that any future translocations are undertaken under optimum conditions is essential for the success of the operations.
Once 2 Months 1 Person
Translocation Site A Translocate quokkas to secure sites to optimise genetic management, based on genetic survey information.
Once 1 Month 5 People
Translocation Site B Once 1 Month 5 People
Translocation Site C Once 1 Month 5 People
Study Location V
Conduct research into the effects of dieback on quokka habitat, and the potential for future dieback spread to impact quokka habitat.
Any fauna species which is dependent upon a complex forest structure and inhabits the forests of south-west Western Australia is potentially threatened by dieback. Understorey species such as Banksia spp. and Persoonia spp., which are highly susceptible to Phytophthora. cinnamomi, form an important part of the structure of jarrah forests. The loss of such forest structure as a consequence of dieback has the potential to increase the risk of predation and result in the loss of food resources for mammals such as quokka.
Once 1 Year 1 Person
Study Location W Once 3 Months 1 Person
Study Location X Once 3 Months 1 Person
All
Undertake genetic and demographic modelling to complement habitat modelling, and to inform climate change adaptation
The potential effects on the distribution of the quokka as a result of climate change run to the extreme of a complete loss of range by the year 2070, with changes in precipitation shown to be the most important variable influencing the modelled historical distribution.
Once 1 Year 2 People
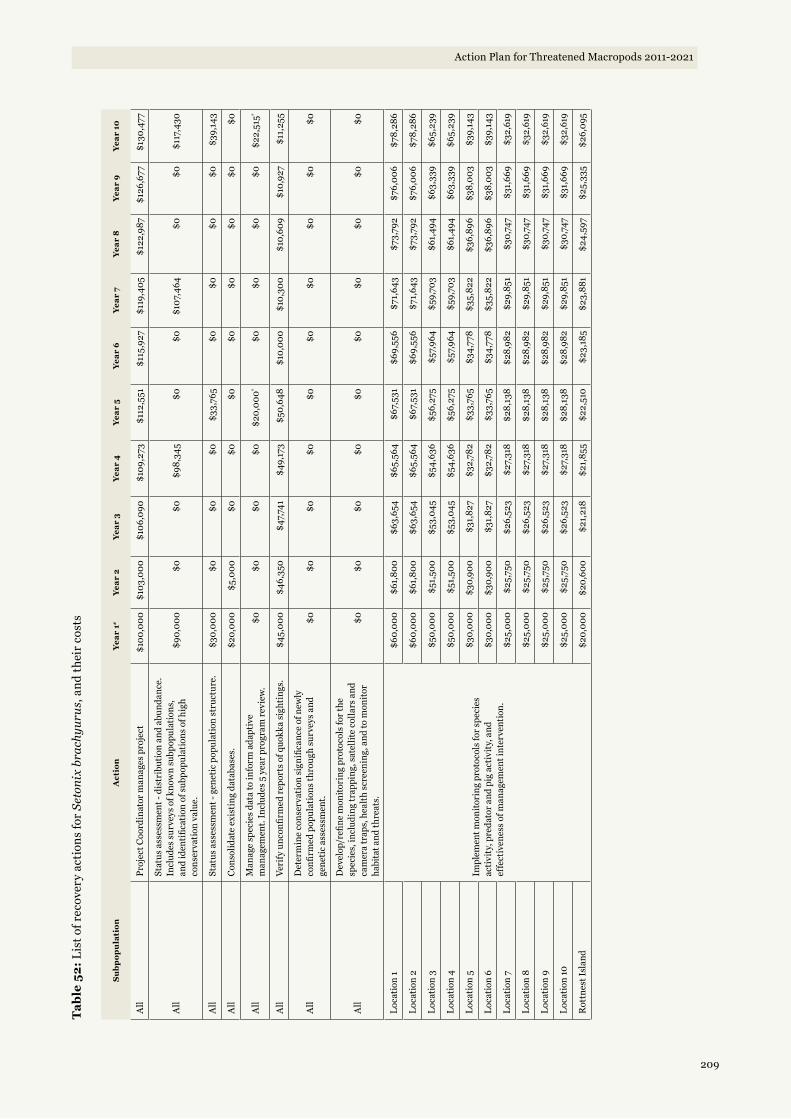
209
Action Plan for Threatened Macropods 2011-2021
Tab
le 5
2: L
ist o
f rec
over
y ac
tion
s fo
r Se
toni
x br
achy
urus
, and
the
ir c
osts
Su
bp
op
ula
tio
nA
ctio
nY
ear
1#Y
ear
2Y
ear
3Y
ear
4Y
ear
5Y
ear
6Y
ear
7Y
ear
8Y
ear
9Y
ear
10
All
Proj
ect C
oord
inat
or m
anag
es p
roje
ct$1
00,0
00$1
03,0
00$1
06,0
90$1
09,2
73$1
12,5
51$1
15,9
27$1
19,4
05$1
22,9
87$1
26,6
77$1
30,4
77
All
Stat
us a
sses
smen
t - d
istr
ibut
ion
and
abun
danc
e.
Incl
udes
sur
veys
of k
now
n su
bpop
ulat
ions
, an
d id
enti
ficat
ion
of s
ubpo
pula
tion
s of
hig
h co
nser
vati
on v
alue
.
$90,
000
$0$0
$98,
345
$0$0
$107
,464
$0$0
$117
,430
All
Stat
us a
sses
smen
t - g
enet
ic p
opul
atio
n st
ruct
ure.
$30,
000
$0$0
$0$3
3,76
5$0
$0$0
$0$3
9,14
3
All
Con
solid
ate
exis
ting
dat
abas
es.
$20,
000
$5,0
00$0
$0$0
$0$0
$0$0
$0
All
Man
age
spec
ies
data
to in
form
ada
ptiv
e m
anag
emen
t. In
clud
es 5
yea
r pro
gram
rev
iew
.$0
$0$0
$0$2
0,00
0*$0
$0$0
$0$2
2,51
5*
All
Veri
fy u
ncon
firm
ed r
epor
ts o
f quo
kka
sigh
ting
s.$4
5,00
0$4
6,35
0$4
7,74
1$4
9,17
3$5
0,64
8$1
0,00
0$1
0,30
0$1
0,60
9$1
0,92
7$1
1,25
5
All
Det
erm
ine
cons
erva
tion
sig
nific
ance
of n
ewly
co
nfirm
ed p
opul
atio
ns th
roug
h su
rvey
s an
d ge
neti
c as
sess
men
t.$0
$0$0
$0$0
$0$0
$0$0
$0
All
Dev
elop
/refi
ne m
onito
ring
pro
toco
ls fo
r the
sp
ecie
s, in
clud
ing
trap
ping
, sat
ellit
e co
llars
and
ca
mer
a tr
aps,
hea
lth
scre
enin
g, a
nd to
mon
itor
habi
tat a
nd th
reat
s.
$0$0
$0$0
$0$0
$0$0
$0$0
Loc
atio
n 1
Impl
emen
t mon
itori
ng p
roto
cols
for s
peci
es
acti
vity
, pre
dato
r and
pig
act
ivit
y, a
nd
effe
ctiv
enes
s of
man
agem
ent i
nter
vent
ion.
$60,
000
$61,
800
$63,
654
$65,
564
$67,
531
$69,
556
$71,
643
$73,
792
$76,
006
$78,
286
Loc
atio
n 2
$60,
000
$61,
800
$63,
654
$65,
564
$67,
531
$69,
556
$71,
643
$73,
792
$76,
006
$78,
286
Loc
atio
n 3
$50,
000
$51,
500
$53,
045
$54,
636
$56,
275
$57,
964
$59,
703
$61,
494
$63,
339
$65,
239
Loc
atio
n 4
$50,
000
$51,
500
$53,
045
$54,
636
$56,
275
$57,
964
$59,
703
$61,
494
$63,
339
$65,
239
Loc
atio
n 5
$30,
000
$30,
900
$31,
827
$32,
782
$33,
765
$34,
778
$35,
822
$36,
896
$38,
003
$39,
143
Loc
atio
n 6
$30,
000
$30,
900
$31,
827
$32,
782
$33,
765
$34,
778
$35,
822
$36,
896
$38,
003
$39,
143
Loc
atio
n 7
$25,
000
$25,
750
$26,
523
$27,
318
$28,
138
$28,
982
$29,
851
$30,
747
$31,
669
$32,
619
Loc
atio
n 8
$25,
000
$25,
750
$26,
523
$27,
318
$28,
138
$28,
982
$29,
851
$30,
747
$31,
669
$32,
619
Loc
atio
n 9
$25,
000
$25,
750
$26,
523
$27,
318
$28,
138
$28,
982
$29,
851
$30,
747
$31,
669
$32,
619
Loc
atio
n 10
$25,
000
$25,
750
$26,
523
$27,
318
$28,
138
$28,
982
$29,
851
$30,
747
$31,
669
$32,
619
Rot
tnes
t Isl
and
$20,
000
$20,
600
$21,
218
$21,
855
$22,
510
$23,
185
$23,
881
$24,
597
$25,
335
$26,
095

210
Action Plan for Threatened Macropods 2011-2021
Su
bp
op
ula
tio
nA
ctio
nY
ear
1#Y
ear
2Y
ear
3Y
ear
4Y
ear
5Y
ear
6Y
ear
7Y
ear
8Y
ear
9Y
ear
10
Bal
d Is
land
Hea
lth
and
dise
ase
scre
enin
g.
$25,
000
$25,
750
$0$2
7,31
8$2
8,13
8$0
$29,
851
$30,
747
$0$3
2,61
9
Rot
tnes
t Isl
and
$25,
000
$25,
750
$0$2
7,31
8$2
8,13
8$0
$29,
851
$30,
747
$0$3
2,61
9
Rot
atin
g m
ainl
and
loca
tion
$25,
000
$25,
750
$26,
523
$27,
318
$28,
138
$28,
982
$29,
851
$30,
747
$31,
669
$32,
619
Loc
atio
n 1
Impl
emen
t mon
itori
ng p
roto
cols
for fi
re
man
agem
ent a
nd h
abit
at c
ondi
tion
, and
ef
fect
iven
ess
of m
anag
emen
t int
erve
ntio
n.
$20,
000
$20,
600
$21,
218
$21,
855
$22,
510
$23,
185
$23,
881
$24,
597
$25,
335
$26,
095
Loc
atio
n 2
$20,
000
$20,
600
$21,
218
$21,
855
$22,
510
$23,
185
$23,
881
$24,
597
$25,
335
$26,
095
Loc
atio
n 3
$20,
000
$20,
600
$21,
218
$21,
855
$22,
510
$23,
185
$23,
881
$24,
597
$25,
335
$26,
095
Loc
atio
n 4
$20,
000
$20,
600
$21,
218
$21,
855
$22,
510
$23,
185
$23,
881
$24,
597
$25,
335
$26,
095
Loc
atio
n 5
$20,
000
$20,
600
$21,
218
$21,
855
$22,
510
$23,
185
$23,
881
$24,
597
$25,
335
$26,
095
Loc
atio
n 6
$15,
000
$15,
450
$15,
914
$16,
391
$16,
883
$17,
389
$17,
911
$18,
448
$19,
002
$19,
572
Loc
atio
n 7
$15,
000
$15,
450
$15,
914
$16,
391
$16,
883
$17,
389
$17,
911
$18,
448
$19,
002
$19,
572
Loc
atio
n 8
$15,
000
$15,
450
$15,
914
$16,
391
$16,
883
$17,
389
$17,
911
$18,
448
$19,
002
$19,
572
Loc
atio
n 9
$15,
000
$15,
450
$15,
914
$16,
391
$16,
883
$17,
389
$17,
911
$18,
448
$19,
002
$19,
572
Loc
atio
n 10
$15,
000
$15,
450
$15,
914
$16,
391
$16,
883
$17,
389
$17,
911
$18,
448
$19,
002
$19,
572
Loc
atio
n 1
Con
duct
str
ateg
ic fe
ral p
reda
tor c
ontr
ol in
qu
okka
hab
itat
.
$30,
000
$30,
900
$31,
827
$32,
782
$33,
765
$34,
778
$35,
822
$36,
896
$38,
003
$39,
143
Loc
atio
n 2
$30,
000
$30,
900
$31,
827
$32,
782
$33,
765
$34,
778
$35,
822
$36,
896
$38,
003
$39,
143
Loc
atio
n 3
$30,
000
$30,
900
$31,
827
$32,
782
$33,
765
$34,
778
$35,
822
$36,
896
$38,
003
$39,
143
Loc
atio
n 4
$30,
000
$30,
900
$31,
827
$32,
782
$33,
765
$34,
778
$35,
822
$36,
896
$38,
003
$39,
143
Loc
atio
n 5
$30,
000
$30,
900
$31,
827
$32,
782
$33,
765
$34,
778
$35,
822
$36,
896
$38,
003
$39,
143
Loc
atio
n 6
$30,
000
$30,
900
$31,
827
$32,
782
$33,
765
$34,
778
$35,
822
$36,
896
$38,
003
$39,
143
Loc
atio
n 7
$30,
000
$30,
900
$31,
827
$32,
782
$33,
765
$34,
778
$35,
822
$36,
896
$38,
003
$39,
143
Loc
atio
n 8
$30,
000
$30,
900
$31,
827
$32,
782
$33,
765
$34,
778
$35,
822
$36,
896
$38,
003
$39,
143
Loc
atio
n 9
$30,
000
$30,
900
$31,
827
$32,
782
$33,
765
$34,
778
$35,
822
$36,
896
$38,
003
$39,
143
Loc
atio
n 10
$30,
000
$30,
900
$31,
827
$32,
782
$33,
765
$34,
778
$35,
822
$36,
896
$38,
003
$39,
143

211
Action Plan for Threatened Macropods 2011-2021
Su
bp
op
ula
tio
nA
ctio
nY
ear
1#Y
ear
2Y
ear
3Y
ear
4Y
ear
5Y
ear
6Y
ear
7Y
ear
8Y
ear
9Y
ear
10
Loc
atio
n 1
Con
duct
str
ateg
ic fe
ral p
ig c
ontr
ol in
quo
kka
habi
tat.
$10,
000
$10,
300
$10,
609
$10,
927
$11,
255
$11,
593
$11,
941
$12,
299
$12,
668
$13,
048
Loc
atio
n 2
$10,
000
$10,
300
$10,
609
$10,
927
$11,
255
$11,
593
$11,
941
$12,
299
$12,
668
$13,
048
Loc
atio
n 3
$10,
000
$10,
300
$10,
609
$10,
927
$11,
255
$11,
593
$11,
941
$12,
299
$12,
668
$13,
048
Loc
atio
n 4
$10,
000
$10,
300
$10,
609
$10,
927
$11,
255
$11,
593
$11,
941
$12,
299
$12,
668
$13,
048
Loc
atio
n 5
$5,0
00$5
,150
$5,3
05$5
,464
$5,6
28$5
,796
$5,9
70$6
,149
$6,3
34$6
,524
Loc
atio
n 6
$5,0
00$5
,150
$5,3
05$5
,464
$5,6
28$5
,796
$5,9
70$6
,149
$6,3
34$6
,524
Loc
atio
n 7
$5,0
00$5
,150
$5,3
05$5
,464
$5,6
28$5
,796
$5,9
70$6
,149
$6,3
34$6
,524
Loc
atio
n 8
$5,0
00$5
,150
$5,3
05$5
,464
$5,6
28$5
,796
$5,9
70$6
,149
$6,3
34$6
,524
Loc
atio
n 9
$5,0
00$5
,150
$5,3
05$5
,464
$5,6
28$5
,796
$5,9
70$6
,149
$6,3
34$6
,524
Loc
atio
n 10
$5,0
00$5
,150
$5,3
05$5
,464
$5,6
28$5
,796
$5,9
70$6
,149
$6,3
34$6
,524
Loc
atio
n 1
Con
duct
act
ive
adap
tive
fire
man
agem
ent t
o m
aint
ain
habi
tat c
ondi
tion
.
$25,
000
$25,
750
$26,
523
$27,
318
$28,
138
$28,
982
$29,
851
$30,
747
$31,
669
$32,
619
Loc
atio
n 2
$25,
000
$25,
750
$26,
523
$27,
318
$28,
138
$28,
982
$29,
851
$30,
747
$31,
669
$32,
619
Loc
atio
n 3
$25,
000
$25,
750
$26,
523
$27,
318
$28,
138
$28,
982
$29,
851
$30,
747
$31,
669
$32,
619
Loc
atio
n 4
$25,
000
$25,
750
$26,
523
$27,
318
$28,
138
$28,
982
$29,
851
$30,
747
$31,
669
$32,
619
Loc
atio
n 5
$25,
000
$25,
750
$26,
523
$27,
318
$28,
138
$28,
982
$29,
851
$30,
747
$31,
669
$32,
619
Loc
atio
n 6
$25,
000
$25,
750
$26,
523
$27,
318
$28,
138
$28,
982
$29,
851
$30,
747
$31,
669
$32,
619
Loc
atio
n 7
$25,
000
$25,
750
$26,
523
$27,
318
$28,
138
$28,
982
$29,
851
$30,
747
$31,
669
$32,
619
Loc
atio
n 8
$25,
000
$25,
750
$26,
523
$27,
318
$28,
138
$28,
982
$29,
851
$30,
747
$31,
669
$32,
619
Loc
atio
n 9
$25,
000
$25,
750
$26,
523
$27,
318
$28,
138
$28,
982
$29,
851
$30,
747
$31,
669
$32,
619
Loc
atio
n 10
$25,
000
$25,
750
$26,
523
$27,
318
$28,
138
$28,
982
$29,
851
$30,
747
$31,
669
$32,
619
Sout
h-W
est D
EC
regi
onIn
vest
igat
e ef
fect
s of
fire
on
quok
ka h
abit
at, a
nd
opti
mum
reg
imes
to m
aint
ain
that
hab
itat
.
$0$5
0,00
0$0
$0$0
$0$0
$0$0
$0
War
ren
DE
C re
gion
$0$0
$40,
000
$0$0
$0$0
$0$0
$0
Sout
h C
oast
DE
C re
gion
$0$0
$40,
000
$0$0
$0$0
$0$0
$0
Stud
y L
ocat
ion
PIn
vest
igat
e ef
fect
of t
imbe
r har
vest
ing
on q
uokk
a ha
bita
t.
$0$0
$0$5
0,00
0$5
1,50
0$0
$0$0
$0$0
Stud
y L
ocat
ion
Q$0
$0$0
$10,
000
$10,
300
$0$0
$0$0
$0
Stud
y L
ocat
ion
R$0
$0$0
$10,
000
$10,
300
$0$0
$0$0
$0
Stud
y L
ocat
ion
SC
ondu
ct r
esea
rch
into
quo
kka
diet
ary
anal
ysis
in
conc
ert w
ith
vege
tati
on m
appi
ng a
nd/o
r hab
itat
m
odel
ling
to in
form
man
agem
ent a
ctio
ns.
$0$0
$40,
000
$0$0
$0$0
$0$0
$0
Stud
y L
ocat
ion
T$0
$0$1
0,00
0$0
$0$0
$0$0
$0$0
Stud
y L
ocat
ion
U$0
$0$1
0,00
0$0
$0$0
$0$0
$0$0
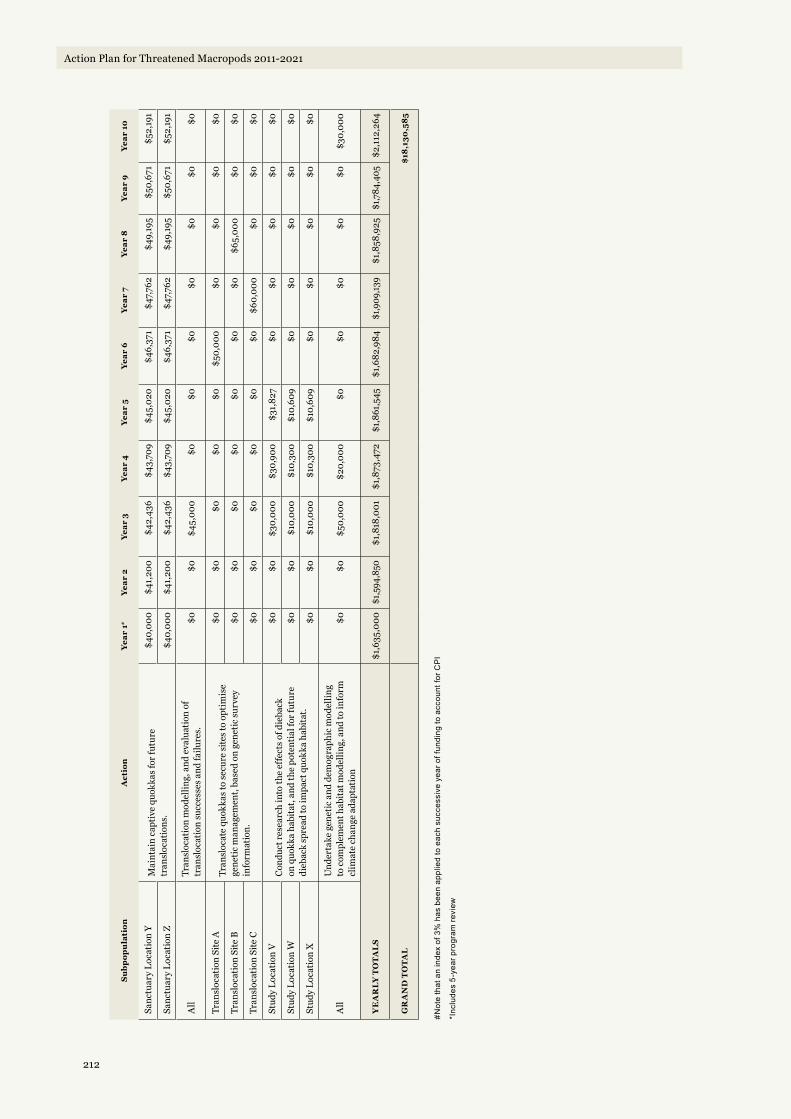
212
Action Plan for Threatened Macropods 2011-2021
Su
bp
op
ula
tio
nA
ctio
nY
ear
1#Y
ear
2Y
ear
3Y
ear
4Y
ear
5Y
ear
6Y
ear
7Y
ear
8Y
ear
9Y
ear
10
Sanc
tuar
y L
ocat
ion
YM
aint
ain
capt
ive
quok
kas
for f
utur
e tr
ansl
ocat
ions
.
$40,
000
$41,
200
$42,
436
$43,
709
$45,
020
$46,
371
$47,
762
$49,
195
$50,
671
$52,
191
Sanc
tuar
y L
ocat
ion
Z$4
0,00
0$4
1,20
0$4
2,43
6$4
3,70
9$4
5,02
0$4
6,37
1$4
7,76
2$4
9,19
5$5
0,67
1$5
2,19
1
All
Tran
sloc
atio
n m
odel
ling,
and
eva
luat
ion
of
tran
sloc
atio
n su
cces
ses
and
failu
res.
$0$0
$45,
000
$0$0
$0$0
$0$0
$0
Tran
sloc
atio
n Si
te A
Tran
sloc
ate
quok
kas
to s
ecur
e si
tes
to o
ptim
ise
gene
tic
man
agem
ent,
base
d on
gen
etic
sur
vey
info
rmat
ion.
$0$0
$0$0
$0$5
0,00
0$0
$0$0
$0
Tran
sloc
atio
n Si
te B
$0$0
$0$0
$0$0
$0$6
5,00
0$0
$0
Tran
sloc
atio
n Si
te C
$0$0
$0$0
$0$0
$60,
000
$0$0
$0
Stud
y L
ocat
ion
VC
ondu
ct r
esea
rch
into
the
effe
cts
of d
ieba
ck
on q
uokk
a ha
bita
t, an
d th
e po
tent
ial f
or fu
ture
di
ebac
k sp
read
to im
pact
quo
kka
habi
tat.
$0$0
$30,
000
$30,
900
$31,
827
$0$0
$0$0
$0
Stud
y L
ocat
ion
W$0
$0$1
0,00
0$1
0,30
0$1
0,60
9$0
$0$0
$0$0
Stud
y L
ocat
ion
X$0
$0$1
0,00
0$1
0,30
0$1
0,60
9$0
$0$0
$0$0
All
Und
erta
ke g
enet
ic a
nd d
emog
raph
ic m
odel
ling
to c
ompl
emen
t hab
itat
mod
ellin
g, a
nd to
info
rm
clim
ate
chan
ge a
dapt
atio
n$0
$0$5
0,00
0$2
0,00
0$0
$0$0
$0$0
$30,
000
YE
AR
LY
TO
TA
LS
$1,6
35,0
00$1
,594
,850
$1,8
18,0
01$1
,873
,472
$1,8
61,5
45$1
,682
,984
$1,9
09,1
39$1
,858
,925
$1,7
84,4
05$2
,112
,264
GR
AN
D T
OT
AL
$18
,130
,58
5
#Not
e th
at a
n in
dex
of 3
% h
as b
een
appl
ied
to e
ach
succ
essi
ve y
ear o
f fun
ding
to a
ccou
nt fo
r CP
I
*Inc
lude
s 5-
year
pro
gram
revi
ew

213
Action Plan for Threatened Macropods 2011-2021
Pr
os
er
Pin
e r
oc
K w
alla
By
(pe
trO
ga
le p
er
se
ph
On
e). ©
ro
d w
illiaM
s/a
us
ca
Pe

Action Plan for Threatened Macropods 2011-2021
$290 Million over 10 Years
species recoverY
invasive species control
record of extinction
This is the estimated cost of down-listing Australia’s 21 threatened and near-threatened species of macropods on the IUCN Red List of Threatened Species by 2021.
The prevalent requirement for fox and cat control in this action plan indicates that predation by introduced animals requires renewed investment and research if we are to successfully address this problem, not only for threatened macropods, but for a very broad range of native animals that face the same threats.
Seven of 57 species of Australian macropod have become extinct since European settlement. Of the 50 species remaining, 42% are listed as threatened or near threatened with extinction.
The general failure of species recovery processes to achieve down-listing in threat status of macropods over the last 15 years highlights the importance of immediate and comprehensive action to secure all macropod species and their habitats.
australia’s threatened Macropods
Why we are here
wwf.org.au
To stop the degradation of the planet’s natural environment andto build a future in which humans live in harmony with nature.
©1986 Panda symbol WWF ® WWF is a registered trademark
WWF-Australia National Office
Level 13, 235 Jones Street,Ultimo NSW 2007GPO Box 528 Sydney NSW 2001
Tel: 61 2 9281 5515Freecall: 1800 032 551Fax: 61 2 9281 1060Email: [email protected]
© N
AS
A