the acyl-acp thioesterase fatm from lotus japonicus
TRANSCRIPT

The Acyl-ACP Thioesterase FatM from Lotus japonicus
is involved in lipid transfer during Arbuscular
Mycorrhiza Symbiosis
Dissertation
zur
Erlangung des Doktorgrades (Dr. rer. nat.)
der
Mathematisch-Naturwissenschaftlichen Fakultät
der
Rheinischen Friedrich-Wilhelms-Universität Bonn
vorgelegt von
Mathias Brands
Bonn, Juli 2019

II
Angefertigt mit Genehmigung der Mathematisch-Naturwissenschaftlichen
Fakultät der Rheinischen Friedrich-Wilhelms-Universität Bonn
1. Gutachter: Prof. Dr. Peter Dörmann
2. Gutachter: Prof. Dr. Andreas Meyer
Tag der Promotion: 14.10.2019
Erscheinungsjahr: 2020

III
Table of Contents
1 INTRODUCTION........................................................................................................................................... 1
1.1 Lipids and Fatty Acids ........................................................................................................................... 1 1.1.1 Plant Glycerolipid Synthesis ........................................................................................................................ 2
1.1.1.1 Membrane Glycerolipids ....................................................................................................................... 2 1.1.1.2 Storage Glycerolipids ............................................................................................................................. 3
1.1.2 Fatty acid de novo Synthesis in Plants and Fungi ............................................................................... 3
1.2 Arbuscular Mycorrhiza Symbiosis ................................................................................................... 6 1.2.1 Formation and Progression of Root Endosymbiosis with AMF .................................................... 8
1.2.1.1 Bidirectional Signalling and Recognition in the Rhizosphere Leads to Root Colonization ............................................................................................................................................... 8
1.2.1.2 Arbuscule Formation ........................................................................................................................... 11 1.2.1.2.1 Arbuscule Life Cycle Dynamics ............................................................................................. 12
1.2.1.3 Post-Symbiotic Growth: Generation of Vesicles and Asexual Spores .............................. 13 1.2.2 Reciprocal Nutrient Exchange ................................................................................................................. 13
1.2.2.1 Mineral Nutrient Uptake and Transport ..................................................................................... 13 1.2.2.2 Carbon Transfer .................................................................................................................................... 16
1.2.2.2.1 Mono-, Di- and Polysaccharides ............................................................................................ 16 1.2.2.2.2 Fatty Acids and Lipids ............................................................................................................... 18
1.2.3 Lipid Metabolism during AMF Symbiosis ........................................................................................... 19 1.2.3.1 Distribution and Changes of Lipids in AMF................................................................................ 20 1.2.3.2 Fatty Acids of AMF ................................................................................................................................ 22 1.2.3.3 Changes in Plant Lipids and Fatty Acids due to AMF ............................................................. 22
1.3 Research Objectives and Approach ............................................................................................... 23
2 MATERIALS AND METHODS................................................................................................................. 25
2.1 Materials ................................................................................................................................................. 25 2.1.1 Equipment ....................................................................................................................................................... 25 2.1.2 Consumables ................................................................................................................................................... 26 2.1.3 Chemicals ......................................................................................................................................................... 27 2.1.4 Antibiotics ........................................................................................................................................................ 28 2.1.5 Commercial Kits and Enzymes ................................................................................................................ 28 2.1.6 Internal Standards for Lipid Quantification and Identification ................................................. 29 2.1.7 Plants, Bacteria and Fungi ......................................................................................................................... 30 2.1.8 Software and Online Resources .............................................................................................................. 31
2.2 Methods ................................................................................................................................................... 32 2.2.1 Minimal Statistics.......................................................................................................................................... 32 2.2.2 Identification and Isolation of Homozygous Insertional Mutants in L. japonicus
Acyl-ACP Thioesterases ............................................................................................................................. 32 2.2.2.1 Phylogenetic Tree of Plant Acyl-ACP Thioesterases .............................................................. 33 2.2.2.2 Amino Acid Sequence Comparison of Yeast and R. irregularis Desaturases ................ 33 2.2.2.3 Cultivation of N. benthamiana ......................................................................................................... 34 2.2.2.4 Cultivation of L. japonicus .................................................................................................................. 34 2.2.2.5 Inoculation of L. japonicus with R. irregularis ........................................................................... 35
2.2.2.5.1 Staining of Fungal Structures in Colonized Roots and Microscopy ........................ 35 2.2.2.5.2 Quantification of Colonization Parameters ...................................................................... 36
2.2.2.6 Root axenic Culture of D. carota with R. irregularis ............................................................... 36 2.2.2.6.1 Extraction of R. irregularis ERM from Culture ................................................................ 37

IV
2.2.2.7 Measurement of Shoot Inorganic Phosphate ............................................................................ 38 2.2.3 Methods for Working with Nucleic Acids ........................................................................................... 38
2.2.3.1 Isolation of Genomic DNA from Plant Tissue ............................................................................ 38 2.2.3.2 Polymerase Chain Reaction .............................................................................................................. 39 2.2.3.3 Restriction Digestion ........................................................................................................................... 39 2.2.3.4 Ligation ..................................................................................................................................................... 40 2.2.3.5 Preparation of Plasmid DNA ............................................................................................................ 41 2.2.3.6 Elution of Nucleic Acids from Agarose Gels ............................................................................... 41 2.2.3.7 Amplification of Expressed Genes by RT-PCR .......................................................................... 41
2.2.3.7.1 Isolation of RNA from L. japonicus and R. irregularis ................................................... 41 2.2.3.7.2 RNA Formaldehyde Gel Electrophoresis ........................................................................... 41 2.2.3.7.3 First Strand cDNA Synthesis and Reverse Transcription PCR (RT-PCR) ............. 42 2.2.3.7.4 DNA Gel Electrophoresis .......................................................................................................... 43
2.2.4 Heterologous Expression of Coding Sequences in Microorganisms and Plants ................. 43 2.2.4.1 Procedures for working with A. tumefaciens ............................................................................. 43
2.2.4.1.1 Transformation of A. tumefaciens by Electroporation ................................................. 44 2.2.4.1.2 Leaf Infiltration for transient Transformation of N. benthamiana ......................... 44
2.2.4.2 Procedures for working with E. coli .............................................................................................. 45 2.2.4.2.1 Transformation of E. coli by Electroporation .................................................................. 45
2.2.4.3 Procedures for working with S. cerevisiae .................................................................................. 46 2.2.4.3.1 Generation of competent S. cerevisiae and Transformation ...................................... 46 2.2.4.3.2 Selection of recombinant S. cerevisiae ................................................................................ 47 2.2.4.3.3 Growth Parameters and feeding of Fatty Acids to S. cerevisiae ............................... 48
2.2.5 General Procedures for working with Protein ................................................................................. 48 2.2.5.1 SDS-PAGE and Coomassie Staining ............................................................................................... 49 2.2.5.2 Western Blot and Immunodetection ............................................................................................ 50 2.2.5.3 Determination of Protein Concentration .................................................................................... 51
2.2.6 Synthesis of Acyl-ACP Substrates ........................................................................................................... 51 2.2.6.1 Purification of Acyl-ACP Synthase ................................................................................................. 52 2.2.6.2 Purification of ACP from E. coli ....................................................................................................... 53 2.2.6.3 Acyl-ACP Synthesis and Ion-Exchange Purification ............................................................... 55 2.2.6.4 Urea PAGE ................................................................................................................................................ 57
2.2.7 L. japonicus Acyl-ACP Thioesterase Activity and Enzyme Assay .............................................. 57 2.2.7.1 Heterologous Expression of L. japonicus Thioesterases in E. coli ..................................... 57 2.2.7.2 Recombinant Protein Purification of Plant Acyl-ACP Thioesterases from E. coli ...... 58 2.2.7.3 Enzyme Assay with recombinant L. japonicus Acyl-ACP Thioesterases ........................ 59 2.2.7.4 Liquid Scintillation Counting............................................................................................................ 60
2.2.8 Quantification and Identification of Lipids and Fatty Acids ........................................................ 60 2.2.8.1 Internal Standards for Lipid and Fatty Acid Analysis ............................................................ 60 2.2.8.2 Extraction of Lipids from Plants and fungal ERM ................................................................... 62 2.2.8.3 Extraction of Lipids from E. coli and S. cerevisiae .................................................................... 62 2.2.8.4 Determination of the Double Bond Position in unsaturated Fatty Acids ...................... 63 2.2.8.5 Solid Phase Extraction of Lipid Extracts ..................................................................................... 63 2.2.8.6 Extraction of Acyl-CoA from Plants and Yeast .......................................................................... 64 2.2.8.7 Measurement of Lipids by Q-TOF MS/MS .................................................................................. 65
2.2.8.7.1 Measurement of Lipids by Q-TOF MS/MS with Nanoflow Direct Infusion ......... 65 2.2.8.7.2 Data Analysis for Quantification of Lipids by Q-TOF MS/MS with Nanoflow
Direct Infusion .............................................................................................................................. 66 2.2.8.8 Measurement of Lipids by Q-TOF LC-MS/MS ........................................................................... 67
2.2.8.8.1 Acyl-CoA .......................................................................................................................................... 68 2.2.8.8.2 Acyl-ACP ......................................................................................................................................... 68 2.2.8.8.3 Fatty Acids ..................................................................................................................................... 69 2.2.8.8.4 Data Analysis for Quantification of Lipids by Q-TOF LC-MS/MS ............................. 70
2.2.8.9 Analysis of Fatty Acids Methyl Esters by Gas Chromatography Flame Ionization Detection .................................................................................................................................................. 70

V
2.2.8.10 Analysis of Lipids by Gas Chromatography Mass Spectrometry (GC-MS) ................... 71 2.2.9 Stable 13C-Isotope Labeling ....................................................................................................................... 72
2.2.9.1 Labeling with 13C-Acetate .................................................................................................................. 72 2.2.9.2 Quantification of 13C Over-Excess Label in Fatty Acid Isotopologs .................................. 72
3 RESULTS...................................................................................................................................................... 73
3.1 The Function of FatM in Arbuscular Mycorrhiza Symbiosis ................................................ 73 3.1.1 The phylogenetic Relationship of Acyl-ACP Thioesterases in Mycorrhiza Host and
non-Host Plant Species reveals mycorrhiza-specific Clades....................................................... 73 3.1.2 Isolation of fatm mutant Plants and Analysis of Mycorrhiza-dependent Gene
Expression ....................................................................................................................................................... 73 3.1.3 The fatm Mutation affects Root Colonization and Lipid Storage in R. irregularis and
symbiotic Phosphate Transfer to the Plant ........................................................................................ 75 3.1.4 Arbuscule Branching is distorted in fatm-1 ....................................................................................... 78 3.1.5 Arbuscule Branching and Root Colonization is restored by genetic Complementation
of fatm-1 ........................................................................................................................................................... 80 3.1.6 Lipid with Mycorrhiza-desaturation Signature are decreased in colonized fatm
Mutants ............................................................................................................................................................. 80 3.1.6.1 Glycerolipids and Fatty Acids .......................................................................................................... 82 3.1.6.2 Comparison between Neutral Lipid Fatty Acids and Polar Lipid Fatty Acids .............. 84 3.1.6.3 Free Sterols .............................................................................................................................................. 84
3.1.7 β-Monoacylglycerol has a Mycorrhiza-signature and is decreased in Colonized fatm Mutants ............................................................................................................................................................. 87
3.1.8 The Mycorrhiza-specific LjFatM Acyl-ACP Thioesterase preferentially hydrolyses Palmitoyl-ACP ................................................................................................................................................ 90
3.1.9 Substrate Specificities of the non-Mycorrhiza-specific Acyl-ACP Thioesterases LjFatA and LjFatB .......................................................................................................................................... 92
3.1.10 Labeling of de novo synthesized Fatty Acids with 13C-Acetate reveals a Flux of Fatty Acids from the Plant to the Fungus via FatM .................................................................................... 94
3.2 Fatty Acid Desaturation in R. irregularis .................................................................................. 100 3.2.1 The acyl-CoA Pool Composition in Host Roots is changed by AMF Colonization ............100 3.2.2 R. irregularis contains Desaturases with Homology to Yeast Acyl-CoA Desaturase
OLE1 .................................................................................................................................................................101 3.2.3 The Auxotrophy for Oleic Acid of the Yeast Δole1 Mutant is complemented by
Expression of R. irregularis RiOLE1 and RiOLE1-LIKE .................................................................102 3.2.4 Mycorrhiza-Signature Fatty Acids are synthesized by RiOLE1-LIKE ....................................103 3.2.5 RiOLE1 and RiOLE1-LIKE are Front-End Desaturases producing Δ9 or Δ11 Double
Bonds ...............................................................................................................................................................105 3.2.6 Expression of RiOLE1 and RiOLE1-LIKE influences Desaturation of the acyl-CoA Pool 107
4 DISCUSSION ............................................................................................................................................. 110
4.1 The L. japonicus Acyl-ACP Thioesterase FatM is required for the Synthesis of Palmitic Acid for Feeding of the Mycorrhiza Fungi ............................................................... 110
4.1.1 Arbuscular Mycorrhiza Host Plant Species contain an evolutionary conserved Set of Genes for Lipid Synthesis during Symbiosis....................................................................................110
4.1.2 FatM is required for unimpeded Mycorrhiza Colonization .......................................................111 4.1.2.1 The FatM Mutation affects Mycorrhzia Marker Gene Expression ..................................111 4.1.2.2 The Mutation of FatM Leads to Defective Fungal Fine Branching during the
Formation of Functional Arbuscules and compromises Symbiotic Phosphate Transfer ..................................................................................................................................................111
4.1.2.3 Lipid Storage in R. irregularis is compromised by the fatm Mutation ..........................112

VI
4.1.3 Lipid Accumulation in AMF and use of Lipids as Biomarkers for Mycorrhiza Colonization ..................................................................................................................................................113
4.1.4 FatM dictates symbiotic Fatty Acid Supply for R. irregularis ...................................................114 4.1.4.1 Reprogramming of Plastidial Fatty Acid Synthesis by AMF ..............................................114 4.1.4.2 Transfer of Symbiotic Fatty Acids after Labeling with 13C2-Acetate ..............................116
4.1.4.2.1 Estimation of the Rate of Symbiotic Fatty Acid Transfer .........................................118 4.1.5 RAM2 might synthesize β-Monoacylglycerols for AMF from Fatty Acids released by
FatM ..................................................................................................................................................................120 4.1.5.1 Lipid Secretion across the Symbiotic Interface ......................................................................123
4.1.6 Possible alternative Mechanisms for AMF to obtain Fatty Acids and Lipids .....................125
4.2 Fatty Acid Desaturation in R. irregularis .................................................................................. 126 4.2.1 R. irregularis contains two Functional Homologs of ScOLE1 ....................................................126 4.2.2 RiOLE1-LIKE is specialized for Mycorrhiza-Signature Fatty Acids ........................................127 4.2.3 RiOLE1-LIKE and RiOLE1 are Front-End Desaturases ................................................................128 4.2.4 Acyl-CoA Accumulation during Symbiosis with R. irregularis .................................................128 4.2.5 Importance of desaturated Fatty Acids in R. irregularis .............................................................129
5 SUMMARY ................................................................................................................................................. 131
6 REFERENCES ............................................................................................................................................ 133
7 APPENDIX ................................................................................................................................................. 151
7.1 Synthetic Oligonucleotides and PCR Reaction Conditions .................................................. 151
7.2 Glycostocks .......................................................................................................................................... 154
7.3 Transcriptomics of L. japonicus Fat genes ................................................................................ 156
7.4 Cloning of RiOLE1 and RiOLE1-like into the Yeast Expression Vector pDR196 ........... 157
7.5 Cloning of RiOLE1 and RiOLE1-LIKE into Expression Vectors for N. benthamiana ..... 159
7.6 Cloning of LjFatA, LjFatB and LjFatM into pQE80L for Expression in E. coli ................. 161
7.7 Golden Gate Cloning of the LjFatM Gene and Promoter and Genetic Complementation of fatm-1 ........................................................................................................... 163
7.8 Mass-over-charge Values for the Quantification of Lipids .................................................. 166
7.9 Glycerolipid molecular Species Distribution during Mycorrhiza Symbiosis in fatm Mutants and WT ................................................................................................................................. 172
7.10 Preparation of acyl-ACP Substrates ......................................................................................... 174

VII
Figures Figure 1: Reactions of Fatty Acid de novo Synthesis in Plants and Fungi. .................................................. 4 Figure 2: Life Cycle Stages and Progression of AM Root Colonization. ....................................................... 9 Figure 3: Uptake, Transport, Exchange and Metabolism of Nutrients at the Symbiotic Interface 14 Figure 4: Phylogenetic Tree of acyl-ACP Thioesterases from AM Host and Non-Host Plants. ....... 74 Figure 5: Isolation of FatM Insertional Mutants and Mycorrhiza-induced Marker Gene
Expression. .................................................................................................................................................... 76 Figure 6: Colonization Parameters and symbiotic Phosphate Uptake in colonized fatm and WT
Roots. ............................................................................................................................................................... 77 Figure 7: Stunted Arbuscules appear in colonized fatm Mutants. ............................................................. 79 Figure 8: Genetic Complementation of defective Arbuscule Morphology in the fatm-1 mutant. .. 81 Figure 9: Comparison of Mycorrhiza-Signature Fatty Acids in total Fatty Acids from
L. japonicus WT and fatm mutant Roots. .......................................................................................... 83 Figure 10: Mycorrhiza-Signature Fatty Acids are differentially reduced in colonized fatm-1
Mutants. ........................................................................................................................................................ 85 Figure 11: Membrane Sterol Lipid Quantification in R. irregularis extraradical Mycelium and
colonized L. japonicus WT and fatm-1 Mutant Roots. ................................................................ 86 Figure 12: Identification of Monoacylglycerol molecular Species with a Mycorrhiza-Signature. 88 Figure 13: Monoacylgycerol Composition in mock-inoculated and colonized L. japonicus
Roots of WT and fatm-1. ........................................................................................................................ 89 Figure 14: Expression of L. Japonicus acyl-ACP Thioesterase FatM in E. coli and in vitro
Enzyme Assay with recombiant FatM. ............................................................................................. 91 Figure 15: Expression of L. Japonicus Acyl-ACP Thioesterases FatA and FatB not involved in
AM Symbiosis in E. coli and in vitro Enzyme Assay with Recombinant Protein. ........... 93 Figure 16: 13C-Acetate Labeling of Fatty Acids during Symbiosis in WT and fatm-1 Roots at
4wpi. ............................................................................................................................................................... 96 Figure 17: Relative Proportion of 13C-Acetate Labeling of Fatty Acids during Symbiosis. .............. 98 Figure 18: Distribution of 13C-Label in Fatty Acids during AMF-Symbiosis and
mock-Treatment. ...................................................................................................................................... 99 Figure 19: Alteration of the acyl-CoA Pool during AMF Symbiosis......................................................... 100 Figure 20: Protein Sequences of R. irregularis similar to S. cerevisiae acyl-CoA Desaturase
OLE1. ........................................................................................................................................................... 101 Figure 21: Growth Complementation of S. cerevisiae Δole1 by Expression of R. irregularis
RiOLE1 and RiOLE1-LIKE. ................................................................................................................... 102 Figure 22: Identification and Quantification of Mycorrhiza-Signature Fatty Acids in N.
benthamiana and S. cerevisiae expressing R. irregularis OLE1 orthologs. ..................... 104 Figure 23: Fatty Acid Composition of Fatty Acid-supplemented Yeast Cultures Expressing
R. irregularis Desaturases. .................................................................................................................. 105 Figure 24: Fatty Acid Methyl Ester DMDS-adducts from Yeast Cultures Expressing
R. irregularis Desaturases. .................................................................................................................. 106 Figure 25: GC-MS Mass Spectra and Structures of Methyl-bis(methylthio) Fatty Acids. .............. 108 Figure 26: Acyl-CoA Composition in N. benthamiana and S. cerevisiae expressing RiOLE1 and
RiOLE1-LIKE. ............................................................................................................................................ 109 Figure 27: Metabolism of 13C-Acyl Groups after 13C2-Acetate Labeling during AM symbiosis .... 119 Figure 28: Cutin Biosynthesis in Arabidopsis Aerial Parts compared to hypothetical
extracellular Lipid Secretion stimulated by Mycorrhiza Colonization in AMF-host Roots. .......................................................................................................................................................... 121
Figure 29: Gene Expression of L. japonicus Fat Genes during differential Treatments. ................ 156 Figure 30: Vector for constitutive Expression of RiOLE1 and RiOLE1-LIKE in S. cerevisiae. ........ 158 Figure 31: Vectors for transient Expression of RiOLE1 and RiOLE1-LIKE in N. benthamiana. .... 160 Figure 32: Expression Vectors for heterologous Expression of L. japonicus Acyl-ACP
Thioesterases in E. coli. ....................................................................................................................... 162

VIII
Figure 33: Molecular Species Composition of Membrane Galactolipids and Phospholipids in colonized WT and fatm Mutants at 4 wpi. ................................................................................... 172
Figure 34: Molecular Species Composition of non-Membrane Neutral Glycerolipids in colonized WT and fatm Mutants at 4 wpi. ................................................................................... 173
Figure 35: Preparation of acyl-ACP Substrates. .............................................................................................. 174

IX
Tables Table 1: Cloning and Expression Vectors ............................................................................................................. 30 Table 2: Recombinant Expression Vectors .......................................................................................................... 31 Table 3: Instrument Settings for Q-TOF MS/MS Nanoflow Direct Infusion ........................................... 66 Table 4: Parameters of Lipid classes for Quantification with Q-TOF MS/MS Nanoflow Direct
Infusion ............................................................................................................................................................. 66 Table 5: Instrument Settings for Q-TOF LC-MS/MS ......................................................................................... 67 Table 6: Parameters of Lipid Classes for Quantification with Q-TOF LC MS/MS ................................. 67 Table 7: Parameters for Acyl-CoA Analysis with Q-TOF LC-MS .................................................................. 68 Table 8: Liquid Chromatography Gradient for Acyl-CoA ............................................................................... 68 Table 9: Parameters for Acyl-ACP Analysis with Q-TOF LC-MS .................................................................. 69 Table 10: Liquid Chromatography Gradient for Acyl-ACP ............................................................................ 69 Table 11: Parameters for Fatty Acid Analysis with Q-TOF LC-MS ............................................................. 70 Table 12: Liquid Chromatography Gradient for Fatty Acids ........................................................................ 70 Table 13: Parameters for Gas Chromatography Flame Ionization (GC-FID) ......................................... 71 Table 14: Gas Chromatograph Parameters for GC-MS .................................................................................... 72 Table 15: Cloning of RiOLE1 and RiOLE1-LIKE for Expression in Yeast. .............................................. 157 ............................................................................................................................................................................................. 158 Table 16: Cloning of RiOLE1 and RiOLE1-LIKE for Expression in N. benthamiana........................... 159 Table 17: Cloning of L. japonicus Fat coding sequences for expression in E. coli. ............................ 161 ............................................................................................................................................................................................. 166 Table 18: Calculated masses of ion adducts (targeted list) for Phospholipids, Galactolipids,
Sufolipid and Neutral Lipids ................................................................................................................ 166 Table 19: Caclulated Molecular Masses of Acyl-CoA, Acyl-ACP and Fatty Acids adduct ions ...... 169 Table 20: Molecular masses of MAG ions and respective product ions used for the
identifaction and quantification by GC-MS .................................................................................... 170 Table 21: Molecular masses, parental ions and product ions used for the identification and
quantification of free sterols by GC-MS .......................................................................................... 171

X
Frequently used Abbreviations ACP Acyl carrier protein AMF Arbuscular mycorrhiza fung(us/i) ATP Adenosine triphosphate A. tumefaciens Agrobacterium tumefaciens BLAST Basic local alignment search tool Ci Curie CTAB Cetyltrimethylammonium bromide ddH20 Double deionized water DAG Diacylglycerol DGDG Digalactosyldiacylglycerol DNA Deoxyribonucleic acid dpi Days post infection dpm Disintegrations per minute DMDS Dimehtyldisulfide DTT Dithiothreitol E. coli Escherichia coli EDTA Ethylenediaminetetraacetic acid ERM Extraradical mycelium ER Endoplasmic reticulum EtBr Ethidium bromide FA Fatty acid FAME Fatty acid methyl ester Fat Fatty acyl-ACP thioesterase Fig Figure FW Fresh weight FS Free sterol g Standard gravity (g = 9.81 m s-2) Gal Galactose GC-FID Gas chromatograph with flame ionization detector GC-MS Gas chromatograph with mass spectrometer G. intraradices/Gi Glomus intraradices (syn. Rhiozphagus irregularis) GPAT Glycerol-3-phosphate acyltransferase h Hour(s) IS Internal standard KAS 3-ketoacyl-ACP synthase KOH Potassium hydroxide LB Lysogeny broth LiCl Lithium chloride L. japonicus/Lj Lotus japonicus MAG Monoacylglycerol M. truncatula/Mt Medicago truncatula MES 2-(N-morpholino)ethanesulfonic acid MGDG Monogalactosyldiacylglycerol min Minute(s) mock Mock-inoculated mol% Molar percentage myc Mycorrhiza MS/MS Tandem mass spectrometry m/z Mass to charge ratio N. benthamiana Nicotiana benthamiana OD600/660 Optical density at a wavelength of 600/660 nm OE Overexpression OLE1 Oleic acid requiring 1

XI
ON Over night PA Phosphatidic acid PAM Periarbuscular membrane PAS Periarbuscular space PBM Peribacteroid membrane PC Phosphatidylcholine PCR Polymerase chain reaction PE Phosphatidylethanolamine PIPES Piperazine-N,N′-bis(2-ethanesulfonic acid) PS Phosphatidylserine ppm Parts per million PPA Pre-penetration apparatus Q-TOF MS Quadrupole time-of-flight mass spectrometer R. irregularis/Ri R. irregularis RNA Ribonucleic acid RT Room temperature RT-PCR Reverse transcriptase polymerase chain reaction sec Second S. cerevisiae S. cerevisiae sn Stereospecific numbering SPE Solid phase extraction SQDG Sulfoquinovosyldiacylglycerol TBE Tris-boric acid-EDTA TE Tris-EDTA TY Tryptone yeast TAG Triacylglycerol TBE Tris, boric acid, EDTA TML Tris, LiCl, MgCl2 UV Ultra violet % (v/v) Percent volume per volume (mL per 100 mL) WT Wild type % (w/v) Percent weight per volume (g per 100 mL) WGA Wheat germ agglutinin WPI Weeks post inoculationion YNB Yeast nitrogen base Fatty acids are abbreviated x:Y, where X represents the number of carbon atoms, and Y
represents the number of double bonds. β-sitosterol is abbreviated as sitosterol throughout the
text.

1
1 Introduction
1.1 Lipids and Fatty Acids
Lipids are the main components of biological membranes and therefore exert an important
function in cellular and organellar compartmentalization in eukaryotic cells. In plants,
glycerolipids, sphingolipids and sterols are the major membrane-forming lipids. Non-membrane
forming storage lipids (triacylglycerol) are an important source of reducing energy and carbon in
cellular metabolism in adipose tissues of animals and seeds of plants. During β-oxidation in the
peroxisomes of plants, fatty acids of storage lipids are mobilized and yield the reducing agent
NADH as well as the carbon building block acetyl-CoA. Plant lipids can serve in signal transduction
(e. g. jasmonic acid, abscisic acid) and provide anchorage via lipid-modification (e. g. acylation,
prenylation) of proteins and other macromolecules. Lipids also form apoplastic diffusion barriers
in plants. Fatty acids, alcohols, aldehydes and ketones are components of cutin and cuticular
waxes on the aerial organs and fatty acids and aclohols are also found as monomers of suberin in
the roots of plants. These provide a hydrophobic barrier. Some lipids such as tocopherols (vitamin
E) provide antioxidant capacity for protection of membranes against free radicals. Carotenoids
serve as photoprotectants of the photosynthetic apparatus. Finally, the pigments chlorophyll and
phylloquinone are active in dissipation of light energy and electron transfer during
photosynthesis in chloroplasts of plants.
In general, lipids consist of a glycerol (glycerolipids), a ceramide (sphingolipids) or a sterol
backbone. Glycerol in gycerolipids has three hydroxyl groups that can be bound to either a polar
head group or non-polar fatty acids. Gycerolipids are classified based on the properties of their
head group, which can be charged. It can contain phosphate (phosphoglycerolipids) or sugar
(glycoglycerolipids). In these lipids, the remaining two glycerol hydroxyl groups are esterified to
fatty acids. The carbon atoms of the fatty acids can either be saturated with hydrogen (saturated
fatty acids) or contain one (mono) or multiple (poly) unsaturated double bonds formed by
dehydrogenation of carbon atoms. The degree of saturation of fatty acids in membrane-lipids
influences the membrane fluidity. Next to the polar lipids, lipids without head group modification
on the glycerol backbone are uncharged and therefore called neutral lipids.
In membranes, polar glycerolipids form a bilayer by hydrophobic interactions of their fatty
acid hydrocarbon tails. Water-soluble molecules from the cytoplasm or the luminal contents of
organelles cannot be dissolved in the hydrophobic bilayer of membranes and therefore,
membranes prevent unwanted diffusion of polar molecules. Membranes are interspersed with
transporter and ion channels for trans-membrane exchanges of compounds between
compartments. Other important lipid components are the sterol lipids. Sterol lipids do not contain
glycerol and can exist in an unmodified (free sterols), esterified (sterol esters), glycosylated

2
(sterol glucosides) or esterified and glycosylated form (acylated sterol glucosides). Free sterols in
plants are mainly campesterol, stigmasterol and sitosterol (Schaeffer et al., 2001). Campesterol is
the precursor for brassinosteroids that are growth hormones and function in biotic stress
response while stigmasterol and sigmasterol are integral parts of membranes.
1.1.1 Plant Glycerolipid Synthesis
Plant membrane glycerolipid synthesis and metabolism involves the plastid and the ER.
Fatty acids are synthesized in the plastid (see 1.1.2) and can be exported to the ER for elongation
and desaturation or directly used in glycerolipid synthesis. Two main routes for glycerolipid
synthesis exist in plants, termed prokaryotic, occurring in the plastids, and eukaryotic, occurring
in the ER membrane (Ohlrogge and Browse, 1995).
In the prokaryotic pathway, acyl-ACP with mainly 18:1Δ9 fatty acid (18:1Δ9-ACP) from
type-II fatty acid de novo synthesis (see 1.1.2) is esterified to the sn-1 position of
glycerol-3-phosphate by GLYCEROL-3-PHOSPHATE ACYLTRANSFERASE (GPAT) to give rise to
lyso-phosphatidic acid (LPA) that is converted to phosphatidic acid (PA) by
LPA-ACYLTRANSFERASE (LPA-AT) via addition of primarily 16:0 fatty acid from 16:0-ACP to the
sn-2 position. The resulting 18:1-16:0-PA is dephosphorylated to yield diacylglycerol (DAG) that
is used as a precursor for the synthesis of the glycoglycerolipids monogalactosyldiacyglycerol
(MGDG), digalactosyldiacylglcerol (DGDG) and sulfoquinovosyldiacylgycerol (SQDG) that either
contain galactose or sulfoquinovose in their head groups. Alternatively, PA is converted to cytidine
diphosphate-DAG (CDP-DAG) that is used for synthesis of the plastidial phosphoglycerolipid
phosphatidylglycerol (PG) (Benning and Ohta, 2005).
The eukaryotic pathway also requires fatty acids synthesized in the plastid but involves
the ER for lipid synthesis. Fatty acids exported from the plastids are converted by LONG CHAIN
ACYL-CoA SYNTHASE (LACS) enzymes into acyl-CoA (Fulda et al., 2004) that is used as substrate
at the ER membrane for fatty acid modification and lipid synthesis Fatty acids from acyl-CoA,
primarily 16:0-CoA, are transferred to the sn-1 position of G-3-P by an ER-membrane associated
GPAT enzyme (Gidda et al., 2009; Shockey et al., 2016). Subsequently, desaturated C18 fatty acids
from 18:1-CoA, 18:2-CoA or 18:3-CoA are transferred to the sn-2 position via LPA-AT to generate
16:0-18:1(18:2/18:3)-PA. Similar to the prokaryotic pathway, DAG and CDP-DAG obtained from
PA serve as backbone for membrane glycerolipid synthesis. Afterwards, the phosphoglycerolipids
phosphatidylcholine (PC), phosphatidylethanolamine (PE), phosphatidyinositol (PI), phosphati-
dylserine (PS) and also some PG are synthesized (Nakamura, 2017).
There is substantial movement of lipids between the ER and plastids (Block and Jouhet,
2015). Therefore, the desaturated 18:2 and 18:3 fatty acids derived from desaturase reactions in
1.1.1.1 Membrane Glycerolipids

3
the ER can be relocated to the plastids and incorporated into plastidial lipids MGDG, DGDG and
SQDG. The origin of the lipid, however, can be distinguished to be from the prokaryotic or
eukaryotic pathway, depending on whether the fatty acid esterified to the sn-2 position of glycerol
is 16:0 (prokaryotic) or 18:1(18:2/18:3) (eukaryotic).
Storage glycerolipids in plants are synthesized at the ER. Fatty acids are exported from the
plastid and then acylated with CoA. This acyl-CoA pool is used for synthesis of storage
glycerolipids. At the ER membrane, GPAT catalyzes the transfer of fatty acids to G-3-P, forming
LPA. The LPA is esterified with another fatty acid from the acyl-CoA pool by
ACYL-CoA:LYSOPHOSPHATIDATE ACYLTRANSFERASE (LPAT) and dephosphorylated by
PHOSPHATIDATE PHOSPHATASE (PAP) to give rise to DAG that is utilized as substrate for
synthesis of PC by CDP-CHOLINE:DIACYLGLYCEROL CHOLINEPHOSPHOTRANSFERASE (CPT)
which transfers the phosphatidylcholine group from CDP-choline to DAG (Bates et al., 2013). For
synthesis of storage glycerolipids, the phosphatidylcholine head group is removed from PC by
PHOSPHOLIPASE C to yield DAG that is used as precursor for the synthesis of triacylglycerol
(TAG), the main storage glycerolipid. For this purpose, DAG is esterified with a fatty acid from the
acyl-CoA pool, catalyzed by ACYL-COA:DIACYLGLYCEROL ACYLTRANSFERASE (DGAT)
(Lardizabal et al., 2001; Yen et al., 2005). As an alternative, PC instead of DAG can be used for
esterification of diacylglycerol by the enzyme PHOSPHOLIPID:DIACYLGLYCEROL
ACYLTRANSFERASE (PDAT) (Kim, 2005). Storage lipids are mainly formed at the rough ER and
accumulate in the cell as water-insoluble structures called oil bodies. These bud-off during
extensive synthesis of TAG at the ER and are covered by a phospholipid monolayer interspersed
with specific protein called oleosins (Shimada et al., 2018).
1.1.2 Fatty acid de novo Synthesis in Plants and Fungi
The term FAS refers to all enzymes involved in fatty acid de novo synthesis occurring in the
plastids of plants and the cytosol of fungi. In plants, multiple proteins are involved in the FAS
reactions that collectively form the type-II FAS complex (Brown et al., 2006). In contrast, fungi
contain a type-I FAS that compromises a single large enzyme with multiple subunits capable of
catalyzing the different reactions necessary for formation of fatty acids (Jenni et al., 2007). While
fungal type-I FAS acts like a single large protein complex, the type-II FAS proteins likely form a
complex assembled in a supramolecular structure to efficiently channel the substrates and
intermediates. The precursor for plant and fungal fatty acids is acetyl-CoA produced in the plastid
of plants and cytosol of fungi (Figure 1a).
1.1.1.2 Storage Glycerolipids

4
Figure 1: Reactions of Fatty Acid de novo Synthesis in Plants and Fungi. a) Carboxylation of acetyl-CoA to malonyl-CoA by ACC is the commited step during FAS. The growing acyl chain is linked via a thioester to ACP. Successive rounds of FAS consist of four core reactions: condensation, reduction, dehydration and reduction. In plants, three KAS isoforms are present of which KAS III catalyzes only the initial condensation reaction of malonyl-ACP with acetyl-CoA and KAS II only the final FAS cycle to yield stearoyl-ACP. Plant enzymes are green, while red indicates fungal origin. b) Acyl-ACP Synthesis and Hydrolysis by acyl-ACP Thioesterases. Inactive apo-ACP is activated by HACPS to generate the active holo-ACP that is used by FAS to generate acyl-ACP. Fatty acid elongation is terminated by hydrolysis of the thioester, releasing sulfhydrdyl-ACP and free fatty acids. The amino acids forming the conserved tripeptide Asp-Ser-Leu are marked in yellow and the thioester on acyl-ACP is indicated in red. PDH, pyruvate dehydrogenase; CoA, coenzyme A; ACP, acyl-carrier protein; ACS, acetyl-CoA snythase; ACC, acetyl-CoA carboxylase; MCMT, malonyl-CoA:acyl-carrier portein malonyltransferase; KAS, 3-ketoacyl-ACP synthase; KR, 3-ketoacyl-ACP reductase; HAD/DH, 3-hydroxyacyl-ACP dehydratase; ER, enoyl-ACP reductase; SAD, stearoyl-ACP desaturase; HACPS, holo-ACP synthase; Fat, acyl-ACP thioesterase.

5
In plastids, acetyl-CoA can be generated by pyruvate dehydrogenase (PDH) via oxidative
decarboxylation of pyruvate (Johnston et al., 1997) or via plastidial acetyl-CoA synthase (ACS)
(Lin and Oliver, 2008). The first committed step in fatty acid synthesis is the carboxylation of
acetyl-CoA to yield the C3 compound malonyl-CoA by acetyl-CoA carboxylase (ACC) (Konishi et
al., 1996). By regulating ACC activity, organisms control the rate of fatty acid synthesis (Andre et
al., 2012). The malonyl group is transferred from CoA to acyl-carrier protein (ACP) via a thioester
linkage to yield malonyl-ACP, catalyzed by malonyl-CoA:acyl carrier protein malonyltransferase
(MCMT). ACP itself is also regarded as part of the FAS. It is present in two forms: apo-ACP and
holo-ACP. Apo-ACP is inactive and can be activated by holo-ACP synthase (HACPS) to generate
holo-ACP (Figure 1b), which is the soluble carrier for fatty acids during the FAS reactions (Chan
and Vogel, 2010).
In the subsequent FAS reactions, malonyl-ACP is elongated in a series of four reactions,
which comprises one cycle of fatty acid de novo synthesis. In the first reaction, β-ketoacyl-ACP
synthase (KAS) condenses malonyl-ACP with acetyl-CoA, thereby decarboxylating the
malonyl-ACP and forming a carbon-carbon bond to yield the C4 compound 3-ketobutyryl-ACP. In
plants, this first reaction is catalyzed by a specific isoform, KASIII. Successively,
3-ketoacyl(butyryl)-ACP is reduced by 3-ketoacyl-ACP reductase (KAR) to 3-hydroxyacyl-
(butyryl)-ACP using electrons from NADPH. It is further dehydrated by hydroxyacyl(butyryl)-ACP
dehydratase (HAD), giving rise to enoyl-ACP. In a final step, electrons from NADPH are again used
to reduce enoyl-ACP, catalyzed by enoyl-ACP reductase (ER) to saturate the fatty acid moiety and
thereby generate acyl-ACP. The C4 product of this first round of FAS, butyryl-ACP, is subjected to
iterative rounds of condensation, reduction, dehydration and reduction until the main products
of FAS are synthesized, which are C16—C18 fatty acids. In these successive rounds, no more
acetyl-CoA is used in the condensation step, but instead the acyl(butyryl)-ACP is condensed with
malonyl-ACP. The first reactions of the second-to-eight rounds of FAS are catalyzed by the KAS
I-isoform in plants, generating up to C16 fatty acids. To synthesize C18 fatty acids, a third isoform,
KAS II, catalyzes the final condensation reaction, which ultimately leads to production of C18
stearoyl-ACP (Li-Beisson et al., 2013). In summary, 14 molecules of NADPH are consumed to
synthesize a C16 fatty acid, which makes fatty acid de novo synthesis highly energy demanding.
Fatty acid de novo synthesis can be terminated by transfer of the fatty acid to glycerolipids,
desaturation of the fatty acid, or hydrolysis of the thioester by acyl-ACP thioesterases (Fat). In
plants, stearoyl-ACP is desaturated by stearoyl-ACP desaturase (SAD), synthesizing C18:1Δ9-ACP
(Shanklin and Somerville, 1991). Two types of Fat enzymes exist in plants, FatA, preferring
C18:1Δ9-ACP and FatB, preferring saturated acyl-ACP with fatty acids of C12—C16 (Jones et al.,
1995). Cleavage of the thioester results in a free fatty acid and a sulfhdydryl-ACP. The free fatty
acid is exported from the plastid and made available for cytoplasmic transport and e. g.

6
glycoglycerolipid synthesis at the ER after conversion into acyl-CoA (see 1.1.1) (Fulda et al., 2004;
Li et al., 2015).
1.2 Arbuscular Mycorrhiza Symbiosis Invention of plant-mycorrhiza symbiosis with fungi from the Glomeromycotina is dated back
approximately 450 million years, which predates the origin of the root and therefore might have
helped early plants to switch to a terrestrial lifestyle (Brundrett, 2002; Brundrett and Tedersoo,
2018). Mycorrhiza associations are diverse and include ecto, ericoid, arbutoid and arbuscular
mycorrhiza. In contrast to ecto, ericoid and arbutoid mycorrhiza, the arbuscular mycorrhiza fungi
form a monophyletic lineage in the Mucomicotina (Martin et al., 2016; Smith and Read, 2008). The
mutual benefit of the symbiosis is foremost, but not limited to, the exchange of photosynthetically
fixed carbon supplied by the plant for mineral nutrients, acquired by the fungal mycelium that
extends beyond the root depletion zone. It has been estimated that 20% of photosynthates
synthesized by the plant shoot are delivered to the fungus (Bago et al., 2000).
Engaging in AM-symbiosis has multiple additional benefits for both partners such as tolerance to
abiotic and biotic stresses (Kumar et al., 2017). Multiple studies have confirmed the alleviating
effects of AM-inoculation to drought stress (Bárzana et al., 2015; Rapparini and Peñuelas, 2014).
In wheat, AMF enhances water use efficiency and causes metabolomic reprogramming for a better
tolerance of drought (Bernardo et al., 2019). In a study with tomato, different AMF (Funneliformis
mosseae, R. irregularis and Claroideoglomus etunicatum) increased resistance to drought and NaCl
stress and the corresponding metabolite profiling revealed increased accumulation of jasmonic
acid and intermediates of the carotenoid pathway, such as ABA glucosyl ester, β-ionone and
blumenol C glucoside (Rivero et al., 2018). This is consistent with promotion of AM colonization
by ABA (Pozo et al., 2015) that is even more eminent under drought stress as shown by increased
ABA in tomato and lettuce under drought stress (Ruiz-Lozano et al., 2015). In Sorghum bicolor, the
AMF Rhizophagus arabicus, which is endemic to hyperarid soils, enhanced phosphate and nitrogen
supply especially under water-limiting conditions, even to a greater extent than R. irregualris,
highlighting the importance of fungal diversity on alleviating abiotic stresses (Symanczik et al.,
2018). AM fungi counteract biotic stresses, as has been shown for increased resistance towards
root-parasitic nematodes (Vos et al., 2012).
AMF reveal a positive effect on soil ecosystems due to phytoremediation, prevention of erosion,
increased water retention capacity, decreased nutrient leaching and promotion of other beneficial
soil microbes (Calonne et al., 2014; Chen, M. et al., 2018; Debiane et al., 2011). They also act as
carbon sinks by providing sequestration of CO2 via belowground C allocation, accumulating the
host-derived carbon in spores and mycelia upon completion of the asexual life-cycle of the fungus
(Ho and Trappe, 1973; Lösel and Cooper, 1979; Olsson and Johnson, 2005). AMF therefore help
capture excessive CO2 and to regulate the global carbon cycle. In agriculture, inoculation of crops
7
with AMF in the field leads to increased grain yield and plant performance (Gibert et al., 2019;
Zhang et al., 2019), although the extent depends on the combination of host genotype and fungal
strain. This has been shown for maize, where in different genotypes, shoot growth was positively
correlated to the amount of extraradical mycelium, promoted differently by the respective maize
cultivar (Sawers et al., 2017).
Due to increased usage of fertilizers, agricultural fields often suffer from over-fertilization.
This has consequences on the adjacent ecosystems, such as algal blooming due to e. g. elevated
phosphate levels caused by leaching of phosphate from the field into the groundwater. Improving
phosphate utilization by crop plants can be achieved by increasing
phosphate-acquisition-efficiency (PAE), which represents the ability of the roots to take up
phosphate from the soil. Inoculation with AMF therefore can contribute to a more efficient usage
of available minerals by increasing PAE, even though studies on wheat and barley showed that
plant growth promotion depends on the diversity of the plant cultivar and the fungal strain
(Campos et al., 2018). In addition, breeding for improved AM symbiosis might proof to be
challenging in the future as AM colonization was only mildly affected by genetic diversity in the
model plant Medicago truncatula (Dreher et al., 2017).
Research on essential genes for the formation of AM symbiosis has mainly been conducted
using forward and reverse genetics with plant mutants. Recently, transcriptomic and genomic
sequencing of a variety of arbuscular mycorrhiza fungal strains and species at different stages of
their life cycle has provided more insights into the fungal molecular components necessary during
AM-symbiosis (Chen et al., 2018; Handa et al., 2015; Kamel et al., 2017; Kobayashi et al., 2018; Lin
et al., 2014; Mathieu et al., 2018; Salvioli et al., 2016; Sun et al., 2019; Tang et al., 2016; Tisserant
et al., 2012; Tisserant et al., 2013; Zeng et al., 2018). In combination with microscopic
observations, the underlying genetic regulation and molecular dialogue of the different stages
during AM symbiosis has been characterized. The processes that encompass development of the
AM symbiosis can be divided into three phases (Figure 2). First, pre-contact signalling of secreted
compounds in the rhizosphere by plant and fungus, second, physical contact and root inter- and
intracellular colonization and third, extraradical mycelium and daughter spore generation. The
last phase can be followed by recolonization. AM symbiosis develops asynchronously and
therefore multiple AM life cycle stages are present on different regions of the same root. During
the second phase, the colonized root is characterized by the abundance of multiple fully branched
arbuscules. These are highly active in nutrient exchange and therefore compromise the central
stage during AM symbiosis (see 1.2.4).

8
1.2.1 Formation and Progression of Root Endosymbiosis with AMF
Resting spores in the soil are stimulated by a cocktail of host signal compounds for
germination and growth towards the root (van Dam and Bouwmeester, 2016). Among them,
strigolactones are well characterized components of root exudates that stimulate hyphal
branching and metabolism (Akiyama et al., 2005; Besserer et al., 2006; Besserer et al., 2008).
Strigolactones are secreted via the ABC transporter PDR1 to create a concentration gradient that
guides the growing hyphae toward the root (Kretzschmar et al., 2012). Some plant species, like
sunflower and oat, do not exudate strigolactones but carlactones, which also have stimulatory
effects on AM hyphae (Mori et al., 2016). Other host-secreted signals are suggested to be
N-acetylglucosamines (GlcNAc), which was revealed by the absence of a typical
signalling-transcript signature when R. irregularis was treated with root exudates from WT and
nope1 (NO PERCEPTION 1) transporter mutants (Nadal et al., 2017). Additionally, flavonoids are
synthesized by the roots during AM colonization and also function in pre-contact signalling
(Harrison, 1993; Larose et al., 2002; Steinkellner et al., 2007). In addition, the hydroxylated fatty
acids 2-hydroxytetradecanoic acid and 2-hydroxydodecanoic acid, putatively present in carrot
root exudates, were shown to induce multiple lateral branches along the germ tube in germinating
spores of Gigaspora gigantea, but this response was absent in R. irregularis (Nagahashi and Douds,
2011). On the other hand, AM fungi secrete diffusible signals as well that are collectively referred
to as myc-factors. The most studied ones are chitooligosaccharides (CO) and
lipochitooligosascharides (LCO) (Genre et al., 2013; Maillet et al., 2011) but might also
compromise peptides such as the SL-INDUCED PUTATIVE SECRETED PROTEIN 1 (SIS1) (Tsuzuki
et al., 2016), SECRETED PROTEIN 7 (Kloppholz et al., 2011) and volatile organic compounds (Sun
et al., 2015). Although the full picture has not yet been unraveled, plant cell surface receptor-like
kinases (RLKs) containing lysine motifs (LysMs) can bind GlcNAc oligosaccharides and function
in perception of signals during AM symbiosis (Zipfel and Oldroyd, 2017).
1.2.1.1 Bidirectional Signalling and Recognition in the Rhizosphere Leads to Root
Colonization

9
Figure 2: Life Cycle Stages and Progression of AM Root Colonization. Symbiosis of roots with AM fungi can be divided into three stages: Stage I compromises pre-symbiotic exchange of signalling compounds. Plant roots exudate strigolactones, carlactones, flavonoids and GlcNAcs to stimulate fungal spore germination and branching. The fungus exudes myc-factors, COs, LCOs and the butenolide karrikin for recognition by the plant. Stage II encompasses physical contact and intercellular hyphae proliferation as well as arbuscule formation. Hyphopdia are formed to support epidermal cell penetration and hyphal transfer through the cells is guided by the PPA. In the inner root cortex, a bigger PPA marks the path for hyphal penetration into cells , where they branch iteratively to form arbuscules. This happens <24h after initial root penetration. The PAM surrounding the arbuscule is synthesized by the plant and equipped with plant nutrient transporters (e. g. PT4) secreted via exocytosis. Therefore, fully branched arbuscules are active in nutrient exchange and are surrounded by cytoplasmic contents such as ER, Golgi and stromulated plastids. The hypha at the point of fungal entry is thickened and is called the arbuscule trunk, forming the trunk domain. Subsequent hyphal branching leads to formation of the branching domain. The BCP1 protein is present in the PAM in the trunk domain and the branching domain and additionally in the host peripheral PM. Arbuscules are transient structures and collapse 1—3 days after their formation by being actively degraded by host-induced hydrolases. The transition zone between intracellular hyphae of the remaining arbuscule and the intercellular hyphae becomes prominent by formation of a septum. As the root colonization proceeds, R. irregularis and most other AMF form vesicles. At later stages of root colonization, the root is characterized by the presence of collapsed arbsucules and is enriched in vesicles that contain lipids and glycogen. This is called senescent colonization. In stage III, fungal hyphae grow out of the root into the soil, where they form daughter spores filled with mainly lipids. Spores are resting structures in the soil until stimulated by host-signals again. IRH, interradical hyphae; PT4, PHOSPHATE TRANSPORTER 4; BCP1, BLUE COPPER PROTEIN 1; DIS, DISINTEGRATED ARBUSCULES, RAM1/2; REDUCED ARBUSCULAR MYCORRHIZA; STR, STUNTED ARBUSCULES; CP, CYSTEINE PROTEINASE, TGL; TRIGLYCERIDE LIPASE.

10
Consequently, rice mutants of the LysM-RLK CERK1 (CHITIN ELICITOR RECEPTOR KINASE
1) gene were severely impaired in AM development (Miyata et al., 2014). Rice mutants of the
DWARF 14-LIKE (d14l) gene do not engage in AM symbiosis due to the absence of fungus-plant
contact sites. D14L encodes an α/β-fold hydrolase that forms an intracellular receptor complex
for perception of karrikin, a post-wildfire signal in plants. The d14l mutant also does not exhibit a
transcriptional response to germinating spore extracts from R. irregularis and therefore, karrikin
probably comprises another chemical signal exuded by AMF (Gutjahr et al., 2015). Perception of
fungal signals by root epidermal cells triggers nuclear calcium oscillations similar to signalling in
root-nodule symbiosis, which indicates recognition of the fungus (Chiu and Paszkowski, 2019).
Upon contact of the approaching hyphae to the root, the hyphal tip differentiates into a
thick supported structure, the hyphopodium, which attaches to the epidermal cell (Figure 2). At
root-AMF contact sites, a LIPID TRANSFER PROTEIN (LTP) gene of unknown function is expressed.
The high expression of LTP prompted the hypothesis that fatty acids might act in signalling or are
supplied to fungal hyphae upon initial contact to the root (Blilou et al., 2000). At cells destined for
fungal penetration, a cytoskeletal rearrangement of the host cytoplasm orchestrated by changed
host gene expression takes place and creates a specialized intracellular structure, the
pre-penetration apparatus (PPA). The PPA forms an apoplastic tunnel into the cell and is created
by an invagination of the plasma membrane supported by an ER-network and cytoskeletal
components. It marks the path of fungal entry into the cell (Genre et al., 2005).
Due to similarities in the early events of both root-nodule and AM endosymbiosis, they
likely share an evolutionary history. The conserved molecular components that are essential for
accommodation of either symbiont are comprised in the Common Symbiosis Pathway (CSP)
(Parniske, 2008). At the plasma membrane of the rhizodermal penetration site, integral
membrane proteins termed SYMBIOSIS RECEPTOR KINASE (SYMRK) with an intracellular kinase
domain and extracellular leucine-rich repeats (LRR) are essential for root-nodule formation and
AM-symbiosis alike (Endre et al., 2002; Stracke et al., 2002). The secondary messengers
downstream of SYMRK that transduce the signal are unknown, but mevalonate might be involved,
as demonstrated by the requirement for the HMGR1 (3-Hydroxy-3-Methylglutaryl CoA REDUCTASE
1) gene for calcium spiking (Venkateshwaran et al., 2015). HMGR1 regulates the MVA pathway in
plants.
Despite of the unsettled details, it is well documented that the symbiosis-signal is
transmitted to the nucleus where it manifests as nuclear and perinuclear calcium spiking again.
Calcium spiking is achieved by reiterated influx and efflux of calcium into the nucleoplasm from
the nuclear envelope lumen to activate target genes. Molecular requirements for calcium spiking
are NUCLEAR PORE COMPLEXES (NUP), the ATP-driven calcium pump MCA8, the potassium
efflux channels POLLUX and CASTOR, as well as CYCLIC-NUCLEOTIDE-GATED CHANNEL 15

11
(CNGC15). Calcium in the nucleoplasm activates calcium and calmodulin-dependent
serine/threonine protein kinase (CCamK) that phosphorylates the transcription factor CYCLOPS,
which leads to host-gene activation and subsequent accommodation of the endosymbiont (Genre
and Russo, 2016).
After penetration of the rhizodermis, the fungal hyphae populate the outer root cortex by
growing inter and intracellularly, forming the intraradical mycelium (IRM). Finally, they approach
the cells of the inner root cortex, but do not form appressoria again. Instead, the cells destined for
fungal hyphae penetration show PPA formation in preparation of accommodation of the symbiont
again. This PPA formation preceding inner cortex cell penetration is more complex and different
from the preceding initial PPA formation in the rhizodermis or the PPA formation during
colonization of the outer root cortex cells, where no arbuscules are formed (Genre et al., 2008).
PPA formation in the inner root cortex cells therefore compromises the initial step in arbuscule
formation, discussed in the next chapter.
During inner cortical PPA formation and preceding the entry of the hypha, the plant
reorganizes its cytoplasmic contents. The nucleus travels opposite of the PPA and polar
localization of secretion towards the point of hypha entry takes place. Contrary to PPA formation
in the outer cortex and the rhizodermis, in inner cortical cells, the nucleus duplicates prior to
fungal penetration. Upon entry of the fungus into the cell, the plant synthesizes the periarbuscular
membrane (PAM) that is in-continuum with the plasma membrane and surrounds the expanding
hyphae. The PAM delimits the plant cytoplasm from the neighboring periarbuscular space (PAS),
an apoplastic continuum that traces the outer surface of the arbuscule membrane. The fungal cell
wall encloses the fungal membrane, which confines the fungal cytoplasm (Ivanov et al., 2019).
Eventually, the intracellular hyphae gives rise to the arbuscule, a highly ramified structure
created by branched hyphae. Mutants in the transcriptional regulator complex formed by
CCaMK-CYCLOPS-DELLA proteins fail to initiate arbuscule branching after cellular penetration
due to absence of signal transduction. The CCaMK-CYCLOPS-DELLA complex activates the
transcription factor REDUCED ARBUSCULAR MYCORRHIZA 1 (RAM1) that controls arbuscule
branching (Floss et al., 2013; Pimprikar et al., 2016). During arbuscule genesis, the invading hypha
grows into the PPA and forms a thick trunk at the point of entry, subsequently called the trunk
domain. The hypha branches dichotomously and forms the branch domain. The plasma
membrane surrounding the trunk domain is characterized by presence of the BLUE COPPER
BINDING PROTEIN 1 (BCP 1) that is anchored to the plasma membrane via a predicted
glycosylphosphatidylinositol (GPI) anchor and is also present in the host plasma membrane in
non-invaded cells (Pumplin and Harrison, 2009). The plant-synthesized PAM causes a 3—4 fold
increase of the host plasma membrane (Alexander et al., 1989). The highly-branched
1.2.1.2 Arbuscule Formation

12
arbuscule-forming hypha increases the surface area of the plant-microbe interface, making
exchange of symbiotic metabolites more efficient. The PAM in juxtaposition of the branch domain
therefore contains a unique set of proteins with functions in e. g. symbiotic nutrient exchange,
such as the phosphate transporter PT4 (Pumplin and Harrison, 2009).
The branch domain of arbuscules is further divided into basal or thick branches that
further branch into fine or secondary branches that resemble the canopy of trees. The ram1
mutants are defective in arbuscular fine branching but still form the thick branches (Park et al.,
2015; Rich et al., 2015; Xue et al., 2015). By continuous branching at their growing tips, the
arbuscule finally fills almost the entire cavity of the cell. As the PAM surrounding the hyphal
branches is actively synthesized during hyphal growth, this requires polarized secretion of
membrane material and protein by the host (Choi et al., 2018). This is achieved by focal fusion of
exocytotic vesicles, containing e. g. symbiotic nutrient transporters, with the PAM. The
vesicle-fusion process is proposed to be mediated by the exocyst complex Exo70i (Pumplin et al.,
2012; Zhang et al., 2015), and the SNARE (N-ethylmaleimide-sensitive factor-attachment protein
receptors) proteins SYNTAXIN 132a (Huisman et al., 2016; Pan et al., 2016), VTI12 (Lota et al.,
2013) and VAMP72d/e (Ivanov et al., 2012).
1.2.1.2.1 Arbuscule Life Cycle Dynamics
Arbuscules are dynamic structures with a lifetime of 1—3 days (Alexander et al., 1989;
Kobae and Hata, 2010). Arbuscules are under control of the plant host cell, which can induce
expression of a set of genes, termed executor genes. These likely promote arbuscule collapse,
probably to prevent underperformance of the fungus in terms of mineral nutrient delivery. The
executor genes include a CHITINASE, the CYSTEINE PROTEINASE 3 (CP3) and CP4/5, and a
TRIGLYCEROL LIPASE (TGL). For activation of these genes, the transcription factor MYB1 has been
reported to be central (Floss et al., 2017). It interacts with DELLA and NSP1 transcription factors
that then induce the described executor genes and thus induce arbuscule degeneration to enable
subsequent recolonization of either the same cell or other cells of the inner root cortex (Gutjahr
and Parniske, 2017). Arbuscule maintenance and proper branching is distorted in a variety of
plant mutants. These mutants show premature arbuscule collapse, leading to the occurrence of
stunted arbuscules. Figure 2 highlights the expression of genes that have functions in arbuscule
branching and are either expressed in fully-branched arbuscules (PT4, FatM, RAM2, STR), or at the
onset of cortical cell penetration and the initial phase of arbuscule generation (DIS, RAM1), and
additionally, genes induced to enforce arbuscule collapse (MYB1, CHITINASE, CP3, CP4/5, TGL)
that are expressed in mature arbuscules and collapsing ones (Figure 2) (Pimprikar and Gutjahr,
2018). Homologs of DIS, FatM and RAM2 are involved in fatty acid biosynthesis and lipid
processing at the ER (Gaude et al., 2012; Rich et al., 2017) and FatM, RAM1, RAM2 and STR-STR2
have an AM-specific phylogenomic distribution, i. e. are symbiosis-specific, while DIS is also found

13
in the genomes of some non-host species but also essential for arbuscule branching and AM
development (Bravo et al., 2016; Bravo et al., 2017; Keymer et al., 2017).
Upon completion of the asexual life cycle of the fungus, intraradical vesicles and
extraradical spores are formed. Intraradically growing hyphae form vesicles at their terminal
ends. These are temporary storage structures containing predominantly glycogen and the neutral
storage lipid TAG (Jabaji-Hare et al., 1984). Hyphae that extend away from the root are termed
extraradical hyphae. They extend in the surrounding rhizosphere, where they form the
extraradical mycelium (ERM), and eventually from spores. Spore formation in the ERM is
dependent on host carbon delivery (Douds, 1994; Douds and Schenk, 1990) and symbiotic hyphae
deliver reduced carbon to the spores predominantly as glycogen (see 1.2.2.2.1) and TAG (see
1.2.2.2.2). Spores predominantly accumulate reduced carbon compounds to provide the energy
for hyphal growth in the absence of a host upon germination and exploration of the rhizosphere
(Olsson and Johansen, 2000). To date, it is unclear how exactly vesicle and spore formation is
organized (Choi et al., 2018). In addition to TAG and glycogen, fungal vesicles are also rich in
cations such as potassium, magnesium, sodium and calcium and therefore may function as a
reservoir or in sequestration of these ions (Strullu et al., 1983).
1.2.2 Reciprocal Nutrient Exchange
Nutrient exchange is the central mechanism of AMF symbiosis. In exchange for carbon, AMF
deliver mineral nutrients to the host (Figure 3). Phosphate and nitrogen are the main nutritional
factors that influence development of AM symbiosis and plants sustain AM colonization as long as
supply of either one is scarce. On the opposite, accumulation of fungal biomass, fungal
proliferation and carbon flow to the fungus are impaired by increased availability of either
nitrogen or phosphate to the roots (Nouri et al., 2015; Olsson et al., 2005).
In the soil, the fungal ERM acquires orthophosphate (PO4-) by high-affinity PHOSPHATE
TRANSPORTER (PT) (Harrison and van Buuren, 1995; Maldonado-Mendoza et al., 2001; Olsson et
al., 2005; Xie et al., 2016). In the fungus, the imported orthophosphate accumulates in the vacuolar
compartment, where it is used to synthesize polyphosphates (poly-P). As the accumulating poly-P
is negatively charged, cations are imported along with phosphate to neutralize the negative
charges which was demonstrated by increased potassium, calcium and magnesium in fungal ERM
as response to Pi uptake and the corresponding cation transporter gene expression (Kikuchi et al.,
2014).
1.2.1.3 Post-Symbiotic Growth: Generation of Vesicles and Asexual Spores
1.2.2.1 Mineral Nutrient Uptake and Transport

14
Figure 3: Uptake, Transport, Exchange and Metabolism of Nutrients at the Symbiotic Interface. Mineral nutrients from the soil are harvested by mycorrhizal extraradical hyphae and taken up as inorganic ions but can be made available also from organic compounds in the soil. Both are translocated to arbuscules and into the PAS for import of the plant via symbiotic H+/co-transporter proteins that reside in the PAM. In exchange, AMF obtain carbon from the host in the form of sugars and fatty acids. Sugar export into the PAS and uptake via fungal monosaccharide transporters occurs across the fungal membrane. The exact mechanism of fatty acid transport is not yet understood.

15
To increase phosphate uptake, AMF stimulate soil-borne bacteria that mineralize
phosphorous from organic phosphate. This was demonstrated by exudation of fructose by R.
irregularis that stimulated uptake of inorganic phosphate released from phytate by secreted acid
phosphatase from the phosphate-solubilizing bacterium Rahnella aquatilis (Zhang et al., 2018).
Next to phosphate, nitrogen is acquired from the soil as NH4+ or NO3- (Johansen et al., 1996) by
fungal AMMONIUM TRANSPORTERS (AMT) and converted into glutamate and mainly arginine in
the ERM.
Both poly-P and arginine are translocated via the vacuolar compartment from the ERM via
intercellular hyphae to the arbuscules. At the arbuscules, arginine is converted via urea to
ammonia again that is subsequently released into the PAS (Govindarajulu et al., 2005). From there,
ammonia is likely transferred via PAM-resident plant AMT2;3 transporters to the plant cytoplasm
(Breuillin-Sessoms et al., 2015). Poly-P at the arbuscules is hydrolyzed and released into the PAS
(Solaiman et al., 1999) from where it is acquired by specific plant PHOSPHATE TRANSPORTER
termed MtPT4 in Medicago (Harrison et al., 2002; Javot et al., 2007), OsPT11 in rice (Kobae and
Hata, 2010; Paszkowski et al., 2002), StPT3 in potato (Rausch et al., 2001) and LePT1 in tomato
(Rosewarne et al., 1999). MtPT4 and OsPT11 were shown to reside in the PAM opposite of the
extensively branched fungal hyphae that form the fine-branch domain of the arbuscules. They are
delivered to the PAM via polarized secretion of exocytotic vesicles via the endomembrane system,
which becomes visible by aggregation of cytoplasmic contents such as ER, Golgi and
trans-Golgi-network, microfilaments and microtubuli in arbuscocytes (Bonfante, 2018; Kobae and
Hata, 2010; Pumplin et al., 2012; Pumplin and Harrison, 2009; Yang et al., 2012).
Besides phosphate and nitrogen, mycorrhizal colonization increases the sulfur content of host
roots. Sulfur is likely acquired by fungal transporters and delivered to the host. A candidate
transporter, LjSultr1;2 from L. japonicus, was proposed to act on symbiotic sulfur uptake at the
PAM (Giovannetti et al., 2014). Host transporters in the PAM likely transport mineral nutrients in
a H+/co-transport manner, as functional characterization of PAM-resident proton pumps
(H+-ATPases OsHA1 and MtHA1) have been shown to energize the PAS for subsequent
co-transport of mineral nutrients (Krajinski et al., 2014; Wang et al., 2014).
Figure 3: (continued) In the fungal cytoplasm, glucose is converted into glycogen and trehalose or hydrolyzed in glycolysis to yield energy. Fatty acids in the fungus are used to synthesize membrane and storage lipids and fatty acids are further modified during elongation and desaturation. Fungal storage lipids can be synthesized in the ERM or in the IRM and transported in long-distance transport as lipid droplets to the spores. The characterized and inferred transporter proteins that engage in nutrient exchange are depicted with their reported names and the organisms in which they were characterized (see text for details). Arg, arginine; Glu, glutamate; CW, cell wall; PM, plasma membrane; FM, fungal membrane; PAM, periarbuscular membrane; PAS, periarbuscular space; FA, fatty acids; Pi, inorganic phosphate.

16
Mineral nutrient homeostasis is closely linked to carbon transfer during AM symbiosis.
The soil-borne nutrients, especially phosphate, are also precious to the fungus, e. g. for
phospholipid synthesis to ensure membrane synthesis and hyphal proliferation, as well as
synthesis of nucleic acids for cellular reproduction. R. irregularis was shown to stop the transfer
of nutrients and instead accumulates mineral nutrients in spores when sucrose in the medium,
which served as carbon source for the host, was reduced to 50% (Hammer et al., 2011).
Colonization with AMF leads to an increased source strength of mycorrhizal roots and
therefore induces photosynthetic CO2 fixation, sucrose synthesis and translocation to the root to
compensate for the carbon drain by the colonizing fungus (Lanfranco et al., 2018). The available
carbon sources for AMF are sugars and fatty acids, both of which are obtained from the host
(Luginbuehl et al., 2017). The transfer of these two carbon compounds is discussed in the next
chapters.
1.2.2.2.1 Mono-, Di- and Polysaccharides
For carbon translocation in the form of sugars, transporter proteins are found in the fungal
membrane that import monosaccharides, but not disaccharides into the fungal cytosol (Solaiman
and Saito, 1997). The MONOSACCHARIDE TRANSPORTER (MST), GpMST1 from Geosiphon
pyriformis, has substrate transport preferences in the following order: glucose > mannose >
galactose > fructose, as revealed by sugar uptake experiments after expression in yeast (Schüssler
et al., 2006; Schüßler et al., 2007). Similarly, RiMST2 from R. irregularis showed the highest
activity with glucose, but it can also transport xylose, mannose and fructose. RiMST2 is mainly
expressed in the arbuscules but also in intercellular hyphae and its expression is strongly induced
by the cell wall sugar xylose. In addition, the ERM of R. irregularis growing out of D. carota roots
was shown to actively take up 14C-glucose and 14C-xylose via H+ co-transport (Helber et al., 2011).
In another experiment, R. irregularis germinating spores were able to take up 14C-glucose from
the medium as well (Bücking et al., 2008).
R. irregularis expresses two additional MONOSACCHARIDE TRANSPORTER genes in the
ERM and spores: RiMST5 and RiMST6. Both have been functionally characterized as glucose
importers after expression in yeast (Ait Lahmidi et al., 2016). Therefore, expression patterns and
substrate properties of RiMST2, RiMST5 and RiMST6 show that hexose uptake is not restricted to
the arbuscules, but can also happen from the rhizosphere.
Glucose, once taken up by the fungus, can be converted into glycogen by GLYCOGEN
SYNTHASE in the IRM and ERM of R. irregularis (Bago et al., 2003) or used for synthesis of
trehalose via trehalose-6-phosphate (Ocón et al., 2007). Under oxidative stress and heat stress,
trehalose synthesis is furthermore induced to enhance stress recovery (Lenoir et al., 2016).
1.2.2.2 Carbon Transfer
17
Labeling of leek roots colonized with Glomus etunicatum using 13C1-glucose showed that glycogen
and trehalose can be synthesized from host-derived carbon in the IRM. Furthermore, in
germinating spores of G. etunicatum, mannitol synthesis was observed to occur at even higher
rates than trehalose synthesis (Shachar-Hill et al., 1995).
Glycogen can also be used for long-distance transport to the ERM where it can be
hydrolyzed to glucose for the synthesis of other carbohydrates or stored (Bago et al., 2003).
Glucose is used for trehalose synthesis, which mainly takes place in the ERM via acetate that enters
the glyoxylate cycle and subsequently gluconeogenesis. This was revealed by expression of the
glyoxylate cycle genes ISOCITRATE LYASE (ICL) and MALATE SYNTHASE (MS) as well as positional
labeling of carbon atoms in trehalose with 13C2-acetate in ERM and germinating spores of R.
irregularis (Bago et al., 1999; Bago et al., 2000; Lammers et al., 2001).
Isotopic labeling of colonized roots with 13C1-glucose followed by NMR spectroscopy in
isolated ERM suggests that in addition to trehalose, chitin synthesis takes places in the ERM (Bago
et al., 2003). The precursor for chitin synthesis is glucose, which can be obtained from trehalose
or hydrolyzed glycogen. Glucose is converted into N-acetylglucosamine (GlcNAc) that polymerizes
to yield the long-chain polymer chitin, catalyzed by CHITIN SYNTHASE (Flores and Gancedo,
2015). Chitin is a major component of the cell wall of AMF and upon arbuscule collapse, the GlcNAc
monomers are taken up and recycled via the fungal transporter RiNGT (Kobae et al., 2015).
If not incorporated into glycogen or chitin (after conversion into GlcNAc), glucose can be
broken down via glycolysis to yield ATP and the reducing agent NADH as well as pyruvate that is
converted into acetyl-CoA by pyruvate dehydrogenase. Acetyl-CoA can be employed for fatty acid
elongation (see 1.2.4.2.2).
On the plant side, glucose and sucrose are hypothesized to be exported into the PAS via
PAM-localized transporters. The genes belonging to the SWEET family (SUGARS WILL
EVENTUALLY BE EXPORTED TRANSPORTERS) StSWEET7a and StSWEET12a from potato show
mycorrhiza-induced gene expression (Manck-Götzenberger and Requena, 2016). Transporters of
the SWEET family were characterized to export and import carbohydrates from the extracellular
space and cellular compartments in Arabidopsis and rice, and are also the targets of manipulation
by pathogens to increase sugar efflux from the infected cells (Chen et al., 2010). StSWEET7a and
StSWEET12a promoters are induced in arbuscocytes, even though the StSWEET7a promoter is
also active in cortex cells of non-inoculated roots. There are four clades of SWEET proteins and
StSWEET7a belongs to clade II of hexose transporters and StSWEET12a to clade III of sucrose
transporters. Therefore, these two candidate transporters likely function in sucrose and glucose
transport across the PAM and the PM in arbuscule-containing cells (Manck-Götzenberger and
Requena, 2016).
The SUCROSE TRANSPORTER genes 1 and 4 from M. truncatula (MtSUT1/4) are induced
by low phosphate and AM colonization and the recombinant proteins are active in transport of

18
sucrose and maltose in yeast, which they transport in a H+/disaccharide co-transport manner
(Doidy et al., 2012). MtSUT1 and MtSUT4 do not transport monosaccharides. Instead, the
MONOSACHARIDE TRANSPORTER 1 from M. truncatula (MtST1) was shown to transport glucose
and fructose alike, but not sucrose (Harrison, 1996). Thus, plants likely secrete monosaccharides
and disaccharides into the PAS.
Plant PAM-localized SUT proteins function directly and indirectly in AM symbiosis. In
tomato, SlSUT2 RNAi-plants had increased arbuscule colonization (Bitterlich et al., 2014), and
SlSUT2 interacts with brassinosteroid signalling components. SlSUT2 therefore negatively
regulates AM development, either by competing for sucrose in the PAS by re-import into the plant
cytoplasm or by regulating the activity of other competitive sucrose importers (Roth and
Paszkowski, 2017). Consistent with an indirect signalling function rather than direct transport by
SlSUT2, the Medicago MtSUT2 transporter was unable to transport sugars in yeast (Doidy et al.,
2012). AM colonization induced the genes SlSUT1 and SlSUT4 and root sucrose and fructose were
increased, while glucose remained constant. As AM colonization also elevates CO2 assimilation
rates and therefore increases the sink strength of the mycorrhizal root, this is consistent with the
idea of increased sucrose transport to the root sink and eventually the fungal interface, while only
glucose is taken up by the fungus (Boldt et al., 2011). This as has also been demonstrated by the
increased usage of glucose but not sucrose by mycorrhizal onion roots (Solaiman and Saito, 1997).
Therefore, plant apoplastic invertases (LeLIN6, StInvCD141) and cytoplasmic invertase
(SUCROSE SYNTHASE; MtSucS1) potentially convert sucrose to fructose and glucose for
subsequent re-import by the plant or uptake by the fungus (Baier et al., 2010; Blee and Anderson,
2002; Hohnjec et al., 2003; Manck-Götzenberger and Requena, 2016; Schaarschmidt et al., 2006).
Over-expression of different yeast invertases located either to the apoplast, the cytoplasm or the
vacuole in Medicago increased hexose-to-sucrose ratios but did not lead to increased mycorrhiza
biomass in the roots, indicating that the AM symbiosis operates at optimum hexose-import
conditions under normal circumstances. However, inhibitions of root apoplastic invertase or
vacuolar invertase in tobacco roots decreased hexose contents and also led to reduction in AM
colonization (Schaarschmidt et al., 2007), suggesting that a certain concentration of hexose in the
periarbuscular space is required for regular AM colonization.
1.2.2.2.2 Fatty Acids and Lipids
As stated above, pyruvate obtained via glycolysis is converted into acetyl-CoA by pyruvate
dehydrogenase. Acetyl-CoA in turn can be used to elongate fatty acids at the ER. In most
organisms, acetyl-CoA can additionally serve as primer for fatty acid de novo synthesis (see 1.1.2)
to provide fatty acids for acyl-lipid synthesis (see 1.1.1). AMF are a remarkable exception as they
lack the genes encoding type-I FAS (Wewer et al., 2014). It is therefore likely that they do not
synthesize fatty acids de novo and rely on their hosts for fatty acid supply. This was demonstrated

19
by labeling experiments on split-compartment petri dishes with carrot roots and R. irregularis.
16:0 and 16:1 fatty acids (typical products of fungal de novo fatty acid synthesis and desaturation)
were only labeled with 14C-acetate when it was supplied to the root compartment containing IRM
and not the ERM compartment. Nevertheless, R. irregularis ERM was still capable of elongating
fatty acid with the supplied 14C-acetate (Trepanier et al., 2005). Previously, in R. irregularis-D.
carota split-petri dish experiments, fungal neutral lipids and mycorrhiza-signature fatty acids
could be labeled with 13C1-glucose only when the label was supplied to the root compartment,
which shows that the ERM was unable to synthesize fatty acids from glucose (Bago et al., 2002;
Pfeffer et al., 1999).
Lipid transfer was visualized 1d after labeling of symbiotic carrot roots with 13C-glucose
by measuring an 13C enrichment in fungal fatty acids in ERM which increased to >2% of total
carbon after 7 days (Olsson et al., 2005). Similar to monosaccharide-transfer, the translocation of
lipids also depends on the nutritional status of the host root and consequently, symbiotic carrot
roots that were supplemented with high amount of nitrogen did transfer less lipids to the fungal
IRM and ERM. This was visualized by decreased 13C content in mycorrhiza-signature fatty acids
after labeling of 13C-glucose to the root compartment in a split-petri dish system (Olsson et al.,
2005).
Two recent studies have expanded the knowledge on transfer of fatty acids from host to
AMF. In M. truncatula, expression of the UcFatB thioesterase that preferably hydrolyzes 12:0-ACP
led to accumulation of 12:0 in the spores of the connected R. irregularis. Besides, the radiolabel
from 14C-acetate but not 14C-sucrose, which was applied to the host roots, failed to accumulate in
TAG from spores feeding on M. truncatula acetyl-CoA synthase (acs) mutant. This proved that
sugars are still transferred, but not fatty acids as the acs mutant is unable to synthesize fatty acids
from exogenously applied 14C-acetate (Luginbuehl et al., 2017). In a second approach, 13C-glucose
was applied to L. japonicus str, ram2 and dis mutant roots supporting the growth of R. irregularis.
By comparing the fatty acid isotopolog 13C-labeling patterns with WT roots, it could be
demonstrated that a mutation in either of these genes led to uncoupling of 13C-patterns in
mycorrhiza fatty acids (Keymer et al., 2017).
1.2.3 Lipid Metabolism during AMF Symbiosis
Despite their apparent disability to synthesize fatty acids de novo, AMF fungi contain a
variety of lipids. The abundance and distribution of lipids and fatty acids in AMF depend on the
mycorrhizal structure (interradical hyphae, vesicles, extraradical hyphae or spores), the
environmental stimulus (e. g. stress or nutrient availability), the host response and nutritional
status as well as the fungal strain. For example, AMF belonging to the Gigasporaceae do not form
interradical vesicles and therefore do accumulate less lipids than Glomeraceae (Dalpé et al., 2012).

20
In R. irregularis extraradical mycelium (hyphea and spores), the most abundant lipid by
far is TAG, followed by DAG and phospholipids, free sterols and sterol esters. Only minor amounts
of sterol glucosides and acylated sterol glucosides as well as glycosylceramides are present
(Wewer et al., 2014). Measurements of lipids in spores of G. versiforme showed that 38% of the
spore fresh weight consists of TAG (Gaspar et al., 1994). The amount of total lipids based on spore
weight in non-germinated spores of Glomus caledonius varied between 45.2%—70.0% and was
mostly TAG (25% DW) (Beilby and Kidby, 1980). A comparable distribution was found in spores
of R. irregularis containing 78% TAG and 11% phospholipids (Jabaji-Hare, 1988). In homogenized
ERM (hyphae and spores) of G. mossae, TAG synthesis rates increased with age of the mycelium as
did incorporation of 14C-palmitic acid into palmitoyl-CoA (Gaspar et al., 2001). In another
experiment, R. irregularis and G. margarita germ tubes and the ERM growing from symbiotic
carrot roots showed high abundance of lipid droplets (syn. oleosomes, lipid globules). AMF lipid
droplets consist of a phospholipid monolayer interspersed with protein and are filled with TAG
and sterol esters as storage lipid. The highest density was observed for G. margarita hyphae,
where 47.2% of the hyphal volume was occupied by lipid droplets, which was 23.9% for R.
irregularis hyphae. It was estimated that in R. irregularis, 0.26 µg TAG are moved per hour to the
ERM. Thus, throughout the entire symbiotic growth stage of R. irregularis, massive amounts of
TAG, synthesized from host-derived fatty acids, are moved from the IRM to the ERM to accumulate
in spores (Figure 3). Even though the general direction is from IRM to ERM, some circulation in
the opposite direction was also observed (Bago et al., 2002a; Bago et al., 2002b).
Upon spore germination, the relative proportion of neutral lipids decreased while
phospholipids increased, indicative of TAG hydrolysis and membrane lipid synthesis in the germ
tube (Beilby and Kidby, 1980). In G. versiforme spores, TAG content decreased by four-fold ten
days post germination (Gaspar et al., 1994). TAG hydrolysis in germinating spores was shown to
be catalyzed by a fungal lipase in G. versiforme (Gaspar et al., 1997), producing DAGs, MAGs and
free fatty acids (Gaspar et al., 2001). In addition to providing energy and a glycerol-backbone for
membrane lipid synthesis, TAG hydrolysis in germinating spores serves to provide acetyl-CoA that
enters the glyoxylate cycle to yield succinate which is fed into gluconeogenesis for synthesis of
hexose that is used to synthesize chitin and trehalose (see 1.2.2.2.1). The metabolic activity of
germinating spores from R. irregularis was also demonstrated by rapid 14C-acetate uptake from
the growth medium (Bücking et al., 2008). When supplied with 13C2-acetate, trehalose in
germinating spores of R. irregularis was shown to be rapidly labeled (79.1% above natural
abundance in carbon position 6), which is consistent with lipolysis of TAG and usage of acetyl-CoA
in gluconeogenesis upon spore germination (Bago et al., 1999). Consistently, a gene coding for
Acyl-CoA DEHYDROGENASE, involved in β-oxidation of fatty acids, was shown to be expressed in
1.2.3.1 Distribution and Changes of Lipids in AMF

21
R. irregularis germ tubes and the ERM at later stages after sporulation. Lipid droplets in
R. irregularis and G. margarita accumulated more frequently in hyphae in close distance to
germinating spores or symbiotic host roots, indicating that TAG hydrolysis increases towards the
growing hyphal tip (Bago et al., 2002a).
Separation of hyphae and spores of ERM from R. irregularis and Glomus calroideum and
subsequent lipid quantification showed that 20% of spore biomass consists of neutral lipids. In
two-month old spores of G. calroideum, neutral lipids were 53-times more abundant than
phospholipids, while this increased to 146 in three-month-old R. irregularis spores. In contrast,
extraradical hyphae contained more phospholipids than spores, but here also neutral lipids were
more abundant. Even though this accounted only for a 24-times increase in G. claroideum hyphae
and a 5.8-times in R. irregularis hyphae, respectively (Olsson and Johansen, 2000). This
exemplifies that even though TAG accumulates in external spores, it is also synthesized in the
interradical hyphae. This is in agreement with increased neutral and phospholipids with
increased root colonization rate (Gaspar et al., 1997; Stumpe et al., 2005).
In interradical vesicles of R. irregularis, lipids make up 58.2% of IRM dry mass and the
proportion of neutral lipids (putatively predominantly TAG) is 16.77% (Jabaji-Hare et al., 1984).
The amount of TAG in vesicles of Glomus versiforme and Glomus vesiculiferum was 65% and 83%
of total lipids, respectively, while phospholipids made up only 2% and 7%, respectively (Jabaji-
Hare, 1988).
The main phospholipid in R. irregularis ERM (hyphae and spores) is phosphatidylcholine
that accounts to ~58 mol% of total phospholipids. Phosphatidylethanolamine (20 mol%),
phosphatidylinositol (13 mol%), phosphatidic acid (0.7 mol%) and phosphatidylserine
(7.3 mol%) are also present while the plastidial phospholipid phosphatidylglycerol is absent.
During symbiotic growth, the fatty acid composition of PC, PE, PI and PS is altered. Di-16:1 and
24:1 containing phospholipids are not found in root tissue colonized by R. irregularis but in ERM
and these fatty acids are still found in TAG from colonized roots. This phospholipid acyl editing by
the fungus might, on the one hand, provide a mechanism for AMF to avoid host-induced defense
reactions when growing symbiotically, while on the other hand these fatty acids provide
protection in the asymbiotic ERM membranes against unfavorable environmental conditions
(Wewer et al., 2014).
Sterol lipids compromise a major constituent of membranes of the fungal hyphae. In R.
irregularis ERM, free sterols accumulate to 64.3 mol%, while sterol esters make up 33.5 mol% and
sterol glucosides and acylated sterol glucosides are only minor components that account for
1.2 mol% and 0.8 mol%, respectively (Wewer et al., 2014). In contrast to ectomycorrhiza fungi,
AMF do not contain ergosterol, which might attribute to their recognition as being non-pathogenic
by the host (Klemptner et al., 2014). The major sterol lipids in AMF are 4-demethylsterols
synthesized de novo from acetate via mevalonate (Figure 3) (Fontaine et al., 2001a). The most

22
abundant sterols are 24-methylcholesterol, 24-ethylcholesterols and to a lesser extent lanosterol,
24-ethylcholesta-5,22-dien-3β-ol and cholesterol (Campagnac et al., 2009; Fontaine et al., 2001b;
Wewer et al., 2014).
AMF can populate even polluted or saline soils. The adjustment of their lipid metabolism
comprises one mechanism to grow under these adverse conditions. R. irregularis induce TAG
hydrolysis to provide energy and a glycerol-backbone for membrane lipid (mainly PC)
regeneration and stress-induced lipid signalling (via PA) in the presence of the polycyclic aromatic
hydrocarbon (PAH), benzo[a]pyrene (Calonne et al., 2014; Debiane et al., 2011).
Mycorrhiza fungi contain a multitude of unsaturated fatty acids. The major fatty acids in
AMF are C16 and C18 (Bentivenga and Morton, 1996). The most abundant one, C16:1n-5 (syn.
cis-palmitvaccenic acid; C16:1ω5) is found almost exclusively in AMF and can therefore be
employed as lipid biomarker (Dalpé et al., 2012). It accounts for 46.5—78 mol% of total fatty acids
in spores of AMF of the order Glomales including the families Acaulosporaceae, Glomaceae and
Gigasporaceae, albeit some Glomaceae (G. leptotichum, G. occultum) and Gigaspora spp. from the
Gigasporacea (G. albida, G. gigantea, G. margarita, G. rosea) contain none only low amounts (<1%
total FA). In addition to C16:1ω5, R. irregularis, G. claroideum and G. roseae spores and hyphae
contain 0.2—3.3 mol% of C16:1n-7 (syn. palmitoleic acid; C16:1Δ9) and the Glomaceae that do
not accumulate C16:1ω5 (G. leptotichum, G. occultum) contain considerable amounts (11—55% )
of palmitoleic acid instead. In addition, in the Gigaspora spp. spores, where C16:1ω5 is low or
absent, higher amounts (38—48%) of C18:1n-9 (syn. cis-oleic acid; C18:1Δ9) and 8—15%
C20:1n-9 (syn. cis-gondoic acid; C20:1ω9) are found (Graham et al., 1995). Oleic acid is present in
lower amounts (~1—5%) in spores of R. irregualris and other Glomaceae as well, while gondoic
acid was reported as being absent (Graham et al., 1995), or comprising only minute amounts (0.06
mol%) in R. irregularis spores (Trepanier et al., 2005). Palmitoleic acid, oleic acid, and gondoic
acid are present in plant roots also in the absence of a mycorrhiza fungus (Olsson and Johansen,
2000; Trepanier et al., 2005).
AMF additionally contain C20, C22 and C24 fatty acids. Of these, the predominant one is
20:3 that can be detected in R. irregularis extraradical hyphae, spores and IRM where it comprises
0.2—1.5 mol% of total fatty acids (Olsson and Johansen, 2000; Trepanier et al., 2005).
The fatty acids and lipids that are present in AMF extraradical tissues (see 1.2.3.1 and
1.2.3.2) can also be detected in colonized roots, albeit mostly in lower amounts. Therefore,
colonized roots contain a mixture of plant lipids and lipids found in inter and intraradically
growing mycelium. Various studies reported the accumulation of mycorrhiza-signature fatty acids
1.2.3.2 Fatty Acids of AMF
1.2.3.3 Changes in Plant Lipids and Fatty Acids due to AMF

23
(mostly hexadecenoic acid) neutral storage lipids (mostly TAG) and 24-methylcholesterol and
24-ethylcholesterol in colonized roots (Cooper and Lösel, 1978; Dalpé et al., 2012; Gaspar, L. et al.,
1997; Schliemann et al., 2008; Stumpe et al., 2005; Trepanier et al., 2005; Wewer et al., 2014). As
described above, AMF contain various fatty acids and lipids that are also present in non-colonized
plant roots (e. g. oleic acid) and are therefore indistinguishable in lipid measurements of colonized
roots.
In R. irregularis-colonized roots of Medicago and barley, the amount of jasmonic acid (JA)
is elevated. JA levels increased even more after longer colonization periods and JA-biosynthesis
genes were expressed in arbuscule-containing cells. JA is typically involved in biotic stress
interactions, and elevated JA levels therefore might contribute to enhanced stress tolerance of
mycorrhizal plants (Hause et al., 2002; Stumpe et al., 2005).
Plants react to phosphate-limiting conditions by replacing phospholipids from their
extraplastidial membranes with galactolipids, mainly DGDG, and by replacing PG in plastids with
SQDG (Tjellström et al., 2008). By increasing phosphate supply in shoots and roots,
mycorrhiza-colonization can reverse this effect and therefore has an indirect effect on plant lipid
content by changing the root lipid composition in a way that it resembles the one in
phosphate-supplied plants (Bravo et al., 2017; Wewer et al., 2014).
In well-colonized AM symbiotic roots, certain apocarotenoids accumulate that are
apparent by orange-yellow coloring of mycorrhized roots. Apocarotenoids are derived from C40
carotenoids via cleavage catalyzed by CAROTENOID CLEAVAGE DIOXYGENASES (CCD) (Siebers et
al., 2016). Two apocarotenoids, the C13 cyclohexenone (α-Ionol-glycoside) and the C14 polyene
(mycorradicin) are synthesized by the mycorrhiza-specific CCD1a enzyme and therefore
accumulate in the cytoplasm of arbuscule-containing cells at later stages of the symbiosis (Fester,
2002; López-Ráez et al., 2015). As strigolactones are synthesized from the same precursor, the
induction of CCD1a might fulfill the purpose of channeling isoprenoid synthesis towards
α-Ionol-glycoside and mycorradicin instead of strigolactones in order to prevent over-promotion
of AMF and induce the arbuscule-degeneration-generation cycle (Walter 2013).
1.3 Research Objectives and Approach The focus of this project is the analysis of the fatty acid transfer from root cortex cells of L.
japonicus to the fatty acid auxotrophic arbuscular mycorrhiza fungus R. irregularis. The genomes
of arbuscular mycorrhiza fungi are devoid of type-I cytosolic fatty acid synthase genes. Therefore,
R. irregularis cannot synthesize fatty acids de novo from acetyl-CoA obtained by glycolysis, as other
heterotrophic fungi do. To investigate the symbiotic lipid transfer, this project took advantage of
the expanding knowledge on the co-evolution of host and fungal genomes as the AMF-host
genomes contain genes specifically evolved for AMF-symbiosis. One of these genes codes for an
ortholog of the acyl-ACP Thioesterase B (FatB) from Arabidopsis, called FatM. Acyl-ACP

24
Thioesterases catalyze the termination of fatty acid de novo synthesis by release of free fatty acids.
Five main approaches were developed to study the function of FatM fom L. japonicus for
mycorrhizal fatty acid supply and to investigate fatty acid and lipid metabolism in R. irregularis.
First, reverse genetics with two independent FatM transposon insertional mutants to study the
effect on R. irregularis root colonization and specifically lipid accumulation in the fungus. Second,
quantification and identification of lipids and lipid intermediates in R. irregerularis extraradical
and intraradical growth. Third, stable 13C-isotope labeling of fatty acids during symbiosis in fatm
and WT. Fourth, biochemical analysis of the recombinant FatM enzyme in vitro. Fifth, functional
characterization of candidate desaturase genes from R. irregularis by heterologous expression in
yeast and N. benthamiana.
The outcome of these experiments was intended to provide knowledge about the question
whether the fungus receives fatty acids from the host and, if so, how it metabolizes and stores
these fatty acids. It was furthermore intended to investigate how a defect in a host gene involved
in de novo fatty acid synthesis might affect the fungal morphology or metabolic capacity. Another
aim was to elucidate the nature of the transferred lipid and to provide an estimation on the
importance of lipid supply in relation to the supply of carbon in the form of carbohydrates.

25
2 Materials and Methods
2.1 Materials
2.1.1 Equipment Autoclave Tuttnauer Systec, Kirchseeon-Buch (D) Balance 770 Kern, Balingen-Frommern (D) Balance PG503-S Delta Range Mettler Toledo, Gießen (D) BalancexS205 DualRange Mettler Toledo, Gießen (D) Binocular microscope SZX16 Olympus, Hamburg (D) Büchner funnel (porcelain, 800 mL Hartenstein Laborbedarf, Würzburg (D) volume, 125mm ID) Rubber seal GUKO Hartenstein Laborbedarf, Würzburg (D) Block heater SBH130D/3 Stuart, Bibby Scientific, Staffordshire (USA) Camera DP7Z for microscope Olympus, Hamburg (D) Centrifuge 5810 R Eppendorf, Hamburg (D) Centrifuge 5417R Eppendorf, Hamburg (D) Centrifuge 5430 Eppendorf, Hamburg (DE) Centrifuge Sorvall RC 5C PLUS Thermo Fisher Scientific, Braunschweig
(D) Dual fluorescent protein flashlight NightSea, Bedford (US) Gel caster, Mighty small II GE Healthcare Europe, Freiburg (D) Growing cabinet, Rumed Rubarth Apparate GmbH (D) Heating block Bioer, Hangzhow (CHN) Homogeniser Precellys®24 PeQlab, Erlangen (D) Homogeniser HO 4/A Edmund Bühler, Hechingen (D) Horizontal electrophoresis chamber Cti, Idstein (D) Incubator, Kelvitron® Thermo Scientific Heraeus®, Waltham (USA) Incubation shaker, Multitron 28570 INFORS, Einsbach (D) Light microscope BH-2 Olympus, Hamburg (D) Magnetic stirrer MR30001 Heidolph Instruments, Schwabach (D) Micro pulser electroporator BioRad Laboratories, München (D) Mini vertical Gel Electrophoresis unit Amersham Bioscience Mixer mill MM400 Retsch, Haan (D) Multiple Gel Caster Amersham Bioscience PowerPac Basic electrophoresis power supply Bio-Rad Laboratories, München (D) pH meter inoLab pH Level 1 WTW, Weilheim (D) Photometer, Specord 205 Analytik Jena, Jena (D) Phytochamber SIMATiC OP17 York International, York (USA) Reverse-Phase Liquid Chromatography Column Knauer Eurosphere-II RP8 Reverse-Phase Liquid Chromatography Column Macherey-Nagel, Düren (D) Nucleoshell Bluebird RP18 Running chamber for gel electrophoresis Cti, Idstein (D) Sample concentrator for organic solvents Techne (Bibby Scientific), Stone (UK) Semi-dry transfer cell Trans-BLOT SD Bio-Rad Laboratories, München (D) Spectrophotometer Nanodrop 1000 PeQlab, Erlangen (D) SpeedVac® Vacuum Concentrator SPD121 P Thermo Fisher Scientific, Braunschweig
(D) Sterile bench model 1.8 Holten Lamin Air, Allerød (DK) Thermocycler TPersonel 48 Biometra, Göttingen (D)

26
Thermocycler TProfessional 96 Biometra, Göttingen (D) Ultracentrifuge Optima L 90K equipped Beckman Coulter, Krefeld (D) with swing-out rotor SW 28 UV-transilluminator DP-001 T1A Vilber Lourmat, Eberhardzell (D) 6530 Accurate-mass Agilent, Böblingen (D) quadrupole time-of-flight (Q-TOF) LC/MS 7890 Gas chromatograph (GC) Agilent, Böblingen (D) with flame ionization detector (FID) 7890 Gas chromatograph (GC) Agilent, Böblingen (D) with mass spectrometer (MS) Tri-Carb Liquid Scintillation Counter 2900 TR Packard BioScience, Meriden (USA)
2.1.2 Consumables Blotting membrane, nitrocellulose (0.45 µm) Blotting paper, pure cellulose Centrifuge tubes, polypropylene (PP) 1.5 mL, 2 mL
GE Healthcare Sigma-Aldrich, Taufkirchen (D) Sarstedt, Nümbrecht (D)
Centrifuge tubes, polypropylene (PP) 15 mL, 50 mL Greiner bio-One, Frickenhausen (D) Coverslips, 24 mmx 60 mm Marienfeld, Lauda Königshofen (D) DEAE-cellulose (pre-swollen) Whatman
DEAE-Sephadex A-25 GE Healthcare Dialysis membrane Spectra/Pore® Spectrum® Laboratories/VWR,
Darmstadt (D) dNTP-Mix (10 mM) Electroporation Cuvettes (1mm gap) Round Filter paper Ø 150 mm (Ref. 10334512)
DNA Cloning Service (D) Bio-Budget, Krefeld (D) Schleicher & Schüll
Glass Pasteur pipettes Brand, Wertheim (D) Glass tubes with screw cap, GL 14tThread, 12x100 mm, 6 mL (DURAN®) Glass tubes with screw cap, 24-400 thread, 28x95 mm, 40 mL (VOA-Vials)
DWK Life Science, Mainz (D) Schmidling Labor + Service SA, Neuheim (CH)
Glass vials for autosampler Glass beads, acid-washed (≤106 µm)
Agilent, Böblingen (D) Sigma-Aldrich, Taufkirchen (D)
Inlets for autosampler vials (Conical and flat-bottom) Liquid Scintillation vial (Polyethylene)
Agilent, Böblingen (D) PerkinElmer, Solingen (D)
Merck™ MF-Millipore Mixed Cellulose Ester Membranes (0.025μm Pore Size)
Fisher Scientific, Schwerte (D)
Microliter pipette tips type 3 series 1700 Labomedic, Bonn (D) Microscope slides, 76x 26x 1 mm Miracloth filtration material (22—25 µm) PCR tubes (BRAND® 781332), Polypropylen
Labomedic, Bonn (D Merck, Darmstadt (D)
Petri dishes (polystyrene) 35x 10 mm Greiner bio-One, Frickenhausen (D) Petri dishes (polystyrene) 94x 16 mm Greiner bio-One, Frickenhausen (D) Petri dishes (polystyrene) 145x 20 mm Greiner bio-One, Frickenhausen (D) PolyPrep® chromatography column (10 mL reservoir) Bio-Rad Laboratories, München (D) Pots for plant cultivation, (10 cm h, 7.5 cm ᴓ) Pöppelmann, Lohne (D) Salmon Sperm DNA Sigma-Aldrich, Taufkirchen (D) Silica sand, grain size 1.4 – 2.3 mm Quarzwerke Witterschlick GmbH,
Alfter (D) Soil, type „Einheitserde Classic“ Klemens Rolfs Gärter Einkauf,
Siegburg (D) SPE columns, type Strata® Silica SI-1 (55 µm, 70 Å), 100 mg / 1 mL
Phenomenex, Aschaffenburg (D)
SPE columns, type Strata® Silica SI-1 (55 µm, 70 Å), 500 mg / 6 mL
Phenomenex, Aschaffenburg (D)

27
Sterile filters, 0.2 µm pore size Schleicher und Schuell, Dassel (D) PTFE (Teflon) septa for GL 14 screw caps Schmidlin, Neuheim (CH) Trays for plant cultivation Pöppelmann, Lohne (D)
2.1.3 Chemicals Acetic acid AppliChem, Darmstadt (D) Acetone Prolabo VWR, Darmstadt (D) Acetonitrile Roth, Karlsruhe (D) Acrylamide Roth, Karlsruhe (D) Agarose PeQlab, Erlangen (D) Ammonium acetate Sigma-Aldrich, Taufkirchen (D) Ammonium sulfate Sigma-Aldrich, Taufkirchen (D) Ammonium molybdate heptahydrate Sigma-Aldrich, Taufkirchen (D Ammoniumpersulfate (APS) AppliChem, Darmstadt (D) Bacto agar Duchefa Biochemie, Haarlem (NL) Bacto peptone Duchefa Biochemie, Haarlem (NL Barium hydroxide Riedel-de Haën (Honeywell),
Seelze (D) Boric acid Grüssing, Filsum (D) Bovine Serum Albumin (BSA), fatty acid free Sigma-Aldrich, Taufkirchen (D) Bovine Serum Albumin (BSA), fraction V Sigma-Aldrich, Taufkirchen (D) Cadmium carbonate Sigma-Aldrich, Taufkirchen (D) Calcium chloride Merck, Darmstadt (D) Chloroform Merck, Darmstadt (D) Coomassie R250 AppliChem, Darmstadt (D) Diethylether Prolabo VWR, Darmstadt (D) Dimethyldisulfide (DMDS) Sigma-Aldrich, Taufkirchen (D) Dipotassiumhydrogenphosphate AppliChem, Darmstadt (D) Ethanol 99%, technical grade with 1% MEK Hofmann Ethanol, p.A. Merck, Darmstadt (D) Ethidium bromide Serva, Heidelberg (D) EDTA-Na2 Sigma-Aldrich, Taufkirchen (D) Formaldehyde AppliChem, Darmstadt (D) Formic Acid VWR, Darmstadt (D) Gelrite Duchefa Biochemie, Haarlem (NL) Glucose Formedium, Norfolk (UK) Glycerol AppliChem, Darmstadt (D) Glycine AppliChem, Darmstadt (D) Hexane Merck, Darmstadt (D) Ink (dark blue) Pelican, supplied by Dr. Caroline Gutjahr Isopropyl ß-D-1-thiogalactopyranoside (IPTG) Formedium, Norfolk (UK) Iodine AppliChem, Darmstadt (D) Iron-Ethylenediaminetetraacetic acid Sigma-Aldrich, Taufkirchen (D) (Fe-EDTA) Isopropanol (2-propanol) AppliChem, Darmstadt (D) Lithium acetate AppliChem, Darmstadt (D) Magnesium chloride AppliChem, Darmstadt (D) Magnesium sulfate Duchefa Biochemie, Haarlem (NL) Malachite green, oxalate salt Acros Organics, Geel (BEL) β-Mercaptoethanol Sigma-Aldrich, Taufkirchen (D) Methanol J.T. Baker, Phillipsburg (USA)

28
Methanolic hydrochloric acid (3N) Sigma-Aldrich, Taufkirchen (D) Molybdenumtrioxide ammoniumtetrahydrate Sigma-Aldrich, Taufkirchen (D) Sodiumthiosulfate Sigma-Aldrich, Taufkirchen (D) N-methyl-N-(trimethylsilyl)-trifluoroacetamide AppliChem, Darmstadt (D) (MSTFA) 3-(N-morpholino) propanesulfonic acid (MOPS) AppliChem, Darmstadt (D) Peptone Formedium, Norfolk (UK) Polyethylenglycerol (PEG) 4000 Roth, Karlsruhe (D) Phosphoric acid AppliChem, Darmstadt (D) Piperazine-N,N′-bis(2-ethanesulfonic acid (PIPES) AppliChem, Darmstadt (D) Potassium chloride Merck, Darmstadt (D) Potassium dihydrogenphosphate Merck, Darmstadt (D) Potassium hydroxide Merck, Darmstadt (D) Potassium nitrate Grüssing, Filsum (D) Pyridine AppliChem, Darmstadt (D) Skimmed-milk powder, blotting-grade Roth, Karlsruhe (D) Sodium chloride Duchefa Biochemie, Haarlem (NL) Sodium citrate AppliChem, Darmstadt (D) Sodium dodecyl sulfate (SDS) AppliChem, Darmstadt (D) Sodium hypochlorite Roth, Karlsruhe (D) Sorbitol Duchefa Biochemie, Haarlem (NL) Sucrose Duchefa Biochemie, Haarlem (NL) Talcum Flora Apotheke, Bonn (D) Tetramethylethylenediamine (TEMED) Bio-Rad Laboratories, München (D) Trichloracetic acid (TCA) Roth, Karlsruhe (D) Toluene Prolabo VWR, Darmstadt (D) Tritonx-100 Sigma-Aldrich, Taufkirchen (D) Tricine Sigma-Aldrich, Taufkirchen (D) Tris-(hydroxymethyl)-aminomethane (Tris) Duchefa Biochemie, Haarlem (NL) Tween-20 Sigma-Aldrich, Taufkirchen (D) Tryptone AppliChem, Darmstadt (D) Ultima Gold Scintillation Cocktail PerkinElmer, Solingen (D) Wheat germ agglutinin (WGA) alexa fluor 488 Life Technologies (Invitrogen), Yeast Extract Duchefa Biochemie, Haarlem (NL) Yeast Nitrogen Base (YNB) Formedium, Norfolk (UK) 13C2-Sodium Acetate Sigma-Aldrich, Taufkirchen (D)
13C6-Glucose Sigma-Aldrich, Taufkirchen (D) 13C4-Palmitic acid Sigma-Aldrich, Taufkirchen (D)
2.1.4 Antibiotics Ampicillin Duchefa Biochemie, Haarlem (NL) Carbenicillin Duchefa Biochemie, Haarlem (NL) Gentamycin Duchefa Biochemie, Haarlem (NL) Kanamycin Duchefa Biochemie, Haarlem (NL) Rifampicin Duchefa Biochemie, Haarlem (NL) Spectinomycin Duchefa Biochemie, Haarlem (NL) Streptomycin Duchefa Biochemie, Haarlem (NL)
2.1.5 Commercial Kits and Enzymes CloneJET PCR Cloning Kit Thermo Fi. Sci.,, Karlsruhe (D) Color Prestained Protein Standard, Broad NEB, Frankfurt a. M (D) Range (11–245 kDa) DCS DNA Polymerase (10 U/µL) DNA Cloning Service, Hamburg (D)

29
DNaseI (A3778) AppliChem, Darmstadt (D) Endoproteinase Asp-N Sequencing Grade Promega (2µg 50µL-1) GeneRuler 1kb DNA ladder Thermo Fi. Sci., Braunschweig (D) First Strand cDNA Synthesis Kit Thermo Fi. Sci., Karlsruhe (D) HisDetector Nickel-HRP Conjugate Kirkegaard & Perry Laboratories,
Wedel (D) Ni-NTA Agarose Qiagen, Hilden (D) NucleoSpin® Gel and PCR Clean-up Kit Macherey-Nagel, Düren (D) NucleoSpin® Plasmid DNA Miniprep Kit Macherey-Nagel, Düren (D) NucleoSpin® RNA Plant Kit Macherey-Nagel, Düren (D) Plant Total RNA Mini Kit DNA Cloning Service, Hamburg (D) Restriction endonucleases and buffers NEB, Frankfurt a. M (D) SuperSignal West Pico Chemiluminescence Thermo Fi. Sci., Braunschweig (D) Substrate T4 DNA Ligase M0202S (400 U/µL) NEB, Frankfurt a. M (D) TURBO DNA-free Kit Thermo Fi. Sci., Karlsruhe (D) Q5® High-Fidelity DNA polymerase (M0491) NEB, Frankfurt a. M (D) Quick StartTM Bradford Protein Assay Bio-Rad Laboratories, München (D)
2.1.6 Internal Standards for Lipid Quantification and Identification Pentadecanoic acid (15:0) Sigma-Aldrich, Taufkirchen (D) Arachidonic acid (20:4∆5,8,11,14cis ) Larodan, Malmö (S) Cholesterol Sigma-Aldrich, Taufkirchen (D) Cholestanol Sigma-Aldrich, Taufkirchen (D) Stigmasterol Sigma-Aldrich, Taufkirchen (D) Stigmastanol Sigma-Aldrich, Taufkirchen (D) di14:0-PC Avanti Polar Lipids, Alabaster AL (USA) di20:0-PC Avanti Polar Lipids, Alabaster AL (USA) di14:0-PE Avanti Polar Lipids, Alabaster AL (USA) di20:0-PE Avanti Polar Lipids, Alabaster AL (USA) di14:0-PG Avanti Polar Lipids, Alabaster AL (USA) di20:0-PG Avanti Polar Lipids, Alabaster AL (USA) di14:0-PA Avanti Polar Lipids, Alabaster AL (USA) di20:0-PA Avanti Polar Lipids, Alabaster AL (USA) di14:0-PS Avanti Polar Lipids, Alabaster AL (USA) di20:0-PS Avanti Polar Lipids, Alabaster AL (USA) PI Mix, from soybean Larodan, Malmö (S) MGDG mix Larodan, Malmö (S) DGDG mix Larodan, Malmö (S) SQDG mix Larodan, Malmö (S) Monopentadecanoin (MAG-15:0) Larodan, Malmö (S) Monopalmitine (MAG-16:0) Larodan, Malmö (S) Monooleoine ∆9cis (MAG-18:1) Larodan, Malmö (S) Monolinoleine ∆9,12cis (MAG-18:2) Larodan, Malmö (S) Monolinolenine ∆9,12,15cis (MAG-18:3) Larodan, Malmö (S) Monoarachidone ∆5,8,11,14cis (MAG-20:4) Larodan, Malmö (S) di-14:0-DAG Larodan, Malmö (S) di-14:1∆9cis -DAG Larodan, Malmö (S) di-20:0-DAG Larodan, Malmö (S) di-20:1∆14cis -DAG Larodan, Malmö (S) tri-10:0-TAG Larodan, Malmö (S) tri-11:1∆10cis -TAG synthesized by Helga Peisker (IMBIO)

30
tri-17:0-TAG Larodan, Malmö (S) tri-17:1-TAG Larodan, Malmö (S) tri-20:0-TAG Larodan, Malmö (S) tri-22:1∆13cis -TAG Larodan, Malmö (S) Palmitoyl-CoA (16:0-CoA) Larodan, Malmö (S) Heptadecanoyl-CoA (17:0-CoA) Sigma-Aldrich, Taufkirchen (D) Heptadecanoyl-CoA (17:0-CoA) Avanti Polar Lipids, Alabaster AL (USA) Stearoyl-CoA (18:0-CoA) Sigma-Aldrich, Taufkirchen (D) Octadecenoyl-CoA (18:1∆9-CoA) Sigma-Aldrich, Taufkirchen (D) Linoleoyl-CoA (18:2∆9,12cis -CoA) Sigma-Aldrich, Taufkirchen (D) Linolenoyl-CoA (18:3∆9,12,15cis -CoA) Sigma-Aldrich, Taufkirchen (D)
2.1.7 Plants, Bacteria and Fungi
L. japonicus wild type, ecotype Gifu Jens Stougaard, University of Aarhus (DK)
L. japonicus LORE1 retrotransposon insertion mutant (FatM-1/G63)—Lotus BASE Plant ID: 30003218 (MG20 Genome v2.5 +LjSGA)
(Malolepszy et al., 2016)
L. japonicus LORE1 retrotransposon insertion mutant (FatM-2/D20)—Lotus BASE Plant ID: 30052489 (MG20 Genome v2.5 +LjSGA)
(Malolepszy et al., 2016)
N. benthamiana WT A. tumefaciens strain GV3101-pMP90 (Koncz and Schell, 1986) E. coli ElectroSHOX Bioline, Luckenwalde (D) E. coli fadD mutant (Dörmann et al., 1995) R. irregularis inoculum with attapuglite clay powder or diatomite as carrier (1 Million spores 100 g -1), corresponding to voucher number DAOM197198, DAOM181602 and MUCL43194
Symplanta GmbH, München (D)
R. irregularis in axenic root culture with Agrobacterium rhizogenes-transformed carrot roots
Department of Genetics, Arthur Schüßler, LMU München (D)
S. cerevisiae WT, Genotype: BY4741 EUROSCARF, Johann Wolfgang Goethe Universität, Frankfurt a. M. (D)
S. cerevisiae ole1 mutant (ORF: YGL055W, Acc. No.: Y40963, Strain: TSA506 Genotype: BY4741)
EUROSCARF, Johann Wolfgang Goethe Universität, Frankfurt a. M. (D) (Stukey et al., 1989)
Table 1: Cloning and Expression Vectors
Vector Description, Selection Marker Reference pDR196 Vector for expression in S. cerevisiae,
AmpR, URA3 (Rentsch et al., 1995)
pYES2 Vector for expression in S. cerevisiae, AmpR, URA3
Invitrogen
pJET1.2 Vector for subcloning in E. coli , AmpR Thermo Fisher Scientific pQE-80L Vector for expression in E. coli, AmpR Qiagen pBin35S1 Vector for expression in plants with 35S
promoter, KanR pBinGlyRed3 (Zhang et al., 2013)
1BamHI and MluI were used to exchange the Glycinin Promoter by 35S Promoter, then eGFP was added with MluI and XhoI (Georg Hölzl, IMBIO). eGFP was replaced by AtWSD1 with MluI and XhoI (Andreas Ahrens, IMBIO).

31
Table 1: (continued)
Vector Description, Selection Marker Reference 917p9RFPUBQ Expr
Vector for expression in plants with Ubiquitin promoter, StrepR, SpecR
pVS1-backbone (Vodala et al., 2008), modified plasmid obtained by Nicole Gaude, MPI Golm
pUC57
Level 0 sublconing of PCR fragments for Golden Gate CloningR, AmpR
Thermo Fisher Scientific, (Binder et al., 2014)
pUC57+BpiI
Level 1 sublconing for Golden Gate CloningR, GentR
Thermo Fisher Scientific, (Binder et al., 2014)
Table 2: Recombinant Expression Vectors
Construct Insert with Restriction Sites or PCR
Vector Organism of Destination
Glycostock (E. coli)
pQE-LjFatAΔtp LjFatA cDNA, BamHI-HindIII (989 bp)
pQE-80L E. coli bn 1160, bn 1161
pQE-LjFatBΔtp LjFatB cDNA, BamHI-HindIII (1101 bp)
pQE-80L E. coli bn 1162, bn 1163
pQE-LjFatMΔtp LjFatM cDNA, BamHI-HindIII (1070 bp)
pQE-80L E. coli bn 881
pDR196-RiOLE1 RiOLE1cDNA, SmaI-XhoI (1226 bp)
pDR196 S. cerevisiae bn 1215
pDR196-RiOLE1-LIKE RiOLE1-LIKE cDNA, SmaI-XhoI (1262 bp)
pDR196 S. cerevisiae bn 1216
pYES2-RiOLE1-LIKE RiOLE1-LIKE cDNA, HindIII-SacI (1262 bp)
pYES2 S. cerevisiae bn 1217
p917UBQ3-RiOLE1 RiOLE1cDNA, BamHI-HindIII (1226 bp)
p917RFP UBQ Expr
N. benthamiana bn 1250
pBin35S-RiOLE1-LIKE RiOLE1cDNA, MluI-XhoI (1262 bp)
pBin35S N. benthamiana bn 1246
2.1.8 Software and Online Resources
Resource Reference
Clone Manager Professional Suite, ver. 8.0
Sci-Ed Software, 2005
Molecular Evolutionary Genetic Analysis (MEGA), ver.6.0
Sci-Ed Software, 2005 (Tamura et al., 2013)
ChloroP 1.1 Server, ver.1.1 (Emanuelsson et al., 1999)
L. japonicus Gene Expression Atlas (LjGEA), ver. 2 (2012)
(Verdier et al., 2013) https://ljgea.noble.org/v2/
Medicago truncatula Gene Expression Atlas (MtGEA), ver. 3
(Benedito et al., 2008; He et al., 2009)
Lotus BASE; Genomic, Proteomic & Expression Resources for L. japonicus (LORE1), ver.2.5
(Malolepszy et al., 2016)
32
Phytozome; Plants Comparative Genomics
Portal, ver.7
(Goodstein et al., 2012)
MassHunter Workstation Software Qualitative Analysis, ver. B.06.00
Agilent Technologies, Inc. 2012
MassHunter Workstation Software Quantitative Analysis for Q-TOF, ver. B.07.00
Agilent Technologies, Inc. 2008
Multiple Sequence Alignment (MultiAlin) (Corpet, 1988)
MycoCosm; R. irregularis Genome (DAOM 181602), ver. 1.0
(Tisserant et al., 2013)
EnsemblFungi; Ensembl Genome Browser, ver. Release 40
(Kersey et al., 2018)
ImageJ 1.52a, Java 1.8.0_77 (64-Bit) Wayne Rasband, National Institutes of Health, USA (https://imagej.net/ImageJ)
Isotope Distribution Calculator and Mass Spectrum Plotter
John J. Manura, David J. Manura, Scientific Instrument Service, USA (https://www.sisweb.com/mstools/isotope.htm)
Cyberlipid Center Cyberlipid.org
Saccharomyces Genome Database (SGD), ver. January 2017
(Engel et al., 2014)
2.2 Methods
2.2.1 Minimal Statistics
Statistical analysis of raw data was done with Microsoft Excel 2013. If possible, a minimum
number of five biologically independent replicas was used. To test for significant differences in
the mean value between more than two groups, one-way ANOVA was conducted. Significant
differences between the mean value of a given measurement between two independent groups (e.
g. WT and mutant) were tested with two-tailed students t-test assuming equal variance. When p
< 0.05 (α, level of significance), the null hypothesis was rejected and differences between mean
values were defined significant. For multiple pairwise comparisons (e. g. WT, mutant A and
mutant B), post-hoc tukey or bonferroni-corrected t-test was done to correct for the increase in
family-wise error rate.
2.2.2 Identification and Isolation of Homozygous Insertional Mutants in L. japonicus Acyl-ACP Thioesterases
L. japonicus FatM and FatB gene sequence were identified previously based on sequence
homology to Arabidopsis FatB (Gomez et al., 2009; Wewer et al., 2014). Using the transcript
sequences, the L. japonicus Gene Expression Atlas (LjGEA) and the M. truncatula Gene Expression
Atlas (MtGEA) were searched to identify expression patterns under various treatments and to
identify other FatB homologs. The LjGEA transcript sequences of the acyl-ACP thioesterase
homologoues identified (LjGEA Gene ID´s: LjFatM: chr5.CM0328.70.r2.d, LjFatB:
Ljwgs_013315.1_at, LjFatA: chr1.CM0316.110.r2 and LjFatC: LJwgs_022305.1_at) were employed

33
in a BLAST search against the L. japonicus genome database ver. 2.5 (Lotus BASE). The resulting
BLAST header of the most similar hit was then used to identify LORE1 retrotransposon insertion
mutants with the LORE1-lines search option from Lotus BASE and R3 seeds were obtained for
these lines. Plants were cultivated, leaf DNA extracted and touchdown PCR performed for
genotyping of homozygous LORE1 insertions as described below (see 2.2.2.2, 2.2.3.1, 2.2.3.2 and
appendix 7.1). To confirm the exact position of the LORE1 insertion, PCR products were
gel-purified and sequenced using the respective genotyping primers.
To compare protein sequences of acyl-ACP thioesterases from various plant species, a
BLASTp search against all translated genomes in the Phytozome database (Plant Comparative
Genomics portal, ver. 7) was conducted using the LjFatM translated amino acid sequence as query.
Sequences from Umbellularia californica UcFatB1 (Voelker et al., 1992) and Cuphea hookeriana
ChFatB2 (Dehesh et al., 1996) were added manually. Multiple sequence alignment was done
automatically using the MUSCLE algorithm implemented in MEGA ver. 6.0 with the UPGMB
clustering method with pre-set parameters. The alignment was exported and a phylogenetic tree
reconstructed by use of maximum likelihood (ML) with amino acid substitution model WAG (+F),
Gamma distributed rates among sites with invariant sites (G+I) and subtree pruning and
regrafting was done as heuristic method for tree reconstruction. The initial tree was created by
Neighbor-joining and the resulting ML tree was tested for validity by performing 1000 pseudo-
iterations (Bootstraps) of the initial amino acid sequence alignment followed by reconstruction of
the ML tree.
To identify R. irregularis desaturases, the protein sequence of S. cerevisiae acyl-CoA
desaturase OLE1 (OLEIC ACID DEPENDENT 1, systemic name YGL055W) was used for a BLAST
search against S. cerevisiae (R64-1-1) and R. irregularis (DAOM 181602=DAOM 197198
GCA_000439145) proteins, accessed at EnsemblFungi (www.fungi.ensembl.org). All hits with an
E-value >0.05 (20 sequences) were retrieved and used subsequently for multiple sequence
alignment with MEGA ver. 6.0 using the MUSCLE algorithm. To visualize sequence similarities
with regard to ScOLE1, a neighbor joining tree was constructed with all retrieved R. irregularis
sequences using the JTT model, gamma distributed rates among sites and pairwise deletions of
gaps. Robustness of the resulting branches was tested by 1000 pseudo-iterations (Bootstraps).
2.2.2.1 Phylogenetic Tree of Plant Acyl-ACP Thioesterases
2.2.2.2 Amino Acid Sequence Comparison of Yeast and R. irregularis Desaturases

34
N. benthamiana was cultivated on soil:vermiculite (3:1 v/v) under long day conditions
(16 h light, 8 h dark) at 25°C, 60% humidity, light intensity of 250 mmol s-1 m-2 and watered with
tap water except for the first irrigation, which contained 0.186% (w/v) boric acid and 0.15% (v/v)
Proplant (Dr. Stähler). Seedlings were seperated into single pots after two weeks and used at 4
weeks after sowing for infiltration experiments.
Seeds from L. japonicus were stored in seed bags for 1—3 month after harvest at RT.
Afterwards, they were transferred to HPLC-vials without inlet and dried in a vacuum desiccator
for three days. For sterilization and pre-germination treatment, seeds were transferred to 2 mL
Eppendorf tubes (50—200 seeds per tube). To break dormancy, the tubes were incubated for 10
sec in liquid nitrogen. Afterwards, the seeds were incubated in 1 mL 96% (v/v) ethanol for 10 sec
and dried thoroughly. Then, they were soaked for 20 min in 2 mL sterilization solution (2% (v/v)
sodium hypochlorite and 0.0001% (v/v) Tween 20) while shaking to ensure equal treatment of
every seed with the solution. The solution was discarded and the seeds rinsed at least five times
with sterile water and finally left in the final wash in the dark ON at RT for swelling. The next day,
they were placed on water‐agar medium (tap water solidified with 0.6% (w/v) agar) and
transferred to a 16 h light/8 h dark cycle with 60% relative humidity, 21°C and a light intensity of
120 µmol m-2 s-1. After 5—14 days, seedlings were transferred to pots (7.5 cm height, 10 cm
diameter) filled with soil:vermiculite (1:3) or silica sand for seed propagation or used for
inoculation with R. irregularis (see 2.2.2.5).
1L Nutrient Solution (+P)
1.25 mM K2HPO4
1.25 mM KH2PO4
0.5 mM KNO3
0.5 mM MgSO4
0.25 mM KCl
0.25 mM CaCl2
0.025 mM Fe-EDTA
0.25 mL trace Elements
1L Nutrient Solution (-P)
0.025 mM K2HPO4
0.025 mM KH2PO4
0.5 mM KNO3
0.5 mM MgSO4
0.25 mM KCl
0.25 mM CaCl2
0.025 mM Fe-EDTA
0.25 mL trace Elements
Trace Elements
Stock Solution
9.2 mM MnCl2
46.3 mM H3BO3
0.81 mM ZnCl2
0.11 mM NaMoO4
0.29 mM CuCl2
2.2.2.3 Cultivation of N. benthamiana
2.2.2.4 Cultivation of L. japonicus

35
Germinated seedlings were transferred to pots filled by three quarters with a substrate of
sand:vermiculite (1:1) containing R. irregularis in diatomite or clay as spore carrier material
(1 million spores per g material). The sand was previously washed thoroughly with tap water and
finally with deionized water to eliminate all traces of phosphate, then mixed with vermiculite and
autoclaved in small bags. The pots were filled, and per pot, 0.3—1 g carrier material containing
3000-10000 spores was added and mixed to a homogenous substrate with a small spoon. The
amount of spores differed between experiments, but was the same for all pots of a particular
experiment, so that mutant and WT plants were inoculated with the same density of spores. Per
pot, 3—4 seedlings were embedded into the upper 1 cm layer. As non-inoculated control, carrier
material devoid of AMF spores was utilized. Inoculated plants were incubated at standard
phytochamber conditions (see 2.2.2.4), covered by plastic hoods for the first 1—2 weeks and
watered three times per week directly into the pots, two times with tap water (30 mL per pot)
and once with 50 mL nutrient (–P) solution to enhance colonization with AMF. Samples of
inoculated and mock-inoculated plants were taken 4 or 7 weeks after inoculation. For harvest of
roots, whole pots were emptied, the substrate brushed off gently and the plants disentangled in a
beaker with water to avoid damage to the roots.
2.2.2.5.1 Staining of Fungal Structures in Colonized Roots and Microscopy
Roots were washed gently under tap water, cut at the root-shoot junction and transferred
to Eppendorf tubes (2 mL) pre-filled with 10% (w/v) KOH. In case roots were stored prior to
staining, they were put in 50% (v/v) ethanol at 4°C until transfer to KOH and staining.
R. irregularis structures were either stained with ink:vinegar for light microscopy or Alexa-Fluor
Wheat-Germ Agglutinin (WGA) (Panchuk-Voloshina et al., 1999) for confocal laser scanning
microscopy.
For ink:vinegar staining, the method of Vierheilig et al. (1998) was employed. The roots
were incubated at 95°C for 15 min, then the liquid was carefully discarded, and the roots rinsed
once with tap water and once with 10% (v/v) acetic acid prior to 5 min incubation at 95°C in
staining solution (5% ( v/v) Ink (Pelican), 5% (v/v) acetic acid). The roots were carefully removed
with forceps, rinsed under tap water for 10 sec and incubated in 5% (v/v) acetic acid at 4°C for 20
min or long-term storage.
WGA-staining and confocal microscopy was done together with Andreas Keymer in the
laboratory of Caroline Gutjahr at the Ludwig-Maximilian University (LMU) in München. The
method described by Pimprikar et al. (2016) was used. Roots were incubated in KOH as described
above but only for 5 min. Afterwards, they were rinsed three times with tap water and incubated
for 1—2 h in 0.1 M HCl, then rinsed once with tap water and 1x PBS, pH 7.4. For staining, WGA
2.2.2.5 Inoculation of L. japonicus with R. irregularis

36
staining solution (0.2 µg in 1 mL 1x PBS, pH 7.4) was added and the roots incubated in the dark
for at least 6 h and stored at 4°C. Roots were mounted on microscope slides and images taken with
a confocal laser scanning microscope Leica SP5 along the Z-axis. Z-stacks were superimposed with
the ImageJ software and merged into a single picture for three-dimensional visualization of fungal
arbuscules.
2.2.2.5.2 Quantification of Colonization Parameters
Different colonization parameters were quantified in R. irregularis colonized WT and fatm
mutant roots. Ink-stained colonized roots were investigated at 10-fold magnification with a
bright-field microscope (BH-2, Olympus).
Root length colonization (%) was quantified based on the grid-line intersection method
(Brundrett, 1996; McGonigle et al., 1990). Root systems were placed in a petri dish with tap water
and dissected with forceps and scalpel into 1 cm root segments. Ten of these segments were
placed on a microscope slide, covered with water and a cover slip and monitored for the
occurrence of fungal structures. To this end, a thread was placed in the middle of the eyepiece (the
intersect) and every root segment was assessed ten times at different, randomly chosen spots
whether the intersect traverses a vesicle, an arbuscule, an intraradical hypha, or no mycorrhizal
structure. Multiple fungal structures could be scored by the intersect at one spot. The percentages
of arbuscule, vesicle and hyphae were expressed as percentage of total spots counted, which were
generally 100 spots per root system.
Measurements of vesicle size was done in the same roots that were used for root length
colonization quantification. All vesicles were measured with the CellLens software (Olympus) in
the ten root segments (1 cm) and averaged per root system.
To visualize premature arbuscule degeneration in the FatM mutant, four categories of
arbuscules were counted similarly to the root length colonization parameters described above.
The ten root segments (1 cm) were randomly investigated at 10 spots per segment and the
intersect used for evaluation of the arbuscule type. Four types of arbuscules were considered: a
normal arbuscule that fills the entire cavity of the cell, a stunted arbuscule that appears shriveled
and small, both types together, or no arbscule at all in the cell. Examples of the arbuscule types
stained with WGA and captured with a confocal microscope are shown in Figure 6.
In-vitro cultivation of R. irregularis was done in axenic root culture in symbiosis with
D. carota roots (Cranenbrouck et al., 2005). The culture was originally obtained by Arthur
Schüßler (LMU, München). To amplify R. irregularis extraradical mycelium on plates, a section of
MSR medium containing colonized roots and ERM was excised with a sterile scalpel. The piece of
MSR medium with roots and ERM was placed on freshly prepared MSR medium (see below) in an
2.2.2.6 Root Axenic Culture of D. carota with R. irregularis
37
one-compartment petri dish (145x 20 mm), or onto one side of a two-compartment petri dish
(94x 16 mm), and incubated at 28°C in the dark for 1—4 month. Hyphal and spore densities of the
ERM in the medium were calculated from a 1 cm2 square with a light microscope and extrapolated
for the whole plate.
Stock 1 (Macroelements)
73.9 g MgSO4 .7H2O
7.6 g KNO3
6.5 g KCl
0.4 g KH2PO4
Add ddH2O to 1 L. Store at 4°C.
Stock 2 (Calcium Citrate)
35.9 g Ca(NO3)2 . 4H2O
Add ddH2O to 1 L. Store at 4°C.
Stock 3 (Vitamins)
0.09 g calcium panthotenate
0.0001 g biotin
0.1 g nicotinic acid
0.09 g pyridoxine
0.1 g thiamine
0.04 g cyanocobalamine
Add ddH2O to 500 mL. Store as 5 mL aliquots at -
20°C.
Stock 4 (NaFeEDTA)
0.16 g NaFeEDTA
Add ddH2O to 500 mL. Store as 5 mL
aliquots at -20°C.
Stock 5 (Microelements)
I) 1.225 g MnSO4 . 4H2O add ddH2O to 100 mL
II) 0.14 g ZnSO4 . 7H2O add ddH2O to 100 mL
III) 0.925 g H3BO3 add ddH2O to 100 mL
IV) 1.1 g CuSO4 . 5H2O add ddH2O to 50 mL
V) 0.12 g Na2MoO4 . 2H2O add ddH2O to 100 mL
VI) 1.7 g (NH4)6Mo7O24 . 4H2O add ddH2O to 100 mL
Mix solution I, II and III, add 5 mL of solution IV, 1 mL
of solution V and VI, add ddH2O to 500 mL. Store at
4°C.
MSR Medium
10 mL Stock 1
10 mL Stock 2
5 mL Stock 3
5 mL Stock 4
1 mL Stock 5
10 g Sucrose
3 g Gelrite.
Dissolve all components. Add ddH2O
to 1L. Adjust pH to 5.5 with NaOH 1M.
2.2.2.6.1 Extraction of R. irregularis ERM from Culture
For harvest of ERM, roots were removed manually with forceps, leaving only hyphae and
spores (ERM) in the medium. The medium was mashed with a spoon and then transferred to
approximately 10 volumes (200 mL for 145x 20 mm petri dish) of sodium citrate solution (20
mM) pre-heated to 40°C, and mixed vigorously by shaking. After 5—20 min incubation at 40°C,
the gelrite was completely dissolved in the sodium citrate buffer and the ERM floated freely in the
liquid. The solubilization of the medium took substantially longer when older (>50 days) plates
were used, due to loss of water from the medium.

38
In the liquid buffer, hyphae and spores formed an aggregate that was retained after passing the
dissolved medium through miracloth (22—25 µm pore size) mounted on a plastic funnel. The
ERM was transferred with forceps to a fresh miracloth piece on a funnel and washed with 1 L
ddH2O to remove residual medium and external contaminants. Fresh weight was determined and
ERM stored at -80°C until RNA or lipid extraction (Wewer et al., 2014) (see 2.2.3.7.1 and 2.2.8.2).
The inorganic phosphate content was measured in shoots of colonized and non-colonized
plants. The method from Itaya and Ui (1966) was used. Either, a shoot section containing 1—3
trifoliate leaves with the stem portion was harvested or total shoots including the leaves. For
every treatment, similar shoots sections with the same amount of leaves were chosen and dried
for 110°C for 2h, homogenized in a ball mill with ceramic beads (Precellys®) and soluble
compounds were dissolved with 1 mL extraction buffer, centrifuged at 4000 g for 5 min. Next, 20
µL of the supernatant were mixed with 480 µL color reagent (molybdate and malachite green),
480 µL 1N HCl and 20 µL Tween 20 and the color was allowed to developed for 30 min. Then, the
absorpiton was measured photometrically at an OD of 660 nm. At acidic pH, the organic dye
malachite green forms a complex with phosphomolybdate that causes a shift in the absorption
maximum, allowing quantification of soluble, inorganic phosphate at 660 nm. A calibration curve
was set up with 0, 10, 75, 100, 200 and 500 µmol KH2PO4 for phosphate quantification.
Extraction Buffer
0.33 M Sorbitol
2 mM MgCl2
1 mM EDTA
50 mM Tricine
Color Reagent
One volume 4.2% w/v ammonium molybdate in 5 N HCl
Three volumes 0.2% w/v Malachite Green
2.2.3 Methods for Working with Nucleic Acids
For DNA isolation, 10—100 mg of leaf tissue was frozen in liquid nitrogen and ground with
a ball mill (Precellys). One mL of CTAB (cetyltrimethylammonium bromide) buffer was added and
the mixture was incubated at 65°C for 10 min under continuous shaking. Phase separation was
then achieved by centrifugation for 5 min at 3000 rpm. The aqueous phase was transferred to a
fresh tube, and incubated on ice for 10 min after mixing with 0.7 mL of isopropanol to precipitate
DNA. DNA was pelleted by centrifugation (10000 g, 5 min), the supernatant discarded and the
pellet rinsed with cold 70% (v/v) ethanol, which was discarded after an additional centrifugation
step (10000 g, 5 min). The remaining pellet was dried and re-dissolved in 50 µL ddH2O and DNA
2.2.2.7 Measurement of Shoot Inorganic Phosphate
2.2.3.1 Isolation of Genomic DNA from Plant Tissue
39
concentration determined by measuring the absorption at a wavelength of 260 nm with the
Nanodrop 1000 photometer.
CTAB Buffer
0.1 M Tris, pH 8.0
20 mM EDTA, pH 8.0
280 mM NaCl
20% (w/v) CTAB
The pH for Tris was adjusted with HCl, the pH for EDTA was adjusted with NaOH.
The polymerase chain reaction (PCR) conditions for primer pairs are listed in appendix
7.1. DNA fragments from DNA or cDNA were amplified by PCR with DNA-polymerases from
Thermus aquaticus (Taq) for genotyping and RT-PCR or with Q5 High-Fidelity Polymerase (NEB)
with proofreading ability if sequences were amplified for cloning and recombinant expression.
PCR Reaction-Mix (Taq)
0.5 µL Taq-polymerase (1 U/µL)
1—3 µL template DNA
1 µL primer forward (10 pmol/µL)
1 µL primer reverse (10 pmol/µL)
2.5 µL 10x buffer
2 µL dNTPs (2.5 mM per nucleotide)
1.5 µL MgCl2 (25 mM)
Add nuclease-free ddH2O to a final
volume of 25 µL.
Q5 Reaction-Mix
0.25 µL Q5 High-Fidelity Polymerasea
1—3 µL template DNA
1 µL primer forward (10 pmol/µL)
1 µL primer reverse (10 pmol/µL)
5 µL 5x Q5 reaction buffer
0.5 µL dNTPs (2.5 mM per nucleotide)
Add nuclease-free ddH2O to a final volume of
25 µL. a Q5 polymerase was added after the reactions were
heated to 98°C to avoid exouclease activity
High-fidelity restriction endonucleases from New England Biolabs were used with the
CutSmart buffer system and incubated at the appropriate temperature for 15 min for up to 2 h.
Cleaved fragments were then seperated by gel electrophoresis. Restriction of plasmid DNA after
extraction of plasmids from recombinant E. coli was done to produce recombinant plasmids for
expression, or to verify correct insertions of insert DNA into the plasmid.
2.2.3.2 Polymerase Chain Reaction
2.2.3.3 Restriction Digestion

40
Restriction Reaction
5—10 µL plasmid DNA (up to 1 µg)
0.5—1 µL restriction enzyme 1 (10 U µL-1)
0.5-1 µL restriction enzyme 2 (10 U µL-1)
5 µL 10x CutSmart buffer
Add nuclease-free ddH2O to a final volume
of 50 µL.
The restriction reaction was scaled down to 25 µL if only a test restriction for proper insertion
into the plasmid was required.
After preparation of plasmid DNA and restriction digestion or PCR, gel-purified plasmids
and inserts were used in a ligation reaction. Amplification of cDNA by Q5-PCR yields blunt-end
PCR products that were cloned into blunt-end sublconing vector pJET 1.2 from the CloneJET PCR
Cloning Kit (Thermo Fisher Scientific) in a blunt-end ligation with T4 DNA Ligase (New England
Biolabs). For ligation, a 3:1 molar ratio of insert-to-vector was used. The relative intensities of
insert and vector DNA fragments were estimated by loading 1 µL of each fragment on a thin
agarose gel that was developed for 5 minutes at 120 V. The estimated intensities were used to
calculate the amount of insert and vector that were needed to achieve a 3:1 molar ratio in the
ligation reaction.
Blunt-end Ligation
1—10 µL gel-purified PCR product
0.5—1 µL linear, blunt-end pJET 1.2 (1
ng.µL-1)
2 µL 10x T4 DNA Ligase buffer
0.25—0.5 µL T4 DNA Ligase M0202S
(400.000 U mL-1)
add nuclease-free ddH2O to a final
volume of 20 µL
The reaction was incubated at RT for 2 h
and stopped at 65°C for 5 min.
Cohesive-end Ligation
1—10 µL gel-purified insert
0.5—3 µL gel-purified linear expression
vector (50—400 ng µL-1)
2 µL 10x T4 DNA Ligase buffer
0.25—0.5 µL T4 DNA Ligase M0202S
(400.000 U mL-1)
Add nuclease-free ddH2O to a final volume of
20 µL.
The reaction was incubated at RT for 30 min
and stopped at 65°C for 5 min.
After heat-inactivation of the ligation reaction, the whole reaction mixture was spotted on a mixed
cellulose ester membrane (0.025 μm pore size) floating on 20 mL ddH2O in a small petri dish (35x
10 mm) and incubated at RT for 30—60 min to desalt the ligation mix.
2.2.3.4 Ligation

41
Plasmid DNA was purified from E. coli cells with the NuceloSpin® Plasmid DNA Miniprep
Kit (Macherey & Nagel) according to standard procedures from pelleted ON cultures (5 mL)
prepared from single colonies grown on selective agar.
DNA Fragments from restriction digestions or PCR amplification were eluted from DNA
agarose gels with the NuceloSpin® Gel and PCR Clean-up Kit (Macherey & Nagel).
Expressed genes from L. japonicus roots or R. irregularis ERM were amplified after cDNA
synthesis from mRNA either for cloning into expression vectors (see appendix 7.4, 7.5, 7.6) or to
compare gene expression (see 2.2.3.7.3).
2.2.3.7.1 Isolation of RNA from L. japonicus and R. irregularis
To avoid RNAse degradation, the samples were kept on ice and RNAse-free equipment was
used. Freshly harvested L. japonicus roots and R. irregularis ERM prepared from MSR plates (see
2.2.2.6) were immediately frozen in liquid N2 and homogenized with pre-cooled mortar and
pestle. Approximately 50—100 mg of material was weighed into pre-cooled Eppendorf tubes and
total RNA was extracted with the Plant Total RNA Mini Kit (DNA Cloning Service). Contaminating
DNA was digested with the TURBO DNA-freeTM Kit (Thermo Scientific). The DNAse-digested RNA
was measured on a Nanodrop photometer to ensure good quality RNA with a A260nm/A280nm
ratio of 1.8—2.0 and to quantify the exact concentration of total RNA. RNA gel electrophoresis was
done afterwards to ensure that no degradation of RNA took place and that equal amounts of RNA
were used for subsequent cDNA synthesis.
2.2.3.7.2 RNA Formaldehyde Gel Electrophoresis
Extracted total RNA from plant and fungal tissues was investigated by formaldehyde gel
electrophoresis prior to first strand cDNA synthesis to ensure good quality RNA. Agarose was
melted in the microwave oven and mixed with MOPS buffer, pH 8.0. After cooling, formaldehyde
was added and the gel was immediately poured. 100—1000 ng total RNA dissolved in water was
diluted to a volume of 10 µL with RNAse-free ddH2O and mixed with 2x RNA sample loading buffer.
Prior to loading, the samples were incubated at 65°C for 10 min to denature the RNA.
Electrophoresis was conducted at 90 V for 30 min. The RNA-Ethidium bromide complexes were
visualized under UV light at a wavelength of 312 nm.
2.2.3.5 Preparation of Plasmid DNA
2.2.3.6 Elution of Nucleic Acids from Agarose Gels
2.2.3.7 Amplification of Expressed Genes by RT-PCR

42
10x MOPS Buffer
0.2 M MOPS
50 mM Sodium acetate
10 mM Na-EDTA
Adjusted to pH 7 or pH 8 with NaOH.
2x RNA Sample Loading Buffer
65% v/v Formamide
8% v/v Formaldehyde
1.3% w/v 1x MOPS, pH 8
54 µg mL-1 Ethidium bromide
Formaldehyde Agarose Gel
1.5% (w/v) Agarose
6% v/v Formaldehyde
in 1x MOPS, pH 8
RNA Running Buffer
10% (w/v) Formaldehyde
in 1x MOPS, pH 7
2.2.3.7.3 First Strand cDNA Synthesis and Reverse Transcription PCR (RT-PCR)
Gene expression was determined with semi-quantitative RT-PCR in mock-inoculated and
AMF-inoculated roots and in fungal ERM. To this end, total RNA was isolated from L. japonicus
roots and fungal ERM harvested from D. carota roots. The mRNA was transcribed into cDNA using
a first strand cDNA synthesis kit (Thermo Fisher Scientific) with oligo (dT)-primers.
Generally 50—200 ng of DNAse-digested, total RNA was diluted with RNAse-free water to a final
volume of 11 µL and added to 1 µL of oligo dT18 primers. A master mix of 4 µL 5x Reaction Buffer,
1 µL RiboLock RNase inhibitor (20 U/µL), 2 µL 10 mM dNTP mix and 1 µL RevertAid M-MuLV RT
(200 U/µL) Reverse Transcriptase for each sample was prepared and 8 µL added to each sample.
The mixture was incubated at 42°C for 60 min and was stopped by an incubation step at 70°C for
5 min. Transcribed cDNA was diluted 1:10, stored at -20°C or used as a template for subsequent
RT-PCR reactions with gene specific primers.
RT-PCR was carried out with a Taq DNA polymerase for amplification of selected plant and fungal
genes (see appendix 7.1). The housekeeping genes UBIQUITIN (UBI) and ACTIN2 (ACT2) served as
RNA loading controls for L .japonicus and α-TUBULIN (α-TUB) for R. irregularis. Except for UBI,
primers were designed that span intron-exon borders to distinguish cDNA from residual genomic
DNA. The UBI gene from L. japonicus does not contain introns. Amplification was done by 25—30
PCR cycles and the products loaded onto agarose gels and stained with ethidium bromide. The
signal intensities of the PCR products from different samples were compared for an estimation of
gene expression, and dilution series were conducted to ensure that the product-to-signal ratio
was linear.
PCR Reaction-Mix (Taq)
0.5 µL DCS-Taq-polymerase (1 U µL-1)
1-3 µL cDNA
1 µL primer forward (10 pmol µL-1)
1 µL primer reverse (10 pmol µL-1)
2.5 µL 10x buffer

43
0.3 µL dNTPs (2.5 mM per nucleotide)
1.5 µL MgCl2 (25 mM)
Add ddH2O to a final volume of 25 µL.
For PCR conditions and oligonucleotide sequences, see appendix 7.1.
2.2.3.7.4 DNA Gel Electrophoresis
Samples for DNA gel electrophoresis were mixed 6x DNA loading dye to obtain a 1x
concentration and then loaded onto 1% (w/v) agarose gels. The DNA was seperated at 90 V for
20-30 min in 1x TBE running buffer and fluorescence of DNA was visualized with UV light
(λ=302 nm) caused by intercalation of the DNA with ethidium bromide. The size of PCR products
was compared to a DNA standard of known size (Gene Ruler 1 kb DNA ladder, Thermo Fisher
Scientific).
10x TBE Buffer
890 mM Tris-base
890 mM Boric acid
20 mM Na2-EDTA (pH 8.0)
pH 8.3
TBE Agarose Gel
1% (w/v) Agarose
0.01% (v/v) Ethidium bromide
(Ethidium bromide stock solution: 1 mg mL-1
ethidium bromide in ddH2O)
in 1x TBE buffer
6x DNA Loading Dye
10 mM Tris-HCl (pH 7.6)
0.03% (w/v) Bromophenol blue
0.03% (w/v) Xylene cyanol FF
60% /v/v) Glycerol
2.2.4 Heterologous Expression of Coding Sequences in Microorganisms and Plants
To study the function of enzymes from L. japonicus and R. irregularis, they were
heterologously expressed in either N. benthamiana (see 2.2.4.1.2), E. coli (2.2.4.2) or S. cerevisae
(see 2.2.4.3). Heterologous expression enables to study the products of enzyme-catalyzed
reactions in a foreign background, allowing a distinction between endogenous, redundant enzyme
products and those that are catalyzed by the studied enzyme. This was done either directly upon
heterologous expression with the living cells (feeding experiment) or after cell rupture and
extraction of the recombinant enzyme from E. coli.
For heterologous expression of the R. irregularis genes RiOLE1 and RiOLE1-LIKE, the
coding sequences were ligated into plant expression vectors (see appendix 7.5) and transferred
2.2.4.1 Procedures for working with A. tumefaciens

44
into A. tumefaciens (see 2.2.6.1.1), which were then used for transient transformation of N.
benthamiana by leaf infiltration (see 2.2.6.1.2).
2.2.4.1.1 Transformation of A. tumefaciens by Electroporation
Agrobacterium tumefaciens, strain GV3101 (pMP90) was grown at 28°C and 200 rpm in
selective YEP medium with rifampicin (80 µg mL-1). 100 mL cultures were grown ON until an OD600
of 0.5—0.7 and cooled for 15 min on ice. Bacteria were pelleted at 2500 g for 20 min at 4°C by
centrifugation. The pellet was resuspended in 200 mL sterile ddH2O and incubated on ice for 15
min. The centrifugation and the following wash step were repeated twice and the cells were
resuspended in 1 mL of sterile 10% (v/v) glycerol. 40 µL aliquots were shock frozen in liquid
nitrogen and then stored at -80°C.
YEP Medium
0.5% (w/v) Beef extract
0.1% (w/v) Yeast extract
0.5% (w/v) Peptone
0.5% (w/v) Sucrose
2 mM MgSO4
An aliquot of electrocompetent A. tumefaciens strain GV3101 (pMP90) was thawed on ice,
and 1—2 µL of a 100x dilution of purified plasmid DNA was added and the mixture incubated on
ice for 30 min. The cells were transferred to pre-cooled electroporation cuvettes and transformed
by application of an electric pulse of 12.5 kV/cm. 0.5—1 mL of pre-warmed 28°C YEP medium was
added to the cuvettes to dilute the cells, they were pipetted to Eppendorf tubes and incubated at
28°C for 4 h while rotating and subsequently plated on selective YEP-Agar with rifampicin (80 µg
mL-1) as genetic resistance marker for the A. tumefaciens GV3101 (pMP90) strain and the
appropriate selective antibiotic for the expression vector and incubated at 28°C for 2 days.
2.2.4.1.2 Leaf Infiltration for transient Transformation of N. benthamiana
Transient expression of coding sequences by infiltration of N. benthamiana leaves was
conducted according to Wood et al. (2009) with slight modifications. To this end, A. tumefaciens
GV3101 (pMP90) containing expression vectors p917UBQ3-RiOLE1 or pBin35S-RiOLE1-LIKE
were used. A. tumefaciens pre-cultures were inoculated from single colonies in 10 mL YEP medium
with rifampicin (80 µg mL-1) and kanamycin (50 µg mL-1) for pBin35S-RiOLE1-LIKE or rifampicin
(80 µg mL-1) and streptomycin (300 µg mL-1) + spectinomycin (100 µg mL-1) for
p917UBQ3-RiOLE1 and grown at 28°C while shaking at 180 rpm for 20 h. To induce virulence
genes, 100 mM acetosyringone dissolved in dimethyl sulfoxide (DMSO) was added and incubated
for another 2—3 h. Prior to transformation, plants were transferred to sufficient light and watered
to stimulate stomata opening. A. tumefaciens were harvested from the cultures by centrifugation

45
for 10 min at 4000 g and resuspended by adding 0.5 volumes of infiltration medium, pipetted with
a cut tip to avoid damge to the bacteria. For infiltration, A. tumefaciens strains containing different
constructs were mixed to a final OD600=0.2 for each construct. Each mixture contained two A.
tumefaciens strains, one expressing the P19 protein of tomato bushy stunt virus to suppress gene
silencing (Garabagi et al., 2012) and the expression construct for the gene of interest. The
construct pBin35S-AtWSD1 was used as positive control for expression of the dsRed fluorescence
marker. The mixture of A. tumefaciens strains was drawn up in a 2 mL syringe without a needle
and infiltrated into the bottom side of leaves (Sparkes et al., 2006). Comparable leaves on different
plants were used to ensure comparability of the results. Fluorescent marker gene expression was
detected after 4—11 days with a fluorescent lamp (NightSea, Bedford, USA). Leaf areas that
displayed a dsRed signal were used for lipid extraction (see 2.2.8.2).
Infiltration Medium
5 mM MgCl2
5 mM MES pH 5.7
100 mM Acetosyringone (dissolved in DMSO)
E. coli was used as heterologous expression system for truncated L. japonicus thioesterases
LjFatAΔtp, LjFatΔtp and LjFatMΔtp without N-terminal signal peptides and for multiplication of
cloning vectors and expression vectors for plant and yeast transformation.
2.2.4.2.1 Transformation of E. coli by Electroporation
For generation of electrocompetent E. coli ElectroSHOX or fadD cells, a 5 mL culture of
E coli was grown from a single colony overnight at 37°C and 200 rpm in LB medium without
antibiotics. The total culture volume was used for the inoculation of 250 mL LB medium that was
grown to an OD600 of 0.4, harvested by centrifugation (4000 g, 5 min, 4°C) and resuspended in 125
mL of ice cold 50 mM CaCl2 and incubated at 4°C for 20 min. The bacteria were pelleted and
resuspended in 20 ml of 50 mM CaCl2 and kept on ice for 4 h. Then, the suspension was mixed
with 7 mL of ice cold 50% (v/v) glycerol and 50 µL aliquots were shock-frozen in liquid nitrogen
and stored at -80°C. For transformation, an aliquot of cells was thawed on ice and mixed with
1— 2 µL of 100x diluted plasmid DNA or 5—10 µL of desalted ligation reaction (see 2.2.3.4) and
incubated for 5 min on ice. The transformation mix was transferred to pre-cooled electroporation
cuvettes and transformed by application of an electric pulse of 12.5 kV/cm. In the next step, 0.5—
1 mL of pre-warmed 37°C LB medium was added to the cuvettes to dilute the cells. Then, they
were pipetted to Eppendorf tubes and incubated at 37°C for 1 h while rotating and subsequently
2.2.4.2 Procedures for working with E. coli

46
plated on selective LB-Agar with the appropriate selective antibiotic for the expression vector and
incubated at 37°C ON.
LB Medium
1% (w/v) tryptone
0.5% (w/v) yeast extract
0.5% (w/v) NaCl
For LB-agar bacto agar was used at 1.5% (w/v).
S. cerevisiae was employed as heterologous expression system for R. irregularis RiOLE1
and RiOLE1-LIKE. Both WT yeast (BY4741) and the Δole1 mutant were used to this end. The Δole1
(Stukey et al., 1989) is deficient in the gene which encodes a STEAROYL-CoA Δ9 DESATURASE and
is fatty-acid auxotroph but can be grown by supplementation of oleic acid to the growth medium
(Ogasawara et al., 2017).
2.2.4.3.1 Generation of competent S. cerevisiae and Transformation
Chemically competent yeast cells were generated and transformed via heat-shock
according to Gietz et al. (1995) with modifications by Gabriel Schaaf and Dominique Loqué.
Competent cells were not stored but prepared fresh for transformation. For preparation, yeast
was cultivated on YPD plates. For generation of competent cells, 5 mL liquid YPD medium was
inoculated with single colonies for growth ON at 28°C on a rotary shaker. 200—400 µL of the ON
culture was added to 4 mL of fresh YPD medium and the cells grown until an OD600nm=0.8-1.0 was
reached (approximately 4—6 h). Cells were harvested at 1500g in 15 mL Falcon tubes, the
supernatant was discarded and the pellet resuspended in 500 µL TE/LiAc buffer at RT and
transferred to an 2 mL Eppendorf tube and centrifuged at 1700 g. The supernatant was discarded
and the pellet resuspended again in the same volume, centrifuged again and the step was repeated
one more time. Finally, the pellet was resuspended in 150—300 µL TE/LiAc buffer and placed on
ice. The mixture was sufficient for ~five transformations.
For heat-shock transformation, a mixture was set up in PCR tubes containing 3.5 µL
salmon sperm carrier DNA (8 mg mL-1) which was warmed up and denatured for 3 min at 95°C
prior to use. The tube was cooled on ice for 2 min. Then, 0.5-4 µL of purified plasmid DNA (200—
500 ng DNA) and 50 µL of chemical competent cells were added. Next, 300 µL of PEG/LiAc buffer
was added and incubated at 30-40 min at RT while shaking at 500 rpm. The mixture was heat-
shocked at 42°C for 20 min, 800 µL sterile ddH2O added and cells gently resuspended. The mixture
was centrifuged at 1700 g for 1 min and the pellet recovered in 60 µL sterile ddH2O and plated on
selective media (see 2.2.4.3.2).
2.2.4.3 Procedures for working with S. cerevisiae

47
YPD Medium
1% (w/v) Yeast extract
2% (w/v) Bacto-peptone 2% (w/v) Glucose Solidified medium contained 2% (w/v) bacto agar.
TE/LiAc Buffer
5 mL 10x TE (100 mM Tris-HCL, 10 mM EDTA,
pH=7.5)
5 mL 1 M LiAc
Add 40 mL ddH2O to final volume of 50 mL.
PEG 4000 [50% (w/v)]
4 g PEG
Add ddH2O to 7 mL. Dissolve by heating,
autoclave, add ddH2O to final volume of 8
mL.
Salmon Sperm Carrier DNA
400 mg Salmon Sperm DNA (Sigma #D6898)
Add TE/LiAc buffer to a final volume of 50 mL.
Incubate at 4°C for 24-48 h while rotating. Aliquot
(2 mL) and stor at -20°C.
PEG/LiAc buffer
10 mL 1 M LiAc
10 mL 10x TE (100 mM Tris-HCl, 10 mM
EDTA, pH=7.5)
Add to 80 mL 50% (w/v) PEG 4000
solution.
2.2.4.3.2 Selection of recombinant S. cerevisiae
For selection of successfully transformed yeast cells, transformation mixtures were plated
on Selective Yeast medium (-uracil). Recombinant plasmids for yeast transformation encode
URA3 (orotidine 5'-phosphate decarboxylase), allowing only recombinant yeast to grow on medium
lacking uracil. The whole transformation mix was plated out and grown for at least 2 d at 28°C
until the development of colonies was visible. For liquid cultures, single colonies were used.
Glucose (20% (w/v))
20 g Glucose Add sterile ddH2O to a final volume of 100 mL.
Filter sterilize.
Dropout powder
2.5 g Adenine (hemisulfate) 1.2 g L-arginine 6 g L-aspartate 6 g L-glutamate (sodium-salt) 1.8 g L-lysine (HCl) 1.2 g L-methionine 3 g L-phenylalanine 22.5 g L-serine 12 g L-threonine 1.8 g L-tyrosine 9 g L-valine (fine ground powder)

48
Histidine, leucine, tryptophan stock
Prepare three seperate solutions. 0.755 g Histidine per 50 mL ddH2O (100 mM). 0.658 g Leucine per 50 mL ddH2O (100 mM). 1.021 g Tryptophana per 50 mL ddH2O (40 mM). Filter sterilize. aFor solubilization, traces of NaOH (5M) were added.
Selective yeast medium (-Uracil) (1L)
1.16 g dropout powder
2 g bacto agara
6.7 g Yeast Nitrogen Base (with ammonium sulfate, without amino acids). Adjust volume to 780 mL with ddH2O,
adjust pH to 5.9 with NaOH and
autoclave. Cool to 55°C.
Add 100 mL glucose (20% (w/v)).
Add 8 mL of each histidine, leucine and
trypotphan stock. aFor liquid cultures, bacto agar was
omitted.
2.2.4.3.3 Growth Parameters and feeding of Fatty Acids to S. cerevisiae
Singe colonies of WT and Δole1 expressing RiOLE1 and RiOLE1-LIKE were used to
inoculate ON cultures in 5 mL Selective Yeast medium (-uracil) with and without 1% (v/v)
Tritonx-100 and 1 mM oleic acid. For dilution series, the OD660 was determined in 1:10 dilutions
and the culture diluted to an OD660=0.2 in 1 mL ddH2O and two more dilutions (1:10 and 1:100)
were made. Five µL of every dilution was spotted on solid Selective Yeast medium (-uracil) with
and without 1% (v/v) Tritonx-100 and 1 mM oleic acid and incubated for 6 days at 28°C.
For extraction of lipids and fatty acid feeding of yeast cultures, ON cultures from single
colonies were diluted to an OD660=0.02 in 5 mL liquid selective yeast medium (-uracil) containing
1% (v/v) Tritonx-100 and 1 mM fatty acid. This was done to complement the Δole1 mutant or to
label the products of fatty acid desaturation in the yeast cultures. As fatty acids, oleic acid (18:1Δ9)
or pentadecanoic acid (15:0) were added. As an additional control, fatty acids were omitted from
the medium. To increase solubility of the fatty acids in the aqueous medium, a concentrated
solution of fatty acids was heated to 60°C in 50% (v/v) Tritonx-100, and added to the pre-heated
medium and shaken ON at RT until no clumps were visible and the solution was homogenous.
When Tritonx-100 and oleic acid were added, the solution remained cloudy.
2.2.5 General Procedures for working with Protein
Investigation of the total protein composition from E. coli heterologously expressing His-
tagged L. japonicus acyl-ACP thioesterases was done by SDS-PAGE (see 2.2.5.1). For detection of
his-tagged protein, the proteins were blotted and immunodetected using chemiluminescence (see
2.2.5.2).

49
Sodium dodecyl phosphate-polyacrylamide gel electrophoresis (SDS-PAGE) was
employed to seperate proteins according to their electrophoretic mobility after denaturation
(Laemmli, 1970). SDS is a detergent which binds to polypeptides and masks their charges, which
results in an overall negative charge, allowing a separation according to approximate protein size
by migration through the polyacrylamide pores. The separating acrylamide gel was prepared by
mixing all components, but ammonium persulfate (APS) and tetramethylethylenediamine
(TEMED), which were added at last to induce polymerization. After this, the stacking gel was
immediately poured between a glass plate and an alumina plate in a gel caster. To ensure an even
edge of the gel, it was covered with isopropanol (1 mL per gel). After 30 min polymerization,
isopropanol was removed and the stacking gel was poured on top. Immediately prior to pouring
the stacking gel, polymerization was initiated by addition of TEMED and APS. After the stacking
gel was poured, combs were inserted. After another 30 min, the gels were ready for use and stored
at 4°C until use.
For loading, protein samples were mixed with one-third volume of 4x sample loading
buffer and incubated for 5 min at 95°C to denature all proteins. Per gel slot, 10-30 µL protein
solution was loaded along with the Color Pre-stained Protein Standard, Broard Range (NEB) as a
reference for protein size. Electrophoresis was conducted initially at 25 mA and 200 V per 64cm2
gel until the running front approached the separating gel. Then the current was increased to 35
mA until the electrophoresis was stopped.
5x Loading Buffer
500 mM Tris 10% (w/v) SDS 50% (w/v) Glycerol 0.025% (w/v) Bromophenol Blue 5 mM EDTA adjust pH to 6.9 with HCl Stored as aliquots (400 µL) at -20°C.
4x Loading Buffer
50 µL ddH2O
50 µL ß-mercaptoethanol
400 µL 5x Stock Loading Buffer
Separating Gel (10%)
6.25 mL 40% Acrylamide/Bis-acrylamide stock
(29:1 v/v)
6.25 mL 1.5 M Tris-HCl, pH=8.8
250 µL 10% (w/v) SDS
12.1 mL ddH2O
Mix until dissolved.
10 µL TEMED
150 µL 10% (w/v) APS
TEMED and APS were added only immediately
prior to pouring of the gel
Stacking Gel (4%)
1 mL 40% Acrylamide/Bis-acrylamide
stock (29:1 v/v)
2.5 mL 1.5 M Tris-HCl, pH=8.8
100 µL 10% (w/v) SDS
6.3 mL ddH2O
Mix until dissolved.
5 µL TEMED
100 µL 10% (w/v) APS
TEMED and APS were added only
immediately prior to pouring of the gel.
2.2.5.1 SDS-PAGE and Coomassie Staining

50
Tank Buffer
125 mM Tris
960 mM Glycine
0.5% (w/v) SDS
Seperated proteins were stained in the SDS-PAGE gel using coomassie R-250 (Diezel et al.,
1972). The stacking gel was removed and the separating gel placed in a glass Weck jar and covered
with coomassie staining solution and heated in the microwave oven until the solution started to
boil. The gel was shaken on a rotary platform at RT for 5 min, rinsed with ddH2O and destained
with destaining solution, and heated until the solution started to boil and subsequently shaken at
RT for 5—15 min. The procedure was repeated until the gel was destained sufficiently for
individual protein bands to appear.
Staining Solution
50% (v/v) Ethanol
7% (v/v) Acetic Acid
0.252% (w/V) Coomassie R-250
Destaining Solution
5% (v/v) Glycerol
7.5% (v/v) Acetic Acid
To detect heterologously expressed His-tagged Fat proteins in E. coli, immunodetection
with His-Detector Nickel-HRP immunodetection was performed. Prior to this, total proteins were
transferred from the SDS-PAGE gel to a nitrocellulose membrane by semi-dry blotting. A blotting
sandwich was assembled by stacking three blotting papers, one nitrocellulose membrane (both
cut to the size of the protein gel), the protein gel and three more blotting paper. Everything was
soaked for 5 min in Towbin transfer buffer (Towbin et al., 1979) prior to assembly of the
sandwich. The sandwich was placed on the anode of the semi-dry transfer cell and the kathode
was placed on top. Total proteins were transferred to the nitrocellulose membrane by blotting at
15 V and 70 mA per 64 cm2 gel for 60 min.
Towbin Transfer Buffer
25 mM Tris
192 mM Glycine
20% (v/v) Methanol
0.1% (w/v) SDS
The blotted membrane was incubated in blocking solution ON at 4°C with gentle shaking,
to block remaining protein binding sites. For binding of His-tagged proteins, the HisDetector
Nickel-HRP conjugate was diluted 1:20000 in blocking solution and the blocked membrane
incubated with gentle shaking for 1 h at RT. Subsequently, the membrane was washed for total
2.2.5.2 Western Blot and Immunodetection

51
20 min at RT with gentle shaking in TBST buffer with refreshing the buffer seven times to remove
excess milk protein and His-detector Nickel-HRP conjugate. Histidine residues in the His-Tags of
protein are bound by nickel, and the conjugated horseradish peroxidase (HRP) was used to detect
proteins using the SuperSignal West Pico Chemiluminescence (Thermo Fisher Scientific)
substrate according to the supplier’s instructions. HRP oxidizes luminol in the presence of
peroxide, which produces a chemiluminescence that was captured onx-ray film.
TBST buffer
20 mM Tris, pH to 8.0 with HCl
0.05% (v/v) Tween 20
150 mM NaCl
Blocking Solution
5% (w/v) skimmed-milk powder in TBST
buffer
For quantification of total protein in crude soluble protein extract or purified recombinant
protein (see 2.2.7.1 and 2.2.7.2), the Quick StartTM Bradford Protein Assay (Bio-Rad) was used.
The method uses colorimetric protein determination with Coomassie Blue G-250 (Bradford,
1976). Under acidic conditions, Coomassie G-250 binds to the protein, which results in the
occurrence of blue color. The absorbance shift is detected photometrically at OD595nm. For the
assay, 100 µL of sample (either crude protein, purified protein fraction from Ni-NTA column or
BSA standard) were mixed with 900 µL of Bradford color reagent, incubated for 5 min at RT and
the OD recorded. For blank measurements, either protein extraction buffer or dialysis buffer (see
2.2.7.1 and 2.2.7.2) were used. A calibration curve with 0, 0.75, 2.25, 3, 4.5, 22.5 and 45 µg mL-1
BSA Fraction V in the respective buffer was set up for quantification.
2.2.6 Synthesis of Acyl-ACP Substrates Acyl-ACPs are constituents of the multisubunit enzyme complex of fatty acid synthase
(FAS). Acyl carrier proteins (ACP) carry fatty acids during de novo synthesis. A conserved serine
residue of the ACPs is post-translationally modified by the addition of a 4'-phosphopantetheine
prosthetic group onto the serine. The terminal thiol group of 4'-phosphopantetheine is linked via
a thioester bond to the fatty acid (Campopiano, 2014). Acyl-ACPs can be synthesized chemically
by imidazole-catalyzed S-acylation with N-acylimidazole (Cronan and Klages, 1981) or
enzymatically (Lauciello et al., 2016; Rock and Garwin, 1979). Here, recombinant acyl-ACP
synthetase (Aas) from E. coli was used (see 2.2.6.1) together with E. coli ACP (see 2.2.6.2) to
enzymatically synthesize acyl-ACPs (see 2.2.6.3).
2.2.5.3 Determination of Protein Concentration

52
The inner membrane acyl-ACP synthase (Aas) was purified from recombinant E. coli cell
line C41(DE3) containing the E. coli Aas open reading frame fused to an N-terminal His-tag in
pET28 plasmid (pAasH) (Shanklin, 2000). To this end, a total volume of 18 L E. coli C41 AasH
pET28a cells were cultured in LB medium with kanamycin (50 µg mL-1) in several 2 L Erlenmeyer
flasks each containing 500 mL medium. The cells were harvested by centrifugation and combined
in falcon tubes (50 mL) and stored at -80°C until extraction of Aas. The extraction and subsequent
column purification and dialysis were done at 4°C, and equipment, centrifuges and solutions were
pre-cooled to 4°C. The bacterial pellet of 18 L culture was thawed on ice, weighed (~50 g),
resuspended in 75 mL of 1x extraction buffer and flakes (several mg) DNAseI (AppliChem) were
added. To disrupt cells, 1.5 mL of resuspended pellet was pipetted to 2 mL Eppendorf tubes
containing approximately 200 µL volume of glass beads (≤106 µm diameter) and homogenized on
a Precellys homogenizer for 1 min at 6000 rpm. The supernatants (~1 mL per tube) were
combined in centrifuge tubes (Centrifuge Sorvall RC 5C PLUS) and the volume adjusted to 200 mL
with 1x extraction buffer. The solution was centrifuged at 18000 rpm for 10 min and the
supernatant (~140 mL) was transferred to centrifuge tubes (4 mL per tube) for ultra
centrifugation at 49 000 rpm for 90 min (Optima L-90K, swing-out rotor SW 28). The supernatant
was discarded and the pellet, containing the membrane fraction, resuspended in 250 µL 1x
extraction buffer via ultrasonification and pipetting up and down. As the swing-out rotor could
only hold 6 ultra centrifuge tubes at once, this process was repeated 5 more times, the
resuspended pellets from ultracentrifugation were combined and the volume adjusted to 10 mL.
Next, 100 mL 2x extraction buffer was added and ddH2O to 200 mL and the solution stirred for 10
min, transferred to Sorval centrifuge tubes and centrifuged for 10 min at 18 000 rpm and the
supernatant, containing the membrane fraction (~180 mL) taken for subsequent Ni2+ affinity
chromatography.
For binding of His-tagged Aas to nickel, 33 mL of Ni-NTA Agarose (Qiagen; supplied in
ethanol) were transferred to a 50 mL Falcon tube. The Ni-NTA Agarose-Ethanol mix was
centrifuged at 4000 rpm, the supernatant (ethanol) discarded and the Ni-NTA pellet resuspended
in 16.5 mL extraction buffer. This step was repeated two times to equilibrate the Ni-NTA matrix
with the resuspension buffer. To the final 33 mL, 17 mL of the E. coli C41 AasH pET28a membrane
fraction from the previous step was added and the tube gently shaken on a rotary platform for 30
min to ensure homogenous binding of nickel to the histidine-tagged Aas protein. The mixture (50
mL) was applied to a protein chromatography column, allowed to settle and the solution passed
through the Nickel-NTA Agarose matrix with a flow rate of 1-2 mL min-1. Subsequently, the
remaining E. coli C41 AasH pET28a membrane fraction (~160 mL) was added and allowed to pass
through the column matrix. The column was washed with 100 mL 1x extraction buffer and then
2.2.6.1 Purification of Acyl-ACP Synthase

53
100 mL 1x extraction buffer with 25 mM imidazole. For elution of bound Aas protein, 100 mL 1x
extraction buffer with 100 mM EDTA was used and 6 elution fractions collected (15 mL each).
EDTA is a chelator that also removed nickel from the matrix. An aliquot of each elution fraction
was taken for SDS-PAGE (see 2.2.5.1) to check for purity of the Aas preparation.
Elution fractions containing the 80.6-kDa Aas protein were combined, pipetted into a
dialysis membrane with a cutoff of 6000-8000 Da (Spectrum® Laboratories) and dialyzed against
100 volumes of 1x extraction buffer for 4 h with gentle shaking. The dialysis buffer was replaced
after 4h and dialysis was continued for another 4h. This step allows EDTA and nickel to pass
through the dialysis membrane thereby removing them from the protein preparation. It was
necessary to restrict dialysis to 2x 4 h as otherwise, increasing amounts of Aas precipitate from
the solution and would be lost. Dialyzed elution fractions were centrifuged at 18000 rpm for 5
min. The clear supernatant (~40 mL) was transferred to a fresh tube and ATP added from the
stock to a final concentration of 5 mM (~2 mL). Glycerol was added from a 70% (v/v) stock to
obtain 10% (v/v) final concentration. Addition of ATP stabilizes Aas upon freezing and is also
necessary for the subsequent acyl-ACP synthesis reaction (see 2.2.6.3). For determination of
protein concentration, an aliquot was quantified with the Bradford Protein Assay (Bio-Rad) (see
2.2.5.3) and Aas protein preparations were stored as 1 mL aliquots (88 µg mL-1) under N2
atmosphere at -80°C.
1x Extraction Buffer
50 mM Tris 20 mM MgCl2 2% (v/v) Tritonx-100 Adjust pH to 8.0 with HCl.
2x Extraction Buffer
100 mM Tris 40 mM MgCl2 4% (v/v) Tritionx-100 Adjust pH to 8.0 with HCl.
ATP Stock
0.1 M ATP in 50 mM Tris-HCl
Adjust pH to 7.0 with HCl.
ACP from E. coli was extracted from electroSHOX cells (Bioline) via anion-exchange
chromatography using diethylaminoethyl (DEAE)-cellulose (Majerus et al., 1965). Bacterial
pellets were harvested consecutively from 500 mL LB cultures grown in 2 L Erlenmeyer flasks
and stored at -80°C. The bacterial pellets (3 times 50 mL falcon tubes =~150 g) were thawed on
ice and resuspended in one-tenth volume (~15 mL) extraction buffer at RT. The resuspended cell
pellet was homogenized by pipetting 1 mL to 2 mL Eppendorf tubes containing approximately
200 µL volume glass beads (≤106 µm diameter) and homogenized on a Precellys homogenizer for
2.2.6.2 Purification of ACP from E. coli

54
1 min at 6000 rpm. The supernatants were combined and a few drops of lysozyme added and the
solution stirred for 2h at RT. The resulting cell paste became very viscous. One volume (~165 mL)
of 0.5% (v/v) Tritonx-100 was added and the solution stirred for 1 h at RT. For further
homogenization, again 1 mL of the viscous cell paste was pipetted with blue Eppendorf pipette
tips, which were cut at the top, to 2 mL Eppendorf tubes containing approximately 200 µL volume
glass beads (≤106 µm diameter) and homogenized on a Precellys homogenizer for 1 min at 6000
rpm. From here on, extraction and purification of ACP was done at 4°C, equipment, centrifuges
and solutions were pre-cooled to 4°C, except otherwise stated. To precipitate DNA and most
protein, but not ACP, one volume (~330 mL) of isopropanol was added slowly over the course of
30 min (one-thirtieth volume added every 2 min) while gently stirring the solution and then
stirred further for 1 h. The mixture was centrifuged for 30 min at 5000 rpm (Sorvall, GS-3 rotor),
the supernatant brought to pH 6.1 with acetic acid and incubated with 20 g (70 g/400 g E. coli
pellet) equilibrated DEAE-cellulose (see below) ON while stirring. At pH 6.1, only ACP and a few
other proteins bind to the DEAE-cellulose.
The mixture was applied via a clean glass funnel and a clean spoon to a round filter paper
(Ø150 mm, Schleicher & Schüll, Ref. 10334512) that was placed in a Büchner funnel (800 mL
volume, 125 mm ID, Hartenstein Laborbedarf) placed on a glass bottle, sealed with a rubber seal
(GUKO, Hartenstein Laborbedarf) and sucked through the filter paper by vacuum applied via a
water jet pump. The remaining slurry was washed with approximately five volumes of the wet
cellulose (~100 mL) of PIPES wash buffer 1 and the same volume PIPES wash buffer 2. The
washed cellulose-slurry with bound ACP was taken from the filter paper with a clean spoon and
poured into a glass chromatography-column with frit for subsequent anion-exchange column
purification. The column matrix was allowed to settle after addition of a small volume of PIPES
wash buffer 2, with a flow rate of 2–3 mL.min-1. For elution, ~150 mL of PIPES elution buffer were
added and fractions collected. The fractions that had an amber, brownish color, derived from a
protein co-eluting with ACP, were pooled (~75 mL) and one-tenth volume (~7.5 mL) of 50% (v/v)
TCA was added so that the final concentration of TCA was 5% (v/v), which precipitates ACP. The
solution was incubated ON and centrifuged at 8000 g for 20 min, and the ACP pellet resuspended
in a minimal volume (3 mL) of resuspension buffer. The pH was adjusted to ~7.0–7.5 by adding
small amounts of 1M Tris base. For precipitation of contaminating proteins (but not ACP), four
volumes of saturated ammonium sulfate (pH~6.8—7.5) were added and the solution incubated
for 1 h at RT and centrifuged at 8000 g for 20 min. To the ACP-containing supernatant, one-tenth
volume of 50% (v/v) TCA was added and ACP precipitated for 1—2 h. The ACP pellet was
harvested by centrifugation at 8000 g for 20 min and resuspended in minimal volume (~0.5 mL)
of 1M Tris and the pH adjusted to 7—7.5 with Tris base. The resuspended ACP was centrifuged
for 20 min at 1000 g and the ACP-containing supernatant transferred to a fresh tube. An aliquot

55
of ACP was used for protein quantification with the Bradford Protein Assay (Bio-Rad) (see 2.2.5.3),
and frozen as 0.5 mL aliquots diluted to 0.75 mg mL-1.
Extraction Buffer
1M Tris, pH=8.0 with HCl 0.1 M Glycine 0.25 M EDTA-Na2
Equilibrated DEAE-cellulose
20 g DEAE-cellulose (pre-swollen)
Mix with PIPES binding buffer, centrifuge,
discard supernatant, use equilibrated
cellulose for chromatography
PIPES Binding Buffer
10 mM PIPES
Adjust to pH 6.1 with acetic acid.
PIPES Wash Buffer 1
10 mM PIPES
0.2 M LiCl
0.1% (v/v) Tritonx-100 Adjust to pH 6.1 with acetic acid.
PIPES Wash Buffer 2
10 mM PIPES
0.2 M LiCl
Adjust to pH 6.1 with acetic acid.
PIPES Elution Nuffer
10 mM PIPES
0.6 M LiCl
Adjust pH=6.1 with acetic acid.
50% (v/v) TCA
5 mL 50% (v/v) TCA
5 mL ddH2O
100% (v/v) TCA (Sambrook and
Russell, 2001)
5 g TCA
2.27 mL ddH2O. The density of the
solution is approximately 1.45 mg.mL-1.
Resuspension Buffer
0.1 M Tris
10 mM DTT
ACP was acylated enzymatically with recombinant E. coli Aas (see 2.2.6.1) according to
Salas and Ohlrogge (2002). Test reactions contained 100 µL total volume. To investigate acylation
over-time, a time-course series was pipetted, as well as a series of reactions with increasing ACP
and fatty acid concentrations, to identify optimal conditions for acylation. For large-scale acylation
prior to purification, 1000 µL reactions were set up and incubated ON at 37°C. Aliquots of all
acylation reactions were applied to urea PAGE (see 2.2.6.4) to investigate the reaction products
and the efficiency of the acylation reaction. For synthesis of radioactive acyl-ACPs, [1-14C]fatty
acids were used in 400 µL acylation reactions for 4 h at 37°C.
2.2.6.3 Acyl-ACP Synthesis and Ion-Exchange Purification

56
Test Acylation of ACP (100 µL)
10 µL 10x TML buffer 5 µL 0.1 M ATP (pH 7.0)a 1 µL 0.4 M DTT 10—40 µL E. coli ACP (0.75 mg mL-1) 10 µL 10 mM Fatty Acid in 10% (v/v) Triton X- 100b Adjust volume to 100 µL with purified E. coli Aas (88 µg mL-1) (see 2.2.6.1). aPrepared fresh and stored as aliquots at -20°C b18:0 and 20:0 fatty acid needed to be heated to 80°C prior to pipetting
Acylation of ACP (1000 µL)
100 µL 10x TML buffer 50 µL 0.1 M ATP (pH 7.0)a 10 µL 0.4 M DTT 400 µL E. coli ACP (0.75 mg mL-1) 30 µL 10 mM Fatty Acid in 10% (v/v) Tritonx-100b
Adjust volume to 1000 µL with purified E. coli Aas (88 µg.mL-1) (see 2.2.6.1) aPrepared fresh and stored as aliquots at -20°C b18:0 and 20:0 fatty acid needed to be heated to 80°C prior to pipetting
Acylation of ACP with [1-14C]Fatty Acids
(400 µL)
40 µL 10x TML buffer 20 µL 0.1 M ATP (pH=7.0)a 8 µL 0.2 M DTT 120 µL E. coli ACP (0.75 mg mL-1) 10.81 µL [1-14C]Fatty Acid (250 µCi in 2.5 mL ethanol)b
Adjust volume to 400 µL with purified E. coli Aas (see 2.2.6.1). aPrepared fresh and stored as aliquots at -20°C bPipetted as first component from stock in EtOH, evaporated and added 10.81 µL 10% (v/v) Tritonx-100.
10x TML Buffer
1 M Tris-HCl, pH 8.0
40 mM LiCl
100 mM MgCl2
The acyl-ACP products were purified by ion-exchange chromatography using
DEAE-cellulose (Rock and Garwin, 1979). Per 1000 µL acylation reaction, 300 mg pre-swollen
DEAE-cellulose (1000 mg per 1000 µg ACP) were mixed with 5 mL MES-KOH binding buffer in a
15 mL falcon tube, centrifuged at 1500 rpm for 5 min and the supernatant discarded to remove
particles that later might clog the column. The equilibrated DEAE-cellulose was mixed with the
acylation reaction and 7 mL MES-KOH binding buffer were added. The mixture incubated while
shaking for 1 h at RT to ensure binding of acyl-ACPs. At pH 6.1, only acyl-ACPs bind, while
remaining fatty acids and E. coli Aas do not. The mixture was applied to a PolyPrep®
chromatography column (Bio-Rad), allowed to settle and the liquid (MES-KOH binding buffer with
unbound molecules) allowed to flow-through. Next, the column was washed with 8 mL MES-KOH
wash buffer and again with 8 mL MES-KOH binding buffer. For elution, 10 mL MES-KOH elution
buffer were used and fractions of 0.5–1 mL collected. Aliquots of all wash steps and elution
fractions were applied to urea PAGE (see 2.2.8.4) and those elution fractions containing the eluted
acyl-ACPs were combined and dialyzed for 2 h against 100 volumes MES-KOH binding buffer using
a dialysis membrane (see 2.2.6.1) to remove the LiCl from the acyl-ACP fraction that otherwise
would interfere with subsequent thioesterase assays. Dialysis led to an increase of the volumes of

57
the acyl-ACP elution fractions by approximately five volumes. Non-radioactive acyl-ACP elution
fractions were concentrated with the SpeedVac® Vacuum Concentrator without heating. To
concentrate [14C]acyl-ACPs, they were incubated in a water bath at 40°C for 6 h to reduce volumes
to ~1.5–2 mL. Care was taken not to completely dry the acyl-ACPs and a minimal volume was left
in the tubes. For the non-radioactive, purified, dialyzed acyl-ACPs, aliquots were used for protein
determination with the Bradford Protein Assay (Bio-Rad) (see 2.2.5.3), urea PAGE (see 2.2.6.4)
and they were divided into 200 µL aliquots, overlaid with N2 gas and stored at -20°C. Radioactivity
of [1-14C]-labeled acyl-ACPs was determined with liquid scintillation counting (see 2.2.7.4) and
100 µL aliquots (~300 dpm µL-1) frozen at -20°C.
MES-KOH Binding Buffer
10 mM MES Adjust pH to 6.1 with KOH
MES-KOH Wash Buffer
1 volume 10 mM MES-KOH binding buffer 4 volumes isopropanol
MES-KOH Elution Buffer
0.5 M LiCl prepared in MES-KOH binding buffer
The purity and identity of acyl-ACPs was investigated with polyacrylamide gel
electrophoresis (PAGE) using urea as denaturing agent (Post-Beittenmiller et al., 1992). The
stacking and separating gels were prepared similar to the SDS-PAGE gels (see 2.2.5.1) but with
urea (5M) instead of SDS and with a 20% acrylamide separating gel. Similar to SDS-PAGE, the
samples were diluted with 4x sample buffer containing urea (5M) instead of SDS and incubated at
95°C for 5 min prior to loading of 10-30 µL on the gel, which were developed at 25—35 mA and
200 V per 8 cm2 gel.
2.2.7 L. japonicus Acyl-ACP Thioesterase Activity and Enzyme Assay Enzyme activity of acyl-ACP thioesterases was examined using either recombinant,
purified thioesterases or crude total protein after induction of thioesterases in E. coli cultures. The
latter was done with L. japonicus FatB and the former with Lotus FatA and FatM.
Proteins were heterologously expressed to purify recombinant thioesterases from E. coli
electroSHOX and to test for thioesterase activity in the E. coli fadD 88 mutant (Overath et al., 1969).
Glycostocks of recombinant E. coli expressing acyl-ACP thioestereases in the pQE-80L vector were
streaked out on selective LB media with agar containing carbenicillin (100 µg mL-1), grown ON at
37°C and single colonies used for inoculation of 5 mL selective medium, grown at 37°C ON at 180
2.2.6.4 Urea PAGE
2.2.7.1 Heterologous Expression of L. japonicus Thioesterases in E. coli

58
rpm and used for inoculation of a main culture of 50—200 mL at a starting OD600=0.1 and
incubated until OD600=0.5. IPTG was added at a concentration of 1 mM; IPTG binds and releases
inhibition by the lac repressor, thereby achieving induction of the lac operon and transcription of
the recombinant Fat mRNA. After induction, the cells were transferred to 16°C to optimize
expression and folding of recombinant protein. Growth curves for E. coli fadD 88 were recorded
by monitoring the OD600 at regular intervals, and 5 mL of the culture was used 16 h after induction
for extraction of free fatty acids by solid-phase extraction (see 2.2.8.3 and 2.2.8.5) and
quantification by GC-FID (see 2.2.8.9). E. coli fadD 88 lacks acyl-CoA synthetase activity. Therefore,
free fatty acids that are hydrolyzed by recombinantly expressed thioesterases cannot be
incorporated into lipids via acyl-CoA. Instead they accumulate and cause growth retardation
(Dörmann et al., 1995;xu et al., 2013).
The cells of induced E. coli ElectroSHOX cultures grown ON at 16°C were harvested by
centrifugation and the cell pellet suspended in lysis buffer either directly or after storage at -20°C.
All equipment and buffers subsequently used were pre-cooled and the work was done at 4°C. Per
0.35 g pellet FW (obtained from a 50 mL culture), 2.25 mL lysis buffer was used. The resuspended
cells were divided into 2 mL Eppendorf tubes (750 µL each) filled with ~200 µL glass beads (≤106
µm diameter) and mechanically homogenized using the Precellys homogenizer three times at
6500 rpm for 20 seconds. In between, the samples were cooled on ice. The lysed cells were
centrifuged at 13500 rpm for 30 min at 4°C to pellet cell debris and insoluble, membrane-bound
protein and the supernatant, containing soluble protein, combined in a 15 mL Falcon tube. The
total soluble protein was mixed with 1 mL equilibrated Ni-NTA Agarose/lysis buffer 50:50 (v/v).
The Ni-NTA Agarose is supplied and stored in 50:50 (v/v) ethanol. For equilibration, the
agarose-ethanol was mixed, 1 mL taken out and centrifuged, the supernatant (~0.5 mL ethanol)
discarded and 0.5 mL lysis buffer added, resuspended, and the equilibration repeated two more
times.
The Ni-NTA Agarose-protein mix was incubated on a rotary platform for 1 h to ensure
efficient binding of the immobilized Ni2+ to the histidine tag of recombinant thioesterases. The
mixture was poured into a PolyPrep® chromatography column (Bio-Rad), capped and the particles
were allowed to settle to the bottom of the column. All column eluates were collected at a flow-rate
of 1 mL min-1. Aliquots of all fractions were collected for subsequent SDS-PAGE analysis. After the
flow-through, which contained unspecifically bound protein and excessive His-tagged
recombinant proteins, was allowed to pass through the matrix, two times 5 mL wash buffer were
added to the column. To ensure efficient washing, the matrix was resuspended each time by gently
pipetting up and down and was allowed to settle again prior to opening of the tubing for collection
of the liquid. For elution, 5 mL elution buffer was added, the matrix suspended, allowed to settle
2.2.7.2 Recombinant Protein Purification of Plant Acyl-ACP Thioesterases from E. coli

59
and nine 0.5 mL fractions were collected in 2 mL Eppendorf tubes. This was done to minimize the
volume of the fractions of the recombinant protein, to ensure high protein concentration.
After analysis of all fractions by SDS-PAGE (see 2.2.5.1), elution fractions containing the
thioesterases FatM or FatA were combined and dialyzed to remove imidazole. The combined
fractions were pipetted into a dialysis membrane tubing with a cutoff of 6000—8000 Da
(Spectrum® Laboratories) and dialyzed against 100 volumes of Tris-HCl (50 mM, pH 8.0) for 2 h
with gentle shaking. The dialysis buffer was replaced after 4h and dialysis was continued for 4h.
The dialyzed elution fractions were diluted with 80% (v/v) glycerol to a final concentration of
10% (v/v) glycerol and stored as aliquots of 125 µL at –80°C. Protein concentration was
determined with the Bradford Protein Assay (see 2.2.5.3).
Lysis Buffer
50 mM NaH2PO4
300 mM NaCl 10 mM Imidazole Adjust pH to 8.0 with NaOH.
Wash Buffer
50 mM NaH2PO4
300 mM NaCl 20 mM Imidazole Adjust pH to 8.0 with NaOH.
Elution Buffer
50 mM NaH2PO4
300 mM NaCl 20 mM Imidazole Adjust pH to 8.0 with NaOH.
Acyl-ACP thioesterase activity was determined according to Ecclestone and Ohlrogge
(1998). The assays were conducted with 5000 dpm (40.95 pmol) [1-14C]acyl-ACPs as substrates,
which was approximately 15-25 µL per [1-14C]acyl-ACP preparation (see 2.2.6.3). For LjFatM, 2.2
ng recombinant enzyme was used in the assay and 5.7 ng for LjFatA. For LjFatB, the soluble protein
fraction after LjFatB induction contained 200 ng total protein. The assay was started with the
addition of the purified enzyme or the soluble protein fraction, respectively, and incubated at RT
until ~40% of the initial substrate (5000 dpm) was hydrolyzed. For LjFatM, the assay was
incubated for 30 min and for LjFatA 5 min. The reaction was terminated by addition of 50 µL 1 M
acetic acid containing 1 mM non-labeled oleic acid as carrier fatty acid. The hydrolyzed free fatty
acids were extracted three times with 300 µL hexane each, and the hexane supernatants collected
in scintillation vials. The solvent was evaporated at 40°C in a water bath and the vials used for
liquid scintillation counting of the remaining free fatty acids (see 2.2.7.4.).
2.2.7.3 Enzyme Assay with recombinant L. japonicus Acyl-ACP Thioesterases

60
Acyl-ACP Thioesterase Assay
5000 dpm [1-14C]Acyl-ACP 1 µL 1 M Tricine-KOH, pH 8.5 2.5 µL 10 mM DTT 2-5 ng recombinant Fat enzyme (~20 µL) Add ddH2O to 50 µL.
For determination of radioactivity by liquid scintillation counting, 20 mL of Ultima Gold
Liquid Scintillation cocktail (PerkinElmer) were added to the scintillation vials after evaporation
of hexane. Hexane was evaporated to ensure uniform distribution of the [1-14C]fatty acids in the
scintillation cocktail. After addition of the scintillation cocktail, the vials were shaken vigorously
and incubated for 24 h prior to counting, to ensure that all air bubbles were evolved.
In liquid scintillation counting, the kinetic energy of nuclear emissions from the decaying
14C are converted into light energy. In detail, β-particles emitted from 14C excite solvent molecules
in the scintillation cocktail, which in turn excite more solvent molecules and fluor solutes that
release photons. Finally, the fluor molecules emit flashes of blue light upon return to the ground
state. The total photons emitted as blue light from excited fluor molecules constitutes the
scintillation and the light energy intensity corresponds to the initial energy of the β-particle.
Counting was done on a Tri-Carb Liquid Scintillation Counter (Packard BioScience) for
10—30 min per sample with the QuantaSmart software using standard 14C-nuclide settings. The
desintregrations per minute (dpm), which represent nuclear decays per minute, were normalized
to pmol [1-14C]acyl-ACP hydrolyzed per minute per µg recombinant protein or soluble protein
extract using the specific radioactivity (122.1 dpm pmol-1) of the commercial fatty acid used for
the synthesis of the [1-14C]acyl-ACP.
2.2.8 Quantification and Identification of Lipids and Fatty Acids
For lipid quantification, concentrations were calculated in correlation to internal
standards of known quantity. Commercially available standards were purchased from Sigma,
Avanti Polar Lipids, Matreya LLC and Larodan (see 2.1.6).
For the quantification of internal standards for phospholipids and galactolipids, DAGs, TAGs, fatty
acids, MAGs, acyl-CoAs and acyl-ACPs, the lipids were trans methylated and measured on GC-FID
as fatty acid methyl esters (see 2.2.8.9). Peak areas were quantified relative to 5 µg pentadecanoic
acid methyl ester (15:0) or myristic acid methyl ester (14:0) in the case for the IS 15:0.
2.2.7.4 Liquid Scintillation Counting
2.2.8.1 Internal Standards for Lipid and Fatty Acid Analysis

61
Fatty acid and Monoacylglycerol Internal Standards For fatty acid quantification either by GC-FID, GC-MS or QTOF LC-MS, 100 µL IS containing 5 µg of
pentadecanoic acid (0.05 µg µL-1) in methanol were added to the sample prior to lipid extraction.
For monoacylglycerol (MAG) measurements, 15 µg monopentadecanoin (15:0-MAG) in
chloroform were added to the sample prior to lipid extraction. The 15:0-MAG IS was a racemic
mixture of 12.3% β-MAG and 87.7% α-MAG. The ratio was experimentally verified by replicate
measurement of the 15:0-MAG IS by GC-MS which is capable to seperate these two MAG forms.
Phospholipid, Galactolipid and Sulfolipid Standard Mix The phospholipid, galactolipid and sulfolipid standard mix was quantified and prepared by Helga
Peisker (IMBIO Institute, Bonn) (Gasulla et al., 2013; Wewer et al., 2014). For each sample, 10 µL
of phospholipid and galactolipid standard mix in chloroform/methanol (2:1) contained 10.35
nmol of di14:0-PC and 13.25 nmol di20:0-PC, 9.33 nmol of di14:0-PE and 12.1 nmol di20:0-PE
PE, 9.92 nmol of di14:0-PG and 11.25 nmol di20:0-PG, 6.96 nmol of di14:0-PA and 7.145 nmol
di20:0-PA, 1.41 nmol di14:0-PS, 15.9 nmol 34:0-PI, 7.278 nmol 34:0-MGDG and 6.75 nmol 36:0
MGDG, 10.134 nmol 34:0-DGDG and 22.2 nmol 36:0-DGDG and 21.2 nmol 34:0-SQDG. Per sample,
10 µL of phospholipid, galactolipid and sulfolipid standard mix were added to 10 µL sample from
a 1 mL crude lipid extract in chloroform. 80 µL Q-TOF running buffer were added to the sample to
ensure that NH4OAc was present for the formation of ammonium adducts during nanospray
ionization.
DAG and TAG Standard Mix DAG and TAG standards were prepared by Katharina Gutbrod (IMBIO Institute, Bonn) (Gasulla et
al., 2013; vom Dorp et al., 2013). The standards were added to the samples as internal standards
prior to lipid extraction. Two different versions of TAG internal standard were used; the first
version contained 10 µL DAG and TAG standard mix in chloroform/methanol (2:1) which included
1 nmol each of di14:0, di14:1, di20:0 and di21:0 or tri10:0, tri11:1, tri20:0 and tri22:1,
respectively. The second version contained 0.02 nmol µL-1 tri17:0, tri 17:1, of which 50 µL (1
nmol) were used per sample.
Free Sterols Internal Standard
For the measurement of free sterols with GC-MS, 10 µL of cholestenol internal standard
(0.1 nmol µL-1) dissolved in chloroform was added prior to lipid extraction of the sample as
described previously for plant samples (Wewer et al., 2011).

62
Acyl-CoA Internal Standard
The internal standard for acyl-CoA quantification was 17:0-CoA. The dried acyl-CoA
powder (5 mg) was dissolved in 500 µL MES-KOH buffer (100 mM, pH 6.0) and stored at -20°C as
a super stock. For quantification, a 1000-fold dilution was prepared as working stock and 5 µL
added to the dissolved lipid sample as internal standard after homogenization of the tissue. The
concentration of the 17:0-CoA super stock and the working stock was quantified against 15:0
using GC-FID.
Lipids from were extracted from plant and fungal tissue according to the two-phase
separation method by Bligh and Dyer (1959). In order to minimize contamination during Q-TOF
MS analysis, non-autoclaved plastic tips were used, and glass ware, especially glass pasteur
pipettes, were rinsed with chloroform prior to use. In the first step of lipid extraction, formic acid
was added to the solvent, to inhibit lipase-induced degradation of lipids (Browse et al., 1986).
Typically, 10—100 mg tissue was harvested and the fresh weight (FW) determined quickly to
minimize the risk of lipid degradation. The tissue was harvested in 2 mL Eppendorf tubes, which
were then quickly frozen in liquid nitrogen and immediately processed or stored at -80°C. For
most lipid extractions, the tissue was homogenized with a ball mill directly in the 2 mL reaction
tubes. For homogenization, ceramic beads were added to the frozen tissue and homogenized using
a ball mill (Precellys) at 6000 Hz for 20 sec. To ensure complete extraction of lipids, the samples
were ground a second time for 60 sec in the presence of two volumes (1 mL) of the extraction
solvent (chloroform/methanol/formic acid, 1:1:0.1). For acyl-CoA extraction and extraction of
lipids from R. irregularis ERM, the tissue was transferred to a pre-cooled mortar, homogenized in
the presence of liquid N2, scraped into 2 mL Eppendorf tubes and the extraction solvent added to
the samples.
After the extraction solvent (together with the IS) was added, lipid degradation is inhibited and
the samples can be processed at RT. Phase separation was induced by addition of 1 volume (0.5
mL) of 1 M KCl/0.2 M H3PO4. After vortexing and centrifugation at 5000 g for 5 min, the lower
organic phase was collected and the remaining aqueous phase re-extracted twice with 2 volumes
(1 mL) chloroform. The organic phases were combined in a fresh glass tube and dried under N2
and stored at -20°C until solid-phase extraction (see 2.2.8.5) or measurement of lipids (see
2.2.8.7—2.2.8.10).
After expression of plant thioesterases in E. coli, 5 mL of induced ON-culture (16 h) was
transferred into glass vials and heated at 95°C for 5 min. Lipids were extracted with 8 mL
2.2.8.2 Extraction of Lipids from Plants and fungal ERM
2.2.8.3 Extraction of Lipids from E. coli and S. cerevisiae

63
chloroform/methanol 6:1 (v/v), the vial centrifuged at 2000 rpm for 5 min and the bottom organic
phase transferred to a fresh glass vial. This step was repeated two times to ensure complete
extraction of lipids. The lipid extract was stored at -20°C until solid phase extraction of free fatty
acids (see 2.2.8.5).
S. cerevisiae lipids were extracted from 1—50 mL pelleted yeast cells obtained from 5— 50
mL ON cultures. Cell pellets were resuspended in 1—10 mL ddH2O, heated in glass tubes at 95°C
for 20 min and three volumes of chloroform/methanol 2:1 (v/v) were added. After vortexing and
centrifugation for 5 min at 2000 rpm, the organic phase was harvested and the sample
re-extracted twice with two volumes chloroform. Yeast total lipids were transmethylated to
obtain total lipid fatty acid methyl esters, which were analyzed by GC-FID directly (see 2.2.8.9) or
used to determine the position of the double bonds in unsaturated fatty acids (see 2.2.8.4).
For determination of the double bond position, unsaturated fatty acids were
methylthiolated. During this reaction dimethyl disulfide is added to the carbon atoms of the
double bond, catalyzed by iodine (Francis, 1981)(Cahoon et al., 1994). The solvent from total fatty
acid methyl esters from 1 mL yeast culture was evaporated. Methyl esters were dissolved in 100
µL iodine solution (60 mg mL-1 in diethylether) and 350 µL dimethyldisulfide and incubated for 3
h at 37°C. Next, 1 mL hexane/diethylether 1:1 (v/v) was added while gently vortexing the mixture.
To neutralize the iodine, drops of 10% (w/v) Na2S2O3 were added while strongly vortexing the
mixture until it appeared colorless. The upper phase containing the methylthio-derivatives was
harvested and analyzed by GC-MS (see 2.2.8.10).
Solid phase extraction was done to seperate lipid classes or individual lipids from complex
lipid extracts according to their polarity. Strata® Silica SI-1 columns with unmodified silica (SiOH)
as stationary phase was used.
A crude lipid extract dissolved in chloroform (see 2.2.10.2 and 2.2.10.3) was applied to a silica
column previously equilibrated three times with one mL of chloroform (three times one mL for
100 mg silica and three times five mL for 500 mg silica). After application of the crude lipid extract
dissolved in chloroform, the flow-through was collected and two more times one mL or 5 mL (for
a 100 mg or 500 mg column, respectively) of chloroform were passed through the column. The
resulting chloroform eluate contains neutral lipids, such as MAGs, DAGs, TAGs and free sterols.
The less polar galactolipids were eluted with three mL acetone/isopropanol 1:1 (v/v) and the
more polar phospholipids in methanol.
2.2.8.4 Determination of the Double Bond Position in unsaturated Fatty Acids
2.2.8.5 Solid Phase Extraction of Lipid Extracts

64
Individual lipid classes were seperated from complex lipids by applying a crude lipid
extract dissolved in hexane to the hexane-equilibrated silica column and eluted with a
hexane/diethylether gradient. The elution solvent increases in polarity due to increased
proportions of diethylether (Gasulla et al., 2013; vom Dorp et al., 2013). Hexane is unpolar, and
therefore most lipids bind to the silica column. As first fraction, TAGs were eluted with
95:5 hexane/diethylether (v/v) from the column, free fatty acids with 92:8, free sterols and DAGs
with 85:15 and MAGs with 0/100.
The eluted SPE-fractions were evaporated to dryness and used for lipid measurement by
Q-TOF MS/MS directly (phospholipids, galactolipids, DAGs and TAGs; see 2.2.8.7) or after
derivatization with GC-FID/MS (free fatty acids, free sterols and MAGs; see 2.2.8.9 and 2.2.8.10).
Acyl-CoA were extracted from plant tissue according to (Domergue et al., 2005; Larson et
al., 2002; Larson and Graham, 2001). For N. benthamiana leaves and L. japonicus roots, the tissue
was harvested, immediately frozen in liquid nitrogen in a porcelain mortar, ground with a pre-
cooled pestle and 20 mg of ground tissues used per replicate for acyl-CoA extraction. The plant
tissue was resuspended in 200 µL freshly prepared, pre-cooled extraction buffer. For extraction
from yeast, cell pellets from 1 mL culture were frozen at –20°C, thawed on ice in 200 µL extraction
buffer and cells mechanically disrupted in a Precellys homogenizer twice at 6000 rpm for 20 sec
in the presence of ~50 µL glass beads (≤106 µm diameter). The samples were centrifuged at 13
500 rpm for 5 min at 4°C and the supernatant used for acyl-CoA extraction.
For quantification, 5 µL 17:0-CoA working stock was added at this point as internal
standard. Lipids were removed with 200 µL hexane that was saturated with isopropanol/ddH2O
(20 mL hexane with 80 mL isopropanol/ddH2O 1:1 v/v), the sample vortexed for several sec,
centrifuged at 2000 rpm for 3 min and the upper organic phase discarded. Care was taken to not
disrupt the interface and to not take out the entire organic phase, to minimize loss of acyl-CoAs
that are dissolved in the lower, aqueous phase. To ensure complete removal of contaminating
lipids, the extraction was repeated three more times. Five µL saturated (NH4)2SO4 and 600 µL
methanol/chloroform 2:1 (v/v) were added, the samples incubated at RT for 20 min and
centrifuged at 13500 rpm for 2 min. The (NH4)2SO4 precipitates contaminating protein and salts,
while the acyl-CoAs are soluble in the organic solvent mixture and are harvested in the
supernatant. The supernatants were transferred to conical glass inlets for autosampler vials
(300 µL volume at once), which were placed in 2 mL Eppendorf tubes that were placed with
opened lids into the SpeedVac® Vacuum Concentrator without heating to evaporate the
water/methanol/chloroform. Care was taken not to over-dry the samples. Samples were
overlayed with N2-gas and stored at –80°C. Prior to measurement with Q-TOF LC-MS/MS (see
2.2.8.6 Extraction of Acyl-CoA from Plants and Yeast

65
2.2.8.8.1) samples were dissolved in a minimal volume (~70 µL) of ddH2O/acetonitrile 9:1 (v/v)
containing 15 mM ammonium hydroxide, with pipetting up and down and ultrasonification.
Acyl-CoA extraction buffer
1 mL Isopropanol 1 mL KH2PO4 (50 mM, pH 7.2) 25 µL Acetic Acid 40 µL Fatty Acid-Free BSA (50 mg.mL-1)b
b=50 mg. mL-1 stocks were prepared and stored as aliquots of 250 µL at –20°C.
KH2PO4 (50 mM, pH 7.2)
30.75 mL K2HPO4 (1 M) 19.25 mL KH2PO4 (1 M) Mix and dilute to 100 mM. Dilute 100 mM K2HPO4/KH2PO4 stock to 50 mM, adjust pH to 7.2 with K2HPO4 (1 M).
Lipids were analyzed with a 6530 Accurate-Mass Quadrupole Time-of-Flight (Q-TOF)
LC/MS (Agilent) mass spectrometer using either nanoflow direct infusion Chip Cube technology
(see 2.2.8.7.1) or liquid chromatography coupled to electrospray ionization (ESI), Q-TOF
LC-MS/MS (see 2.2.8.8). The dissolved lipid samples were injected into the ion source for
ionization. The mass-over-charge ratios of positively or negatively ionized lipids or lipid adducts
were scanned for in the ion selecting cell (Q1). These were collided with nitrogen collision gas in
the collision cell (Q2) to achieve collision-induced dissociation with the generation of fragments,
which were detected in the mass analyzer after separation in the flight-tube. The amount of lipids
was calculated in relation to internal standards (see 2.2.8.1). Exact molecular masses of ions were
calculated using the Agilent Mass Hunter Calculator and the distribution of isotopes was
calculated with the Isotope Distribution Calculator and Mass Spectrum Plotter from Scientific
Instrument Services.
2.2.8.7.1 Measurement of Lipids by Q-TOF MS/MS with Nanoflow Direct Infusion
Phospholipids, galactolipids, DAGs and TAGs were measured by Q-TOF MS/MS direct
infusion with positive ionization using methods developed by Helga Peisker, Vera Wewer and
Katharina Gutbrod (IMBIO Institute, Bonn). Lipids were dried, dissolved in
chloroform/methanol/300 mM ammonium acetate (300:665:35), and 5–22 µL of the sample
injected, depending on the type of analysis. In the ion selecting cell, targeted lists of molecular
species of the respective ionized lipids were scanned and mass spectra of fragmented ions
recorded at a rate of 1 spectrum per second. Table 19 in Appendix 7.8 shows the targeted lists for
all lipid classes analyzed by Q-TOF MS/MS with nanoflow direct infusion and table 3 summarizes
the Q-TOF MS/MS instrument settings for this configuration.
2.2.8.7 Measurement of Lipids by Q-TOF MS/MS

66
Table 3: Instrument Settings for Q-TOF MS/MS Nanoflow Direct Infusion
Part Properties/Settings
Infusion chip FIA Chip II flow injection and infusion
Solvent chloroform/methanol/300 mM ammonium acetate 300:665:35 (v/v/v)
Flow rate 0.5—1 µL min-1 Drying gas Nitrogen: 8 mL min-1 Ionization mode Positive Fragmentor voltage 200 V
Gas temperature 300°C
Injection volume per sample 5—22 µL Chip Vcap 1700 V Spectrum scan rate 1 spectrum sec-1
The abundance of a charged daughter ion was used to identify the lipid after
fragmentation. MGDG, DGDG, SQDG, PA, PS, PI, PE, PG, DAG and TAG were quantified based on the
abundance of the product ion after subtraction of a specific neutral loss from the precursor ion
(Table 4). PC was identified and quantified based on precursor ion scanning for the ion with m/z
184.0739.
Table 4: Parameters of Lipid classes for Quantification with Q-TOF MS/MS Nanoflow Direct Infusion
Lipid Class Collision Energy (V) Neutral loss (m/z) Product Ion (m/z)
MGDG 12 179.0556 DGDG 17 341.1084 SQDG 19 261.0518 PA 20 115.0034 PS 22 185.0089 PI 20 277.0563 PE 20 141.0190 PG 20 189.0402 PC 35 184.0739 DAG 20 NL of the FA TAG 20 NL of the FA
2.2.8.7.2 Data Analysis for Quantification of Lipids by Q-TOF MS/MS with Nanoflow Direct Infusion
Mass spectrums and chromatograms were visualized with the Agilent Mass Hunter
Qualitative Analysis Software (Version B.06.00). To calculate molar quantities, ion counts of
product ions of endogenous lipids and lipid standards were exported to Microsoft Excel 2013. The
counts from four iterations of mass selection, fragmentation and detection were averaged per
molecular species. Lipids that differ from each other only in the occurrence of a single double bond
in their fatty acids differ in their m/z values by two hydrogen atoms (m/z =2), and therefore the
presence of naturally occurring 13C2 isotopes can lead to isotopic overlap (Ejsing et al., 2006). To
account for isotopic overlap, the probability of a fragment ion containing two 13C atoms was

67
calculated and subtracted from the respective lipid molecular species. For most glycolipid
analyses, two different internal standards (see 2.2.8.1) were used. Their detector signal response
can vary due to differences in their m/z values. In general, smaller molecules are better ionized
and their abundance might be overestimated. To correct for this inaccuracy, a trend function of
m/z against ion counts was calculated for the two internal standards and this value used to divide
the ion counts of the molecular species from the tissue to be analyzed. The isotope-and
trend-corrected ion counts were then used to calculate molar concentrations of lipids in relation
to internal standard signal and tissue weight.
For measurement of fatty acids, acyl-CoA and acyl-ACP, the Q-TOF was operated with
electrospray ionization (ESI) with normal flow. Table 5 summarizes the instrument settings for
Q-TOF LC-MS/MS. To achieve separation of analytes, a reverse-phase column (C8 or C18) for
liquid chromatography (LC) was installed. The sample was injected onto the column in a polar
solvent and lipids retained on the unpolar stationary phase. Elution was achieved with a gradient
of an unpolar solvent.
Table 5: Instrument Settings for Q-TOF LC-MS/MS
Flow rate 0.2—0.5 mL min-1
Drying gas Nitrogen: 8 mL min-1
Fragmentor voltage 200 V Gas temperature 300°C Injection volume per sample 20—35 µL Chip Vcap 1700 V Spectrum scan rate 1 spectrum sec-1
For acyl-CoAs and acyl-ACPs, the mass spectrometer was utilized in MS/MS mode with
positive ionization. Upon ionization, different adducts of ions are formed that differ in their
suitability for subsequent fragmentation and detection. For acyl-CoAs, H+-adducts were selected
and for acyl-ACPs, NH4+-adducts (see appendix 7.8, Table 19). Selected ions (Q1) were fragmented
in Q2 and the fragment ions seperated in the ToF and quantified, similar to glycerolipid analysis
(see 2.2.8.7). Table 6 shows the optimized collision energies and neutral losses.
Table 6: Parameters of Lipid Classes for Quantification with Q-TOF LC MS/MS
Lipid Class Collision Energy (V) Neutral Loss (m/z)
Acyl-CoA 35 506.9960a
Acyl-ACP 45 413.1432, 315.1663b a=Neutral loss of 506.9960 (m/z) corresponds to adenosine-3'-phosphate-5'-diphosphate. b=Neutral loss of 413.1432 (m/z) corresponds to aspartic acid-serine-leucine with 4'-phosphopantetheine(DSLp), 315.1663 corresponds to aspartic acid-serine-leucine (DSL) with phosphate from the 4´-phosphopantetheine
2.2.8.8 Measurement of Lipids by Q-TOF LC-MS/MS

68
2.2.8.8.1 Acyl-CoA
Extracted Acyl-CoAs (see 2.2.8.6) were seperated with reverse-phase chromatography
using silica modified with C8 alkyl chains as stationary phase with an unpolar solvent gradient
(Domergue et al., 2005; Larson et al., 2002; Larson and Graham, 2001), see table 7 and table 8.
Table 7: Parameters for Acyl-CoA Analysis with Q-TOF LC-MS
Flow rate 0.5 mL min-1 LC Column Knauer Eurospher-II RP8 (150x 3 mm) Solvent A Acetonitrile + 15 mM NH4OH
Solvent B ddH2O/Acetonitrile 9:1 (v/v) + 15 mM NH4OH (final concentration)
Solvent C ddH2O/Acetonitrile 3:7 (v/v) + 0.1% Formic Acid (final concentration)
Ionization Positive MS mode MS/MS
Table 8: Liquid Chromatography Gradient for Acyl-CoA
Time (min) Solvent A (%) Solvent B (%) Solvent C (%)
0 0 100 0 5 25 75 0 11 100 0 0 13 100 0 0 15 0 0 100 18 0 0 100 20 0 100 0 20.1 0 100 0
2.2.8.8.2 Acyl-ACP
After enzymatic synthesis of acyl-ACPs (see 2.2.6.3), their purity and identity was
confirmed by Q-TOF LC-MS/MS. To prepare acyl-ACPs as standards for chromatography and mass
spectrometry, they were digested with endoproteinase Asp-N as described previously (Bates et
al., 2014; Kim et al., 2015). 50 µL of acyl-ACP (dissolved in 10 mM MES pH=6.1) were mixed with
50 µL MOPS 50 mM pH=7.6 to ensure that the pH was above 7.0 for optimal Asp-N activity. Two
µL (80 ng) of Asp-N endoproteinase (Promega) were added, incubated at 37°C for 2 h and the
reaction stopped by addition of 70 µL methanol. The Asp-N endoproteinase specifically
hydrolyses the peptide bonds at the N-terminal side of aspartic acid and leucine residues. In
acyl-ACPs of Arabidopsis and many other organisms (e. g. E. coli), aspartic acid and leucine flank
the serine group where the 4'-phosphopantetheine arm is attached to the fatty-acyl chain, thereby
releasing acyl-4'-phosphopantetheine-aspartic acid-serine-leucine from the mature acyl-ACP
upon endoproteinase digestion. The resulting acyl-phosphopanthteine-tripeptide limb is small

69
enough for mass spectrometry. Per sample, 30 µL of digested acyl-ACP was injected onto the
instrument prior to separation on a reverse phase (C18) column (Macherey & Nagel Nucleoshell
Bluebird RP18). For details, see tables 9 and 10.
Table 9: Parameters for Acyl-ACP Analysis with Q-TOF LC-MS
Flow rate 0.2 mL min-1
LC-Column Macherey & Nagel Nucleoshell Bluebird RP18 with pre-column
Solvent A Acetonitrile/10 mM Ammonium Formate + 10 mM Formic Acid 1:9 (v/v)
Solvent B Acetonitrile/10 mM Ammonium Formate + 10 mM Formic Acid 9:1 (v/v)
Ionization Positive MS mode MS/MS
Table 10: Liquid Chromatography Gradient for Acyl-ACP
Time (min) Solvent A (%) Solvent B (%)
0 100 0 3 100 0 3.1 85 15 12 0 100 17 0 100 19 100 0 30 100 0
2.2.8.8.3 Fatty Acids
The method for 13C-quantification in fatty acids with Q-TOF LC-MS was initially developed
by Katharina Gutbrod (IMBIO Institute, Bonn). Prior to the measurement, esterified fatty acids
were saponified by alkaline hydrolysis to obtain free fatty acids following an protocol adopted
from the Cyberlipid Center (www.cyberlipid.org). Crude lipid extracts (see 2.2.8.2) were
evaporated, dissolved in 3 mL methanol/KOH (3 M) 9:1 (v/v) and incubated for 1 h at 80°C. After
cooling, the reaction was neutralized by addition of 300 µL concentrated HCl and fatty acids
extracted after addition of 500 µL hexane. The hexane was evaporated and the free fatty acids
dissolved in acetonitrile prior to injection.
Free fatty acids were ionized in the negative mode, generating [M-H]- ions due to their
carboxyl groups. Their fragmentation pattern is of little use for identification and quantification
and therefore, the ion counts for fatty acids were extracted from a full ion scan (m/z 100=1300)
without fragmentation (Q-TOF LC-MS as only the first quadrupole is utilized without
fragmentation). The sample was dissolved in 300 µL acetonitrile, 30 µL injected and the flow rate
set to 0.2 mL min-1. A previously published chromatography gradient was used for separation of
free fatty acids by liquid chromatography (Kortz et al., 2013). For details see table 11 table 12.

70
Table 11: Parameters for Fatty Acid Analysis with Q-TOF LC-MS
Flow rate 0.2 mL min-1 LC-Column Knauer Eurospher-II RP8 (150x 3 mm) Solvent A ddH2O/Acetonitrile/Formic Acid 63:37:0.02 (v/v/v) Solvent B Isopropanol/Acetonitrile 1:1 (v/v) Ionization Negative MS mode MS only
Table 12: Liquid Chromatography Gradient for Fatty Acids
Time (min) Solvent A (%) Solvent B (%)
0 100 0 18 0 100 22 0 100 22.2 100 0 30 100 0
2.2.8.8.4 Data Analysis for Quantification of Lipids by Q-TOF LC-MS/MS
Chromatograms from acyl-CoA and acyl-ACP chromatography were analyzed with Agilent
Mass Hunter Qualitative Analysis Software (Version B.06.00). Peak areas (ion counts) were
integrated and the results exported to Microsoft Excel 2013. The ion count for each analyte was
recorded as the main product ion after fragmentation (for LC-MS/MS) or without fragmentation
(LC-MS). Molar quantities were calculated in relation to internal standard peak areas, and
normalized to tissue weight or optical density of a culture in the case of yeast.
Evaluation of 13C-labeled fatty acid isotopologs was done with Agilent MassHunter
Quantitative Analysis for Q-TOF (Version B.07.00). Fatty acid ion abundancies were extracted
from the total ion chromatogram by scanning for the molecular ions [M-H]- without fragmentation.
The peaks in the resulting extracted ion chromatogram (EIC) were manually integrated for every
fatty acid isotopolog, exported to Microsoft Excel 2013 and used for quantification of unlabeled
12C fatty acid and 13C-labeled fatty acid isotpologues after subtraction of naturally occurring 13C
(see 2.2.9.2), in relation to internal standard and tissue weight.
Non-labeled fatty acid quantification was performed by analysis of fatty acid methyl esters
(FAME) on a gas chromatograph (GC) with flame ionization detection (FID). Esterified fatty acids
were transmethylated from lipids by acidic catalysis, which transfers the ester bound fatty acid to
a methyl group, generating fatty acid methyl esters. Dried lipid extracts were dissolved in 1 mL
1 N methanolic HCl and incubated for 30 min at 80°C. 1 mL 0.9% (w/v) NaCl and 1 mL hexane
were added, samples mixed and phases seperated by centrifugation (3 min, 2000 g). The upper
2.2.8.9 Analysis of Fatty Acids Methyl Esters by Gas Chromatography Flame Ionization
Detection

71
hexane phase containing the unpolar, volatile FAMEs was harvested and directly applied to the
GC or concentrated by evaporation under N2 gas. The FAMEs were eluted from the GC column
(Supelco SP-2380) with a temperature gradient starting with 100°C, increased to 160°C by
25°C/min, then to 220°C by 10°C/min and finally decreased to 100°C by 25°C/min. Table 13
summarizes the instrument settings for FAME analysis by GC-FID. Peaks in the GC-FID
chromatograms were identified by their retention times compared to a rapeseed standard
mixture (Supelco).
Table 13: Parameters for Gas Chromatography Flame Ionization (GC-FID)
Part Properties/Settings Column Supelco SP-2380 Length 25 m Inner diameter 0.53 mm Film thickness 0.2 µm Carrier gas Helium Flow rate 1.2 mL min -1 Injection volume per sample 1—4 µL H2 flow 30 mL min -1 Synthetic air flow 440 mL min
GC-MS was used for identification of lipids based on their mass spectra. Mass spectra were
compared with the National Institute of Standards and Technology (NIST) mass spectral library
or by comparison to the mass spectra of in-house synthesized or purchased standards. The
method was used for FAMEs, free sterols and MAGs. The analysis was conducted on a gas
chromatograph (Agilent 7890) coupled to mass spectrometer 5975C inertxL MSD (Agilent). For
fatty acid analysis, FAMEs were prepared as described above (see 2.2.8.9).
For free sterols and MAGs, the respective SPE fractions (see 2.2.8.5) were evaporated. Lipids were
dissolved and free OH-groups silylated with 100 µL of N-methyl-N-(trimethylsilyl)-
trifluoroacetamide (MSTFA) at 80°C for 30 min. MSTFA was then evaporated under N2 gas and the
samples were dissolved in hexane for injection onto the GC. Silylated compounds or FAMEs were
seperated on a HP-5MS column (Agilent) using a temperature gradient starting at 150°C,
increased to 280°C at 10°C/min, held for 10.5 min, and decreased to 150°C at 20°C/min (Table
14).
Upon elution from the column, compounds enter the ion source and are ionized by
electron impact (EI) ionization with 69 electron volt (eV), which causes also fragmentation. The
he product ion is subsequently guided by the quadrupole mass-filter analyzer to the detector. The
mass filter selects ions in the range of 50-550 (m/z). One full ion scan was recorded per
2.91 seconds.
2.2.8.10 Analysis of Lipids by Gas Chromatography Mass Spectrometry (GC-MS)

72
Table 14: Gas Chromatograph Parameters for GC-MS
Part Properties/Settings Column Agilent HP-5MS Length 30 m Inner diameter 0.25 mm Film thickness 0.25 µm Carrier gas Helium Flow rate 2 mL min -1 Injection volume per sample
1—4 µL
MAGs were present in the analyzed tissues as two regio-isomers, α and β, depending on
the position of the acyl chain on the glycerol backbone. In the α-MAG isomer, the acyl chain is
esterified to sn-1 or sn-3 of sn-glycerol, while in β-MAG, it is attached to sn-2. On the GC-column,
the syliated regio-isomers were seperated and identified based on characteristic fragment ions
(Destaillats et al., 2010; Li et al., 2007; Yang et al., 2010). As the GC-MS was operated in scan-mode,
the ion abundancies for MAG-isomers were extracted from total ion chromatograms (Table 20).
Free sterols were also quantified based on characteristic fragment ions (see table 21) extracted
from the total ion chromatogram (Wewer and Dörmann, 2014).
2.2.9 Stable 13C-Isotope Labeling
Upon labeling with 13C, the incorporated label from exogenously applied compounds
enters the metabolism and changes the 13C-pattern that now deviates from the naturally occurring
13C-isotope pattern. The percentage distribution of naturally occurring 13C in every fatty acid was
retrieved with the Isotope Distribution Calculator and Mass Spectrum Plotter (www.sisweb.com)
and subtracted from the molar quantity of the respective fatty acid isotopolog quantified with
Q-TOF LC-MS. The resulting amount was designated the over-excess (OE) amount as it exceeds
the threshold for natural 13C abundance and therefore must have originated from the 13C labeling
(Keymer et al., 2017). To verify this approach, a negative control without 13C label was analyzed.
This control showed the expected 13C distribution identical to the naturally occurring 13C
distribution.
2.2.9.1 Labeling with 13C-Acetate
Colonized roots of L. japonicus with R. irregularis were retrieved from the substrate of the
pots, washed with water and the roots submerged in 10 mL labeling buffer (20 mMMES-KOH, 0.2
(v/v) Tween 20, pH=5.6) in 50 mL falcon tubes. [13C2]sodium acetate was added to the buffer
directly at a concentration of 4 mM. The bottom half of the tube was covered with aluminum foil
and the shoots exposed to continuous light for the 24 h labeling period.
2.2.9.2 Quantification of 13C Over-Excess Label in Fatty Acid Isotopologs

73
3 Results
3.1 The Function of FatM in Arbuscular Mycorrhiza Symbiosis
3.1.1 The phylogenetic Relationship of Acyl-ACP Thioesterases in Mycorrhiza Host and non-Host Plant Species reveals mycorrhiza-specific Clades
To conduct a survey of the gene repertoire of acyl-ACP thioesterases, translated coding
sequences from nine plant species were aligned and used to establish an unrooted
maximum-likelihood phylogenetic tree showing the relationship among mycotrophic and
non-mycotrophic plants, based on the differences in amino acid sequence (Figure 4). The
phylogenetic analysis returned two major clades, named FatA-type and non-FatA-type, according
to their respective orthologs in A. thaliana FatA1/FatA2 (FatA-type) and FatB (non-FatA-type)
(Jing et al., 2018). The non-FatA-clade was divided into three sub-clades, FatB, FatC and FatM,
named according to the L. japonicus sequences that were grouped there. FatA and FatB were
present in AMF-host and non-host species, while FatC and FatM sub-clades were found only in
AMF-hosts. In all mycotrophic plants, Fat sequences were seperated between the monocotyledons
Z. mays, S. bicolor (Poaceae) and the dicotyledons M. truncatula, G. max and L. japonicus (Fabaceae)
that were included in the phylogenic analysis.
Acyl-ACP thioesterases from different plant species differ in their substrate specificities.
In general, FatA-type thioesterases prefer mostly 18:1-ACP as substrate and FatB-type act
preferentially on saturated acyl-ACP with chain lengths of C8—C18 (Jing et al., 2011). The
acyl-ACP thioesterases specific for medium chain acyl-ACP from Cuphea hookeriana (ChFatB2)
and Umbellaria californica (UcFatB1) were grouped to the FatB sub-clade. FatC sequences from
mycorrhiza hosts were more closely related to the FatB sub-clade than to the FatM sub-clade,
which is the most distant of the three non-FatA-type sub-clades. This reveals that mycorrhiza
hosts have probably acquired two more copies of non-FatA-type acyl-ACP thioesterases during
their co-evolution with AMF. Of these two (FatC and FatM), only FatM exhibited a
mycorrhiza-specific gene expression pattern (see appendix 7.3) and was therefore selected as
candidate to investigate symbiotic lipid transfer.
3.1.2 Isolation of fatm mutant Plants and Analysis of Mycorrhiza-dependent Gene Expression
To study the function of FatM, a reverse genetic approach was conducted using mutant
alleles that contain transposon insertions upstream of the FatM start codon. The Lotus FatM
nucleotide sequence (chr5.CM0328.70.nd) was blasted against the flanking sequences of the Lotus
Retrotransposon (LORE1) mutant database to identify transposon insertions in the FatM gene.

74
Figure 4: Phylogenetic Tree of acyl-ACP Thioesterases from AM Host and Non-Host Plants. Amino acids sequences were aligned with ClustalX using MEGA v 6.0, and a maximum-likelihood tree was constructed. The numbers on the branches indicate boot-strap values (1000 iterations). At, Arabidopsis thaliana; Bra, Brassica rapa; Ch, Cuphea hookeriana; Glyma, Glycine max; Lj, L. japonicus; Medtr, Medicago truncatula; Sb, Sorghum bicolor; Uc, Umbellularia californica; Zma, Zea mays. Lotus sequences are highlighted with red boxes. Mycotrophic plants are highlighted in blue, non-mycotrphic plants are depicted in black. The experimentally verified preferences for different acyl-ACPs of the thioesterases are indicated in green boxes next to the protein name in the order of substrate preference. ChFatB1 (Jones et al. 1995); ChFatB2 (Dehesh et al. 1996); UcFatB1 (Voelker et al. 1992); AtFatA1, AtFatB (Salas and Ohlrogge 2002); LjFatA, LjFatB, LjFatM (this work).

75
T3 seeds of plants containing insertions were obtained, plants grown and genomic leaf
DNA used for genotyping of the insertion. Two independent fatm mutant alleles, designated fatm-
1 (“G63”, LORE1 Plant ID: 30003218) and fatm-2 (“D20”, LORE1 Plant ID: 30052489), carrying
LORE1-insertions 218 bp and 248 bp upstream of the start codon (Figure 5a) were selected for
mycorrhiza-colonization experiments. The mutant plants were confirmed to be by PCR (Figure
5b).
The two independent alleles of the homozygous insertion lines showed decreased FatM
gene expression upon colonization with R. irregularis at 4 wpi and 7 wpi (Figure 5c, d). In fatm-1
and fatm-2, at 4 wpi, no gene expression was observed and at 7 wpi, it was reduced in relation to
the WT control. This shows that although the two lines do not represent null mutations, FatM
expression is strongly affected. Expression of FatA, FatB and FatC remained unchanged upon
colonization, either at 4 wpi or 7 wpi in both fatm mutant alleles. In the colonized fatm mutant
lines, expression of the plant mycorrhiza-marker PHSOPHATE TRANSPORTER 4 (PT4), was
strongly reduced in fatm-1 and absent from fatm-2 at 4 wpi, while expression was recovered at
7 wpi to a level similar to WT. The same expression pattern was detected for the fungal
housekeeping gene α-TUBULIN that was reduced at 4 wpi, but similar to WT at 7 wpi. These data
indicate that colonization is strongly reduced at 4 wpi but can be recovered at to some degree at
7 wpi.
3.1.3 The fatm Mutation affects Root Colonization and Lipid Storage in R. irregularis and symbiotic Phosphate Transfer to the Plant
To quantify root colonization parameters in fatm mutant plants, fungal cell walls were
stained in colonized roots and investigated under a bright-field microscope (Figure 6a—d). Using
the modified grid-line intersection method, the relative frequency of fungal structures was
quantified in the samples harvested at 4 and 7 wpi (Figure 6a). The percentage of hyphae,
arbuscules, vesicles and total colonization (either one of the preceding) was decreased in
colonized fatm-1 and fatm-2 root systems at 4 wpi. Arbuscule and hyphae frequency was
recovered to WT levels in fatm-2 at 7 wpi, but remained decreased in fatm-1. In the WT and the
two fatm mutant lines, the frequency of fungal structures was increased at 7 wpi relative to 4 wpi.
Vesicles frequency was consistently decreased in the two mutant alleles at 4 wpi and 7 wpi, but to
a greater extend in fatm-1, especially at 7 wpi.
Fungal arbuscules are dynamic structures that undergo programmed degeneration and
generation cycles, dependent on the host plant (Gutjahr and Parniske, 2013). Mutations of plant
genes essential for AMF symbiosis can lead to the premature degeneration of arbuscules, causing
the occurrence of stunted arbuscules (Breuillin-Sessoms et al., 2015; Floss et al., 2017). Therefore,
it was investigated whether stunted arbuscules are also found in the Lotus fatm mutant roots.

76
Figure 5: Isolation of FatM Insertional Mutants and Mycorrhiza-induced Marker Gene Expression. a) Scheme for the L. japonicus FatM gene depicting exons (black boxes), introns (solid line), the position of the LORE1 transposon insertions in fatm-1 and fatm-2 (black triangles), start codon (ATG), stop codon (TAG) and the position of primers (black arrowheads). The exact position of the insertion was determined by sequencing the PCR product of fatm-1 genomic DNA (using the primers bn2306+bn1627) with bn2306, and by sequencing the PCR product of fatm-2 genomic DNA (using bn2300+bn1627) with bn2300. The primers bn2027+bn2028 were used for RT-PCR. b) PCR products of touchdown-PCR with the primers for genotyping. The PCR reaction for fatm-2 was pipetted in a single reaction containing the transposon-specific primer bn1627 and the gene primers bn2300 and bn2301. In fatm-1, three seperate reactions were performed with bn2306/bn 2307, bn2306/bn1627 and bn2307/bn1627. Homozygous insertion lines show a PCR product with the forward gene primer and bn1627 (red arrowheads). Plant lines that were kept for seed propagation for use in the subsequent experiments are indicated as “D20” and G63”. M, Marker; Het, heterozygous; Hom, homozygous. c, d) Semi-quantitative RT-PCR using primer bn2027+ bn2028 with cDNA synthesized from total root RNA of WT, fatm-1 and fatm-2 after colonization with R. irregularis for 4 and 7 weeks. Thioesterases and mycorrhiza marker genes were amplified in 30 PCR cycles. As control for RNA loading, UBIQUITIN was amplified. Fat, Acyl-ACP thioesterase; PT4, PHOSPHATE TRANSPORTER 4; Ri α-TUB, R. irregularis alpha-TUBULIN, UBI, UBIQUITIN.

77
Figure 6: Colonization Parameters and symbiotic Phosphate Uptake in colonized fatm and WT Roots. a) Colonized roots were stained with ink-vinegar, fungal structures (hyphae, arbuscules, vesicles) counted and expressed as % of total spots counted. This was done with five independent root systems harvested at 4 and 7 wpi (n=5). b) At 4 wpi, roots were used for quantification of the distribution of different types of arbuscules in the arbuscule population in fatm-1 and WT. n= four independent root systems. c) Vesicle surface area was measured in the same root systems that were used in a). d) The frequency of the measured vesicles in c) in the root systems. Vesicles were placed in categories according to their size: 0—1000 µm2, 1000—2000 µm2, 2000—3000 µm2, 3000—4000 µm2 and 4000—5000 µm2, counted and divided by the total number of vesicles. For c) and d), five independent root systems were counted (n=5). e) Inorganic shoot phosphate was quantified photometrically in shoots harvested from mycorrhiza- inoculated plants. Results –P myc are from at least eight independent leaf samples from three different pots and –P mock are from at least three individual leaf samples from single pots. –P myc, infected with R. irregularis; –P mock, inoculated with carrier material. WT Gifu, Wild type ecotype Gifu; WT seg, LORE1 segregating wild type allele of fatm-1. All graphs represent average values, error bars depict standard deviation. In a,c—e one-way ANOVA with post-hoc Tukey, different letters indicate significant differences (P < 0.05). In b), students t-test (**P < 0.01).

78
To do so, the frequency of different types of arbuscules was scored in the entire arbuscule
population (Figure 6b). On the one hand, WT-like arbuscules, which appear in the bright-field
microscope as densely packed, fully branched squares that fill the entire cavity of the cortex cell,
were very abundant in WT and to a lesser extent in fatm-1. On the other hand, small, shriveled
mutant arbuscules were enriched in fatm-1.
The latter were called “stunted” to differentiate them from arbuscules that were regularly
degenerated after reaching the end of their lifespan. Such degenerated arbuscules can also be
observed in colonized WT roots, albeit these were most often found in the vicinity of vesicles,
indicating a progression in the mycorrhiza life cycle. Vesicles in mycorrhiza symbiosis are storage
organs for mainly triacylglycerol and glycogen (Smith and Read, 2008). Vesicles were formed in
both WT and fatm mutants, but less frequently in the latter. Vesicles in fatm-1 and fatm-2 were
also smaller (Figure 6c). To visualize these changes in detail, the vesicles were organized in
categories according to their size. The two fatm alleles showed an accumulation of small-sized
vesicle of categories from 0—1000 µm, 1000—2000 µm and a decrease in vesicle size categories
2000—3000 µm and 3000—4000 µm while very large ones of 4000—5000 and > 5000 µm were
absent (Figure 6d).
AMF deliver phosphate to the plant. As AMF colonization and symbiotic phosphate
transporter (PT4) gene expression were affected in fatm mutant roots, the efficiency of symbiotic
phosphate transfer was investigated. Upon colonization with mycorrhiza fungi, PT4 is expressed
in the periarbuscular membrane responsible for phosphate transport to the plant cytoplasm
(Harrison et al., 2002). Free inorganic phosphate serves as a measure of plant phosphate
nutritional status (Chapin and Bieleski, 1982). Free inorganic phosphate was measured and
compared between shoots of mycorrhiza-inoculated WT and fatm mutant plants (Figure 6e). The
colonized mutant plants contained the same amounts of inorganic phosphate as the
mock-inoculated WT and mutants. Mycorrhiza colonization elevated phosphate content in
colonized WT shoots to 79.4 µmol mg-1 DW, which represents an increase by ~33% relative to
colonized fatm-1. This result demonstrates that the deficiency in mycorrhiza colonization in fatm
has a negative impact on the host nutrient status and also likely on plant performance.
3.1.4 Arbuscule Branching is distorted in fatm-1
To study fungal arbuscule morphology in fatm mutants in detail, the fungal cell wall was
stained with a WGA-conjugated fluorophore (WGA-Alexa Fluor 488) and stained roots inspected
with a confocal laser scanning microscope (Figure 7). The colonized root cortex exhibited regions
where the arbuscules had stunted appearances. These arbuscules were shrunken and less
abundant, compared to healthy, WT arbuscules. The stunted arbuscules stopped their
development and therefore exhibited less extensive hyphal fine branching that led to their
shriveled appearances. Besides stunted arbuscules, normal arbuscules were also identified in the

79
two mutant alleles. Stunted arbuscules in fatm-1 and fatm-2 generally occurred in the
neighborhood of other stunted arbuscules, despite of the root being extensively colonized with
intraradical hyphae. This led to the occurrence of root regions where exclusively stunted
arbuscules appeared (see Figure 7 for examples in fatm-1 and fatm-2). These are likely the result
of abortion of the whole infection unit. Arbuscule degeneration is a regular feature of mycorrhiza
intracellular growth that is also observed, although with lower frequency, in WT.
Arbuscule degeneration is the result of programmed arbuscule senescence controlled by
the plant to ensure arbuscule productivity (Floss et al., 2017; Toth and Miller, 1984). It is
associated with the generation of fungal vesicles and therefore indicates a general progression in
the symbiosis. Contrary to degenerated arbuscules in WT, regions in the mutant roots where
Figure 7: Stunted Arbuscules appear in colonized fatm Mutants. Roots of colonized WT Gifu, WT seg and both fatm mutant alleles were colonized for 4 weeks with R. irregularis. The fungus was stained with WGA Alexa Fluor 488, and stained roots investigated with Confocal Laser Scanning Microscopy with excitation at 488 nm and emission at 500—550 nm. Two types of maginifcations were used, 25-fold (25x) and 63-fold (63x). In WT, arbuscules are formed by extensive branching of the invading hyphae, the resulting arbuscules appear as squares filling the entire cavity of the cortex cell. In fatm-1 and fatm-2 mutants, arbuscules branching was arrested, giving rise to stunted arbuscules that remaining small in comparison. Besides stunted arbuscules, normal, fully branches arbuscules were occasionally present in both fatm-1 and fatm-2. Fungal structures are indicated by letters and lines; v, vesicles; a, fully-branched WT arbuscule; eh, extraradical hyphae; ih, intraradical hyphae; a*, stunted arbuscule with arrested development. Bars, 50 µm.

80
stunted arbuscules occurred were generally not associated with vesicles. The hyphae in the two
mutant roots exhibited regular morphology which was not affected by the fatm mutation. Thus,
the fatm mutation leads to distortion of hyphal fine-branching in the later stage of arbuscule
formation, causing the occurrence of stunted, immature, non-functional arbuscules. These are not
associated with the progression in fungal life cycle but indicate premature abortion of a functional
symbiosis.
3.1.5 Arbuscule Branching and Root Colonization is restored by genetic Complementation of fatm-1
To confirm that arbuscule fine-branching is distorted due to the fatm mutation, genetic
complementation was done. To this purpose, the 2 kb promoter region upstream of FatM was
used to express the FatM gene sequence. The construct was introduced into A. rhizogenes and
employed for transient transformation of fatm-1 and WT L. japonicus. Transiently transformed L.
japonicus roots were then inoculated with R. irregularis (Figure 8). To inspect AMF performance,
colonization parameters were quantified and arbuscule morphology inspected. Infection sites
with exclusively stunted arbuscules were still observed in fatm-1 containing the empty vector
control. In the complemented line, arbuscles were fully developing after expression of the FatM
gene (Figure 8a). Consistent with the restoration of arbuscule branching, the root colonization
rate returned to levels almost equal to WT. This was observed with regard to total colonization
and the frequency of intraradical hyphae and arbuscules (Figure 8b). Only the percentage of
vesicles in the colonized roots was not complemented completely, but still increased compared to
fatm-1 (EV). These results confirm that the fatm mutation caused the reduced AMF colonization
and, more specifically, the arbuscule fine-branching defect.
3.1.6 Lipid with Mycorrhiza-desaturation Signature are decreased in colonized fatm Mutants
Mycorrhiza-colonized and non-colonized plant roots differ in their lipidome. When
colonized with R. irregularis, the plant lipid composition is changed and in addition, lipids from
the mycorrhiza fungus can be detected in colonized roots (Wewer et al., 2014). To study changes
in plant and mycorrhiza lipid composition, lipids were measured in colonized roots and
mock-inoculated roots of WT and fatm-1 mutants. Colonized roots compromise a mixed sample
with plant and fungal lipids, and in addition, the plant lipid composition can be changed in
response to colonization with AMF.

81
Figure 8: Genetic Complementation of defective Arbuscule Morphology in the fatm-1 mutant. a) Hairy roots of fatm-1 were transformed with Agrobacterium rhizogenes carrying an empty vector (EV) or a construct with the FatM promoter and gene (pFatM:gFatM). After infection with R. irregularis, fungal structures in the roots were stained with WGA Alexa Fluor 488 and observed under a confocal microscope at 25-fold and 63-fold magnification. Stunted arbuscules were observed in fatm-1 (EV), but arbuscule branching was restored in fatm-1 complemented with pFatM:gFatM. a, fully branched WT arbuscules; a*, mutant arbuscules with stunted appearance. Bars, 25 µm. b) Quantification of colonization parameters in the same lines shown in a). Fungal structures were counted with the grid-line intersection method. Different letters indicate significant differences (ANOVA; post-hoc Tukey; n = 14; p < 0.001) among genotypes for each fungal structure (Total, Intraradical Hyphae, Arbuscules, Vesicles). Total and intraradical hyphae, n= 14, p ≤ 0.01; arbuscules, p ≤ 0.005; vesicles, p ≤ 0.01.
82
The membrane-forming phospholipids and galactolipids as well as non-membrane
forming neutral lipids (triacylglycerol) were measured in colonized WT, fatm-1 and fatm-2. The
most abundant mycorrhiza-signature fatty acid is palmitvaccenic acid (16:1ω5) (Olsson and
Johansen, 2000). Additional to this marker fatty acid, the highly desaturated fatty acids 20:3, 20:4
and 20:5 are found in R. irregularis and not in the plant root. Another abundant fatty acid in the
fungal tissue is 16:0, but this fatty acid also is a major fatty acid in the plant. Membrane forming
phospholipids and galactolipids acylated with 16:1, 16:0 and 20:3/4/5 did not accumulate to the
same extent in colonized fatm mutants as they did after colonization with mycorrhiza in the WT
(Appendix 7.8).
The most abundant lipid in the fungal cytoplasm is triacylglycerol (TAG) (Olsson et al.,
2003). The TAG molecular species that contain mycorrhiza specific fatty acids were substantially
decreased in colonized fatm, especially the triacylglycerols tri-16:1 (48:3), di-16:1-16:0 (48:2)
and 16:1-di-16:0 (48:1) (Appendix 7.8). They are the main triacylglycerol forms in R. irregularis
and very prominently accumulate in vesicles and spores. Diacylgycerol (DAG) molecular species
with 16:0 and 16:1 were as well decreased in colonized fatm mutants. DAG is a precursor for TAG
synthesis.
Concordantly, the reduction in membrane forming and neutral glycerolipids containing
mycorrhiza-signature fatty acids in fatm mutant plants was also reflected in the composition of
total fatty acids (Figure 9). Palmitvaccenic acid occurs only in colonized roots and was the most
abundant fatty acid in WT colonized roots at 7 wpi. The degree of root colonization is reflected in
the amount of 16:1ω5, as it increases during colonization (Schliemann et al., 2008). At 7 wpi, 16:0,
and to a lesser extent, other mycorrhiza-marker fatty acids (18:1ω7 and 20:3) accumulation in
colonized fatm mutants. Noteworthy, the minor fatty acids 14:0, 22:0 and 24:0 accumulated in WT
at 7 wpi, while they remained less abundant in fatm-1 and fatm-2, even though these fatty acids
are not typical signature fatty acids for mycorrhiza fungi. The decreased amounts of
mycorrhiza-signature lipids and fatty acids reflect the decrease in fungal biomass in colonized
fatm roots, in agreement with the results obtained after root staining and microscopy (see 3.1.3).
However, detailed lipid and fatty acid analysis showed in addition that the most prominent
decrease is observed for 16:1/16:0-containing TAG, even after 7 wpi in fatm-2 (Figure 9c), which
showed a similar total colonization as WT (Figure 9a). This is consistent with the decreased vesicle
frequency and smaller vesicle size in the two fatm mutant roots (Figure 9c, d). Hence, the
deficiency in storage lipid accumulation correlates with decreased vesicle frequency and
occurrence of smaller vesicles.
3.1.6.1 Glycerolipids and Fatty Acids

83
Figure 9: Comparison of Mycorrhiza-Signature Fatty Acids in total Fatty Acids from L. japonicus WT and fatm mutant Roots. a) Total fatty acids from whole root systems of myc-inoculated WT Gifu or fatm mutant roots at 4 wpi (n=4). b) Total fatty acids from whole root systems infected with R. irregularis at 4 wpi. c) Total fatty acids from whole root system infected with R. irregularis at 7 wpi. (n=3). Total fatty acids were hydrolyzed from crude lipid extracts via transmethylation, generating fatty acid methyl esters that were quantified by GC-FID and identified by GC-MS. Mycorrhiza signature fatty acids accumulate upon colonization with R. irregularis, but to a lesser extent in fatm mutants than in WT at 4 wpi and 7wpi. R, Fatty acids originating from R. irregularis; n.d., not detected; +myc, inoculated with R. irregularis; +mock, inoculated with mycorrhiza carrier material; WT Gifu, Wild type ecotype Gifu; WT seg, LORE1 segregating wild type allele of fatm-1. All graphs represent average values, error bars depict standard deviation. One-way ANOVA with post-hoc Tukey, different letters indicate significant differences (P < 0.05).

84
To investigate changes in storage and membrane lipid fatty acids more closely, total lipids
were seperated into two fractions: neutral lipids (storage lipids) and polar lipids (membrane
lipids). Fatty acid methyl esters were then generated and quantified by GC-FID (Figure 10). In WT
and fatm 1, the amounts of mycorrhiza-specific neutral lipid fatty acids (NLFA) were higher (7.04
nmol mg FW-1 for WT and 0.89 nmol mg FW-1 for fatm-1) than mycorrhiza-specific polar lipid fatty
acids (PLFA) (0.66 nmol mg FW-1 in WT and 0.14 nmol mg FW-1 in fatm -1) (Figure 10a). In both
fractions, mycorrhiza-signature fatty acids were decreased in colonized fatm-1, as shown before.
To visualize the differential decrease between 16:1ω5 and 20:3, the fold change (WTseg/fatm-1)
was plotted (Figure 10b).
Here, a 11-fold decrease in 16:1ω5-NLFA and a 9.7-fold decrease in mycorrhiza-specific PLFA was
obtained (Figure 10a). This shows that even though 16:1ω5-NLFA is more abundant, the ratio of
reduction due to the fatm mutation is nearly the same as for 16:1ω5-PLFA. This was also true for
20:3 fatty acid, but with an overall less ratio of reduction of 2.9 in NLFA and 2.3 in PLFA.
Theseanalyses show that the main deficit of R. irregularis growing in fatm-1 is the synthesis of
16:1ω5, regardless of the lipid fraction, and 20:3 synthesis is less affected. It has previously been
proposed that a 16:0 containing lipid might be the substrate for transfer to the fungus from the
plant, in addition to carbohydrates (possibly glucose) (Bravo et al., 2017; Keymer et al., 2017).
Furthermore, 16:0 is the substrate for 16:1ω5 synthesis by desaturation in the fungus (see 3.2).
The deficit in accumulation of 16:1ω5 is therefore consistent with these findings and likely
represents decreased 16:0 fatty acid transfer in fatm.
The distribution of sterols in roots changes after mycorrhiza colonization, especially the free
sterol and sterol ester contents increase with extended colonization (Fontaine 2001; Olsson et al.,
2003; Wewer et al., 2014). Mycorrhiza fungi are exceptional as they do not accumulate ergosterol
as most fungi, but instead contain high amounts of 24-methylcholesterol and 24-ethylcholesterol
(Fontaine et al., 2004; Grandmougin-Ferjani et al., 1999; Olsson et al., 2003) (Figure 11).
24-methylcholesterol is structurally related to the phytosterol campesterol and
24-ethylcholesterol to the phytosterol sitosterol. They could not be differentiated by GC-MS
analysis. Sterol quantification in R. irregularis extraradical mycelium confirmed that
24-methylcholesterol and 24-ethylcholesterol make up the bulk amount of free sterols in
mycorrhiza tissue (59.1 mol% and 33.0 mol%, respectively), while cholesterol,
24-ethylcholesta-5,22-dienol (structurally related to stigmasterol) and lanosterol are only minor
components (Figure 11b).
3.1.6.2 Comparison between Neutral Lipid Fatty Acids and Polar Lipid Fatty Acids
3.1.6.3 Free Sterols

85
The 24-methylcholesterol content can serve as biomarker for successful colonization and
interaction of the mycorrhiza fungus with the plant host (Fontaine et al., 2004). Here, it was used
as non-fatty acid, lipid-biomarker for mycorrhiza in the colonized fatm-1 and WT Lotus roots
(Figure 11c, d). 24-methylcholesterol accumulated due to colonization with R. irregularis in the
WT control to 0.347 nmol mg FW-1 (35.45 mol%) and remained decreased in fatm-1 (0.243 nmol
mg FW-1; 27.32 mol%). Consequently, 24-ethylchole-sta-5,22-dienol (stigmasterol) showed a
relative and absolute increase in fatm-1 with mycorrhiza (44.51 mol% in fatm-1 to 32.36 mol% in
WT and 0.40 nmol mg FW-1 over 0.32 nmol mg FW-1), possibly indicating that stigmasterol
synthesis is depressed in colonized WT, but to a lesser extent depressed in colonized fatm-1.
24-methylcholesterol could not be distinguished from campesterol, which was detected in plant
roots without mycorrhiza, although it only accounts for ~5 mol% of total free plant sterols
Figure 10: Mycorrhiza-Signature Fatty Acids are differentially reduced in colonized fatm-1 Mutants. a) Colonized roots after seven weeks of inoculation where used to extract total lipids, which were divided by solid-phase extraction into neutral lipids and polar lipids. Fatty acids were transmethylated from lipids and measured as fatty acid methyl esters on GC-FID (n=4). b) The amount of mycorrhiza signature fatty acids 16:1ω5 and 20:3 in the WT were divided by the amounts in fatm-1 to obtain the fold-change reduction in NLFA and PLFA. Albeit both fatty acids are biomarkers for mycorrhiza colonization, 20:3 shows a less severe decrease in accumulation upon mycorrhiza proliferation. NLFA, Neutral Lipid Fatty Acids; PLFA, Polar Lipid Fatty Acids; WT seg, LORE1 segregating wild type allele of fatm-1. All graphs represent average values, error bars depict standard deviation. Student’s t-test (**P < 0.01).

86
(Wewer et al., 2014) and can therefore be neglected when using 24-methylcholesterol as
mycorrhiza lipid biomarker. Free sterols are typical membrane constituents in eukaryotes
(Schaeffer et al., 2001) and 24-methylcholesterol therefore serves as a measure of fungal
membranes in colonized roots. The decrease in 24-methylcholesterol in fatm-1 therefore confirms
a decrease in fungal biomass as shown earlier with staining and fatty acid measurements (see
3.1.3 and 3.1.6.1).
Figure 11: Membrane Sterol Lipid Quantification in R. irregularis extraradical Mycelium and colonized L. japonicus WT and fatm-1 Mutant Roots. a,b) Free sterols were extracted from R. irregularis ERM and D. carota colonized roots grown in axenic root culture after 86 d. (n=6). c,d) Free sterols were measured in colonized roots of L. japonicus in a WT control and fatm-1 mutant at 7 wpi (n=4). Free sterols were obtained from crude lipid extracts by solid-phase extraction and measured on GC-MS as trimethylsilyl ethers. The most abundant membrane-forming sterol in R. irregularis is 24-methylcholesterol that is used as non-fatty acid lipid biomarker. In fatm-1, it fails to accumulate to the same amount as in WT, reflecting decreased amount of fungal membranes. ERM, Extraradical mycelium; WT seg, LORE1 segregating wild type allele of fatm-1; +myc, inoculated with R. irregularis. All graphs represent average values, error bars depict standard deviation. Student’s t-test (*P < 0.05; **P < 0.01).

87
3.1.7 β-Monoacylglycerol has a Mycorrhiza-signature and is decreased in Colonized fatm Mutants
Monoacylglycerol (MAG) with 16:0 fatty acid attached to the sn-2 position of sn-glycerol
(ß-MAG) is the main product of the GLYCEROL-3-PHOSPHATE ACYLTRANSFERASE (GPAT)
REDUCED ARBUSCULAR MYCORRHIZA 2 (RAM2) that has acyltransferase and phosphatase
activity (Luginbuehl et al., 2017). The RAM2 gene is highly expressed in roots colonized with
mycorrhiza, similar to FatM (Gomez et al., 2009; Wang et al., 2012). In plants, β-MAGs are
precursors for the polyesters suberin and cutin that are suggested to be secreted to the apoplast
(Beisson et al., 2012; Yadav et al., 2014). Therefore, 16:0 β-MAG could play a role in lipid secretion
to the fungus. To detect MAGs with a mycorrhiza-signature, the same approach was used as
described for other glycerolipids and free sterols. This approach utilizes the information from
isolated extraradical mycelium (ERM) of R. irregularis from monoxenic root culture with D. carota
to identify lipids specific for R. irregularis. These accumulate to high abundance in the ERM and to
a lesser extent in the colonized roots. For a detailed investigation of MAG accumulation during
spore formation, ERM was harvested from the root compartment (RC) and the fungal
compartment (FC) of a D. carota/R. irregularis culture. ERM from the RC contained less spores
than ERM from the FC, due to the space restrictions in the RC. The sn-1/3-acylated MAGs (α-MAG)
were seperated from β-MAGs in GC-MS analysis of SPE-lipid fractions. The positional isomers of
α-MAG (sn-1 MAG, sn-3 MAG) could not be seperated by GC-MS and were therefore quantified
together.
Several α-MAGs were detected that accumulate in the ERM and are therefore fungal
specific (Figure 12a). The most prominent one was α-MAG acylated with the signature fatty acid
16:1ω5. It accumulated to 71.96 mol% of all α-MAGs in ERM extracted from the FC, to 34.42 mol%
in ERM from the RC and to 4.26 mol% in the colonized roots (Figure 12b). The same signature was
observed for 20:5, 20:4 and 20:3 α-MAGs, albeit these were under the detection limit for the
samples from the root compartment and the colonized roots and accumulated to a smaller degree
in the ERM from the FC (20:3 to 0.23 mol%). In ERM from the FC, the number of spores is greatly
increased. Thus, with increasing spore number, the amount of 16:1ω5 α-MAG also increased. This
was also true for the absolute amount of 16:0 α-MAG, which is a MAG species that occurs in the
plant and the fungus. However, when plotted in mol% of all α-MAGs (Figure 12b), the increase in
16:1ω5 α-MAG in fungal tissue was accompanied by a relative decrease of 16:0 α-MAG. The
relative proportion (mol%) was reduced from 60.63 mol% in colonized roots to 49.82 mol% in
ERM (RC) and to 22.41 mol% in ERM (FC). Most MAG molecular species were also detected in the
β configuration, but their overall concentration was less than α-MAGs (Figure 12c,d). The
distribution of mycorrhiza-marker β-MAGs was the same as for α-MAGs. 16:1ω5 β-MAG was the
most abundant marker and the absolute amount also decreased when less fungal biomass was
present in the sample (FC>RC>colonized roots).

88
The same was observed for 16:0 β-MAG. Noteworthy, 16:1ω5 β-MAG was present in the
mixed tissue of the colonized D. carota roots as well, which likely reflects the high amount of fungal
biomass in these roots that have a colonization rate of ~100%. Interestingly, 20:3 β-MAG was the
third most abundant β-MAG in FC-ERM (18.78 mol%) and was under the detection limit in
RC-ERM and colonized roots. These findings reveal that β-MAGs, even though they are likely produ
ced by the plant via RAM2, accumulate to a large degree in fungal mycelium, prominently in
spores. They therefore could represent intermediates in TAG synthesis in IRM and ERM.
In addition to axenic root cultures, MAGs were also measured and compared between
colonized and mock-inoculated L. japonicus roots at 7 wpi (Figure 13a, b). The previously
Figure 12: Identification of Monoacylglycerol molecular Species with a Mycorrhiza-Signature. a,b) Absolute (nmol mg FW-1) and relative (mol%) quantification of sn-1/3-acylated α-MAGs in R. irregularis ERM and D. carota colonized with R. irregularis. c,d) Absolute (nmol mg FW-1) and relative (mol%) quantification of sn-2-acylated β-MAGs in R. irregularis ERM and D. carota colonized with R. irregularis. R. irregularis was grown in monoxenic root culture in symbiosis with A. rhizogenes-transformed, hairy roots of D. carota as host in a petri dish system with two compartments. The root compartment (RC) contained colonized roots and extraradical mycelium growing into the medium, where the fungal compartment (FC) contained only extraradical mycelium (spores and hyphae). The number of spores and hyphae is larger in the fungal compartment. After extraction of tissue from the medium, MAGs were seperated, detected and quantified by GC-MS (n=3). FC, Fungal compartments; RC, Root compartment; ERM, Extraradical mycelium; R, Fatty acids originating from R. irregularis; n.d., not detected; +myc, infected with R. irregularis. All graphs represent average values, error bars depict standard deviation. One-way ANOVA with post-hoc Tukey, different letters indicate significant differences (P < 0.05).
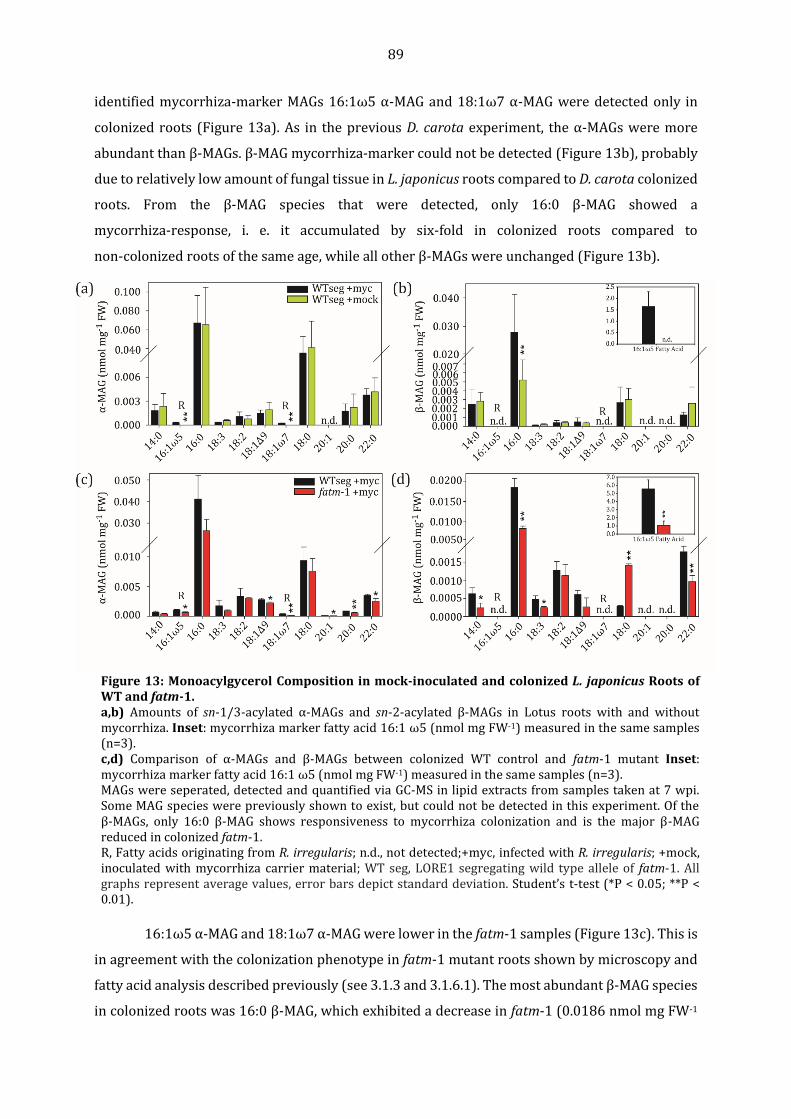
89
identified mycorrhiza-marker MAGs 16:1ω5 α-MAG and 18:1ω7 α-MAG were detected only in
colonized roots (Figure 13a). As in the previous D. carota experiment, the α-MAGs were more
abundant than β-MAGs. β-MAG mycorrhiza-marker could not be detected (Figure 13b), probably
due to relatively low amount of fungal tissue in L. japonicus roots compared to D. carota colonized
roots. From the β-MAG species that were detected, only 16:0 β-MAG showed a
mycorrhiza-response, i. e. it accumulated by six-fold in colonized roots compared to
non-colonized roots of the same age, while all other β-MAGs were unchanged (Figure 13b).
16:1ω5 α-MAG and 18:1ω7 α-MAG were lower in the fatm-1 samples (Figure 13c). This is
in agreement with the colonization phenotype in fatm-1 mutant roots shown by microscopy and
fatty acid analysis described previously (see 3.1.3 and 3.1.6.1). The most abundant β-MAG species
in colonized roots was 16:0 β-MAG, which exhibited a decrease in fatm-1 (0.0186 nmol mg FW-1
Figure 13: Monoacylgycerol Composition in mock-inoculated and colonized L. japonicus Roots of WT and fatm-1. a,b) Amounts of sn-1/3-acylated α-MAGs and sn-2-acylated β-MAGs in Lotus roots with and without mycorrhiza. Inset: mycorrhiza marker fatty acid 16:1 ω5 (nmol mg FW-1) measured in the same samples (n=3). c,d) Comparison of α-MAGs and β-MAGs between colonized WT control and fatm-1 mutant Inset: mycorrhiza marker fatty acid 16:1 ω5 (nmol mg FW-1) measured in the same samples (n=3). MAGs were seperated, detected and quantified via GC-MS in lipid extracts from samples taken at 7 wpi. Some MAG species were previously shown to exist, but could not be detected in this experiment. Of the β-MAGs, only 16:0 β-MAG shows responsiveness to mycorrhiza colonization and is the major β-MAG reduced in colonized fatm-1. R, Fatty acids originating from R. irregularis; n.d., not detected;+myc, infected with R. irregularis; +mock, inoculated with mycorrhiza carrier material; WT seg, LORE1 segregating wild type allele of fatm-1. All graphs represent average values, error bars depict standard deviation. Student’s t-test (*P < 0.05; **P < 0.01).

90
in WT to 0.0083 nmol mg FW-1 in fatm-1, figure 13d). In addition, 14:0 β-MAG was reduced as well,
albeit the total amount was less than 16:0 β-MAG. 16:0 β-MAG is the preferred product of the
mycorrhiza-specific RAM2 enzyme and the second most abundant product is 14:0 β-MAG
(Luginbuehl et al., 2017). Thus, the decrease in 16:0 β-MAG and 14:0 β-MAG in fatm-1 could reflect
decreased RAM2 activity in these mutants. The content of 18:0 β-MAG was five-fold increased in
fatm-1 (Figure 13d). Even though RAM2 prefers 16:0-CoA and 14:0-CoA as fatty acid donor, it can
also act on 18:0-CoA. Therefore, accumulation of 18:0 β-MAG in fatm-1 might reflect alternative
substrate activity by RAM2 and thus could also represent a shift from 14:0/16:0-symbiotic fatty
acid transfer to 18:0 fatty acids. Alternatively, the 18:0 β-MAG in colonized fatm-1 could
accumulate in in the plant, because 18:0 β-MAG is a less accepted substrate for secretion to the
fungus. As a control of the degree of fungal colonization and lipid accumulation in L. japonicus
roots used for MAG analysis, 16:1ω5 total fatty acid was measured (Figure 13b,d, insets). A ~30%
total root colonization is reflected by 0.5—1 nmol mg FW-1 16:1ω5, and 8—12 nmol mg FW-1 is
equivalent to 90—100% root colonization. This was done to ensure comparability between the
different measurements and as the control of the degree of colonization with R. irregularis. Thus,
both sample sets were shown to be well-colonized and accumulated considerable amounts of
fungal lipids (1.64 and 5.55 nmol mg FW-1 for WTseg +myc, see figure 13b inset and figure 13d
inset, respectively).
3.1.8 The Mycorrhiza-specific LjFatM Acyl-ACP Thioesterase preferentially hydrolyses Palmitoyl-ACP
The L. japonicus acyl-ACP thioesterases LjFatM was heterologously expressed in E. coli
(Figure 14). The cloned coding sequence encodes a truncated protein that was cloned without the
predicted N-terminal transit peptide (LjFatMΔtp), resulting in the expression of a recombinant
protein with the predicted size of 40.52 kDa (Figure 14a). Thioesterase activity for LjFatMΔtp was
investigated by expression in the E. coli fadD mutant, which lacks acyl-CoA synthethase activity
and therefore accumulates free fatty acids upon over-expression of thioesterases. The
accumulation of free fatty acids can serve as indicator for thioestease activity (Jing et al., 2011). A
large fraction of the free fatty acids are secreted to the medium. Therefore, free fatty acids were
measured in entire cultures (including liquid medium) of E. coli fadD cells harboring an empty
vector or the LjFatMΔtp construct.
LjFatMΔtp-expressing E. coli fadD mutants accumulated 14:0, 16:0, 16:1Δ9, and 18:1Δ9 free
fatty acids, resulting in a total five-fold accumulation of free fatty acids, compared to EV fadD
control (Figure 14b). Here, the acyl-ACP substrate availability depends on the acyl-ACP pattern of
E. coli and is therefore different from plant plastids. To study the substrate preferences in detail,
recombinant enzyme assays with equal substrate amounts were conducted.

91
Recombinant LjFatM was purified from E. coli via affinity-chromatography on nickel
columns using the N-terminal His-tag. Purified, recombinant LjFatM was incubated in seperate
reactions with a range of 14C-acyl-ACP substrates at the same concentrations. The radioactivity of
the hydrolyzed free fatty acids served as measure of thioesterase activity (Figure 14c). The
reactions containing 16:0-ACP were hydrolyzed with the highest rate by LjFatM, while 18:0-ACP
was the second preferred substrate. The substrates 18:1Δ9-ACP and 14:0-ACP were also
hydrolyzed to some degree, while 10:0-ACP and 12:0-ACP, representing very uncommon fatty
Figure 14: Expression of L. Japonicus acyl-ACP Thioesterase FatM in E. coli and in vitro Enzyme Assay with recombiant FatM. a) Western blot from E. coli fadD cultures expressing LjatM. Cultures were inoculated from ON cultures and induced with 1 mM IPTG at OD600=0.5 and incubated at 28°C, 37°C or 16°C ON. The calculated size of the recombinant protein without transit peptide and including the N-terminal His-Tag is 40.51 kDa (red asterisk). Incubation at 28°C and 37°C resulted in the presence of an unspecific band slightly above the 32 kDa marker. For subsequent determination of thioestease activity (b) and protein purification (c), cultures were incubated at 16°C after induction with IPTG. b) Free Fatty Acid Quantification with GC-FID from cell pellets of E. coli fadD expresising LjFatM at 16°C ON after induction with IPTG (n=3). c) In vitro enzyme assay of LjFatM. Recombinant FatM was His-Tag purified and incubated with various 14C-marked acyl-ACP substrates in seperate reactions. The radioactivity of the extracted free fatty acids from the thioesterase reaction indicated the enzyme substrate preferences (n=3). M, Protein size marker; LjatM, L. japonicus acyl-ACP thioesterase M; EV, Empty vector control. All graphs represent average values, error bars depict standard deviation. Student’s t-test (*P < 0.05; **P < 0.01).

92
acids in L. japonicus, were not hydrolyzed. Thus, LjFatM prefers palmitoyl-ACP as substrate, which
coincides with its homology to Arabidopsis AtFatB and is consistent with the proposed role in
feeding palmitic acid to the mycorrhiza fungus.
3.1.9 Substrate Specificities of the non-Mycorrhiza-specific Acyl-ACP Thioesterases LjFatA and LjFatB
Upon mycorrhiza colonization, plants must ensure that acyl-lipid synthesis for plant
metabolism is seperated from acyl-lipids destined for secretion to the fungus. As plants also
depend on plastidial fatty acid supply, the acyl-ACP thioesterases that are not engaged in
mycorrhiza colonization, LjFatA and LjFatB, where characterized biochemically. Similar to LjFatM,
truncated coding sequences of LjFatA and LjFatB were expressed in E. coli and purified for an in
vitro enzyme assay (Figure 15). The calculated sizes of the recombinant proteins without
predicted N-terminal transit peptides are 37.26 kDA (LjFatAΔtp) and 41.76 kDa (LjFatBΔtp). The
western blot from induced E. coli fadD cultures showed specific His-tag signals for the two
proteins close to the 46 kDa marker (Figure 15a). Consistent with the predicted sizes, the band
for LjFatBΔtp was slightly bigger than for LjFatAΔtp. The blot signals also indicated that LjFatA
expression was stronger than LjFatB, which might explain why purification of LjFatB was
unsuccessful.
The amounts of the monounsaturated free fatty acids 16:1Δ9 and 18:1Δ11, which
accumulated in E. coli fadD, where higher when LjFatA was expressed compared to expression of
LjFatB. Although in both cultures, these fatty acids accumulated stronger than in the EV control
(Figure 15b). While 16:0 free fatty acid only comprised a small proportion of the accumulating
free fatty acids in both cultures, 14:0 free fatty acid was additionally increased in the cultures
expressing LjFatB. This coincides with the preference of FatB-type thioesterases for saturated
acyl-ACPs, while the FatA-types prefer monounsaturated acyl-ACPs. However, as described
bevore (see 3.1.8), the accumulation of free fatty acids in E. coli fadD is also influenced by the
endogenous concentrations of acyl-ACPs and not only by acyl-ACP thioesterase substrate
specificities. Therefore, in vitro enzyme assays were conducted for LjFatA and LjFatB as well
(Figure 15c,d). LjFatA revealed acyl-ACP substrate preference for 18:1Δ9-ACP>18:0-ACP>
16:0-ACP>14:0-ACP>12:0-ACP and 10:0-ACP (Figure 15c). Recombinant LjFatB enzyme could not
unequivocally be purified from E. coli, probably due to weaker expression than LjFatA (see above).
Therefore, the crude soluble protein extracted from E. coli ElectroSHOX cells subsequent to
IPTG-induction were incubated with the 14C-Acyl-ACPs, and thioesterase activity calculated
compared to a control using total soluble protein from induced EV cultures (Figure 15d). Acyl-ACP
thioesterase activity in E. coli EV ElectroSHOX resembled the pattern of free fatty acids shown
before for E. coli EV fadD (Figure 15b): 16:0>14:0>18:1Δ11>12:0>18:0 and 10:0.

93
Figure 15: Expression of L. Japonicus Acyl-ACP Thioesterases FatA and FatB not involved in AM Symbiosis in E. coli and in vitro Enzyme Assay with Recombinant Protein. a) Western blot from E. coli fadD cultures expressing LjFatA or LjFatB. Cultures were inoculated from ON cultures and induced with 1 mM IPTG at OD600=0.5 and incubated at 16°C ON. The calculated sizes of the recombinant proteins without transit peptides and including the N-terminal His-Tags are 37.26 kDa for LjFATA and 41.76 kDa for LjFATB (red asterisks). b) Free Fatty Acid Quantification with GC-FID from cell pellets of E. coli fadD expresising LjFatA and LjFatB at 16°C ON after induction with IPTG (n=3). c,d) Acyl-ACP thiosterase enzyme assays. His-Tag purified LjFatA or total soluble protein from induced E. coli ElectroSHOX expressing LjFatB and an EV control were incubated with various 14C-labeled acyl-ACP substrates in seperate reactions. The radioactivity of the extracted free fatty acids from the thioesterase reaction indicated the enzyme substrate preferences (n=3). M, Protein size marker; LjFatA, B, L. japonicus acyl-ACP thioesterase A,B; EV, Empty vector control. All graphs represent average values, error bars depict standard deviation. Student’s t-test (*P < 0.05; **P < 0.01).

94
The thioesterase activity in E. coli electroSHOX expressing LjFatB deviates from that
pattern as 16:0-ACP was hydrolyzed at a higher rate than in the EV control and furthermore,
18:1Δ9 was the second most preferred substrate, next to 18:0-ACP and a small portion of
10:0-ACP, which both are minor substrates for LjFatB. Thioesterase activity for 12:0-ACP and
14:0-ACP were similar to EV control, even though E. coli fadD expressing LjFatB showed 14:0 free
fatty acid accumulation (Figure 15b).
3.1.10 Labeling of de novo synthesized Fatty Acids with 13C-Acetate reveals a Flux of Fatty Acids from the Plant to the Fungus via FatM
To monitor fatty acid de novo synthesis and symbiotic lipid transfer to the fungus, a
labeling experiment with 13C-acetate was set up. When presenting roots with acetate, it is taken
up by the root into the apoplast and enters the root cytoplasm where it is imported into the plastid
and converted into acetyl-CoA by acetyl-CoA synthethase (Lin and Oliver, 2008). Acetyl-CoA is
subsequently utilized for de novo synthesis of fatty acids. Due to the absence of FAS from R.
irregularis, acetate is likely not incorporated into 16:0 fatty acids, one of the main products of de
novo fatty acid synthesis (see Figure 1), but can be taken up by hyphae of R. irregularis and used
for elongation of C16 fatty acids to C18, C20 and C22 fatty acids. The profile of 13C-labeled fatty
acids was compared for mock-inoculated and mycorrhiza-colonized WT and fatm-1 plants.
Colonized roots were submerged in buffer with 13C2-acetate and incubated ON for labeling of fatty
acids and symbiotic lipid transfer to the fungus. Finally, total fatty acids were hydrolyzed from
total lipid extracts and the amount of 13C-label quantified with Q-TOF LC-MS/MS and GC-MS
(Figure 16).
The utilization of 13C2-acetate for de novo synthesis of fatty acids led to the occurrence of
fatty acids containing 1—16 13C atoms, called isotopologs. When successfully labeled with
exogenously applied 13C2acetate, the abundance of the fatty acid 13C-isotopologs differs from the
naturally occurring isotpologs. The percentage of natural 13C isotopologs was predicted (Isotope
Distribution Calculator; www.sisweb.com) and experimentally verified by measuring fatty acids
from non-labeled plants. Substraction of the natural isotopologs from the 13C-isotopologs in the
acetate-labeled samples gave rise to the 13C over-excess value that represents the absolute amount
of incorporated 13C in 13C2-acetate labeling. Even chain isotoplogs (13C2, 13C4, 13C6 e.t.c) were
typically more abundant than uneven ones, which is characteristic for direct incorporation of
13C2-acetate as 13C2-acetyl-CoA in de novo synthesis (see Figure 1).
The 13C over-excess label was present in all major fatty acids (Figure 16a). For all labeled
fatty acids, the highest peak was the 13C2-isotopolog and the amount of label incorporated into
fatty acids was decreased with increasing number of 13C atoms present. In the fatty acid isotpologs
of 16:1ω5 fatty acid, 13C6—13C16 were not detected, in 20:3 fatty acid, 13C11—13C20 could not be
detected, 13C17—13C18 could not be detected in 16:0 and 18:2 fatty acid and 13C14—13C18 were
95
absent from 18:0 fatty acid. The sum of all 13C over-excess isotopologs were compared per fatty
acid (Figure 16b). In WT, colonization with R. irregularis led to increased abundance of 13C over-
excess label in all fatty acids compared to mock-inoculated roots. The highest sum of over-excess
label was obtained for the mycorrhiza-signature fatty acid 16:1ω5. The fatty acids 16:0, 18:2 and
18:1 were also abundantly labeled and some over-excess label was still detectable in 18:0 and
20:3. In colonized fatm-1, the 13C over-excess label did not accumulate in mycorrhiza-signature
fatty acids 16:1ω5 and 20:3. In 16:1ω5, it was decreased six-fold from 0.12 nmol mg FW-1 OE to
0.02 nmol mg FW-1 OE and three-fold in 20:3 from 0.013 nmol mg FW-1 OE in WT to 0.0039 nmol
mg FW-1 OE in fatm-1. Furthermore, the 13C over-excess label was increased in all other fatty acids,
noticeably in 18:2 and 18:0 (two-fold increases), but also in 16:0 and 18:1, albeit to a lesser extent.
This shows a redirection of 13C2-acetate into synthesis of typical plant fatty acids when symbiotic
fatty acid transfer is hindered.
To investigate whether the incorporation of 13C from 13C2-acetate into fungal fatty acids
was influenced by the differences in fungal biomass in fatm-1 and WT (see 3.1.3 and 3.1.6), the
sum of over-excess 13C was divided by the amount of total fatty acid isotopologs (12C+13C)
measured by GC-FID (Figure 17a). The labeling pattern was the same as shown for absolute
amounts before (Figure 16), except for 18:1 fatty acid, where the relative 13C over-excess label
was higher for mock-inoculated than for colonized roots (Figure 17b and Figure 17c). Importantly,
the relative incorporation of 13C over-excess label in mycorrhiza-signature fatty acids 16:1ω5 and
20:3 in was consistently decreased in colonized fatm-1 compared to WT (Figure 17c). Thus,
reduced 13C over-excess label in mycorrhiza-fatty acids in colonized fatm-1 is not due to decrease
in total fungal biomass, but due to a specific effect caused by the fatm mutation, i. e. a block in
symbiotic fatty acid transfer.
To compare the symbiotic fatty acid transfer at different symbiotic stages (i. e. 4 and 9
wpi), the percentage distribution of the 13C over-excess fatty acids was calculated (Figure 18). To
this end, the total amount of 13C over-excess fatty acids was defined as 100% and the relative
proportion of 13C over-excess of every individual fatty acid calculated. The proportion of 13C over-
excess in the mycorrhiza-signature fatty acids 16:1ω5 and 20:3 was highest (43.5%) in colonized
WT (Figure 18a). It was prominently high in 16:1ω5 (38.5%) compared to 20:3 (4.9%). The 13C
over-excess label in 16:0 cannot clearly be assigned to the plant or fungus, although the fungus
likely cannot utilize 13C2-acetate for 16:0 synthesis. Therefore, as a conservative estimation, at
least 38.5% (% of total 13C over-excess label in 16:1ω5 at 4 wpi in WT) of de novo synthesized
fatty acids are transferred in the ~12 h (ON) labeling period, from the plant to the fungus at the 4
wpi growth stage in the functional symbiosis with WT L. japonicus. The fraction of 13C over-excess
label in mycorrhiza-signature fatty acids is reduced with progression of the symbiosis, so that at
9 wpi, 19.5% (% 13C over-excces of 16:1ω5 + 20:3) of these are labeled in colonized WT.

96
Figure 16: 13C-Acetate Labeling of Fatty Acids during Symbiosis in WT and fatm-1 Roots at 4wpi. The absolute amoutns of 13C over-excess fatty acids were quantified. a) Roots of WT and fatm-1 mutant plants were submerged in 13C-acetate buffer for labeling of fatty acids ON. Lipids were extracted and hydrolyzed and 13C-fatty acid isotopologs quantified with Q-TOF LC-MS/MS, except for 16:1ω5, which was measured with GC-MS. The amount of naturally-occurring 13C was subtracted, yielding 13C-over excess values. The number on thex-axis indicates the isotopologs, i. e. the respective fatty acid containing an increasing number of 13C-carbons originating from 13C-acetate (n=3). b) Sum of the individual 13C-isotopologs depicted in a) (n=3). The 13C-acetate is used for plastidial fatty acid de novo synthesis, and in fatm-1 colonized with R. irregularis, the total amount of label in mycorrhiza-signature fatty acids 16:1ω5 and 20:3 was lower than in WT, showing that FatM controls symbiotic fatty acid transfer. R, Fatty acids originating from R. irregularis; n.d., not detected; +myc, infected with R. irregularis; +mock, inoculated with mycorrhiza carrier material; WT seg, LORE1 segregating wild type allele of fatm-1. All graphs represent average values, error bars depict standard deviation. Student’s t-test with Bonferroni correction for multiple pairwise comparisons (*, significantly different from WTseg +myc; ‡, significantly different from fatm-1 +myc; P < 0.0125).

97
Decreased labeling at later stages of the symbiosis likely is indicative of decreased
symbiotic fatty acid transfer. This fits with the observation that at later growth stages, when the
AMF extensively generates spores, the colonized root is saturated with hyphae and vesicles, but
arbuscules are less abundant. In root regions with this senescent colonization, also symbiotic
phosphate transfer is hampered (Kobae, 2019). Thus, at later growth stages (>9 wpi), the bulk
transfer of symbiotic fatty acids is mostly complete and therefore decreased at 9 wpi. Additionally,
there is a relative increase in the label into 20:3 fatty acid from 4.9% at 4 wpi to 11.4% at 9 wpi.
As 13C2-acetate can be scavenged by the fungus to elongate fatty acids to 20:3, this might indicate
increased usage of 13C2-acetate by the fungus for fatty acid elongation. This could be a result of
increased fungal tissue at 9 wpi that in turn can scavenge more 13C2-acetate than at 4 wpi.
In colonized fatm-1, the 13C over-excess label in mycorrhiza-fatty acids was consistently
low with 11.7% at 4 wpi and 12.3% at 9 wpi. It was distributed nearly evenly between 16:1ω5
and 20:3. Thus, symbiotic fatty acid transfer remained inefficient and low in fatm-1 even when the
root was heavily colonized at 9 wpi. An additional isomer of 16:1 fatty acid was found in L.
japonicus roots. This fatty acid was seperated from 16:1ω5 by GC-MS and was present also in
mock-inoculated samples but only at 9 wpi (Figure 18a and b). The retention time and mass
spectra are identical to 16:1Δ9 fatty acid from S. cerevisiae (see Figure 22) and this nomenclature
is therefore used, although no positional analysis of the double bond was performed. This fatty
acid is likely of plant origin, but a fraction could also be derived from R. irregularis, as the fungus
also contains 18:1Δ9, but to a lower amount than plant roots. In a mock sample from 9 wpi, 16:1Δ9
was abundantly labeled (16.7% in WT and 11.2% in fatm-1) (Figure 18b). Noteworthy, 13C
over-excess label in 16:1Δ9 accumulated in 9 wpi colonized fatm-1 to 16.5%, while being only
6.9% in WT of the same age. Therefore, most of the 13C over-excess labeled 16:1Δ9 is of plant
origin and confirms the induction of plant fatty acid de novo synthesis by AMF colonization. This
observation is similar to the redirection of 13C over-excess label into other plant fatty acids, i. e.
18:0, 18:2 and partially 16:0 and 18:1 in colonized fatm-1 at 4 wpi, as discussed above (Figure 16,
Figure 17 and Figure 18a).

98
Figure 17: Relative Proportion of 13C-Acetate Labeling of Fatty Acids during Symbiosis. a) Measurement of total fatty acids (all isotopologs, 12C+13C) with GC-FID in the 13C-labeled, colonized roots. b,c) The absolute amounts of 13C-over excess fatty acids (Figure 16) were divided by the amounts of total fatty acids (12C+13C, see a) and expressed as% of these. The number on thex-axis indicates the isotopolog (increasing number of 13C-carbons originating from 13C-acetate) (n=3). In fatm, the reduced fungal biomass leads to a decrease in mycorrhiza signature fatty acids. The relative incorporation of 13C (%13C over-excess relative to total fatty acid) into mycorrhiza-signature fatty acids is decreased in colonized fatm compared to WT, as shown before for absolute amounts (Figure 16). This confirms that the reduction of 13C-incorporation is not due to decrease in total fungal biomass. R, Fatty acids originating from R. irregularis; n.d., not detected;+myc, infected with R. irregularis; +mock, inoculated with mycorrhiza carrier material; WT seg, LORE1 segregating wild type allele of fatm-1. All graphs represent average values, error bars depict standard deviation. Student’s t-test with Bonferroni correction for multiple pairwise comparisons (*, significantly different from WTseg +myc; ‡, significantly different from fatm-1 +myc; P < 0.0125).

99
Figure 18: Distribution of 13C-Label in Fatty Acids during AMF-Symbiosis and mock-Treatment. The sum of all 13C over-excess fatty acids was set to 100% and the relative proportion of the indivudal 13C over-excess fatty acids was calculated. a) 13C-label in the major fatty acids during inoculation with R. irregularis for 4 and 9 weeks in WTseg or fatm-1 mutant. b) 13C-label in the major fatty acids in mock-inoculated roots incubated for 4 and 9 weeks in WTseg or fatm-1 mutant. Every colored segment represents the average of three (4 wpi) or five (9 wpi) independent biological samples. The detailed isotopolog labeling for the 4 wpi samples is depicted in Figures 16 and 17. The highest proportion of 13C over-excess label derived from acetate is found in mycorrhiza fatty acids at 4 wpi in the WT and is lower at 9 wpi, while being decreased consistently in colonized fatm-1. 16:1-isomers 16:1Δ9 and 16:1ω5 were measured via GC-MS. 16:1Δ9 was only labeled in older roots (9 wpi). Number on the brackets denote the sum of 13C over-excess label in mycorrhiza signature fatty acids. R, Fatty acids originating from R. irregularis;+ R. irregularis, infected with mycorrhiza; +mock, inoculated with mycorrhiza carrier material; WT seg, LORE1 segregating wild type allele of fatm-1

100
3.2 Fatty Acid Desaturation in R. irregularis
3.2.1 The acyl-CoA Pool Composition in Host Roots is changed by AMF Colonization
Because fatty acids released by acyl-ACP thioesterases from plastidial de novo synthesis
enter the acyl-CoA pool at the ER, acyl-CoAs were quantified in mock-inoculated and
AMF-colonized WT and fatm-1 roots. This measurement revealed the R. irregualris-dependent
alteration of the acyl-CoA pool (Figure 19). The main acyl-CoA molecular species in
AMF-inoculated roots was 16:0-CoA, while in mock-inoculated roots, 18:2-CoA had the same
abundance as 16:0-CoA. 16:1-CoA accumulated in colonized roots, but could not be detected in
non-colonized roots. In colonized fatm-1, 16:1-CoA was decreased, compared to colonized WT.
Additionally, 20:1-CoA showed very little abundance in colonized fatm-1 and mock-inoculated
WT, and only traces were identified. 20:0-CoA, which was the second most abundant CoA-species
in mycorrhiza-colonized roots of WT, was less abundant in fatm-1 +myc and mock-inoculated WT.
The changes in acyl-CoAs carrying mycorrhiza-signature fatty acids 16:1 and 20:1 are consistent
with the results obtained from total fatty acid, lipid and MAG analysis (see 3.1.6 and 3.1.7). The
changes in acyl-CoA pool in colonized roots were accompanied by an increase in acyl-CoAs with
typical plant fatty acids (i. e. 18:3 and 18:2) in mock-inoculated roots.
Figure 19: Alteration of the acyl-CoA Pool during AMF Symbiosis. a,b) Absolute (a) and relative (b) quantification of acyl-CoAs in colonized and mock-inoculated WT and fatm mutants. Plants were inoculated for seven weeks with R. irregularis or mock-treated before extraction of acyl-CoAs. AMF colonization causes the occurrence of 16:1 and 20:1-CoAs as well as the increase of 20:0-CoA. +myc, infected with R. irregularis; +mock, inoculated with mycorrhiza carrier material; WT seg, LORE1 segregating wild type allele of fatm-1. All graphs represent average values, error bars depict standard deviation. One-way ANOVA with post-hoc Tukey, different letters indicate significant differences (P < 0.05).

101
The origin of mycorrhiza-signature fatty acids 16:1 and 20:3 in colonized roots were not
yet experimentally verified. However, these fatty acids are likely derived from desaturases in the
mycorrhiza symbiont, because the ERM accumulates considerable amounts of 16:1 and 20:3
esterified to TAG and phospholipids. To study symbiotic fatty acid transfer and lipid biosynthesis
in R. irregularis, the genes involved in fatty acid desaturation in R. irregularis were investigated
using S. cerevisiae as a model system (see 3.2.2).
3.2.2 R. irregularis contains Desaturases with Homology to Yeast Acyl-CoA Desaturase OLE1 In the model fungus S. cerevisiae, fatty acid desaturation depends on the acyl-CoA
desaturase OLEIC ACID REQUIRING 1 (ScOLE1) that desaturases stearoyl-CoA and
hexadecanoyl-CoA to produce oleoyl-CoA and palmitoyl-CoA, respectively (Smet et al., 2012). The
ScOLE1 amino acid sequences was used in a BLASTp search against the R. irregularis translated
genome (DAOM 181602=DAOM 197198 GCA_000439145) accessed at EnsemblFungi
(www.fungi.ensembl.org).
Figure 20: Protein Sequences of R. irregularis similar to S. cerevisiae acyl-CoA Desaturase OLE1. BLASTp with ScOLE1 was done against the R. irregularis translated nucleotide genome and all significant hits were used in a multiple sequence alignment of protein sequences using ClustalX with MEGA v 6.0. A neighbor-joining (NJ) tree was constructed. Two sequences are highly similar to ScOLE1, termed RiOLE1 and RiOLE1-LIKE, indicated by red boxes. The numbers on the branches indicate boot-strap values (1000 iterations). Sc, S. cerevisiae; Ri, R. irregularis.

102
Twenty three non-redundant, significant hits (E-value < 0.05) were retrieved of which two protein
sequences were highly similar to ScOLE1 and were therefore termed RiOLE1 and RiOLE1-LIKE
(Figure 20). RiOLE1 was more similar to ScOLE1 than RiOLE1-LIKE. Subsequently, their coding
sequences were amplified from R. irregularis cDNA and expressed in yeast and N. benthamiana
(see 3.2.3—3.25) to study their enzymatic activity.
3.2.3 The Auxotrophy for Oleic Acid of the Yeast Δole1 Mutant is complemented by Expression of R. irregularis RiOLE1 and RiOLE1-LIKE
RiOLE1 and RiOLE1-LIKE were used to rescue the Δole1 yeast mutant that exhibits a
growth deficiency when no unsaturated fatty acids are supplemented to the medium (Stukey et
al., 1989). Constitutive expression of RiOLE1 and RiOLE1-LIKE allowed ScΔole1 mutants to grow
on medium free of monounsaturated fatty acids and did not affect growth in the WT background
(Figure 21).
Figure 21: Growth Complementation of S. cerevisiae Δole1 by Expression of R. irregularis RiOLE1 and RiOLE1-LIKE. The coding sequences of Rhiozphagus OLE1 and OLE1-LIKE were constitutively expressed in yeast WT or ScΔole1 background. A dilution series was plated out on minimal medium without fatty acids and, as a positive control, minimal medium containing 1mM oleic acid (18:1Δ9). The plates were incubated at 28°C for 5 days. When grown without supplementation of unsaturated fatty acids, expression of RiOLE1 and RiOLE1-LIKE partially rescued the growth phenotype of the yeast Δole1 mutant, similar to supplementation of 18:1Δ9. WT, wild-type; EV, Empty vector control; Ole1, Oleic acid dependent 1; Ri, R. irregularis.

103
Supplementation of oleic acid to the medium rescued growth of the ScΔole1 mutant.
Growth of yeast on the oleic acid-supplemented medium expressing RiOLE1 or RiOLE1-LIKE did
not differ between the ScΔole1 or WT background. However, ScΔole1 cells expressing RiOLE1 grew
slightly better than those expressing RiOLE1-LIKE. This might be explained by the higher sequence
similarity between ScOLE1 and RiOLE1 which might indicate a higher functional relationship, in
contrast to RiOLE1-LIKE (Figure 20).
3.2.4 Mycorrhiza-Signature Fatty Acids are synthesized by RiOLE1-LIKE
The most abundant fatty acid in R. irregularis ERM is palmitvaccenic acid (16:1ω5). In
colonized plant roots, 16:1ω5 accumulates and it is absent from mock-treated roots (Figure 9).
Additionally, 18:1ω7 can be detected in colonized roots (Stumpe et al., 2005). Fatty acids with
similar retention times and mass spectra as 16:1ω5 and 18:1ω7 were exclusively found in yeast
cells expressing RiOLE1-LIKE but not RiOLE1 or the EV control (Figure 22a and b). 16:1ω5 and
18:1ω7 were eluted prior to palmitic acid and stearic acid, but after palmitoleic and oleic acid,
respectively. The composition of fatty acids was additionally analyzed in N. benthamiana leaves
transiently expressing RiOLE1 or RiOLE1-LIKE coding sequences (Figure 22c and d). In N.
benthamiana expressing RiOLE1-LIKE, 16:1ω5 and 18:1ω7 fatty acids are present (Figure 22d)
that were absent from N. benthamiana leaves transiently expressing RiOLE1 and the EV negative
control (Figure 22c).
In addition to the WT, expression of RiOLE1-LIKE in the yeast ScΔole1 mutant also caused
the accumulation of 16:1ω5 fatty acids (Figure 22e and f). Quantification of total fatty acids
revealed a shift towards 16:1ω5 fatty acids with an accompanying decrease in 16:1Δ9 and18:1Δ9
in RiOLE1-LIKE-expressing ScΔole1 that was not observed in RiOLE1-LIKE-expressing WT. Both,
WT and ScΔole1 exhibited a relative reduction in 16:0 fatty acid (in mol%) when RiOLE1-LIKE was
expressed (Figure 22f). On the other hand, 18:1Δ9 accumulated in yeast WT and ScΔole1 when
RiOLE1 was expressed (Figure 22e and Figure 22f) and the relative amount of 18:0 decreased
(Figure 22f). In the same samples, the amount of of 16:1Δ9 in WT and ScΔole1 decreased as well,
but in absolute amounts, this was only observed in the ScΔole1 background. Thus, RiOLE1-LIKE is
responsible for the synthesis of 16:1ω5 and 18:1ω7 in R. irregularis IRM and ERM and RiOLE1
synthesises Δ9-fatty acids, consistent with the higher sequence similarity to ScOLE1 which is a
16:0-CoA and 18:0-CoA delta9 desaturase (Figure 20).
To evaluate whether fatty acid desaturation by R. irregularis desaturases is influenced by
exogenous application of fatty acids, the culture medium was supplemented with 15:0 fatty acid
and the yeast total fatty acid composition investigated (Figure 23). Fatty acids with odd carbon
atoms are absent from yeast.

104
Figure 22: Identification and Quantification of Mycorrhiza-Signature Fatty Acids in N. benthamiana and S. cerevisiae expressing R. irregularis OLE1 orthologs. a,b) GC-MS total ion chromatograms of fatty acid methyl esters synthesized from total lipid extracts obtained from 1 mL yeast culture or approximately 100 mg L. japonicus root inoculated with or without mycorrhiza for 4 weeks. c,d) GC-MS total ion chromatograms of fatty acid methyl esters synthesized from the methanol-fraction after solid-phase extraction of lipid extracts obtained from N. benthamiana leaves transiently expressing RiOLE1 (c) and RiOLE1-LIKE (d). Leaves were harvested 5 days (c) or 4 days (d) after leaf infiltration with Agrobacterium. Yeast and N. benthamiana expressing RiOLE1-LIKE contain the mycorrhzia signature fatty acid 16:1ω5 that is otherwise only found in mycorrhiza-containing tissue. e,f) Quantification of total fatty acids by GC-FID of 1 mL yeast culture expressing RiOLE1 or RiOLE1-LIKE in the WT or Δole1 mutant background. +myc, infected with R. irregularis; +mock, inoculated with mycorrhiza carrier materia; Lj, L. japonicus; WT, wild-type; EV, Emtpy vector control; Ole1, Oleic acid dependent 1; Ri, R. irregularis. All graphs represent average values, error bars depict standard deviation. One-way ANOVA with post-hoc Tukey, different letters indicate significant differences (P < 0.05).

105
In all six yeast cultures that were fed with 15:0, fatty acids with retention times similar to Δ9-cis
monounsaturated fatty acids were detected. These comprised 15:1Δ9, 16:1Δ9, 17:1Δ9 and
18:1Δ9. In WT and ScΔole1 expressing RiOLE1-LIKE, additional monounsaturated fatty acids were
distinguished that were absent from the other samples. These were identified as 15:1ω4, 16:1ω5
and 18:1ω7, due to their retention times and mass spectra. In the WT background, a 17:1 fatty
acid was detected, regardless of the expression constructs (Figure 23a) and this was absent from
ScΔole1 EV and ScΔole1RiOLE1. Instead, a 17:1 peak (17:1ω6) was only found when RiOLE1-LIKE
was expressed in ScΔole1 (Figure 23b). Thus, 17:1ω6 in ScΔole1 expressing RiOLE1-LIKE co-elutes
with a 17:1 fatty acid that is also synthesized in yeast WT after feeding with 15:0 fatty acid. The
ω-denoted fatty acids eluted between the Δ9-cis and the saturated fatty acids of similar chain
lengths, identical to the mycorrhiza-signature monounsaturated fatty acids detected in other
tissues (Figure 22a—d). Therefore, RiOLE1-LIKE has a broad substrate specificity and can
introduce the double bond at position delta11 ('mycorrhiza-signature') into the fatty acids 15:0,
16:0, 17:0 and 18:0.
3.2.5 RiOLE1 and RiOLE1-LIKE are Front-End Desaturases producing Δ9 or Δ11 Double Bonds
For determination of the double bond position in monoeonic fatty acids, fatty acid methyl
esters from yeast cultures expressing RiOLE1 and RiOLE1-LIKE were derivatized with dimethyl
disulfide (DMDS) and subsequently analyzed by GC-MS. DMDS reacts with the double bonds of
Figure 23: Fatty Acid Composition of Fatty Acid-supplemented Yeast Cultures Expressing R. irregularis Desaturases. a,b) GC-MS total ion chromatograms of total fatty acids obtained from yeast WT (a) or ScΔole1 (b) expressing Rhiozphagus OLE1 and OLE1-LIKE coding sequences. The culture media were supplemented with 1 mM 15:0 fatty acid that is normally absent from yeast. Upon supplementation with 15:0, novel monounsaturated fatty acids can be detected. These have either retention times similar to Δ9-cis fatty acids or, when RiOLE1-LIKE is expressed, to mycorrhiza-signature fatty acids that are denoted as ω-fatty acids here. WT, wild-type; EV, Empty vector control; Ole1, Oleic acid dependent 1; Ri, R. irregularis.

106
unsaturated fatty acids and thus generates dimethyl disulfide adducts, causing a shift in retention
time during GC-MS analysis (Yamamoto et al., 1991) (Figure 24). When analyzed with the same
temperature program described for underivatized fatty acid methyl esters in Figure 22a, DMDS
derivatization caused a retention time shift of approximately 6 min for monounsaturated fatty
acids. Figure 24 shows that 16:1ω5 and 18:1ω7 were found as DMDS adducts only in yeast
expressing RiOLE1-LIKE.
The mass spectra of the moneonic fatty acids revealed two major fragments that resulted
from disruption of the bond between the methylthio-substituted carbon atoms (Figure 25). These
fragments allowed the identification of the original double bond position. Fragmentation of
16:1Δ9-DMDS yielded a 145 m/z fragment containing the seven carbon atoms from the
methyl-end with the additional methylthio-group (Fragment A in Figure 25a) and a second
fragment of 217 m/z that included the remaining nine carbon atoms with the carboxyl group and
the other methylthio-group at the carbon atom that formed the double bond in the original fatty
acid (Fragment B in Figure 25a). The 217 m/z fragment also underwent secondary fragmentation,
resulting in the loss of methanol (32 m/z) from the ester moeiety, which yields the fragment
185 m/z (Fragment A – 32 m/z), confirming the identity as a methyl ester. In 16:1ω5 fatty acid,
the position of the double was verified to be located between carbon atoms 11 and 12, because
Figure 24: Fatty Acid Methyl Ester DMDS-adducts from Yeast Cultures Expressing R. irregularis Desaturases. GC-MS total ion chromatograms of fatty acid methyl esters after DMDS derivatization, obtained from total lipids of yeast ScΔole1 expressing Rhiozphagus OLE1 and OLE1-LIKE coding sequences. DMDS-adduct formation causes delayed elution from the column by approximately 6 minutes, compared to non-derivatized fatty acid methyl esters. Next to Δ9-cis fatty acids, when RiOLE1-LIKE is expressed, mycorrhiza-signature fatty acids (denoted as ω-fatty acids) occur. WT, wild-type; EV, Empty vector control; Ole1, Oleic acid dependent 1; Ri, R. irregularis; DMDS, Dimethyldisulfide.

107
fragments of 117 m/z and 245 m/z were obtained in the mass spectrum (Figure 25b). The mass
spectra for 18:1Δ9-DMDS adducts confirmed the position of the double bond in oleic acid between
carbon atoms 9 and 10, because fragments of 173 m/z and 217 m/z were prominent (Figure 25c).
In 18:1ω7, two major fragments of 145 m/z and 245 m/z were present in the mass spectrum of
the DMDS adduct that confirmed the position of the double bond between carbon atoms 11 and
12. Therefore, 18:1ω7 is the second product of RiOLE1-LIKE and resulted from the desaturation
of 18:0, not from elongation of 16:1ω5, as the double bond would have been at 18:1ω5 in that
case, because fatty acids are elongated by addition of two carbons at the carboxyl end (Tehlivets
et al., 2007). The mass spectra of DMDS adducts thus indicate that RiOLE1-LIKE introduces double
bonds on 16:0 and 18:0 fatty acids eleven carbon atoms counting from the carboxyl (delta) end.
Accordingly, RiOLE1-LIKE is a front-end desaturase that produces Δ11-monoeonic fatty acids.
3.2.6 Expression of RiOLE1 and RiOLE1-LIKE influences Desaturation of the acyl-CoA Pool
As RiOLE1 and RiOLE1-LIKE are highly similar to the ScOLE1 acyl-CoA desaturase, the
impact of RiOLE1 and RiOLE1-LIKE expression on acyl-CoA composition was determined in
N benthamiana leaves and in yeast cultures. Acyl-CoA measurement with Q-TOF LC-MS/MS
allowed the separation of acyl-CoA molecular species according to their fatty acid moieties. In
N. benthamiana leaves, expression of RiOLE1-LIKE but not RiOLE1 led to the occurrence of
16:1-CoA that is otherwise not detectable in leaf tissue. In yeast, 16:1-CoA was also detected in
WT (Figure 26a). Quantification of the acyl-CoA molecular species in transgenic N. benthamiana
additionally revealed an increase in 18:1-CoA when RiOLE1 was expressed (Figure 26b and c).
The occurrence of 16:1-CoA in N. benthamiana expressing RiOLE1-LIKE was accompanied by a
relative decrease in 16:0-CoA (Figure 26c).
Heterologous expression of RiOLE1 and RiOLE1-LIKE had an impact on the yeast acyl-CoA
pool as well (Figure 26d and e). In yeast WT expressing RiOLE1, 18:1-CoA was increased and in
the ScΔole1 background, this 18:1-CoA increase was also seen (Figure 26e). When RiOLE1-LIKE
was expressed, the alterations of the acyl-CoA pool were strongest in the ScΔole1 background,
where 16:1-CoA accumulated while 16:0-CoA was decreased. Additionally, 18:1-CoA was
increased in relation to EV-ScΔole1 but not to RiOLE1-ScΔole1. As the most abundant acyl-CoA was
16:1-CoA in yeast WT, expression in the WT background likely caused R. irregularis desaturases
to compete with the endogenous yeast acyl-CoA desaturase OLE1, masking the CoA substrate
preference in the case of RiOLE1-LIKE.
The described influence on the acyl-CoA molecular species in N. benthamiana and yeast
leads to the suggestion that RiOLE1 and RiOLE1-LIKE are acyl-CoA desaturases, as is their
homolog in yeast, ScOLE1. However, as phospholipids, especially PC, rapidly exchange acyl groups

108
Figure 25: GC-MS Mass Spectra and Structures of Methyl-bis(methylthio) Fatty Acids. a—d) Mass spectra and the corresponding structures of monoeonic fatty acids obtained after DMDS-deriviatisation of total fatty acid methyl esters from ScΔole1 yeast cultures expressing Rhiozphagus OLE1 or OLE1-LIKE coding sequences. Two major fragments are present in the mass spectra representing fragmentation between the methylthio-derivatised carbon atoms that formed the double bond in the original fatty acids. FA, Fragment A; FB, Fragment B.

109
with the acyl-CoA pool, thereby equilibrating the acyl composition of the PC and acyl-CoA pool,
the observed effects on acyl-CoAs could also be the result from desaturation of e. g. PC and rapid
equilibration with the acyl-CoA pool.
Figure 26: Acyl-CoA Composition in N. benthamiana and S. cerevisiae expressing RiOLE1 and RiOLE1-LIKE. a) Q-TOF LC-MS/MS chromatogram of acyl-CoAs extracted for the product ion (497.3474 m/z) obtained after neutral loss of adenosine-3'-phosphate,5'-diphosphate (506.9900 m/z) from the 16:1-CoA precursor (1004.3374 m /z). b—e) Quantification of acyl-CoAs in relation to internal standard 17:0-CoA and tissue fresh weight or OD. RiOLE1-LIKE prefers 16:0-CoA but can also act on 18:0-CoA while RiOLE1 acts primarily on 18:0-CoA. WT, wild-type; EV, Empty vector control; Ole1, Oleic acid dependent 1; Ri, R. irregularis. All graphs represent average values, error bars depict standard deviation. One-way ANOVA with post-hoc Tukey, different letters indicate significant differences (P < 0.05).

110
4 Discussion
4.1 The L. japonicus Acyl-ACP Thioesterase FatM is required for the Synthesis of Palmitic Acid for Feeding of the Mycorrhiza Fungi
4.1.1 Arbuscular Mycorrhiza Host Plant Species contain an evolutionary conserved Set of Genes for Lipid Synthesis during Symbiosis
The FatM gene is exclusively expressed in roots that are infected with mycorrhiza (Gomez
et al., 2009; Wewer et al., 2014), while the other acyl-ACP thioesterases FatA, FatB and FatC show
ubiquitous expression patterns (Figure 29). FatM and FatC are only present in the genomes of
plant species that engage in mycorrhiza symbiosis. FatM and FatC form seperate clades because
the FatM sequences are more similar to FatB acyl-ACP thioesterases and are more distant to the
FatA-type (Figure 4). This phylogenetic relationship is consistent with previously published
phylogenetic analyses for FatM and other genes coding for proteins involved in lipid biosynthesis
as well as symbiotic nutrient exchange, signal transduction and other metabolic processes (Bravo
et al., 2016; Favre et al., 2014). FatM and these other AM-specific genes were lost during evolution
in non-AM host families i. e. the Brassicales (Delaux et al., 2014). FatM is therefore probably
indispensable for AM symbiosis, and the phylogenetic distribution of FatM in hosts and non-hosts
highlights the impact of AMF symbiosis on evolution of host genomes. However, FatM does not
comprise a novel molecular function, but rather is involved in expansion and regulation of a
pre-existing function (synthesis of palmitic acid) to orchestrate AM symbiosis. Taking a pre-
existing molecular function and coordinating it for AM-symbiosis in AM-hosts, has been
hypothesized for multiple molecular functions before, such as redox metabolism, signaling,
transcription, membrane transport, lipid metabolism (including FatM and RAM2), defense,
exocytosis, secondary metabolism and stress responses (Bravo et al., 2016).
Reliance on host fatty acids was most likely acquired along with the establishment of the
endomycorrhizal fungi, but is likely not a feature of the ectomycorrhizal fungi, because the
genome of the ectomycorrhizal fungus Laccaria bicolor does contain a vertebrate-type I FAS
(Reich et al., 2009) and therefore presumably can produce its own fatty acids. The absence of FAS
genes was reported as well for the fungal human skin pathogen Malassezia sp. that contains
secreted lipases to scavenge host lipids (Triana et al., 2017;xu et al., 2007). Also, the maize
pathogenic fungus Ustilago maydis induces host lipid metabolism to feed, among other
metabolites, on the accumulating lipids at the infection sites, even though U. maydis still contains
FAS genes (Doehlemann et al., 2008; Lanver et al., 2018). Thus, outsourcing of lipid synthesis is a
feature observed in pathogenic and symbiotic interactions.

111
4.1.2 FatM is required for unimpeded Mycorrhiza Colonization
Using a reverse genetic approach with LORE1 transposon insertional mutants of FatM
(Figure 5 a, b), mutant lines were identified with reduced FatM gene expression (Figure 5 c, d).
Two independent alleles, designated fatm-1 and fatm-2, were identified in which FatM gene
expression was absent at 4 wpi (corresponding to ~30—40% total root colonization) (Figure 9c)
but was present to some extent under extensive colonization at 7 wpi (50—90% total root
colonization) (Figure 9d). However, FatM expression compared to WT remained strongly
reduced. In both mutant alleles, the LORE1-transposon insertions are located upstream of the
start codon of FatM at-218 bp in fatm-1 and -248 bp in fatm-2 and therefore might be promoter
insertions or in the 5´UTR. Thus, these mutant lines do not represent null mutations, but show
severely decreased FatM expression.
In both mutant alleles, the expression of PT4, a plant gene that is exclusively induced in
arbuscocytes was reduced at 4 wpi but recovered to WT levels at 7 wpi (Figure 5d). The same
expression pattern was observed for the fungal α-TUBULIN gene. The PT4 transporter locates to
the PAM in juxtaposition to the hyphal fine-branches and its expression is therefore indicative of
fully-branched, functional arbuscules (Pimprikar and Gutjahr, 2018) (see 4.2.2.2). α-TUBULIN is a
fungal housekeeping gene expressed in hyphae and spores (Corradi et al., 2004). Thus, at 4 wpi,
mycorrhiza marker gene expression corresponds to reduced root colonization in the two fatm
mutant alleles (Figure 5a and Figure 6a). At 7 wpi, reduced total root colonization and reduced
colonization with arbuscules and hyphae in fatm-1 (Figure 6a) was not reflected by the level of
PT4 and α-TUBULIN gene expression, which was similar to WT. Therefore, mycorrhiza marker
gene expression measured by RT-PCR can be recovered by increased colonization at 7 wpi in fatm-
1 and fatm-2, even though the actual degree of colonization in fatm-1, investigated via staining
and microscopy, remained decreased.
Arbuscules are dynamic structures, and a fully functional arbuscule is characterized by extensive
hyphal branching. Two types of branches are present on healthy WT arbuscules: large and fine
branches. The phosphate transporter PT4 localizes to the PAM at the hyphal fine branches,
indicating that these structures are active in symbiotic nutrient exchange. A GFP fusion protein of
M. truncatula FatM was shown to be localized to stromulated plastids surrounding the fine
branches of fully-branched arbuscules (Bravo et al., 2017). In Medicago and Lotus fatm mutants,
arbuscule branching was distorted and led to the occurrence of stunted arbuscules that lacked
4.1.2.1 The FatM Mutation affects Mycorrhzia Marker Gene Expression
4.1.2.2 The Mutation of FatM Leads to Defective Fungal Fine Branching during the
Formation of Functional Arbuscules and compromises Symbiotic Phosphate
Transfer

112
extensive branching, which caused them also to be smaller (Figure 6) (Bravo et al., 2017). As
branching of hyphae causes the surface area of the symbiotic interface to increase (Alexander et
al., 1989), less extensive branching of R. irregularis hyphae in fatm probably leads to compromised
metabolite exchange and ineffective arbuscules. This is reflected by decreased shoot inorganic
phosphate (Figure 5e), although this could also be explained by the overall decreased colonization
in fatm (Figure 5a).
Aborted arbuscule branching in fatm could be a result of the lack of symbiotic lipid transfer,
mediated by FatM, leading to a shortage of membrane synthesizing capacity in R. irregularis.
Alternatively, the decrease in symbiotic phosphate transfer (and probably other nutrients) might
initiate a negative feedback response from the plant host. Accommodation of the fungus is
controlled by the plant, and inefficient arbuscules are actively aborted by the host to prevent
underperformance of the fungus (Choi et al., 2018; Floss et al., 2017; Gutjahr and Parniske, 2017;
Toth and Miller, 1984). The stunted arbuscule phenotype of Lotus and Medicago fatm mutants
resembles those of pt4 and str transporter mutants (Breuillin-Sessoms et al., 2015; MacLean et al.,
2017; Zhang et al., 2010), therefore suggesting that symbiotic mineral nutrient exchange and
symbiotic lipid exchange are connected, resulting in the same arrest of arbuscule development
that ultimately leads to an inefficient symbiosis.
Spores and hyphae of AMF mainly contain neutral storage lipids, predominantly TAGs with
fatty acids 16:0 and 16:1 (Beilby, 1980; Beilby and Kidby, 1980) that circulate as lipid droplets in
between the fungal IRM and ERM (Bago et al., 2002) and accumulate either in spores or in
intraradical vesicles. In fatm mutants, vesicles occur less frequent and are smaller (Figure 6),
indicating that intraradical lipid storage is compromised due to the fatm mutation. This is also
reflected by the severe reduction in TAG, especially TAG containing the fatty acids 16:0 and 16:1
(Figure 9, 10). In agreement, 16:1 fatty acid accumulation was positively correlated with vesicle
frequency in R. irregularis colonizing citrus roots (Graham et al., 1995). In R. irregularis, vesicles
consist of 58.2% lipids relative to their dry weight. Of these, 16.7% are neutral lipids, 28.32%
glycolipids and sphingolipids and 15.91% phospholipids. Remarkably, 16:1 and 18:1 fatty acids
predominate in neutral lipids as well as in glycolipids and sphingolipids but are less abundant in
the phospholipids (Jabaji-Hare et al., 1984). After initial root colonization and establishment of a
functional AM symbiosis, the content of neutral lipids, foremost acylated with 16:0 and 16:1,
drastically increases in colonized roots and ERM of R. irregularis, while phospholipids are only
marginally increased by comparison (Olsson and Johansen, 2000). The strong reduction in 16:1ω5
(Figure 9), which is mostly due to decrease in 16:1ω5-NLFA (Figure 10a, b) in colonized fatm
roots, therefore is indicative of a specific reduction in storage lipid accumulation. Fungal
membrane (phospho)lipids probably are less affected by the reduction of symbiotic fatty acid
4.1.2.3 Lipid Storage in R. irregularis is compromised by the fatm Mutation

113
transfer because 16:1ω5-PLFA is present in drastically lower absolute amounts, even though
16:1ω5-PLFA was reduced by the same factor as 16:1ω5-NLFA in fatm-1 mutants (Figure 10).
As discussed above, decreased fungal lipid accumulation in colonized fatm roots could be
the direct consequence of compromised fatty acid transfer from the plant to the fungus. With
regard to the cumulative evidence for symbiotic fatty acid transfer presented here and in other
studies (for review, see Keymer and Gutjahr (2018)), this is the most likely explanation for the
observed vesicle and lipid phenotype. Eventhough in theory, reduced lipid accumulation could
merely be the consequence of reduced fungal colonization and not specifically reduced fatty acid
transfer, which then would be only an indirect side-effect of reduced colonization. Most mutations
that negatively affect mycorrhiza colonization probably lead to a decrease in fungal membranes
and consequently reduced marker lipids. Even when these genes might not directly be involved
in host lipid reprogramming and lipid transfer to the fungus. Nonetheless, hyphae morphology
was regular in fatm mutants and hyphae colonization was not as severely affected as vesicle
formation, especially at 7 wpi (Figure 6), when symbiotic lipid transfer supposedly has been going
on for 5—6 weeks. Specifically in fatm-2 at 7 wpi, hyphae and arbuscule colonization was restored
to WT levels, but vesicles remained markedly reduced. Taken together, these observations favor
a specific role for FatM in lipid accumulation in vesicles that becomes visible especially at later
stages of AM symbiosis. Consistently, vesicle formation is common in orders of the
Glomeromycotina except for the Gigasporales (Smith and Read, 2008) but not in ectomycorrhiza,
which do not accumulate excessive amounts of lipids and contain FAS genes for synthesis of fatty
acids (Reich et al., 2009). The physiology and role of vesicles is largely unknown (Montero et al.,
2019). The first vesicles are formed early after root colonization and occur more frequently at
later stages of the AM symbiosis. They could therefore fulfill a function that is vital for the fatty
acid-auxotrophic lifestyle of AMF fungi, i. e. as temporary lipid storages until lipids are
translocated to spores during sporulation.
4.1.3 Lipid Accumulation in AMF and use of Lipids as Biomarkers for Mycorrhiza Colonization
R. irregularis contains different unsaturated fatty acids that are absent from the plant
host and therefore are employed as fatty acid biomarkers for estimation of mycorrhiza biomass.
The most abundant one, 16:1ω5 (palmitvaccenic acid) occurs in many acyl-glycerolipids, mostly
in the neutral storage lipid TAG (Figure 9) (Olsson and Johansen, 2000; Wewer et al., 2014).
Palmitvaccenic acid and other fatty acids of mycorrhiza origin as well as sterol lipids were used
as lipid biomarkers for AMF under laboratory conditions and in the field (Bentivenga and Morton,
1996; Graham et al., 1995, Lehman et al., 2019; Nordby et al., 1981). There is a correlation
between the rate of colonization with R. irregularis and accumulation of marker fatty acids or
sterol lipids in colonized roots (Figure 6 and 9) (Olsson et al., 1995; Schliemann et al., 2008;

114
Stumpe et al., 2005). Fatty acid analysis in the colonized fatm mutant revealed that the
mycorrhiza-marker fatty acids were differently reduced in the fatm mutants. While 16:1ω5
showed the most prominent reduction, 20:3 was less affected (Figure 9, 10). This was true for
fatty acids in the neutral lipid fraction and the polar lipid fraction (Figure 10). Also, the free sterol
lipid 24-methylcholesterol only showed a minor decrease, compared to 16:1ω5 in colonized fatm
mutants (Figure 11). Therefore, even though all these compounds are restricted to R. irregularis
tissue, their suitability as mycorrhiza lipid marker differs. In WT, 16:1ω5 quantification reveals
mainly lipid storage in vesicles as well as spore formation, mostly due to accumulation of neutral
lipids. Still, 16:1ω5 is also present to some degree in membrane-forming polar lipids, although in
a considerable lower concentration (~14-fold less) (Figure 10a). In contrast, fungal 20:3 fatty acid
accumulates approximately to a similar amount in the neutral lipid fraction (0.133 nmol.mg FW 1)
and the polar lipid fraction (0.164 nmol.mg FW-1). Different to 16:1ω5, 20:3 therefore is less
valuable as marker for storage lipid accumulation, but provides insight into fungal membranes
and storage lipids alike. The sterol lipid 24-methylcholesterol provides only information on AMF
membrane abundance, but not of storage lipid accumulation as it is absent from the neutral lipid
fraction.
Mycorrhiza signature fatty acids can also be detected in polar and neutral lipids of
ectomycorrhizal fungi albeit their concentrations are very low in comparison to saturated fatty
acids. In contrast to AMF the ecotmycorrhiza fungi Pichia tinctorius and P. sylvestris do not
accumulate excessive amounts of lipids (Lackzo et al., 2004). This confirms that especially
monunsaturated 16:1ω5-NLFA is a suitable marker for R. irregularis lipid accumulation and likely
also for other oleaginous AMF fungi, albeit there is less knowledge about the lipid accumulation
in other AMF besides R. irregularis.
4.1.4 FatM dictates symbiotic Fatty Acid Supply for R. irregularis
Heterologous expression in E. coli followed by fatty acid measurements or enzyme assays
with recombinant protein demonstrate that FatM preferentially hydrolyses 16:0-ACP (Figure 14).
The massive induction of FatM expression upon colonization with AMF (see appendix 7.3 and
(Gomez et al., 2009; Wewer et al., 2014)) and the localization to plastids close to the fine branches
of arbuscules (Bravo et al., 2017) indicate that the colonization with AMF and the resulting
arbuscule formation leads to a reprogramming of host plastidial fatty acid synthesis towards de
novo synthesis of 16:0. This is in accordance with the finding that the most abundant fatty acids
in R. irregularis ERM are 16:0 and its direct desaturation product 16:1ω5 (Figure 9 and (Wewer
et al., 2014)). The enzyme assay revealed that FatM is also able to hydrolyze considerable amounts
of 18:0-ACP and 18:1Δ9cis-ACP in vitro when only these substrates were offered (Figure 14). In
4.1.4.1 Reprogramming of Plastidial Fatty Acid Synthesis by AMF

115
arbuscocytes in vivo, FatM will however likely hydrolyze much less 18:0 and 18:1, as most of the
elongated acyl-ACP will be scavenged as 16:0-ACP already and exported as 16:0 fatty acid from
the plastid, due to the highest preference for 16:0-ACP.
In Arabidopsis fatb mutants, it was demonstrated how the different substrate specificities
of the Fat enzymes influence de novo fatty acid synthesis. Arabidopsis fatb mutants reveal
decreased 16:0 fatty acid content and a concomitant increase in 18:1Δ9, the main product of
AtFatA, in extraplastidial, eukaryotic lipids (Bonaventure et al., 2003). The similarities in amino
acid sequences of Lotus LjFatM and Arabidopsis AtFatB reveals the close relationship between
these two enzymes (Figure 4). In addition, the functional relationship of FatM and AtFatB was
confirmed through complementation of the Arabidopsis fatb mutant using FatM from M.
truncatula (Jiang et al., 2018). Similar to LjFatM, Arabidopsis FatB also prefers 16:0-ACP as
substrate (Salas and Ohlrogge, 2002). However, while Arabidopsis FatB showed the second most
activity with 18:1-ACP, the second most preferred substrate for LjFatM was 18:0-ACP, while
18:1-ACP was only the third most preferred substrate (Figure 14c). This reveals that LjFatM has
a strong tendency to act on saturated acyl-ACPs (16:0-ACP>18:0-ACP>18:1-ACP) which is not
strictly conserved in Arabidopsis FatB (16:0-ACP>18:1-ACP>18:0-ACP), even though the most
preferred substrate also is saturated 16:0-ACP. Another important difference between LjFatM and
AtFatB is the enzyme activity on 14:0-ACP. 14:0-ACP was hydrolyzed by LjFatM at 0.092 pmol-
1 min-1 µg protein-1,, which corresponds to 3.5-times less enzyme activity than on 16:0-ACP
(0.33 pmol-1 min-1 µg protein-1). In contrast, enzyme activity of AtFatB on 14:0-ACP was ~22-fold
less than for 16:0-ACP (Salas and Ohlrogge, 2002), which shows that LjFatM has a broader
substrate range by accepting also shorter chain lengths (14:0-ACP), contrary to AtFatB.
The bay laurel acyl-ACP thioesterase UcFatB1 also has enzyme activity on shorter chain,
saturated acyl-ACPs (12:0-ACP>14:0-ACP) (Voelker et al., 1992) and was accordingly placed in
the phylogenetic analysis in between Arabidopsis FatB and LjFatM (Figure 4). Similar to LjFatM,
the preference for 16:0-ACP is also conserved in the acyl-ACP thioesterase from Cuphea
hookeriana, ChFatB1. Similar to Arabidopsis FatB and contrary to LjFatM, ChFatB1 accepts 18:1 as
second most preferred substrate (Jones et al., 1995). C. hookeriana contains a second acyl-ACP
thioesterase, ChFatB2 for shorter chain fatty acids (10:0-ACP>8:0-ACP). In comparison, LjFatM
cannot hydrolyze these shorter chain acyl-ACPs (Figure 14c).
In conclusion, the substrate specificities of acyl-ACP thioesterases from multiple plant
species have been shown to reflect the demand of fatty acids for subsequent lipid synthesis
(Aznar-Moreno et al., 2018; Dehesh et al., 1996; El Tahchy et al., 2017; Jones et al., 1995;
Rodríguez-Rodríguez et al., 2014; Salas and Ohlrogge, 2002; Voelker et al., 1992). Thus, the
substrate specificity of LjFatM reflects the importance of the different fatty acids induced by AMF
colonization. They can therefore be ranked by their importance for AMF: 16:0 18:0>18:1>14:0,

116
even though subsequent modifications at the ER (elongation, desaturation) could have an
influence as well.
Contrary to LjFatM, LjFatA and LjFatB gene expression is not affected by mycorrhiza
colonization (see appendix 7.3). They show acyl-ACP substrate specificities related to their
orthologs in Arabidopsis (Figure 15). Thus, they are likely to act as housekeeping thioesterases
ensuring plant fatty acid supply independent from mycorrhiza fatty acid demand. Yet, their
expression levels in colonized roots are low compared to FatM and thus their enzyme activities
will likely be exceeded by the massively induced FatM, which causes a temporal increase in 16:0
fatty acids and consequently a decrease in plant 18:0 and 18:1 fatty acids in arbuscocytes.
The fungal demand for molecules synthesized in the plastids of the host cell is also revealed
by the finding that in arbuscocytes, plastids were shown to proliferate and stromulate around the
branching arbuscule (Fester et al., 2001; Lohse et al., 2005). Cytoplasmic rearrangement of host
organelles and the endomembrane system is commonly observed around haustoria formed by
pathogenic infection, and is the consequence of manipulation of the host metabolism (Kwaaitaal
et al., 2017). Therefore, induction of plastidial activity, i. e. 16:0 fatty acid synthesis via FatM, is in
agreement with re-organisation of the host metabolism by AMF.
In plant plastids, acetyl-coenzyme A synthetase (ACS) converts imported cytosolic acetate
and coenzyme A into acetyl-coenzyme A (acetyl-CoA) (Behal et al., 2002). The carboxylation of
acetyl-CoA to malonyl-CoA is the committed step in fatty acid de novo synthesis. It is catalyzed by
acetyl-CoA carboxylase (ACC). In the next reaction, two carbons from malonyl-ACP are added per
reaction cycle to the growing fatty acid chain. Therefore, exogenously applied 13C2-acetate is
relocated to the plastid and the two 13C-atoms are used to synthesize fatty acids de novo via
elongation by addition of two carbons per cycle. Consequently, mutants of acs in Arabidopsis show
strongly reduced labeling of fatty acids by exogenous application of acetate, highlighting the
importance of this enzyme for acetate-labeling of fatty acids (Lin and Oliver, 2008).
In Lotus colonized and non-colonized roots subjected to exogenous 13C2-acetate, the
13C-label could be quantified in all major fatty acids (Figure 16, 17, 18). The amount of 13C
introduced via 13C2-acetate was corrected for the abundance of naturally occurring isotopologs,
giving rise to the 13C over-excess label. When comparing colonized and mock-inoculated WT roots,
the abundance of 13C over-excess label in all fatty acids was increased by colonization with
R. irregularis (Figure 16b). This finding was previously reported by labeling of Glomus
mosseae-inoculated onion roots with 14C2-acetate (Lösel and Cooper, 1979). In the Lotus
experiment described here, the colonized roots were placed in 13C2-acetate containing buffer ON
(~12 h labeling period). The 13C2-acetate is taken up into the root cell apoplast. From there, it
could be accessed by the plant and the fungal hyphae alike. In hyphae, it could be used for
4.1.4.2 Transfer of Symbiotic Fatty Acids after Labeling with 13C2-Acetate

117
elongation of fatty acids (Calonne et al., 2014; Trepanier et al., 2005). Accordingly, R. irregularis
extraradical hyphae, growing asymbiotically from germinating spores, or in symbiosis with D.
carota, were able to take up and metabolize labeled glycerol, glucose,xylose and acetate. This
shows that AM hyphae have the mechanisms for uptake and acquisition of these carbon
compounds independent of transfer via arbuscules (Bücking et al., 2008; Helber et al., 2011;
Lammers et al., 2001; Pfeffer et al., 1999). As AMF lack cytosolic type-I FAS (Ropars et al., 2016;
Sedzielewska Toro and Brachmann, 2016; Tang et al., 2016; Tisserant et al., 2013; Wewer et al.,
2014), 16:0 fatty acids are very likely not synthesized in R. irregularis. This was brought forward
as hypothesis from earlier labeling experiments using a split-petri dish system where the 14C-label
from 14C-acetate accumulated in 16:0 and 16:1 fatty acid in ERM only if the plant was also able to
access the acetate (Trepanier et al., 2005). Therefore, despite of being available to the plant roots
and the fungal intraradical hyphae alike, a considerable portion of the 13C2-acetate applied to
colonized Lotus roots was likely acquired by the plant and used for de novo synthesis of fatty acids.
This is also emphasized by the abundance of 13C over-excess label in 16:0 fatty acid in colonized
WT. The isotopolog labeling pattern of 16:0 congruently showed the typical 13C2-pattern indicative
of incorporation via malonyl-ACP during de novo synthesis, because the isotopologs with even
number of 13C carbon atoms were abundantly labeled (Figure 16a). In the fungus, 16:0 fatty acid
is desaturated to the mycorrhiza-signature fatty acid 16:1ω5 (see 3.2). In colonized WT, the
13C-label was highest in 16:1ω5 (Figure 16b). Together, these results indicate that a high
proportion of the applied 13C2-acetate was acquired by the plant to synthesize 16:0 that then was
transferred to the fungus for desaturation to 16:1ω5.
In the colonized fatm-1 mutant, 13C over-excess in 16:1ω5 was reduced compared to
colonized WT and the same was observed for 20:3 fatty acid, albeit the latter was of lower
abundance (Figure 16). This reduction was independent of the reduced total root colonization in
fatm-1 mutants (Figure 9a), as was demonstrated by relative 13C over-excess incorporation in %
to total fatty acid abundance (Figure 17). Reduced 13C over-excess in mycorrhiza-signature fatty
acids in colonized fatm-1 therefore reveals that FatM is required for unimpaired symbiotic fatty
acid supply. In colonized fatm-1, the 13C label increased almost two-fold in 18:2 and 18:0 fatty
acids, compared to colonized WT (Figure 16b) and this was also independent of reduced fungal
biomass in colonized fatm-1 (Figure 17b). Therefore, this suggests that due to reduced gene
expression of FatM in colonized fatm-1, the 13C over-excess is re-directed from mycorrhiza marker
fatty acids (16:1 ω5 and 20:3) into other fatty acids (18:2 and 18:0). 18:2 and 18:0 fatty acids
occur in both symbiotic partners. Thus, re-direction of 13C over-excess in colonized fatm-1 is either
due to increased uptake of 13C2-acetate and elongation of fatty acids by fungal mycelium or due to
increased labeling of plant 18:2 and 18:0.
Despite of the imminent importance of FatM for accumulation of 13C over-excess label in
mycorrhiza fatty acids from 13C2-acetate labeling, residual 13C over-excess label is still observed in

118
16:1ω5 in colonized fatm-1 (Figure 16, 17, 18). One explanation could be the residual gene
expression of FatM in colonized fatm-1 (Figure 5). Even though these colonized fatm-1 roots were
enriched in stunted arbuscules that were arrested in hyphal fine branching, there were also
normal, fully branched arbuscules (see 3.14). These could likely still function in symbiotic nutrient
(i. e. fatty acid) transfer. Therefore, symbiotic fatty acid transfer is severely reduced, but not fully
abolished in colonized fatm-1 mutants.
The 13C over-excess in 16:0 fatty acid was increased two-fold by AMF-colonization in WT,
compared to mock-inoculated roots (Figure 16b). As discussed above, 13C over-excess in 16:0 in
colonized roots very likely exclusively originates from de novo synthesis of 16:0 fatty acid in the
plant. Therefore, colonization with R. irregularis increased the rate of 16:0 fatty acid de novo
synthesis. This is in agreement with the requirement of the DIS gene for mycorrhiza development
and symbiotic fatty acid transfer (Keymer et al., 2017). DIS encodes a β-ketoacyl-ACP synthase
(KAS), a component of the FAS complex. Figure 27 summarizes lipid synthesis during symbiosis
and specifically highlights the movement of acyl-groups containing 13C-labeled carbon from
13C2-acetate feeding.
4.1.4.2.1 Estimation of the Rate of Symbiotic Fatty Acid Transfer
As discussed above, the 13C2-acetate labeling experiment suggested that a substantial
portion of 13C over-excess was transferred as 16:0 fatty acid. As an estimate, this was at least
~38.5% of the total 13C over-excess signal, because 38.5% 13C over-excess label was found in
16:1ω5 at 4 wpi in WT roots (Figure 18). In other experiments, seven days of labeling with
13C-glucose of D. carota inoculated with R. irregularis revealed an enrichment of 13C in the
16:1ω5-NLFA signature fatty acids by 2.2% of total root carbon in IRM and 1.1% in ERM (Olsson
et al., 2005). These results indicate that next to the fatty acid transfer indicated by 13C2-acetate
labeling in figures 16—18, glucose is transferred as well. How the transfer of these carbon
compounds compares to each other and whether the fungus prefers one over the other remains
unknown. However, comparison of labeling rates from glucose versus acetate fedding suffer from
the fact that the glucose taken up by the plant might not be transferred to the fungus directly but
broken down in plant glycolysis. The resulting acetate could be used to synthesis fatty acids that
might eventually be transferred to the fungus.
At 4 wpi in colonized WT, 4.9% of 13C over-excess label was found in fungal 20:3 fatty acid
(Figure 18a, first column). As opposed to the 13C over-excess label in 16:1ω5, which likely
exclusively originates from labeled 13C-16:0 obtained from the plant, the 13C over-excess label in
20:3 can have two origins (Figure 27). Firstly, 13C-labeled fatty acids acquired from the plant (i. e.
13C-16:0 fatty acid) that are then elongated and desaturated to 20:3 within the fungus using
unlabeled acetate from fungal metabolism. And, secondly, unlabeled fungal fatty acids that were
elongated with 13C-acetate scavenged by the fungus from the apoplast or the labeling buffer.

119
Figure 27: Metabolism of 13C-Acyl Groups after 13C2-Acetate Labeling during AM symbiosis In arbuscocytes, genes encoding plastidial de novo fatty acids synthesis genes (DIS, FatM) and lipid synthesis genes at the ER (RAM2) are essential for fungal development. 16:0 fatty acid from the plastid might be incorporated into 16:0-β MAG hypothetically for secretion to the fungus. At the ER-Golgi network, the plant secretory pathway is active for synthesis of the PAM via membrane fusion of secretory vesicles (SV). In the apoplastic interface between plant cell and fungal arbuscule, evaginations of the PAM (Intramatrix compartment I, IMC-I; Ivanov et al, 2019) and discrete, apoplastic extracellular vesicles (AVS; Roth et al, 2019) are present. Regular plant lipid synthesis that is likely not responsive to mycorrhiza colonization is depicted in black. The mycorrhiza-induced lipid synthesis pathway and the possible fate of 13C-labeled carbon from 13C2-acetate are highlighted in red. Due to the lack of type-I FAS genes in R. irregularis, 13C in fungal 16:x fatty acids are most likely derived from de novo synthesized plant fatty acids, while label in 18:x and 20:x fatty acids could also have arisen by fatty acid elongation at the ER with 13C2-acetate taken up by fungal ERH from the medium or via IRH from the apoplast. The mycorrhiza signature fatty acid 16:1ω5/Δ11 is synthesized by RiOLE1-LIKE. The substrate specificities of plant Fat and RAM2 enzymes are depicted with the most preferred substrate in large letter size. ACS, ACETYL-COA SYNTHASE; KASIII, β-KETOACYL SYNTHASE; G-3-P, Glycerol-3-Phosphate; Sub/Cut, Suberin/Cutin; SV, Secretory vesicles; IMC-I, Intramatrix compartment I; AVS, Apoplastic vesicular structure; PPM, Plant plasma membrane; PAM, Periarbuscular membrane; PAS, Periarbuscular space; FAM, Fungal arbuscule membrane; FHM, Fungal hyphae membrane; ERH, Extraradical hyphae.

120
To provide a more accurate estimation of the rate of symbiotic fatty acid transfer, it is therefore
important to distinguish these two routes for 13C enrichment of 20:3 fatty acid. In the colonized
fatm-1 mutant, the relative 13C over-excess label in fungal 20:3 fatty acid was decreased to 10.05%
as compared to 14.3% in WT (in% of 12C + 13C fatty acids) (Figure 17). Because FatM provides an
entry point for 13C-labeled fatty acids to the fungus, this suggests that in the present experiment
at least one third of the 13C over-excess label in fungal 20:3 was retrieved from the plant as fatty
acid. Thus, of the 4.9% 13C over-excess label in 20:3, at least 1.6% were probably retrieved as fatty
acid from the plant. As the origin of the other fatty acids that were labeled by 13C2-acetate (14:0,
16:1Δ9, 18:0, 18:1, 18:2 and 18:3) are present in plant and fungus, the rate of labeling in these
fatty acids cannot be seperately estimated in the plant and the fungus, but only as the sum of both.
Other labeling experiments with 13C-glucose of Lotus roots in a two-compartment system
focused on the 13C-isotopolog pattern in 16:0 and 16:1ω5 fatty acids in fungal ERM and the
colonized roots. In the ERM from dis and ram2 mutants, the 13C-isotopolog pattern did not
resemble the one from colonized roots and the total 13C label in these fatty acids was reduced. In
addition to the labeling experiments presented here, these observations provide evidence that
next to FatM, symbiotic fatty acid transfer also requires β-keto-acyl ACP synthesis by DIS and lipid
modification at the ER by RAM2 (Keymer et al., 2017; Keymer and Gutjahr, 2018).
4.1.5 RAM2 might synthesize β-Monoacylglycerols for AMF from Fatty Acids released by FatM
The mycorrhiza-specific RAM2 gene encodes a glycerol-3-phosphate acyltransferase with
phosphatase domain, that produces predominantly 16:0 β-MAG from 16:0-CoA and
glycerol-3-phosphate (Luginbuehl et al., 2017). 16:0 β-MAG showed a mycorrhiza-signature
pattern and failed to accumulate to the same extent in fatm-1 colonized roots as in colonized WT
(Figure 12 and Figure 13). The latter was previously also reported for Medicago fatm (Bravo et
al., 2017). 16:0 β-MAG also fails to accumulate in the colonized lipid synthesis mutants ram2 and
dis of Lotus as well as in a mutant for the hypothetic lipid transporter str (Keymer et al., 2017).
These results suggest that FatM is responsible for a shift in plant fatty acid export from the plastids
towards 16:0, which is converted into 16:0-CoA and transferred to 16:0 β-MAG at the ER by RAM2.
16:0 β-MAG might subsequently be secreted to the periarbuscular space for uptake by the fungus.
16:0 β-MAG was present in profound amounts in the ERM of R. irregularis and was less abundant
in ERM with less spores and even less in colonized roots (Figure 12). This is to some extent
counter-intuitive, because if 16:0 β-MAG is the lipid that is transported to the fungus, one would
expect the highest concentration in colonized roots, as this is where the nutrient exchange takes
place. One explanation for this discrepancy could be that not all of the transferred 16:0 β-MAG is
directly incorporated into fungal glycerolipids but stored and transported as β-MAG to the spores.

121
Figure 28: Cutin Biosynthesis in Arabidopsis Aerial Parts compared to hypothetical extracellular Lipid Secretion stimulated by Mycorrhiza Colonization in AMF-host Roots. In Arabidopsis (upper panel), synthesis of cutin is depicted. Acyl-CoAs are modified by cytochrome P450 (CYP450) monoyxgenases to generate cutin precursors that are used by sn2-GPAT to generate sn2-MAG (β-MAG), which serves as cutin monomer. PM-resident ABCG transporters are inferred in secretion of monomers into the apoplast for subsequent polymerization of β-MAG cutin monomers (2-MHG) by CUTIN SYNTHASE (CUS) (Yeats et al., 2012; Yeats et al., 2014). In AMF-host arbuscocytes (lower panel), the massive induction of FatM might lead to a surplus of 16:0-CoA at the ER that could be used by the RAM2 GPAT to synthesize 16:0 β-MAG, which is subsequently secreted to the PAS via the ABCG transporter STR and taken up by the fungus. The pathway is depicted for 16:0 fatty acid, because it is the primary product of DIS (KASI), FatM and RAM2. As there is no direct evidence for the 16:0 β-MAG secretion-route, lipids could be taken up by the fungus via alternative mechanisms. FAS, FATTY ACID SYNTHASE; LACS, LONG-CHAIN ACYL-COA SYNTHASE; G3P, Glycerol-3-Phosphate; DCF, DEFICIENT IN CUTIN FERULATE; GPAT, GLYCEROL-3-PHOSPHATE ACYLTRANSFERASE; 2-MHG, 2-mono(10,16-dihydroxyhexadecanoyl)glycerol; CUS, CUTIN SYNTHASE; RAM2, REDUCED ARBUSCULAR MYCORRHIZA; STR, STUNTED ARBUSCULES; PM, Plasma membrane; CW, Polysaccharide cell wall; PAM, Periarbuscular membrane; PAS, Periarbscular space; FM, Fungal membrane.

122
The mycorrhiza-marker fatty acid 16:1ω5 is produced by desaturation of 16:0 by the fungal
desaturase RiOLE1-LIKE (see 3.2). Even though the exact substrate of RiOLE1-LIKE is unknown,
fungal fatty acid desaturases either use acyl-CoA or acyl-lipids as substrate (Los and Murata,
1998). As RiOLE1-LIKE is a homolog of the yeast acyl-CoA desaturase ScOLE1 (Figure 20), it likely
also acts on acyl-CoA. If 16:0 fatty acids are transferred as β-MAG, they could be involved in a
fungal acyl-CoA synthesis reaction to generate e. g. 16:0-CoA, which is then desaturated by
RiOLE1-LIKE and then enters fungal glycerolipid (phospholipids and TAG) synthesis via the
acyl-CoA pool (Figure 27). Alternatively, RiOLE1-LIKE could act directly on glycerolipids, such as
phospholipids or MAGs, to generate the desaturated fatty acid that could then be used for TAG
synthesis, even though there is no experimental evidence that RiOLE1-LIKE act on acyl-lipids and
not on acyl-CoA.
Regardless of the substrate of RiOLE1-LIKE, the relatively high abundance of 16:1ω5
α-MAG and β-MAG species could also reflect that these are intermediates in TAG synthesis in
R. irregularis. Consistently, 16:1ω5 β-MAG and 16:0 β-MAG were also present in colonized D.
carota, confirming that some TAG synthesis also occurs in the IRM and not exclusively in the ERM
during spore formation. Upon sporulation in the AMF Glomus versiforme, TAG is hydrolyzed by
lipases to yield energy and fatty acids for membrane synthesis (Gaspar et al., 1994). In the AMF
Glomus caledonius, MAGs acylated to 16:0 and 16:1 increased upon spore germination and hyphae
growth (Beilby and Kidby, 1980). In isolated spores and vesicles from R. irregularis and Glomus
vesiculiferum, MAGs were the third most abundant lipid species, next to TAGs and free fatty acids
(Jabaji-Hare, 1988). These findings together with the results presented here show that MAGs can
be substrates of fungal lipid catabolism and may therefore also serve in anabolism during TAG
synthesis. However, more research targeting storage lipid synthesis in AMF is required to answer
the question how 16:0 fatty acids are transferred and integrated in the fungal lipid metabolism.
RAM2 was initially proposed to function in the synthesis of cutin monomers that have a
signaling function for pathogens and AMF (Murray et al., 2013; Wang et al., 2012). GPATs are
localized to the ER-membrane and. In Arabidopsis, they have been organized by the presence of a
phosphatase domain and by their involvement in subern, cutin or membrane and storage lipid
synthesis (Beisson et al., 2012; Shockey et al., 2016). Figure 28 compares cutin biosynthesis in
Arabidopsis aerial parts and mycorrhiza-colonized roots of AMF-host plants. Three cutin-specific
GPATs exist in Arabidopsis that transfer an acyl group from acyl-CoA to the sn-2 position of
glycerol-3-phosphate: AtGPAT4, AtGPAT6 and AtGPAT8 (Jayawardhane et al., 2018). These
enzymes produce sn-2 lysophosphatidic acid as intermediate product and finally produce sn-2
MAG (β-MAG) by cleavage of the phosphate via the phosphatase domain. AtGPAT6 has the most
sequence similarity to RAM2 from AMF-host plants (Wang et al., 2012). In vitro enzyme assays
with AtGPAT6 showed that the most preferred acyl donor is 16:0 ω-OH-CoA, but that it can also

123
use 18:1 ω-OH-CoA and 18:1 DCA-CoA as well as 10,16-diOH 16:0-CoA (Yang et al., 2012). The
ω-hydroxylated and α,ω-dicarboxylic fatty acids are typical aliphatic monomers found after
depolymerization of cutin in the shoots and suberin in the roots (Nawrath et al., 2013). Atgpat6
mutant flower cutin is deficient in 16:0 ω-OH and 16:0 DCA (Li-Beisson et al., 2009), while stem
cutin in Atgpat4/Atgpat8 double mutants is deficient in all (16:0/18:x) ω-OH and DCA cutin
monomers (Li et al., 2007). Similar to AtGPAT6, RAM2 preferentially uses a 16 carbon fatty acid,
albeit 16:0 non-hydroxylated fatty acid (Luginbuehl et al., 2017). Therefore, the RAM2 enzyme
might have evolved from cutin-specific GPATs. However, contrary to biosynthesis of cutin
precursors, the hypothetical AMF-induced MAG synthesis does likely not involve further fatty acid
modifications at the ER, as no MAG species (α or β) with hydroxylated fatty acids or dicarboxylic
fatty acids could be detected. Taken together, this indicates that the β-MAG species produced by
RAM2 function in fungal nutrition rather than signaling, in accordance with the current scientific
consensus (Bravo et al., 2017; Choi et al., 2018; Jiang et al., 2017; Keymer et al., 2017; Keymer and
Gutjahr, 2018; Luginbuehl et al., 2017; Luginbuehl and Oldroyd, 2017; MacLean et al., 2017; Rich
et al., 2017; Roth and Paszkowski, 2017). How does the putative lipid (i. e. 16:0 β-MAG) reaches
the fungus? During extracellular cutin assembly, PM-resident ABCG transporters (AtABCG11,
AtABCG13, AtABCG23) have been described that have been inferred to be involved in secretion of
cutin monomers to the apoplast for subsequent extracellular polymerization (Fich et al., 2016). In
addition, β-MAGs with C22 and C24 fatty acids were shown to be present as components of
extracellular root waxes (Li et al., 2007), showing that after intracellular synthesis, MAGs can be
exported from the cell. Therefore, a similar trans-membrane lipid transport mechanism might
exist in AM symbiosis (see 4.1.5.1).
Fatty acids and lipids are water-insoluble and therefore insoluble in the plant cytoplasm,
the periarbuscular space and the fungal cytoplasm. Furthermore, they need to traverse the
periarbuscular membrane and the fungal plasma membrane to reach the fungal cytoplasm and
finally the ER, where they can be incorporated into fungal lipids. Recently, electron microscopy
and tomography have revealed electron-dense fungal tubular structures close to the fungal
plasma membrane, located in the fine and thick branches of the arbuscules (Ivanov et al., 2019).
In the same study, intramatrix compartments (IMC-I, see figure 27), which are tubular and
vesicular extensions of the PAM into the PAS around the arbuscule thick branches, were reported.
It has also been described that in functional arbuscules close to the PAM, the plant cytoplasm is
enriched in ER, golgi bodies, plastids and mitochondria.
In a second study using the same approach, similar PAM evaginations, called memtubes,
were described, which also are continuous with the plant cytoplasm and are close to the fungal
membrane around the arbuscule fine branches. Additionally, discrete vesicles were described that
4.1.5.1 Lipid Secretion across the Symbiotic Interface

124
were present in the PAS in the vicinity of the arbuscule fine and thick branches. These were
termed apoplastic vesicular structures (AVS, see figure 27) and might resemble secretory,
extracellular vesicles directed by the plant to the fungus for symbiotic nutrient (lipid) transfer
(Roth et al., 2019).
Taken together, the plant might set up a secretory machinery to enable export of molecules
from the ER, such as lipids (i. e. 16:0 β-MAG), and an interconnected network of membrane
evaginations and extracellular vesicles to enable transfer across the plant-fungus interface. Earlier
results have shown that the PAM adjacent to the fine branches is targeted by polar localization of
exocytosis (Ivanov et al., 2012; Zhang et al., 2015) and is thus the place of arbuscule growth by
hyphal extension and branching. Additionally, the symbiotic phosphate transporter PT4, which
engages in symbiotic mineral nutrient transfer, is targeted to the PAM at these fine branches
(Breuillin-Sessoms et al., 2015; Harrison et al., 2002; Pumplin et al., 2012). The fine branches are
thus very active in symbiotic mineral exchange and therefore could very well be the place for the
suggested symbiotic lipid transfer. Even though the thick branches and the arbuscule trunk do
also contain close contact sites with the plant cytoplasm and might therefore also engage in
metabolic exchange.
The half-size ABC transporters STR1 and STR2 are expressed in the PAM in the arbuscule
branch domain, similar to PT4 (Gutjahr et al., 2012; Zhang et al., 2010). In Arabidopsis, different
ABCG transporter have been characterized that exhibit defects in root and pollen suberin (Yadav
et al., 2014), and in the cuticle of Arabidopsis aerial organs (Bessire et al., 2011; Bird et al., 2007;
Panikashvili et al., 2011). The suberin and cutin chemical composition of these mutants is
furthermore characterized by a decrease in aliphatic and aromatic components. Therefore, ABCG
transporters have been concluded to be involved in cutin and suberin monomer export across the
plasma membrane for extracellular polymer assembly. However, no direct transport experiments
were conducted and the nature of the transported lipid substrate was not investigated for any
ABCG transporter involved in cutin and suberin assembly. For cutin, β-MAG export was inferred
for these ABCG transporters, because the recombinant, cuticle-localized CUS1 (CUTIN SYNTHASE)
enzyme from tomato catalyzes polymerization of β-MAG monomers with 10,16-dihydroxy fatty
acids (2-mono(10,16-dihydroxyhexadecnoyl)glycerol) (Fich et al., 2016; Yeats et al., 2012; Yeats
et al., 2014). Consequently, STR1 and STR2 might be involved in symbiotic fatty acid export during
AM-symbiosis by transporting 16:0 β-MAG into the PAS. Currently, there is no direct experimental
evidence for this hypothesis, but 16:0 β-MAG in colonized str mutants of Medicago was not as
severely reduced as 16:0 β-MAG in colonized ram2 and fatm mutants. Although it still remained
reduced in comparison to colonized WT, this finding could indicate that in colonized Medicago str
mutants, 16:0 β-MAG export is blocked and therefore accumulates to a certain degree in the plant
(Bravo et al., 2017; MacLean et al., 2017).

125
4.1.6 Possible alternative Mechanisms for AMF to obtain Fatty Acids and Lipids
Next to the data presented here, multiple other lines of evidence suggest that AMF obtain
their fatty acids by inducing fatty acid and lipid synthesis in plants via DIS, FatM and RAM2. As
discussed above (see 4.1.5), lipids or fatty acids might then be exported from plants to mycorrhiza
fungi via a plant lipid export mechanism involving secreted extracellular vesicles or
membrane-transport via STR (Jiang et al., 2017; Keymer et al., 2017; Luginbuehl et al., 2017; Rich
et al., 2017). Even though this is the most likely mechanism of how AMF obtain fatty acids,
alternatives to this AM-induced plant lipid synthesis and export pathway are discussed below.
These could provide alternatives of how AMF obtain fatty acids and lipids, if they are not directly
fed to the fungus by the plant.
During arbuscule senescence, lipid droplets that contain lipids from the PAM accumulate
around the collapsing arbuscule branches (Kobae et al., 2014). These lipids could be incorporated
by the fungus and therefore could be a source of lipids to AMF. Alluringly, R. irregularis contains
36 putatively secreted lipases that could be employed for hydrolysis of the PAM-lipids and
subsequent uptake of fatty acids into the fungus (Kamel et al., 2017). In theory, FatM could be
involved in synthesis of fatty acids directed towards the PAM, rather than direct feeding of fatty
acids to the fungus. However, FatM expression is highest in arbuscocytes when the hyphae form
fine branches and therefore already represent fully-branched, functional arbuscules (Bravo et al.,
2017). As a pre-requisite, this requires extensive PAM synthesis beforehand. The timely
expression of FatM in the vicinity of functional arbuscules therefore argues against a function in
synthesis of the PAM.
As a second alternative mechanism how AMF could obtain fatty acids, they could have
evolved a yet uncharacterized way to synthesize the bulk amount of fatty acids. Mitochondria are
capable of fatty acid synthesis and even though AMF lack the genes coding for cytosolic type-I FAS,
AMF still contain mitochondrial type II FAS genes. Three genes from Rhizophagus with homology
to mitochondrial FAS II enzymes are upregulated in a low-phosphate dependent manner in
colonized roots (Vijayakumar et al., 2016). In eukaryotes, mitochondrial FAS (mtFASII) produces
octanoyl-ACP as a precursor for lipoic acid (Witkowski et al., 2007). Alterations in mtFASII activity
affected the amounts of lysophospholipids and sphingolipids but not the fatty acid composition of
mitochondria, although it remained unclear whether these effects are caused by alterations in
lipoic acid metabolism or respiration (Clay et al., 2016). It has been suggested that long-chain fatty
acids can be produced by mtFASII for mitochondrial phospholipid remodeling and protein
acylation, but this has not been experimentally demonstrated (Hiltunen et al., 2010). These
findings indicate that mtFASII produces mainly lipoic acid as a cofactor for enzymes of oxidative
decarboxylation rather than serving as source for the bulk-supply of fatty acids for extra
mitochondrial lipids of AMF.

126
In the sleeping sickness parasite Trypanosoma spp. a third way of synthesizing fatty acids
apart from type-I and type-II FAS complexes has evolved. Trypanosoma employs microsomal
elongase enzymes (ELO) to elongate butyryl-CoA (C4) with repetitive incorporation of acetate
units from malonyl-CoA to yield myristic acid (C14). Myristic acid serves as acyl-chain of
GPI-anchors or can be elongated to C16—C20 via other ELO enzymes (ELO3) for incorporation
into phospholipids. Trypanosoma can also scavenge fatty acids from the host environment to
supply the ELO3-elongation pathway and it has been speculated that it switches to de novo
synthesis from butyryl-CoA when it enters the cerebrospinal fluid, where fatty acid concentrations
are lower than in the blood (Lee et al., 2007). Thus, depending on the environmental conditions,
Trypanosoma is able to synthesize fatty acids from acetate (after conversion into acetyl-CoA and
malonyl-CoA) independent of the cytosolic type I FAS genes.
Taken together, the uptake of lipids from the receding PAM via lipid droplets by the fungus
might be an indirect way of how plant-derived lipids reach the fungus. However, the timed
expression of FatM argues against a function in PAM synthesis and rather favors a function in 16:0
fatty acid production for direct feeding of fatty acids to the fungus. Due to the lack of evidence that
mitochondrial fatty acid synthesis can supply the bulk amount of fatty acids, it is also rather
unlikely that mitochondrial type II FAS genes have evolved to take over the function of cytosolic
type I FAS in AMF. Whether AMF have evolved an alternative yet uncharacterized way of
synthesizing fatty acids de novo, comparable to Trypanosoma, remains speculative.
4.2 Fatty Acid Desaturation in R. irregularis
4.2.1 R. irregularis contains two Functional Homologs of ScOLE1
The R. irregularis genome contains two that are orthologos of the acyl-CoA desaturase gene
OLE1 from S. cerevisiae. These two sequences were termed RiOLE1 and RiOLE1-LIKE (Figure 20).
As S. cerevisiae contains only a single copy of OLE1 and the RiOLE1 amino acid sequence is more
similar to ScOLE1 (56% amino acid sequence identity) than RiOLE1-LIKE (54.2% amino acid
sequence identity), RiOLE1-LIKE could have occurred via gene duplication of OLE1 in R. irregularis,
making RiOLE1 and RiOLE1-LIKE paralogs.
Transformation of yeast WT and yeast ScΔole1 mutant with RiOLE1 and RiOLE1-LIKE both
led to partial complementation of the fatty acid auxotrophy of ScΔole1 when grown in the absence
of monounsaturated fatty acids at 28°C (Figure 21). Thus, RiOLE1 and RiOLE1-LIKE are
functionally related to ScOLE1 and therefore represent functional homologs of ScOLE1. Acyl-CoA
desaturases are ubiquitously present in many organisms, and in previous experiments, the
function of genes similar to yeast OLE1 from various organisms was studied by functional
replacement of the disrupted ScOLE1 in the Δole1 mutant (Anamnart et al., 1997; Miyazaki et al.,
2006; Shanklin et al., 1994; Stukey et al., 1990; Tsai et al., 2019; Wongwathanarat et al., 1999),
similar to the experiment presented in figure 18. In this experiment, RiOLE1 did complement the

127
growth deficiency of Δole1 better than RiOLE1-LIKE (Figure 21), which shows that the closer
sequence similarity of ScOLE1 to RiOLE1 is also reflected on a functional level. ScOLE1 is active
with palmitoyl-CoA and stearoyl-CoA, producing palmitoleoyl-CoA and oleoyl-CoA, respectively
(Tsai et al., 2019). Due to the closer sequence similarity, RiOLE1 likely shares this activity, while
RiOLE1-LIKE might have a more specialized function.
4.2.2 RiOLE1-LIKE is specialized for Mycorrhiza-Signature Fatty Acids
In yeast WT and Δole1 expressing RiOLE1-LIKE, the mycorrhiza-signature fatty acids
16:1ω5 and 18:1ω7 were detected that are normally only observed in AMF-colonized roots and
extraradical mycelium (Figure 22a, b). Transient expression in N. benthamiana confirmed the
occurrence of 16:1ω5 when RiOLE1-LIKE, but not RiOLE1, was expressed (Figure 22c, d). From
these results it can be deduced that RiOLE1-LIKE is responsible for insertion of the
mycorrhiza-signature double bond at position ω5(Δ11).
The ScΔole1 mutant is a suitable model system to study fatty acid desaturation as it has a
low background desaturation activity (Stukey et al., 1989). However, in ScΔole1 harboring an
empty vector control, residual Δ9-desaturation activity was revealed by the presence of 16:1 Δ9
and 18:1 Δ9, even though the latter was present in smaller amounts (Figure 22e, f). In comparison
to ScΔole1 EV, the amount of the two Δ9 monunsaturated fatty acids decreased in ScΔole1 when
RiOLE1-LIKE was expressed, while 18:1Δ9 was lower in comparison to ScΔole1 expressing RiOLE1.
Upon expression of RiOLE1 in ScΔole1, mainly 18:1Δ9 accumulated and the amount of 16:1Δ9 was
reduced in comparison to ScΔole1 EV (Figure 22e, f). In addition, 16:1ω5 was the most abundant
fatty acid in ScΔole1 expressing RiOLE1-LIKE and therefore, RiOLE1-LIKE likely prefers 16:0 fatty
acid as a substrate but can also act to some degree on 18:0 fatty acid, synthesizing only the ω5/Δ11
double bond and not ω9/Δ9. In contrast, RiOLE1 likely acts primarily on 18:0 and to a lesser extent
on 16:0, introducing a double bond at the position Δ9.
As mentioned for heterologous expression of plant acyl-ACP thioesterase in E. coli (see
3.18 and 3.19), the endogenous substrate availability in the organism used for expression also has
an impact on the rate of reaction product formation. Yeast WT-EV and ScΔole1-EV contain by
default approximately three-times more 16:0 fatty acid than 18:0 fatty acid (Figure 22e), which
probably already shifts the activity of heterologously expressed RiOLE1 and RiOLE1-LIKE towards
16:0, just because it is more abundant. Nevertheless, the suggested substrate specificities of
RiOLE1-LIKE (16:0>18:0) and RiOLE1 (18:0>16:0) are reflected by the accumulation of
desaturated products in R. irregularis ERM, which contains substantially more 16:1ω5 than
18:1ω7 and more 18:1Δ9 than 16:1Δ9 (Olsson and Johansen, 2000). Functional differentiation of
desaturases has been reported before. In mice, four OLE1 isoforms are present, called
STEAROYL-COA DESATURASES (SCD), of which three act on 16:0-CoA and 18:0-CoA and one only

128
on acyl-CoAs with acyl chains < 16:0, producing Δ9 monounsaturated fatty acids (Miyazaki et al.,
2006).
4.2.3 RiOLE1-LIKE and RiOLE1 are Front-End Desaturases
Detailed analysis of 16:1 and 18:1 DMDS-adducts via mass spectrometry confirmed the
specific position of the double bonds at either Δ9 or Δ11 (ω5 in 16:1 and ω7 in 18:1, respectively),
depending on which Rhizophagus desaturase was expressed (Figure 22). Fatty acid desaturases
recognize the position for insertion of the double bond by counting carbon atoms from the methyl
or the carboxyl end (Meesapyodsuk and Qiu, 2012). In RiOLE1-LIKE-expressing ScΔole1, 18:1ω5
was not detected, but only 18:1ω7. The presence of 18:1ω5 would have indicated that 18:1 in
R. irregularis arises from elongation of 16:1ω5 or by recognition of the ω5-carbon by the
desaturase. Instead, the majority of monoeonic fatty acids in RiOLE1-LIKE-expressing ScΔole1
were derived from desaturation of 16:0 and 18:0, respectively, and not by elongation. Hence, both
desaturases recognize the position for insertion of the double bond with respect to the carboxyl
end and are thus front-end desaturases. The resulting fatty acids therefore should be called
16:1Δ11 and 18:1Δ11.
Next to unsaturated 16 and 18 carbon fatty acids, polyunsaturated fatty acids with chain
lengths >20 occur in R. irregularis (Jabaji-Hare, 1988; Wewer et al., 2014). The most abundant one,
20:3, was also employed as lipid marker in this study (Figure 9, 10, 16, 17, 18). How R. irregularis
produces these fatty acids is unknown, but the occurrence of 20:1-CoA in R. irregularis colonized
roots that was absent from colonized fatm-1 and mock-inoculated WT roots (Figure 19) suggests
that the 20:3 synthesis could involve a stepwise desaturation of 20:0, or elongation of 16:1, 18:1
and then further desaturation. R. irregularis also contains 18:2 fatty acid, and in the AMF Glomus
caledonius, a second 18:3 isomer (n-6) was reported (Beilby and Kidby, 1980) that is also present
in R. irregularis (Jabaji-Hare, 1988). This could represent the 20:3 precursor. The enzymes
responsible for desaturation of 20:x fatty acids are unknown and could involve yet
uncharacterized desaturases. As an alternative hypothesis, RiOLE1 and RiOLE1-LIKE could also
accept 20:x fatty acids for further desaturation and might even insert multiple double bonds into
18:x and 20:x fatty acids, but not 16:1, as there is no 16:2 or 16:3 fatty acids in R. irregularis.
4.2.4 Acyl-CoA Accumulation during Symbiosis with R. irregularis
Expression of RiOLE1 and RiOLE1-LIKE in yeast and N. benthamiana led to changes in the
composition of acyl-CoAs (Figure 26). In N. benthamiana, the most prominent change was the
occurrence of 16:1-CoA when RiOLE1-LIKE was expressed (Figure 26 b, c). In ScΔole1, where
16:1-CoA can also be detected in EV controls, RiOLE1-LIKE expression greatly increased 16:1-CoA
content. 18:1-CoA was increased by RiOLE1 expression (Figure 26 d, e). Desaturases have been

129
classified based on their substrates, which can be acyl-ACPs, acyl-lipids or acyl-CoAs (Los and
Murata, 1998). Acyl-ACP desaturases have only been described in plants (Cahoon et al., 1992;
Cahoon et al., 1994). Therefore, RiOLE1 and RiOLE1-LIKE either act on acyl-CoAs or acyl-lipids.
The observed changes in acyl-CoAs in yeast and N. benthamiana could be the consequence of
direct desaturation of acyl-CoAs or could be due to equilibration of acyl-groups from acyl-lipids
with the acyl-CoA pool.
Nevertheless, acyl-CoAs play a role in lipid metabolism in R. irregularis as revealed by the
changes in acyl-CoA composition in colonized and non-colonized L. japonicus roots (Figure 19).
16:1-CoA and 20:1-CoA were not detected in mock-inoculated roots, which indicates that at least
some of the acyl groups in R. irregularis are shuttled into TAG and membrane lipid synthesis via
acyl-CoA. In Mortierella alpina, another oleaginous fungus, desaturation of 18:1Δ9, other 18:x and
20:x fatty acids was shown to be catalyzed by two distinct desaturases that act on acyl-CoA as
substrates (Wang et al., 2018), and this could therefore also apply to the R. irregualris desaturases.
4.2.5 Importance of desaturated Fatty Acids in R. irregularis
The accumulating fatty acids in R. irregularis spores are most likely broken down to acetyl-
CoA via β-oxidation upon spore germination to subsequently yield reducing energy via follow-up
reaction. In theory, saturated fatty acids would be best suited for carbon and energy storage, and
there is no need to produce desaturated fatty acids. Why does R. irregularis invests additional
resources to desaturate 16:0 into 16:1Δ11 monunsaturated fatty acids? As 16:1Δ11 and other
mono and poly unsaturated fatty acids also occur in membrane lipids, one purpose of having
desaturated fatty acids could be to adapt membrane fluidity under stressful environmental
conditions, as has been shown for other fungi (Rodríguez-Vargas et al., 2007; Tan et al., 2017).
Alternatively, mycorrhiza signature fatty acids in hyphal membranes could serve for
recognition by the host. Surface-associated molecules are important for recognition of colonizing
fungi. For example, chitin in the fungal cell wall is recognized by hosts of pathogenic and
mycorrhiza fungi alike and either triggers plant defense reactions or the nuclear calcium-spiking
that precedes mycorrhiza accommodation, depending on the type of fungus (Bonfante and Genre,
2015). Modification of chitin in fungal cell walls was observed for the pathogenic fungi Puccinia
graminis f. sp. Tritici and Uromyces fabae, which modified surface-exposed chitin to chitosane by
de-N-acetylation to avoid host recognition (El Gueddari et al., 2002). Therefore, the fatty acid
desaturation signature of mycorrhiza hyphal membranes might be used to differentiate them
from pathogenic fungi.
The mycorrhiza signature fatty acid 16:1Δ11 is not only present in R. irregularis
membranes but also the most abundant fatty acid in the storage lipid TAG. Mycorrhiza fungi are
hosts to endophytic bacteria (Salvioli et al., 2016). The Δ11-desaturation signature on storage
lipids could therefore be a way to regulate lipid synthesis in response to the bacterial symbiont.

130
In the symbiosis between the endosymbiotic bacterium Spiroplasma poulsonii and Drosophila
melanogaster, D. melanogaster prevents over-proliferation of the symbiont by controlling the
availability of DAG that serves as carbon source for the symbiont. Interestingly, two DAG
molecular species containing one saturated and a monounsaturated fatty acid (32:1, 16:0-16:1Δ9
and 34:1, 16:0-18:1Δ9) are the primary source of fatty acids (Herren et al., 2014). An analogous
mechanism might be present in R. irregularis as well.
Having unusual fatty acids could also serve as obstruction to potential pathogens that
could try to scavenge lipids from the spores in the soil. A double bond does require more energy
investment for release of reducing energy in β-oxidation and the subsequent reactions. Thus, the
Δ11fatty acids would be less attractive for other organisms, or might even be completely useless
because they lack the appropriate enzymes to metabolize these unusual fatty acids, or might even
not recognized them. This would provide an advantage for R. irregularis spores to increase the
chances of survival in the soil.

131
5 Summary
Arbuscular mycorrhiza colonization of roots is an ancient symbiosis that presumably was
involved in the conquest of the land by early plants. Its main benefit for plants is the increased
access to soil mineral nutrients beyond the root depletion zone. Arbuscular mycorrhiza fungi
follow an obligate biotrophic lifestyle. Metabolites derived from photosynthesis of the host plant
represent the sole source of reduced carbon for AMF. During symbiotic growth, AMF colonize the
root and penetrate the cortex cells where the highly branched hyphae form arbuscules and where
metabolites are exchanged between host and symbiont. During post-symbiotic growth, the fungus
forms lipid-storage structures called vesicles and eventually grows out of the root into the soil
where it forms spores again that are filled with neutral storage lipids. Lipids in R. irregularis
contain fatty acids with unusual double bond positions, i. e. 16:1 Δ11/ω5 that are specific for AMF
and primarily accumulate in neutral lipids but also in membrane lipids. The genomes of multiple
AMF, such as the model fungus Rhziophagus irregularis, lack type-I cytosolic fatty acid synthase
genes (FAS) that are required for the synthesis of fatty acids. The absence of de novo fatty acid
synthesis from AMF therefore led to the hypothesis that next to hexoses, fatty acids serve as an
additional source of reduced carbon.
AMF-host co-evolution has shaped host plant genomes to contain conserved genes exclusively
dedicated to AMF symbiosis. One of these genes is the acyl-ACP Thioesterase M (FatM). Fat
enzymes terminate fatty acid elongation during de novo synthesis by hydrolysis of the thioester
and thereby liberate free fatty acids for lipid metabolism. The importance of FatM for AMF
symbiosis was investigated in the host plant Lotus japonicus during symbiosis with R. irregularis.
For this purpose, mycorrhiza-colonization of fatm transposon-insertion mutants was
characterized, 13C-labeling of fatty acids during symbiosis was conducted and the recombinant
FatM enzyme was studied in vitro.
Consistent with an essential role in AMF symbiosis, FatM gene expression was only detectable in
colonized roots. Reduction of FatM gene expression in fatm mutants led to impaired mycorrhiza
symbiosis. Fungal root colonization was reduced and R. irregularis exhibited a defect in storage
lipid accumulation. Furthermore, arbuscule branching was affected in fatm mutants and as a
consequence, symbiotic phosphate supply was decreased. The fatty acids 16:0, 18:0 and 18:1Δ9
are the three main products of plant fatty acid de novo synthesis and R. irregularis mainly
accumulates 16:0 and 16:1ω5. Recombinant expression and in vitro enzyme assays of FatM
revealed that 16:0-ACP is the preferred substrate. Therefore, plastids in arbuscocytes are
reprogrammed by induction of FatM to increase 16:0 fatty acid synthesis, which subsequently
accumulate in R. irregularis. Quantification of β-monoacylglycerols (MAG) revealed that 16:0
β-MAG shows a mycorrhiza-dependent profile, i. e. it accumulated upon colonization in the WT as

132
well as in ERM (hyphae and spores) but failed to accumulate to the same extent in colonized fatm
mutants. 16:0 β-MAG synthesis and secretion to the PAS might therefore represent the major
mechanism for 16:0 fatty acid transfer to the fungus. Labeling of fatty acids during symbiosis with
13C2-acetate demonstrated that FatM is essential for accumulation of the mycorrhiza-signature
fatty acids 16:1ω5 and 20:3, as a decrease of 13C over-excess label was observed in colonized fatm
mutants, which was independent of decreased fungal biomass.
Similar to other oleaginous fungi, AMF contain multiple unsaturated long-chain fatty acids.
The enzymes responsible for desaturation of these mycorrhiza-marker fatty acids were
previously unknown. Two genes with homology to the yeast acyl-CoA desaturase OLE1 are
present in R. irregularis, termed RiOLE1 and RiOLE1-LIKE. Both can act on 16:0 and 18:0 fatty acids
to produce a Δ9 (RiOLE1) or the mycorrhiza-specific ω5/Δ11 (RiOLE1-LIKE) double bond, as
revealed by heterologous expression in yeast and N. benthamiana. Expression also changed the
acyl-CoA pool composition, which was enriched in 18:1 or 16:1, depending on the heterologous
expression of RiOLE1 or RiOLE1-LIKE, respectively. Based on the high sequence similarity with
ScOLE1, RiOLE1 and RiOLE1-LIKE are most likely acyl-CoA desaturases.
The experiments presented here show that AMF reprogram fatty acid and lipid synthesis towards
the production of 16:0 fatty acids via FatM that are then transferred to the fungus for desaturation
and incorporation into lipids. In future, knowledge on symbiotic nutrient exchange can help to
understand and improve the benefits of mycorrhiza symbiosis for crop plant nutrition and plant
breeding.

133
6 References Ait Lahmidi, N., Courty, P.-E., Brulé, D., Chatagnier, O., Arnould, C., Doidy, J., Berta, G.,
Lingua, G., Wipf, D. and Bonneau, L. (2016) Sugar exchanges in arbuscular mycorrhiza: RiMST5 and RiMST6, two novel Rhizophagus irregularis monosaccharide transporters, are involved in both sugar uptake from the soil and from the plant partner. Plant Physiol. Biochem., 107, 354–363.
Akiyama, K., Matsuzaki, K.-i. and Hayashi, H. (2005) Plant sesquiterpenes induce hyphal branching in arbuscular mycorrhizal fungi. Nature, 435, 824–827.
Alexander, T., Toth, R., Meier, R. and Weber, H.C. (1989) Dynamics of arbuscule development and degeneration in onion, bean, and tomato with reference to vesicular–arbuscular mycorrhizae in grasses. Can. J. Bot., 67, 2505–2513.
Anamnart, S., Tomita, T., Fukui, F., Fujimori, K., Harashima, S., Yamada, Y. and Oshima, Y. (1997) The P-OLE1 gene of Pichia angusta encodes a Δ9-fatty acid desaturase and complements the ole1 mutation of Saccharomyces cerevisiae. Gene, 184, 299–306.
Andre, C., Haslam, R.P. and Shanklin, J. (2012) Feedback regulation of plastidic acetyl-coa carboxylase by 18:1-acyl carrier protein in Brassica napus. Proc. Natl. Acad. Sci. USA, 109, 10107–10112.
Aznar-Moreno, J.A., Sánchez, R., Gidda, S.K., Martínez-Force, E., Moreno-Pérez, A.J., Venegas Calerón, M., Garcés, R., Mullen, R.T. and Salas, J.J. (2018) New insights into sunflower (Helianthus annuus L.) FatA and FatB thioesterases, their regulation, structure and distribution. Front. Plant Sci., 9, 1496.
Bago, B., Pfeffer, P.E., Abubaker, J., Jun, J., Allen, J.W., Brouillette, J., Douds, D.D., Lammers, P.J. and Shachar-Hill, Y. (2003) Carbon export from arbuscular mycorrhizal roots involves the translocation of carbohydrate as well as lipid. Plant Physiol., 131, 1496–1507.
Bago, B., Pfeffer, P.E., Douds, D.D., Brouillette, J., Bécard, G. and Shachar-Hill, Y. (1999) Carbon metabolism in spores of the arbuscular mycorrhizal fungus Glomus intraradices as revealed by nuclear magnetic resonance spectroscopy. Plant Physiol., 121, 263–272.
Bago, B., Pfeffer, P.E. and Shachar-Hill, Y. (2000) Carbon metabolism and transport in arbuscular mycorrhizas. Plant Physiol., 124, 949–958.
Bago, B., Pfeffer, P.E., Zipfel, W., Lammers, P. and Shachar-Hill, Y. (2002 a) Tracking metabolism and imaging transport in arbuscular mycorrhizal fungi. Metabolism and transport in AM fungi. Plant Soil, 244, 189–197.
Bago, B., Zipfel, W., Williams, R.M., Jun, J., Arreola, R., Lammers, P.J., Pfeffer, P.E. and Shachar-Hill, Y. (2002 b) Translocation and utilization of fungal storage lipid in the arbuscular mycorrhizal symbiosis. Plant Physiol., 128, 108–124.
Baier, M.C., Keck, M., Gödde, V., Niehaus, K., Küster, H. and Hohnjec, N. (2010) Knockdown of the symbiotic sucrose synthase MtSucS1 affects arbuscule maturation and maintenance in mycorrhizal roots of Medicago truncatula. Plant Physiol., 152, 1000–1014.
Bárzana, G., Aroca, R. and Ruiz-Lozano, J.M. (2015) Localized and non-localized effects of arbuscular mycorrhizal symbiosis on accumulation of osmolytes and aquaporins and on antioxidant systems in maize plants subjected to total or partial root drying. Plant Cell Environ., 38, 1613–1627.
Bates, P.D., Johnson, S.R., Cao, X., Li, J., Nam, J.-W., Jaworski, J.G., Ohlrogge, J.B. and Browse, J. (2014) Fatty acid synthesis is inhibited by inefficient utilization of unusual fatty acids for glycerolipid assembly. Proc. Natl. Acad. Sci. USA, 111, 1204–1209.
Bates, P.D., Stymne, S. and Ohlrogge, J. (2013) Biochemical pathways in seed oil synthesis. Curr. Opin. Plant Biol., 16, 358–364.
Behal, R.H., Lin, M., Back, S. and Oliver, D.J. (2002) Role of acetyl-coenzyme A synthetase in leaves of Arabidopsis thaliana. Arch. Biochem. Biophys., 402, 259–267.
Beilby, J.P. (1980) Fatty acid and sterol composition of ungerminated spores of the vesicular-arbuscular mycorrhizal fungus, Acaulospora laevis. Lipids, 15, 949–952.

134
Beilby, J.P. and Kidby, D.K. (1980) Biochemistry of ungerminated and germinated spores of the vesicular-arbuscular mycorrhizal fungus, Glomus caledonius. Changes in neutral and polar lipids. J. Lipid Res., 21, 739–750.
Beisson, F., Li-Beisson, Y. and Pollard, M. (2012) Solving the puzzles of cutin and suberin polymer biosynthesis. Curr. Opin. Plant Biol., 15, 329–337.
Benning, C. and Ohta, H. (2005) Three enzyme systems for galactoglycerolipid biosynthesis are coordinately regulated in plants. J. Biol. Chem., 280, 2397–2400.
Bentivenga, S.P. and Morton, J.B. (1996) Congruence of fatty acid methyl ester profiles and morphological characters of arbuscular mycorrhizal fungi in Gigasporaceae. Proc. Natl. Acad. Sci. USA, 93, 5659–5662.
Bernardo, L., Carletti, P., Badeck, F.W., Rizza, F., Morcia, C., Ghizzoni, R., Rouphael, Y., Colla, G., Terzi, V. and Lucini, L. (2019) Metabolomic responses triggered by arbuscular mycorrhiza enhance tolerance to water stress in wheat cultivars. Plant Physiol. Biochem., 137, 203–212.
Besserer, A., Bécard, G., Jauneau, A., Roux, C. and Séjalon-Delmas, N. (2008) GR24, a synthetic analog of strigolactones, stimulates the mitosis and growth of the arbuscular mycorrhizal fungus Gigaspora rosea by boosting its energy metabolism. Plant Physiol., 148, 402–413.
Besserer, A., Puech-Pagès, V., Kiefer, P., Gomez-Roldan, V., Jauneau, A., Roy, S., Portais, J.-C., Roux, C., Bécard, G. and Séjalon-Delmas, N. (2006) Strigolactones stimulate arbuscular mycorrhizal fungi by activating mitochondria. PLoS Biol., 4, e226.
Bessire, M., Borel, S., Fabre, G., Carraça, L., Efremova, N., Yephremov, A., Cao, Y., Jetter, R., Jacquat, A.-C., Métraux, J.-P. and Nawrath, C. (2011) A Member of the pleiotropic drug resistance family of atp binding cassette transporters is required for the formation of a functional cuticle in arabidopsis. Plant Cell, 23, 1958–1970.
Binder, A., Lambert, J., Morbitzer, R., Popp, C., Ott, T., Lahaye, T. and Parniske, M. (2014) A modular plasmid assembly kit for multigene expression, gene silencing and silencing rescue in plants. PLoS One, 9, e88218.
Bird, D., Beisson, F., Brigham, A., Shin, J., Greer, S., Jetter, R., Kunst, L., Wu, X., Yephremov, A. and Samuels, L. (2007) Characterization of Arabidopsis ABCG11/WBC11, an ATP binding cassette (ABC) transporter that is required for cuticular lipid secretion. Plant J., 52, 485–498.
Bitterlich, M., Krügel, U., Boldt-Burisch, K., Franken, P. and Kühn, C. (2014) The sucrose transporter SlSUT2 from tomato interacts with brassinosteroid functioning and affects arbuscular mycorrhiza formation. Plant J., 78, 877–889.
Blee, K.A. and Anderson, A.J. (2002) Transcripts for genes encoding soluble acid invertase and sucrose synthase accumulate in root tip and cortical cells containing mycorrhizal arbuscules. Plant Mol. Biol., 50, 197–211.
Bligh, E.G. and Dyer, W.J. (1959) A rapid method of total lipid extraction and purification. Can. J. Biochem. Physiol., 37, 911–917.
Blilou, I., Ocampo, J.A. and García-Garrido, J.M. (2000) Induction of Ltp (lipid transfer protein) and Pal (phenylalanine ammonia-lyase) gene expression in rice roots colonized by the arbuscular mycorrhizal fungus Glomus mosseae. J. Exp. Bot., 51, 1969–1977.
Block, M.A. and Jouhet, J. (2015) Lipid trafficking at endoplasmic reticulum-chloroplast membrane contact sites. Curr. Opin. Cell Biol., 35, 21–29.
Boldt, K., Pörs, Y., Haupt, B., Bitterlich, M., Kühn, C., Grimm, B. and Franken, P. (2011) Photochemical processes, carbon assimilation and RNA accumulation of sucrose transporter genes in tomato arbuscular mycorrhiza. J. Plant Physiol., 168, 1256–1263.
Bonaventure, G., Salas, J.J., Pollard, M.R. and Ohlrogge, J.B. (2003) Disruption of the FATB gene in Arabidopsis demonstrates an essential role of saturated fatty acids in plant growth. Plant Cell, 15, 1020–1033.
Bonfante, P. (2018) The future has roots in the past: the ideas and scientists that shaped mycorrhizal research. New Phytol., 220, 982–995.
Bonfante, P. and Genre, A. (2015) Arbuscular mycorrhizal dialogues: do you speak 'plantish' or 'fungish'? Trends Plant Sci., 20, 150–154.
135
Bradford, M.M. (1976) A rapid and sensitive method for the quantitation of microgram quantities of protein utilizing the principle of protein-dye binding. Anal. Biochem., 72, 248–254.
Brands, M., Wewer, V., Keymer, A., Gutjahr, C. and Dörmann, P. (2018) The Lotus japonicus acyl-acyl carrier protein thioesterase FatM is required for mycorrhiza formation and lipid accumulation of Rhizophagus irregularis. Plant J., 95, 219–232.
Bravo, A., Brands, M., Wewer, V., Dörmann, P. and Harrison, M.J. (2017) Arbuscular mycorrhiza-specific enzymes FatM and RAM2 fine-tune lipid biosynthesis to promote development of arbuscular mycorrhiza. New Phytol., 214, 1631-1645.
Bravo, A., York, T., Pumplin, N., Mueller, L.A. and Harrison, M.J. (2016) Genes conserved for arbuscular mycorrhizal symbiosis identified through phylogenomics. Nat. Plants, 2, 15208.
Breuillin-Sessoms, F., Floss, D.S., Gomez, S.K., Pumplin, N., Ding, Y., Levesque-Tremblay, V., Noar, R.D., Daniels, D.A., Bravo, A., Eaglesham, J.B., Benedito, V.A., Udvardi, M.K. and Harrison, M.J. (2015) Suppression of arbuscule degeneration in Medicago truncatula phosphate transporter mutants is dependent on the ammonium transporter 2 family protein AMT2;3. Plant Cell, 27, 1352–1366.
Brown, A.P., Affleck, V., Fawcett, T. and Slabas, A.R. (2006) Tandem affinity purification tagging of fatty acid biosynthetic enzymes in Synechocystis sp. PCC6803 and Arabidopsis thaliana. J. Exp. Bot., 57, 1563–1571.
Brundrett, M. (1996) Working with mycorrhizas in forestry. Canberra: Australian Centre for International Agricultural Research.
Brundrett, M.C. (2002) Coevolution of roots and mycorrhizas of land plants. New Phytol., 154, 275–304.
Brundrett, M.C. and Tedersoo, L. (2018) Evolutionary history of mycorrhizal symbioses and global host plant diversity. New Phytol., 220, 1108–1115.
Bücking, H., Abubaker, J., Govindarajulu, M., Tala, M., Pfeffer, P.E., Nagahashi, G., Lammers, P. and Shachar-Hill, Y. (2008) Root exudates stimulate the uptake and metabolism of organic carbon in germinating spores of Glomus intraradices. New Phytol., 180, 684–695.
Cahoon, E.B., Cranmer, A.M., Shanklin, J. and Ohlrogge, J.B. (1994) delta 6 Hexadecenoic acid is synthesized by the activity of a soluble delta 6 palmitoyl-acyl carrier protein desaturase in Thunbergia alata endosperm. J. Biol.Chem., 269, 27519–27526.
Cahoon, E.B., Shanklin, J. and Ohlrogge, J.B. (1992) Expression of a coriander desaturase results in petroselinic acid production in transgenic tobacco. Proc. Natl. Acad. Sci. USA, 89, 11184–11188.
Calonne, M., Fontaine, J., Debiane, D., Laruelle, F., Grandmougin-Ferjani, A. and Lounes-Hadj Sahraoui, A. (2014) The arbuscular mycorrhizal Rhizophagus irregularis activates storage lipid biosynthesis to cope with the benzoapyrene oxidative stress. Phytochemistry, 97, 30–37.
Campagnac, E., Fontaine, J., Lounès-Hadj Sahraoui, A., Laruelle, F., Durand, R. and Grandmougin-Ferjani, A. (2009) Fenpropimorph slows down the sterol pathway and the development of the arbuscular mycorrhizal fungus Glomus intraradices. Mycorrhiza, 19, 365–374.
Campopiano, D.J. (2014) ACP-AasS you like it. Chem. Biol., 21, 1257–1259. Campos, P., Borie, F., Cornejo, P., López-Ráez, J.A., López-García, Á. and Seguel, A. (2018)
Phosphorus acquisition efficiency related to root traits: is mycorrhizal symbiosis a key factor to wheat and barley cropping? Front. Plant Sci., 9, 1-21.
Chan, D.I. and Vogel, H.J. (2010) Current understanding of fatty acid biosynthesis and the acyl carrier protein. Biochem. J., 430, 1–19.
Chapin, F.S. and Bieleski, R.L. (1982) Mild phosphorus stress in barley and a related low-phosphorus-adapted barleygrass: Phosphorus fractions and phosphate absorption in relation to growth. Physiol. Plant., 54, 309–317.
Chen, E.C., Mathieu, S., Hoffrichter, A., Sedzielewska-Toro, K., Peart, M., Pelin, A., Ndikumana, S., Ropars, J., Dreissig, S., Fuchs, J., Brachmann, A. and Corradi, N. (2018) Single nucleus sequencing reveals evidence of inter-nucleus recombination in arbuscular mycorrhizal fungi. Elife, 7:e39813.

136
Chen, L.-Q., Hou, B.-H., Lalonde, S., Takanaga, H., Hartung, M.L., Qu, X.-Q., Guo, W.-J., Kim, J.-G., Underwood, W., Chaudhuri, B., Chermak, D., Antony, G., White, F.F., Somerville, S.C., Mudgett, M.B. and Frommer, W.B. (2010) Sugar transporters for intercellular exchange and nutrition of pathogens. Nature, 468, 527–532.
Chen, M., Arato, M., Borghi, L., Nouri, E. and Reinhardt, D. (2018) Beneficial services of arbuscular mycorrhizal fungi - from ecology to application. Front. Plant Sci., 9, 1270.
Chiu, C.H. and Paszkowski, U. (2019) Mechanisms and impact of symbiotic phosphate acquisition. Cold Spring Harb. Perspect. Biol., 11, 1-32.
Choi, J., Summers, W. and Paszkowski, U. (2018) Mechanisms underlying establishment of arbuscular mycorrhizal symbioses. Annu. Rev. Phytopathol., 56, 135–160.
Clay, H.B., Parl, A.K., Mitchell, S.L., Singh, L., Bell, L.N. and Murdock, D.G. (2016) Altering the mitochondrial fatty acid synthesis (mtFASII) pathway modulates cellular metabolic states and bioactive lipid profiles as revealed by metabolomic profiling. PLoS One, 11, e0151171.
Cooper, K.M. and Lösel, D.M. (1978) Lipid physiology of vesicular-abuscular mycorrhiza. Composition of lipids in roots of onion, clover and ryegrass infected with Glomus mosseae. New Phytol., 80, 143–151.
Corradi, N., Hijri, M., Fumagalli, L. and Sanders, I.R. (2004) Arbuscular mycorrhizal fungi (Glomeromycota) harbour ancient fungal tubulin genes that resemble those of the chytrids (Chytridiomycota). Fung. Genet. Biol., 41, 1037–1045.
Cranenbrouck, S., Voets, L., Bivort, C., Renard, L., Strullu, D.-G. and Declerck, S. (2005) Methodologies for in vitro cultivation of arbuscular mycorrhizal fungi with root organs. In In Vitro Culture of Mycorrhizas (Declerck, S., Fortin, J.A. and Strullu, D.-G., eds). Berlin, Heidelberg: Springer Berlin Heidelberg, 341–375.
Cronan, J.E. and Klages, A.L. (1981) Chemical synthesis of acyl thioesters of acyl carrier protein with native structure. Proc. Natl. Acad. Sci. USA, 78, 5440–5444.
Dalpé, Y., Trépanier, M., Sahraoui, A.L.-H., Fontaine, J. and Sancholle, M. (2012) 8 lipids of mycorrhizas. In Fungal Associations. 2nd edn. (Hock, B., ed): Springer Berlin Heidelberg, 137–169.
Debiane, D., Calonne, M., Fontaine, J., Laruelle, F., Grandmougin-Ferjani, A. and Lounes-Hadj Sahraoui, A. (2011) Lipid content disturbance in the arbuscular mycorrhizal, Glomus irregulare grown in monoxenic conditions under PAHs pollution. Fungal Biol., 115, 782–792.
Dehesh, K., Jones, A., Knutzon, D.S. and Voelker, T.A. (1996) Production of high levels of 8:0 and 10:0 fatty acids in transgenic canola by overexpression of Ch FatB2, a thioesterase cDNA from Cuphea hookeriana. Plant J., 9, 167–172.
Delaux, P.-M., Varala, K., Edger, P.P., Coruzzi, G.M., Pires, J.C. and Ané, J.-M. (2014) Comparative phylogenomics uncovers the impact of symbiotic associations on host genome evolution. PLoS Genet., 10, e1004487.
Destaillats, F., Cruz-Hernandez, C., Nagy, K. and Dionisi, F. (2010) Identification of monoacylglycerol regio-isomers by gas chromatography-mass spectrometry. J. Chromat. B, 1217, 1543–1548.
Diezel, W., Kopperschläger, G. and Hofmann, E. (1972) An improved procedure for protein staining in polyacrylamide gels with a new type of coomassie brilliant blue. Anal. Biochem., 48, 617–620.
Doehlemann, G., Wahl, R., Horst, R.J., Voll, L.M., Usadel, B., Poree, F., Stitt, M., Pons-Kühnemann, J., Sonnewald, U., Kahmann, R. and Kämper, J. (2008) Reprogramming a maize plant: transcriptional and metabolic changes induced by the fungal biotroph Ustilago maydis. Plant J., 56, 181–195.
Doidy, J., van Tuinen, D., Lamotte, O., Corneillat, M., Alcaraz, G. and Wipf, D. (2012) The Medicago truncatula sucrose transporter family: characterization and implication of key members in carbon partitioning towards arbuscular mycorrhizal fungi. Mol. Plant, 5, 1346–1358.
Domergue, F., Abbadi, A., Zähringer, U., Moreau, H. and Heinz, E. (2005) In vivo characterization of the first acyl-CoA Δ6-desaturase from a member of the plant kingdom, the microalga Ostreococcus tauri. Biochem. J., 389, 483–490.

137
Dörmann, P., Voelker, T.A. and Ohlrogge, J.B. (1995) Cloning and expression in Escherichia coli of a novel thioesterase from Arabidopsis thaliana specific for long-chain acyl-acyl carrier proteins. Arch. Biochem. Biophys., 316, 612–618.
Douds, D.D. (1994) Relationship between hyphal and arbuscular colonization and sporulation in a mycorrhiza of Paspalum notatum Flugge. New Phytol., 126, 233–237.
Douds, D.D. and Schenk, N.C. (1990) Relationship of colonization and sporulation by VA mycorrhizal fungi to plant nutrient and carbohydrate contents. New Phytol., 116, 621–627.
Dreher, D., Yadav, H., Zander, S. and Hause, B. (2017) Is there genetic variation in mycorrhization of Medicago truncatula? PeerJ, 5, e3713.
Ecclestone, V.S. and Ohlrogge, J.B. (1998) Expression of lauroyl-acyl carrier protein thioesterase in Brassica napus seeds induces pathways for both fatty acid oxidation and biosynthesis and implies a set point for triacylglycerol accumulation. Plant Cell, 10, 613–622.
Ejsing, C.S., Duchoslav, E., Sampaio, J., Simons, K., Bonner, R., Thiele, C., Ekroos, K. and Shevchenko, A. (2006) Automated identification and quantification of glycerophospholipid molecular species by multiple precursor ion scanning. Anal. Chem., 78, 6202–6214.
El Gueddari, N.E., Rauchhaus, U., Moerschbacher, B.M. and Deising, H.B. (2002) Developmentally regulated conversion of surface-exposed chitin to chitosan in cell walls of plant pathogenic fungi. New Phytol., 156, 103–112.
El Tahchy, A., Reynolds, K.B., Petrie, J.R., Singh, S.P. and Vanhercke, T. (2017) Thioesterase overexpression in Nicotiana benthamiana leaf increases the fatty acid flux into triacylgycerol. FEBS Lett., 591, 448–456.
Endre, G., Kereszt, A., Kevei, Z., Mihacea, S., Kaló, P. and Kiss, G.B. (2002) A receptor kinase gene regulating symbiotic nodule development. Nature, 417, 962–966.
Favre, P., Bapaume, L., Bossolini, E., Delorenzi, M., Falquet, L. and Reinhardt, D. (2014) A novel bioinformatics pipeline to discover genes related to arbuscular mycorrhizal symbiosis based on their evolutionary conservation pattern among higher plants. BMC Plant Biol., 14, 333.
Fester, T. (2002) Occurrence and localization of apocarotenoids in arbuscular mycorrhizal plant roots. Plant Cell Physiol., 43, 256–265.
Fester, T., Strack, D. and Hause, B. (2001) Reorganization of tobacco root plastids during arbuscule development. Planta, 213, 864–868.
Fich, E.A., Segerson, N.A. and Rose, J.K.C. (2016) The plant polyester cutin: biosynthesis, structure, and biological roles. Annu. Rev. Plant. Biol., 67, 207–233.
Flores, C.-L. and Gancedo, C. (2015) The gene YALI0E20207g from Yarrowia lipolytica encodes an N-acetylglucosamine kinase implicated in the regulated expression of the genes from the N-acetylglucosamine assimilatory pathway. PLoS One, 10, 1-21.
Floss, D.S., Gomez, S.K., Park, H.-J., MacLean, A.M., Müller, L.M., Bhattarai, K.K., Lévesque-Tremblay, V., Maldonado-Mendoza, I.E. and Harrison, M.J. (2017) A transcriptional program for arbuscule degeneration during AM symbiosis is regulated by MYB1. Curr. Biol., 27, 1206–1212.
Floss, D.S., Levy, J.G., Lévesque-Tremblay, V., Pumplin, N. and Harrison, M.J. (2013) DELLA proteins regulate arbuscule formation in arbuscular mycorrhizal symbiosis. Proc. Natl. Acad. Sci. USA, 110, E5025-34.
Fontaine, J., Grandmougin-Ferjani, A., Glorian, V. and Durand, R. (2004) 24-methyl/methylene sterols increase in monoxenic roots after colonization by arbuscular mycorrhizal fungi. New Phytol., 163, 159–167.
Fontaine, J., Grandmougin-Ferjani, A., Hartmann, M.A. and Sancholle, M. (2001a) Sterol biosynthesis by the arbuscular mycorrhizal fungus Glomus intraradices. Lipids, 36, 1357–1363.
Fontaine, J., Grandmougin-Ferjani, A. and Sancholle, M. (2001b) Lipid metabolism of the endomycorrhizal fungus. Glomus intraradices. C. R. Acad. Sci. III, 324, 847–853.
Francis, G.W. (1981) Alkylthiolation for the determination of double-bond position in unsaturated fatty acid esters. Chem. Phys. Lipids, 29, 369–374.

138
Fulda, M., Schnurr, J., Abbadi, A., Heinz, E. and Browse, J. (2004) Peroxisomal Acyl-CoA synthetase activity is essential for seedling development in Arabidopsis thaliana. Plant cell, 16, 394–405.
Garabagi, F., Gilbert, E., Loos, A., McLean, M.D. and Hall, J.C. (2012) Utility of the P19 suppressor of gene-silencing protein for production of therapeutic antibodies in Nicotiana expression hosts. Plant Biotechnol. J., 10, 1118–1128.
Gaspar, L., Pollero, R. and Cabello, M. (1997) Variations in the lipid composition of alfalfa roots during colonization with the arbuscular mycorrhizal fungus Glomus versiforme. Mycologia, 89, 37–42.
Gaspar, L., Pollero, R. and Cabello, M. (2001) Biosynthesis and degradation of glycerides in external mycelium of Glomus mosseae. Mycorrhiza, 11, 257–261.
Gaspar, M.L., Pollero, R. and Cabello, M. (1997) Partial purification and characterization of a lipolytic enzyme from spores of the arbuscular mycorrhizal fungus Glomus versiforme. Mycologia, 89, 610–614.
Gaspar, M.L., Pollero, R.J. and Cabello, M.N. (1994) Triacylglycerol consumption during spore germination of vesicular-arbuscular mycorrhizal fungi. J. Am. Oil Chem. Soc., 71, 449–452.
Gasulla, F., vom Dorp, K., Dombrink, I., Zähringer, U., Gisch, N., Dormann, P. and Bartels, D. (2013) The role of lipid metabolism in the acquisition of desiccation tolerance in Craterostigma plantagineum: A comparative approach. Plant J., 75, 726–741.
Gaude, N., Bortfeld, S., Duensing, N., Lohse, M. and Krajinski, F. (2012) Arbuscule-containing and non-colonized cortical cells of mycorrhizal roots undergo extensive and specific reprogramming during arbuscular mycorrhizal development. Plant J., 69, 510–528.
Genre, A., Chabaud, M., Balzergue, C., Puech-Pagès, V., Novero, M., Rey, T., Fournier, J., Rochange, S., Bécard, G., Bonfante, P. and Barker, D.G. (2013) Short-chain chitin oligomers from arbuscular mycorrhizal fungi trigger nuclear Ca2+ spiking in Medicago truncatula roots and their production is enhanced by strigolactone. New Phytol., 198, 190–202.
Genre, A., Chabaud, M., Faccio, A., Barker, D.G. and Bonfante, P. (2008) Prepenetration apparatus assembly precedes and predicts the colonization patterns of arbuscular mycorrhizal fungi within the root cortex of both Medicago truncatula and Daucus carota. Plant Cell, 20, 1407–1420.
Genre, A., Chabaud, M., Timmers, T., Bonfante, P. and Barker, D.G. (2005) Arbuscular mycorrhizal fungi elicit a novel intracellular apparatus in Medicago truncatula root epidermal cells before infection. Plant Cell, 17, 3489–3499.
Genre, A. and Russo, G. (2016) Does a common pathway transduce symbiotic signals in plant-microbe interactions? Front. Plant Sci., 7, 96.
Gibert, A., Tozer, W. and Westoby, M. (2019) Plant performance response to eight different types of symbiosis. New Phytol., 222, 526–542.
Gidda, S.K., Shockey, J.M., Rothstein, S.J., Dyer, J.M. and Mullen, R.T. (2009) Arabidopsis thaliana GPAT8 and GPAT9 are localized to the ER and possess distinct ER retrieval signals: Functional divergence of the dilysine ER retrieval motif in plant cells. Plant Physiol. Biochem., 47, 867–879.
Gietz, R.D., Schiestl, R.H., Willems, A.R. and Woods, R.A. (1995) Studies on the transformation of intact yeast cells by the LiAc/SS-DNA/PEG procedure. Yeast, 11, 355–360.
Giovannetti, M., Tolosano, M., Volpe, V., Kopriva, S. and Bonfante, P. (2014) Identification and functional characterization of a sulfate transporter induced by both sulfur starvation and mycorrhiza formation in Lotus japonicus. New Phytol., 204, 609–619.
Gomez, S.K., Javot, H., Deewatthanawong, P., Torres-Jerez, I., Tang, Y., Blancaflor, E.B., Udvardi, M.K. and Harrison, M.J. (2009) Medicago truncatula and Glomus intraradices gene expression in cortical cells harboring arbuscules in the arbuscular mycorrhizal symbiosis. BMC Plant Biol., 9, 10.
Govindarajulu, M., Pfeffer, P.E., Jin, H., Abubaker, J., Douds, D.D., Allen, J.W., Bucking, H., Lammers, P.J. and Shachar-Hill, Y. (2005) Nitrogen transfer in the arbuscular mycorrhizal symbiosis. Nature, 435, 819–823.

139
Graham, J.H., Hodge, N.C. and Morton, J.B. (1995) Fatty acid methyl ester profiles for characterization of glomalean fungi and their endomycorrhizae. Appl. Environm. Microbiol., 61, 58–64.
Grandmougin-Ferjani, A., Dalpé, Y., Hartmann, M.-A., Laruelle, F. and Sancholle, M. (1999) Sterol distribution in arbuscular mycorrhizal fungi. Phytochemistry, 50, 1027–1031.
Gutjahr, C., Gobbato, E., Choi, J., Riemann, M., Johnston, M.G., Summers, W., Carbonnel, S., Mansfield, C., Yang, S.-Y., Nadal, M., Acosta, I., Takano, M., Jiao, W.-B., Schneeberger, K., Kelly, K.A. and Paszkowski, U. (2015) Rice perception of symbiotic arbuscular mycorrhizal fungi requires the karrikin receptor complex. Science, 350, 1521–1524.
Gutjahr, C. and Parniske, M. (2013) Cell and developmental biology of arbuscular mycorrhiza symbiosis. Annu. Rev. Cell Dev. Biol., 29, 593–617.
Gutjahr, C. and Parniske, M. (2017) Cell biology: control of partner lifetime in a plant-fungus relationship. Curr. Biol., 27, 420-423.
Gutjahr, C., Radovanovic, D., Geoffroy, J., Zhang, Q., Siegler, H., Chiapello, M., Casieri, L., An, K., An, G., Guiderdoni, E., Kumar, C.S., Sundaresan, V., Harrison, M.J. and Paszkowski, U. (2012) The half-size ABC transporters STR1 and STR2 are indispensable for mycorrhizal arbuscule formation in rice. Plant J., 69, 906–920.
Hammer, E.C., Pallon, J., Wallander, H. and Olsson, P.A. (2011) Tit for tat? A mycorrhizal fungus accumulates phosphorus under low plant carbon availability. FEMS Microbiol. Ecol., 76, 236–244.
Handa, Y., Nishide, H., Takeda, N., Suzuki, Y., Kawaguchi, M. and Saito, K. (2015) RNA-seq transcriptional profiling of an arbuscular mycorrhiza provides insights into regulated and coordinated gene expression in Lotus japonicus and Rhizophagus irregularis. Plant Cell Physiol., 56, 1490–1511.
Harrison, M.J. (1993) Isoflavonoid accumulation and expression of defense gene transcripts during the establishment of vesicular-arbuscular mycorrhizal associations in roots of Medicago truncatula. Mol. Plant Micr. Interact., 6, 643.
Harrison, M.J. (1996) A sugar transporter from Medicago truncatula: altered expression pattern in roots during vesicular-arbuscular (VA) mycorrhizal associations. Plant J., 9, 491–503.
Harrison, M.J., Dewbre, G.R. and Liu, J. (2002) A phosphate transporter from Medicago truncatula involved in the acquisition of phosphate released by arbuscular mycorrhizal fungi. Plant Cell, 14, 2413–2429.
Harrison, M.J. and van Buuren, M.L. (1995) A phosphate transporter from the mycorrhizal fungus Glomus versiforme. Nature, 378, 626–629.
Hause, B., Maier, W., Miersch, O., Kramell, R. and Strack, D. (2002) Induction of jasmonate biosynthesis in arbuscular mycorrhizal barley roots. Plant Physiol., 130, 1213–1220.
Helber, N., Wippel, K., Sauer, N., Schaarschmidt, S., Hause, B. and Requena, N. (2011) A versatile monosaccharide transporter that operates in the arbuscular mycorrhizal fungus Glomus sp is crucial for the symbiotic relationship with plants. Plant Cell, 23, 3812–3823.
Herren, J.K., Paredes, J.C., Schüpfer, F., Arafah, K., Bulet, P. and Lemaitre, B. (2014) Insect endosymbiont proliferation is limited by lipid availability. Elife, 3, e02964.
Hiltunen, J.K., Autio, K.J., Schonauer, M.S., Kursu, V.A.S., Dieckmann, C.L. and Kastaniotis, A.J. (2010) Mitochondrial fatty acid synthesis and respiration. Biochem. Biophys. Acta, 1797, 1195–1202.
Ho, I. and Trappe, J.M. (1973) Translocation of 14C from festuca plants to their endomycorrhizal fungi. Nat. New Biol., 244, 30–31.
Hohnjec, N., Perlick, A.M., Pühler, A. and Küster, H. (2003) The Medicago truncatula sucrose synthase gene MtSucS1 is activated both in the infected region of root nodules and in the cortex of roots colonized by arbuscular mycorrhizal fungi. Mol. Plant Micr. Interact., 16, 903–915.
Huisman, R., Hontelez, J., Mysore, K.S., Wen, J., Bisseling, T. and Limpens, E. (2016) A symbiosis-dedicated SYNTAXIN OF PLANTS 13II isoform controls the formation of a stable host-microbe interface in symbiosis. New Phytol., 211, 1338–1351.
Itaya, K. and Ui, M. (1966) A new micromethod for the colorimetric determination of inorganic phosphate. Clin. Chim. Acta, 14, 361–366.

140
Ivanov, S., Austin, J., Berg, R.H. and Harrison, M.J. (2019) Extensive membrane systems at the host–arbuscular mycorrhizal fungus interface. Nat. Plants, 5, 194–203.
Ivanov, S., Fedorova, E.E., Limpens, E., Mita, S. de, Genre, A., Bonfante, P. and Bisseling, T. (2012) Rhizobium-legume symbiosis shares an exocytotic pathway required for arbuscule formation. Proc. Natl. Acad. Sci. USA, 109, 8316–8321.
Jabaji-Hare, S. (1988) Lipid and fatty acid profiles of some vesicular-arbuscular mycorrhizal fungi: contribution to taxonomy. Mycologia, 80, 622.
Jabaji-Hare, S., Deschene, A. and Kendrick, B. (1984) Lipid content and composition of vesicles of a vesicular-arbuscular mycorrhizal fungus. Mycologia, 76, 1024–1030.
Javot, H., Penmetsa, R.V., Terzaghi, N., Cook, D.R. and Harrison, M.J. (2007) A Medicago truncatula phosphate transporter indispensable for the arbuscular mycorrhizal symbiosis. Proc. Natl. Acad. Sci. USA, 104, 1720–1725.
Jayawardhane, K.N., Singer, S.D., Weselake, R.J. and Chen, G. (2018) Plant sn-glycerol-3-phosphate acyltransferases: biocatalysts involved in the biosynthesis of intracellular and extracellular lipids. Lipids, 53, 469–480.
Jenni, S., Leibundgut, M., Boehringer, D., Frick, C., Mikolásek, B. and Ban, N. (2007) Structure of fungal fatty acid synthase and implications for iterative substrate shuttling. Science, 316, 254–261.
Jiang, Y., Wang, W., Xie, Q., Liu, N., Liu, L., Wang, D., Zhang, X., Yang, C., Chen, X., Tang, D. and Wang, E. (2017) Plants transfer lipids to sustain colonization by mutualistic mycorrhizal and parasitic fungi. Science, 356, 1172–1175.
Jiang, Y., Xie, Q., Wang, W., Yang, J., Zhang, X., Yu, N., Zhou, Y. and Wang, E. (2018) Medicago AP2-domain transcription factor WRI5a is a master regulator of lipid biosynthesis and transfer during mycorrhizal symbiosis. Mol. Plant, 11, 1344–1359.
Jing, F., Cantu, D.C., Tvaruzkova, J., Chipman, J.P., Nikolau, B.J., Yandeau-Nelson, M.D. and Reilly, P.J. (2011) Phylogenetic and experimental characterization of an acyl-ACP thioesterase family reveals significant diversity in enzymatic specificity and activity. BMC Biochem., 12, 44.
Jing, F., Zhao,L., Yandeau-Nelson, M.D. and Nikolau, B.J. (2018) Two distinct domains contribute to the substrate acyl chain length selectivity of plant acyl-ACP thioesterase. Nat. Commun., 9, 860.
Johansen, A., Finlay, R.D. and Olsson, P.A. (1996) Nitrogen metabolism of external hyphae of the arbuscular mycorrhizal fungus Glomus intraradices. New Phytol., 133, 705–712.
Johnston, M.L., Luethy, M.H., Miernyk, J.A. and Randall, D.D. (1997) Cloning and molecular analyses of the Arabidopsis thaliana plastid pyruvate dehydrogenase subunits. Biochem. Biophys. Acta, 1321, 200–206.
Jones, A., Davies, H.M. and Voelker, T.A. (1995) Palmitoyl-acyl carrier protein (ACP) thioesterase and the evolutionary origin of plant acyl-ACP thioesterases. Plant Cell, 7, 359–371.
Kamel, L., Keller-Pearson, M., Roux, C. and Ané, J.-M. (2017) Biology and evolution of arbuscular mycorrhizal symbiosis in the light of genomics. New Phytol., 213, 531–536.
Keymer, A. and Gutjahr, C. (2018) Cross-kingdom lipid transfer in arbuscular mycorrhiza symbiosis and beyond. Curr. Opin. Plant Biol., 44, 137–144.
Keymer, A., Pimprikar, P., Wewer, V., Huber, C., Brands, M., Bucerius, S.L., Delaux, P.-M., Klingl, V., Röpenack-Lahaye, E.v., Wang, T.L., Eisenreich, W., Dörmann, P., Parniske, M. and Gutjahr, C. (2017) Lipid transfer from plants to arbuscular mycorrhiza fungi. Elife, 6, e29107.
Kikuchi, Y., Hijikata, N., Yokoyama, K., Ohtomo, R., Handa, Y., Kawaguchi, M., Saito, K. and Ezawa, T. (2014) Polyphosphate accumulation is driven by transcriptome alterations that lead to near-synchronous and near-equivalent uptake of inorganic cations in an arbuscular mycorrhizal fungus. New Phytol., 204, 638–649.
Kim, H.J., Silva, J.E., Vu, H.S., Mockaitis, K., Nam, J.-W. and Cahoon, E.B. (2015) Toward production of jet fuel functionality in oilseeds: identification of FatB acyl-acyl carrier protein thioesterases and evaluation of combinatorial expression strategies in Camelina seeds. J. Exp. Bot., 66, 4251–4265.

141
Kim, H.U. (2005) Ubiquitous and endoplasmic reticulum-located lysophosphatidyl acyltransferase, LPAT2, is essential for female but not male gametophyte development in Arabidopsis. Plant Cell, 17, 1073–1089.
Klemptner, R.L., Sherwood, J.S., Tugizimana, F., Dubery, I.A. and Piater, L.A. (2014) Ergosterol, an orphan fungal microbe-associated molecular pattern (MAMP). Mol. Plant, 15, 747–761.
Kloppholz, S., Kuhn, H. and Requena, N. (2011) A secreted fungal effector of Glomus intraradices promotes symbiotic biotrophy. Curr. Biol., 21, 1204–1209.
Kobae, Y. (2019) Dynamic phosphate uptake in arbuscular mycorrhizal roots under field conditions. Front. Environ. Sci., 6, 1216.
Kobae, Y., Gutjahr, C., Paszkowski, U., Kojima, T., Fujiwara, T. and Hata, S. (2014) Lipid droplets of arbuscular mycorrhizal fungi emerge in concert with arbuscule collapse. Plant Cell Physiol., 55, 1945–1953.
Kobae, Y. and Hata, S. (2010) Dynamics of periarbuscular membranes visualized with a fluorescent phosphate transporter in arbuscular mycorrhizal roots of rice. Plant Cell Physiol., 51, 341–353.
Kobae, Y., Kawachi, M., Saito, K., Kikuchi, Y., Ezawa, T., Maeshima, M., Hata, S. and Fujiwara, T. (2015) Up-regulation of genes involved in N-acetylglucosamine uptake and metabolism suggests a recycling mode of chitin in intraradical mycelium of arbuscular mycorrhizal fungi. Mycorrhiza, 25, 411–417.
Kobayashi, Y., Maeda, T., Yamaguchi, K., Kameoka, H., Tanaka, S., Ezawa, T., Shigenobu, S. and Kawaguchi, M. (2018) The genome of Rhizophagus clarus HR1 reveals a common genetic basis for auxotrophy among arbuscular mycorrhizal fungi. BMC Genomics, 19, 465.
Koncz, C. and Schell, J. (1986) The promoter of TL-DNA gene 5 controls the tissue-specific expression of chimaeric genes carried by a novel type of Agrobacterium binary vector. Mol. Gen. Genet., 204, 383–396.
Konishi, T., Shinohara, K., Yamada, K. and Sasaki, Y. (1996) Acetyl-CoA carboxylase in higher plants: most plants other than gramineae have both the prokaryotic and the eukaryotic forms of this enzyme. Plant Cell Physiol., 37, 117–122.
Kortz, L., Dorow, J., Becker, S., Thiery, J. and Ceglarek, U. (2013) Fast liquid chromatography-quadrupole linear ion trap-mass spectrometry analysis of polyunsaturated fatty acids and eicosanoids in human plasma. J. Chromat. B, 927, 209–213.
Krajinski, F., Courty, P.-E., Sieh, D., Franken, P., Zhang, H., Bucher, M., Gerlach, N., Kryvoruchko, I., Zoeller, D., Udvardi, M. and Hause, B. (2014) The H+-ATPase HA1 of Medicago truncatula is essential for ohosphate transport and plant growth during arbuscular mycorrhizal symbiosis. Plant Cell, 26, 1808–1817.
Kretzschmar, T., Kohlen, W., Sasse, J., Borghi, L., Schlegel, M., Bachelier, J.B., Reinhardt, D., Bours, R., Bouwmeester, H.J. and Martinoia, E. (2012) A petunia ABC protein controls strigolactone-dependent symbiotic signalling and branching. Nature, 483, 341–344.
Kumar, M., Prasad, R., Kumar, V., Tuteja, N. and Varma, A. (2017) Mycorrhizal fungi under biotic and abiotic stress. In Mycorrhiza - Eco-Physiology, Secondary Metabolites, Nanomaterials. 4th edn. (Varma, A., Prasad, R. and Tuteja, N., eds). Cham: Springer International Publishing, pp. 57–69.
Kwaaitaal, M., Nielsen, M.E., Böhlenius, H. and Thordal-Christensen, H. (2017) The plant membrane surrounding powdery mildew haustoria shares properties with the endoplasmic reticulum membrane. J. Exp. Bot., 68, 5731–5743.
Lackzo, E., Boller, T. and WIEMKEN, V. (2004) Lipids in roots of Pinus sylvestris seedlings and in mycelia of Pisolithus tinctorius during ectomycorrhiza formation: changes in fatty acid and sterol composition. Plant Cell Environm., 27, 27–40.
Laemmli, U.K. (1970) Cleavage of structural proteins during the assembly of the head of bacteriophage T4. Nature, 227, 680–685.
Lammers, P.J., Jun, J., Abubaker, J., Arreola, R., Gopalan, A., Bago, B., Hernandez-Sebastia, C., Allen, J.W., Douds, D.D., Pfeffer, P.E. and Shachar-Hill, Y. (2001) The glyoxylate cycle in an arbuscular mycorrhizal fungus. Carbon flux and gene expression. Plant Physiol., 127, 1287–1298.

142
Lanfranco, L., Fiorilli, V. and Gutjahr, C. (2018) Partner communication and role of nutrients in the arbuscular mycorrhizal symbiosis. New Phytol., 220, 1031–1046.
Lanver, D., Müller, A.N., Happel, P., Schweizer, G., Haas, F.B., Franitza, M., Pellegrin, C., Reissmann, S., Altmüller, J., Rensing, S.A. and Kahmann, R. (2018) The biotrophic development of Ustilago maydis studied by RNA-Seq analysis. Plant Cell, 30, 300–323.
Lardizabal, K.D., Mai, J.T., Wagner, N.W., Wyrick, A., Voelker, T. and Hawkins, D.J. (2001) DGAT2 is a new diacylglycerol acyltransferase gene family. purification, cloning, and expression in insect cells of two polypeptides from Mortierella ramanniana with diacylglycerol acyltransferase activity. J. Biol. Chem., 276, 38862–38869.
Larose, G., Chênevert, R., Moutoglis, P., Gagné, S., Piché, Y. and Vierheilig, H. (2002) Flavonoid levels in roots ofMedicago sativa are modulated by the developmental stage of the symbiosis and the root colonizing arbuscular mycorrhizal fungus. J. Plant Physiol., 159, 1329–1339.
Larson, T.R., Edgell, T., Byrne, J., Dehesh, K. and Graham, I.A. (2002) Acyl CoA profiles of transgenic plants that accumulate medium-chain fatty acids indicate inefficient storage lipid synthesis in developing oilseeds. Plant J., 32, 519–527.
Larson, T.R. and Graham, I.A. (2001) Technical Advance. A novel technique for the sensitive quantification of acyl CoA esters from plant tissues. Plant J., 25, 115–125.
Lauciello, L., Lack, G., Scapozza, L. and Perozzo, R. (2016) A high yield optimized method for the production of acylated ACPs enabling the analysis of enzymes involved in P. falciparum fatty acid biosynthesis. Biochem. Biophys. Rep., 8, 310–317.
Lee, S.H., Stephens, J.L. and Englund, P.T. (2007) A fatty-acid synthesis mechanism specialized for parasitism. Nat. Rev. Microbiol., 5, 287–297.
Lehman, R.M., Osborne, S.L., Taheri, W.I., Buyer, J.S. and Chim, B.K. (2019) Comparative measurements of arbuscular mycorrhizal fungal responses to agricultural management practices. Mycorrhiza, 29, 227–235.
Lenoir, I., Fontaine, J. and Lounès-Hadj Sahraoui, A. (2016) Arbuscular mycorrhizal fungal responses to abiotic stresses: A review. Phytochemistry, 123, 4–15.
Li, N., Gügel, I.L., Giavalisco, P., Zeisler, V., Schreiber, L., Soll, J. and Philippar, K. (2015) FAX1, a novel membrane protein mediating plastid fatty acid export. PLoS Biol., 13, e1002053.
Li, Y., Beisson, F., Koo, A.J.K., Molina, I., Pollard, M. and Ohlrogge, J. (2007) Identification of acyltransferases required for cutin biosynthesis and production of cutin with suberin-like monomers. Proc. Natl. Acad. Sci. USA, 104, 18339–18344.
Li, Y., Beisson, F., Ohlrogge, J. and Pollard, M. (2007) Monoacylglycerols are components of root waxes and can be produced in the aerial cuticle by ectopic expression of a suberin-associated acyltransferase. Plant Physiol., 144, 1267–1277.
Li-Beisson, Y., Pollard, M., Sauveplane, V., Pinot, F., Ohlrogge, J. and Beisson, F. (2009) Nanoridges that characterize the surface morphology of flowers require the synthesis of cutin polyester. Proc. Natl. Acad. Sci. USA, 106, 22008–22013.
Li-Beisson, Y., Shorrosh, B., Beisson, F., Andersson, M.X., Arondel, V., Bates, P.D., Baud, S., Bird, D., DeBono, A., Durrett, T.P., Franke, R.B., Graham, I.A., Katayama, K., Kelly, A.A., Larson, T., Markham, J.E., Miquel, M., Molina, I., Nishida, I., Rowland, O., Samuels, L., Schmid, K.M., Wada, H., Welti, R., Xu, C., Zallot, R. and Ohlrogge, J. (2013) Acyl-Lipid Metabolism. In The Arabidopsis Book, No. 12, pp. e0161.
Lin, K., Limpens, E., Zhang, Z., Ivanov, S., Saunders, D.G.O., Mu, D., Pang, E., Cao, H., Cha, H., Lin, T., Zhou, Q., Shang, Y., Li, Y., Sharma, T., van Velzen, R., Ruijter, N. de, Aanen, D.K., Win, J., Kamoun, S., Bisseling, T., Geurts, R. and Huang, S. (2014) Single nucleus genome sequencing reveals high similarity among nuclei of an endomycorrhizal fungus. PLoS Gen., 10, e1004078.
Lin, M. and Oliver, D.J. (2008) The role of acetyl-coenzyme a synthetase in Arabidopsis. Plant Physiol., 147, 1822–1829.
Lohse, S., Schliemann, W., Ammer, C., Kopka, J., Strack, D. and Fester, T. (2005) Organization and metabolism of plastids and mitochondria in arbuscular mycorrhizal roots of Medicago truncatula. Plant Physiol., 139, 329–340.

143
López-Ráez, J.A., Fernández, I., García, J.M., Berrio, E., Bonfante, P., Walter, M.H. and Pozo, M.J. (2015) Differential spatio-temporal expression of carotenoid cleavage dioxygenases regulates apocarotenoid fluxes during AM symbiosis. Plant Sci., 230, 59–69.
Los, D.A. and Murata, N. (1998) Structure and expression of fatty acid desaturases. Biochim. Biophys. Acta, 1394, 3–15.
Lösel, D.M. and Cooper, K.M. (1979) Incorporation of 14 C-labeled substrates by uninfected and VA mycorrhizal roots of onion. New Phytol., 83, 415–426.
Lota, F., Wegmüller, S., Buer, B., Sato, S., Bräutigam, A., Hanf, B. and Bucher, M. (2013) The cis-acting CTTC-P1BS module is indicative for gene function of LjVTI12, a Qb-SNARE protein gene that is required for arbuscule formation in Lotus japonicus. Plant J., 74, 280–293.
Luginbuehl, L.H., Menard, G.N., Kurup, S., van Erp, H., Radhakrishnan, G.V., Breakspear, A., Oldroyd, G.E.D. and Eastmond, P.J. (2017) Fatty acids in arbuscular mycorrhizal fungi are synthesized by the host plant. Science, 356, 1175–1178.
Luginbuehl, L.H. and Oldroyd, G.E.D. (2017) Understanding the Arbuscule at the Heart of Endomycorrhizal Symbioses in Plants. Curr. Biol., 27, R952-R963.
MacLean, A.M., Bravo, A. and Harrison, M.J. (2017) Plant signaling and metabolic pathways enabling arbuscular mycorrhizal symbiosis. Plant Cell, 29, 2319–2335.
Maillet, F., Poinsot, V., Andre, O., Puech-Pagès, V., Haouy, A., Gueunier, M., Cromer, L., Giraudet, D., Formey, D., Niebel, A., Martinez, E.A., Driguez, H., Becard, G. and Denarie, J. (2011) Fungal lipochitooligosaccharide symbiotic signals in arbuscular mycorrhiza. Nature, 469, 58–63.
Majerus, P.W., Alberts, A.W. and Vagelos, R. (1965) The acyl carrier protein of fatty acid synthesis: Purification, physical properties and substrate binding site. Proc. Natl. Acad. Sci. USA, 51, 1231–1238.
Maldonado-Mendoza, I.E., Dewbre, G.R. and Harrison, M.J. (2001) A phosphate transporter gene from the extra-radical mycelium of an arbuscular mycorrhizal fungus Glomus intraradices is regulated in response to phosphate in the environment. Mol. Plant Micr. Interact., 14, 1140–1148.
Malolepszy, A., Mun, T., Sandal, N., Gupta, V., Dubin, M., Urbanski, D., Shah, N., Bachmann, A., Fukai, E., Hirakawa, H., Tabata, S., Nadzieja, M., Markmann, K., Su, J., Umehara, Y., Soyano, T., Miyahara, A., Sato, S., Hayashi, M., Stougaard, J. and Andersen, S.U. (2016) The LORE1 insertion mutant resource. Plant J., 88, 306–317.
Manck-Götzenberger, J. and Requena, N. (2016) Arbuscular mycorrhiza symbiosis induces a major transcriptional reprogramming of the potato SWEET sugar transporter family. Front. Plant Sci., 7, 487.
Martin, F., Kohler, A., Murat, C., Veneault-Fourrey, C. and Hibbett, D.S. (2016) Unearthing the roots of ectomycorrhizal symbioses. Nat. Rev. Microbiol., 14, 760–773.
Mathieu, S., Cusant, L., Roux, C. and Corradi, N. (2018) Arbuscular mycorrhizal fungi: intraspecific diversity and pangenomes. New Phytol., 220, 1129–1134.
McGonigle, T.P., Miller, M.H., Evans, D.G., Fairchild, G.L. and Swan, J.A. (1990) A new method which gives an objective measure of colonization of roots by vesicular-arbuscular mycorrhizal fungi. New Phytol., 115, 495–501.
Meesapyodsuk, D. and Qiu, X. (2012) The front-end desaturase: structure, function, evolution and biotechnological use. Lipids, 47, 227–237.
Miyata, K., Kozaki, T., Kouzai, Y., Ozawa, K., Ishii, K., Asamizu, E., Okabe, Y., Umehara, Y., Miyamoto, A., Kobae, Y., Akiyama, K., Kaku, H., Nishizawa, Y., Shibuya, N. and Nakagawa, T. (2014) The bifunctional plant receptor, OsCERK1, regulates both chitin-triggered immunity and arbuscular mycorrhizal symbiosis in rice. Plant Cell Physiol., 55, 1864–1872.
Miyazaki, M., Bruggink, S.M. and Ntambi, J.M. (2006) Identification of mouse palmitoyl-coenzyme A Delta9-desaturase. J. Lipid Res., 47, 700–704.
Montero, H., Choi, J. and Paszkowski, U. (2019) Arbuscular mycorrhizal phenotyping: the dos and don'ts. New Phytol., 221, 1182–1186.
Mori, N., Nishiuma, K., Sugiyama, T., Hayashi, H. and Akiyama, K. (2016) Carlactone-type strigolactones and their synthetic analogues as inducers of hyphal branching in arbuscular mycorrhizal fungi. Phytochemistry, 130, 90–98.

144
Murray, J.D., Cousins, D.R., Jackson, K.J. and Liu, C. (2013) Signaling at the root surface: The role of cutin monomers in mycorrhization. Mol. Plant, 6, 1381–1383.
Nadal, M., Sawers, R., Naseem, S., Bassin, B., Kulicke, C., Sharman, A., An, G., An, K., Ahern, K.R., Romag, A., Brutnell, T.P., Gutjahr, C., Geldner, N., Roux, C., Martinoia, E., Konopka, J.B. and Paszkowski, U. (2017) An N-acetylglucosamine transporter required for arbuscular mycorrhizal symbioses in rice and maize. Nat. Plants, 3, 17073.
Nagahashi, G. and Douds, D.D. (2011) The effects of hydroxy fatty acids on the hyphal branching of germinated spores of AM fungi. Fung. Biol., 115, 351–358.
Nakamura, Y. (2017) Plant phospholipid diversity: emerging functions in metabolism and protein-lipid Interactions. Trends Plant Sci., 22, 1027–1040.
Nawrath, C., Schreiber, L., Franke, R.B., Geldner, N., Reina-Pinto, J.J. and Kunst, L. (2013) Apoplastic diffusion barriers in Arabidopsis. Arabidopsis Book, 11, e0167.
Nordby, H.E., Nemec, S. and Nagy, S. (1981) Fatty acids and sterols associated with citrus root mycorrhizae. J. Agricult. Food Chem., 29, 396–401.
Nouri, E., Breuillin-Sessoms, F., Feller, U. and Reinhardt, D. (2015) Phosphorus and Nitrogen Regulate Arbuscular Mycorrhizal Symbiosis in Petunia hybrida. PloS one, 10, e0127472.
Ocón, A., Hampp, R. and Requena, N. (2007) Trehalose turnover during abiotic stress in arbuscular mycorrhizal fungi. New Phytol., 174, 879–891.
Ogasawara, Y., Kira, S., Mukai, Y., Noda, T. and Yamamoto, A. (2017) Ole1, fatty acid desaturase, is required for Atg9 delivery and isolation membrane expansion during autophagy in Saccharomyces cerevisiae. Biol. Open, 6, 35–40.
Ohlrogge, J. and Browse, J. (1995) Lipid biosynthesis. Plant Cell, 7, 957–970. Olsson, P.A., Bååth, E., Jakobsen, I. and Söderström, B. (1995) The use of phospholipid and
neutral lipid fatty acids to estimate biomass of arbuscular mycorrhizal fungi in soil. Mycol. Res., 99, 623–629.
Olsson, P.A., Burleigh, S.H. and van Aarle, I.M. (2005) The influence of external nitrogen on carbon allocation to Glomus intraradices in monoxenic arbuscular mycorrhiza. New Phytol., 168, 677–686.
Olsson, P.A. and Johansen, A. (2000) Lipid and fatty acid composition of hyphae and spores of arbuscular mycorrhizal fungi at different growth stages. Mycol. Res., 104, 429–434.
Olsson, P.A. and Johnson, N.C. (2005) Tracking carbon from the atmosphere to the rhizosphere. Ecol. Lett., 8, 1264–1270.
Olsson, P.A., Larsson, L., Bago, B., Wallander, H. and van Aarle, I.M. (2003) Ergosterol and fatty acids for biomass estimation of mycorrhizal fungi. New Phytol., 159, 7–10.
Olsson, P.A., van Aarle, I.M., Gavito, M.E., Bengtson, P. and Bengtsson, G. (2005) 13C incorporation into signature fatty acids as an assay for carbon allocation in arbuscular mycorrhiza. Appl. Environm. Microbiol., 71, 2592–2599.
Overath, P., Pauli, G. and Schairer, H.U. (1969) Fatty acid degradation in Escherichia coli. Eur. J. Biochem., 7, 559–574.
Pan, H., Oztas, O., Zhang, X., Wu, X., Stonoha, C., Wang, E., Wang, B. and Wang, D. (2016) A symbiotic SNARE protein generated by alternative termination of transcription. Nat. Plants, 2, 15197.
Panchuk-Voloshina, N., Haugland, R.P., Bishop-Stewart, J., Bhalgat, M.K., Millard, P.J., Mao, F. and Leung, W.Y. (1999) Alexa dyes, a series of new fluorescent dyes that yield exceptionally bright, photostable conjugates. J. Histochem. Cytochem., 47, 1179–1188.
Panikashvili, D., Shi, J.X., Schreiber, L. and Aharoni, A. (2011) The Arabidopsis ABCG13 transporter is required for flower cuticle secretion and patterning of the petal epidermis. New Phytol., 190, 113–124.
Park, H.-J., Floss, D.S., Levesque-Tremblay, V., Bravo, A. and Harrison, M.J. (2015) Hyphal branching during arbuscule development requires reduced arbuscular mycorrhiza1. Plant Physiol., 169, 2774–2788.
Parniske, M. (2008) Arbuscular mycorrhiza. the mother of plant root endosymbioses. Nat. Rev. Microbiol., 6, 763–775.

145
Paszkowski, U., Kroken, S., Roux, C. and Briggs, S.P. (2002) Rice phosphate transporters include an evolutionarily divergent gene specifically activated in arbuscular mycorrhizal symbiosis. Proc. Natl. Acad. Sci. USA, 99, 13324–13329.
Pfeffer, P.E., Douds, D.D., Becard, G. and Shachar-Hill, Y. (1999) Carbon uptake and the metabolism and transport of lipids in an arbuscular mycorrhiza. Plant Physiol., 120, 587–598.
Pimprikar, P., Carbonnel, S., Paries, M., Katzer, K., Klingl, V., Bohmer, M.J., Karl, L., Floss, D.S., Harrison, M.J., Parniske, M. and Gutjahr, C. (2016) A CCaMK-CYCLOPS-DELLA complex activates transcription of RAM1 to regulate arbuscule branching. Curr. Biol., 26, 987–998.
Pimprikar, P. and Gutjahr, C. (2018) Transcriptional regulation of arbuscular mycorrhiza development. Plant Cell Physiol., 59, 673–690.
Post-Beittenmiller, D., Roughan, G. and Ohlrogge, J.B. (1992) Regulation of plant fatty acid biosynthesis. Analysis of acyl-coenzymeA and acyl-acyl carrier protein substrate pools in spinach and pea chloroplasts. Plant Physiol., 100, 923–930.
Pozo, M.J., López-Ráez, J.A., Azcón-Aguilar, C. and García-Garrido, J.M. (2015) Phytohormones as integrators of environmental signals in the regulation of mycorrhizal symbioses. New Phytol., 205, 1431–1436.
Pumplin, N. and Harrison, M.J. (2009) Live-cell imaging reveals periarbuscular membrane domains and organelle location in Medicago truncatula roots during arbuscular mycorrhizal symbiosis. Plant Physiol., 151, 809–819.
Pumplin, N., Zhang, X., Noar, R.D. and Harrison, M.J. (2012) Polar localization of a symbiosis-specific phosphate transporter is mediated by a transient reorientation of secretion. Proc. Natl. Acad. Sci. USA, 109, 72.
Rapparini, F. and Peñuelas, J. (2014) Mycorrhizal Fungi to Alleviate Drought Stress on Plant Growth. In Use of Microbes for the Alleviation of Soil Stresses, 1, 21–42.
Rausch, C., Daram, P., Brunner, S., Jansa, J., Laloi, M., Leggewie, G., Amrhein, N. and Bucher, M. (2001) A phosphate transporter expressed in arbuscule-containing cells in potato. Nature, 414, 462–470.
Reich, M., Göbel, C., Kohler, A., Buée, M., Martin, F., Feussner, I. and Polle, A. (2009) Fatty acid metabolism in the ectomycorrhizal fungus Laccaria bicolor. New Phytol., 182, 950–964.
Rentsch, D., Laloi, M., Rouhara, I., Schmelzer, E., Delrot, S. and Frommer, W.B. (1995) NTR1 encodes a high affinity oligopeptide transporter in Arabidopsis. FEBS Lett., 370, 264–268.
Rich, M.K., Nouri, E., Courty, P.-E. and Reinhardt, D. (2017) Diet of arbuscular mycorrhizal fungi: bread and butter? Trends Plant Sci., 22, 652–660.
Rich, M.K., Schorderet, M., Bapaume, L., Falquet, L., Morel, P., Vandenbussche, M. and Reinhardt, D. (2015) The petunia GRAS transcription factor ATA/RAM1 regulates symbiotic gene expression and fungal morphogenesis in arbuscular mycorrhiza. Plant Physiol., 168, 788–797.
Rivero, J., Álvarez, D., Flors, V., Azcón-Aguilar, C. and Pozo, M.J. (2018) Root metabolic plasticity underlies functional diversity in mycorrhiza-enhanced stress tolerance in tomato. New Phytol., 220, 1322–1336.
Rock, C.O. and Garwin, J.L. (1979) Preparative enzymatic synthesis and hydrophobic chromatography of acyl-acyl carrier protein. J. Biol. Chem., 254, 7123–7128.
Rodríguez-Rodríguez, M.F., Salas, J.J., Garcés, R. and Martínez-Force, E. (2014) Acyl-ACP thioesterases from Camelina sativa: cloning, enzymatic characterization and implication in seed oil fatty acid composition. Phytochemistry, 107, 7–15.
Rodríguez-Vargas, S., Sánchez-García, A., Martínez-Rivas, J.M., Prieto, J.A. and Randez-Gil, F. (2007) Fluidization of membrane lipids enhances the tolerance of Saccharomyces cerevisiae to freezing and salt stress. Appl. Environm. Microbiol., 73, 110–116.
Ropars, J., Toro, K.S., Noel, J., Pelin, A., Charron, P., Farinelli, L., Marton, T., Kruger, M., Fuchs, J., Brachmann, A. and Corradi, N. (2016) Evidence for the sexual origin of heterokaryosis in arbuscular mycorrhizal fungi. Nat. Microbiol., 1, 16033.
Rosewarne, G., M., Barker, S., J., Smith, S.E., Smith, F.A. and Schachtman, D., P. (1999) A Lycopersicon esculentum phosphate transporter (LePT1 ) involved in phosphorus uptake from a vesicular-arbuscular mycorrhizal fungus. New Phytol., 144, 507–516.

146
Roth, R., Hillmer, S., Funaya, C., Chiapello, M., Schumacher, K., Lo Presti, L., Kahmann, R. and Paszkowski, U. (2019) Arbuscular cell invasion coincides with extracellular vesicles and membrane tubules. Nat. Plants, 5, 204–211.
Roth, R. and Paszkowski, U. (2017) Plant carbon nourishment of arbuscular mycorrhizal fungi. Curr. Opin. Plant Biol., 39, 50–56.
Ruiz-Lozano, J.M., Aroca, R., Zamarreño, Á.M., Molina, S., Andreo-Jiménez, B., Porcel, R., García-Mina, J.M., Ruyter-Spira, C. and López-Ráez, J.A. (2015) Arbuscular mycorrhizal symbiosis induces strigolactone biosynthesis under drought and improves drought tolerance in lettuce and tomato. Plant Cell Environm., 39, 441–452.
Salas, J.J. and Ohlrogge, J.B. (2002) Characterization of substrate specificity of plant FatA and FatB acyl-ACP thioesterases. Arch. Biochem. Biophys., 403, 25–34.
Salvioli, A., Ghignone, S., Novero, M., Navazio, L., Venice, F., Bagnaresi, P. and Bonfante, P. (2016) Symbiosis with an endobacterium increases the fitness of a mycorrhizal fungus, raising its bioenergetic potential. ISME J., 10, 130–144.
Sambrook, J. and Russell, D.W. (2001) Molecular cloning. A laboratory manual. 3rd edn. Cold Spring Harbor, N.Y: Cold Spring Harbor Laboratory Press.
Sawers, R.J.H., Svane, S.F., Quan, C., Grønlund, M., Wozniak, B., Gebreselassie, M.-N., González-Muñoz, E., Chávez Montes, R.A., Baxter, I., Goudet, J., Jakobsen, I. and Paszkowski, U. (2017) Phosphorus acquisition efficiency in arbuscular mycorrhizal maize is correlated with the abundance of root-external hyphae and the accumulation of transcripts encoding PHT1 phosphate transporters. New Phytol., 214, 632–643.
Schaarschmidt, S., Gonzalez, M.-C., Roitsch, T., Strack, D., Sonnewald, U. and Hause, B. (2007) Regulation of arbuscular mycorrhization by carbon. The symbiotic interaction cannot be improved by increased carbon availability accomplished by root-specifically enhanced invertase activity. Plant Physiol., 143, 1827–1840.
Schaarschmidt, S., Roitsch, T. and Hause, B. (2006) Arbuscular mycorrhiza induces gene expression of the apoplastic invertase LIN6 in tomato (Lycopersicon esculentum) roots. J. Exp. Bot., 57, 4015–4023.
Schaeffer, A., Bronner, R., Benveniste, P. and Schaller, H. (2001) The ratio of campesterol to sitosterol that modulates growth in Arabidopsis is controlled by sterol methyltransferase 2;1. Plant J., 25, 605–615.
Schliemann, W., Ammer, C. and Strack, D. (2008) Metabolite profiling of mycorrhizal roots of Medicago truncatula. Phytochemistry, 69, 112–146.
Schüssler, A., Martin, H., Cohen, D., Fitz, M. and Wipf, D. (2006) Characterization of a carbohydrate transporter from symbiotic glomeromycotan fungi. Nature, 444, 933–936.
Schüßler, A., Martin, H., Cohen, D., Fitz, M. and Wipf, D. (2007) Arbuscular Mycorrhiza. Plant Signal. Behav., 2, 431–434.
Sedzielewska Toro, K. and Brachmann, A. (2016) The effector candidate repertoire of the arbuscular mycorrhizal fungus Rhizophagus clarus. BMC Genom., 17, 101.
Shachar-Hill, Y., Pfeffer, P.E., Douds, D., Osman, S.F., Doner, L.W. and Ratcliffe, R.G. (1995) Partitioning of intermediary carbon metabolism in vesicular-arbuscular mycorrhizal leek. Plant Physiol., 108, 7–15.
Shanklin, J. (2000) Overexpression and purification of the Escherichia coli inner membrane enzyme acyl-acyl carrier protein synthase in an active form. Protein Expr. Purif., 18, 355–360.
Shanklin, J. and Somerville, C. (1991) Stearoyl-acyl-carrier-protein desaturase from higher plants is structurally unrelated to the animal and fungal homologs. Proc. Natl. Acad. Sci. USA, 88, 2510–2514.
Shanklin, J., Whittle, E. and Fox, B.G. (1994) Eight histidine residues are catalytically essential in a membrane-associated iron enzyme, stearoyl-CoA desaturase, and are conserved in alkane hydroxylase and xylene monooxygenase. Biochemistry, 33, 12787–12794.
Shimada, T.L., Hayashi, M. and Hara-Nishimura, I. (2018) Membrane Dynamics and Multiple Functions of Oil Bodies in Seeds and Leaves. Plant Physiol., 176, 199–207.
Shockey, J., Regmi, A., Cotton, K., Adhikari, N., Browse, J. and Bates, P.D. (2016) Identification of Arabidopsis GPAT9 (At5g60620) as an essential gene involved in triacylglycerol biosynthesis. Plant Physiol., 170, 163–179.

147
Siebers, M., Brands, M., Wewer, V., Duan, Y., Hölzl, G. and Dörmann, P. (2016) Lipids in plant-microbe interactions. Biochim. Biophys. Acta, 1861, 1379–1395.
Smet, C.H. de, Vittone, E., Scherer, M., Houweling, M., Liebisch, G., Brouwers, J.F. and Kroon, A.I.P.M. de (2012) The yeast acyltransferase Sct1p regulates fatty acid desaturation by competing with the desaturase Ole1p. Mol. Biol. Cell, 23, 1146–1156.
Smith, S.E. and Read, D.J. (2008) Mycorrhizal symbiosis. 3rd edn. Amsterdam, London: Academic.
Solaiman, M.D.Z. and Saito, M. (1997) Use of sugars by intraradical hyphae of arbuscular mycorrhizal fungi revealed by radiorespirometry. New Phytol., 533–538.
Solaiman, M.Z., Ezawa, T., Kojima, T. and Saito, M. (1999) Polyphosphates in intraradical and extraradical hyphae of an arbuscular mycorrhizal fungus, Gigaspora margarita. Appl. Environ. Microbiol., 65, 5604–5606.
Sparkes, I.A., Runions, J., Kearns, A. and Hawes, C. (2006) Rapid, transient expression of fluorescent fusion proteins in tobacco plants and generation of stably transformed plants. Nat. Protoc., 1, 2019–2025.
Steinkellner, S., Lendzemo, V., Langer, I., Schweiger, P., Khaosaad, T., Toussaint, J.-P. and Vierheilig, H. (2007) Flavonoids and strigolactones in root exudates as signals in symbiotic and pathogenic plant-fungus interactions. Molecules, 12, 1290–1306.
Stracke, S., Kistner, C., Yoshida, S., Mulder, L., Sato, S., Kaneko, T., Tabata, S., Sandal, N., Stougaard, J., Szczyglowski, K. and Parniske, M. (2002) A plant receptor-like kinase required for both bacterial and fungal symbiosis. Nature, 417, 959–962.
Strullu, Chamel, A., Eloy, J.F. and Gourret, J., P. (1983) Ultrastructure and analysis by laser probe mass spectrography of the mineral composition of the vesicles of Trifolium pratense endomycorrhizas. New Phytol., 94, 81–88.
Stukey, J.E., McDonough, V.M. and Martin, C.E. (1989) Isolation and characterization of OLE1, a gene affecting fatty acid desaturation from Saccharomyces cerevisiae. J. Biol. Chem., 264, 16537–16544.
Stukey, J.E., McDonough, V.M. and Martin, C.E. (1990) The OLE1 gene of Saccharomyces cerevisiae encodes the delta 9 fatty acid desaturase and can be functionally replaced by the rat stearoyl-CoA desaturase gene. J. Biol. Chem., 265, 20144–20149.
Stumpe, M., Carsjens, J.-G., Stenzel, I., Gobel, C., Lang, I., Pawlowski, K., Hause, B. and Feussner, I. (2005) Lipid metabolism in arbuscular mycorrhizal roots of Medicago truncatula. Phytochemistry, 66, 781–791.
Sun, X., Chen, W., Ivanov, S., MacLean, A.M., Wight, H., Ramaraj, T., Mudge, J., Harrison, M.J. and Fei, Z. (2019) Genome and evolution of the arbuscular mycorrhizal fungus Diversispora epigaea (formerly Glomus versiforme) and its bacterial endosymbionts. New Phytol., 221, 1556–1573.
Sun, X.-G., Bonfante, P. and Tang, M. (2015) Effect of volatiles versus exudates released by germinating spores of Gigaspora margarita on lateral root formation. Plant Phys. Biochem., 97, 1–10.
Symanczik, S., Lehmann, M.F., Wiemken, A., Boller, T. and Courty, P.-E. (2018) Effects of two contrasted arbuscular mycorrhizal fungal isolates on nutrient uptake by Sorghum bicolor under drought. Mycorrhiza, 28, 779–785.
Tan, L., Zhuo, R., Li, S., Ma, F. and Zhang, X. (2017) Differential expression of desaturase genes and changes in fatty acid composition of Mortierella sp. AGED in response to environmental factors. J. Sci. Food Agric., 97, 1876–1884.
Tang, N., San Clemente, H., Roy, S., Becard, G., Zhao, B. and Roux, C. (2016) A survey of the gene repertoire of Gigaspora rosea unravels conserved features among Glomeromycota for obligate biotrophy. Front. Microbiol., 7, 233.
Tehlivets, O., Scheuringer, K. and Kohlwein, S.D. (2007) Fatty acid synthesis and elongation in yeast. Biochim. Biophys. Acta, 1771, 255–270.
Tisserant, E., Kohler, A., Dozolme-Seddas, P., Balestrini, R., Benabdellah, K., Colard, A., Croll, D., da Silva, C., Gomez, S.K., Koul, R., Ferrol, N., Fiorilli, V., Formey, D., Franken, P., Helber, N., Hijri, M., Lanfranco, L., Lindquist, E., Liu, Y., Malbreil, M., Morin, E., Poulain, J., Shapiro, H., van Tuinen, D., Waschke, A., Azcon-Aguilar, C., Becard, G., Bonfante, P.,

148
Harrison, M.J., Kuster, H., Lammers, P., Paszkowski, U., Requena, N., Rensing, S.A., Roux, C., Sanders, I.R., Shachar-Hill, Y., Tuskan, G., Young, J.P., Gianinazzi-Pearson, V. and Martin, F. (2012) The transcriptome of the arbuscular mycorrhizal fungus Glomus intraradices (DAOM 197198) reveals functional tradeoffs in an obligate symbiont. New Phytol., 193, 755–769.
Tisserant, E., Malbreil, M., Kuo, A., Kohler, A., Symeonidi, A., Balestrini, R., Charron, P., Duensing, N., Frei dit Frey, N., Gianinazzi-Pearson, V., Gilbert, L.B., Handa, Y., Herr, J.R., Hijri, M., Koul, R., Kawaguchi, M., Krajinski, F., Lammers, P.J., Masclaux, F.G., Murat, C., Morin, E., Ndikumana, S., Pagni, M., Petitpierre, D., Requena, N., Rosikiewicz, P., Riley, R., Saito, K., San Clemente, H., Shapiro, H., van Tuinen, D., Becard, G., Bonfante, P., Paszkowski, U., Shachar-Hill, Y.Y., Tuskan, G.A., Young, J.P.W., Sanders, I.R., Henrissat, B., Rensing, S.A., Grigoriev, I.V., Corradi, N., Roux, C. and Martin, F. (2013) Genome of an arbuscular mycorrhizal fungus provides insight into the oldest plant symbiosis. Proc. Natl. Acad. Sci. USA, 110, 20117–20122.
Tjellström, H., Andersson, M.X., Larsson, K.E. and Sandelius, A.S. (2008) Membrane phospholipids as a phosphate reserve. the dynamic nature of phospholipid-to-digalactosyl diacylglycerol exchange in higher plants. Plant Cell Environ., 31, 1388–1398.
Toth, R. and Miller, R.M. (1984) Dynamics of arbuscule development and degeneration in a Zea mays mycorrhiza. Am. J. Bot., 71, 449.
Towbin, H., Staehelin, T. and Gordon, J. (1979) Electrophoretic transfer of proteins from polyacrylamide gels to nitrocellulose sheets: procedure and some applications. Proc. Natl. Acad. Sci. USA, 76, 4350–4354.
Trepanier, M., Becard, G., Moutoglis, P., Willemot, C., Gagne, S., Avis, T.J. and Rioux, J.-A. (2005) Dependence of arbuscular-mycorrhizal fungi on their plant host for palmitic acid synthesis. Appl. Environm. Microbiol., 71, 5341–5347.
Triana, S., Cock, H. de, Ohm, R.A., Danies, G., Wösten, H.A.B., Restrepo, S., González Barrios, A.F. and Celis, A. (2017) Lipid metabolic versatility in Malassezia spp. yeasts studied through metabolic modeling. Front. Microbiol., 8, 1772.
Tsai, Y.-Y., Ohashi, T., Wu, C.-C., Bataa, D., Misaki, R., Limtong, S. and Fujiyama, K. (2019) Delta-9 fatty acid desaturase overexpression enhanced lipid production and oleic acid content in Rhodosporidium toruloides for preferable yeast lipid production. J. Biosci. Bioeng., 127, 430–440.
Tsuzuki, S., Handa, Y., Takeda, N. and Kawaguchi, M. (2016) Strigolactone-induced putative secreted protein 1 is required for the establishment of symbiosis by the arbuscular mycorrhizal fungus Rhizophagus irregularis. Mol. Plant. Microbe Interact., 29, 277–286.
van Dam, N.M. and Bouwmeester, H.J. (2016) Metabolomics in the Rhizosphere: tapping into belowground chemical communication. Trends Plant Sci., 21, 256–265.
Venkateshwaran, M., Jayaraman, D., Chabaud, M., Genre, A., Balloon, A.J., Maeda, J., Forshey, K., den Os, D., Kwiecien, N.W., Coon, J.J., Barker, D.G. and Ané, J.-M. (2015) A role for the mevalonate pathway in early plant symbiotic signaling. Proc. Natl. Acad. Sci. USA, 112, 9781–9786.
Vierheilig, H., Coughlan, A.P., Wyss, U. and Piché, Y. (1998) Ink and vinegar, a simple staining technique for arbuscular-mycorrhizal fungi. Appl. Environm. Microbiol., 64, 5004–5007.
Vijayakumar, V., Liebisch, G., Buer, B., Xue, L., Gerlach, N., Blau, S., Schmitz, J. and Bucher, M. (2016) Integrated multi-omics analysis supports role of lysophosphatidylcholine and related glycerophospholipids in the Lotus japonicus-Glomus intraradices mycorrhizal symbiosis. Plant Cell Environm., 39, 393–415.
Vodala, S., Abruzzi, K.C. and Rosbash, M. (2008) The nuclear exosome and adenylation regulate posttranscriptional tethering of yeast GAL genes to the nuclear periphery. Mol. Cell, 31, 104–113.
Voelker, T.A., Worrell, A.C., Anderson, L., Bleibaum, J., Fan, C., Hawkins, D.J., Radke, S.E. and Davies, H.M. (1992) Fatty acid biosynthesis redirected to medium chains in transgenic oilseed plants. Science, 257, 72–74.
vom Dorp, K., Dombrink, I. and Dormann, P. (2013) Quantification of diacylglycerol by mass spectrometry. Meth. Mol. Biol., 1009, 43–54.

149
Vos, C., Claerhout, S., Mkandawire, R., Panis, B., Waele, D. de and Elsen, A. (2012) Arbuscular mycorrhizal fungi reduce root-knot nematode penetration through altered root exudation of their host. Plant Soil, 354, 335–345.
Walter, M.H. Role of carotenoid metabolism in the arbuscular mycorrhizal symbiosis. In Molecular Microbial Ecology of the Rhizosphere 1&2, pp. 513–524.
Wang, E., Schornack, S., Marsh, J.F., Gobbato, E., Schwessinger, B., Eastmond, P., Schultze, M., Kamoun, S. and Oldroyd, G.E.D. (2012) A common signaling process that promotes mycorrhizal and oomycete colonization of plants. Curr. Biol., 22, 2242–2246.
Wang, E., Yu, N., Bano, S.A., Liu, C., Miller, A.J., Cousins, D., Zhang, X., Ratet, P., Tadege, M., Mysore, K.S., Downie, J.A., Murray, J.D., Oldroyd, G.E.D. and Schultze, M. (2014) A H+-ATPase that energizes nutrient uptake during mycorrhizal symbioses in rice and Medicago truncatula. Plant Cell, 26, 1818–1830.
Wang, M., Chen, H., Ailati, A., Chen, W., Chilton, F.H., Todd Lowther, W. and Chen, Y.Q. (2018) Substrate specificity and membrane topologies of the iron-containing ω3 and ω6 desaturases from Mortierella alpina. Appl. Microbiol. Biotechnol., 102, 211–223.
Wewer, V., Brands, M. and Dörmann, P. (2014) Fatty acid synthesis and lipid metabolism in the obligate biotrophic fungus Rhizophagus irregularis during mycorrhization of Lotus japonicus. Plant J., 79, 398–412.
Wewer, V., Dombrink, I., vom Dorp, K. and Dörmann, P. (2011) Quantification of sterol lipids in plants by quadrupole time-of-flight mass spectrometry. J. Lipid Res., 52, 1039–1054.
Wewer, V. and Dörmann, P. (2014) Determination of sterol lipids in plant tissues by gas chromatography and Q-TOF mass spectrometry. In Plant Isoprenoids, Methods and Protocols. Methods in Molecular Biology (vol. 1153) (Rodrígues-Concepción, M., ed). New York: Humana Press, New York, pp. 115–133.
Witkowski, A., Joshi, A.K. and Smith, S. (2007) Coupling of the de novo fatty acid biosynthesis and lipoylation pathways in mammalian mitochondria. J. Biol. Chem., 282, 14178–14185.
Wongwathanarat, P., Michaelson, L.V., Carter, A.T., Lazarus, C.M., Griffiths, G., Stobart, A.K., Archer, D.B. and MacKenzie, D.A. (1999) Two fatty acid delta9-desaturase genes, ole1 and ole2, from Mortierella alpina complement the yeast ole1 mutation. Microbiol., 145 (Pt 10), 2939–2946.
Xie, X., Lin, H., Peng, X., Xu, C., Sun, Z., Jiang, K., Huang, A., Wu, X., Tang, N., Salvioli, A., Bonfante, P. and Zhao, B. (2016) Arbuscular Mycorrhizal Symbiosis Requires a Phosphate Transceptor in the Gigaspora margarita Fungal Symbiont. Mol. Plant, 9, 1583–1608.
Xu, J., Saunders, C.W., Hu, P., Grant, R.A., Boekhout, T., Kuramae, E.E., Kronstad, J.W., DeAngelis, Y.M., Reeder, N.L., Johnstone, K.R., Leland, M., Fieno, A.M., Begley, W.M., Sun, Y., Lacey, M.P., Chaudhary, T., Keough, T., Chu, L., Sears, R., Yuan, B. and Dawson, T.L. (2007) Dandruff-associated Malassezia genomes reveal convergent and divergent virulence traits shared with plant and human fungal pathogens. Proc. Natl. Acad. Sci. USA, 104, 18730–18735.
Xu, P., Gu, Q., Wang, W., Wong, L., Bower, A.G.W., Collins, C.H. and Koffas, M.A.G. (2013) Modular optimization of multi-gene pathways for fatty acids production in E. coli. Nat. Commun., 4, 1409.
Xue, L., Cui, H., Buer, B., Vijayakumar, V., Delaux, P.-M., Junkermann, S. and Bucher, M. (2015) Network of GRAS transcription factors involved in the control of arbuscule development in Lotus japonicus. Plant Physiol., 167, 854–871.
Yadav, V., Molina, I., Ranathunge, K., Castillo, I.Q., Rothstein, S.J. and Reed, J.W. (2014) ABCG transporters are required for suberin and pollen wall extracellular barriers in Arabidopsis. Plant Cell, 26, 3569–3588.
Yamamoto, K., Shibahara, A., Nakayama, T. and Kajimoto, G. (1991) Determination of double-bond positions in methylene-interrupted dienoic fatty acids by GC-MS as their dimethyl disulfide adducts. Chem. Phys. Lipids, 60, 39–50.
Yang, S.-Y., Grønlund, M., Jakobsen, I., Grotemeyer, M.S., Rentsch, D., Miyao, A., Hirochika, H., Kumar, C.S., Sundaresan, V., Salamin, N., Catausan, S., Mattes, N., Heuer, S. and Paszkowski, U. (2012) Nonredundant regulation of rice arbuscular mycorrhizal symbiosis by two members of the phosphate transporter1 gene family. Plant Cell, 24, 4236–4251.

150
Yang, W., Pollard, M., Li-Beisson, Y., Beisson, F., Feig, M. and Ohlrogge, J. (2010) A distinct type of glycerol-3-phosphate acyltransferase with sn-2 preference and phosphatase activity producing 2-monoacylglycerol. Proc. Natl. Acad. Sci. USA, 107, 12040–12045.
Yang, W., Simpson, J.P., Li-Beisson, Y., Beisson, F., Pollard, M. and Ohlrogge, J.B. (2012) A land-plant-specific glycerol-3-phosphate acyltransferase family in Arabidopsis. Substrate specificity, sn-2 preference, and evolution. Plant Physiol., 160, 638–652.
Yeats, T.H., Huang, W., Chatterjee, S., Viart, H.M.-F., Clausen, M.H., Stark, R.E. and Rose, J.K.C. (2014) Tomato cutin deficient 1 (CD1) and putative orthologs comprise an ancient family of cutin synthase-like (CUS) proteins that are conserved among land plants. Plant J., 77, 667–675.
Yeats, T.H., Martin, L.B.B., Viart, H.M.-F., Isaacson, T., He, Y., Zhao, L., Matas, A.J., Buda, G.J., Domozych, D.S., Clausen, M.H. and Rose, J.K.C. (2012) The identification of cutin synthase: formation of the plant polyester cutin. Nat. Chem. Biol., 8, 609–611.
Yen, C.-L.E., Monetti, M., Burri, B.J. and Farese, R.V. (2005) The triacylglycerol synthesis enzyme DGAT1 also catalyzes the synthesis of diacylglycerols, waxes, and retinyl esters. J. Lipid Res., 46, 1502–1511.
Zeng, T., Holmer, R., Hontelez, J., Te Lintel-Hekkert, B., Marufu, L., Zeeuw, T. de, Wu, F., Schijlen, E., Bisseling, T. and Limpens, E. (2018) Host- and stage-dependent secretome of the arbuscular mycorrhizal fungus Rhizophagus irregularis. Plant J., 94, 411–425.
Zhang, C., Cahoon, R.E., Hunter, S.C., Chen, M., Han, J. and Cahoon, E.B. (2013) Genetic and biochemical basis for alternative routes of tocotrienol biosynthesis for enhanced vitamin E antioxidant production. Plant J., 73, 628–639.
Zhang, L., Feng, G. and Declerck, S. (2018) Signal beyond nutrient, fructose, exuded by an arbuscular mycorrhizal fungus triggers phytate mineralization by a phosphate solubilizing bacterium. ISME J., 12, 2339–2351.
Zhang, Q., Blaylock, L.A. and Harrison, M.J. (2010) Two Medicago truncatula half-ABC transporters are essential for arbuscule development in arbuscular mycorrhizal symbiosis. Plant Cell, 22, 1483–1497.
Zhang, S., Lehmann, A., Zheng, W., You, Z. and Rillig, M.C. (2019) Arbuscular mycorrhizal fungi increase grain yields: a meta-analysis. New Phytol., 222, 543–555.
Zhang, X., Pumplin, N., Ivanov, S. and Harrison, M.J. (2015) EXO70I is required for development of a sub-domain of the periarbuscular membrane during arbuscular mycorrhizal symbiosis. Curr. Biol., 25, 2189–2195.
Zipfel, C. and Oldroyd, G.E.D. (2017) Plant signalling in symbiosis and immunity. Nature, 543, 328–336.

151
7 Appendix
7.1 Synthetic Oligonucleotides and PCR Reaction Conditions Oligonucleotide Sequence (5'-3')1 PCR, Target DNA PCR Reaction conditions RT-PCR FW (bn2221) RW (bn2222)
GAAGGACTCTTGCGGATTAC GAGGCCACAACAAACGATAC
RT-PCR, Lotus UBI
95°C-120 s, 30 cycles: (94°C-30 s, 60°C-40 s, 72°C- 40 s), 72°C-10 min
FW (bn2508) RW (bn2509)
GAAGAGCATCCCGTTCTGTT TCTGCTGAAGTGGTAAACGAG
RT-PCR, Lotus ACT
95°C-120 s, 30 cycles: (94°C-30 s, 62°C -40 s, 72°C-40 s), 72°C-10 min
FW (bn2027) RW (bn2028)
ACAAGACGCCTCTCCAAAC GTTCCCAATGGCTACTACTTCC
RT-PCR, Lotus FatM
95°C-120 s, 30 cycles: (94°C-30 s, 58°C -40 s, 72°C- 40 s), 72°C-10 min
FW (bn2456) RW (bn2457)
GGACTTGTGCCTAGAAGAGCA GCGGTTGATCTCAAGTCCTT
RT-PCR, Lotus FatA
95°C-120s , 30 cycles: (94°C-30 s, 60°C-40 s, 72°C-40 s), 72°C-10 min
FW (bn2500) RW (bn2501)
GGGTGGATTCTGGAGAGTGC TGGAACTCGATTCAAAGCATCA
RT-PCR, Lotus FatB
95°C-120 s, 30 cycles: (94°C-30 s, 60°C -40 s, 72°C- 40 s), 72°C-10 min
FW (bn2502) RW (bn2503)
ATCTGGGTTGGCTCCAAGG AGTGTGTGTATTGCAGGTCAG
RT-PCR, Lotus FatC
95°C-120 s, 30 cycles: (94°C-30 s, 60°C -40 s, 72°C- 40 s), 72°C-10 min
FW (bn2454) RW (bn2455)
CACTCGTCGGAACGTTATCC AGGATGCCTTGAAACCTGCT
RT-PCR, Lotus PT4
95°C-120 s, 30 cycles: (94°C-30 s, 58°C -40 s, 72°C-40 s), 72°C-10 min
FW (bn1942) RW (bn1943)
TGTCCAACCGGTTTTAAAGT AAAGCACGTTTGGCGTACAT
RT-PCR, Rhizo-phagus α-TUB
95°C-120 s, 30 cycles: (94°C-30 s, 56°C-40 s, 72°C- 30 s), 72°C-10 min
Genotyping of LORE1 insertion
FW (bn 2306) RW (bn 2307)
CGGCTCGAACAAGATTGACTCAGTGGA AGCCCTTGGCGATGAGGATCAACC
Genotyping of insertion in FatM-1
95°C-180 s, 5 cycles: (95°C-30 s, 72°C-75 s), 10 cycles: (95°C-30 s, 72°C to 68°C with -0.5°C per cycle, 72°C-45 s), 20 cycles: (95°C-30 s, 68°C-30 s, 72°C-45 s), 72°C-10 min
FW (bn 2300) RW (bn 2301)
CGGCTCGAACAAGATTGACTCAGTGGA AGCCCTTGGCGATGAGGATCAACC
Genotyping of insertion in FatM-2
95°C-180 s, 5 cycles: (95°C-30 s, 72°C-75 s), 10 cycles: (95°C-30 s, 72°C to 68°C with -0.5°C per cycle, 72°C-45 s), 20 cycles: (95°C-30 s, 68°C-30 s, 72°C-45 s), 72°C-10 min

152
Cloning by PCR-introduced RE-overhang
FW (bn2363) RW (bn2418)
TATGGATCCATGGCTGCTACTTTCACATT ATAAAGCTTCTAGGTGGAAAATGGAATTG
Expression of LjFatM in E. coli (pQE-80L)
98°C-30 s, 35 cycles: (98°C-10 s, 60°C-30 s, 72°C- 35 s), 72°C- 120 sec)
FW (bn2340) RW (bn2335)
GCGGGATCCGAGACACTTAGCCACA CGCAAGCTTTAGGTGGAAAATGGAA
Expression of LjFatMΔtp in E. col (pQE-80L)
98°C-30 s, 15 cycles: (98°C-10 s, 57°C-20 s, 7°C- 35 s), 98°C- 30 s, 20 cycles: (98°C-10 sec, 72°C -25 sec, 72°C- 120 sec)
FW (bn2354) RW (bn2356)
TATGGATCCGCAGAAACTGTGAAGCGTGA ATAAAGCTTTTACCTGGCACTTTCTCCTG
Expression of LjFatBΔtp in E. coli (pQE-80L)
98°C-30 s, 35 cycles: (98°C-10 s, 63°C-30 s, 72°C- 35 s), 72°C- 120 sec)
FW (bn3075) RW (bn3083)
TATCCCGGGATGGTGGCACAGGCAACATT ATACTCGAGTTATTTGGTTTTCCTATGTT
Expression of RiOLE1 in yeast (pDR196)
98°C-30 s, 10 cycles: (98°C-7 s, 58°C-20 s, 72°C- 32 s),
25 cycles: (98°C-7 sec, 68°C -20 sec, 72°C- 32 s)25x, 72°C-120 sec
FW (bn3077) RW (bn3084)
TATCCCGGGATGGCTGCTGCGCCAGTAAA ATACTCGAGCTATTCTTCCTTCTGACTCT
Expression of RiOLE1-LIKE in yeast (pDR196)
98°C-30 s, 10 cycles: (98°C-7 s, 63°C-20 s, 72°C- 32 s), 25 cycles: (98°C-7 sec, 72°C -20 sec, 72°C- 32 s), 72°C-120 sec
FW (bn3079) RW (bn3080)
TATAAGCTTATGGTGGCACAGGCAACATT ATAGGATCCTTATTTGGTTTTCCTATGTT
Expression of RiOLE1 in yeast (pYES2)
98°C-30 s, 10 cycles: (98°C-7 s, 58°C-20 s, 72°C- 32 s), 25 cycles: (98°C-7 sec, 67°C -20 sec, 72°C- 32 s), 72°C-120 sec
FW (bn3081) RW (bn3082)
TATAAGCTTATGGCTGCTG
CGCCAGTAAA ATAGAGCTCCTATTCTTCCT
TCTGACTCT
Expression of RiOLE1-LIKE in yeast (pYES2)
98°C-30 s, 10 cycles: (98°C-7 s, 63°C-20 s, 72°C- 32 s), 25 cycles: (98°C-7 sec, 72°C -20 sec, 72°C- 32 s), 72°C-120 sec
FW (bn3214) RW (bn3076)
TATGGATCCATGGTGGCACAGGCAACATT ATAAAGCTTTTATTTGGTTTTCCTATGTT
Expression of RiOLE1 in N. benthamiana (p917RFPUBQExpr)
98°C-30 s, 10 cycles: (98°C-7 s, 58°C-20 s, 72°C- 32 s), 25 cycles: (98°C-7 sec, 68°C -20 sec, 72°C- 32 s), 72°C-120 sec
FW (bn3212) RW (bn3213)
TATACGCGTATGGCTGCTGCGCCAGTAAA ATACTCGAGCTATTCTTCCTTCTGACTCT
Expression of RiOLE1-LIKE in N. benthamiana (pBin35S)
98°C-30 s, 10 cycles: (98°C-7 s, 63°C-20 s, 72°C- 32 s), 25 cycles: (98°C-7 sec, 72°C -20 sec, 72°C- 32 s), 72°C-120 sec
Golden Gate Cloning
FW (bn 3016)
ATGAAGACTTTACGGGTCTCAGCGGGAATGATCATTATGCCAACA
pFatM cloning for pFatM:gFatM
98°C-30 s, 10 cycles: (98°C-7 s, 52°C-20 s, 72°C- 50 s), 25 cycles: (98°C-7 s, 72°C-20 s, 72°C- 50 s),72°C-2 min

153
RW (bn 3017) ATGAAGACTTCAGAGGTCTCTCAGATCTTTTTTCTATTTTTTTGG
FW (bn 3018) RW (bn 3021)
ATGAAGACTTTACGGGTCTCACACCATGGCTGCTACTTTCACATT TAGAAGACAAAGATCACTTATAAATAGGGTATCC
gFatM fragment 1 cloning for pFatM:gFatM
98°C-30 s, 10 cycles: (98°C-7 s, 55°C-20 s, 72°C- 20 s), 25 cycles: (98°C-7 s, 66°C-20 s, 72°C- 20 s), 72°C-2 min
FW (bn 3020) RW (bn 3023)
TAGAAGACAAATCTTCAATGAACGGATCCAGCAT TAGAAGACAAGACTTTCTCATGAAGTAGTTAAAT
gFatM fragment 2 cloning for pFatM:gFatM
98°C-30 s, 10 cycles: (98°C-7 s, 54°C-20 s, 72°C- 17 s), 25 cycles: (98°C-7 s, 66°C-20 s, 72°C- 17 s), 72°C-2 min
FW (bn 3022) RW (bn 3019)
TAGAAGACAAAGTCTCATGGGCTTCAGTGTTTTG ATGAAGACTTCAGAGGTCTCTCCTTCTTCCACACTTATTGCTAGG
gFatM fragment 3 cloning for pFatM:gFatM
98°C-30 s, 10 cycles: (98°C-7 s, 62°C-20 s, 72°C- 50 s), 25 cycles: (98°C-7 s, 72°C-20 s, 72°C- 50 s), 72°C-2 min

154
7.2 Glycostocks
Construct Insert with Restriction Sites or PCR primer used
Plasmid Organism/Strain Glycostock Number
pJ-LjFatAΔtp LjFatA cDNA, PCR bn2403-bn2405
pJET1.2 E.coli/ ElectroSHOX
bn 1139
pJ-LjFatBΔtp LjFatB cDNA, PCR bn2354-bn2356
pJET1.2 E.coli/ ElectroSHOX
bn 1140
pJ-LjFatMΔtp LjFatM cDNA, PCR bn2340-bn2335
pJET1.2 E.coli/ ElectroSHOX
bn 849
pJ-LjFatMTE LjFatM cDNA, PCR bn2342-bn2335
pJET1.2 E.coli/ ElectroSHOX
bn 850
pJ-LjFatM LjFatM cDNA, PCR bn2334-bn2418
pJET1.2 E.coli/ ElectroSHOX
bn 1016
pQE-LjFatAΔtp LjFatA cDNA, BamHI-HindIII (989 bp)
pQE-80L E.coli/ ElectroSHOX
bn 1160, bn 1161
pQE-LjFatBΔtp LjFatB cDNA, BamHI-HindIII (1101 bp)
pQE-80L E.coli/ ElectroSHOX
bn 1162, bn 1163
pQE-LjFatMΔtp LjFatM cDNA, BamHI-HindIII (1070 bp)
pQE-80L E.coli/ ElectroSHOX
bn 881
pJ-RiOLE1 RiOLE1cDNA, PCR bn3214-bn3076
pJET1.2 E.coli/ ElectroSHOX
bn 1244
pJ-RiOLE1-LIKE RiOLE1-LIKE cDNA, PCR bn3211-bn3213
pJET1.2 E.coli/ ElectroSHOX
bn 1243
pDR196-RiOLE1 RiOLE1cDNA, SmaI-XhoI (1226 bp)
pDR196 E.coli/ ElectroSHOX
bn 1215
pDR196-RiOLE1-LIKE
RiOLE1-LIKE cDNA, SmaI-XhoI (1262 bp)
pDR196 E.coli/ ElectroSHOX
bn 1216
pYES2-RiOLE1-LIKE
RiOLE1-LIKE cDNA, HindIII-SacI (1262 bp)
pYES2 E.coli/ ElectroSHOX
bn 1217
pJ-RiOLE1 RiOLE1 cDNA, PCR bn3214-bn3076
pJET1.2 E.coli/ ElectroSHOX
bn 1249
p917UBQ3-RiOLE1 RiOLE1cDNA, BamHI-HindIII (1226 bp)
p917RFP UBQ Expr
E.coli/ ElectroSHOX
bn 1250
pJ-RiOLE1-LIKE RiOLE1-LIKE cDNA, PCR bn3212-bn3213
pJET1.2 E.coli/ ElectroSHOX
bn 1243

155
pBin35S-RiOLE1-LIKE
RiOLE1cDNA, MluI-XhoI (1262 bp)
pBin35S E.coli/ ElectroSHOX
bn 1246
p917UBQ3-RiOLE1 RiOLE1cDNA, BamHI-HindIII (1226 bp)
p917RFP UBQ Expr
A. tumefaciens/ GV3101 (pMP90)
bn 1265
pDR196-EV - pDR196 S. cerevisae/ BY4741 (WT)
bn 1231
pDR196-RiOLE1 RiOLE1cDNA, SmaI-XhoI (1226 bp)
pDR196 S. cerevisae/ BY4741 (WT)
bn 1232
pDR196-RiOLE1-LIKE
RiOLE1-LIKE cDNA, SmaI-XhoI (1262 bp)
pDR196 S. cerevisae/ BY4741 (WT)
bn 1233
pDR196-EV - pDR196 S. cerevisae/ ole1-Δ
bn 1234
pDR196-RiOLE1 RiOLE1cDNA, SmaI-XhoI (1226 bp)
pDR196 S. cerevisae/ ole1-Δ
bn 1235
pDR196-RiOLE1-LIKE
RiOLE1-LIKE cDNA, SmaI-XhoI (1262 bp)
pDR196 S. cerevisae/ ole1-Δ
bn 1236
LI-pUC57(BB03)-pFatM
LjFatM promoter (1.8 kb) without mutagenesis, BpiI (1824 bp)
L1pUC57+BpiI(Gent)
E.coli/ ElectroSHOX
bn 1198
LI-pUC57(BB03)-gFatM
LjFatM gene with mutagenesis, BpiI (3200 bp)
L1pUC57+BpiI(Gent)
E.coli/ ElectroSHOX
bn 1199
LI-pUC57(BB03)-gFatM
LjFatM gene with mutagenesis, BpiI (3200 bp)
L1pUC57+BpiI(Gent)
E.coli/ TOP10
bn 1200

156
7.3 Transcriptomics of L. japonicus Fat genes
Figure 29: Gene Expression of L. japonicus Fat Genes during differential Treatments. The L. japonicus Gene Expression Atlas (LjGEA; https://ljgea.noble.org/v2/) was used for a BLAST search using the coding sequence of FatM (chr5.CM0328.70.r2.d) as query. Gene expression levels of FatM and homologous genes LjFatA, LjFatB and LJFatC is depicted on the y-axis and different treatment conditions on thex-axis. FatM is extensively and exclusively expressed in mycorrhiza-inoculated roots (+myc), where the other Fat genes show a differential expression pattern and are also expressed in e. g. developing seeds, flowers, shoots and leaves.

157
7.4 Cloning of RiOLE1 and RiOLE1-like into the Yeast Expression Vector pDR196
The RiOLE1 (Gloin1|344273) cDNA (1226 bp) and RiOLE1-like (Gloin1|340272) cDNA
(1262 bp) cDNAs were obtained by RT-PCR using wild type R. irregularis ERM RNA with primers bn3075 + bn3083 and bn3077 + bn3084, respectively, using Q5 polymerase with proofreading ability to incorporate 5´ overhangs suitable for restriction digestion. The PCR products were isolated, ligated into the linearized vector pJET1.2 and transformed into E. coli electroSHOX. Recombinant clones were selected with carbenicillin (100 µg mL -1) and plasmid DNA was purified. The constructs were digested with restriction enzymes or PCR was performed to confirm the successful cloning of RiOLE1 and RiOLE1-like into pJET 1.2. The appropariate fragments were then cloned into pDR196 expression vector (Table 15). To confirm correct sequences, plasmids were sequenced at Eurofins Genomics, Ebersberg (D). The sequences obtained were aligned with the RiOLE1 sequence (Gloin1|344273) and RiOLE1-LIKE (Gloin1|340272) from EnsemblFungi database. Table 15: Cloning of RiOLE1 and RiOLE1-LIKE for Expression in Yeast.
Construct Restriction
Endonucleases
Fragments
obtained for
Orientation A
Fragments
obtained for
Orientation B
Primer used for
Sequencing or
Colony PCR
pJ-RiOLE1 SmaI,xhoI 25, 1231a, 2963 23, 1235, 2961 bn2444 +
bn2445
pJ-RiOLE1-LIKE SmaI,xhoI 25, 1267a, 2963 23, 1271, 2961 bn2444 +
bn2445
pDR196 (EVb) SmaI,xhoI 6363a, 43 - -
pDR196-RiOLE1 BamHI, HindIII 1292, 5519, 783 - bn3075 +
bn3083
pDR196-RiOLE1-
LIKE
BamHI, HindIII 354, 494, 480,
5519, 783
- bn3077 +
bn3084 aUnderlined, bold fragments were eluted from the gel and used in subsequent ligation reactions. bEV= Empty vector.

158
Figure 30: Vector for constitutive Expression of RiOLE1 and RiOLE1-LIKE in S. cerevisiae. RiOLE11 and RiOLE1-LIKE cDNAs were cloned into the pDR196. HPA Pro, Plasma membrane H+-ATPase promoter; MCS, multiple cloning site; ADH1 Ter, alcohol dehydrogenase 1 terminator; 2µ Ori= yeast 2µ origin of replication, URA3= yeast orotidine-5-phosphate decarboxylase, URA3 Pro= yeast orotidine-5-phosphate decarboxylase promoter, AmpR= Ampicillin/carbenicillin resistance gene ß-lactamase (bla), pUC Ori= pUC bacterial origin of replication.

159
7.5 Cloning of RiOLE1 and RiOLE1-LIKE into Expression Vectors for N. benthamiana
RiOLE1 (Gloin1|344273) cDNA (1226 bp) and RiOLE1-like (Gloin1|340272) cDNA (1262
bp) were obtained by RT-PCR using wild type R. irregularis ERM cDNA with primers bn3214 + bn3076 and bn3212 + bn3213, respectively, using Q5 polymerase with proofreading ability to incorporate 5´ overhangs suitable for restriction digestion. The PCR products were isolated, ligated into the linearized vector pJET1.2 and transformed into E. coli electroSHOX. Recombinant clones were selected with carbenicillin (100 µg mL-1) and plasmid DNA was purified. The constructs were digested with restriction enzymes or PCR was performed to confirm the successful cloning of RiOLE1 and RiOLE1-like into pJET 1.2 (Table 16). The appropriate fragments were then cloned into p917RFPUBQExpr (RiOLE1) or pBin35S-AtWSD1 (RiOLE-LIKE) expression vector (Table 16). p917UBQ3-RiOLE1 was selected with streptomycin (300 µg mL -1) and spectinomycin (100 µg mL -1) and pBin35S-RiOLE1-LIKE with Kanamycin (50 µg mL -1). To confirm that the sequences were correct, plasmids were sequenced at Eurofins Genomics, Ebersberg (D). The sequences obtained were aligned with the RiOLE1 sequence (Gloin1|344273) and RiOLE1-LIKE (Gloin1|340272) from EnsemblFungi database. Table 16: Cloning of RiOLE1 and RiOLE1-LIKE for Expression in N. benthamiana.
Construct Restriction
Endonucleases
Fragments
obtained for
Orientation A
Fragments
obtained for
Orientation B
Primer used
for Sequencing
and Colony
PCR
pJ-RiOLE1 HindIII 261, 3958 1494, 2725 bn2444 +
bn2445
BamHI, HindIII 261, 1233a,
2725
261, 1233a,
2725
-
pJ-RiOLE1-LIKE XbaI, KpnI 456, 3799 833, 3422 bn2444 +
bn2445
XbaI, EcoRV 1022, 3233 271, 3984 -
MluI,xhoI 23, 1269a, 2963 23, 1269a, 2963 -
p917RFPUBQExpr (EVb)
BamHI, HindIII 24, 13522 a - -
p917UBQ3-RiOLE1 BamHI,
HindIII,xhoI
BamHI, HindIII
XbaI
5275, 1233,
8247
1233, 13522
2495, 738, 2781,
8741
- bn3214+
bn3076
-
pBin35S-AtWSD1c XhoI, MluI 1452, 10334a - -
pBin35S-RiOLE1-
LIKE
XhoI, HindIII 11145, 458 - bn3212 +
bn3213 aUnderlined, bold fragments were eluted from the gel and used in subsequent ligation reactions; RiOLE1+p917RFPUBQExpr and RiOLE1-LIKE + pBin35S. bEV= Empty vector. cAtWSD1 (glycostock bn1173) was removed from pBin35S-AtWSD1 and the pBin35S backbone used for expression of RiOLE1-LIKE.

160
Figure 31: Vectors for transient Expression of RiOLE1 and RiOLE1-LIKE in N. benthamiana. RiOLE1 and RiOLE1-LIKE cDNAs were cloned into expression vectors p917RFPUBQExpr and pBIN35S. 35S. Pro, 35S Promoter from Cauliflower Mosaic Virus; NPTII, Neomycin Phosphotransferase for Kanamycin resistance; 35 S Ter, 35S Terminator; Nos Ter, Nopaline Synthase (Nos) Terminator; dsRed, Discosoma (ds) Red Fluorescence Protein; Ubq10 prom, UBIQUITIN10 Promoter; Ubq3 prom, UBIQUITIN3 Promoter; cDNA int, UBQ3 Intron for enhanced expression; RiOle1, R. irregularis OLE1 cDNA; OCS Ter, Octopine Synthase Terminator; RB, Right border; ColE1 Ori, Colicin E1 Origin of Replication for replication of Plasmid in E. coli; pVS1, backbone from predecessor plasmid; sm/sp, Spectinomycin/Streptomycin Resistance genes; LB, Left border.

161
7.6 Cloning of LjFatA, LjFatB and LjFatM into pQE80L for Expression in E. coli
cDNA from L. japonicus roots colonized with R. irregularis was used to amplify Fat genes without the predeceding N-terminal transit peptides generating the fragments LjFatAΔtp (972 bp) with primers bn2403 + bn2405, LjFatBΔtp (1120 bp) with bn2354 + bn2356 and LjFatMΔtp (1089 bp) with bn2340 + bn2335. Additionally, for LjFatM, the full coding sequence (LjFatM) was amplified with bn2363 + bn2418 (1214 bp) and the thioesterase domain (LjFatMTE) with bn 2432 + bn 2335 (942 bp). All RT-PCRs were done with Q5 polymerase (NEB) with proofreading ability. The PCR products were seperated by DNA gel electrophoresis. The PCR products were isolated, ligated into the linearized vector pJET1.2 and transformed into E. coli electroSHOX. Recombinant clones were selected with carbenicillin (100 µg mL-1) and plasmid DNA was purified. The constructs were digested with restriction enzymes or PCR was performed to confirm the successful cloning of LjFat sequences into pJET 1.2 (Table 17). The appropariate fragments were then cloned into pQE80-L expression vector. To confirm correct sequences, plasmids were sequenced at Eurofins Genomics, Ebersberg (D). Table 17: Cloning of L. japonicus Fat coding sequences for expression in E. coli.
Construct Restriction
Endonucleases
Fragments
obtained for
Orientation A
Fragments
obtained for
Orientation B
Primer used for
Sequencing and
Colony PCR
pJ-FatAΔtp BamHI, HindIII 261, 2725, 960a 261, 2725, 960a bn2444 + bn2445
pJ-FatBΔtp BamHI, HindIII 1109a, 261, 2725 1109a, 261, 2725 bn2444 + bn2445
pJ-FatMΔtp BamHI, HindIII 1077a, 261, 2725 1077a, 261, 2725 bn2444 + bn2445
pJ-FatM BamHI, HindIII 1202a, 261, 2725 1202a, 261, 2725 bn2444 + bn2445
pJ-FatMTE BamHI, HindIII 930a, 261, 2725 930a, 261, 2725 bn2444 + bn2445
pQE-80L
(EVb)
BamHI, HindIII 4709a, 42 - -
pQE-LjFatAΔtp - - - bn2638 + bn2639
pQE-LjFatBΔtp - - - bn2638 + bn2639
pQE-LjFatMΔtp - - - bn2638 + bn2639 aUnderlined, bold fragments were eluted from the gel and used in subsequent ligation reactions; RiOLE1+p917RFPUBQExpr and RiOLE1-LIKE + pBin35S. bEV= Empty vector.
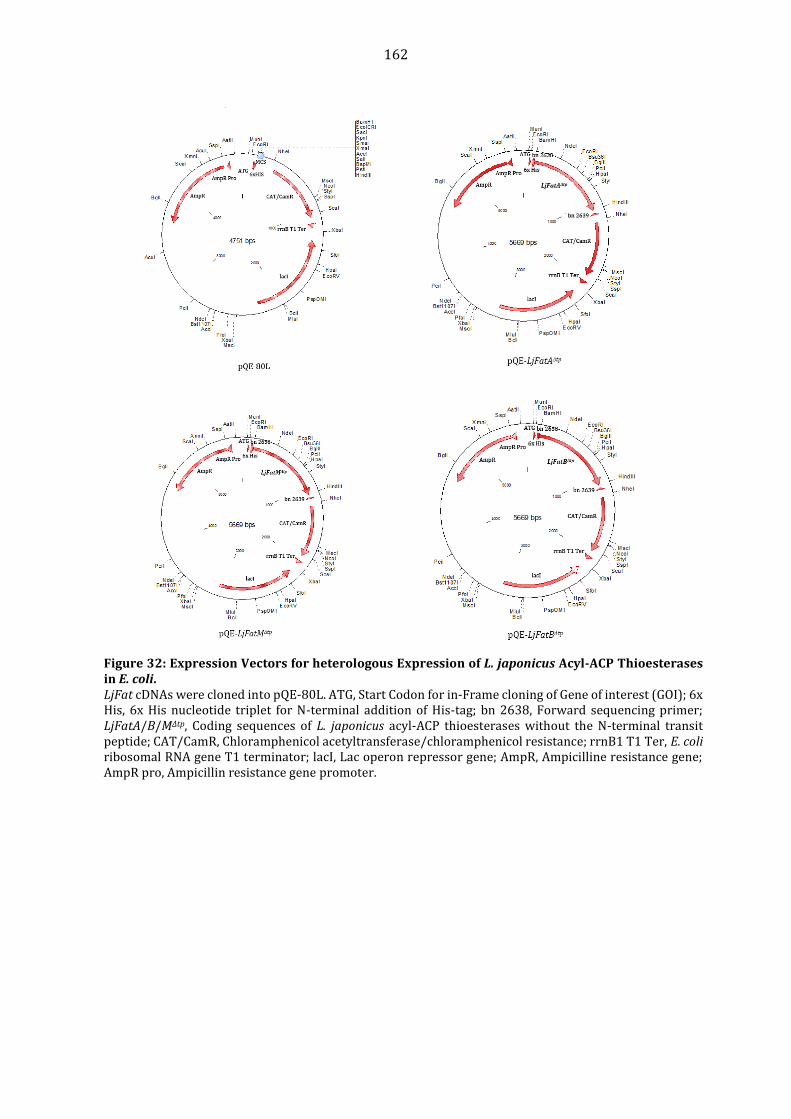
162
Figure 32: Expression Vectors for heterologous Expression of L. japonicus Acyl-ACP Thioesterases in E. coli. LjFat cDNAs were cloned into pQE-80L. ATG, Start Codon for in-Frame cloning of Gene of interest (GOI); 6x His, 6x His nucleotide triplet for N-terminal addition of His-tag; bn 2638, Forward sequencing primer; LjFatA/B/MΔtp, Coding sequences of L. japonicus acyl-ACP thioesterases without the N-terminal transit peptide; CAT/CamR, Chloramphenicol acetyltransferase/chloramphenicol resistance; rrnB1 T1 Ter, E. coli ribosomal RNA gene T1 terminator; lacI, Lac operon repressor gene; AmpR, Ampicilline resistance gene; AmpR pro, Ampicillin resistance gene promoter.

163
7.7 Golden Gate Cloning of the LjFatM Gene and Promoter and Genetic Complementation of fatm-1
Level II and Level III cloning was performed by Andreas Keymer at the Ludwigs Maximilian University, München, in the group of Caroline Gutjahr in 2018. As template for the FatM gene and promoter, DNA from L. japonicus roots colonized with R. irregularis was used. In golden gate cloning, the type IIS restriction enzymes BbsI (BpiI) and BsaI that cut outside the recognition sequence are used. Level I sublconing constructs are assembled from level 0 plasmids using BbsI, Level II constructs are generated with BsaI and for assembly of Level III plant expression constructs, BbsI is used again. Level 0 Subcloning into pUC57 (Amp)
The genomic FatM sequence (gFatM) contains type IIS restriction enzyme recognition sites, therefore mutagenesis PCR is performed to disrupt these. The gFatM gene contains one BbsI(BpiI) and one BsaI recognition site. To distrup the recognition sites, single nucleotides were exchanged via mutagenesis PCR by introducing a mismatch at the 5´ overhang of PCR primer. With the same primer, a 5´ BpiI-recognition site was added to ensure the correct orientation of the gene sequence after the three fragments from mutagenesis PCR are assembled again. The three fragments were produced using primer bn 3018 + bn 3021 (643 bp), bn 3020 + bn 3023 (388 bp), and bn 3022+ bn3019 (2244 bp).
The 1.8 kb sequence upstream of the gFatM start codon was designated as the putative promoter region (pFatM) and amplified with primers bn 3016 + bn 3017 (1850 bp) without mutagenesis as it did not contain type IIS recognition sites.
The correct PCR products were excised from the agarose gel, purified, used for blunt-end ligation into linearized subcloning vector pJET1.2 and transformed into E. coli ElectroSHOX. Selection of recombinant clones was done on LB agar containing carbenicilin (100 µg mL -1) and plasmid DNA was purified from ON cultures.
To verify the correct insertion into the subcloning vector, the constructs were digested with the following enzymes or PCR was performed with the following primers to confirm the successful cloning of pJ-L0gFatM1, pJ-L0gFatM2, pJ-L0gFatM3 and pJ-L0pFatM into pJET 1.2.
Construct Restriction
Endonucleases
Fragments
obtained for
Orientation A
Fragments
obtained for
Orientation B
Primer used for
Sequencing and
Colony PCR
pJ-L0gFatM1 BbsI (BpiI) 330, 619, 2668 330, 619, 2668 bn2444 + bn2445
pJ-L0gFatM2 BbsI (BpiI) 330, 364, 2668 330, 364, 2668 bn2444 + bn2445
pJ-L0gFatM3 BbsI (BpiI) 330, 2220, 2668 330, 2220, 2668 bn2444 + bn2445
pJ-L0pFatM BbsI (BpiI) 330, 1820, 2668 330, 1820, 2668 bn2444 + bn2445
Level I Subcloning into LI-pUC57+BpiI (BB03)
To obtain the level I vectors, the level 0 vectors were digested with BbsI (BpiI) and ligated into BbsI (BpiI)-digested level I vector LI-pUC57+BpiI. This was done in a single cut-ligation reaction containing 62.5 fmol DNA per fragment.
Cut-ligation LI-gFatM 1 µL LI-pUC57+BpiI (BB03) (100 ng *µL -1) 0.7 µL pJ-L0gFatM1 (208 ng *µL -1) 1.9 µL pJ-L0gFatM2 (70 ng *µL -1)
1.22 µL pJ-L0gFatM3 (72.8 ng *µL -1)
Cut-ligation LI-pFatM 1 µL LI-pUC57+BpiI (BB03) (100 ng *µL -1) 1.45 µL pJ-L0pFatM (51 ng *µL -1) 0.75 µL T4 DNA Ligase M0202S (400.000
U.mL-1)

164
0.75 µL T4 DNA Ligase M0202S
(400.000 U.mL-1)
1.5 µLx T4 DNA Ligase buffer
0.5 µL BbsI-HF (20.000 U.mL-1)
Add nuclease-free ddH2O to a final volume
of 15 µL.
1.5 µLx T4 DNA Ligase buffer
0.5 µL BbsI-HF (20.000 U.mL-1)
Add nuclease-free ddH2O to a final volume
of 15 µL.
The reactions were mixed, spinned down and incubated in a PCR cycler with the following
settings: (37°C-2 min, 25°C-5 min)35x—50°C-5 min, 80°C–5min. The cut-ligation mixture was desalted and transformed into E. coli ElectroSHOX and and E. coli TOP10 (Thermo Fisher Scientific) selection of recombinant clones was done on LB agar containg gentamycin (20 µg mL-
1) and plasmid DNA was purified from ON cultures. To verify the correct insertion into the Level I subcloning vector, the constructs were
digested with the following enzymes or PCR was performed with the following primers to confirm the successful cloning of LI-pUC57(BB03)-gFatM and LI-pUC57(BB03)-pFatM.
Construct Restriction
Endonucleases
Fragments
obtained (bp)
Primer used for
Colony PCR and
Fragments
obtained (bp)
Primer used for
Sequencing
LI-pUC57(BB03)-
gFatM
BsaI 3181, 2483 bn 2027 + bn 2632
(1109 bp)
bn2301/bn2303 +
bn2632
LI-pUC57(BB03)-
pFatM
BsaI 1804, 2483 - bn2310/bn2311 +
bn2632
Level II and III Cloning
In Level II, BsaI sites flanking the desired inserts in the Level I constructs were used to assemble these in the correct orientation (promoter fragment in front of the gene fragment and Nos terminator after gene sequence) in the Level II plasmid. In Level III cloning, BpiI was used to transfer the assembled fragments (pFatM:gFatM and pFatM:EV) into an expression vector suitable for plant transformation containing a resistance gene (kanamycin) and a mCherry fluorescence marker (p35s:mCherry).
Overview of Golden Gate Cloning
In the table below, all constructs used for the assembly of L. japonicus FatM promoter upstream of the FatM gene sequence for complementation of the FatM mutation, are summarized (Brands et al., 2018).
Purpose Construct Description
Golden Gate level 0 and I (L0, LI) elements
L0 subcloning of pFatM without mutagenesis
L0 pJET1.2 pLjFatM PCR amplification from genomic DNA of L. japonicus Gifu wild type. FatM 1.8 kb promoter fragment (pFatM) with bn 3016 + bn 3017 (1850 bp) and assembly by blunt-end ligation into L0 pJET1.2.
L0 subcloning of gFatM with mutagenesis
L0 pJET1.2 gFatM-Fragment1
Assembled by blunt-end ligation of gFatM PCR fragment 1, 2 and 3 into L0 pJET1.2 plasmid

165
L0 pJET1.2 gFatM-Fragment2 L0 pJET1.2 gFatM-Fragment3
amplified from genomic DNA of L. japonicus Gifu wild type. Primers: Fragment 1: bn 3018 + bn 3021 (643 bp) Fragment 2: bn 3020 + bn2023 (388 bp) Fragment 3: bn 3022 + bn2019 (2244 bp)
LI pFatM module generation
LI pLjFatM Assembled 1 fragment from L0 pJET1.2 pLjFatM by BpiI cut-ligation into LI-pUC57+BpiI plasmid (BB03)
LI gFatM module generation
LI gFatM Assembled 3 fragments from L0 pJET1.2 gFatM 1,2,3 by BpiI cut ligation into LI-pUC57+BpiI plasmid (BB03)
Golden Gate level II (LII) plasmids
LII construct generation
LIIc 1_2 pFatM:gFatM (pAK44)
Assembled by BsaI cut ligation from: LI A-B pLjFatM + LI B-C dy (BB06) + LI gFatM + LI D-E dy (BB08) + LI E-F NosT (G006) + LI F-G dy (BB09) + LIIc F 1_2 (BB30)
LII construct generation
LIIc 1_2 pFatM:EV (pAK45)
Assembled by BsaI cut ligation from: LI A-B pLjFatM + LI B-C dy (BB06) + LI C-D dy (BB07) + LI D-E dy (BB08) + LI E-F NosT (G006) + LI F-G dy (BB09) + LIIc F 1_2 (BB30)
LIIc 3_4 p35s:mCherry (pAK18)
Assembled by BsaI cut ligation from: LI A-B p35s (G005) + LI B-C dy (BB06) + LI C-D mCherry (G057) + LI D-E dy (BB08) + LI E-F 35sT (G059) + LI F-G dy (BB09) + LIIc R 3_4 (BB34)
Golden Gate level III (LIII) plasmids for plant transformation
Genetic complementation of FatM-1
LIIIβ F A-B pFatM:gFatM (pAK46)
Assembled by BpiI cut ligation from: LIIc 1_2 pFatM:gFatM + LII 2-3 ins (BB43) + LIIc R 3-4 p35s:mCherry + LII 4-6 dy (BB41) + LIIIβ F A-B (BB53)
Genetic complementation of FatM-1
LIIIβ F A-B pFatM:EV (pAK47)
Assembled by BpiI cut ligation from: LIIc 1_2 pFatM:EV + LII 2-3 ins (BB43) + LIIc R 3-4 p35s:mCherry + LII 4-6 dy (BB41) + LIIIβ F A-B (BB53)

166
7.8 Mass-over-charge Values for the Quantification of Lipids Lipids were quantified via Q-TOF MS/MS Nanoflow Direct Infusion with Chip Cube Technology (Wewer et al., 2014). Table 18: Calculated masses of ion adducts (targeted list) for Phospholipids, Galactolipids, Sufolipid and Neutral Lipids
Molecular Species
Calculated Molecular Mass of ion adduct
(m/z)a
Molecular Species
Calculated Molecular
Mass of ion adduct (m/z)a
34:6 MGDG 764.5307 28:0 PS (IS)b 680.4503 34:5 MGDG 766.5463 34:4 PS 756.4810 34:4 MGDG 768.5620 34:3 PS 758.4967 34:3 MGDG 770.5776 34:2 PS 760.5123 34:2 MGDG 772.5933 34:1 PS 762.5280 34:1 MGDG 774.6089 36:6 PS 780.4810 34:0 MGDG (IS)b 776.6246 36:5 PS 782.4967 36:6 MGDG 792.5620 36:4 PS 784.5123 36:5 MGDG 794.5776 36:3 PS 786.5280 36:4 MGDG 796.5933 36:2 PS 788.5436 36:3 MGDG 798.6089 36:1 PS 790.5593 36:2 MGDG 800.6246 38:6 PS 808.5123 36:1 MGDG 802.6402 38:5 PS 810.5280 36:0 MGDG (IS)b 804.6559 38:4 PS 812.5436 38:6 MGDG 820.5933 38:3 PS 814.5593 38:5 MGDG 822.6089 38:2 PS 816.5749 38:4 MGDG 824.6246 38:1 PS 818.5906 38:3 MGDG 826.6402 40:4 PS 840.5749 34:6 DGDG 926.5835 40:3 PS 842.5906 34:5 DGDG 928.5992 40:2 PS 844.6062 34:4 DGDG 930.6148 40:1 PS 846.6219 34:3 DGDG 932.6305 40:0 PS (IS)b 848.6375 34:2 DGDG 934.6461 42:4 PS 868.6062 34:1 DGDG 936.6618 42:3 PS 870.6219 34:0 DGDG (IS)b 938.6775 42:2 PS 872.6375 36:6 DGDG 954.6148 42:1 PS 874.6532 36:5 DGDG 956.6305 34:4 PI 848.5283 36:4 DGDG 958.6461 34:3 PI 3 850.5440 36:3 DGDG 960.6618 34:2 PI 3 852.5597 36:2 DGDG 962.6774 34:1 PI 3 854.5753 36:1 DGDG 964.6931 34:0 PI 3 (IS)b 856.5910 36:0 DGDG (IS)b 966.7087 36:6 PI 3 872.5283 38:6 DGDG 982.6461 36:5 PI 3 874.5440 38:5 DGDG 984.6618 36:4 PI 3 876.5596 38:4 DGDG 986.6774 36:3 PI 3 878.5753 38:3 DGDG 988.6931 36:2 PI 3 880.5909 34:6 SGDG 828.4926 36:1 PI 3 882.6066 34:5 SGDG 830.5082 36:0 PI (IS)b 884.6223 34:4 SGDG 832.5239 28:0 PE (IS)b 636.4604 34:3 SGDG 834.5395 34:4 PE 712.4912 34:2 SGDG 836.5552 34:3 PE 714.5069 34:1 SGDG 838.5708 34:2 PE 716.5225 34:0 SQDG (IS)b 840.5865 34:1 PE 718.5382 36:6 SGDG 856.5239 36:6 PE 736.4912

167
Table 18 (continued) 36:5 SGDG 858.5395 36:5 PE 738.5069 36:4 SGDG 860.5552 36:4 PE 740.5225 36:3 SGDG 862.5708 36:3 PE 742.5382 36:2 SGDG 864.5865 36:2 PE 744.5538 36:1 SGDG 866.6022 36:1 PE 746.5695 36:0 SQDG (IS)b 868.6178 38:6 PE 764.5225 28:0 PA (IS)b 610.4448 38:5 PE 766.5382 34:6 PA 682.4442 38:4 PE 768.5538 34:5 PA 684.4462 38:3 PE 770.5695 34:4 PA 686.4755 38:2 PE 772.5851 34:3 PA 688.4912 40:3 PE 798.6008 34:2 PA 690.5068 40:2 PE 800.6164 34:1 PA 692.5225 40:0 PE (IS)b 804.6477 36:6 PA 710.4755 42:4 PE 824.6169 36:5 PA 712.4912 42:3 PE 826.6321 36:4 PA 714.5068 42:2 PE 828.6477 36:3 PA 716.5225 28:0 PG (IS)b 684.4816 36:2 PA 718.5381 32:1 PG 738.5279 40:0 PA (IS)b 778.6326 32:0 PG 740.5436 28:0 PS (IS)b 680.4503 34:4 PG 760.5123 34:4 PS 756.4810 34:3 PG 762.5279 34:3 PS 758.4967 34:2 PG 764.5436 34:2 PS 760.5123 34:1 PG 766.5592 34:1 PS 762.5280 34:0 PG 768.5749 36:6 PS 780.4810 40:0 PG (IS)b 852.6694 36:5 PS 782.4967 28:0 PC (IS)b 678.5074 36:4 PS 784.5123 32:0 PC 734.5695 36:3 PS 786.5280 34:4 PC 754.5382 36:2 PS 788.5436 34:3 PC 756.5538 36:1 PS 790.5593 34:2 PC 758.5695 38:6 PS 808.5123 34:1 PC 760.5851 38:5 PS 810.5280 36:6 PC 778.5382 38:4 PS 812.5436 36:5 PC 780.5538 38:3 PS 814.5593 36:4 PC 782.5695 38:2 PS 816.5749 36:3 PC 784.5851 38:1 PS 818.5906 36:2 PC 786.6008 40:4 PS 840.5749 36:1 PC 788.6164 40:3 PS 842.5906 38:6 PC 806.5695 40:2 PS 844.6062 38:5 PC 808.5851 40:1 PS 846.6219 38:4 PC 810.6008 40:0 PS (IS)b 848.6375 38:3 PC 812.6164 42:4 PS 868.6062 38:2 PC 814.6321 42:3 PS 870.6219 40:5 PC 836.6164 42:2 PS 872.6375 40:4 PC 838.6321 42:1 PS 874.6532 40:3 PC 840.6477 30:0 TAG (IS)b 572.4885 40:2 PC 842.6634 33:3 TAG (IS)b 608.4885 40:0 PC (IS)b 846.6952 48:9 TAG 806.6297 28:2 DAG (IS)b 526.4466 48:8 TAG 808.6453 28:0 DAG (IS)b 530.4784 48:7 TAG 810.6609 32:3 DAGk 580.4937 48:6 TAG 812.6765 32:2 DAG 582.5093 48:5 TAG 814.6921 32:1 DAG 584.5249 48:4 TAG 816.7077 32:0 DAG 586.5405

168
Table 18 (continued) 48:3 TAG 818.7233 34:6 DAG 602.478 48:2 TAG 820.7389 34:5 DAGl 604.4936 48:1 TAG 822.7545 34:4 DAGm 606.5092 48:0 TAG 824.7702 34:3 DAGn 608.5249 50:9 TAG 834.6608 34:2 DAGo 610.5405 50:8 TAGc 836.6764 34:1 DAGp 612.5562 50:7 TAG 838.6920 34:0 DAG 614.5718 50:6 TAG 840.7076 36:6 DAGq 630.5092 50:5 TAG 842.7232 36:5 DAGr 632.5248 50:4 TAG 844.7389 36:4 DAGs 634.5405 50:3 TAG 846.7545 36:3 DAGt 636.5562 50:2 TAG 848.7702 36:2 DAGu 638.5718 50:1 TAG 850.7858 36:1 DAG 640.5875 50:0 TAG 852.8015 36:0 DAG 642.6031 52:9 TAG 862.6921 38:6 DAG 658.5405 52:8 TAG 864.7077 38:5 DAG 660.5561 52:7 TAG 866.7233 38:4 DAGv 662.5718 52:6 TAG 868.7389 38:3 DAG 664.5874 52:5 TAG 870.7545 40:10 DAG 678.5092 52:4 TAGd 872.7702 40:9 DAG 680.5248 52:3 TAG 874.7858 40:8 DAG 682.5405 52:2 TAG 876.8015 40:7 DAG 684.5561 52:1 TAG 878.8171 40:6 DAG 686.5718 52:0 TAG 880.8328 40:5 DAG 688.5875 54:9 TAG 890.7233 40:2 DAG 694.6344 54:8 TAG 892.7389 40:1 DAG 696.6500 54:7 TAGe 894.7545 42:2 DAG 722.6657 54:6 TAGf 896.7702 42:1 DAG 724.6813 54:5 TAGg 898.7858 44:6 DAG 742.6344 54:4 TAGh 900.8015 44:5 DAG 744.6500 54:3 TAGi 902.8171 44:4 DAG 746.6657
a Exact molecular masses corresponds to [M+NH4]+ adducts (MGDG, DGDG, SQDG, PA, PI, PG, TAG, DAG) and [M+H]+ adducts (PS, PE, PC). bIS= Internal standard. CRepresenting 16:2-16:3-18:3 and 16:3-16:3-18:2 dRepresenting 16:0-18:1-18:3 and 16:0-18:2-18:2 eRepresenting 18:2-18:2-18:3 and 18:1-18:3-18:3 fRepresenting 18:0-18:3-18:3, 18:1-18:2-18:3 and 18:2-18:2-18:2 gRepresenting 18:0-18:2-18:3, 18:1-18:1-18:3 and 18:1-18:2-18:2 hRepresenting 18:0-18:1-18:3, 18:1-18:1-18:2 and 18:0-18:2-18:2 iRepresenting 18:0-18:0-18:2 and 18:0-18:1-18:1 kRepresenting 16:0-16:3 and 16:1-16:2 lRepresenting 16:2-18:3 and 16:3-18:2 mRepresenting f 16:1-18:3, 16:2-18:2 and 16:3-18:1 nRepresenting 16:0-18:3, 16:1-18:2 and 16:3-18:0 0Representing 16:0-18:2, 16:1-18:1 and 16:2-18:0 pRepresenting 16:0-18:1 and 16:1-18:0 qRepresenting 18:3-18:3 and 16:1-20:5 rRepresenting 16:1-20:4, 16:0-20:5 and 18:2-18:3 sRepresenting 18:2-18:2, 18:1-18:3, 16:1-20:3 and 16:0-20:4 tRepresenting 16:0-20:3, 18:0-18:3 and 18:1-18:2 uRepresenting 18:0-18:2 and 18:1-18:1; vRepresenting 18:1-20:3 and 18:0-20:4

169
For the quantification of lipids with liquid chromatography electorspray ionization Q-TOF MS/MS (Q-TOF LC-MS/MS) and Q-TOF LC-MS, the following m/z values were used. Table 19: Caclulated Molecular Masses of Acyl-CoA, Acyl-ACP and Fatty Acids adduct ions
Molecular Species Calculated Molecular Mass of Ion Adduct (m/z)
Ion
14:0-CoA 1028.3374 [M+H]+ 16:1-CoA 1004.3374 [M+H]+ 16:0-CoA 1006.3530 [M+H]+ 17:0-CoA (IS)a 1020.3678 [M+H]+ 18:3-CoA 1028.3374 [M+H]+ 18:2-CoA 1030.3530 [M+H]+ 18:1-CoA 1032.3687 [M+H]+ 18:0-CoA 1034.3840 [M+H]+ 20:1-CoA 1060.3996 [M+H]+ 20:0-CoA 1062.4156 [M+H]+ 13:0-ACP 870.4532 [M+NH4]+ 14:0-ACP 884.4688 [M+NH4]+ 16:3-ACP 906.4532 [M+NH4]+ 16:2-ACP 908.4688 [M+NH4]+ 16:1-ACP 910.4845 [M+NH4]+ 16:0-ACP 912.5001 [M+NH4]+ 18:3-ACP 934.4845 [M+NH4]+ 18:2-ACP 936.5001 [M+NH4]+ 18:1-ACP 938.5158 [M+NH4]+ 18:0-ACP 940.5314 [M+NH4]+ 14:0-FA 227.2011 [M-H]- 15:0-FA (IS)a 241.2168 [M-H]- 16:1-FA 253.2168 [M-H]- 16:0-FA 255.2324 [M-H]- 18:3-FA 277.2168 [M-H]- 18:2-FA 279.2324 [M-H]- 18:1-FA 281.2481 [M-H]- 18:0-FA 283.2637 [M-H]- 20:5-FA 301.2168 [M-H]- 20:4-FA 303.2324 [M-H]- 20:3-FA 305.2481 [M-H]- 20:2-FA 307.2637 [M-H]- 20:1-FA 309.2794 [M-H]- 20:0-FA 311.2950 [M-H]-
aIS, Internal standard.

170
Table 20: Molecular masses of MAG ions and respective product ions used for the identifaction and quantification by GC-MS
Molecular Species
Calculated Molecular Mass of [M+-15] ion (m/z)
Characteristic Product Ion for α-MAG [M+-15]-88 (m/z)
Characteristic Product Ion for β-MAG [M+-15]-146 (m/z)
14:0-MAG 431 343 285
15:0-MAG (IS)a 445 357 299
16:1-MAG 457 369 311
16:0-MAG 459 371 313
18:3-MAG 481 393 335
18:2-MAG 483 395 337
18:1-MAG 485 397 339
18:0-MAG 487 399 341
20:5-MAG 505 417 359
20:4-MAG 507 419 361
20:3-MAG 509 421 363
20:1-MAG 513 425 367
20:0-MAG 515 427 369
22:0-MAG 543 455 397
aIS, Internal standard.

171
Table 21: Molecular masses, parental ions and product ions used for the identification and quantification of free sterols by GC-MS
Sterol Caclulated
Molecular Mass of M+(m/z)
Characteristic Product Ion (m/z)
Cholestanol (IS)a 460 355
Cholesterol 458 368
Campesterol (24-Methylcholesterol)
472 382
Stigmasterol (24-Ethylcholesta-5,22-dienol)
484 394
Lanosterol 498 393
ß-Sitosterol (24-Ethyl-cholesterol)
486 396
aIS, Internal standard.

172
7.9 Glycerolipid molecular Species Distribution during Mycorrhiza Symbiosis in fatm Mutants and WT
Figure 33: Molecular Species Composition of Membrane Galactolipids and Phospholipids in colonized WT and fatm Mutants at 4 wpi. Molecular species composition of a) MGDG, b) DGDG, c) SQDG, d) PC, e) PE, f) PI, g) PG and i) PA. Glycerolipids were measured by Q-TOF MS/MS. Lipid species that contain the Rhiozphagus signature fatty acids 16:1, 20:3, 20:4 and 20:5, as well as 16:0, accumulate under colonization to a lesser extend in mutants than in WT. Combination of carbon chain length and fatty acids are indicated on thex-Axis. Values are means and error bars are SD of three measurements. R, Molecular species specifically accumulating in R. irregularis.

173
Figure 34: Molecular Species Composition of non-Membrane Neutral Glycerolipids in colonized WT and fatm Mutants at 4 wpi. Molecular species composition of a) TAG and b) DAG. Neutral glycerolipids were measured by Q-TOF MS/MS. Lipid species that contain the Rhiozphagus signature fatty acids 16:1, 20:3, 20:4 and 20:5, as well as 16:0, accumulate under colonization to a lesser extend in mutants than in WT. The most abundant mycorrhiza-specific lipid is TAG with the molecular species 48:3 and 48:2. Combination of carbon chain length and fatty acids are indicated on thex-Axis. Values are means and error bars are SD of three measurements. R, Molecular species specifically accumulating in R. irregularis.

174
7.10 Preparation of acyl-ACP Substrates
Figure 35: Preparation of acyl-ACP Substrates. a) Ni-NTA purification of E. coli acyl-ACP synthetase (Aas). Different elution fractions from the preparation and the protein chromatography were compared by SDS-PAGE. Elution fractions containing recombinant Aas protein (80.6 kDA, red arrowhead) were kept. b) ACP preparation from E. coli WT. Samples were kept from different steps during the ACP preparation and anion-exchange chromatography. Samples were mixed with Bradford color reagent that gives a blue color for proteins showing the successful isolation of ACP. c) Acylation reaction of palmitic acid with E. coli ACP using E. coli Aas. As a control, the fatty acid was omitted (-FA). The reaction products were seperated using urea-PAGE. ACP dimerisation products and ACP apo and holo isoforms are seperated from acyl-ACP (16:0-ACP). During acylation, holo-ACP is converted into acyl-ACP, which can be seen by reduction of holo-ACP and the occurrence of acyl-ACP in the three reactions containing palmitic acid. Increasing the reaction time from 5 min to 1h and 12 h did not lead to increased acyl-ACP abundance. d) Q-TOF LC MS/MS measurement of Asp-N endoproteinase digested acyl-ACP limbs. Acyl-ACP limbs were seperated on a RP8 column and identified based on the neutral loss of DSLp. e) Mass spectra of 13:0 and 14:0-ACP limbs. The most abundant fragment ion is the fatty acid with pantetheine. Minor fragments for the fatty acid containing the 4´-phosphopantetheine group and the unfragmented acyl-ACP limb ([M+], blue diamond) are detected. M, Marker, SN, Supernatant, FT, Flow-through, E1—E16, Elution fractions 1—16, W, Wash step, ACP, Acyl-carrier protein, DSLp, Aspartic acid-Serine-Leucine with 4´-phopshopantetheine group.

175
List of Publications
Parts of this thesis were published in: Brands, M., Wewer, V., Keymer, A., Gutjahr, C. and Dörmann, P. (2018) The Lotus japonicus
acyl-acyl carrier protein thioesterase FatM is required for mycorrhiza formation and lipid accumulation of R. irregularis. Plant J., 95, 219–232.
During the doctoral studies the following manuscripts derived from collaborations were published: Bravo, A., Brands, M., Wewer, V., Dörmann, P. and Harrison, M.J. (2017) Arbuscular
mycorrhiza-specific enzymes FatM and RAM2 fine-tune lipid biosynthesis to promote development of arbuscular mycorrhiza. New Phytol., 214, 1631-1645.
Keymer, A., Pimprikar, P., Wewer, V., Huber, C., Brands, M., Bucerius, S.L., Delaux, P.-M.,
Klingl, V., Röpenack-Lahaye, E.v., Wang, T.L., Eisenreich, W., Dörmann, P., Parniske, M. and Gutjahr, C. (2017) Lipid transfer from plants to arbuscular mycorrhiza fungi. Elife, 6, e29107.
Xue, L., Klinnawee, L., Zhou, Y., Saridis, G., Vijayakumar, V., Brands, M., Dörmann, P.,
Gigolashvili, T., Turck, F. and Bucher, M. (2018) AP2 transcription factor CBX1 with a specific function in symbiotic exchange of nutrients in mycorrhizal Lotus japonicus. Proc. Natl. Acad. Sci USA. 115, 9239–9246.
Additional publications: Wewer, V., Brands, M. and Dörmann, P. (2014) Fatty acid synthesis and lipid metabolism in the
obligate biotrophic fungus R. irregularis during mycorrhization of Lotus japonicus. Plant J., 79, 398–412.
Siebers, M., Brands, M., Wewer, V., Duan, Y., Hölzl, G. and Dörmann, P. (2016) Lipids in plant-
microbe interactions. Biochim. Biophys. Acta, 1861, 1379–1395.

176
Acknowledgments
Im Folgenden habe ich mal probiert, aufzuschreiben, wofür ich besonders dankbar bin und welche Personen besonderen Anteil am Gelingen der Doktorarbeit und am Nicht-Verzweifeln des Doktoranden haben. Das Ganze ist quasi eine Belohnung für den genigten Leser, dass er bis zum Schluss durchgehalten halt. Aber nich schummeln und einfach bis hierhin vorblättern… Hab ich dich erwischt!? Da diese Seite mir gehört, würde ich in dieser Danksagung gerne persönliche Sachen nennen und außerdem die Dinge und Personen auflisten, die im wissenschaftlichen Sinne Dank verdienen. Das Ganze soll allerdings keine Rangliste sein, mein Dank ist also genauso herzlich gemeint, wenn ihr erst weiter unten erwähnt werdet. Wo fängt man an? Meine Lust auf wissenschaftliches Arbeiten, die hoffentlich in dieser Arbeit einigermaßen ansprechend zum Ausdruck kommt, hat sich erst so richtig entwickelt, als ich im September 2011 ins IMBIO in Peters AG gekommen bin, um von Vera bei Projekt- und Bachelorarbeit betreut zu werden. Danke also an dich, vor allem dafür, dass du herzlich, fair und ehrlich warst. Im Laufe der Zeit hat man ja auch den einen oder anderen Studenten betreut und mit einigen geredet und da ist mir klar geworden, wie wichtig ein motvierender und freundlicher Begleiter für mich war. Wer weiß, wenn die Zeit nicht so toll gewesen wäre, ob ich in Bonn und im IMBIO geblieben wäre? Sowieso die Leute ausm IMBIO: Mittlerweile sind aus den meisten Kollegen von damals ja sowieso Freunde geworden – beste acknowledgment! Natürlich auch danke an Peter für die Unterstützung, die Chanchen und Möglichkeiten, die er mir geboten hat und bietet. Für fachlich exzellente Betreuung und für Verfügbarkeit sowieso. Ich kenne Doktoranden, die sehen ihren Prof. alle paar Wochen mal. Das war hier ganz anders und in der Anfangszeit waren die sehr regelmäßigen und manchmal ausufernden Besprechungen zwar anstrengend, haben aber garantiert zum Erfolg des Projektes geführt. Die Zeit in Bonn war für mich bisher fachlich und auch persönlich ein Reifeprozess. Von der Bachelorarbeit übern Master bis zum Doktoranden. Da mir auch während der Masterarbeit bei Benni Franke und Lukas Schreiber hier in Bonn viel Vertrauen und Support entgegengebracht worden ist, möchte ich den beiden hier auch danken. Diese Zeit war auch super positiv, sodass für mich klar war, eine Doktorandenstelle anzutreten und mein Glück in der Wissenschaft zu suchen. Danke an alle Kollaborationspartner: Andreas Keymer und Caroline Gutjahr für die Konfokalmikroskopie und die Komplementation von fatm Mutanten, die Methoden zum Färben und die Untersützung beim Manuskript. Außerdem an Armando Bravo und Maria Harrison für die produktive Zusammenarbeit bei ihrem Lipid-Mykorrhiza Projekt. Noch mal explizit ein Lob und Danke an alle aktuellen Kollegen und Kolleginnen aus dem IMBIO: an Helga, Katha und Vera für die Betreuung der Massenspektrometrie und darüber hinaus für das Messen von etlichen Proben und die essentielle Hilfe beim Auswerten von allem Möglichen. Extra Dank noch mal für diverse Male Hilfe und Unterstützung auch bei anderen wissenschaftlichen Problemen und Themen. Das Gleiche gilt für Philipp, der immer positiv eingestellt ist und mit dem man immer science talk machen kann. Liebe auch an Meike als langjährige Kollegin, Sportlerin und als weise ältere Freundin (harhar). Danke für Tipps, Hinweise, Begleitung und Untersützung zu allem. Dank gilt außerdem Marlies fürs Genotypisieren und für den Unterhalt der Mykorrhiza-Karrottenwurzel Sterilkultur sowie alle weiteren Arbeiten, bei denen du mir geholfen hast. Danke an Barbara, die mir gezeigt hat, wie man rekombinante Proteine aufreinigt. Danke auch an Jill, die meine neue Büronachbarin ist und tatsächlich auch mal kurz Stundentin bei mir war. Vielen Dank an Regina als ehemalige Labor- und Büronachbarin, sowie an Mina für seine Tipps mit Hefe und seine friedliche Art. Lieben Dank und einen freundlichen Klaps an alle Studenten, die ich betreut habe, an vorderster Front diejenigen, die ihre Abschlussarbeiten bei mir gemacht haben: Johanna, Steven und Cornelia. Danke an Andreas für die technische Unterstützung beim Parieren. Danke auch an Georg, Biggi, Ellen und EPJ. Ganz am Schluss Liebe an meine Familie: Anne, Wolfgang, Flip und Flo und am allermeisten an dich, Lea. Peace out und praise the sun!