the aerator group (2021). aerosol generation during
TRANSCRIPT

the AERATOR group (2021). Identification of the source events foraerosol generation during oesophago-gastro-duodenoscopy. Gut.https://doi.org/10.1136/ gutjnl-2021-324588
Peer reviewed versionLicense (if available):CC BY-NCLink to published version (if available):10.1136/ gutjnl-2021-324588
Link to publication record in Explore Bristol ResearchPDF-document
This is the author accepted manuscript (AAM). The final published version (version of record) is available onlinevia BMJ Publishing Group at https://gut.bmj.com/content/early/2021/06/29/gutjnl-2021-324588 . Please refer toany applicable terms of use of the publisher.
University of Bristol - Explore Bristol ResearchGeneral rights
This document is made available in accordance with publisher policies. Please cite only thepublished version using the reference above. Full terms of use are available:http://www.bristol.ac.uk/red/research-policy/pure/user-guides/ebr-terms/

1
Title. Identification of the source events for aerosol generation during oesophago-gastro-duodenoscopy
Authors: Gregson F.K.A.1*, Shrimpton A.J.2,3,6*, Hamilton F.4, Cook T.M.5, Reid J.P.1, Pickering A.E.2,6, Pournaras D.J.7, Bzdek B.R.1 and Brown J.M.3
* - these authors contributed equally to this work.
Affiliations
1 - School of Chemistry, University of Bristol, Bristol, BS8 1TS;
2 - School of Physiology, Pharmacology & Neuroscience, University of Bristol, Bristol, BS8 1TD.
3 - Department of Anaesthesia and Intensive Care Medicine, North Bristol NHS Trust, Bristol, BS10 5NB;
4 – Population Health Sciences, Bristol Medical School, University of Bristol, BS8 2PH
5 - Department of Anaesthesia and Intensive Care Medicine, Royal United Hospitals NHS Trust, Bath, UK and Bristol Medical School, University of Bristol, BS8 1TS
6 – Bristol Anaesthesia, Pain & Critical Care Sciences, Translational Health Sciences, Bristol Medical School, BS2 8HW.
7 – Department of Upper Gastrointestinal and Bariatric/Metabolic Surgery, North Bristol NHS Trust, Bristol, BS10 5NB
Author for Correspondence – JB: Email for Correspondence - [email protected]
Word count: 3737 words.
Keywords: Oesophago-gastro-duodenoscopy, Aerosol, SARS-CoV-2, Coughing

2
Abstract (250 words)
Objective
To determine if oesophago-gastro-duodenoscopy (OGD) generates increased levels of aerosol in
conscious patients and identify the source events.
Design
A prospective, environmental aerosol monitoring study, undertaken in an ultraclean environment, on
patients undergoing OGD. Sampling was performed 20cm away from the patient’s mouth using an
optical particle sizer. Aerosol levels during OGD were compared to tidal breathing and voluntary
coughs within subject.
Results
Patients undergoing bariatric surgical assessment were recruited (mean BMI 44, mean age 40yrs,
n=15). A low background particle concentration in theatres (3 L-1) enabled detection of aerosol
generation by tidal breathing (mean particle concentration 118 L-1). Aerosol recording during OGD
showed an average particle number concentration of 595 L-1 with a wide range (3 – 4,320 L-1).
Bioaerosol generating events, namely coughing or burping, were common. Coughing was evoked in
60% of the endoscopies, with a greater peak concentration and a greater total number of sampled
particles than the patient’s reference voluntary coughs (11,710 v 2320 L-1 and 780 v 191 particles, n=9,
P=0.008). Endoscopies with coughs generated a higher level of aerosol than tidal breathing whereas
those without coughs were not different to background. Burps also generated increased aerosol
concentration, similar to those recorded during voluntary coughs. The insertion and removal of the
endoscope was not aerosol generating unless a cough was triggered.
Conclusion
Coughing evoked during OGD is the main source of the increased aerosol levels and therefore OGD
should be regarded as a procedure with high risk of producing respiratory aerosols. OGD should be
conducted with airborne personal protective equipment and appropriate precautions in those
patients who are at risk of having COVID-19 or other respiratory pathogens.

3
SUMMARY
What is already known about this subject?
Oesophago-gastro-duodenoscopy (OGD) is currently classified as an Aerosol Generating Procedure. Recent aerosol sampling studies have demonstrated increased particle concentration above background during OGD but not identified the source events.
What are the new findings?
An uneventful OGD (without coughing or burping) does not generate aerosol above that associated with tidal breathing. More specifically, insertion and removal of an endoscope for OGD does not generate an increase in aerosol concentration. However, the process of OGD frequently triggers coughs in conscious patients. Such OGD-evoked coughs generate higher aerosol concentration than volitional coughs and the resultant plumes of airborne particles are likely to be associated with an increased risk of transmission of respiratory pathogens. Our study puts the aerosol generated during endoscopy into a meaningful context of normal respiratory events and identifies the index risk events.
How might it impact on clinical practice in the foreseeable future?
OGD-evoked coughs are common. Therefore, OGD should be treated as having a high risk of aerosol generation and should be conducted with airborne personal protective equipment and appropriate precautions in those patients who are at risk of having COVID-19 or other respiratory pathogens. Strategies to reduce coughing and eructation would reduce aerosol generation.
4
INTRODUCTION
The Coronavirus-19 (COVID-19) pandemic, caused by severe acute respiratory syndrome coronavirus-
2 (SARS-CoV-2), has led to dramatic and widespread changes in the way hospital medicine is practised.
SARS-CoV-2 has the potential to be spread by three main routes: droplet, contact and airborne. The
extent of airborne transmission of SARS-CoV-2 remains debated [1, 2, 3, 4] but is of increasing concern
especially with the advent of new strains of the virus (e.g. B.1.1.7) that have increased transmissibility
[5, 6]. Infectious respiratory aerosols are considered by the World Health Organisation as being
composed of particles <5 micrometres in diameter [7] which remain in suspension in the air for many
minutes or hours, potentially leading to distant transport of viral particles [8, 9]. Importantly, particles
of this dimension are respirable, enabling deposition deep within the human respiratory tract leading
to transmission of disease [8].
A number of medical interventions have been designated ‘aerosol generating procedures’ (AGPs).
These AGPs are considered to carry the highest risk of airborne transmission of respiratory pathogens
to healthcare workers. The interventions currently categorised as AGPs are based predominantly on
epidemiological data from the 2003 SARS-COV-1 epidemic [10, 11]. The WHO list of AGPs has been
adopted or adapted by many national healthcare organisations such as the Center for Disease Control
and Prevention (CDC) [12] and Public Health England (PHE) [13]. Oesophago-gastro-duodenoscopy
(OGD) is classified as an AGP and this designation has led to development of joint guidelines for safe
endoscopy by the Gastroenterological societies in the UK[14], Europe [15] and USA [16].
Current national and international guidance recommends the use of airborne precaution personal
protective equipment (PPE) when undertaking AGPs, which includes the use of respirators (e.g. FFP3
or N95 masks). Other recommendations include performing AGPs in a closed space with good
ventilation [17, 18] and allowing a sufficient ‘fallow’ interval such that aerosol may disperse after the
procedure [19]. These precautions inevitably slow the turnover within an operating room or
procedural suite, and the wearing of PPE may impact on the quality of care delivered due to physical
and communication difficulties.
The categorisation of OGD as an AGP was not based on evidence demonstrating aerosol generation
from this intervention, nor from being associated with an increased incidence of SARS-CoV-2
transmission to healthcare workers conducting the procedures. Recent work directly measuring
aerosol levels in the clinical environment has questioned the validity of inclusion of several procedures
defined as ‘aerosol generating’ including tracheal intubation and extubation [20]; percutaneous
tracheostomy [21]; and respiratory supportive treatments such as continuous positive airway pressure
delivered via a face mask [22, 23, 24].
5
Two recent proof-of-concept studies reported increased levels of aerosol measured during OGD and
concluded that the procedure is an AGP [25, 26]. However, these studies have been unable to
definitively identify the specific source event responsible for the aerosol generation (i.e. endoscope
insertion / removal, coughing, deep breathing, gastrointestinal eructation or retching), nor were they
able to place the findings in the context of the risk of aerosol generation by natural respiratory events
(tidal breathing, coughing). This is important as respiratory events such as coughing, speaking and
breathing have been shown to generate measurable concentrations of aerosol [27, 28, 29, 30, 31]. To
strengthen the evidence base underlying designation of AGPs, and the rationale for stringent airborne
transmission-based precautions, it is essential to determine how much aerosol these procedures
generate compared to natural respiratory events. We therefore quantitated the extent to which OGD,
performed in conscious patients, generates aerosols and compared this to the aerosol generated by
coughing and tidal breathing in the same patients in an ultra-clean ventilation operating theatre.

6
METHODS
Ethics
A prospective environmental sampling study was undertaken to measure the amount and size
distribution of particles generated by conscious patients undergoing OGD in a UK hospital (North
Bristol NHS Trust). Ethical approval was granted by the Greater Manchester REC committee
(Reference: 20/NW/0393) as part of the AERATOR study (approved 18/09/2020). The study is
registered in the ISRCTN registry (ISRCT:N21447815) and granted Urgent Public Health status by the
NIHR. Patients or the public were not involved in the design, or conduct, or reporting, or dissemination
plans of our research.
Selection of patients
Study participants were over 18 years of age and undergoing diagnostic OGD as part of a bariatric
surgical assessment. The indication for endoscopy was in line with the International Federation for the
Surgery of Obesity and Metabolic Disorders (IFSO) Position Statement [32] which recommends
consideration of OGD in patients without upper gastrointestinal symptoms prior to bariatric and
metabolic surgery procedures. All patients had self-isolated for two weeks, had a negative SARS-CoV-
2 polymerase chain reaction test in the 72-hours before admission and gave written informed consent
before entry to the study.
Study conduct
The objective of the study was to measure aerosol generated during the routine conduct of OGD. To
sensitively detect aerosols generated by either natural respiratory events or AGPs, the measurements
must be undertaken in an environment where background airborne particle concentrations are very
low. Therefore, recordings were undertaken in operating theatres with an ultra-clean ventilation
system (EXFLOW 32; Howorth Air Technology, Farnworth, UK) with high efficiency particulate air
(HEPA) filtration. The ultra-clean ventilation system (UCV) provides an environment which is both
ultra-clean and highly ventilated. We have previously demonstrated that the UCV ensures a very low
background particle concentration, enabling detection of aerosols generated by natural respiratory
events and AGPs [20, 21, 31, 33].
The UCV was placed in standby mode during recordings to minimise any effect the high air change
rate may have on particle detection [33]. When fully operational, the UCV system generates a ‘surgical
canopy’ of clean air, which is directed vertically downward over the operating table within a perimeter
delineated by markings on the floor. The air handling unit runs at 50Hz to generate this ultra-clean
zone which results in 500-600 air changes per hour within the perimeter. When the system is placed

7
in ‘standby mode’ the frequency of the inverter in the air handling unit is reduced to 25Hz and the
‘surgical canopy’ of constrained laminar airflow is lost, this reduces the number of air changes to 25
per hour (equivalent to a standard operating theatre). The air flow velocity is 0.25m.s-1 at 1m above
the ground. This still provides an ultraclean environment (minimising interference from background
aerosol) [33] but without the high number of air changes, ensuring any findings are generalisable to
more typical operating theatre settings.
All healthcare workers, and members of the investigating team, wore contact and droplet precaution
PPE in line with both trust, and national policy. The number of staff in the room and their movement
were kept to a minimum throughout the study to minimise extrinsic and artefactual aerosol
generation.
A portable Optical Particle Sizer (OPS, TSI Incorporated, model 3330, Shoreview, NM, USA) was used.
The OPS samples air at 1 L.min-1 and detects particles by laser optical scattering, reporting the particle
number concentration and size distribution within the range 300 nm to 10 µm diameter, with a
sampling bin width of 1 s. All air sampled was via a 3D printed funnel (formed of Polylactic acid on a
RAISE3D Pro2 Printer, 3DGBIRE, Chorley, UK) with a maximum diameter of 150 mm, cone height of 90
mm with a 10-mm exit port. Conductive silicone sampling tubing (3001788, TSI, 1m length, 4.8 mm
internal diameter) connected the funnel to the OPS. The silicone tube had an internal volume of 72.5
ml giving a transit lag between the funnel and the particle sizer (with a flow of 1 L.min1) of 4.3 s which
was taken into account in the time registration of measurements. In previous work, we have
established that the transmission sampling loss of particles < 5 µm diameter with this set up is <10 %
[31]. It should be noted that we cannot report the absolute number of particles generated, only the
number sampled and detected, recognising that we do not sample all of the air from the activity into
the OPS instrument.
Reference aerosol generation was measured in each patient before endoscopy with the patient
positioned supine on the operating table in the theatre. The sampling funnel was handheld by the
investigator approximately 20cm in front and directed towards the patient’s face. The reference
sequences consisted of one-minute quiet tidal breathing, followed by three maximal voluntary coughs
at 30 second intervals, with tidal breathing in between. Background aerosol was then measured with
the funnel at 1 metre distance, facing away from the patient (and any other staff) but still within the
central area of the UCV system while the patient was prepared for the endoscopy as below.
All patients had topical anaesthesia of their oropharynx with Lidocaine 10% (Xylocaine, 50 ml/500
spray, AstraZeneca, Sweden). The OGD was performed in the left lateral position, with conscious
sedation achieved with intravenous midazolam as necessary by the endoscopist, according to their
8
normal practice. A mouthguard was inserted prior to insertion of the endoscope (8.9mm GIF-H290
Video Gastrointestinal Scope with EVIS X1 CV-1500 Video System; Olympus, Tokyo, Japan).
Aerosol generation during endoscopy was measured with the sampling funnel, handheld 20 cm from
the patient’s mouth. This enabled insertion of the endoscope between the funnel and the mouth. The
aerosol generated during OGD was analysed for all periods between endoscope insertion through the
mouthguard until endoscope removal. These periods were aggregated for those patients where more
than one endoscope insertion was undertaken. Aerosol sampling commenced for reference
recordings, undertaken prior to initial endoscope insertion, and was continuous until after final
endoscope removal. All events of significance were timestamped (i.e. endoscope insertion, endoscope
removal, coughs, burping). Cough events (both voluntary and evoked during endoscopy) were
averaged within subject and then aggregated across the whole group.
Data were exported from the OPS, processed in the TSI Aerosol Instrument Manager software, and
analysed in Origin Pro (Originlab, Northampton, MA, USA) and Prism v8 (Graphpad, San Diego, CA,
USA). We report the sampled mean aerosol concentration as well as the peak concentration over 1 s
sampling time, reported as mean (SD). We used paired or unpaired t-tests or Mann-Witney and
Wilcoxon tests to conduct statistical comparisons as appropriate. The criterion for statistical
significance was set at P<0.05.

9
RESULTS
Fifteen patients were recruited: fourteen were being assessed before bariatric surgery and one patient
attended for assessment 2 years after gastric bypass surgery. There were two males and thirteen
females with a mean BMI of 46 ± 9.3 kg/m2 and an average age of 42 years (range 21-75). Four patients
requested and received additional conscious sedation with endoscopist-administered midazolam.
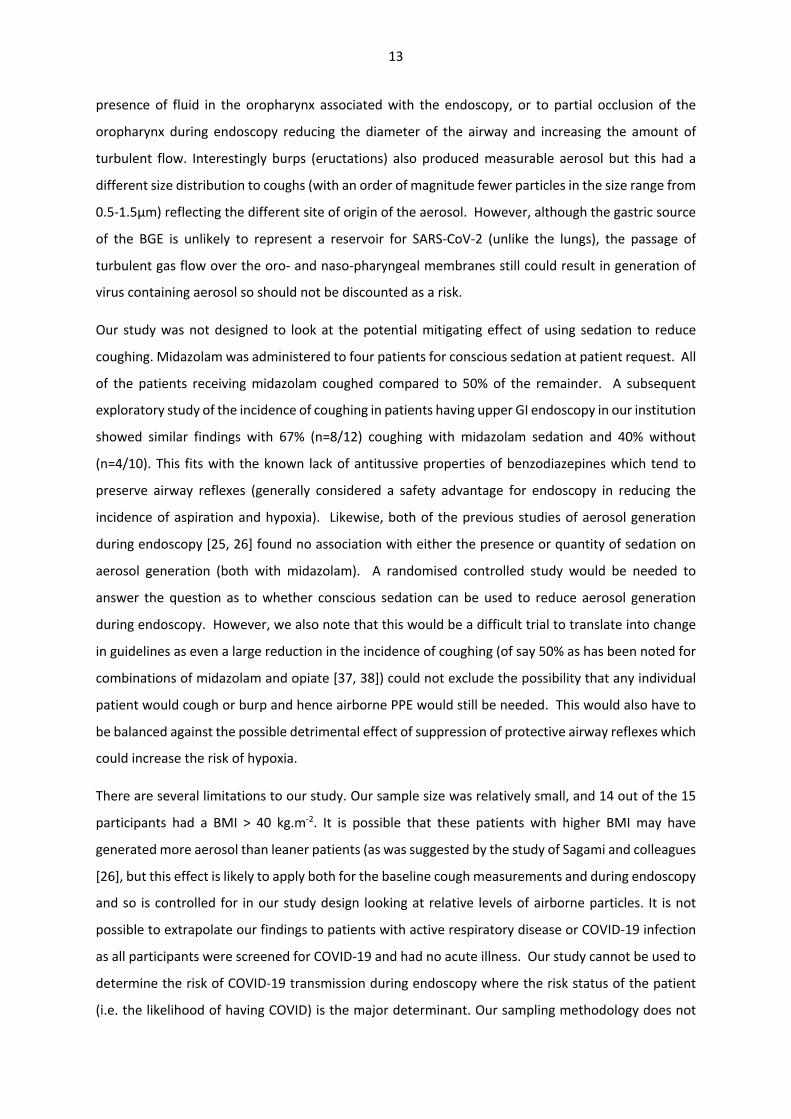
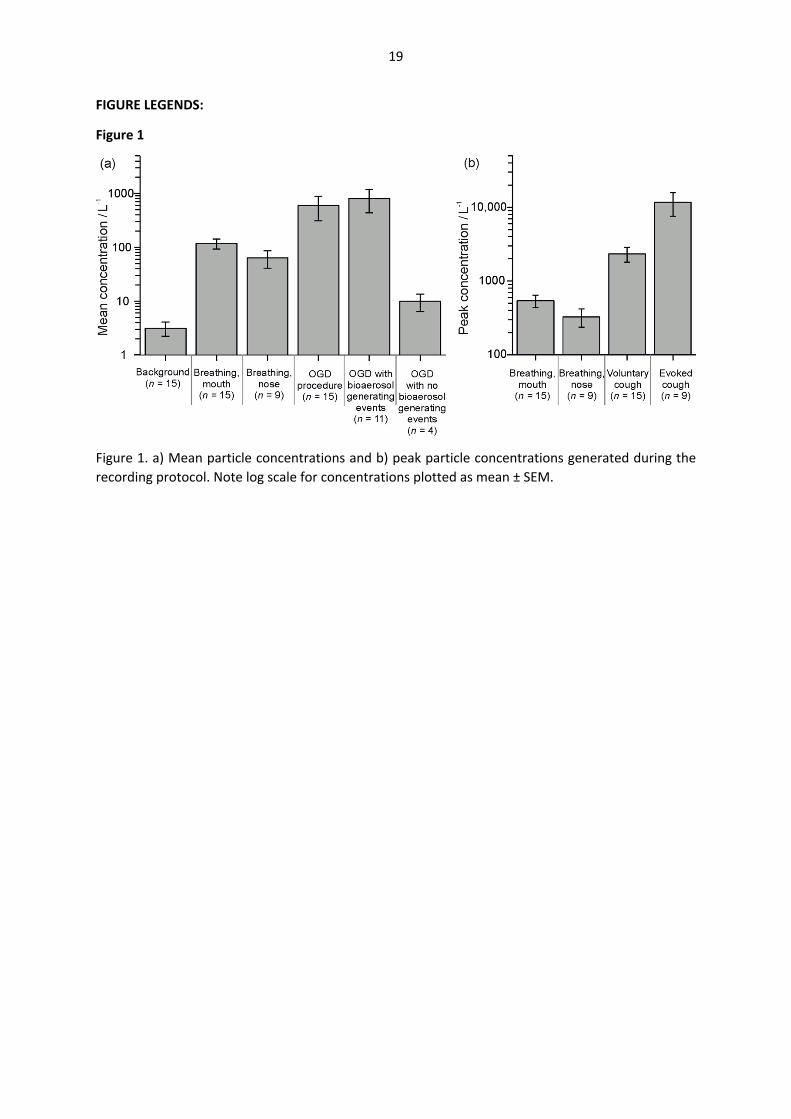
Background sampling showed the air was very clean with a mean aerosol number concentrations,
referred to below simply as the concentration, of 3.1 (3.7) particles.L-1 (corresponding to ~3 particles
detected each minute of sampling). The patient’s tidal breathing, via the mouth, generated a mean
particle concentration of 118 (97.2) L-1 and an average peak particle concentration of 540 (410) L-1
(n=15 patients) (Figure 1). In nine patients a further minute of nasal breathing was recorded, this
generated a mean particle concentration of 63.5 (72.0) L-1 and a peak particle concentration of 327
(283) L-1 (n=9). Nasal breathing produced a lower aerosol concentration than mouth breathing
(P=0.008, Wilcoxon).
[Figure 1]
The expulsive phase of a cough typically lasts less than 1 second [34], and the aerosol concentration
rises rapidly to a sharp peak, with a subsequent decay as the remaining aerosol reaches the sampling
funnel, dissipates and becomes diluted by clean background air (Figure 2). The reference voluntary
coughs for the 15 patients each generated an aerosol concentration profile clearly detectable above
the baseline with a mean peak concentration of 2330 (2120) L-1, an average total number of particles
detected per cough of 192 (183) and mean duration of 19.8 (5.8) s.
[Figure 2]
The mean aerosol particle concentration measured during endoscopy was 595 (1110) L-1 (n=15, Figure
1a) and the average duration of endoscopy was 222 s (range 129 – 457s). This aerosol concentration
was well above background levels but was not significantly higher than the level of aerosol measured
during mouth breathing (vs 118 L-1, P=0.17, Wilcoxon test). We noted that there was a very large
range of average aerosol concentrations between endoscopy sessions from 3 L-1 (indistinguishable
from background – see figure 3a) to 4320 L-1 (figure 3b). Coughs were frequently evoked during the
endoscopy (figure 3b, 9/15 subjects were observed to cough – with a median of 4 coughs [range 1-
10]). Likewise, burps were induced during some procedures (figure 2b, 4/15 subjects burped – median
of 2 burps per endoscopy [range 1-4]).
The OGD-evoked coughs generated high concentrations of aerosol (Figure 2a & 3b) with a mean peak
concentration of 11,710 (13,700) L-1, and total number of particles detected per cough of 780 (1010).

10
The total number of particles from evoked coughs was significantly greater than the volitional coughs
recorded from the same patients (780 vs 191, n=9, P=0.008, Wilcoxon) and the peak mass
concentration was higher (4.51 vs 0.54 µg/m3, P=0.008, Wilcoxon). Similarly, the peak particle
concentration was greater for evoked versus volitional coughs (11,710 v 2320 L-1, P=0.008 Wilcoxon).
The profile of the particle concentration generated by evoked coughs remained detectable above the
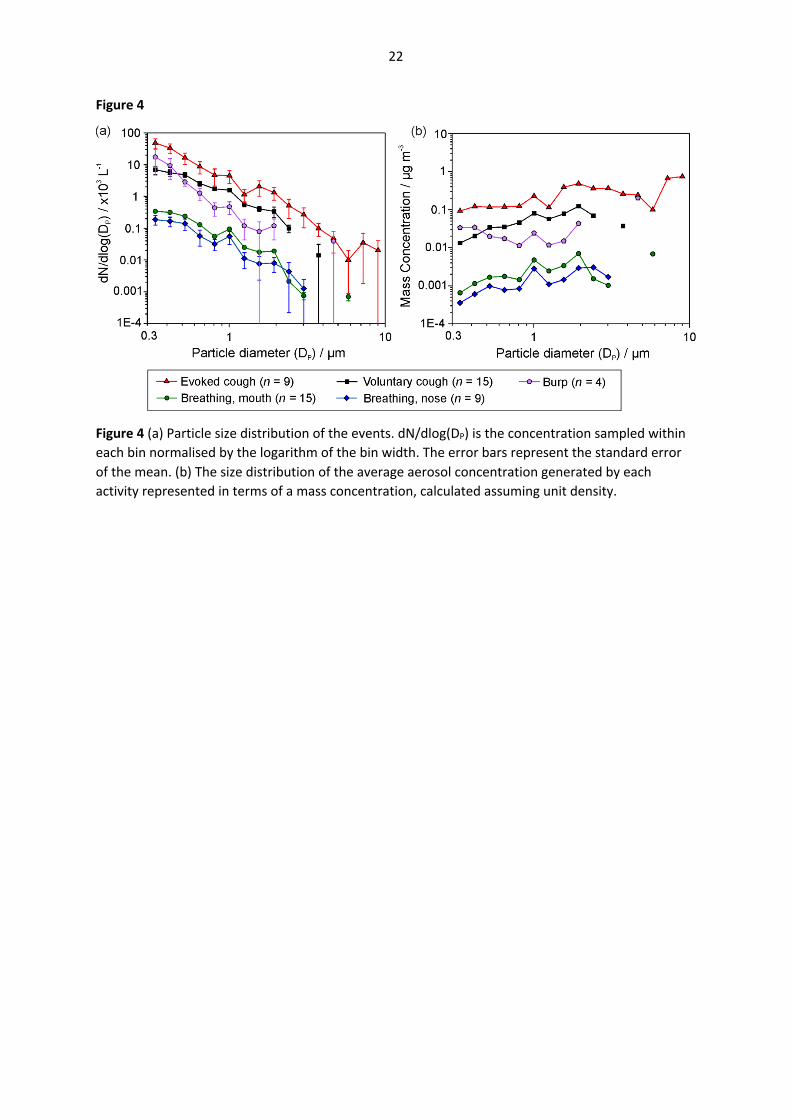
baseline for a mean duration of 14.5 (4.8) s. Analysis of the size distribution of these evoked coughs
showed them to have a similar profile to volitional coughs, reported as number concentration
distribution across the size-resolved bins of the OPS, but with an increase in the total numbers of
particles in each size bin (Figure 4).
[Figure 3]
Burps observed during OGD procedures generated a mean peak concentration of 3060 (3830) L-1 and
a total number of particles detected per burp of 205 (280). There was no significant difference
between the peak particle concentration or total number of detected particles of a voluntary cough
and burp by the same patient. Analysis of the particle size distribution of these evoked burps showed
them to have a different profile to coughs, with a decrease in the total numbers of particles in the size
range between 0.5 and 1.5µm (Figure 4).
As an evoked cough or a burp had a large effect on the particle concentration, our subsequent analysis
split the patients into those who had such “bioaerosol generating events” (BGEs) versus those who
did not. The mean aerosol number concentration sampled during the eleven endoscopies with BGEs
was higher than that recorded during the four endoscopies where no cough or burp was triggered
(808 (1240) L-1 vs 10.0 (7.2) L-1, Mann-Whitney test, P=0.0015). When these transient and discrete
coughing or burping events were excluded from the analysis, the mean particle concentration during
the rest of the endoscopy was 31.4 (33.9) L-1 identifying the discrete BGEs as being responsible for the
overall elevation in aerosol during the procedure.
[Figure 4]
A focussed analysis of aerosol concentration fluctuations during a 30 s sampling window surrounding
endoscope insertion (n=12) and removal (n=11) (starting 10 s prior to insertion or removal), excluding
those which triggered BGEs, showed a low concentration of aerosol which was not significantly
different to background and was less than both tidal breathing and voluntary coughs (Figure 5). No
other significant aerosol generating events were identified during the conduct of the OGDs.
[Figure 5]
11
DISCUSSION
We have measured aerosol generation in patients undergoing OGD. In the patients who coughed
during the procedure (60%), very high particle concentrations were detected - around five-fold higher
than those seen during volitional coughs. This suggests that OGD meets the criterion for being a high
risk procedure for generating aerosol in those patients in whom endoscopy evokes a cough. This is
consistent with the findings of recent studies which also concluded that OGD was associated with
increased aerosol generation [25, 26]. However, we specifically identify that evoked coughs and
belches are the index risk events rather than the insertion and removal of the endoscope from the
oesophagus.
Conducting aerosol sampling during OGD in a HEPA-filtered ultraclean environment provides an
optimal setting for detecting aerosols due to the extremely low background concentration. Sampling
in an adjacent operating theatre (non UCV) revealed a baseline particle content of 16,000 particles L-
1 (compared to 3 L-1) [33]. Sampling in such a theatre would mean the aerosol detected in this study
(for example associated with tidal breathing) would be impossible to detect over background ‘noise’.
We note that a previous study of OGD aerosol generation also found high background counts (25-
40,000 particles per Cubic Foot equating to ~900-1400 particles L-1) in their procedure room, which
had a standard ventilation system [25]. This would preclude detection of the aerosol generated by
breathing or even a volitional cough over the background particle count (likely mostly inorganic ‘dust’
rather than bioaerosol). Importantly, the high temporal resolution (1Hz measurements of airborne
particles) in combination with the low background aerosol concentration enables the definitive
attribution of specific respiratory or procedural events as being the source of the aerosol (rather than
attempting to make the link by inference when using a minute by minute analysis [26]).
A novel aspect of our study design is using each patient’s own respiratory events as a comparator.
This puts the aerosol measurements made during endoscopy into a meaningful biological context of
normal respiratory events. This approach also reduces the impact of between-subject variation and
so increases the power to detect significant changes even within a relatively small sample size. We
used tidal breathing as a lower reference for natural aerosol generation and could reliably detect this
aerosol concentration above background (the first time such a measure has been possible in a study
of patients). For the patients who did not cough during the procedure lower concentrations were
detected than during coughing or even normal tidal breathing. This may be due to the presence of the
bite guard, attenuation by the endoscope itself or the endoscopist’s hands, or due to shallow / nasal
breathing during the procedure.

12
The sampling method used in our study is appropriate to detect aerosol particles generated from the
respiratory system which are generally in the range of 10 nm to 20 µm, with a large predominance in
the sub-micron range [29]; we do not detect droplets larger than 20 µm and can make no statement
about their presence or absence from these procedures. We set out to study aerosol levels close to
the source of generation. By sampling close to the patient (20cm) we achieve an accurate measure of
exposure risk for the endoscopist and assistant who will be within the near vicinity of the patient
(within 1m) so any emitted plumes of aerosol are highly relevant to their risk of transmission. The
WHO have defined aerosols as being composed of particles <5µm in size but recently, such a strict
delineation in size has been questioned: moist exhaled droplets smaller than 100 µm can decrease
considerably in size, showing similar aerodynamic behaviour to aerosol such that they can present a
transmission risk over many metres [35]. This is relevant particularly when considering the dispersal
of particles within the room which is currently not directly experimentally quantifiable for respiratory
aerosols given the relatively low concentrations of particles and the enormous degree of dilution that
occurs with dispersal even in a room with standard ventilation. We believe that the primary risk to
the endoscopy team is from the close-quarters exposure to respiratory aerosol near the site of
generation (the patient) but the issue of potential particle persistence and dispersal within the room
as a route of transmission may also be a factor that merits further investigation (for review see [36]).
Respiratory aerosols are considered to be well represented by a bimodal distribution, with mean
aerodynamic diameters of the two modes in the range 800 to 1500 nm; the smaller mode is considered
to arise in the lower respiratory tract, the bronchioles, and the larger is assigned as the laryngeal mode
[29]. The OPS cannot intrinsically differentiate between respiratory and non-respiratory aerosols, but
by timestamping events, minimising movement of the investigator, sampling close to the patient and
using a funnel to directionally focus on sources originating from the patient we reduced the risk of
artefactual particle detection or detection of aerosol from staff in the room. We did not take any
specific precautions such as limiting staff movement or altering their routine care during the conduct
of these endoscopies and so our results are characteristic of aerosol generated during typical clinical
practice. The size distribution of the particles detected during the study was typical of respiratory
aerosols; it formed a log-normal distribution of particles with the peak lying in the submicron size
range [20, 29, 30] and had a similar profile for both voluntary and procedure-evoked coughs [20]. This
suggests the mechanism generating the aerosol is similar in both cases and provides a characteristic
fingerprint distinguishing respiratory aerosols from other potential particle sources (ie from fabric /
bedding dust released by movement of staff and patient).
The increased number of particles produced by OGD-evoked coughs, above those produced by a
volitional cough, may relate either to a more forceful reflexively-generated protective cough, to the
13
presence of fluid in the oropharynx associated with the endoscopy, or to partial occlusion of the
oropharynx during endoscopy reducing the diameter of the airway and increasing the amount of
turbulent flow. Interestingly burps (eructations) also produced measurable aerosol but this had a
different size distribution to coughs (with an order of magnitude fewer particles in the size range from
0.5-1.5µm) reflecting the different site of origin of the aerosol. However, although the gastric source
of the BGE is unlikely to represent a reservoir for SARS-CoV-2 (unlike the lungs), the passage of
turbulent gas flow over the oro- and naso-pharyngeal membranes still could result in generation of
virus containing aerosol so should not be discounted as a risk.
Our study was not designed to look at the potential mitigating effect of using sedation to reduce
coughing. Midazolam was administered to four patients for conscious sedation at patient request. All
of the patients receiving midazolam coughed compared to 50% of the remainder. A subsequent
exploratory study of the incidence of coughing in patients having upper GI endoscopy in our institution
showed similar findings with 67% (n=8/12) coughing with midazolam sedation and 40% without
(n=4/10). This fits with the known lack of antitussive properties of benzodiazepines which tend to
preserve airway reflexes (generally considered a safety advantage for endoscopy in reducing the
incidence of aspiration and hypoxia). Likewise, both of the previous studies of aerosol generation
during endoscopy [25, 26] found no association with either the presence or quantity of sedation on
aerosol generation (both with midazolam). A randomised controlled study would be needed to
answer the question as to whether conscious sedation can be used to reduce aerosol generation
during endoscopy. However, we also note that this would be a difficult trial to translate into change
in guidelines as even a large reduction in the incidence of coughing (of say 50% as has been noted for
combinations of midazolam and opiate [37, 38]) could not exclude the possibility that any individual
patient would cough or burp and hence airborne PPE would still be needed. This would also have to
be balanced against the possible detrimental effect of suppression of protective airway reflexes which
could increase the risk of hypoxia.
There are several limitations to our study. Our sample size was relatively small, and 14 out of the 15
participants had a BMI > 40 kg.m-2. It is possible that these patients with higher BMI may have
generated more aerosol than leaner patients (as was suggested by the study of Sagami and colleagues
[26], but this effect is likely to apply both for the baseline cough measurements and during endoscopy
and so is controlled for in our study design looking at relative levels of airborne particles. It is not
possible to extrapolate our findings to patients with active respiratory disease or COVID-19 infection
as all participants were screened for COVID-19 and had no acute illness. Our study cannot be used to
determine the risk of COVID-19 transmission during endoscopy where the risk status of the patient
(i.e. the likelihood of having COVID) is the major determinant. Our sampling methodology does not

14
detect aerosols smaller than 300 nm (approximately three times the diameter of the SARS-CoV-2 virus)
however, respiratory particles less than 300 nm in diameter are extremely unlikely to carry viable
virions unless the patient’s viral titre is extremely high. This lower size limit excludes aerosols of sub-
virus size which cannot contain the virus [39] but are always present in any environment at the highest
concentration and number – so our sampling method reduces this irrelevant ‘noise’ signal. Similarly,
aerosols greater than 10 µm are not detected using our techniques. However, particles larger than 5
µm are classified as droplets and protection is afforded by droplet precaution PPE (ie fluid resistant
surgical facemasks).
Our findings are clinically relevant, particularly in the context of the COVID pandemic. Performing an
OGD may unpredictably trigger coughing whenever the oropharynx is instrumented, and such OGD-
evoked coughs generate more aerosol than either breathing or volitional coughs. Based on our
observations, OGD should continue to be designated an aerosol generating procedure in conscious
patients. Therefore, airborne protection PPE including a FFP3/N95 facemask and eye protection
should be used in the care of any patient known or suspected to have COVID-19. These precautions
will likely have to continue while SARS-CoV-2 is still in circulation in the community and beyond for
the management of any patients with respiratory pathogens. We also note there is currently an
absence of epidemiological evidence demonstrating that OGD is associated with an increased risk of
COVID transmission, but this may reflect the widespread adoption of airborne PPE and precautions by
endoscopists and endoscopy staff. Given the increased risk of aerosol generation we suggest that
upper GI endoscopy should be conducted in an environment with a high level of air changes and
carefully designed air flows to ensure rapid clearance and dispersal of aerosol [19]. We find no
evidence for any other sources of increased aerosol generation during the OGD and therefore if a
patient does not cough or belch during the OGD then consideration may be given to decreasing the
time interval for air changes in the room between cases. In addition, strategies to reduce the incidence
of coughing and eructation should be explored as a means to decrease the risk of aerosol generation.
ACKNOWLEDGEMENTS
The authors acknowledge the AERATOR group, which consists of (in alphabetical order): Arnold, D;
Brown, J; Bzdek, B; Davidson, A; Dodd, J; Gormley M; Gregson, F; Hamilton, F; Maskell, N; Murray, J;
Keller, J; Pickering, A.E; Reid, J; Sheikh, S; Shrimpton, A.
The AERATOR study was fully funded by an NIHR-UKRI rapid rolling grant (Ref: COV0333).

15
This report presents independent research commissioned by the National Institute for Health
Research (NIHR). The views and opinions expressed by authors in this publication are those of the
authors and do not necessarily reflect those of the NHS, the NIHR, UKRI, or the Department of Health.
B.R.B. is supported by the Natural Environment Research Council (NE/P018459/1).
AUTHOR CONTRIBUTIONS
FKAG and AJS are joint first authors on this article. AJS, JMB, DJP and FH collected the data. FKAG, AJS
and AEP performed the data analysis. JMB, AEP, AJS, FKAG and TMC drafted the manuscript. BRB, JPR
and AEP provided technical guidance and advice. All authors read and approved the final manuscript.
COMPETING INTERESTS
The authors declare no competing interests.

16
REFERENCES
1 Miller SL, Nazaroff WW, Jimenez JL, Boerstra A, Buonanno G, Dancer SJ, et al. Transmission of SARS-CoV-2 by inhalation of respiratory aerosol in the Skagit Valley Chorale superspreading event. Indoor Air 2020. 2 Schutzer-Weissmann J, Magee DJ, Farquhar-Smith P. Severe acute respiratory syndrome coronavirus 2 infection risk during elective peri-operative care: a narrative review. Anaesthesia 2020;75:1648-58. 3 Asadi S, Bouvier N, Wexler AS, Ristenpart WD. The coronavirus pandemic and aerosols: Does COVID-19 transmit via expiratory particles? Aerosol Science and Technology 2020;54:635-8. 4 Morawska L, Milton DK. It Is Time to Address Airborne Transmission of Coronavirus Disease 2019 (COVID-19). Clin Infect Dis 2020;71:2311-3. 5 Mahase E. Covid-19: What have we learnt about the new variant in the UK? British Medical Journal 2020;371:m4944. 6 NERVTAG. Meeting on SARS-CoV-2 variant under investigation VUI-202012/01., 2020. 7 W.H.O. Infection prevention and control of epidemic and pandemic-prone acute respiratory infections in health care. Geneva: World Health Organization, 2014. 8 Gralton J, Tovey E, McLaws M-L, Rawlinson WD. The role of particle size in aerosolised pathogen transmission: A review. Journal of Infection 2011;62:1-13. 9 Walker JS, Archer J, Gregson FKA, Michel SES, Bzdek BR, Reid JP. Accurate Representations of the Microphysical Processes Occurring during the Transport of Exhaled Aerosols and Droplets. ACS Central Science 2021;7:200-9. 10 Boswell C, Longstaff J. Aerosol Generating Procedures (AGPs). 2020; https://hpspubsrepo.blob.core.windows.net/hps-website/nss/2893/documents/1_tbp-lr-agp-v1.pdf: accessed: 11 Tran K, Cimon K, Severn M, Pessoa-Silva CL, Conly J. Aerosol generating procedures and risk of transmission of acute respiratory infections to healthcare workers: a systematic review. PLoS One 2012;7:e35797. 12 Which procedures are considered aerosol generating procedures in healthcare settings. Healthcare workers FAQs. 2020; https://www.cdc.gov/coronavirus/2019-ncov/hcp/faq.html?CDC_AA_refVal=https%3A%2F%2Fwww.cdc.gov%2Fcoronavirus%2F2019-ncov%2Fhcp%2Finfection-control-faq.html: accessed: 30/12/2020 13 COVID-19 infection prevention and control guidance: aerosol generating procedures. 20 October 2020. ; https://www.gov.uk/government/publications/wuhan-novel-coronavirus-infection-prevention-and-control/covid-19-infection-prevention-and-control-guidance-aerosol-generating-procedures accessed: 18/12/20 14 Endoscopy activity and COVID-19: BSG and JAG guidance. 2020; https://www.bsg.org.uk/covid-19-advice/endoscopy-activity-and-covid-19-bsg-and-jag-guidance/: accessed: 30th December 2020 15 Gralnek IM, Hassan C, Beilenhoff U, Antonelli G, Ebigbo A, Pellise M, et al. ESGE and ESGENA Position Statement on gastrointestinal endoscopy and COVID-19: An update on guidance during the post-lockdown phase and selected results from a membership survey. Endoscopy 2020;52:891-8. 16 American Society for Gastrointenstinal Endoscopy : Guidance for GI endoscopy and practice operations during the COVID-19 pandemic. 2021; https://www.asge.org/docs/default-source/default-document-library/guidance-for-gi-endoscopy-and-practice-operations-during-the-covid-19-pandemic_updated_final-march-2021.pdf: accessed: 11/4 17 Cook TM. Personal protective equipment during the coronavirus disease (COVID) 2019 pandemic – a narrative review. Anaesthesia 2020;75:920-7. 18 COVID-19 Guidance for the Remobilisation of services within health and care settings: infection prevention and control (IPC) recommendations. August 2020;

17
https://www.gov.uk/government/publications/wuhan-novel-coronavirus-infection-prevention-and-control: accessed: 19 Cook TM, Harrop-Griffiths W. Aerosol clearance times to better communicate safety after aerosol-generating procedures. Anaesthesia 2020;75:1122-3. 20 Brown J, Gregson FKA, Shrimpton A, Cook TM, Bzdek BR, Reid JP, et al. A quantitative evaluation of aerosol generation during tracheal intubation and extubation. Anaesthesia 2021;76:174-81. 21 Ramesh AV, Collin I, Gregson FKA, Brown J. Aerosol generation during percutaneous tracheostomy insertion. Journal of the Intensive Care Society, 2020:1751143720977278. 22 Gaeckle NT LJ, Park Y, Kreykes G, Evans MD, Hogan CJ. Aerosol Generation from the Respiratory Tract with Various Modes of Oxygen Delivery. Am J Respir Crit Care Med 2020;202:1115–24. 23 Wilson NM, Marks GB, Eckhardt A, Clarke A, Young F, Garden FL, et al. The effect of respiratory activity, ventilatory therapy and facemasks on total aerosol emissions. medRxiv, 2021:DOI: 10.1101/2021.02.07.21251309. 24 Hamilton F, Gregson F, Arnold D, Sheikh S, Ward K, Brown J, et al. Aerosol emission from the respiratory tract: an analysis of relative risks from oxygen delivery systems. medRxiv 2021:DOI: 10.1101/2021.01.29.21250552. 25 Chan SM, Ma TW, Chong MK, Chan DL, Ng EKW, Chiu PWY. A Proof of Concept Study: Esophagogastroduodenoscopy Is an Aerosol-Generating Procedure and Continuous Oral Suction During the Procedure Reduces the Amount of Aerosol Generated. Gastroenterology 2020;159:1949-51 e4. 26 Sagami R, Nishikiori H, Sato T, Tsuji H, Ono M, Togo K, et al. Aerosols Produced by Upper Gastrointestinal Endoscopy: A Quantitative Evaluation. Am J Gastroenterol 2021;116:202-5. 27 Stelzer-Braid S, Oliver BG, Blazey AJ, Argent E, Newsome TP, Rawlinson WD, et al. Exhalation of respiratory viruses by breathing, coughing, and talking. J Med Virol 2009;81:1674-9. 28 Yang S LG, Chen CM, Wu CC, Yu KP. The size and concentration of droplets generated by coughing in human subjects. Journal of Aerosol Medicine 2007;20:484– 94. 29 Johnson GR, Morawska L, Ristovski ZD, Hargreaves M, Mengersen K, Chao CYH, et al. Modality of human expired aerosol size distributions. Journal of Aerosol Science 2011;42:839-51. 30 Morawska L, Johnson GR, Ristovski ZD, Hargreaves M, Mengersen K, Corbett S, et al. Size distribution and sites of origin of droplets expelled from the human respiratory tract during expiratory activities. Journal of Aerosol Science 2009;40:256-69. 31 Gregson FKA, Watson NA, Orton CM, Haddrell AE, McCarthy LP, Finnie TJR, et al. Comparing aerosol concentrations and particle size distributions generated by singing, speaking and breathing. Aerosol Science and Technology 2021:1-15. 32 Brown WA, Johari Halim Shah Y, Balalis G, Bashir A, Ramos A, Kow L, et al. IFSO Position Statement on the Role of Esophago-Gastro-Duodenal Endoscopy Prior to and after Bariatric and Metabolic Surgery Procedures. Obesity Surgery 2020;30:3135-53. 33 Shrimpton A, Gregson FKA, Cook TM, Brown J, Bzdek BR, Reid JP, et al. A quantitative evaluation of aerosol generation during tracheal intubation and extubation: a reply. Anaesthesia 2021;76 Suppl 3:16-8. 34 Widdicombe J, Fontana G. Cough: what's in a name? Eur Respir J 2006;28:10-5. 35 Prather KA, Marr LC, Schooley RT, McDiarmid MA, Wilson ME, Milton DK. Airborne transmission of SARS-CoV-2. Science 2020;370:303-4. 36 Tang JW, Bahnfleth WP, Bluyssen PM, Buonanno G, Jimenez JL, Kurnitski J, et al. Dismantling myths on the airborne transmission of severe acute respiratory syndrome coronavirus-2 (SARS-CoV-2). J Hosp Infect 2021;110:89-96. 37 Greig JH, Cooper SM, Kasimbazi HJ, Monie RD, Fennerty AG, Watson B. Sedation for fibre optic bronchoscopy. Respir Med 1995;89:53-6.
18
38 Stolz D, Chhajed PN, Leuppi JD, Brutsche M, Pflimlin E, Tamm M. Cough suppression during flexible bronchoscopy using combined sedation with midazolam and hydrocodone: a randomised, double blind, placebo controlled trial. Thorax 2004;59:773-6. 39 Robinson JF, de Anda IR, Moore FJ, Gregson FKA, Reid JP, Husain L, et al. How effective are face coverings in reducing transmission of COVID-19? medRxiv 2020:DOI: 10.1101/2020.12.01.20241992.
19
FIGURE LEGENDS:
Figure 1
Figure 1. a) Mean particle concentrations and b) peak particle concentrations generated during the recording protocol. Note log scale for concentrations plotted as mean ± SEM.

20
Figure 2
Figure 2 Mean particle concentration sampled during reference voluntary coughs (n=15 patients) overlaid with those for coughs evoked during OGD (n=9 patients) and burps observed during OGD (n=4 patients). The shaded region represents SEM.

21
Figure 3
Figure 3 Continuous time series of aerosol detected during respiratory manoeuvres (tidal breathing and voluntary coughs) followed after a period of background monitoring by OGD
a. Uneventful OGD without any significant aerosol generation. b. A more challenging endoscopy requiring multiple attempts at scope insertion which triggered
coughing during the final episode
22
Figure 4
Figure 4 (a) Particle size distribution of the events. dN/dlog(DP) is the concentration sampled within each bin normalised by the logarithm of the bin width. The error bars represent the standard error of the mean. (b) The size distribution of the average aerosol concentration generated by each activity represented in terms of a mass concentration, calculated assuming unit density.

23
Figure 5
Figure 5 Profile of aerosol concentration detected during endoscope (a) insertion (n=12) (b) removal (n=11). A low mean concentration of aerosol was detected in the 30 second time period around endoscope insertion (10.3 (9.5) particles.L-1) and removal (15.1 (12.4) particles.L-1) where the concentrations were not significantly different to background. Note endoscope insertions (n=3) and removals (n=4) that immediately triggered coughing or burping (i.e. during this sampling window) were excluded from the pooled analysis.