the aes corporations2.q4cdn.com/825052743/files/doc_presentations/2018/03/analytics... ·...
TRANSCRIPT
The AES Corporation
March 2018

2Contains Forward-Looking Statements
Certain statements in the following presentation regarding AES’ business operations may constitute“forward-looking statements.” Such forward-looking statements include, but are not limited to, thoserelated to future earnings growth and financial and operating performance. Forward-looking statementsare not intended to be a guarantee of future results, but instead constitute AES’ current expectationsbased on reasonable assumptions. Forecasted financial information is based on certain materialassumptions. These assumptions include, but are not limited to, accurate projections of future interestrates, commodity prices and foreign currency pricing, continued normal or better levels of operatingperformance and electricity demand at our distribution companies and operational performance at ourgeneration businesses consistent with historical levels, as well as achievements of planned productivityimprovements and incremental growth from investments at investment levels and rates of returnconsistent with prior experience. For additional assumptions see Slide 31 and the Appendix to thispresentation. Actual results could differ materially from those projected in our forward-lookingstatements due to risks, uncertainties and other factors. Important factors that could affect actual resultsare discussed in AES’ filings with the Securities and Exchange Commission including but not limited tothe risks discussed under Item 1A “Risk Factors” and Item 7: “Management’s Discussion & Analysis” inAES’ 2017 Annual Report on Form 10-K, as well as our other SEC filings. AES undertakes no obligationto update or revise any forward-looking statements, whether as a result of new information, futureevents or otherwise.
Reconciliation to U.S. GAAP Financial InformationThe following presentation includes certain “non-GAAP financial measures” as defined in Regulation Gunder the Securities Exchange Act of 1934, as amended. Schedules are included herein that reconcilethe non-GAAP financial measures included in the following presentation to the most directly comparablefinancial measures calculated and presented in accordance with U.S. GAAP.
Safe Harbor Disclosure

3Contains Forward-Looking Statements
1. Earnings refers to Adjusted EPS (a non-GAAP financial measure). Parent Free Cash Flow is also a non-GAAP financial measure. See Appendix for definitions.
Continuing to Transform and Simplify, While Achieving Financial Objectives
We Are Well Positioned to:
Deliver 8% to 10% average annual growth in earnings1
and Parent Free Cash Flow1
through 2020
Achieve investment grade credit metrics
in 2019
Reduce our carbon intensity by 25% from
2016-2020 and 50% by 2030
Maximizing efficiency
through reorganization yielding $100
million in additional annual
savings
Reducing financial riskby prepaying$1 billion in Parent debt
Leveraging platforms by
adding 4.4 GW of projects under
construction
Reshaping portfolio through a balanced approachto reduce
overall risk
4Contains Forward-Looking Statements
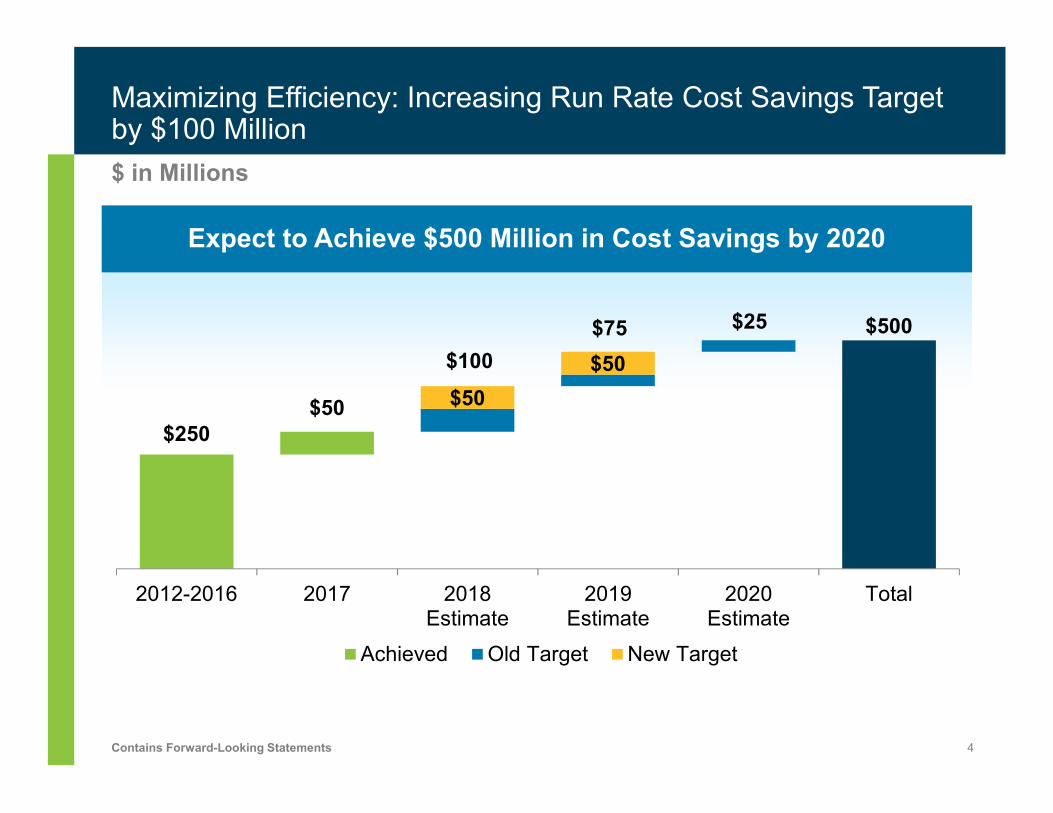
Expect to Achieve $500 Million in Cost Savings by 2020
$ in Millions
Maximizing Efficiency: Increasing Run Rate Cost Savings Target by $100 Million
$500
$250 $50 $50
$50
2012-2016 2017 2018Estimate
2019Estimate
2020Estimate
Total
Achieved Old Target New Target
$100
$75 $25

5Contains Forward-Looking Statements
Adding up to 8.3 GW of New Capacity Through 2020
On Track to Complete Projects Under Construction; Making Significant Progress Toward Reshaping Our Portfolio
2,307
4,301
887
2017 2018 2019 2020 Total
1,952
3,330874
2,118 8,274
Total Capacity Under Construction
Renewables Under Signed PPAs/Exclusive Negotiations
Renewables in Advanced Development
Renewables Acquired
Completed Construction
6Contains Forward-Looking Statements
As discussed on our previous calls, the project has experienced construction delays and cost overruns
Alto Maipo has negotiated a fixed price, lump sum EPC contract with Strabag, the project’s main contractor for the entire project
Transfers all geological risk to Strabag
Includes material capital commitments from Strabag to fund additional costs
Requires concessions from project lenders and meaningful contributions from AES Gener, which are tied to construction milestones
Expect to receive approval from the lenders in the second quarter of 2018
Once completed, Alto Maipo will diversify AES Gener’s generation mix and provide a zero emission source of power in Chile’s load center for many decades
Leveraging Our Platforms: 531 MW Alto Maipo Hydro Project in Chile
7Contains Forward-Looking Statements
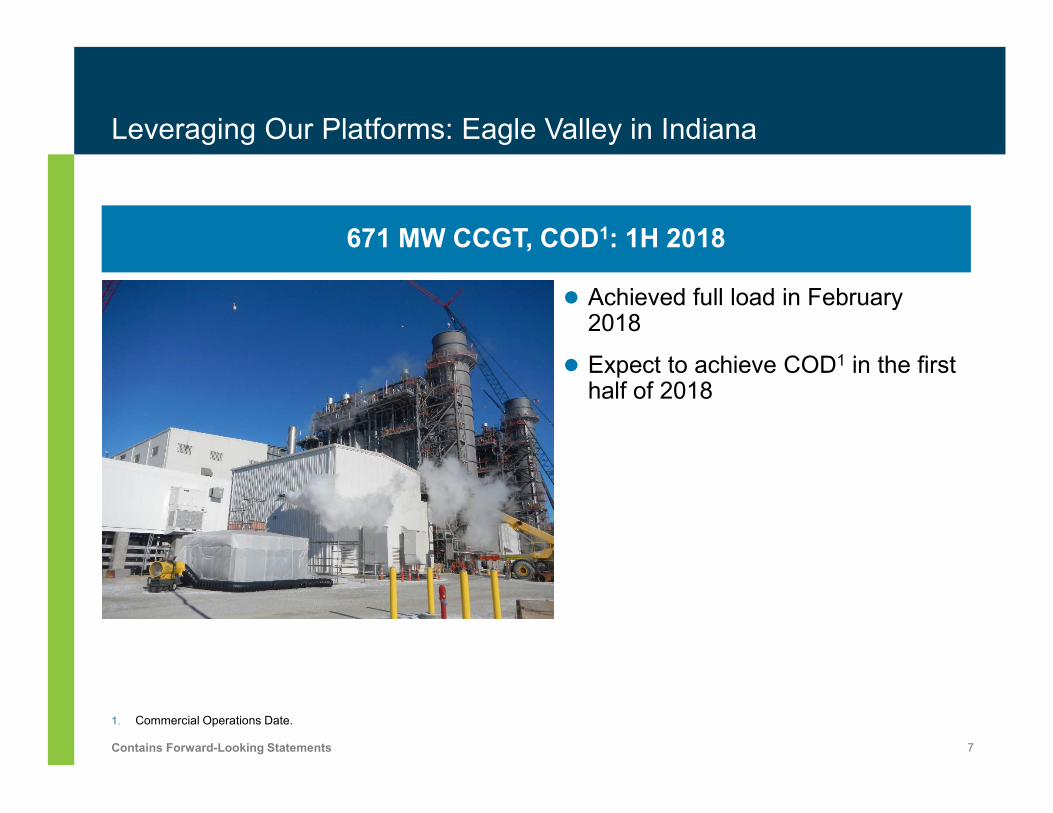
671 MW CCGT, COD1: 1H 2018
Leveraging Our Platforms: Eagle Valley in Indiana
Achieved full load in February 2018
Expect to achieve COD1 in the first half of 2018
1. Commercial Operations Date.

8Contains Forward-Looking Statements
1,284 MW CCGT, COD1: 1H 2020 100 MW Energy Storage, COD1 1H 2021
Leveraging Our Platforms: Southland Repowering in California
20-year PPAs with Southern California Edison
Construction proceeding as planned
100 MW of 4-hour duration energy storage – world’s largest lithium-ion energy storage facility coming on-line in 1H 2021
1. Commercial Operations Date.
9Contains Forward-Looking Statements
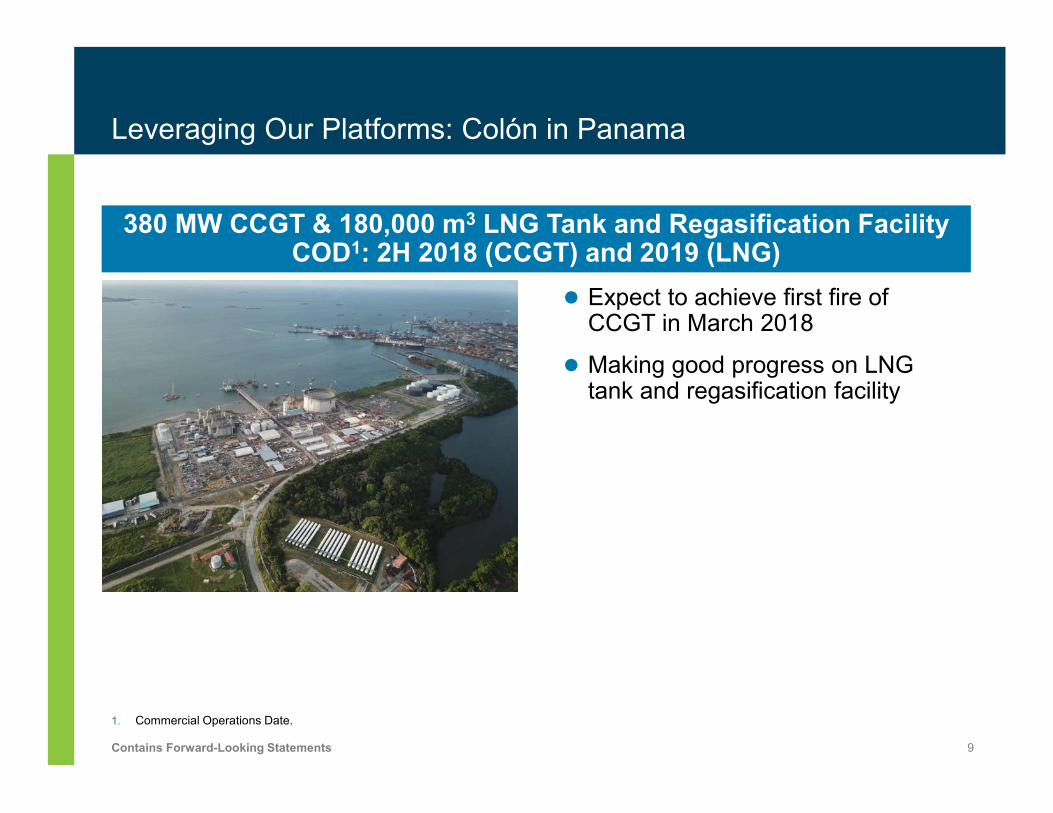
380 MW CCGT & 180,000 m3 LNG Tank and Regasification FacilityCOD1: 2H 2018 (CCGT) and 2019 (LNG)
Leveraging Our Platforms: Colón in Panama
Expect to achieve first fire of CCGT in March 2018
Making good progress on LNG tank and regasification facility
1. Commercial Operations Date.

10Contains Forward-Looking Statements
In 2017, Acquired 2.3 GW of Long-Term Contracted Renewables
Reshaping Our Portfolio to Deliver Attractive Returns to Shareholders and Reduce Carbon Exposure
Brazil: 686 MW of Wind and Solar
U.S.: sPower (1.3 GW of Wind and Solar)
Mexico: 306 MW of Wind

11Contains Forward-Looking Statements
Offering New Innovative Energy Solutions
Reshaping Our Portfolio to Deliver Attractive Returns to Shareholders and Reduce Carbon Exposure
Solar Plus 5-Hour Duration Energy Storage
Fluence Energy Storage Joint Venture with Siemens

12Contains Forward-Looking Statements
Replacing Coal Capacity with Renewables and Natural Gas
Balanced Approach to De-Risking Our Portfolio
41% 33% 29%
32%37%
37%
23% 26% 31%
Year-End 2015 Year-End 2017 Year-End 2020
Coal Gas Renewables Oil, Pet Coke & Diesel
In 2017, Announced Exit of 4.3 GW, or 30%, of Coal-Fired Capacity

13Contains Forward-Looking Statements
Carbon Intensity (Tons of CO2/MWh of Generation)
Establishing Carbon Intensity Reduction Targets
0.69 0.670.60 0.55 0.51
0.31
2016 Actual 2017 Actual 2018 2019 2020 2030
2016-2020: Reduction of 20 Million Tons of CO2 Emissions

14Contains Forward-Looking Statements
One-time charge of $1.08 per share in 2017 largely due to deemed repatriation of foreign earnings
Non-cash due to significant NOL position
Near-term impacts of $0.05 to $0.08
Lower tax shield due to Parent leverage
Global Intangible Low Taxed Income (GILTI)
Foreign earnings above a threshold now subject to U.S. tax
Over the longer-term, tax reform can be beneficial
Territorial tax regime
Actions taken to offset impacts
Impact of U.S. Tax Reform

15Contains Forward-Looking Statements
Since 2011, Reduced Parent Debt by $2 Billion($ in Millions)
1. Excludes intercompany borrowings of approximately $200 million.
Continuing to Improve Our Debt Profile
$6,515
$4,670 ($530) ($308)($419) ($240) ($301) ($254)
$207
Total ParentDebt as ofDecember31, 2011
2012 2013 2014 2015 2016 2017 2017Revolver
Draws
Total ParentDebt as ofDecember31, 2017
1
Prepaying $1 Billion in Parent Debt in 1H 2018, to Achieve Investment Grade
16Contains Forward-Looking Statements
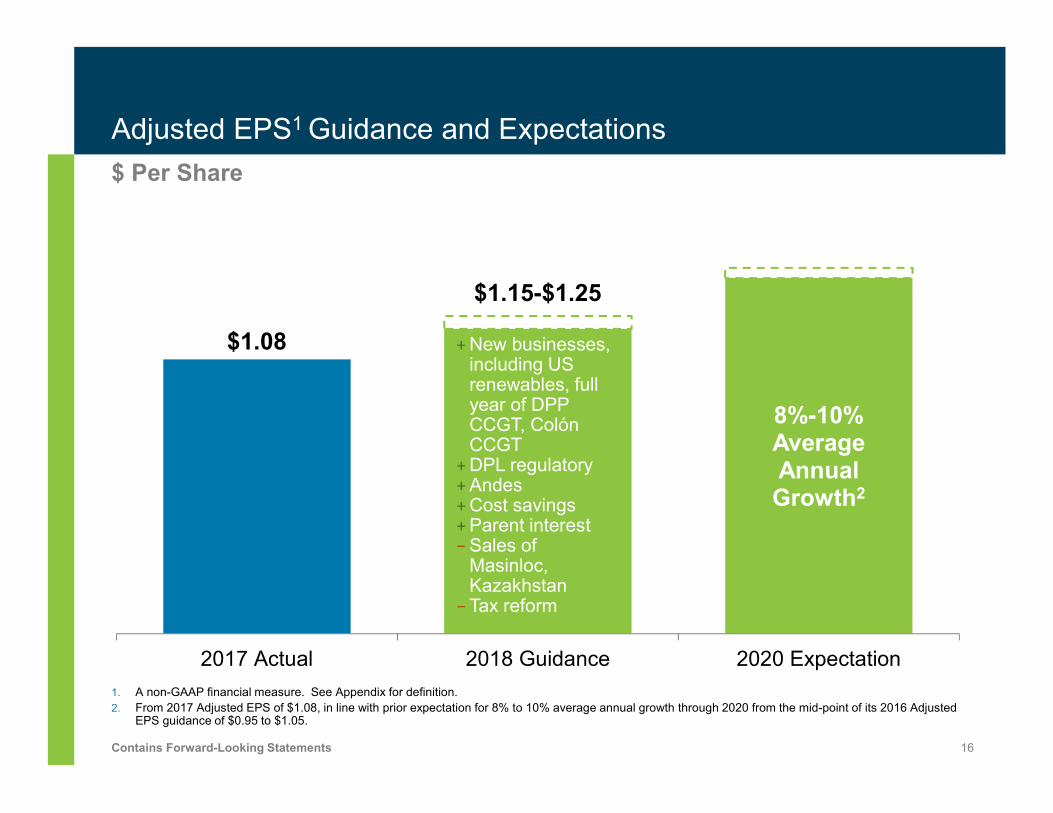
$1.08
$1.15-$1.25
8%-10% Average Annual Growth2
2017 Actual 2018 Guidance 2020 Expectation
$ Per Share
1. A non-GAAP financial measure. See Appendix for definition.
2. From 2017 Adjusted EPS of $1.08, in line with prior expectation for 8% to 10% average annual growth through 2020 from the mid-point of its 2016 Adjusted EPS guidance of $0.95 to $1.05.
Adjusted EPS1 Guidance and Expectations
+New businesses, including US renewables, full year of DPP CCGT, Colón CCGT
+DPL regulatory+Andes+Cost savings+Parent interest−Sales of
Masinloc, Kazakhstan
− Tax reform

17Contains Forward-Looking Statements
$637 $600-$675
8%-10% Average Annual Growth2
2017 Actual 2018 Expectation 2020 Expectation
$ in Millions
1. A non-GAAP financial measure. See Appendix for definition.
2. From 2017 Parent Free Cash Flow of $637 million, in line with prior expectation for 8% to 10% average annual growth through 2020 from the mid-point of its 2016 expectation of $525 to $625 million.
Parent Free Cash Flow1 Expectations
+Higher margins+Cost savings+Parent interest−Gener− IPALCO tax
sharing payments−Restructuring
costs

18Contains Forward-Looking Statements
$ in Millions
Discretionary Cash – Sources ($1,899)
Discretionary Cash – Uses ($1,899)
1. A non-GAAP financial measure. See Appendix for definition and reconciliation to the nearest GAAP measure.
2018 Parent Capital Allocation Plan
$11
$1,899
$1,000
$250
$600-$675
BeginningCash
MasinlocSale
Proceeds
Placeholderfor AdditionalAsset SaleProceeds
Parent FCF TotalDiscretionary
Cash
$105
$250
$344
$800
$400
1
Investments in Subsidiaries
Shareholder Dividend
Maximizing Discretionary Cash to Increase Risk-Adjusted Returns for Shareholders
Debt Prepayment
Repayment of Revolver & Other Temporary
Borrowings
Unallocated

19Contains Forward-Looking Statements
$11
$4,230
$1,000
$1,000
$2,219
2018 BeginningCash
Masinloc SaleProceeds
Remaining AssetSale Proceeds
Target
Parent FCF Total DiscretionaryCash
$ in Millions
1. A non-GAAP financial measure. See Appendix for definition. Parent Free Cash Flow based on the mid-point of 2018 expectation of $638, plus $1,581 for 2019-2020 (based on the mid-point of our 8%-10% average annual growth rate off 2017 actual of $637).
$4.2 Billion in Discretionary Cash Being Generated 2018-2020
1

20Contains Forward-Looking Statements
$ in Millions
1. Includes: $11 beginning cash; $2,000 asset sale proceeds; and Parent Free Cash Flow of approximately $2,219. Parent Free Cash Flow based on the mid-point of 2018 expectation of $638, plus $1,581 for 2019-2020 (based on the mid-point of our 8%-10% average annual growth rate off 2017 actual of $637).
2. Assumes constant payment of $0.13 per share each quarter on 660 million shares outstanding.
2018-2020: Allocating $4.2 Billion1 Discretionary Cash to Maximize Risk-Adjusted Returns
$1,250
$750$1,030
$800
$400 Unallocated Discretionary Cash Parent de-levering (~$400) Growth investments Dividend growth
2018 Repayment of Revolver & Other Temporary Borrowings
Identified Investments in SubsidiariesShareholder Dividend2
Allocating a Significant Portion of Discretionary Cash to Achieve Investment Grade and to Shareholder Dividend
2018 Debt Prepayment

21Contains Forward-Looking Statements
1. Earnings refers to Adjusted EPS (a non-GAAP financial measure). Parent Free Cash Flow is also a non-GAAP financial measure. See Appendix for definitions.
Continuing to Transform and Simplify, While Achieving Financial Objectives
We Are Well Positioned to:
Deliver 8% to 10% average annual growth in earnings1
and Parent Free Cash Flow1
through 2020
Achieve investment grade credit metrics
in 2019
Reduce our carbon intensity by 25% from
2016-2020 and 50% by 2030
Maximizing efficiency
through reorganization yielding $100
million in additional annual
savings
Reducing financial riskby prepaying$1 billion in Parent debt
Leveraging platforms by
adding 4.4 GW of projects under
construction
Reshaping portfolio through a balanced approachto reduce
overall risk

22Contains Forward-Looking Statements
Currencies and Commodities Slides 23-25
AES Modeling Disclosures Slide 26
FY 2018 Adjusted PTC1 Modeling Ranges Slide 27
Construction Program Slide 28
Reconciliations Slides 29-30
Assumptions & Definitions Slides 31-32
1. A non-GAAP financial measure.
Appendix

23Contains Forward-Looking Statements
Interest Rates1
Currencies
Commodity
100 bps move in interest rates over year-to-go 2018 is forecasted to have a change in EPS of approximately $0.025
10% appreciation in USD against the following key currencies is forecasted to have the following negative EPS impacts:
2018
Average Rate Sensitivity
Brazilian Real (BRL) 3.39 Less than $0.005, Long Exposure
Colombian Peso (COP) 3,030 $0.005, Long Exposure
Euro (EUR) 1.22 Less than $0.005, Long Exposure
Great British Pound (GBP) 1.36 Less than $0.005, Long Exposure
Argentine Peso (ARS) 20.77 ($0.005), Short Exposure
Chilean Peso (CLP) 617 Less than ($0.005), Short Exposure
10% increase in commodity prices is forecasted to have the following EPS impacts:
2018
Average Rate Sensitivity
Illinois Basin Coal $37/ton$0.010, Short Exposure
Rotterdam Coal (API 2) $90/ton
NYMEX WTI Crude Oil $66/bbl$0.005, Long Exposure
IPE Brent Crude Oil $60/bbl
NYMEX Henry Hub Natural Gas $2.8/mmbtuLess than $0.005, Long Exposure
UK National Balancing Point Natural Gas £0.5/therm
US Power (DPL) – PJM AD Hub $31/MWh $0.010, Long Exposure
Note: Guidance provided on February 27, 2018. Sensitivities are provided on a standalone basis, assuming no change in the other factors, to illustrate the magnitude and direction of changing market factors on AES’ results. Estimates show the impact on full year 2018 Adjusted EPS. Actual results may differ from the sensitivities provided due to execution of risk management strategies, local market dynamics and operational factors. Full year 2018 guidance is based on currency and commodity forward curves and forecasts as of December 31, 2017. There are inherent uncertainties in the forecasting process and actual results may differ from projections. The Company undertakes no obligation to update the guidance presented. Please see Item 1 of the Form 10-K for a more complete discussion of this topic. AES has exposure to multiple coal, oil, and natural gas, and power indices; forward curves are provided for representative liquid markets. Sensitivities are rounded to the nearest $0.005 cent per share.
1. The move is applied to the floating interest rate portfolio balances as of December 31, 2017.
Full Year 2018 Guidance Estimated Sensitivities

24Contains Forward-Looking Statements
Full Year 2020 FX Sensitivity by Currency1
(Cents Per Share, Exposures Before Hedges)
1. Sensitivity represents full year 2020 exposure to a 10% appreciation of USD relative to foreign currency as of December 31, 2017.
Foreign Exchange (FX) Risk Before Hedges
0.5
0.5
1.5
1.0 1.00.5
2.0
Argentine Peso Brazilian Real Chilean Peso Colombian Peso Euro Indian Rupee Total
2020 correlated FX risk before hedges is $0.02 for 10% USD appreciation
FX risk mitigated on a rolling basis by active FX hedging
Long Exposures
Short Exposures
25Contains Forward-Looking Statements
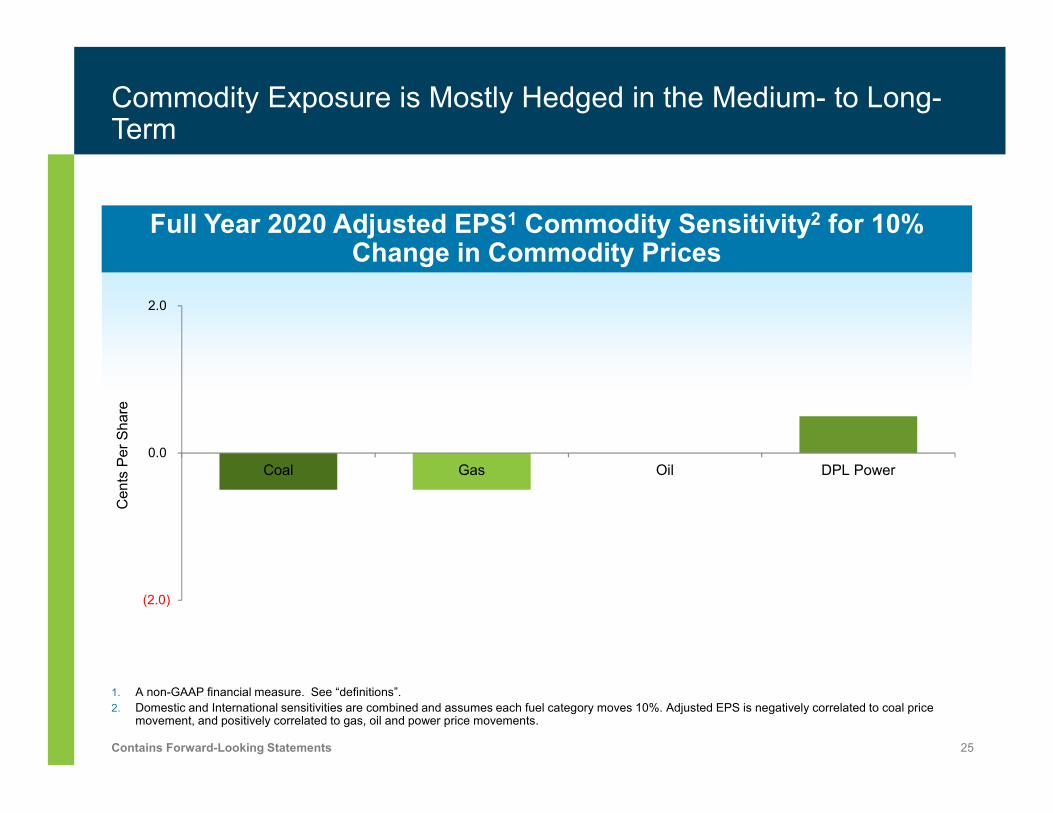
Full Year 2020 Adjusted EPS1 Commodity Sensitivity2 for 10% Change in Commodity Prices
1. A non-GAAP financial measure. See “definitions”.
2. Domestic and International sensitivities are combined and assumes each fuel category moves 10%. Adjusted EPS is negatively correlated to coal price movement, and positively correlated to gas, oil and power price movements.
Commodity Exposure is Mostly Hedged in the Medium- to Long-Term
(2.0)
0.0
2.0
Coal Gas Oil DPL Power
Cen
ts P
er
Sh
are

26Contains Forward-Looking Statements
Parent Company Cash Flow Assumptions 2017 2018
Subsidiary Distributions (a) $1,203 $1,100-$1,175
Cash Interest (b) ($290) ($260)
Corporate Overhead ($179) ($140)
Parent-Funded SBU Overhead ($93) ($90)
Business Development ($4) ($10)
Cash for Development, General & Administrative and Tax (c)
($276) ($240)
PARENT FREE CASH FLOW1 (a – b – c) $637 $600-$675
$ in Millions
1. A non-GAAP financial measure. See “definitions”.
AES Modeling Disclosures
27Contains Forward-Looking Statements
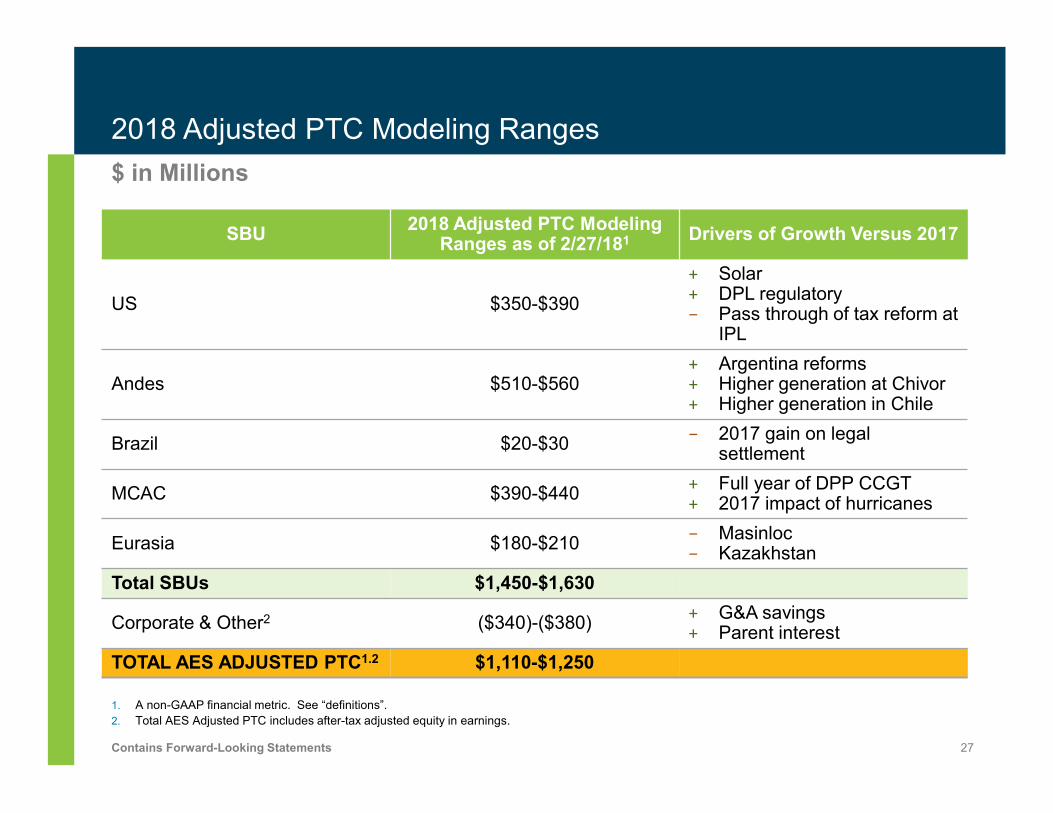
$ in Millions
1. A non-GAAP financial metric. See “definitions”.
2. Total AES Adjusted PTC includes after-tax adjusted equity in earnings.
2018 Adjusted PTC Modeling Ranges
SBU2018 Adjusted PTC Modeling
Ranges as of 2/27/181 Drivers of Growth Versus 2017
US $350-$390
+ Solar+ DPL regulatory− Pass through of tax reform at
IPL
Andes $510-$560+ Argentina reforms+ Higher generation at Chivor+ Higher generation in Chile
Brazil $20-$30− 2017 gain on legal
settlement
MCAC $390-$440+ Full year of DPP CCGT+ 2017 impact of hurricanes
Eurasia $180-$210− Masinloc− Kazakhstan
Total SBUs $1,450-$1,630
Corporate & Other2 ($340)-($380)+ G&A savings+ Parent interest
TOTAL AES ADJUSTED PTC1.2 $1,110-$1,250

28Contains Forward-Looking Statements
Project Country AES Ownership FuelGross MW
Expected COD
Total CapexTotal AES
EquityROE Comments
Construction Projects Coming On-Line 2017-2020
Eagle Valley CCGT US-IN 70% Gas 671 1H 2018 $613 $193
Colón Panama 50% Gas 380 2H 2018 $1,003 $196Regasification and LNG
storage tank expected on-line in 2019
OPGC 2 India 49% Coal 1,320 2H 2018 $1,585 $227
Alto Maipo Chile 62% Hydro 531 1H 2019 $2,513 $413
Southland Repowering US-CA 100% Gas 1,284 1H 2020 $2,287 $329Excludes 100 MW of energy
storage expected to come on-line in 1H 2021
Total 4,186 $8,001 $1,358
ROE1 ~12%Weighted average; net income divided by AES
equity contribution
CASH YIELD1 ~13%
Weighted average; subsidiary distributions divided by AES equity
contribution
$ in Millions, Unless Otherwise Stated
1. Based on projections. See our 2017 Form 10-K for further discussion of development and construction risks. Based on 3-year average contributions from all projects under construction, once all projects under construction are completed.
Attractive Returns from Construction Pipeline

29Contains Forward-Looking Statements
$ in Millions, Except Per Share Amounts
FY 2017 FY 2016
Net of NCI2Per Share
(Diluted) Net of NCI2
Net of NCI2Per Share
(Diluted) Net of NCI2
Loss from Continuing Operations, Net of Tax, Attributable to AES and Non-GAAP Diluted EPS
($507) ($0.76)3 ($20) ($0.04)
Add: Income Tax Expense (Benefit) Attributable to AES $828 ($111)
Pre-Tax Contribution $321 ($131)
Adjustments
Unrealized Derivative Gains ($3) - ($9) ($0.01)
Unrealized Foreign Currency (Gains) Losses ($59) ($0.10) $22 $0.03
Disposition/Acquisition Losses $123 $0.194 $6 $0.015
Impairment Losses $542 $0.826 $933 $1.417
Losses on Extinguishment of Debt $62 $0.098 $29 $0.059
Restructuring Costs $31 $0.05 - -
U.S. Tax Law Reform Impact - $1.0810 - -
Less: Net Income Tax Benefit - ($0.29)11 - ($0.51)12
ADJUSTED PTC1 & ADJUSTED EPS1 $1,017 $1.08 $850 $0.94
1. Non-GAAP financial measures. See “definitions”.
2. NCI is defined as Noncontrolling Interests.
3. In calculating diluted loss per share under GAAP of ($0.77), the Company excluded common stock equivalents from the weighted average shares as their inclusion would be anti-dilutive. However, for purposes of calculating Adjusted EPS, the impact of dilutive common stock equivalents of $0.01 was included, resulting in Non-GAAP diluted loss per share of ($0.76)..
4. Amount primarily relates to loss on sale of Kazakhstan CHPs of $49 million, or $0.07 per share, realized derivative losses associated with the sale of Sul of $38 million, or $0.06 per share, loss on sale of Kazakhstan Hydroelectric plants of $33 million, or $0.05 per share, costs associated with early plant closure of DPL of $24 million, or $0.04 per share; partially offset by gain on Masinloc contingent consideration of $23 million, or $0.03 per share and gain on sale of Zimmer and Miami Fort of $13 million, or $0.02 per share.
5. Amount primarily relates to the loss on deconsolidation of UK Wind of $20 million, or $0.03 per share and losses associated with the sale of Sul of $10 million, or $0.02; partially offset by the gain on sale of DPLER of $22 million, or $0.03 per share.
6. Amount primarily relates to asset impairment at Kazakhstan CHPs of $94 million, or $0.14 per share, at Kazakhstan hydroelectric plants of $92 million, or $0.14 per share, at Laurel Mountain of $121 million, or $0.18 per share, at DPL of $175 million, or $0.27 per share and at Kilroot of $37 million, or $0.05 per share.
7. Amount primarily relates to asset impairments at DPL of $859 million, or $1.30 per share; $159 million at Buffalo Gap II ($49 million, or $0.07 per share, net of NCI); and $77 million at Buffalo Gap I ($23 million, or $0.03 per share, net of NCI).
8. Amount primarily relates to losses on early retirement of debt at the Parent Company of $92 million, or $0.14 per share, at AES Gener of $20 million, or $0.02 per share, at IPALCO of $9 million or 0.01 per share; partially offset by a gain on early retirement of debt at Alicura of $65 million, or $0.10 per share.
9. Amount primarily relates to the loss on early retirement of debt at the Parent Company of $19 million, or $0.03 per share.
10. Amount relates to a one-time transition tax on foreign earnings of $675 million, or $1.02 per share and the remeasurement of deferred tax assets and liabilities to lower corporate tax rates of $39 million, or $0.06 per share.
11. Amount primarily relates to the income tax benefit associated with asset impairment losses of $148 million, or $0.22 per share in the twelve months ended December 31, 2017.
12. Amount primarily relates to the income tax benefit associated with asset impairment of $332 million, or $0.50 per share in the twelve months ended December 31, 2016.
Reconciliation of FY Adjusted PTC1 and Adjusted EPS1

30Contains Forward-Looking Statements
$ in Millions, Except Per Share Amounts
1. A non-GAAP financial measure. See “definitions”.
2. The Company is not able to provide a corresponding GAAP equivalent for its Adjusted EPS guidance. In providing its full year 2017 Adjusted EPS guidance, the Company notes that there could be differences between expected reported earnings and estimated operating earnings, including the items listed below. Therefore, management is not able to estimate the aggregate impact, if any, of these items on reported earnings. As of December 31, 2017, the impact of these items was as follows: (a) unrealized gains or losses related to derivative transactions represent a gain of $3 million; (b) unrealized foreign currency gains or losses represent a gain of $60 million; (c) gains or losses and associated benefits and costs due to dispositions and acquisitions of business interests, including early plant closures, and the tax impact of the repatriation of sales proceeds represent a loss of $114 million; (d) losses due to impairments of $394 million; (e) gains, losses and costs due to the early retirement of debt represent a loss of $42 million; (f) costs directly associated with a major restructuring program, including, but not limited to, workforce reduction efforts, relocations, and office consolidation of $21 million; and (g) tax benefit or expense related to the enactment effects of 2017 U.S. tax law reform of $714 million.
Reconciliation of 2017 Guidance
2017 Guidance
Consolidated Net Cash Provided by Operating Activities
$2,000-$2,800
Consolidated Free Cash Flow1 $1,400-$2,000
Adjusted EPS1,2 $1.00-$1.10
Reconciliation
Consolidated Net Cash Provided by Operating Activities (a)
$2,000-$2,800
Maintenance & Environmental Capital Expenditures (b)
$600-$800
Consolidated Free Cash Flow1 (a - b) $1,400-$2,000
Commodity and foreign currency exchange rates and forward curves as of September 30, 2017

31Contains Forward-Looking Statements
Forecasted financial information is based on certain material assumptions. Such assumptions include, but are not limited to: (a) no unforeseen external events such as wars, depressions, or economic or political disruptions occur; (b) businesses continue to operate in a manner consistent with or better than prior operating performance, including achievement of planned productivity improvements including benefits of global sourcing, and in accordance with the provisions of their relevant contracts or concessions; (c) new business opportunities are available to AES in sufficient quantity to achieve its growth objectives; (d) no material disruptions or discontinuities occur in the Gross Domestic Product (GDP), foreign exchange rates, inflation or interest rates during the forecast period; and (e) material business-specific risks as described in the Company’s SEC filings do not occur individually or cumulatively. In addition, benefits from global sourcing include avoided costs, reduction in capital project costs versus budgetary estimates, and projected savings based on assumed spend volume which may or may not actually be achieved. Also, improvement in certain Key Performance Indicators (KPIs) such as equivalent forced outage rate and commercial availability may not improve financial performance at all facilities based on commercial terms and conditions. These benefits will not be fully reflectedin the Company’s consolidated financial results.
The cash held at qualified holding companies (“QHCs”) represents cash sent to subsidiaries of the Company domiciled outside of the U.S. Such subsidiaries had no contractual restrictions on their ability to send cash to AES, the Parent Company, however, cash held at qualified holding companies does not reflect the impact of any tax liabilities that may result from any such cash being repatriated to the Parent Company in the U.S. Cash at those subsidiaries was used for investment and related activities outside of the U.S. These investments included equity investments and loans to other foreign subsidiaries as well as development and general costs and expenses incurred outside the U.S. Since the cash held by these QHCs is available to the Parent, AES uses the combined measure of subsidiary distributions to Parent and QHCs as a useful measure of cash available to the Parent to meet its international liquidity needs. AES believes that unconsolidated parent company liquidity is important to the liquidity position of AES as a parent company because of the non-recourse nature of most of AES’ indebtedness.
Assumptions

32Contains Forward-Looking Statements
Adjusted Earnings Per Share, a non-GAAP financial measure, is defined as diluted earnings per share from continuing operations excluding gains or losses of both consolidated entities and entities accounted for under the equity method due to (a) unrealized gains or losses related to derivative transactions, (b) unrealized foreign currency gains or losses, (c) gains or losses and associated benefits and costs due to dispositions and acquisitions of business interests, including early plant closures, and the tax impact from the repatriation of sales proceeds, (d) losses due to impairments, (e) gains, losses and costs due to the early retirement of debt, (f) costs directly associated with a major restructuring program, including, but not limited to, workforce reduction efforts, relocations, and office consolidation; and (g) tax benefit or expense related to the enactment effects of 2017 U.S. tax law reform. The GAAP measure most comparable to Adjusted EPS is diluted earnings per share from continuing operations. We believe that Adjusted EPS better reflects the underlying business performance of the Company and is considered in the Company’s internal evaluation of financial performance. Factors in this determination include the variability due to unrealized gains or losses related to derivative transactions, unrealized foreign currency gains or losses, losses due to impairments and strategic decisions to dispose of or acquire business interests, retire debt or implement restructuring initiatives, which affect results in a given period or periods. Adjusted EPS should not be construed as an alternative to diluted earnings per share from continuing operations, which is determined in accordance with GAAP. For the year ending December 31, 2017, the definition was revised to exclude associated benefits and costs due to acquisitions, dispositions and early plant closures, including the tax impact of decisions made at the time of sale to repatriate proceeds; costs directly associated with a major restructuring program, including, but not limited to, workforce reduction efforts, relocations, and office consolidation; and tax benefit or expense related to the enactment effects of 2017 U.S. tax law reform.
Adjusted Pre-Tax Contribution, a non-GAAP financial measure, is defined as pre-tax income from continuing operations attributable to AES excluding gains or losses of the consolidated entity due to (a) unrealized gains or losses related to derivative transactions, (b) unrealized foreign currency gains or losses, (c) gains or losses and associated benefits and costs due to dispositions and acquisitions of business interests, including early plant closures, (d) losses due to impairments, (e) gains, losses and costs due to the early retirement of debt, and (f) costs directly associated with a major restructuring program, including, but not limited to, workforce reduction efforts, relocations, and office consolidation. Adjusted PTC also includes net equity in earnings of affiliates on an after-tax basis adjusted for the same gains or losses excluded from consolidated entities. The GAAP measure most comparable to Adjusted PTC is income from continuing operations attributable to AES. We believe that Adjusted PTC better reflects the underlying business performance of the Company and is considered in the Company’s internal evaluation of financial performance. Factors in this determination include the variability due to unrealized gains or losses related to derivative transactions, unrealized foreign currency gains or losses, losses due to impairments and strategic decisions to dispose of or acquire business interests, retire debt or implement restructuring initiatives, which affect results in a given period or periods. In addition, for Adjusted PTC, earnings before tax represents the business performance of the Company before the application of statutory income tax rates and tax adjustments, including the effects of tax planning, corresponding to the various jurisdictions in which the Company operates. Adjusted PTC should not be construed as an alternative to income from continuing operations attributable to AES, which is determined in accordance with GAAP. For the year ending December 31, 2017, the definition was revised to exclude associated benefits and costs due to dispositions and acquisitions of business interests, including early plant closures, and costs directly associated with a major restructuring program, including, but not limited to, workforce reduction efforts, relocations, and office consolidation.
Free Cash Flow, a non-GAAP financial measure, is defined as net cash from operating activities (adjusted for service concession asset capital expenditures) less maintenance capital expenditures (including non-recoverable environmental capital expenditures), net of reinsurance proceeds from third parties. AES believes that Free Cash Flow is a useful measure for evaluating our financial condition because it represents the amount of cash generated by the business after the funding of maintenance capital expenditures that may be available for investing in growth opportunities or for repaying debt. Free Cash Flow should not be construed as an alternative to net cash from operating activities, which is determined in accordance with GAAP.
NCI is defined as noncontrolling interests. Parent Company Liquidity (a non-GAAP financial measure) is defined as cash at the Parent Company plus availability under corporate credit facilities plus cash at qualified
holding companies (“QHCs”). AES believes that unconsolidated Parent Company liquidity is important to the liquidity position of AES as a Parent Company because of the non-recourse nature of most of AES’ indebtedness.
Parent Free Cash Flow (a non-GAAP financial measure) should not be construed as an alternative to Net Cash Provided by Operating Activities which is determined in accordance with GAAP. Parent Free Cash Flow is equal to Subsidiary Distributions less cash used for interest costs, development, general and administrative activities, and tax payments by the Parent Company. Parent Free Cash Flow is used for dividends, share repurchases, growth investments, recourse debt repayments, and other uses by the Parent Company.
Subsidiary Liquidity (a non-GAAP financial measure) is defined as cash and cash equivalents and bank lines of credit at various subsidiaries.
Subsidiary Distributions should not be construed as an alternative to Net Cash Provided by Operating Activities which is determined in accordance with GAAP. Subsidiary Distributions are important to the Parent Company because the Parent Company is a holding company that does not derive any significant direct revenues from its own activities but instead relies on its subsidiaries’ business activities and the resultant distributions to fund the debt service, investment and other cash needs of the holding company. The reconciliation of the difference between the Subsidiary Distributions and Net Cash Provided by Operating Activities consists of cash generated from operating activities that is retained at the subsidiaries for a variety of reasons which are both discretionary and non-discretionary in nature. These factors include, but are not limited to, retention of cash to fund capital expenditures at the subsidiary, cash retention associated with non-recourse debt covenant restrictions and related debt service requirements at the subsidiaries, retention of cash related to sufficiency of local GAAP statutory retained earnings at the subsidiaries, retention of cash for working capital needs at the subsidiaries, and other similar timing differences between when the cash is generated at the subsidiaries and when it reaches the Parent Company and related holding companies.
Definitions