the african development bank of a greenfield 420 mw run-of-the river hydro project on the sanaga...
TRANSCRIPT

Investor Presentation
The African Development Bank
April 2018

Overview of the Bank Group 2
Financial Profile of the African Development Bank 23
Capital Market Activities 33
Appendix:
1
2
3
4
A – Financial Statements 40
B – Green Bond Framework 43
C – Social Bond Framework 59
D – African Economic Outlook 71
E – Frequently Asked Questions 77
Table of contents
1

Africa is a continent of contrast, rich in natural
resources yet its people are among the poorest in the
world. The image of Africa that gets projected in the
world is that of a continent with disease, hunger,
corruption and the need for aid beyond foreseeable
future. But, there is another story that is less told which
acknowledges the challenges faced by the continent but
also recognizes the progress made in terms of more
children going to school, less war, growing quest for
better governance and an expanding middle class. The
African Development Bank is part of that story.
Overview of the Bank Group1
The African Development Bank Group
2
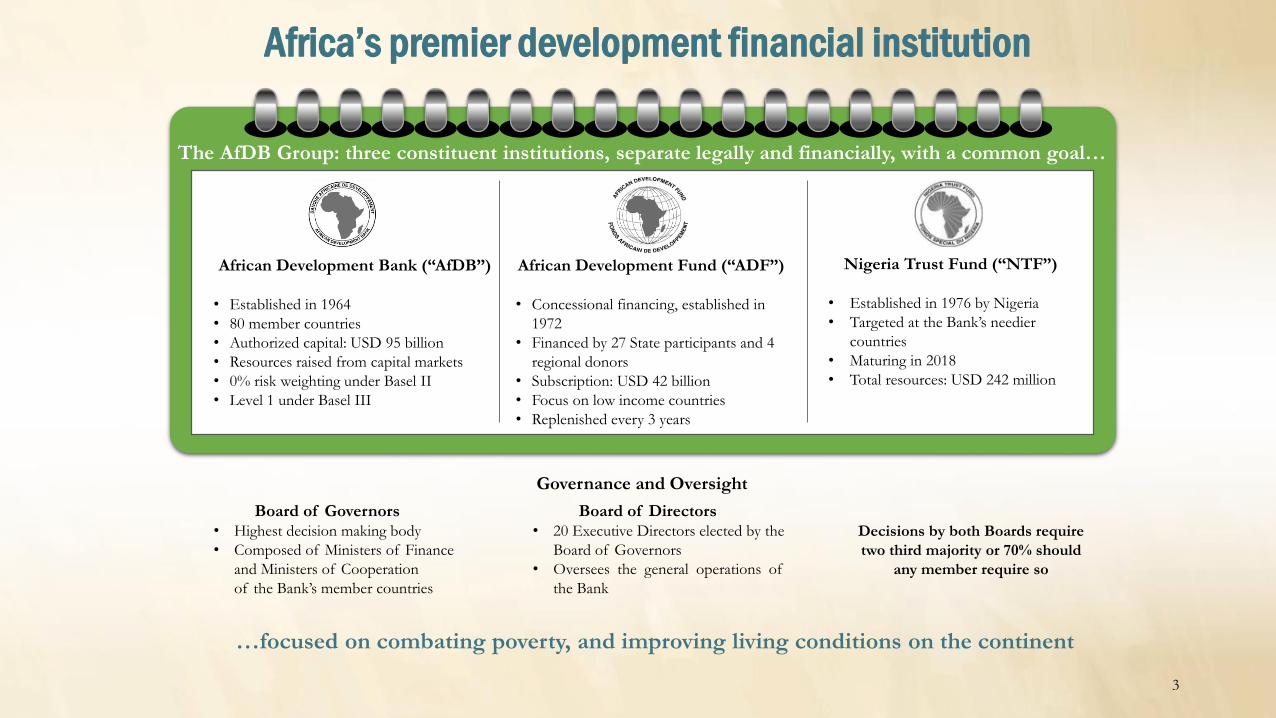
Africa’s premier development financial institution
Board of Governors• Highest decision making body
• Composed of Ministers of Finance
and Ministers of Cooperation
of the Bank’s member countries
Decisions by both Boards require
two third majority or 70% should
any member require so
…focused on combating poverty, and improving living conditions on the continent
Governance and Oversight
Board of Directors • 20 Executive Directors elected by the
Board of Governors
• Oversees the general operations of
the Bank
African Development Bank (“AfDB”)
• Established in 1964
• 80 member countries
• Authorized capital: USD 95 billion
• Resources raised from capital markets
• 0% risk weighting under Basel II
• Level 1 under Basel III
African Development Fund (“ADF”)
• Concessional financing, established in
1972
• Financed by 27 State participants and 4
regional donors
• Subscription: USD 42 billion
• Focus on low income countries
• Replenished every 3 years
Nigeria Trust Fund (“NTF”)
• Established in 1976 by Nigeria
• Targeted at the Bank’s needier
countries
• Maturing in 2018
• Total resources: USD 242 million
The AfDB Group: three constituent institutions, separate legally and financially, with a common goal…
3
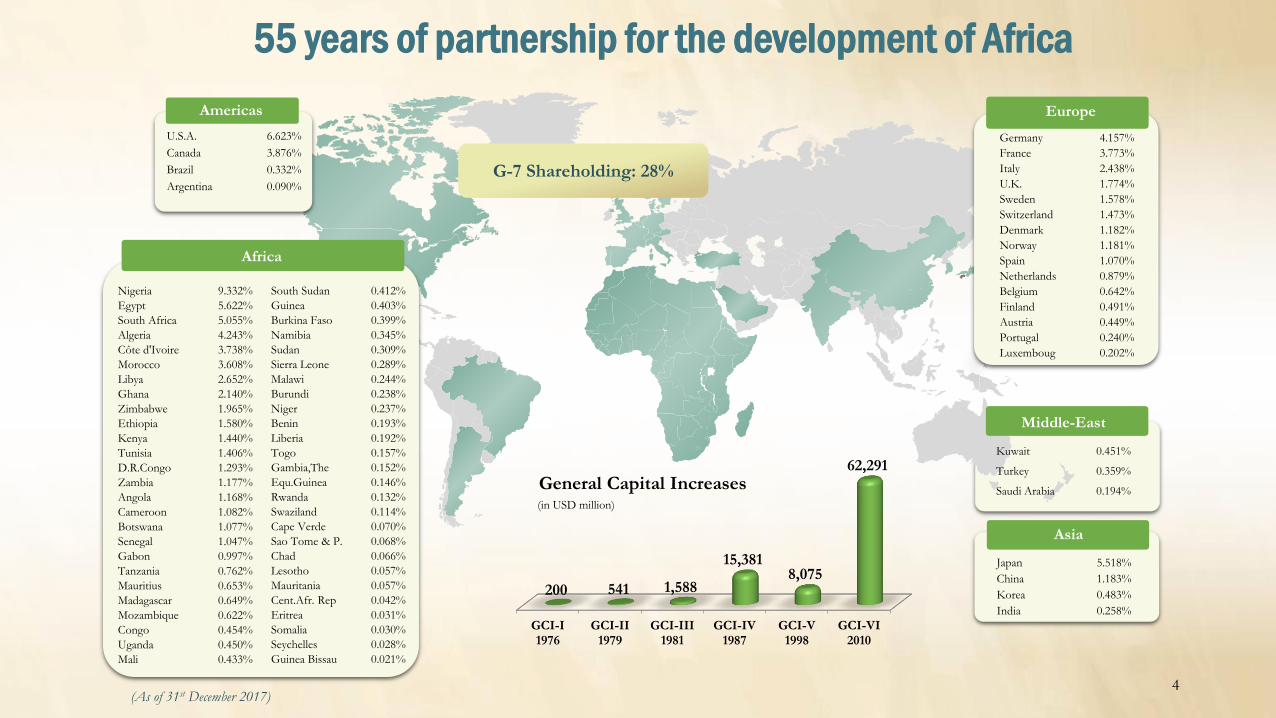
55 years of partnership for the development of Africa
Americas
Africa
Europe
Middle-East
Asia
G-7 Shareholding: 28%
(As of 31st December 2017)
GCI-I1976
GCI-II1979
GCI-III1981
GCI-IV1987
GCI-V1998
GCI-VI2010
200 541 1,588
15,381 8,075
62,291
General Capital Increases(in USD million)
4
Nigeria 9.332%
Egypt 5.622%
South Africa 5.055%
Algeria 4.243%
Côte d'Ivoire 3.738%
Morocco 3.608%
Libya 2.652%
Ghana 2.140%
Zimbabwe 1.965%
Ethiopia 1.580%
Kenya 1.440%
Tunisia 1.406%
D.R.Congo 1.293%
Zambia 1.177%
Angola 1.168%
Cameroon 1.082%
Botswana 1.077%
Senegal 1.047%
Gabon 0.997%
Tanzania 0.762%
Mauritius 0.653%
Madagascar 0.649%
Mozambique 0.622%
Congo 0.454%
Uganda 0.450%
Mali 0.433%
South Sudan 0.412%
Guinea 0.403%
Burkina Faso 0.399%
Namibia 0.345%
Sudan 0.309%
Sierra Leone 0.289%
Malawi 0.244%
Burundi 0.238%
Niger 0.237%
Benin 0.193%
Liberia 0.192%
Togo 0.157%
Gambia,The 0.152%
Equ.Guinea 0.146%
Rwanda 0.132%
Swaziland 0.114%
Cape Verde 0.070%
Sao Tome & P. 0.068%
Chad 0.066%
Lesotho 0.057%
Mauritania 0.057%
Cent.Afr. Rep 0.042%
Eritrea 0.031%
Somalia 0.030%
Seychelles 0.028%
Guinea Bissau 0.021%
U.S.A. 6.623%
Canada 3.876%
Brazil 0.332%
Argentina 0.090%
Kuwait 0.451%
Turkey 0.359%
Saudi Arabia 0.194%
Japan 5.518%
China 1.183%
Korea 0.483%
India 0.258%
Germany 4.157%
France 3.773%
Italy 2.438%
U.K. 1.774%
Sweden 1.578%
Switzerland 1.473%
Denmark 1.182%
Norway 1.181%
Spain 1.070%
Netherlands 0.879%
Belgium 0.642%
Finland 0.491%
Austria 0.449%
Portugal 0.240%
Luxemboug 0.202%

The Bank Group addresses the diverse needs of the continentPreserving the long-term financial integrity of the AfDB
ADF Concessional Financing28 low-income countries are eligible to
receive loans and grants from ADF only
Access to AfDB and ADF
financing9 countries eligible
4 Blend countries (Cameroon, Kenya,
Senegal and Zambia)
5 Countries have been granted access to
AfDB through the revised credit policy
in 2014 (Burkina Faso, Cote d’Ivoire,
Rwanda, Tanzania and Uganda)
Additionality and development
outcome assessment-core indicators
• Job creation
• Government revenues
• Financial return
• Foreign currency earnings
Enclave Finance
Self-sustaining, export oriented
projects, located in ADF-eligible
countries
Private Sector OperationsViable enterprises and multinational
projects with an additionality and development outcome
• Direct loans
• Lines of credits
• Equity participation
• Guarantees
AfDB Sovereign Operations17 middle-income countries eligible to
receive AfDB funding
Criteria :
GNI per capita
Country’s creditworthiness
5
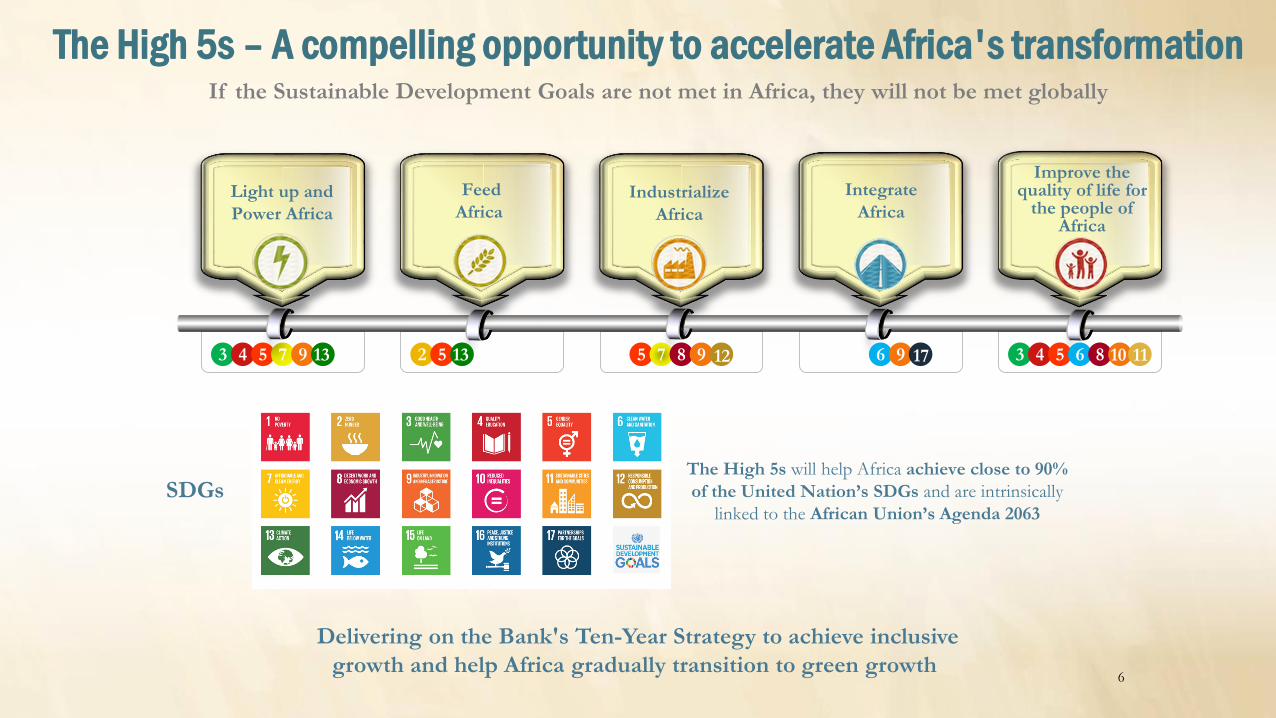
The High 5s – A compelling opportunity to accelerate Africa's transformation
The High 5s will help Africa achieve close to 90%
of the United Nation’s SDGs and are intrinsically
linked to the African Union’s Agenda 2063
If the Sustainable Development Goals are not met in Africa, they will not be met globally
Light up and
Power Africa
Industrialize
Africa
Feed
Africa
Integrate
Africa
Improve the quality of life for
the people of Africa
3 4 5 7 9 13 2 5 13 5 7 8 9 12 6 9 17 3 4 5 6 8 10 11
Delivering on the Bank's Ten-Year Strategy to achieve inclusive
growth and help Africa gradually transition to green growth
SDGs
6

Our 2025 targets
7
Generate 162 GW of
electricity; create 130
million on-grid
connections; add 75
million off-grid
connections; provide
150 million households
with access to clean
cooking energy
Lift 130 million people
out of extreme poverty
while eliminating
hunger and
malnutrition; increase
Africa’s share of
market value for
processed
commodities by 40%
Increase industrial
contribution to GDP
by 130%; double
industrial GDP to USD
1.72 trillion; create 35
special economic
zones; develop and
strengthen 30 Public-
Private Partnerships
Increase intra-African
trade to 52% of total
trade; save USD 172
billion in
transportation costs;
eliminate visa
requirements for
Africans travelling
across Africa
Create 25 million jobs
and impact 50 million
youth by creating
durable labor market
linkages and better
opportunities; USD 30
billion in income gains
for the African
economy
3.8 million people will
get access to electricity
4.9 million Africans
will benefit from
improved food security
19,500 SMEs will
benefit from access to
finance
11 million Africans will
benefit from improved
transportation and
ICT services
19.8 million Africans
will benefit from
better access to water
& sanitation
Development impact from the Bank’s work in 2017
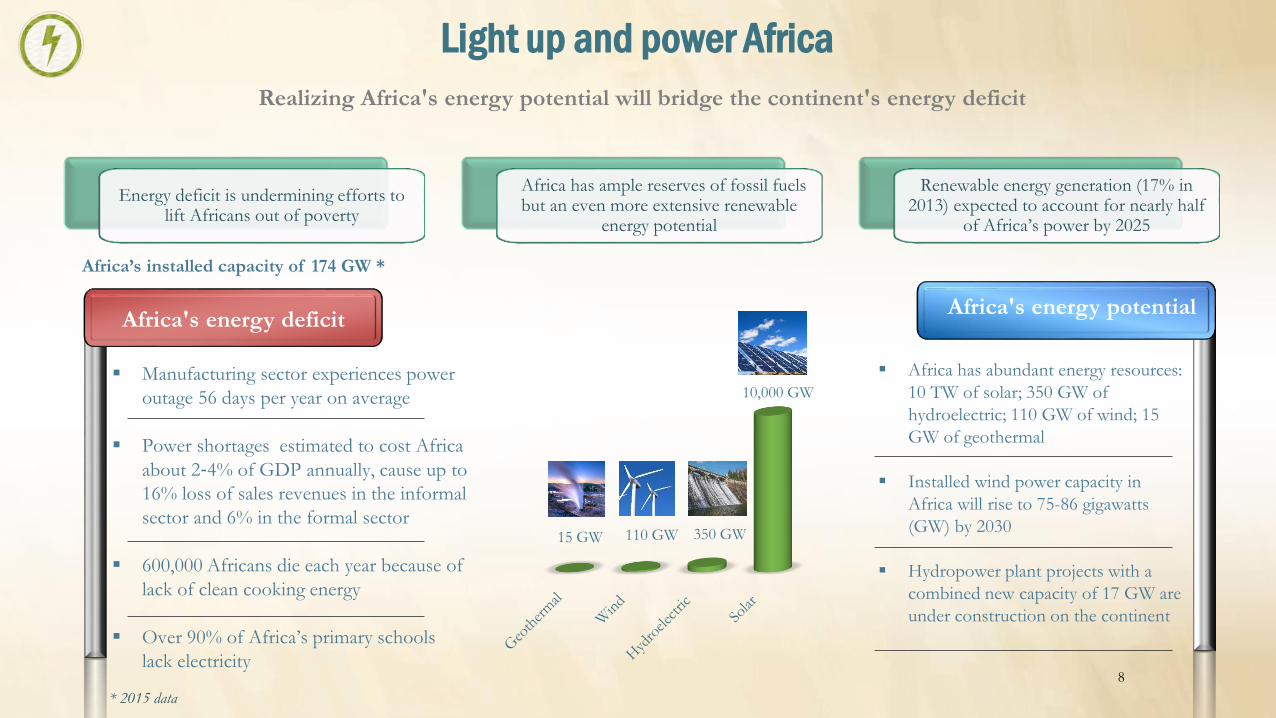
Light up and power Africa
Realizing Africa's energy potential will bridge the continent's energy deficit
Energy deficit is undermining efforts to lift Africans out of poverty
Africa has ample reserves of fossil fuels but an even more extensive renewable
energy potential
Renewable energy generation (17% in 2013) expected to account for nearly half
of Africa’s power by 2025
8
Africa's energy deficit
Manufacturing sector experiences power
outage 56 days per year on average
Power shortages estimated to cost Africa
about 2‐4% of GDP annually, cause up to
16% loss of sales revenues in the informal
sector and 6% in the formal sector
600,000 Africans die each year because of
lack of clean cooking energy
Over 90% of Africa’s primary schools
lack electricity
Africa's energy potential
Africa has abundant energy resources:
10 TW of solar; 350 GW of
hydroelectric; 110 GW of wind; 15
GW of geothermal
Installed wind power capacity in
Africa will rise to 75-86 gigawatts
(GW) by 2030
Hydropower plant projects with a
combined new capacity of 17 GW are
under construction on the continent
15 GW 110 GW 350 GW
10,000 GW
Africa’s installed capacity of 174 GW *
* 2015 data

Transformative projects in 2017
Cameroon
Project cost: EUR 1,122 million –
AfDB financing: EUR 150 million
Project description:
Construction of a greenfield 420 MW run-of-the river hydro
project on the Sanaga river, in South Cameroon
Expected outcomes:
Provide clean, affordable and reliable energy at a competitive
price to end-users to stimulate green and inclusive growth
Increase national installed capacity by 33%
Cameroon’s electrification rate of currently 50% to reach 70%
Electricity access rate to increase from 80% currently to 100%,
providing access to energy for 10 million homes and businesses
Electricity supply to increase from 6,000 to 9,000 GWh
Contribute to reduce use of fossil fuels
GHG emission reduction of 1.35 million tons of CO2 per year
1,500 temporary jobs created during construction and 75
permanent jobs during the operation of the plant (30 years)
Nachtigal Hydro Power Project for clean, affordable and reliable energy
Morocco
Project cost: USD 2,296 million –
AfDB financing: USD 240 million
Project description:
Part of Moroccan Solar Program (NOOR) which aims to develop
total power generating capacity of at least 2,000 MW by 2020 - 1st
project was Ouarzazate complex (580 MW, spread over 4 plants)
Midelt consists in the development of 2 solar power plants
connected to the national grid, with cumulative capacity of up to
800 MW
Expected outcomes:
Total annual output estimated at 1,886 GWh
Electricity supply guaranteed for more than 2 million Moroccans
(6% of the population)
GHG emission reduction of 0.7 million tons of CO2 per year
Reduction in fossil fuel imports thanks to renewable energies
Increase in the share of renewable energies from 33.4% in 2015 to
42% by 2020 and 52% by 2030
3,000 jobs created during construction and 200 during operation
NOOR Midelt Solar Complex Project for the development of renewable energies
9…to light up and power Africa

Creating wealth, improving lives while preserving the environment
Technical assistance to
local farmers, civil
society and governments
to provide policy advice
and capacity building
Climate smart
agriculture practices and
reduction of emissions
from forest degradation
Our Priorities
• Increased productivity and value addition
• Greater investment in infrastructure
• Expanded agricultural finance
• Improved agribusiness environment
• Increased inclusivity, sustainability, and nutrition
• Enhanced partnerships
Our Goals
• End extreme poverty, hunger and malnutrition
• Achieve net export status for agricultural commodities
• Eliminate malnourishment for about 240 million
people
• Double Africa’s share of market value select
processed agricultural commodities
10
USD 1.2 billion invested by the Bank in agriculture in 2017
Africa food challenges
Lack of productivity of African
agriculture
Security of land tenure and good
governance
Climate change and variability trends
Falling commodity prices for a broad
range of natural resources
High level of dependence on food
imports
Opportunities of Agriculture
More than 60% of Africa’s working
population engaged in agriculture
65% of the world’s most arable
uncultivated land located in Africa
Abundance of fresh water supplies
51% of jobs accounted for in
agriculture across the continent

Selected projects to transform agriculture
Cote
d’Ivoire Project cost: EUR 124 million –
AfDB financing: EUR 64 million
Project description:
Reviving promising value chains in agriculture and agro-industry
(rice, maize, cassava, vegetables, pork, fish) in Belier region
Infrastructure development for agricultural activities (irrigation,
roads, storage, marketing facilities, livestock infrastructure,
electric lines, ICT)
Improving living conditions for the people (infrastructure,
classrooms, school canteens, health structures)
Strengthen land security, support mechanization, develop
recruitment of young graduates, facilitate access to financing
Expected outcomes:
461,600 beneficiaries (50% women): 112,000 directly (107,000
lifted out of poverty), 800 young graduates and 200 SMEs
Agricultural produce processing rate to raise from 119,000 tons
currently to 581,000 tons
19,000 permanent jobs to be created
Belier Region Agro-Industrial Pole Project for food and nutritional security
11…to feed Africa
Namibia
Project cost: ZAR 1.42 billion –
AfDB financing: ZAR 1 billion
Project description:
Value Chain Improvement (agricultural mechanization and
certified seed systems improvement)
Enhance agricultural productivity to reduce annual
importation of staple cereals crops/grains, facilitate job
creation and enhance household income
Expected outcomes:
Maize and pearl millet production increased from 1,000 to
47,000 tons and from 4,000 to 162,000 tons respectively
Annual imports of grain/cereal reduced from 60 to 20%
Directly benefit 294,500 crop producers/farmers (54%
women), 10,000 livestock farmers
34 staff trained in agriculture mechanization to transfer
knowledge and skills to beneficiaries
Support 111 farmer cooperatives
111,240 jobs created in agricultural production and processing
Agricultural Mechanism and Seed Improvement Project to improve lives of rural communities
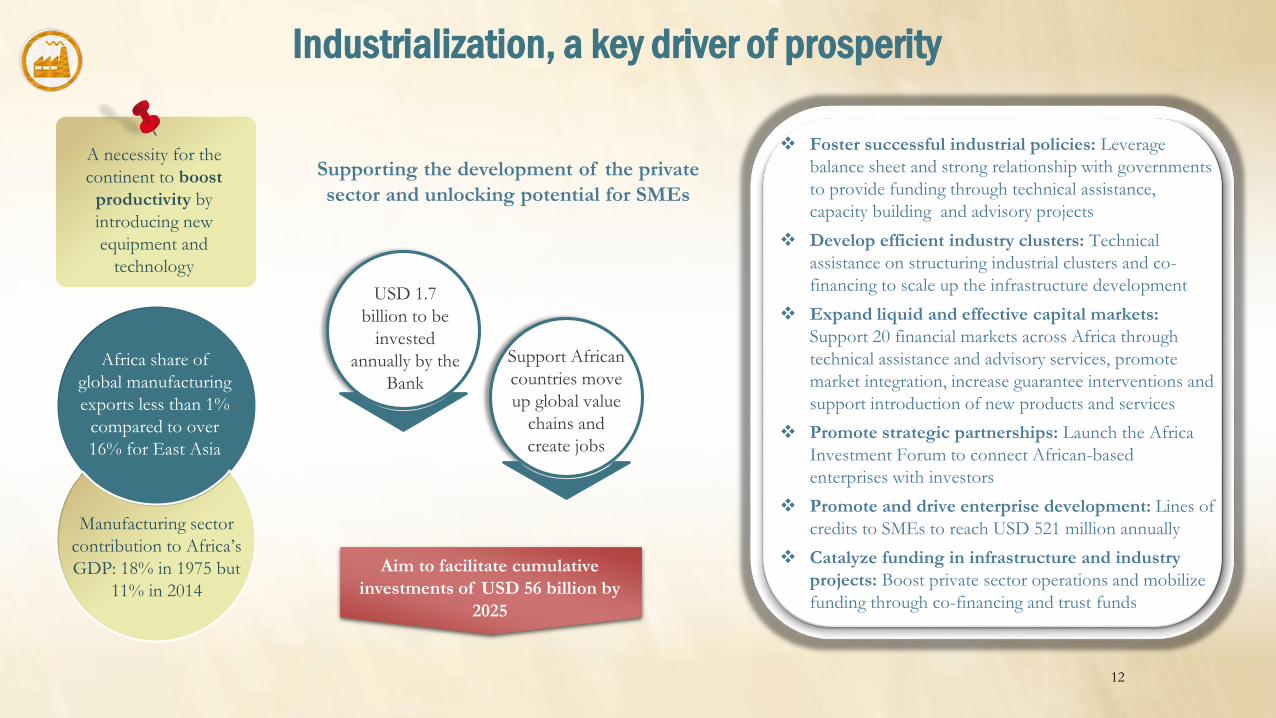
Africa share of
global manufacturing
exports less than 1%
compared to over
16% for East Asia
Manufacturing sector
contribution to Africa’s
GDP: 18% in 1975 but
11% in 2014
Foster successful industrial policies: Leverage
balance sheet and strong relationship with governments
to provide funding through technical assistance,
capacity building and advisory projects
Develop efficient industry clusters: Technical
assistance on structuring industrial clusters and co-
financing to scale up the infrastructure development
Expand liquid and effective capital markets:
Support 20 financial markets across Africa through
technical assistance and advisory services, promote
market integration, increase guarantee interventions and
support introduction of new products and services
Promote strategic partnerships: Launch the Africa
Investment Forum to connect African-based
enterprises with investors
Promote and drive enterprise development: Lines of
credits to SMEs to reach USD 521 million annually
Catalyze funding in infrastructure and industry
projects: Boost private sector operations and mobilize
funding through co-financing and trust funds
Industrialization, a key driver of prosperity
A necessity for the
continent to boost
productivity by
introducing new
equipment and
technology
Supporting the development of the private
sector and unlocking potential for SMEs
USD 1.7
billion to be
invested
annually by the
Bank
Support African
countries move
up global value
chains and
create jobs
Aim to facilitate cumulative
investments of USD 56 billion by
2025
12

Supporting the development of the private sector
Morocco
Project cost : EUR 231 million –
AfDB Financing: EUR 50 Million
Project description:
Design, construction and operation of a Greenfield cement
plant in Ouled Ghanem in Morocco, with annual capacity of
1.1 million tons of clinker and 1.4 million tons of cement
36 years of limestone and clay reserves available on project
site to produce clinker and cement
Cement will be sold locally and up to 20% of clinker will be
exported to West Africa
Expected outcomes:
200 permanent and 30 seasonal jobs created during operation
phase, and 1,000 jobs during construction
Increased forex revenues for Morocco
Support regional integration and intra-Africa trade
Generate tax revenues for the Moroccan Government
Tekcim Cement ProjectMauritius
AfDB Financing: USD 100 million
Project description:
Support Maubank’s corporate strategy including SME
development, to create jobs, notably for the youth, diversify
the economy and grow key sectors like manufacturing and
agribusiness
Expected outcomes:
MauBank to scale-up lending to SMEs in Mauritius.
Increase SME clients from 4,400 to 6,000, including 1,500
women enterprises and 300 youth enterprises
Grow the SME loan portfolio from MUR 3.4 billion
currenty to MUR 10 billion by 2027
Maubank Holdings Limited Project to finance SMEs
13

Integrate Africa is an imperative
Tariffs on intra-regional imports
Powering regional
integration
Develop a vision and strategic framework for the development of regional and continental infrastructure
Create larger, more attractive markets
Link landlocked countries to international markets
Support intra-African trade
Address Africa’s low internal and external trade performances
Our focus
Billions of dollars in potential trade lost because of lack of cross-border production networks
East African
Community0%
Economic Community
of Central African
States & Common
Market for Eastern and
Southern Africa
1.9%
Southern African
Development
Community
3.8%
Economic Community
of West African States5.7%
14
Intra-African trade lowest globally at 15%,
compared to 61% in Asia, 60% in the EU and
41% in the North America Free Trade Area
Poor infrastructure road network,
inefficient transport system
Partial implementation of regional
commitments
Capital outflows obstructed by poorly
developed financial markets
Low labor mobility
Little economic diversification
High trade costs with small markets, scattered
and far from major markets
Roadblocks to integrate Africa

Lake Chad Basin Regional Road Network Integration Project
Project cost : EUR 104 million –
AfDB Financing: EUR 33 millionProject Description:
Construction of 620 meter bridge over Logone River and
a connecting road of 14 km
Rehabilitation of socio-economic infrastructure,
promotion of entrepreneurial activities for women and
youth, construction of markets, classrooms, health centers
Expected outcomes:
Direct beneficiaries are transport system users and
populations living in project area
Trade volume between Cameroon and Chad to increase
from 15% to 20% in 2025
Truck travel time reduced from 3 days to 1 day between
Yaoundé and Ndjamena
Reduced transportation cost
Reduction of flooding, drowning (70 people per year) and
loss of merchandise
Project cost : EUR 113 million –
AfDB Financing: EUR 33 million
15
Improving movement of people and goods between Chad and
Cameroon and unlocking their economic potential
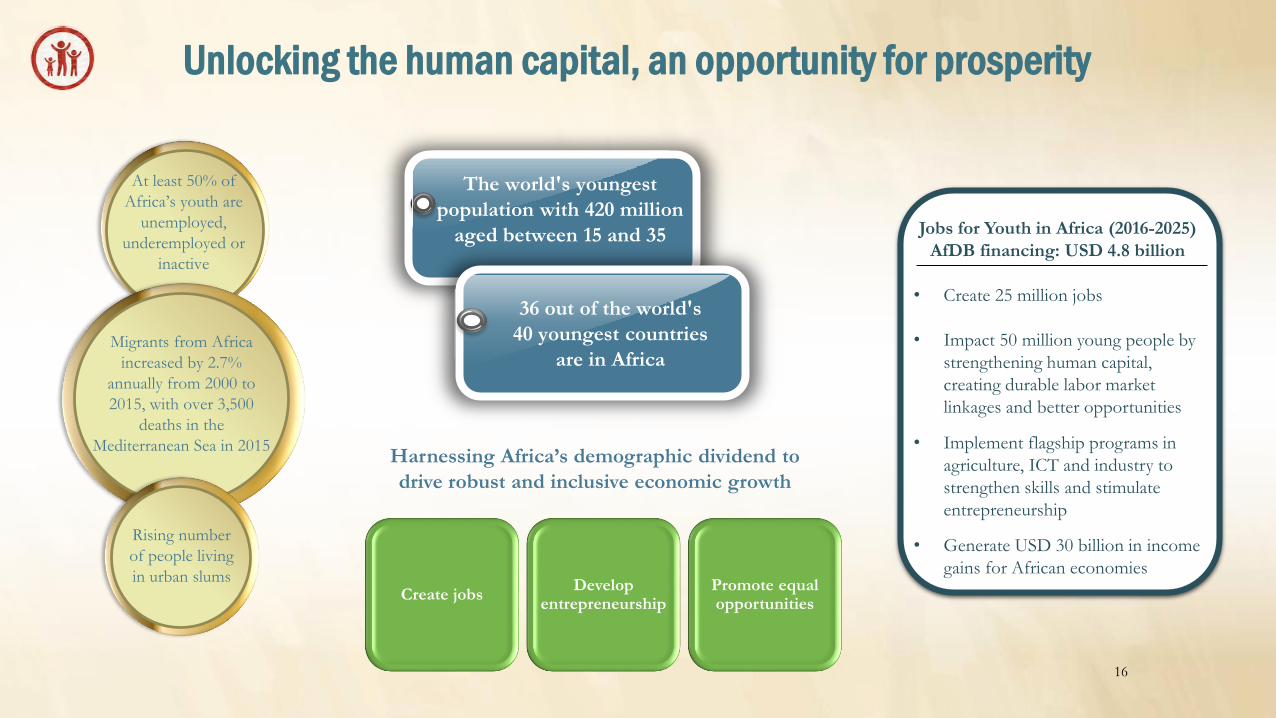
Unlocking the human capital, an opportunity for prosperity
Create jobsDevelop
entrepreneurshipPromote equal opportunities
Harnessing Africa’s demographic dividend to
drive robust and inclusive economic growth
Jobs for Youth in Africa (2016-2025)
AfDB financing: USD 4.8 billion
• Create 25 million jobs
• Impact 50 million young people by
strengthening human capital,
creating durable labor market
linkages and better opportunities
• Implement flagship programs in
agriculture, ICT and industry to
strengthen skills and stimulate
entrepreneurship
• Generate USD 30 billion in income
gains for African economies
At least 50% of
Africa’s youth are
unemployed,
underemployed or
inactive
Migrants from Africa
increased by 2.7%
annually from 2000 to
2015, with over 3,500
deaths in the
Mediterranean Sea in 2015
Rising number
of people living
in urban slums
16
The world's youngest
population with 420 million
aged between 15 and 35
36 out of the world's
40 youngest countries
are in Africa

Improving the quality of life for the people of Africa
Senegal
Project cost : EUR 867 million –
AfDB Financing: EUR 183 million
Project description:
55 km Regional Express Train from Dakar city center to Blaise
Diagne International Airport (AIBD), via Diamniadio, to be
implemented in 2 phases: Dakar-Diamniadio (36 km) and
Diamniadio-AIBD (19 km)
Will transport 113,000 passengers per day and should form the
public transport backbone of Dakar metropolitan area
Expected outcomes:
Direct beneficiaries are users of transport services and the 3.5
million people living in the project area
Reduction in travel time from 108 to 45 minutes in 2019
Increased mobility and reduced congestion
Support the development of Integrated Special Economic Area,
which will create ultimately 75,000 jobs
6,000 direct jobs, 5,000 indirect jobs and 10,000 induced jobs
created per year
GHG emissions reduction of an estimated 337,600 tons of CO2
over the life of the project (40 years)
Dakar-Diamniadio-AIBD Regional Express Train Project - Phase I
Egypt
Project cost : USD 387 million –
AfDB Financing: USD 100 million
Project description:
Protect the environment and water resources from pollution
Reduce health diseases due to discharge of untreated wastewater to
the drains and canals
Enhance water re-use by upgrading the quality of existing primary
treatment system to include secondary treatment and increasing the
treatment plant’s capacity
Treated wastewater will be used in agriculture and will contribute to
improve livelihoods and generate income
Expected outcomes:
Benefit more than 8 million people in project area
Create more than 1,200 job opportunities during implementation
and operation
More than 4,000 indirect jobs are also expected to be created in
various areas, including SMEs in tourism, agriculture, and fisheries
for unskilled, semi-skilled, and skilled persons
Finance the feasibility study for a waste to energy add-on to the
wastewater treatment plant
Sustainable Development of Abu RawashWastewater Treatment Plant
17

2010 2011 2012 2013 2014 2015 2016 2017
6,314
8,782
6,538 6,754
7,316
8,778
10,802
8,652
Sovereign approvals Non-sovereign approvals
In USD million
Record operations to address burning challenges
18
Challenging operating
environment
Serving a larger number of
countries now eligible for
AfDB financing
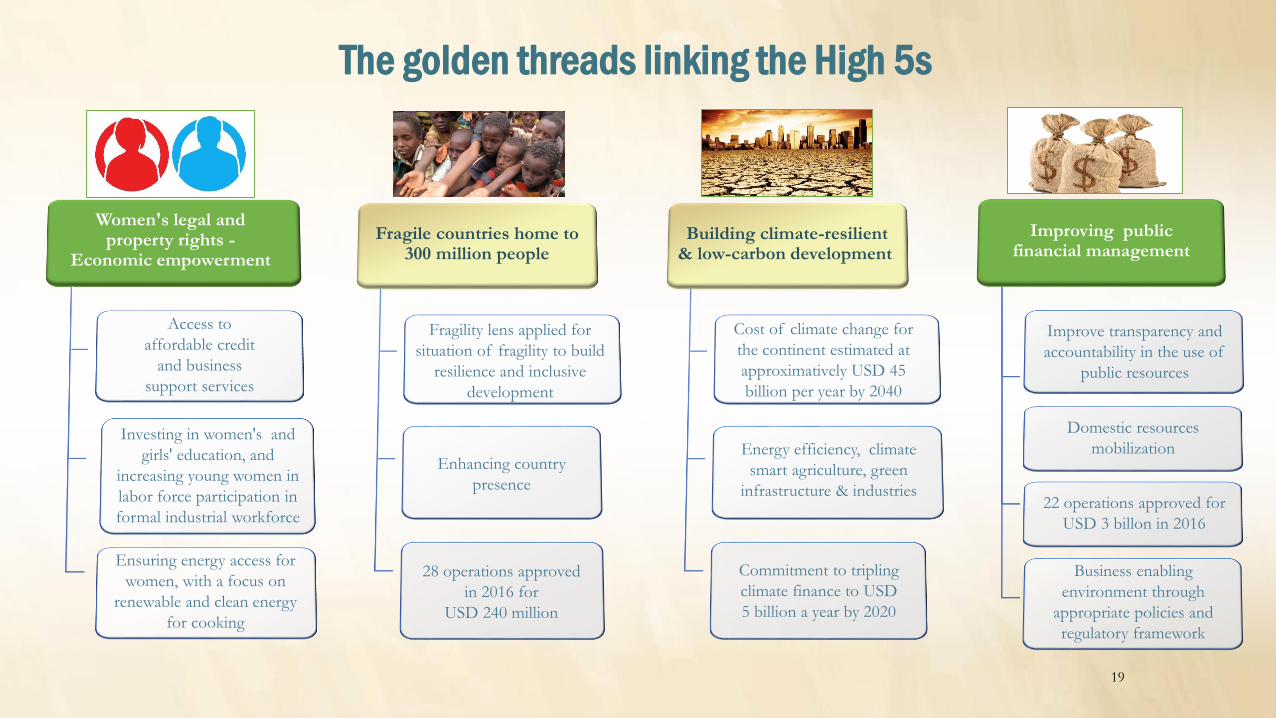
The golden threads linking the High 5s
Women's legal and property rights -
Economic empowerment
Ensuring energy access for
women, with a focus on
renewable and clean energy
for cooking
Access to
affordable credit
and business
support services
Investing in women's and
girls' education, and
increasing young women in
labor force participation in
formal industrial workforce
Fragile countries home to 300 million people
28 operations approved
in 2016 for
USD 240 million
Fragility lens applied for
situation of fragility to build
resilience and inclusive
development
Enhancing country
presence
Building climate-resilient & low-carbon development
Commitment to tripling
climate finance to USD
5 billion a year by 2020
Cost of climate change for
the continent estimated at
approximatively USD 45
billion per year by 2040
Energy efficiency, climate
smart agriculture, green
infrastructure & industries
Improving public financial management
22 operations approved for
USD 3 billon in 2016
Improve transparency and
accountability in the use of
public resources
Domestic resources
mobilization
Business enabling
environment through
appropriate policies and
regulatory framework
19

African countries face a significant threat from climate change
Yet Africa has only received 4% of the global climate finance… 20

A leading role in the path to green growth
21
68% invested in
mitigation
projects 32% invested in
adaptation
projects
USD 2.35 billion of climate finance mobilized by the Bank
in 2017, representing 28% of total lending approvals
Second Climate Change
Action Plan 2016-2020
Target for climate finance to
represent at least 40% of
approvals by 2020
Objective to finance
adaptation and mitigation
in equal proportions
Mobilize significantly mor4e
new and additional climate
finance to Africa
Facility for
Energy
Inclusion
USD 500 million fund to finance small-scale renewable energy projects (off-grid solar PV, mini-grids, independent power producers)
Power generation capacity to increase by 303 MW, improving access to electricity in rural areas with 500,000 new grid connections and 2.8 million off-grid users
GHG emission reduction of 340k tons of CO2 over project life (15 years)
Evolution II
Fund
USD 250 million fund to finance small and medium-sized projects in clean and sustainable energy infrastructure and resource efficiency
Energy generation capacity of 5-150 MW per project Evolution I contributed to GHG emission reduction of 62 million tons of CO2 over
project life (10 years)
Closing funding gaps in small-scale energy infrastructure

Crowding-in resources through co-financing and partnerships
Resource mobilization from various partners in 2017 :
• EUR 10 million from Germany (KfW) to the NEPAD-IPPF
• NOK 25 million from Norway to the Youth Entrepreneurship and Innovation Trust Fund
• GBP 2.6 million from the UK to the Countries in Transition Trust Fund
• USD 3 million from the Rockefeller Foundation to support Job for Youth Program 22
AGTF South KoreaAFDEPSAAFIF
EUR 2.2 billion USD 6 billion USD 2 billion EUR 1.5 billion USD 620 million
Africa Investment
Facility, a co-financing
partnership with the
European Union,
combining loans, grants,
technical assistance and
equity investments to
support
transformational
projects
Japan-Africa Energy
Initiative launched by
the Government of
Japan, to provide
concessional and non-
concessional finance
to support the New
Deal on Energy for
Africa
Africa Growing
Together Fund, a co-
financing fund with
China for sovereign
and non-sovereign
projects in
infrastructure,
transport, energy and
water
Co-financing
agreement with
Agence Française de
Développement to
support projects in all
sectors, focusing on
renewable energy,
climate change,
transport and
agriculture
Co-financing
Agreement with Korea
Exim Bank to provide
loans for sovereign
operations, targeting
energy, infrastructure,
water, ICT, green
growth, agriculture and
human development

Financial Profile of the African Development Bank
The financial position of the AfDB is very
strong. Thanks to its solid capitalization,
ample liquidity buffers and prudent risk-
management framework, the institution has
the capacity to absorb potential shocks
emanating from a turbulent operating
environment. Continued financial and
operational prudence will remain key.
The African Development Bank
2
23

Summary financial information
*Net of Cumulative Exchange Adjustment on Subscriptions
Note: Data converted from UA (Special Drawing Rights of the IMF) to USD at period-end exchange rates
SDRUSD: 1.54000 (2013); 1.44881 (2014); 1.38573 (2015); 1.34433 (2016); 1.42413 (2017)
(in USD million) 2013 2014 2015 2016 2017
Assets 32,335 33,251 35,152 39,963 46,392
Loans 17,619 18,105 17,832 20,295 25,113
Investments 9,372 10,637 11,629 14,237 16,408
Borrowings 19,939 20,828 22,794 27,753 33,005
Equity 8,980 8,809 8,980 8,880 10,101
Paid-in Capital * 4,580 4,730 4,932 5,187 5,854
Reserves 4,400 4,079 4,048 3,693 4,247
Income before distributions 278 220 129 161 368
Subscribed Capital 100,424 94,366 90,741 88,035 93,278
24
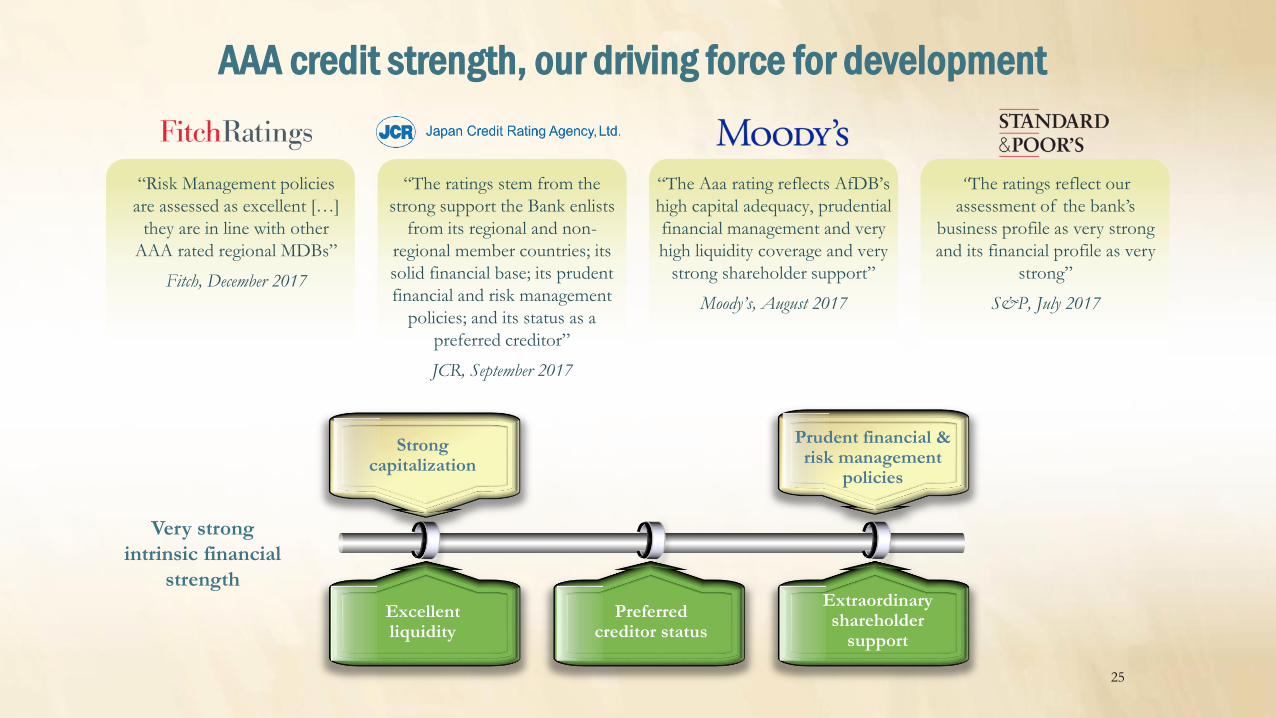
“The Aaa rating reflects AfDB’s
high capital adequacy, prudential
financial management and very
high liquidity coverage and very
strong shareholder support”
Moody’s, August 2017
“Risk Management policies
are assessed as excellent […]
they are in line with other
AAA rated regional MDBs”
Fitch, December 2017
“The ratings stem from the
strong support the Bank enlists
from its regional and non-
regional member countries; its
solid financial base; its prudent
financial and risk management
policies; and its status as a
preferred creditor”
JCR, September 2017
“The ratings reflect our
assessment of the bank’s
business profile as very strong
and its financial profile as very
strong”
S&P, July 2017
AAA credit strength, our driving force for development
Strong capitalization
Prudent financial & risk management
policies
Excellent liquidity
Preferred creditor status
Extraordinary shareholder
support
Very strong
intrinsic financial
strength
25

A solid Bank with a strong financial performance
USD 1.2 billion transferred to key development
initiatives since 2010
African Development Fund USD 400 million
Democratic Republic of Congo Debt Relief Mechanism
USD 585 million
Special Relief Fund USD 80 million
Middle Income Country Trust Fund USD 45 million
2010 2011 2012 2013 2014 2015 2016 2017
364
295
339
234
287
190
273310
Allocation to reserves Allocation to development initiatives
Allocable income
(in USD million)
USD 1.1 billion kept in reserves since 2010 to reinforce
the Bank’s capital
*MDBs: IBRD, IFC, AsDB, EBRD and IADB
0%
20%
40%
60%
80%
2010 2011 2012 2013 2014 2015 2016
Cost-to-income ratio
AfDB
Average of Multilateral Development Banks*
29% increase in net income before distributions
approved by the Board of Governors driven by
Interest earned on increased lending volumes
Performance of treasury investments
Proven
efficiency in the
management
of operations
26

Optimizing balance sheet to expand headroom capacity
* Burkina Faso, Cote d’Ivoire, Rwanda, Tanzania and Uganda
Efficient management of risk capital
Amendment of the Bank's credit
policy (2014)
Providing creditworthy ADF countries*
access to AfDB financing, allowing
more lending, greater diversification in
the sovereign portfolio and reducing
concentration risks
Exposure Exchange Agreement (2015)
For an amount of USD 4.5 billion allowing
to significantly reduce concentration risk,
providing additional lending headroom and
greater diversification to the sovereign
portfolio and improving the Bank's capital
adequacy ratio
Private Sector Credit
Enhancement Facility (PSF)
Increasing the Bank’s lending capacity
by USD 1 billion for private sector
projects in low income countries.
USD 343 million leveraged as of 2016
through 23 projects
Co-financing
Scaling up and mainstreaming co-
financing activities to further stretch
capital and leverage resources from
other partners for high impact
development projects
Syndication and partial guarantees
to crowd-in investments
Program using A/B loan structures
to mobilize financing for non-
sovereign operations and guarantees
used to mitigate political/credit risk
Partial "sell-down" of loans to
external investors
Initial step towards synthetic and true sale
securitization of parts of the Bank's loan
portfolio to recycle capital for new loans
and strengthen our catalytic role. Further
exploring other risk transfer mechanisms
to achieve greater capital efficiency
27

Risk bearing capacity to bolster Africa's transformation
2010 2011 2012 2013 2014 2015 2016 2017
12,596 14,210 16,730 17,619 18,105 17,832
20,295
25,375
Sovereign Non-sovereign
The Bank’s risk appetite: Weighted Average Risk Rating
(WARR) of the portfolio between BB+ (3) and B- (4)
78%
22%In USD million
Defined
prudential and
operational limits
aligned with our
business strategy,
risk appetite and
risk bearing
capacity
Credit enhancement
provided by the
PSF expanding the
Bank’s capacity to
take on riskier
projects with strong
development
outcomes
More lending to
low income
countries to fund
transformational
projects and
programs
28
55%
23%19%
3%0%
18%22%
42%
14%
3%
VERY LOW RISK
(BBB- AND ABOVE)
LOW RISK(BB- TO
BB+)
MODERATE RISK
(B - TO B+)
HIGH RISK(CCC TO
CCC+)
VERY HIGH RISK
(C TO CCC - )
Sovereign Non-sovereign
Strong portfolio credit quality
(as of 31st December 2017)
Increased demand for the AfDB’s
resources in an evolving environment
2.74 (BBB-)
4.02 (B)
3.04 (BB)
2010 2011 2012 2013 2014 2015 2016 2017
Sovereign loans Non-sovereign loans Combined portfolio

A strong capitalization to address Africa’s development needs
4,485
1,733
946369
332 81
-265
7,679
10,101
(in USD million)
* Diversification benefit stems from correlation between risks
Available
risk
capital
(22%)
Risk
capital
utilized
(78%)
Risks assumed by the Bank through its operations currently
remain within its total available risk capital
2010 2011 2012 2013 2014 2015 2016 2017
7,424 7,494 8,207
8,980 8,809 8,980 8,880
10,101
Reserves Paid-in capital
Risk capital base boosted by GCI-VI
payments and transfers to reserves
(as of 31st December 2017)
(in USD million)
29
USD 1 billion of additional
paid-in capital expected from
2018 to 2026

Prudential ratios closely monitored to protect stakeholders
30
Positive impact
of GCI-VI on
prudential ratios
84%
55%50% 48%
52%58%
73%81%
53%
40%
24% 25% 26% 28%35%
42%
100%
2010 2011 2012 2013 2014 2015 2016 2017
Leverage ratio Gearing ratio
The Bank’s key prudential ratios remain
below their statutory threshold
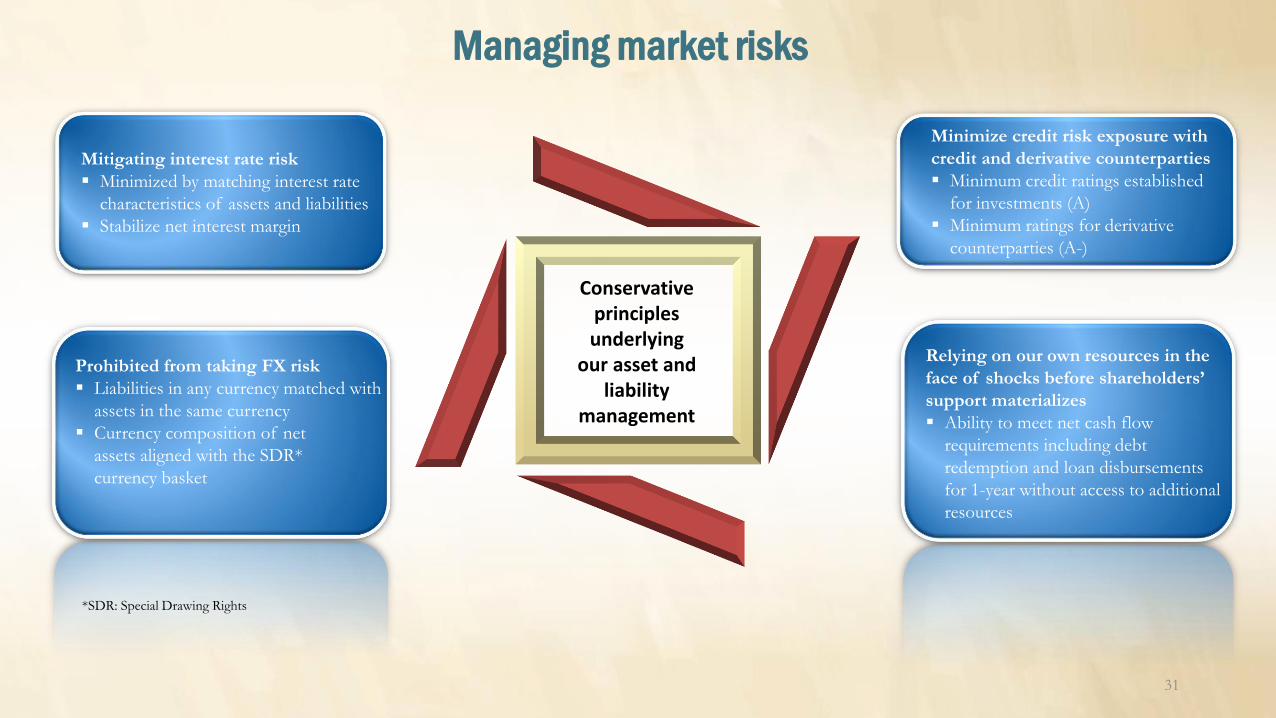
Mitigating interest rate risk
Minimized by matching interest rate
characteristics of assets and liabilities
Stabilize net interest margin
Prohibited from taking FX risk
Liabilities in any currency matched with
assets in the same currency
Currency composition of net
assets aligned with the SDR*
currency basket
Minimize credit risk exposure with
credit and derivative counterparties
Minimum credit ratings established
for investments (A)
Minimum ratings for derivative
counterparties (A-)
Relying on our own resources in the
face of shocks before shareholders’
support materializes
Ability to meet net cash flow
requirements including debt
redemption and loan disbursements
for 1-year without access to additional
resources
*SDR: Special Drawing Rights
Conservative principles underlying
our asset and liability
management
Managing market risks
31

Prudent investment policy underpins our strong liquidity profile
AAA50%
AA+ to AA-41%
A+ and lower
9%
Investment Strategy
Capital preservation
Liquidity Return
USD 9.5 billion held at fair value trading
portfolio to meet short-term liquidity needs
USD 6.9 billion held at amortized cost portfolio
to stabilize net interest margin
USD EUR CNY GBP JPY SEK CHF ZAR
8,247
5,178
1,033 900 615 35082 2
(As of 31st December 2017)
USD 16.4 billion multi-currency portfolio
82.5%
13.4%
2.4% 1.6% 0.1%
Supra, Sov& Agencies
CoveredBonds
Corporatebonds
Moneymarkets
ABS*
High quality investments(As of 31st December 2017)
(in USD million)
* AAA rated only
Two sub-treasury portfolios
Generating
investment
income
redeployed to
increase the
Bank’s lending
and development
impact
1.80%
1.50%1.40% 1.40%
1.50%
2013 2014 2015 2016 2017
Portfolio performance
32
USD EUR CNY GBP JPY CHF ZAR Others

The African Development Bank
Capital Market Activities3
33

Leveraging our AAA to meet Africa’s development needs
2009 2010 2011 2012 2013 2014 2015 2016 2017 2018
7.5
2.8 3.8
3.8 5.6
4.4 3.9
9.9 9.8
8.0
(in USD billion)
(As of 31st December 2017)
34
“AfDB’s funding profile remains very diverse in terms of investor base, currency and maturity” Standard & Poor’s, July 2017
A growing borrowing program
aligned to our lending activities
A diversified funding profile in various markets and
currencies across the world
“Market access remains excellent” Fitch, December 2017
“As a very active global benchmark issuer, the Bank benefits from ample access to global and local capital markets at very favorable terms, and from a large and diversified investor base across regions and local currencies” Moody’s, August 2017
Attracting competitive funding levels for the benefit of the African continent
Promote African capital
markets by issuing local
currency bonds
Deepening and widening our investor base
across the world
Catering the needs of Socially
Responsible Investors
Strong track record in
issuing liquid global
benchmarks
Outstanding
borrowings
of USD 33
billion

Larger size USD benchmarks seal widespread name recognition
42%36%
14%8%
36%
46%
11%6%
Europe Americas Asia Africa &Middle-East
…Deepening and widening the Bank’s investor base
64%
23%13%
48%
34%
18%
Central Banks &Official Institutions
Asset Managers Banks
Allocations Orders
35
Strategic repositioning as a more liquid issuer
3-year USD 2.5 billion
1.875% due March 2020
US Treasuries + 25.8 bps
Midswaps + 3 bps
BAML/Daiwa/Goldman
Sachs/JP Morgan/TD
Securities
5-year USD 2 billion
2.125% due November
2022
US Treasuries + 19.35 bps
Midswaps + 12 bps
Barclays/BNP/Citigroup/
JP Morgan/Wells Fargo
March 2017 October 2017
3-year USD 2 billion
2.625% due March 2021
US Treasuries + 26.35 bps
Midswaps -1 bp
BAML/Barclays/BMO/
Nomura/TD
March 2018
Largest AfDB
transactionLargest 5-year USD
benchmark issuance
AAA rating and strong fundamentals
High quality of execution
Secondary market performance
High quality order books
Strong developmental mission
Successful transactions confirming investors’
confidence in the Bank’s credit story
“AfDB impresses with sub-libor dollar threes as swap spreads rise. The African Development Bank was awash with superlatives from SSA bankers watching on jealously as it printed a $2bn March 2021 global through mid-swaps…”, March 2018
Largest
orderbook
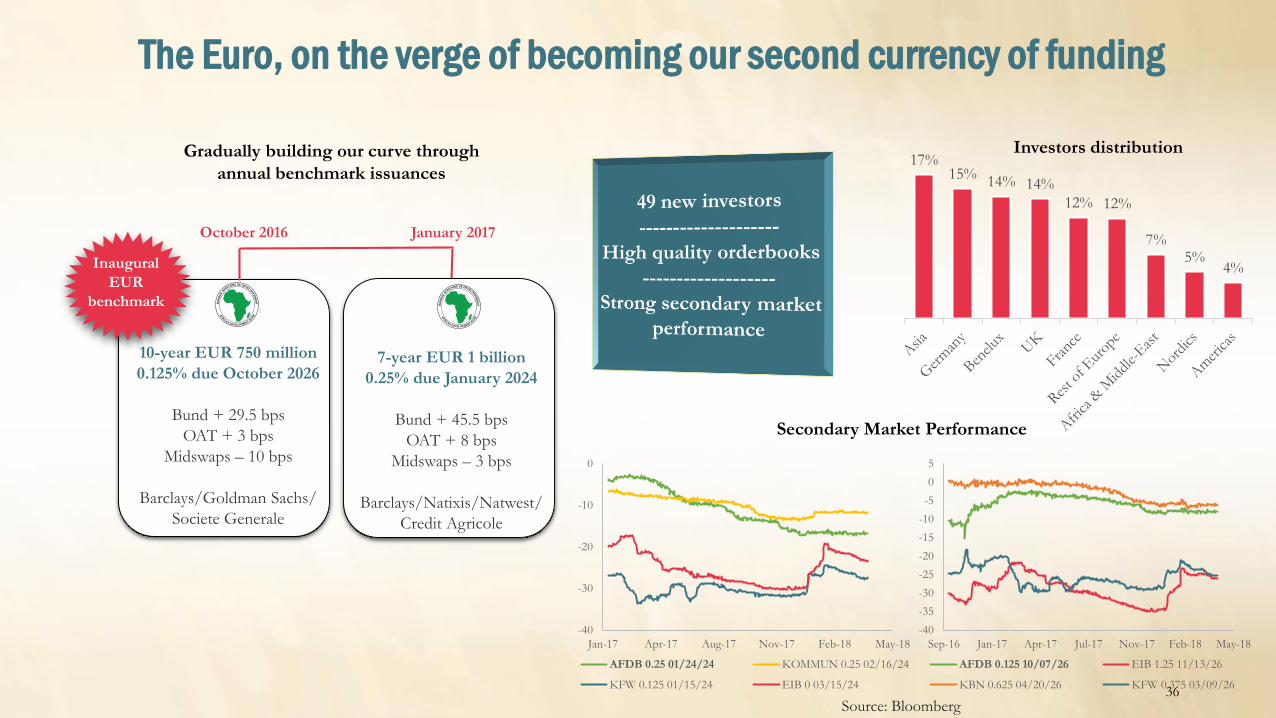
The Euro, on the verge of becoming our second currency of funding
17%15%
14% 14%
12% 12%
7%5%
4%
36
Investors distribution
10-year EUR 750 million
0.125% due October 2026
Bund + 29.5 bps
OAT + 3 bps
Midswaps – 10 bps
Barclays/Goldman Sachs/
Societe Generale
7-year EUR 1 billion
0.25% due January 2024
Bund + 45.5 bps
OAT + 8 bps
Midswaps – 3 bps
Barclays/Natixis/Natwest/
Credit Agricole
October 2016 January 2017
Gradually building our curve through
annual benchmark issuances
Secondary Market Performance
Inaugural
EUR
benchmark
-40
-30
-20
-10
0
Jan-17 Apr-17 Aug-17 Nov-17 Feb-18 May-18
AFDB 0.25 01/24/24 KOMMUN 0.25 02/16/24
KFW 0.125 01/15/24 EIB 0 03/15/24
-40
-35
-30
-25
-20
-15
-10
-5
0
5
Sep-16 Jan-17 Apr-17 Jul-17 Nov-17 Feb-18 May-18
AFDB 0.125 10/07/26 EIB 1.25 11/13/26
KBN 0.625 04/20/26 KFW 0.375 03/09/26
Source: Bloomberg

A reference issuer in the Kangaroo market
37
February 2018
15-year AUD 50.4 million
3.556% due August 2033
BBSW + 45 bpsBNP Paribas
January 2018
10-year AUD 380 million
3.35% due August 2028
BBSW + 44 bpsDaiwa
“Improve the quality of life for
the people of Africa” theme
bond
20 bond increases executed
Close to AUD 1 billion issued
83% increase in issuance
volume vs 2016
Highlights of 2017
September 2017
10-year AUD 80 million
3.345% due September 2027BBSW + 46 bps
Daiwa
First “Industrialize
Africa” theme bond
January 2017
10-year AUD 50 million
3.30% due July 2027
BBSW + 51 bpsMizuho
250300
1150
650
350 330
565
110
535
11550
Feb2019
Feb2020
Mar2022
Mar2024
Jan 2025 Jun2026
Jul 2027 Sep2027
Aug2028
Dec2031
Aug2033
(In AUD million)
AUD 4.4 billion outstanding
Kangaroos across 12 maturities
First Green
Kangaroo
December 2016
AFRICAN DEVELOPMENT
BANK3.50% Green Bond
AUD 55,000,000 KangarooDue 2031
“Best AUD Bond”
EMEA Finance

Financing inclusive and sustainable growth in Africa
38
MXN
BRL
AUDUSD
TRY
SEK
ZAR
IDR
INR
10-year SEK 733 million
“Light up and power Africa” theme bond
1.245% due September 2027
2017 “Global deal of the Year”
award by
Multi-currency theme bonds linked to the High 5s
catering to Japanese Socially Responsible Investors
Contributing to GHG emission reduction of approximately 43 million tons of CO2
USD 500 million matured Oct 2016
USD 500
million due Dec
2018
SEK 1 billion
due Feb 2019
SEK 1 billion
due March 2019
SEK 1.25
billion due June
2022
AUD 110
million due Dec
2031
A credible and transparent Green Bond framework to
finance climate change mitigation and adaptation
Water supply & sanitation
Education & vocational training
Healthcare
Job creation
Last mile connectivity
Information and communication technologies
Food security
Financial inclusion
Gender
Showcasing concrete actions to alleviate poverty on the continent
Social BondEUR 500 million
0.25% due November 2024
Credit Agricole, HSBC, Goldman Sachs
“Overall, Sustainalytics is of
the opinion that the AfDB’s
Social Bond Framework is
credible and transparent, and
aligns with the four pillars of
the Social Bond Principles
2017”, September 2017
Orderbook exceeded EUR 1.5 billion with
69 orders
Strong participation from 23 SRI
investors
3 times oversubscription in
150 minutes

43
117
87
15
176
68
2012 2013 2014 2015 2016 2017
A relevant and responsive development partner for AfricaExpanding the Bank’s African borrowing and lending currencies
A reference issuer in
offshore African
currency linked notes
In USD million
NGN
UGX
GHS
ZAR
ZAR
ZMW
ZAR
NGN
GHS
NGN
ZAR
BWP
39
Continuous work with African governments and regulators for
approvals to issue local currency debt
Botswana
BWP 5 billion
MTN program
Nigeria
NGN 160 billion
MTN program
Uganda
UGX 125 billion
MTN program
Zambia
ZMW 160 million
MTN program
South Africa
ZAR 20 billion
inward listing
program

The African Development Bank
Appendix
A. Financial Statements
4
40

Year ended 31 December 2017 2016 2015 2014 2013
Operational Income and Expenses
Loans and related derivatives 459.29 369.19 314.78 317.92 296.78
Income from Investments and related derivatives 195.04 155.71 122.21 132.41 131.25
Income from Other Securities 2.15 3.78 3.73 3.85 3.95
Total income from Loans and Investments 665.76 536.02 455.78 460.52 441.42
Interest and amortized issuance costs (428.92) (373.05) (346.13) (375.96) (302.99)
Net interest on borrowing-related derivatives 154.02 196.26 217.62 245.42 150.08
Unrealized losses on borrowings, related derivatives and others 48.13 (68.04) (38.81 (36.73) 46.82
Provision for Impairment on Loan Principal and Charges Receivable (16.97) (67.81) (65.43) (18.02) (41.14)
Provision for Impairment on Equity Investments (0.02) 0.16 0.43 0.75 0.76
Provision for Impairment on Investments - - - - 9.19
Translation Gains/(Losses) (1.45) 1.00 14.61 (4.07) 13.33
Other Income 3.61 9.51 2.30 3.39 3.03
Net Operational Income 426.46 261.49 229.65 282.20 302.98
Administrative Expenses (147.77) (130.06) (122.00) (123.16) (110.97)
Depreciation – Property, Equipment and Intangible Assets (15.22) (10.04) (9.05) (7.61) (6.70)
Sundry (Expenses)/Income (5.04) (1.32) (5.44) 0.26 (4.98)
Total Other Expenses (168.03) (141.42) (136.49) (130.50) (122.65)
Income before Distributions Approved by the Board of Governors 258.43 120.07 93.16 151.70 180.33
Distributions of Income Approved by the Board of Governors (82.00) (95.00) (124.00) (120.00) (107.50)
Net Income for the Year 176.43 25.07 (30.84) 31.70 72.83
1 UA = 1 SDR = 1.54000 (2013) ; 1.44881 (2014) ; 1.38573 (2015) ; 1.34433 (2016) ; 1.42413 (2017)
AfDB Income Statement (UA million)
41

AfDB Balance Sheet highlights (UA million)
Year ended 31 December 2017 2016 2015 2014 2013
Assets
Cash 1,173.10 1,306.82 1,214.61 406.71 954.13
Demand Obligations 3.8 3.8 3.8 3.8 3.8
Treasury Investments 11,521.07 10,590.04 8,392.26 7,341.62 6,058.45
Derivative Assets 717.02 1,233.75 1,454.62 1,143.68 985.96
Non-Negotiable Instruments on Account of Capital 0.08 0.16 0.27 0.74 1.2
Accounts Receivable 594.97 543.83 489.54 640.16 843.86
Outstanding Loans 17,818.24 15,348.44 13,070.40 12,647.81 11,585.84
Hedged Loans – Fair Value Adjustment 54.45 80.23 79.84 112.7 32.49
Equity Participations 781.22 719.38 703.27 596.82 525.01
Other Securities - 54.36 46.42 94.11 82.9
Other Assets 96.37 97.7 93.56 79.46 41.22
Total Assets 32,575.73 29,727.09 25,346.74 22,950.83 20,996.72
Liabilities, Capital and Reserves
Accounts Payable 1,255.59 1,615.99 1,332.38 1,211.81 1,246.11
Derivative Liabilities 1,051.63 861.27 1,084.99 853.74 971.85
Borrowings 23,175.69 20,644.15 16,449.27 14,375.95 12,947.44
Capital Subscriptions Paid 4,268.81 4,019.88 3,727.69 3,438.23 3,147.08
Cumulative exchange adjustment on subscriptions (158.04) (161.04) (168.84) (173.54) (172.65)
Reserves 2,982.05 2,746.84 2,921.25 2,815.32 2,856.88
Total Liabilities, Capital and Reserves 32,575.73 29,727.09 25,346.74 22,950.83 20,996.72
421 UA = 1 SDR = 1.54000 (2013) ; 1.44881 (2014) ; 1.38573 (2015) ; 1.34433 (2016) ; 1.42413 (2017)

The African Development Bank
Appendix
B. Green Bond Framework
4
43

AfDB’s Green Bond framework
Portfolio selection
• AfDB eligibility criteria for Green Bond linked to the climate finance tracking methodology
Monitoring and reporting
• Impact assessment of projects: metrics : positive outcome of the investment
• Disclosure on disbursements & deployment of proceeds
• Update on projects
External assurance
• Certification process: Second opinion from CICERO
Management of proceeds
• Pipeline of projects
• Disbursement of eligible projects
• Semi-annual allocation of proceeds to green projects to be approved by ALCO
Investor Marketing
• Updates through roadshows and targeted communications
• Respond to Investor queries
• ESG rating
…Aligned to the Green Bond Principles44
“A clear impression of an institution
that is well aware of the challenges
posed by climate change as well as
other environmental and social
concerns that may be associated with
investments projects. In particular we
are pleased with the consciousness
shown towards the external impacts of
projects both across space and time”.
CICERO, September 2013

AfDB guiding principles for climate finance tracking
Projects reducing vulnerability of human or natural systems to climate change by maintaining or
increasing adaptive capacity and resilience
Projects leading to significant GHG emissions
reductions over the lifetime of the asset
Only projects whose financing can be qualified in full as promoting either low-carbon or climate resilient
development will be considered for the Bank’s
Green Bond portfolio
Adaptation
Mitigation
Eligible projects for the Green Bond portfolio
45

What can be financed with AfDB Green Bonds?
Greenfield Renewable Energy Generation (e.g. solar, wind, geothermal, and ocean power)
Biosphere conservation projects (reduce emissions from deforestation and degradation of ecosystems)
Solid Waste Management (e.g. incineration of waste, landfill gas capture and landfill gas combustion)
Demand-side Brownfield and Greenfield Energy Efficiency (e.g. energy efficiency improvements in lighting and equipment; retrofit of transmission lines, substations or distribution systems to reduce technical losses)
Vehicle energy efficiency fleet retrofit or urban transport modal change
Water Supply and Access (e.g. water-saving measures such as introduction of less water intensive crops or preservation of soil moisture and fertility)
Urban Development (e.g. rehabilitation and upgrade of urban water drainage systems in areas vulnerable to frequency and/or severity of flash floods and storm surges brought by climate change)
Industrial Processes (reduce GHG emissions from industrial processes improvements and cleaner production)
Fugitive emissions and carbon capture (e.g. carbon capture and storage, reduction of gas flaring or methane fugitive emissions in the oil and gas industry, coal mine methane capture)
46

Project evaluation & selection
Bank’s Methodology for Tracking Climate Adaptation and
Mitigation Finance
Bank’s Environmental
Strategy permeates design
of all projects
ALL PROJECTS
APPLICATION OF GREEN
BOND FRAMEWORK
SCREENING AND SELECTION OF PROJECTS
ACCORDING TO THE CLIMATE FINANCE
TRACKING METHODOLOGY
GREEN BOND
ELIGIBLE PROJECTS
BOND
PROCEEDS
SEMI-ANNUAL
ALLOCATION
USD
EUR ZAR
Joint Multilateral Development Bank (MDB) Report on
Adaptation/ Mitigation Finance
47

Allocation of proceeds
TREASURY
USD
EUR ZARBOND
PROCEEDS SEMI-ANNUAL ALLOCATION
GREEN BOND ELIGIBLE PROJECTS
An amount equal to the net proceeds of the bonds will be kept in the treasury liquidity portfolio and tracked in an
appropriate manner through an attested formal internal process that assures the link of net proceeds to AfDB’s lending
operations in the fields of climate change adaptation and mitigation
(“eligible green projects”)
So long as the bonds are outstanding, the balance of net proceeds will be
reduced at the end of each semester, under the Bank’s debt allocation
framework, by amounts matching the disbursements made during the semester in respect of eligible
projects/loans*
* Pending such disbursements, net proceeds will be held in the Bank’s liquidity portfolio and invested under the same conservative investment guidelines as other ordinary capital resources 48

Case study: Itezhi-Tezhi Hydro Project in Zambia
Electricity generation of clean hydro power will save anestimated 360,000 tons of CO2 emissions per year
As a category 1 project, full ESIA conducted
A positive environmental externality of USD 39 millionminimum expected to be created
For the 404 persons affected by the project, full ResettlementAction Plan prepared and implemented in accordance with theBank’s policy on involuntary resettlement including supportingthe vulnerable to relocate.
A budgetary allocation provided by Zambia Energy UtilityCompany (ZESCO) to ensure fair and timely compensation ofproject affected persons
Addressing the potential negative effects of large hydro projects
49
AfDB Green Bond portfolio contains 2 large hydro projects:
ONEE Integrated Wind/Hydro Project in Morocco
Itezhi-Tezhi Hydro Project in Zambia
AfDB Green Bonds can only finance large hydro if net emission reductions can be demonstrated (i.e. emission
reductions from replacing fossil fuel minus emissions generated from creating the reservoir )
Dam projects involving
construction of a reservoir of 1,000
ha or more affecting land used by local
populations
Power
transmission lines
of more than 110
kV crossing highly
populated,
forested or
cultivated areas
Power
generation plants
with capacity of
more than 30
MW
Full Environmental and Social Impact Analysis
(ESIA) needed if any criteria here below are met
Share of large hydro projects in the Bank’s
Green Bond portfolio was 6.74% in 2017

Environmental, Social & Governance Credentials
CSR rating: Advanced (improvement of 10 points vs 2014)
50
“AfDB’s overall Corporate Social Responsibility performance is
considered “Advanced” in absolute terms (63/100) and it has
significantly increased since last review.”
“AfDB displays an homogeneous approach to the management
of its ESG impacts, achieving an advanced performance in all
the three pillars. ... The institution Environmental strategy
addresses the material issues related to its business operations,
and environmental and climate safeguards are implemented”.
Vigeo, August 2016
“AfDB has moderately high exposure to credit risks arising from
the environmental impact of the countries and activities it
finances. The Bank's strong set of environmental policies and
formalized ESG risk management systems place it in a strong
position to mitigate the environmental risk inherent in the
projects and activities it finances..”
MSCI ESG Research, June 2017
“The company acknowledges climate change as a major
challenge and states its commitment to reduce greenhouse gas
emissions stemming from its own operations. In addition the
company is committed to reducing some of the emissions in the
corporate value chain (e.g. lending and investment activities)
through the endorsement of renewable energies and/or clients'
energy efficiency.”
Oekom Corporate Rating, January 2018
ESG rating: A (unchanged vs 2014)

Green unpacked: commitment to transparency
51
AfDB’s Green Bond Framework Cicero’s Second Opinion Vigeo’s ESG Rating List of eligible projects in the Green Bond portfolio List of Green Bond issues AfDB’s Green Bond newsletter
Dedicated Green Bond webpage
Impact reporting: Renewable energy capacity constructed or rehabilitated Annual energy savings Annual energy produced Annual GHG emission reduced or avoided Volume of water saved/treated Annual catchment of water Other indicators (job creation)
Annual Green Bond newsletter
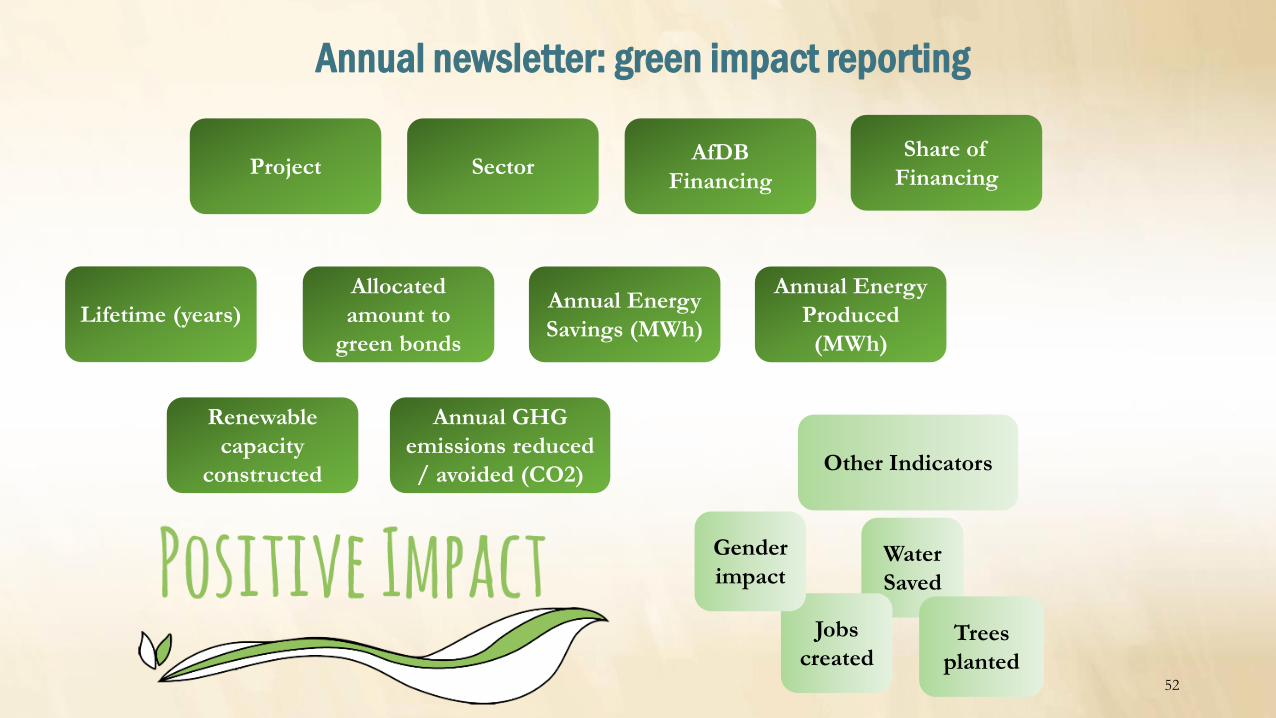
Project SectorAfDB
Financing
Share of
Financing
Allocated
amount to
green bonds
Lifetime (years)Annual Energy
Savings (MWh)
Annual Energy
Produced
(MWh)
Renewable
capacity
constructed
Annual GHG
emissions reduced
/ avoided (CO2)Other Indicators
Water
Saved
Jobs
createdTrees
planted
Gender
impact
Annual newsletter: green impact reporting
52

Green Bond impact reporting (1) – Selected renewable energy/energy efficiency projects
Brief Project Profile Country Sector
AfDB
financing
(USD
mn)
AfDB
share of
financing
Allocated
amount to
Green
Bonds
(USD)
mn)
Expected
economic
life/financial
life
(years)
Annual energy
produced
(MWh)
Renewable
energy
capacity
constructed
or
rehabilitated
(MW)
Annual GHG
emissions
reduced or
avoided (in tons
CO2e)
Other Indicators
Uganda Rural Electricity Access Project, Uganda
The project aims to build distribution networks to evacuate renewable energy
generated from a hydropower source, and to provide last-mile connections to
the grid for rural households, businesses and public institutions. This will help
replace diesel based energy generation with renewably generated electricity, as
well as limit deforestation.
Uganda Solar 100 82% 0.5 20 0 0 38,713
- 992 direct jobs created during
construction (198 women) and 88
during operation (26 women).
- 110,000 trees planted
Ithezi-Tezhi Power Project, Zambia
The project represents the development, construction, and operation of a new
120 MW base load hydropower dam at the site of the existing Itezhi-Tezhi
dam. By deploying additional generation capacity in the region, this project will
contribute to the resilience of the Zambian economy.
Zambia Hydro 35 15% 31 40 89,477 17.57 52,720
- About 700 workers are expected to
be hired during construction.
- During operations about 120
permanent jobs should be created.
Eskom Renewable Energy Project - Sere Wind Facility, South Africa
The project will add 100 MW of renewable energy production capacity to the
national grid and contribute to saving nearly 6 million tons of GHG emissions
over its 20 year lifespan.
South Africa Wind 45 13% 9 20 28,833.39 13.17 32,915
- The wind facility is expected to
generate approximately 140 direct and
1,371 indirect jobs during
construction and 10 jobs during
operation.
Kivuwatt Project, Rwanda
The project comprises 2 main components: a methane gas extraction and
purification facility located eters below the lake surface, on a floating barge off
the coast of Lake Kivu to harvest methane rich gas from 320 mand a 25 MW
capacity power plant on the lake shore at Kibuye to convert the methane gas to
electrical energy.
Rwanda Biogas 25 20% 23 25 215, ,000 25 700,000
- The project is expected to create 60
permanent skilled jobs, in addition to
the 250 jobs created at construction
stage
Cabeólica Wind Power Project, Cabo Verde
The project consists of the construction, operation and maintenance of 4
onshore wind farms on 4 islands of the Cape Verdean archipelago, with a
combined installed capacity of 25.5 MW. The project will reduce CO2
emissions by at least 85,000 metric tons per year.
Cabo Verde Wind
16 23% 12 20 21,562 5.98 19,922- 80 local jobs during construction
and 8-10 local jobs during operations
53

Green Bond impact reporting (2) – Selected sustainable and waste water projects
Brief Project Profile Country Sector
AfDB
financing
(USD mn)
AfDB
share of
financing
Allocated
amount to
Green Bonds
(USD mn)
Annual
absolute (
gross) water
savings (million
m3)
Annual absolute
(gross) amount of
wastewater
treated, reused or
avoided in m3
Annual GHG
emissions reduced
or avoided (in tons
CO2e)
Other Indicators
National Irrigation Water Saving Programme Support Programme,
Morocco
This adaptation project promotes water efficiency, water and soil
conservation, diversification of income sources and capacity building of
water users’ associations and farmers. As a result, it is expected to
improve the resilience of vulnerable groups as well as production
systems to climate change. The project's impact area covers a total land
area of 26 000 hectares, comprising 10 250 farms divided into two water
basins, Oum Rbia and Loukko.
MoroccoSustainable water
management 88.00 49% 0.00 31.60
- Anchor infrastructure will help to save
water, which will be recycled for an
estimated production of 64.3 million
m3/year
- Close to 700,000 additional jobs created
through land development.
Project to Improve the Quality of Treated Water, Tunisia
The project will contribute to reducing Tunisia’s water stress through
the direct use of treated water for irrigation and recharge of water tables. TunisiaWastewater
treatment37.03 87% 12.38 38,544.893 154,180
- About 3.9 million inhabitants will have
a healthy environment; 5,000 hectares of
land and for watering about 700 hectares
of golf courses; coastal fishing will be
improved in the region.
Gabal El-Asfar Wastewater Treatment Plant - Stage II, Phase II
Project, Egypt
The project objective is to improve the quality of wastewater discharged
into the drainage system in Cairo East, thereby contributing to increased
coverage of improved sanitation and clean environment for the nearly 8
million people living in this area. The project entails the construction of
phase II of GAWWTP. This phase will provide an additional wastewater
treatment capacity of 500,000 m3/d.
Egypt Wastewater
treatment 60.86 21% 48.89 182,500,000 730,000
- The project includes the use of
anaerobic digesters for electricity
generation. Power generation (about 6
MW) by the project will be used internally
and cut down electricity costs.
- 250-300 permanent jobs with varied
skills needed during operations and
maintenance of the facility.
The National Irrigation Water Saving Programme Support Project,
Morocco
The project will finance the construction of irrigation infrastructure
covering about 20,000 ha. The project has both climate adaptation and
mitigation co-benefits, given that it seeks not only tomconvert
conventional irrigationm systems into on demand irrigation systems, but
also to establish an irrigation warning system.
MoroccoSustainable water
management 61.16 78% 47.98 53.66
- Will directly benefit 5,853 farms and a
target population of almost 30,000
inhabitants
- 235,000 additional jobs.
Farm Income Enhancement and Forestry Conservation
Programme - Project 2, Uganda
With effects of climate change and the increasingly unreliable rainfall
pattern, the need for investment in irrigation has become of paramount
importance for the Government of Uganda. The project will develop
five new gravity fed irrigation schemes which will help improve
household incomes, food security, and climate resilience through
sustainable natural resources management and agricultural enterprise
development.
Uganda Sustainable water
management 77 84% 1.4
10,276
- 4,038 hectares of new irrigated land to
be cultivated with high value crops
- 31,000 households from the irrigation
schemes will benefit directly of which
about 51% are women
- 5,000 hectares of degraded forest
rehabilitated
- 90,683 farmers trained in natural
resource management. 54

World’s largest concentrated solar power plant
Morocco - Ouarzazate Solar Complex – Phase II (NOORo II and NOORo III)
Project cost: USD 1 billion - AfDB financing: USD 121 millionApproved: December 2014Signed: December 2014Planned completion date: December 2019
In 2016, Morocco kicked-off the 1st phase of the world's largest concentratedsolar power plant, Noor 1, one of the 4 solar plants that compose the NoorSolar Power complex. This project will produce 580 MW of electricity andreduce Morocco’s dependence to fossil fuels and foster the use of renewableenergy in the country. Noor 1 has an installed capacity of 160 MW and willcontribute to reduce GHG emissions of 240,000 tons of CO2 per year over a25-year period.
500 MW of Concentrated Solar Power (CSP) capacity Annual GHG reductions of 520,000 tons of CO2 per year Curb CO2 emissions by 13 million tons over the lifetime of the project Create 1,600 jobs during construction and 200 permanent jobs thereafter Increase in the share of renewable energies in Morocco’s energy supply
55
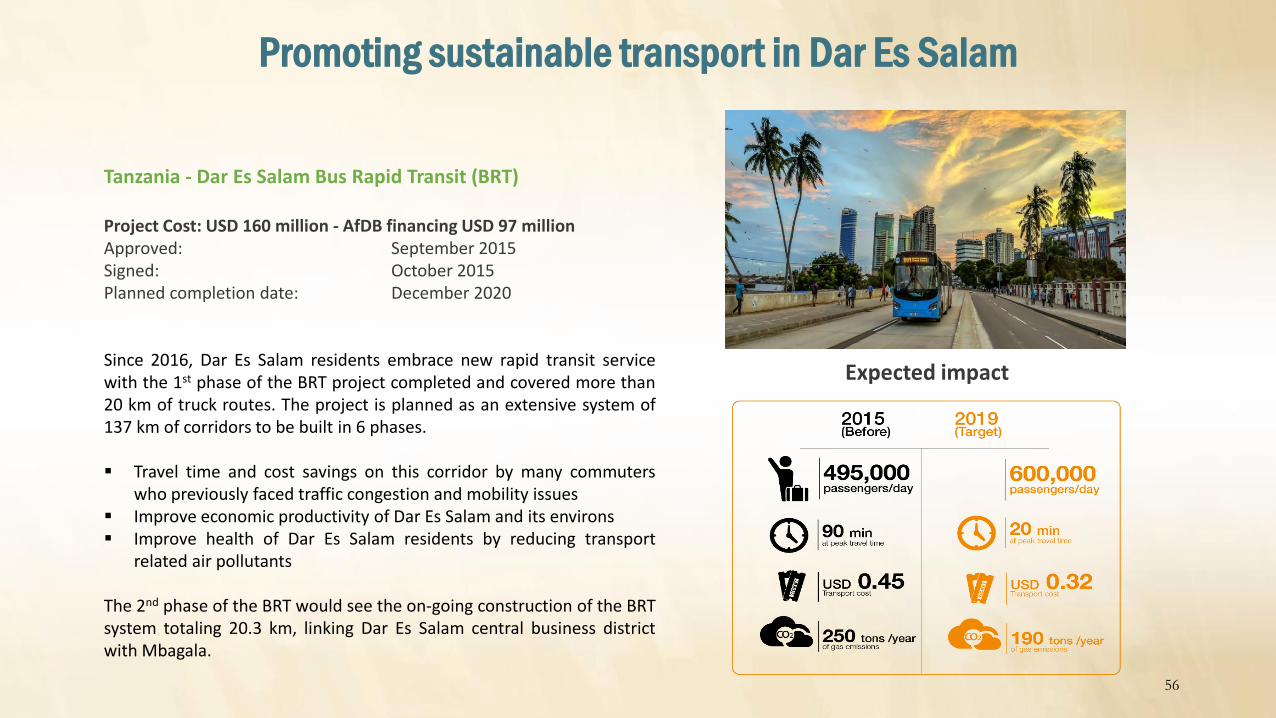
Promoting sustainable transport in Dar Es Salam
Tanzania - Dar Es Salam Bus Rapid Transit (BRT)
Project Cost: USD 160 million - AfDB financing USD 97 millionApproved: September 2015Signed: October 2015Planned completion date: December 2020
Since 2016, Dar Es Salam residents embrace new rapid transit servicewith the 1st phase of the BRT project completed and covered more than20 km of truck routes. The project is planned as an extensive system of137 km of corridors to be built in 6 phases.
Travel time and cost savings on this corridor by many commuterswho previously faced traffic congestion and mobility issues
Improve economic productivity of Dar Es Salam and its environs Improve health of Dar Es Salam residents by reducing transport
related air pollutants
The 2nd phase of the BRT would see the on-going construction of the BRTsystem totaling 20.3 km, linking Dar Es Salam central business districtwith Mbagala.
Expected impact
56

Financing irrigation for a greener agriculture
Morocco - National Irrigation Water Saving Program Support Project (PAPNEE II)
Project Cost: USD 97 million - AfDB financing USD 88 millionApproved: December 2016Signed: June 2017Planned completion date: December 2023
PAPNEEI-2 will cover 2 water basins, Oum Rbia (basin with high water stresslevels) and Loukkos (basin with very high energy cost). This climate changeadaptation project will fund the construction of irrigation infrastructure withinthe 2 water basins covering about 26,000 hectares, as well as irrigation waterdevelopment measures and capacity building activities for the water users’associations and farmers especially women and youths who are the vulnerablegroups.
Directly benefit 10,250 farms, with a target population of almost 61,500, mostly smallholder farmers
64.3 million m3 of water will be saved per year USD 0.5 million worth of energy gained annually 535,310 additional jobs created by construction sites and 696,180 additional
jobs generated annually through land development over 2017-2022
57

Africa’s largest wind power project
58
Providing clean and affordable energy to the underserved in Kenya
Computer generated mockup of the Lake Turkana project
“African Renewable Deal of the Year
2015” award by Thomson Reuters
Project Finance International
Lake Turkana Wind Power Project
Project cost : EUR 625 million –
AfDB Financing: EUR 115 million
Project Description:
Construction of 300 MW wind farm, comprising of 365
turbines of 850 KW capacity, connected to the power grid
Construction of a road
Installation of fiber-optic cable
Expected outcomes:
Scale up energy generation to 5,000 MW
Produce 20% of Kenya’s currently installed capacity
Close the energy gap of the country
Reduce energy cost for end-users
GHG emissions reduction of 700,000 tons of CO2 per year
Connect Great-Rift Valley region to the rest of the country
through improved infrastructure
600 jobs created during construction and 150 permanent
jobs during operation
Upgrade rural road network
Approved: April 2013
Signed: March 2014
The African Development Bank
Appendix
C. Social Bond Framework
4
59

AfDB’s mission statement is to spur sustainable economic
development and social progress in Africa, contributing
to poverty reduction
AfDB 10-year Strategy’s overarching objectives: promote
inclusive growth and support African countries gradually transition to green growth
Investor diversification
Providing support to the nascent Social
Bond marketAfDB strong SRI
credentials
Showcasing AfDB’sconcrete actions to
alleviate poverty on the continent
Why issue Social Bonds?
60
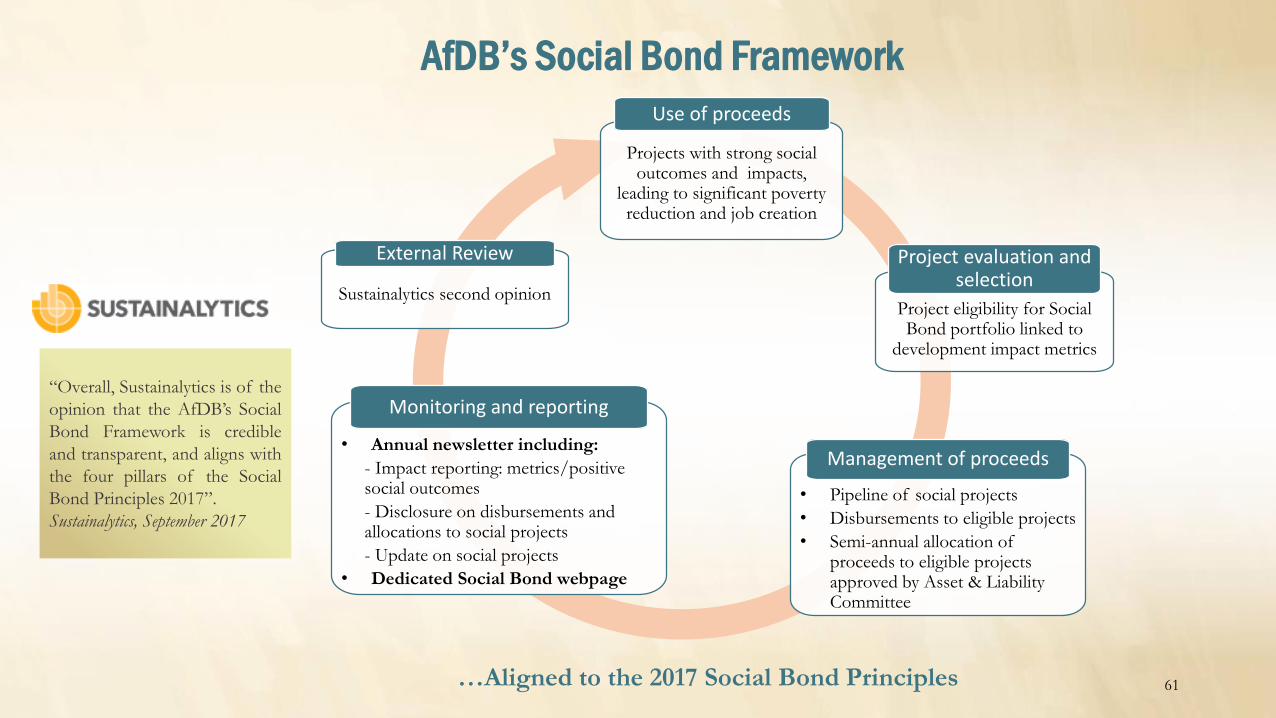
AfDB’s Social Bond Framework
…Aligned to the 2017 Social Bond Principles
Project evaluation and selection
Project eligibility for Social Bond portfolio linked to
development impact metrics
Management of proceeds
• Pipeline of social projects
• Disbursements to eligible projects
• Semi-annual allocation of proceeds to eligible projects approved by Asset & Liability Committee
Monitoring and reporting
• Annual newsletter including:
- Impact reporting: metrics/positive social outcomes
- Disclosure on disbursements and allocations to social projects
- Update on social projects
• Dedicated Social Bond webpage
Use of proceeds
Projects with strong social outcomes and impacts,
leading to significant poverty reduction and job creation
External Review
Sustainalytics second opinion
61
“Overall, Sustainalytics is of the
opinion that the AfDB’s Social
Bond Framework is credible
and transparent, and aligns with
the four pillars of the Social
Bond Principles 2017”.
Sustainalytics, September 2017
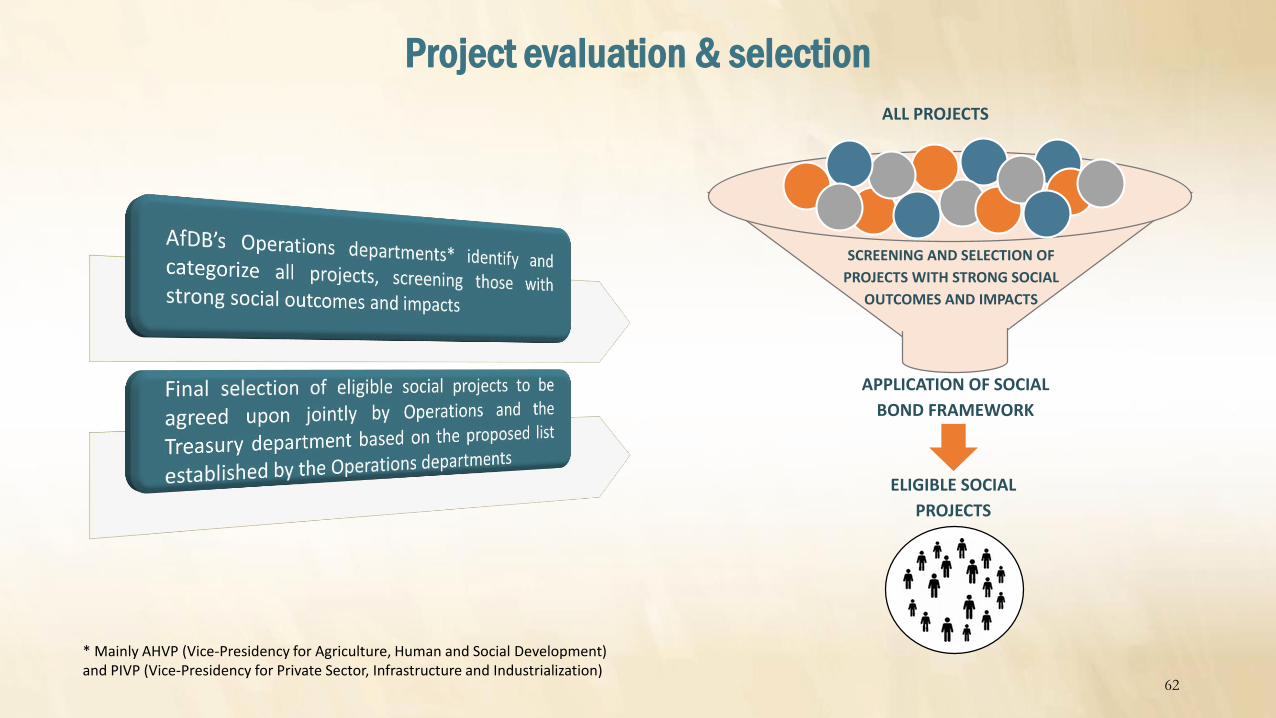
ALL PROJECTS
APPLICATION OF SOCIAL
BOND FRAMEWORK
SCREENING AND SELECTION OF
PROJECTS WITH STRONG SOCIAL
OUTCOMES AND IMPACTS
ELIGIBLE SOCIAL
PROJECTS
Project evaluation & selection
* Mainly AHVP (Vice-Presidency for Agriculture, Human and Social Development) and PIVP (Vice-Presidency for Private Sector, Infrastructure and Industrialization)
62

What can be financed with AfDB Social Bonds?
Information and Communications Technology(last mile connectivity for rural communities)
Agriculture and food security (small-scale irrigation and agriculture value chain development, provision of farm infrastructure and agricultural inputs for rural farmers, soft commodity finance facilities)
Education and vocational training (skills development for employability and entrepreneurship, youth employment programs, enhanced infrastructure and capacity building for schools)
Water supply and sanitation (sustainable safe water supply and sanitation services delivery)
Agri-business, industries and services (Small and Medium Enterprises and value chain financing)
Poverty reduction projects all across the African continent
Health (health systems development, public health and construction and/or rehabilitation of hospitals and healthcare centers)
Housing finance, financial inclusion and sector development (social housing, financial payment systems for populations)
Energy distribution (rural electrification)
Agriculture and food security
25%Education and
vocational training
5%Energy
distribution13%
Information and Communications
Technology6%
Water supply and sanitation
51%
6%
13%
25%
17%
10%
29%
Multinational North Africa East Africa
Southern Africa Central Africa West Africa
63

TREASURY
USD
EUR ZARSOCIAL BOND
PROCEEDS SEMI-ANNUAL ALLOCATION
SOCIAL BOND ELIGIBLE PROJECTS
An amount equal to the net proceeds of the Notes will be kept in AfDB’s
treasury liquidity portfolio and tracked in an appropriate manner through an attested formal internal process that assures the link of net proceeds to projects with strong social impact
(“eligible social projects”)
So long as the Notes are not fully allocated, the balance of net
proceeds will be reduced at the end of each semi-annual period by
amounts matching the disbursements made during such semi-annual period in respect of
eligible social projects/loans*
* Pending such disbursements, net proceeds will be held in the Bank’s liquidity portfolio and invested under the same conservative investment guidelines as other ordinary capital resources
Management of proceeds
64

Key developments in Social Bond market Details on selected social projects (implementation,
disbursements, other relevant indicators collected) Impact reporting: number of beneficiaries positively
impacted by social projects, job creation etc. AfDB’s Social Bond issuance (outstandings, allocation to
Social projects, investor distribution per type and geography)
Annual Social Bond newsletter
AfDB’s Social Bond Framework, including project evaluation, selection criteria and use of proceeds
Review/rating of the Bank’s Social Bond Framework by Second Opinion Provider Sustainalytics
List of projects included in the Social Bond portfolio List of Social Bond transactions AfDB’s Social Bond newsletter Development Effectiveness Report*
Dedicated Social Bond webpage
* Produced annually, the report monitors all AfDB public and private sector projects, shows details on Africa’s progress against its development goals and assesses the contribution made by the Bank to Africa’s development
Meeting transparency and disclosure requirements of SRI investors
65

Social Bond impact reporting (1) – Selected projects
Project Title / Goal Sector Country Currency Project costAfDB
financingNumber of beneficiaries Employment generation Other indicator
Institutional Support for the Sustainability of Urban Water Supply and Sanitation Service Delivery - Strengthen institutional efficiency in water and sanitation sector at central and provincial level and improve access and service delivery
Water supply and Sanitation
Angola USD
154,710,000 123,770,000 2.3 million (52% women) Women & youth in the underserved peri-urban areas
Decrease in under 5 mortality rate due to diarrheal disease to 108/1,000 from 173/1,000
Four Towns Water Supply and Sanitation Improvement Program -Improve health and socio-economic development of residents of 4 beneficiary towns, through increased access to sustainable water supply and sanitation services and improvement in service delivery
Water supply and Sanitation
Ethiopia USD
113,950,000 76,110,000 635,000 (>50% women) Employment/livelihood opportunities generated by increased investments
Decrease in under 5 mortality rate to 30/1,000 from 64/1,000
Towns Sustainable Water Supply and Sanitation - Unlock economic growth potential and improve quality of life through provision of safe, affordable and sustainable water and sanitation services
Water supply and Sanitation
Kenya USD
451,663,097 381,191,000 2,110,000 people with access to piped water, 1,340,000 people with access to sewerage
600 direct, 2,000 permanent & 10,000 temporary indirect jobs
Under 5 mortality rate to 20/1,000 from 51/1,000
Drinking Water Quality and Service Improvement Project - Consolidate and secure drinking water supply in several towns and improve water quality and the performance of existing drinking water supply services
Water supply and Sanitation
Morocco EUR177,700,000 88,850,000 8 million in 2030, including 1
million in rural areasFew hundreds during works and operational phase + boost economic activities in the regions
Under 5 mortality rate to 25/1,000 from 30/1,000
Urban Water Sector Reform and Port-Harcourt Water Supply and Sanitation Project - Provide sustainable access to safe drinking water and sanitation in Port-Harcourt and strengthen Government's capacity to reform the urban water and sanitation system across the country
Water supply and Sanitation
Nigeria USD
346,060,000 200,000,000 1,300,000 (47% women) Youth employment opportunities through a fresh graduate attachment scheme
Under 5 mortality rate to 22/1,000, from 142/1,000
Reinforcement of Multiple-Use Water Supply along the Louga-Thies-Dakar Road - Reinforce and safeguard drinking water supply for domestic, industrial and rural purposes
Water supply and Sanitation
Senegal EUR423,840,000 65,000,000 3 million people (51%
women)5,150 jobs created Reduction of diarrheal-disease
prevalence rate by 15% by 2025
Arusha Sustainable Urban Water and Sanitation Delivery Project -Provide safe, reliable and sustainable water and sanitation services, and contribute to improvement in health, social well-being and living standard
Water supply and Sanitation
Tanzania USD
233,916,000 143,647,000 600,000 people in Arusha and 250,000 additional people
Opportunities during construction Under 5 mortality rate to 54/1,000 from 81/1,000
Rural Drinking Water Supply Programme - Phase II - Improve socio-economic and sanitary living conditions of rural communities, by ensuring steady supply of drinking water of adequate quality and quantity
Water supply and Sanitation
Tunisia EUR
149,255,909 97,400,000 372,000 inhabitants and 130,000 students and teaching staff from more than 1,200 schools
2,000 temporary jobs (works phase), 1,000 permanent jobs (management of DWS system), up to 7,500 indirect jobs
Reduction in water-borne disease rate by 2025
Lusaka Sanitation Program - Climate Resilient Sustainable Infrastructure Project -Increase access to sustainable sanitation services to Lusaka residents especially the urban poor
Water supply and Sanitation
Zambia USD127,830,000 50,000,000 473,000 direct (52%
women), 600,000 indirect250 full-time skilled/semi-skilled + 600 part-time unskilled jobs trhough the program
Under 5 mortality rate to 50/1,000 from 87/1,000
66
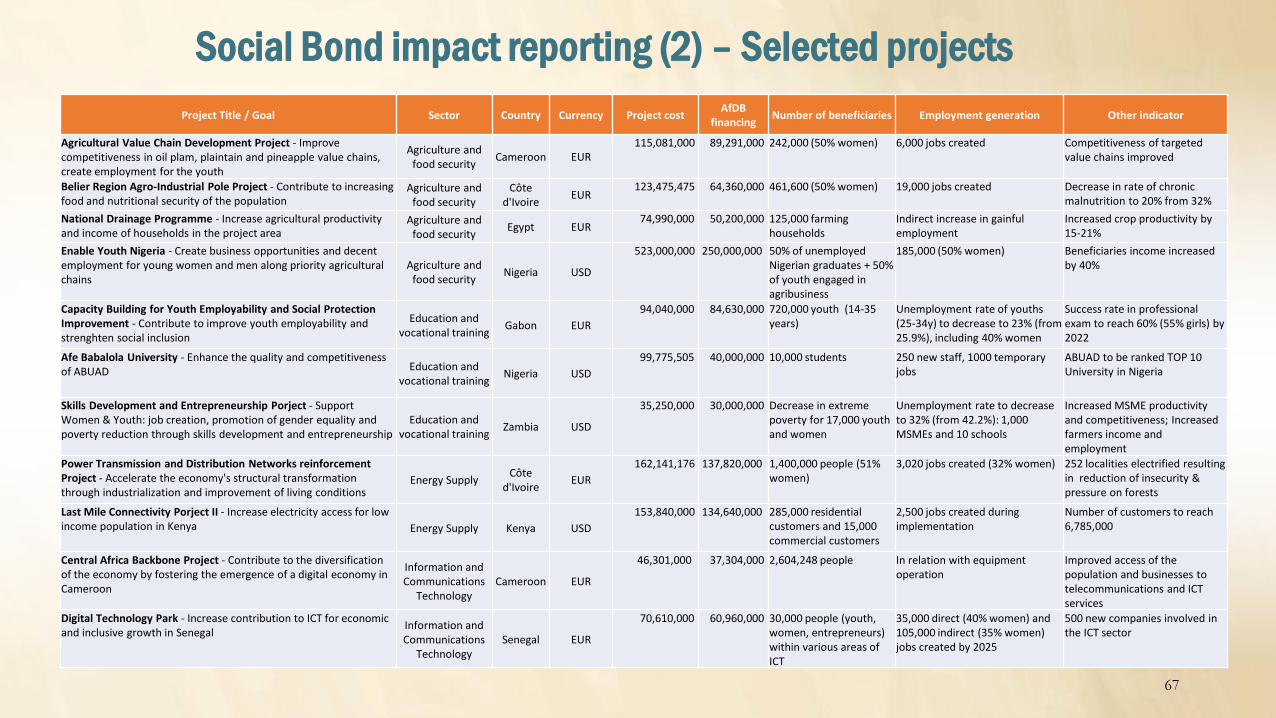
Social Bond impact reporting (2) – Selected projects
Project Title / Goal Sector Country Currency Project costAfDB
financingNumber of beneficiaries Employment generation Other indicator
Agricultural Value Chain Development Project - Improve competitiveness in oil plam, plaintain and pineapple value chains, create employment for the youth
Agriculture and food security
Cameroon EUR115,081,000 89,291,000 242,000 (50% women) 6,000 jobs created Competitiveness of targeted
value chains improved
Belier Region Agro-Industrial Pole Project - Contribute to increasing food and nutritional security of the population
Agriculture and food security
Côte d'Ivoire
EUR123,475,475 64,360,000 461,600 (50% women) 19,000 jobs created Decrease in rate of chronic
malnutrition to 20% from 32%
National Drainage Programme - Increase agricultural productivity and income of households in the project area
Agriculture and food security
Egypt EUR74,990,000 50,200,000 125,000 farming
householdsIndirect increase in gainful employment
Increased crop productivity by 15-21%
Enable Youth Nigeria - Create business opportunities and decent employment for young women and men along priority agricultural chains
Agriculture and food security
Nigeria USD
523,000,000 250,000,000 50% of unemployed Nigerian graduates + 50% of youth engaged in agribusiness
185,000 (50% women) Beneficiaries income increased by 40%
Capacity Building for Youth Employability and Social Protection Improvement - Contribute to improve youth employability and strenghten social inclusion
Education and vocational training
Gabon EUR
94,040,000 84,630,000 720,000 youth (14-35 years)
Unemployment rate of youths (25-34y) to decrease to 23% (from 25.9%), including 40% women
Success rate in professional exam to reach 60% (55% girls) by 2022
Afe Babalola University - Enhance the quality and competitiveness of ABUAD Education and
vocational trainingNigeria USD
99,775,505 40,000,000 10,000 students 250 new staff, 1000 temporary jobs
ABUAD to be ranked TOP 10 University in Nigeria
Skills Development and Entrepreneurship Porject - Support Women & Youth: job creation, promotion of gender equality and poverty reduction through skills development and entrepreneurship
Education and vocational training
Zambia USD
35,250,000 30,000,000 Decrease in extreme poverty for 17,000 youth and women
Unemployment rate to decrease to 32% (from 42.2%): 1,000 MSMEs and 10 schools
Increased MSME productivity and competitiveness; Increased farmers income and employment
Power Transmission and Distribution Networks reinforcement Project - Accelerate the economy's structural transformation through industrialization and improvement of living conditions
Energy SupplyCôte
d'IvoireEUR
162,141,176 137,820,000 1,400,000 people (51% women)
3,020 jobs created (32% women) 252 localities electrified resulting in reduction of insecurity & pressure on forests
Last Mile Connectivity Porject II - Increase electricity access for low income population in Kenya Energy Supply Kenya USD
153,840,000 134,640,000 285,000 residential customers and 15,000 commercial customers
2,500 jobs created during implementation
Number of customers to reach 6,785,000
Central Africa Backbone Project - Contribute to the diversification of the economy by fostering the emergence of a digital economy in Cameroon
Information and Communications
TechnologyCameroon EUR
46,301,000 37,304,000 2,604,248 people In relation with equipment operation
Improved access of the population and businesses to telecommunications and ICT services
Digital Technology Park - Increase contribution to ICT for economic and inclusive growth in Senegal
Information and Communications
TechnologySenegal EUR
70,610,000 60,960,000 30,000 people (youth, women, entrepreneurs) within various areas of ICT
35,000 direct (40% women) and 105,000 indirect (35% women) jobs created by 2025
500 new companies involved in the ICT sector
67
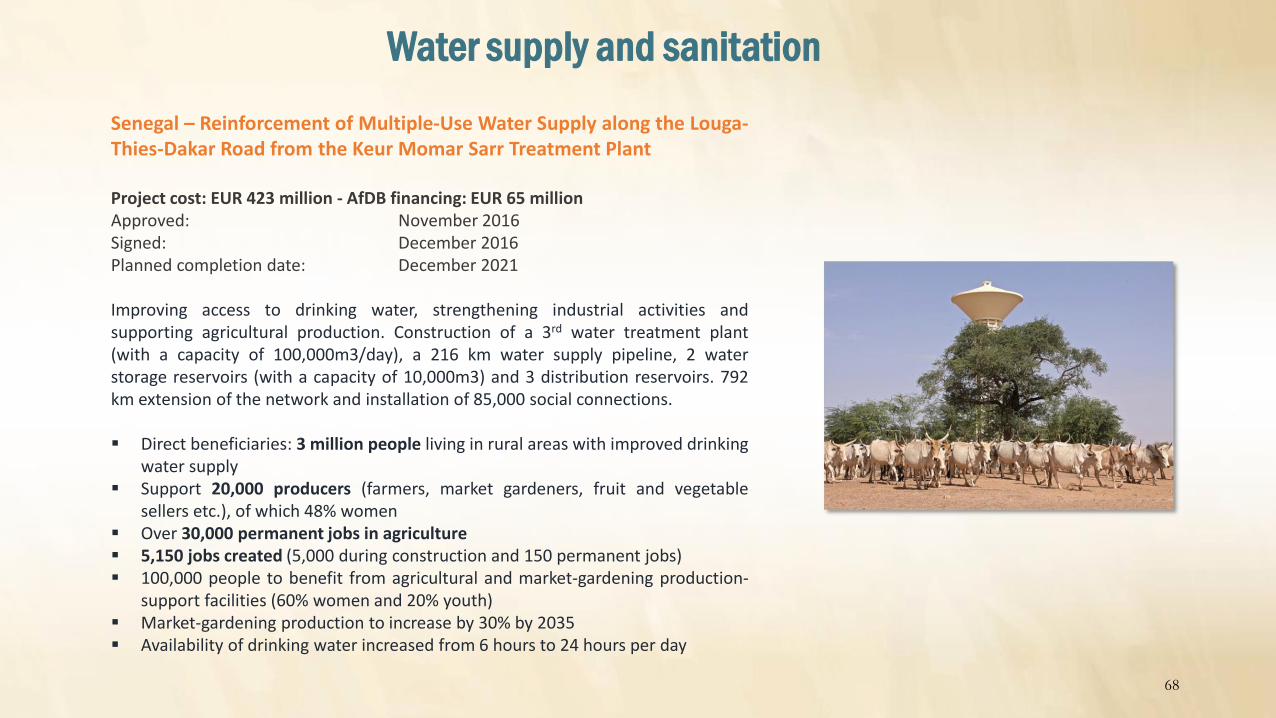
Senegal – Reinforcement of Multiple-Use Water Supply along the Louga-Thies-Dakar Road from the Keur Momar Sarr Treatment Plant
Project cost: EUR 423 million - AfDB financing: EUR 65 millionApproved: November 2016Signed: December 2016Planned completion date: December 2021
Improving access to drinking water, strengthening industrial activities andsupporting agricultural production. Construction of a 3rd water treatment plant(with a capacity of 100,000m3/day), a 216 km water supply pipeline, 2 waterstorage reservoirs (with a capacity of 10,000m3) and 3 distribution reservoirs. 792km extension of the network and installation of 85,000 social connections.
Direct beneficiaries: 3 million people living in rural areas with improved drinkingwater supply
Support 20,000 producers (farmers, market gardeners, fruit and vegetablesellers etc.), of which 48% women
Over 30,000 permanent jobs in agriculture 5,150 jobs created (5,000 during construction and 150 permanent jobs) 100,000 people to benefit from agricultural and market-gardening production-
support facilities (60% women and 20% youth) Market-gardening production to increase by 30% by 2035 Availability of drinking water increased from 6 hours to 24 hours per day
Water supply and sanitation
68
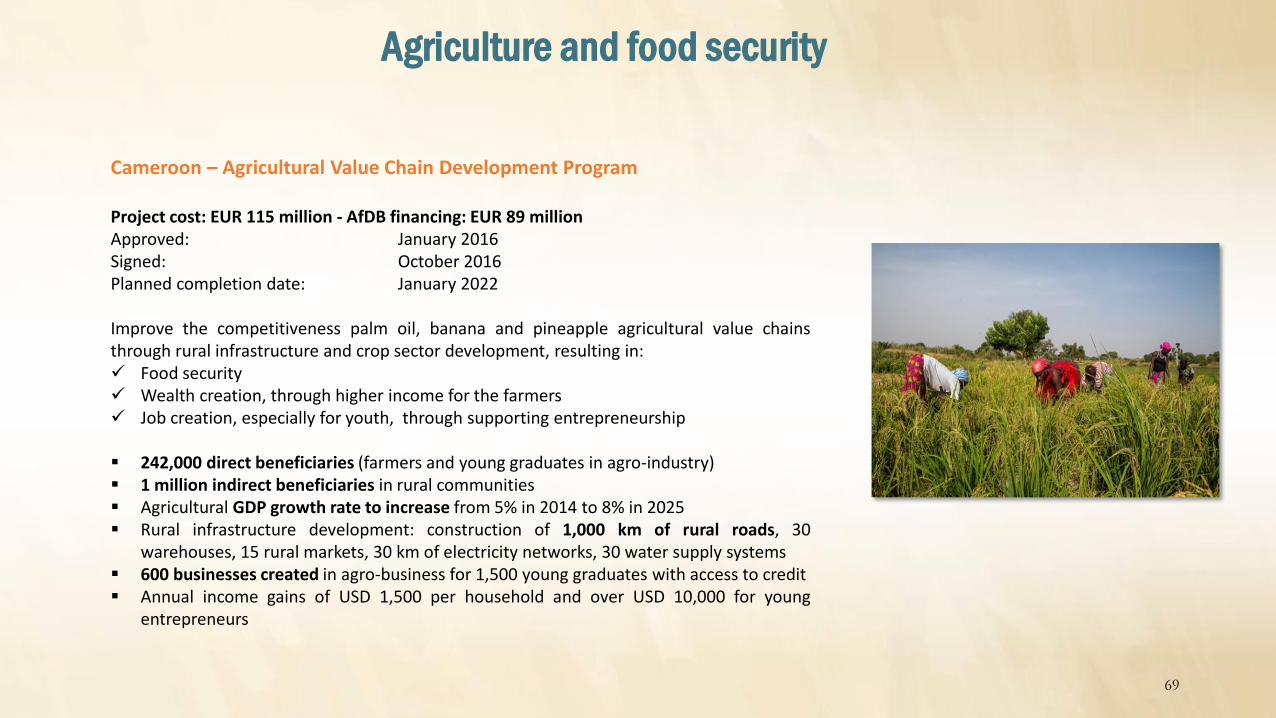
Cameroon – Agricultural Value Chain Development Program
Project cost: EUR 115 million - AfDB financing: EUR 89 millionApproved: January 2016Signed: October 2016Planned completion date: January 2022
Improve the competitiveness palm oil, banana and pineapple agricultural value chainsthrough rural infrastructure and crop sector development, resulting in: Food security Wealth creation, through higher income for the farmers Job creation, especially for youth, through supporting entrepreneurship
242,000 direct beneficiaries (farmers and young graduates in agro-industry) 1 million indirect beneficiaries in rural communities Agricultural GDP growth rate to increase from 5% in 2014 to 8% in 2025 Rural infrastructure development: construction of 1,000 km of rural roads, 30
warehouses, 15 rural markets, 30 km of electricity networks, 30 water supply systems 600 businesses created in agro-business for 1,500 young graduates with access to credit Annual income gains of USD 1,500 per household and over USD 10,000 for young
entrepreneurs
Agriculture and food security
69

Nigeria – Babalola University Expansion Plan
Project cost: USD 40 million - AfDB financing: USD 40 millionApproved: October 2016Signed: June 2017
Construction of a 400-bed teaching hospital for the Medical School,an industrial research park, a post-graduate school, student hostels,a central library and a small scale hydro-power plant installation. In2014, only 30% of eligible students were admitted to University inNigeria (more than 1 million unable to study in universities due tocapacity constraints). Also the quality of training offered byuniversities is poor as over 75% of graduates are not fully employed.
Enhancement of a farmer training program that will benefit over2,400 smallholder farmers
Improved access to high quality education for more than 10,000students per year and double student capacity by 2025
Generate 12,000 high quality and employable graduates Create 250 permanent and 1,000 temporary jobs Provide scholarships to more than 500 students
Education and vocational training
70

Appendix
The African Development Bank
D. African Economic Outlook
4
71

Increase in real output
Better macroeconomic management
Progress in structural reforms (infrastructure)
Sensible policy frameworks
But major macroeconomic challenges remain
End of commodity super-cycle
Weak current account positions
Increase in cost of capital, as US rates will edge up
Higher inflation
2019
4.1%
4.1%
3.6%
2017
2018
African economies have been resilient to negative shocks
Stronger economic perspectives
Improved global economic conditions
Recovery in commodity prices
Sustained domestic demand, partly met by import substitution
Improvement in agricultural production
72Source: African Economic Outlook 2018
Good GDP
growth
recovery from
2.2% in 2016

5.0% - Recovery of oil production in Libya, return of FDIs in Egypt
(net exports boosted by EGP depreciation) and new fiscal and monetary
policy measures in Algeria to mitigate the dependence on high oil prices
underpinned the performance of North Africa region
2.5% - Growth expected to accelerate, as Nigeria should consolidate
gains made in 2017. Cote d’Ivoire, Ghana and Senegal should also
contribute to the expansion of West Africa
5.6% - The fastest-growing region in Africa. Strong growth widespread in
the region with many countries (Djibouti, Ethiopia, Kenya, Rwanda,
Tanzania and Uganda) growing 5% or more
0.7% - Output contracted sharply in Republic of Congo (-4%) and
Equatorial Guinea (-7.3%) weighing down on Central Africa’s GDP
growth, which continued to underperform despite recovery in oil prices
1.1% - Growth nearly doubled, reflecting better performance of 3 main
commodity exporters (South-Africa, Angola and Zambia). Lesotho,
Malawi, Mauritius, Mozambique expected to grow above 4%, but
represent a relatively small contribution to the region’s GDP
Mixed economic performance with wide variations
73A faster recovery, especially among the non-resource rich economies
Largest African economies
Nigeria (18%)
South Africa (13%)
Egypt (11%)
Cote d’Ivoire: 8% Ethiopia: 10.9%
Senegal: 6.8%
Tanzania: 6.5%
Djibouti: 6.8%Burkina Faso: 6.7%
Libya: 55%
Ghana: 6%
Rwanda: 6.2%Guinea: 6.4%
18 African countries grew above
5% and 37 above 3% in 2017

Current account positions are expected to improve with the
recovery in commodity prices but remain worrisome
-8
-6
-4
-2
0
2014 2015 2016 2017
Oil-Exporting Oil-Importing Africa
Current account balance (% GDP)
Fiscal consolidation measures implemented by several governments
to respond to widening deficits
-10
-8
-6
-4
-2
0
2014 2015 2016 2017
Oil-Exporting Oil-Importing Africa
Fiscal balance including grants (% GDP)
Increase in inflation fueled by the depreciation in exchange rates, the
widening of fiscal deficits, stoked by the commodity price shock
0
5
10
15
20
2014 2015 2016 2017
Oil-Exporting Oil-Importing Africa
Inflation (%)
Some macroeconomic imbalances
Source: African Economic Outlook 2018
74

Africa’s thirst for development finance
56.5
50.2
64.6
6.5
2010 2011 2012 2013 2014 2015 2016
FDI ODA Remittances Portfolio Investments
In USD billion
…Therefore still insufficient to fully meet development challenges
Source: African Economic Outlook 2018
75
Remittances represent the most stable source
of flows, accounting for about a third of total
external financial inflows
Foreign Direct Investments (FDI) inflows
rising, driven by international and regional
investment in the extractive sector,
infrastructure and consumer-oriented industries
Official Development Assistance (ODA)
remained a large source of financing, despite
difficult economic conditions in donor
countries
Portfolio investment inflows (equity and
bonds) are not significant and remain volatile,
due to relatively undeveloped capital markets in
most African countries
Overall, external flows slowed…

Global savings and Africa’s needs: a tragic mismatch
1.7%
4.3%
2.3%
3.5%4.0%
3.0%2.5%
5.9%
2.6%
3.8%4.4%
3.5%
Americas Africa Europe Oceania Asia World
Current trends Investment needs
Expected infrastructure gap 2016-2040 (in % of GDP)
At same level of
GDP per capita,
South Asia, East
Asia and Latin
America have
higher access to
electricity and water
than most African
countries
AfDB estimates investment
needs for infrastructure in
the range of USD 130–170
billion a year
Africa can be the next investment frontier…
Policy of negative
interest rates in high
income countries
Excess savings to
finance public
investment in
developed countries
Facilitate capital flow
to profitable
investment
opportunities in
developing countries
Investment alternatives for the
international financial community
Yet the global economy
boasts 100 trillions of dollars
of savings in developed
countries chasing
investment opportunities...
78
(225) 20 26 39 00
(225) 20 26 29 06
Contact:
www.afdb.org
afdb_acc AfDB_Group
African Development Bank Group
For more information
77