the aftermath of sovereign debt assistance: does debt relief … · 2018-04-17 · bakers plan of...
TRANSCRIPT
The Aftermath of Sovereign Debt Assistance:
Does Debt Relief Play a Role in Reducing Future Conflict?
Shaista Karim Sadrudin Jaffer
(6017703)
Major Research Paper presented to
Department of Economics of the University of Ottawa
In partial fulfillment of the requirements of the M.A. Degree
Supervisor: Professor Gilles Grenier
ECO 6999
Ottawa, Ontario
March 2018

|Page 2
Abstract
One major obstacle that restrains developing countries from economic growth is debt.
Financial burdens due to debt tie up resources that could potentially be used for education,
healthcare and other societal improvements. To assist countries that demonstrate large amounts
of debt, a group of creditors implemented initiatives with the purpose of assisting developing
countries financially through partial or complete debt relief. The question, however, remains as
to what extent debt relief assists in reducing future conflict. This paper analyzes this subject in
the context of the 36 countries that participated in the 1999 Enhanced Heavily Indebted Poor
Countries (HIPC) Initiative, where conflict is measured as battle-related number of deaths caused
by a civil war. The regression model contains explanatory variables such as the economic growth
(measured as real GDP per capita), the importance of debt relief (in terms of debt relief-to-GDP
and debt relief-to-exports) and the duration of the initiative. The results show a negative
relationship between debt relief and conflict, but it is not statistically significant. A graphical
approach agrees with that finding. Debt relief is a debatable concept that has consequences
depending on the scope of the analysis. In my case, the consequence of debt relief on future
conflicts cannot be established with statistical significance. The study therefore concludes that
even though debt relief may be a great economic advantage to developing countries, there is only
weak evidence that it has a bearing on the determination of future conflict.

|Page 3
Table of Contents
I. INTRODUCTION .............................................................................................................. 6
II. AN OVERVIEW OF THE HEAVILY INDEBTED POOR COUNTRIES (HIPC) INITIATIVE ............. 8 I. DEFINING DEBT RELIEF ...........................................................................................................9 II. HISTORY ................................................................................................................................9 III. OVERVIEW OF REQUIREMENTS ............................................................................................ 11
III. LITERATURE REVIEW .................................................................................................... 13 I. DEBT RELIEF ......................................................................................................................... 13
A. IS DEBT RELIEF BENEFICIAL IN GENERAL?.................................................................................. 13 B. THE CONSEQUENCES OF DEBT RELIEF IN THE PARTICULAR CONTEXT OF THE HIPC COUNTRIES ................................................................................................................ 16
II. CONFLICT ECONOMICS ......................................................................................................... 18
IV. METHODOLOGY AND DATA .......................................................................................... 21 I. THE DEPENDENT VARIABLE: A MEASURE OF THE CHANGE IN CONFLICT ................................ 21 II. THE REGRESSION MODEL ..................................................................................................... 23 III. SOURCES OF DATA FOR THE EXPLANATORY VARIABLES ........................................................ 26
A. THE CHANGE IN THE REAL GDP PER-CAPITA ............................................................................. 26 B. THE MEASURES OF THE IMPORTANCE OF DEBT RELIEF ............................................................ 27 C. THE DURATION OF THE HIPC INITIATIVE ................................................................................... 28
IV. DATA ON CONFLICT .......................................................................................................... 28
V. STATISTICAL RESULTS ................................................................................................... 30 I. CAPTURING THE RELATIONHIP BETWEEN Ri AND IMPi THROUGH A GRAPHICAL REPRESENTATION ................................................................................................................ 30 II. GRAPHICAL ANALYSIS SEPARATELY FOR EACH COUNTRY ...................................................... 32 III. REGRESSION ANALYSIS ......................................................................................................... 34 IV. FURTHER ANALYSIS OF THE CONFLICT COEFFICIENT .............................................................. 36
VI. CONCLUSION ............................................................................................................... 37
VII. REFERENCES ................................................................................................................. 39
VIII. APPENDIX .................................................................................................................... 42

|Page 4
Summary of Tables
Table 1: Importance of Debt Relief and Conflict Coefficients for
HIPC Countries 25
Table 2: OLS Regression of Actual Conflict Model 35
Table 3: Pearson Correlation Coefficients of Actual Conflict Model 35
Table A1: Decision Date, Midpoint Year, Completion Date and Conflict
Intensity Every Year Between M-10 and M+5 for HIPC
Countries 42
Table A2: Total and Average Conflict Intensity During Sub-Periods for
HIPC Countries 43
Table A3: Real GDP Per-Capita as a Measure of Debt Relief Every
Year Between M-10 and M+5 for HIPC Countries 44
Table A4: Change in the Real GDP Per-Capita and During of Debt Relief
for HIPC Countries 45
Summary of Figures
Figure 1. Measure of the Importance of Debt Relief-to-Exports (𝐷𝐸𝑥𝑖)
to Ri 31
Figure 2. Measure of the Importance of Debt Relief-to-GDP (𝐷𝐺𝐷𝑃𝑖)
to Ri 31
Figure 3. Combined Measure of Real GDP Per-Capita VS Conflict
Related Number of Deaths 33
Figure A1. Real GDP Per-Capita VS Conflict Related Number of Deaths
Every Year Between M-10 and M+5 for HIPC Countries 46

|Page 5
Abbreviations
ACLED – The Armed Conflict Location and Event Data Project
This data set was consulted for the data on civil war combats in Africa.
GDP – Gross Domestic Product
This is the primary determinant when measuring the economic health of a nation.
HIPC – Heavily Indebted Poor Countries
The HIPC countries consist of 36 developing countries that have high levels of recorded
debt burdens and poverty.
IMF- The International Monetary Fund
The IMF is an international organization that works together with the goal of
strengthening economic and financial situations and relationships within and between the
global economy.
NPV- Net Present Value
This is the present value of a sum of money, rather than a future monetary amount that
will have inflation and interest associated with the value.
OLS – Ordinary Least Squares
This is simply a method for approximating unknown values in a linear regression model.
PRSP- Poverty Reduction Strategy Paper
The PRSP is a requirement imposed on the countries enrolled under the HIPC Initiative.
This paper is jointly written by the government and its citizens to create poverty reduction
strategies that will be implemented, prior to receiving the final stock of debt relief.
UCDP- Uppsala Conflict Data Program
The UCDP provides a data set that collects current data since the 1970’s on violent
conflicts in most of the counties around the world.
WB- The World Bank
The World Bank is a group that stands together to fight poverty and emphasizes
economic growth through viable and rational solutions, on a global scale

I. INTRODUCTION
Accumulated sovereign debt has been an economic problem that many countries have
faced and it has increasingly become a concern for developing countries. Those countries are
known to have a lower industrial capacity than developed ones, and as a result they tend to be
exposed to more issues relating to poverty, financial aid in the form of debt, and armed conflict.
In efforts to regain economic status, those countries have implemented poverty reduction
strategies that often led to the accumulation of debt and that potentially contributed to
augmenting the likelihood of future conflict. In an attempt to help developing countries to avoid
accumulating debt while struggling to improve their economy, some developed countries and
international agencies have implemented initiatives with the purpose of assisting developing
countries financially either through partial or complete debt relief. Those initiatives include the
Bakers Plan of 1985, the Brady Initiative of 1989, the Heavily Indebted Poor Countries (HIPC)
Initiative of 1996, the Enhanced HIPC of 1999, and the Multilateral Debt Relief Initiative
(MDRI) of 2005. In evaluating the extent of the success of those plans, the question arises
whether debt relief played a role in reducing the incidence of future conflicts in the poor
countries as prescribed by the chosen initiative.
To evaluate the relationship between debt relief and future conflict, I use an empirical
approach to understand the extent of these efforts. Specifically, this study focuses on the 36
countries involved in the Enhanced HIPC1 framework of 1999. I use data on the real per-capita
Gross Domestic Product (GDP) for each country from the World Bank (WB) Data Outlook
(2017). With the assistance of recorded documents and reports from the International Monetary
Fund (IMF) and the WB regarding the conditions of approval and graduation from the HIPC
1 From here onwards, the Enhanced HIPC Initiative of 1999 will be referenced as HIPC.

|Page 7
program, I use financial and economic indicators to estimate appropriate measures of the
importance of debt relief (International Monetary Fund, 2017; World Bank, 2016), which are
then assessed alongside the number of battle-related deaths stemming from future conflicts2 for
the countries involved.
While financial and economic indicators for the countries involved with the HIPC are
readily available, information on conflicts varies across countries. In this report, a conflict is
defined as an episode of violence within a country, or a war. Several types of wars can occur in
developing countries, including international wars and intra-state wars. The intra-state wars
include civil wars, inter-communal wars, and non-state wars.3
This analysis is limited to intra-
state wars, namely civil wars, focusing on battle-related deaths from civil war in the countries of
interest. I consulted two data sets: The Armed Conflict Location and Event Data Project (2017,
ACLED) which provides data on battle-related casualties in Africa, and the Uppsala Conflict
Data Program (2015, UCDP) which provides data on war-related casualties for major civil wars
around the world. Information from these two data sources were combined to create a data set on
conflict.
The literature on the direct relationship between debt relief and future conflict suggests
that debt relief in developing countries should lead to a reduction in conflicts. I will elaborate on
these discussions in the section entitled ‘Literature Review.’ Two separate empirical
investigations – a graphical approach and a regression analysis – will be used to study the effect
of debt relief on future conflicts in the countries covered by the initiative.
2 From here onwards, the incidences of future conflicts, and the number of battle-related deaths stemming from
future conflicts will be referred to as “future conflicts.” 3 Definitions of these various types of war are found in Sarkees (2010).

|Page 8
From a graphical representation of the data, a moderate relationship between debt relief
and the measure of conflict is observed. The data is then combined to create an average
observation of the number of battle-related deaths amongst all 36 countries enrolled under the
HIPC. The measure of conflict chosen throughout the study is the average change in the battle-
related number of deaths from civil war. When evaluating this measure, the results suggest that
the HIPC Initiative was moderately successful in reducing future conflict. However, the
relationship is not significant at the 5% level in the linear regression model.
This paper is organized as follows. The Enhanced HIPC Initiative will be described in
detail in Section II, which will include its background and framework analysis. In Section III, I
will discuss the literature on the economic theory surrounding debt relief and conflict economics.
The model and data will be summarized and explained in Section IV, using regression analysis
with a graphical approach, through the creation of a conflict coefficient. Finally, the statistical
analysis will be presented in Section V and the conclusion will follow in Section VI.
II. AN OVERVIEW OF THE HEAVILY INDEBTED POOR COUNTRIES (HIPC)
INITIATIVE
The enhanced HIPC Initiative of 1999 was a joint commitment between the IMF and the
WB, established with the mission of reducing debt and poverty while stimulating economic
growth. By using the factsheets available on their website (International Monetary Fund, 2017;
World Bank, 2016) and informational documents (International Monetary Fund, 2001;
International Monetary Fund and The World Bank, 2001), along with external seminars hosted
by the IMF, particularly discussed by Das et al (2012), I briefly describe the history behind the
formation of this program, as well as its goals and expectations.
|Page 9
I. DEFINING DEBT RELIEF
Debt relief can be expressed in terms of maturity extensions, interest reductions, debt
reductions, as well as a full cancellation of the debt, as described by Reinhart and Trebesch
(2016). In this study, the term is defined as a form of debt restructuring carried out by the IMF
and the WB. The reorganization of debt gives the HIPCs the ability to service their debts without
shortfalls. It also gives way to freed up financial resources initially used to make debt servicing
payments, which can be made available to stimulate economic growth through investments in
education, infrastructure, and healthcare.
II. HISTORY
The original HIPC Initiative was launched in 1996 by the IMF, the WB, the Paris Club
and other official multi- and bi- lateral creditors. It was the first time in history that this diverse
group of creditors united to reduce the external debt of some of the poorest countries in the
world. The aim of the original initiative was to reduce external debts to sustainable levels so that
poor countries would be able to service their debts through financial assistance, export earnings,
and private capital inflows. While many such initiatives were established in the past, their
success was limited due to the insolvency of the economies of the underdeveloped countries. The
capacity of supporting debt in the less developed countries was greatly exceeded and the need for
an initiative that would assist in stimulating economic growth was necessary.
In terms of funding the HIPC, some countries and organizations had agreed to write off
the development aid debt and cancel all trade debts by the countries enrolled under the HIPC. For
instance, the African Development Bank committed to a large sum of irrevocable debt relief,
totaling over $370 million USD, as noted in their summary of the HIPC Initiative (African

|Page 10
Development Bank Group, 2017). The proceeds from the IMF’s off-market gold sales in 1999
were all deposited into a separate account, known as the Poverty Reduction and Growth Trust
(PRG-HIPC fund), which was specifically designed for the HIPC. The creation of this financial
account was proposed by one of the key creditors country’s representative, Gordon Brown,
Britain’s Chancellor at the time4.
Although the original HIPC seems to have been beneficial to poor countries, it was not a
realistic or applicable framework due to the presence of conflicts in these countries, out of which
over 75% were African. When there are conflicts, it becomes difficult to monitor the spending of
debt relief flowing into the countries and the extent to which the aid is being used for the social
benefit of the people. By adjusting the original initiative, the new and enhanced HIPC framework
of 1999 intended to have more relaxed conditions for program eligibility. The relationship
between poverty reduction and external debt relief is emphasized in the enhanced program
through the requirement of the Poverty Reduction Strategy Paper (PRSP), which includes joint
contributions by the government and civil society of the less developed country. In efforts to
reduce debt to a sustainable level, the promotion of economic growth and poverty reduction
became the focus of the enhanced HIPC. This approach was used to motivate poor countries to
re-allocate spending, originally tagged for debt servicing, towards social services such as
healthcare and education. Addison et al (2004) found that the resources released by debt relief,
between 60% and 70% of debt service, were equivalent to the new-found spending towards
education, healthcare and other social programs. It was also observed that debt relief equivalent
to 50% of the debt-to-GDP ratio led to a 0.5 to 1 percentage point increase in the growth rate per
year. In restructuring the countries’ reform efforts, the HIPC required that the countries applying
4 A study entitled “The Latin American Crisis” discusses the various debt relief initiatives and the establishment of
the different funding mechanisms used to write off debts of less developed countries. (Ruggiero, 1999)

|Page 11
for the program meet strict conditions to ensure that the investment goes to countries willing to
improve their economy and social well-being.
III. OVERVIEW OF REQUIREMENTS
To be considered for funding under the HIPC Initiative, the applicant countries have to
satisfy certain conditions. They must have met strict qualifications, including income thresholds5,
inability to manage debt burden6 and contributions to the PRSP. The countries must be able to
borrow funds from supported programs and agencies belonging to the IMF and the WB, and they
must have performed well with regards to reforms and policies implemented through those
programs.
Two milestones need to be passed to receive the full stock of debt relief: the decision
point and the completion point. The first objective to reach is the decision point; the guidelines
ensure that creditors commit an amount of debt relief in full when the qualifying country reaches
this stage. It is at this phase that the country qualifies for a timeline for policy and reform
implementation and the inflow of interim aid commences.
After reaching the decision point, countries going through the approval process must pass
the second milestone: the completion point. At this stage, creditors lower the debt service
payments and the final stock of the first committed debt relief is delivered. To reach this stage,
certain reforms and programs must be implemented with the intention to stimulate economic
growth and to reduce national poverty. This is done through the proper implementation of the
5 The Gross National Product (GNP) in a country must be lower than the minimal requirements to receive a loan
from the International Development Association (IDA) to be considered a heavily indebted poor country. 6 Developing countries may not be able to manage their debt burdens when either all resources are used towards
repaying the debt or when there are not enough resources to service the debt.

|Page 12
PRSP for at least one year. At this stage, the WB considers the country as a graduate from the
program.
In comparison to the original HIPC Initiative, regulations and implementation of the
enhanced initiative to motivate economic growth and development are based on a more realistic
approach. For instance, the debt relief-to-exports ratio is targeted at 150%, down from 250% in
the original framework. Also, the debt relief-to-revenue ratio is intentioned at around 250%,
compared to the 280% initially. Similarly, the exports-to-GDP ratio and the revenues-to-GDP
ratio are both set at 30% and 15%, down from 40% and 20%, respectively.
Despite the credibility of the program and the goals of improved economic well-being,
many challenges remain that ensure that debts do not return to unsustainable or unmanageable
levels. These include the inability to strengthen the finances in the areas of debt and public
spending, as well as ensuring the full participation by creditors to the program. In many cases,
creditors committed to an amount but did not deliver the amount of debt relief that was initially
agreed upon. Even though some of the major creditors delivered their share of debt relief and
assistance, others were lagging. These facts are verified by the factsheets presented by the WB
and the IMF.
One impact of the HIPC Initiative that needs to be considered is that of post-conflict
countries or those currently facing conflicts during the implementation of the HIPC Initiative.
These less-developed nations tend to receive quicker and higher debt relief to assist them in
reducing violence. In providing assistance in a time-efficient manner, the goals of poverty
reduction and economic stabilization are prominently emphasized. This is done through an earlier
decision point, a longer interim period, and more flexible requirements at the completion point.
|Page 13
In observing the importance given to conflict-inflicted countries within the initiative, the
remainder of this study will focus, after a review of the literature, on the conflict component of
the initiative.
III. LITERATURE REVIEW
Since this paper first explores the incidence of debt relief in each country and then
investigates its effect on future conflicts, the literature for each of the above components must be
consulted individually. Therefore, I explore the issue of debt relief in underdeveloped countries
as a single theoretical framework, whereas the context of conflict economics in direct relation to
battle-related deaths caused by civil war is analyzed in another framework.
I. DEBT RELIEF
A. IS DEBT RELIEF BENEFICIAL IN GENERAL?
Is debt relief beneficial? Reinhart and Trebesch (2016) focus on this question while
comparing two distinct cases: the countries affected during the interwar period from 1920 to
1939 and the emerging market crisis era from 1978 to 2010. The general finding in both samples
is that debt relief is beneficial only if the correct type of intervention is applied. Specifically, the
most effective debt relief option is a debt write-off. The other types of debt relief options include
maturity extensions, debt reductions, and interest reductions, which are less effective. The data
used for their study was taken from the study performed by Cruces and Trebesch (2013) on
sovereign debt “haircuts,” or on what we would call debt relief.

|Page 14
Reinhart and Trebesch (2016) concluded that the majority of the debt following World
War I resulted from official external sovereign debt. The solution suggested by the Congress of
the United States was a full cancellation of the war debt. This debt write-down rendered the
economies at question a chance of reestablishment. In contrast, from 1978 to 2010, the emerging
market debt crisis was the result of private creditors. Thus, the use of debt relief in this situation
had a different effect than the one marked earlier because of the differing causes. In the first case,
the complete debt write-off allowed the affected countries another chance to reestablish their
economies, return to financial markets and become a part of the IMF and the WB. In the latter
instance, the debt relief played more of a role of rebalancing the economies of the countries of
interest. In both eras, the debate about the cost-benefit of debt relief depended on many factors.
For example, economic growth through increased social welfare and improved infrastructure was
the result of freed resources from debt relief. The moratorium announced by US President
Herbert Hoover in 1931 was a significant event in relation to debt relief. That announcement
gave way to a one-year grace period to the indebted countries based on the premise that loan
payments were difficult to make while restructuring a nation. The result of the moratorium was
that after the one-year period, a country’s payment irregularities worsened until 1934, when all
debts were written off. This was known as the “crisis-exit.” The literature confirms that debt
relief was attempted in two ways according to Reinhart and Trebesch (2016): a moratorium and a
full debt write-off.
In acknowledging that debt relief is beneficial, it is important to further assess its broad
aftermath. Reinhart and Trebesch (2014) conducted an analysis on the outcome of debt relief in
countries during the interwar and in the emerging markets eras, similar to their later study
analyzed above. The difference between the two studies is found in the methodology- while their
|Page 15
2014 study consisted of a simple analysis using a graphical approach, their 2016 study included a
DID (Difference in Difference) regression. The overall results of both papers, however, remained
the same. Reinhart and Trebesch (2014) concluded that the results for the two time periods were
similar: debt relief generally led to higher growth of Gross Domestic Product (GDP).
Furthermore, the debt-servicing liabilities as well as the overall government debt were lowered.
While the results favorably demonstrate that debt relief benefited the economy in the short-run,
the question arises of whether these results can be sustained in the long-run.
Birdsall and Williamson (2002) focused on the debt relief of poor countries around the
world. Most of these countries participated in the HIPC Initiative to strategically stimulate
economic growth. The objective was to establish a ‘new aid architecture’ to promote long-term
sustainability after development aid was delivered. To determine if debt relief is the best method
of assistance, it was compared to various methods of development aid. The results show that
development aid thrived in economies with profitable and investment-seeking considerations
rather than in economies with developmental considerations. Debt relief increases resources for
public spending which positively correlates with sustainable economic growth. The direct effects
of an increase in public spending include better education systems, improved healthcare systems
and enhanced infrastructure and facilities. Debt relief is recognized to be the most efficient form
of support provided to developing countries. Birdsall and Williamson (2002) state that “an
assured dollar of debt relief is probably more efficient in generating development than a
promised dollar of new aid.” (p.72) Therefore, it can be inferred that sustainability is achieved
when debt relief has been delivered rather than just promised.

|Page 16
B. THE CONSEQUENCES OF DEBT RELIEF IN THE PARTICULAR CONTEXT OF
THE HIPC COUNTRIES
Beneficial debt relief has been the goal of past financial initiatives in terms of anticipating
sustainable and long-term economic growth. The establishment of the HIPC Initiative of 1996
and of the Enhanced HIPC of 1999 attempted to correct the economic goal that the developing
countries were striving for. Addison et al (2004) completed an investigation on debt relief in poor
countries which focused on the HIPC Initiative. In their research, the emphasis on the positive
relationship between debt relief and economic growth rate is a key finding – an increase in the
amount of debt relief that a country receives results in more sustainable economic growth. They
observed that education and healthcare spending correspond to a proportion between 62% and
70% of debt servicing. This amount was obtained from the funds made available through debt
relief aiming to improve the economic condition of the country. Addison et al (2004) confidently
supported the HIPC Initiative and discussed the positive aftermath of debt relief on the involved
countries.
Birdsall and Williamson (2002) investigated the countries enrolled under the HIPC
Initiative. Although their results are consistent with the economic theory that debt relief leads to
development, they also expressed criticisms towards the HIPC framework. The HIPC debt relief
was beneficial partly because the beneficiaries were required to first prepare a Poverty Reduction
Strategy Paper (PRSP) to be submitted to both the IMF and the WB. This requirement allowed
the eligible developing countries to take ownership of the strategies that they could implement to
reduce poverty and stimulate economic growth.
Likewise, Addison (2003) performed a study which focused on the African countries.
More than three quarters of the 36 countries that have graduated from the HIPC Initiative are

|Page 17
African. While conducting detailed research on numerous African countries, he found that many
of them are poor and indebted because of past conflicts. Past conflicts have corrupted those
nations and have directly affected their institutions, which led to unbalanced investments.
Consequently, a low growth rate is observed to indirectly contribute to future conflicts. One of
the goal of the HIPC was to prevent those future conflicts from occurring. Due to the PRSP
eligibility requirement, poor countries had to prepare a well-designed development strategy on
their own so that the plan would be achievable from the point of view of the prospective
recipient. This broad-based strategy was an attempt to reduce future conflicts in the developing
HIPCs.
By framing economic growth as one of the main goals of debt relief, the effect of the
decreasing financial burden on social conflicts in the HIPC countries was subsequently studied
by Addison and Murshed (2003). They acknowledged the necessity of studying the effect of debt
relief on future conflicts in the countries of interest in order to validate the efficiency of the
initiative. They indicated that conflict reduction has been mentioned in debates but never
explored rigorously.
In specifying that debt relief frees up financial resources for increased development
spending, it can be concluded that debt relief may also contribute to reducing social conflict. For
example, debt relief can be considered as an addition of financial resources that cause the
government to face a trade-off: either the government increases transfers to the rebel groups
engaged in conflict, or it increases the fighting efforts against the rebel groups. Most countries
that were conflict-inflicted prior to their enrollment into the HIPC were unstable during and after
debt relief was delivered. This does not entail that the debt relief received was useless, but rather
that the intensity of conflict was so high in those countries that even debt relief could not provide
|Page 18
enough resources to terminate the conflicts completely. Many of the HIPCs that endured
conflicts are rich in natural resources and therefore face threats of appropriation and exploitation.
The greed pushing rebel groups to capture these resources is the main cause of conflict in those
countries. Addison and Murshed (2003) conducted a statistical study using a model that
maximized the expected utility of the government and the rebels with respect to the probability of
observing conflict and the respective payoffs. In maximizing the expected utilities in the game,
the findings suggest that debt relief is unlikely to eliminate conflict entirely, but it can reduce
fighting intensity and cost of war. To further understand the importance of debt relief, an in-
depth analysis on the extent of future conflicts is required.
II. CONFLICT ECONOMICS
In discussing the consequences of debt relief on future conflicts, it is important to
emphasize the definition of conflict used in this study to better examine the underlying causes of
conflicts, namely civil war.
Collier and Hoeffler (1998) analyze the nature of conflict in the context of the economic
causes of civil war. They emphasize that a war will generally occur if the rebel groups’
incentives outweigh the transaction costs of starting the conflict. These incentives generally
consist of the seizure of financial resources that can be appropriated from the government or
from the masses because of development aid. The cost of the conflict includes the opportunity
cost tied to the fighting-induced drop in economic activity. It is observed that the cost of warfare
increases with the duration of the war. In an expanded analysis, Collier and Hoeffler (2002) study
the effects of aid and policy on reducing civil conflicts. Although aid and policy are found to
have no direct effect on the risk of induced conflict, indirect effects exist. During civil war,

|Page 19
questions arise regarding rebels’ target of aid as their incentive to fight. During a conflict, aid is
generally reduced by donor countries and organizations so that the only form of aid coming into
that nation is food aid. Though health aid was also being brought over to those that needed it, the
aid flowing into the country prior to the conflict could be a motive for the rebels to appropriate
the new inflow of available resources. This opportunity could result in an outbreak of civil
conflict in low-income countries.
More recently, Collier and Hoeffler (2004) studied the causes of a civil war through a
cost-benefit analysis. In determining the opportunities of an outbreak of civil war in their
previous study, Collier and Hoeffler (2007) conducted an empirical study to investigate the
effects of aid on armed conflict, the primary focus of which was the military spending and the
extent to which foreign aid is allocated to security and defense purposes. The results show that
aid often unintentionally increases the risk of internal conflict. In Africa, it is found that military
spending nearly doubles when foreign aid is received. Thus, the authors observe that military
spending does not deter rebels from causing upheaval, nor does it reduce the risk of internal
conflict.
While aid appears to increase the risk of conflict in some studies, it could also decrease
the risk in other contexts. Miguel et al (2004) focused on estimating the effects of economic
conditions on the on-set of civil conflicts in low-income African countries. In assessing a variety
of explanatory variables, they found that economic growth has a significantly negative effect on
the risk of conflict such as a civil war. By conducting a variety of regressions over a sample of
countries in Africa, they concluded that economic conditions have a crucial influence on civil
conflicts and that increased growth rates lead to reduced risk for future conflicts.

|Page 20
De Ree and Nillesen (2009) take a new approach to study the effect of foreign aid on
future civil conflicts. In separating future conflicts into civil conflict on-set and civil conflict
duration, a more detailed analysis is formed in understanding the direct effects of development
aid. While civil conflict on-set measures the commencement of a battle, civil conflict duration
accounts for the length of the battle. Collier et al (2004) took the time to study the effects of the
duration of a civil war on the economies of less developed countries. Similarly, De Ree and
Nillesen (2009) found that countries with weak institutions and low per capita income are more
prone to civil conflict. In comparison to wealthy countries, poor countries face a higher risk of
conflict as a direct response to their economic environment. Foreign aid received by most poor
countries in Africa was used to increase their military spending which in turn, significantly
reduced the duration of the conflict. However, their study concluded that aid had no significant
effect on the actual on-set of a civil war.
In the case of the HIPC, most of the less developed countries that were involved in the
initiative experienced conflict in the form of a civil war after reaching the decision and
completion points of the debt relief. The question of interest remains to determine the extent to
which debt relief through the HIPC Initiative reduced the probability of observed conflicts in the
future.
While debt relief and conflict have been explored separately in this literature review, the
simultaneity of the relationship has yet to be tested. Addison and Murshed (2003) studied the
statistical effect of debt relief on the on-set of civil war through utility maximization; however, a
more direct approach to understanding the relationship between the variables is absent. By
combining the available theories and proposing a new model, this study will attempt to identify
the extent to which debt relief plays a role in reducing future conflicts.

|Page 21
IV. METHODOLOGY AND DATA
I. THE DEPENDENT VARIABLE:
A MEASURE OF THE CHANGE IN CONFLICT
The aim of this analysis is to determine whether the HIPC Initiative was successful in
reducing future conflicts in the countries where it was implemented. Through the creation of a
coefficient which measures the average change in conflict over a period of 15 years before and
after the delivery of debt relief, it is possible to evaluate the success of the HIPC program in
reducing future conflicts. I choose to conduct this research over the span of 15 years in order to
have a long enough period. Although each country joined the HIPC Initiative in a different year,
the data for all countries is available 10 years prior to their graduation from the program to at
least 5 years after. By using this measure of conflict change as the dependent variable in a
regression, the evaluation of the success of the HIPC program can be determined.
The decision and completion points (defined earlier in section II) play an important role
in this study because they provide a benchmark for a condensed time interval during which debt
relief is received. The period during which each country receives debt relief under the HIPC -
specifically between the decision point and the completion point – allows for the choice of an
alternative midpoint year (M) between the two milestones to provide a benchmark to compare
the results from before and after the delivery of debt relief. Since ‘midpoint’ more generally
refers to separating an interval exactly into half, I choose to label the data point as an ‘alternative
midpoint’ which serves to define the most representative year between the two milestone years.
A two-step process is used for determining the most reasonable alternative midpoint year. I first
determine the actual midpoint year between the decision and completion points: this assists in a
|Page 22
realistic selection. I then validate my selection by choosing the one year which witnessed conflict
from one year before, one year after and the actual midpoint year. If the actual midpoint year
recorded an observed conflict, regardless of the number of recorded battle-related deaths, I
choose that year; otherwise I choose the year before or the year after. While economic growth
can be stimulated directly after declaring an inflow of debt assistance in some countries, in other
cases it may not occur until after the nation receives the entire stock of the promised financial
aid. I first select the most realistic alternative midpoint year for each country, based on the
available information for the period of interest. I then gather the data, commencing ten years
prior to the alternative midpoint, i.e. M-10, and ending up to five years after, i.e. M+5. The
reason for choosing this interval is not only because the data is available for all countries, but it is
also because the trend of the data around the alternative midpoint year may be better evaluated. I
will refer to this ‘alternative midpoint’ as ‘midpoint’ for the remainder of this study. In being
able to observe the economic growth in the years leading up to M, the impact of the majority of
the debt relief after the midpoint year can be better analyzed. For instance, if real GDP per-capita
is observed to be gradually increasing for the 10 years prior to M, and if I suddenly observe a
rapid increase during the first 5 years after M, it is reasonable to expect that debt relief played a
role, ceteris paribus. However, if the economic activity is shown to be increasing leading up to M
and then returns close to initial lower levels within the 5 years after the midpoint year, then the
effect of debt relief is not considered to be significant. Therefore, the time interval from M-10 to
M+5 seems appropriate to use for data collection and analysis in this work.
Table A1 of the Appendix presents the raw data that I used to calculate the dependent
variable. It shows the decision point, the midpoint, the completion point, and the number of
battle-related deaths for each of the 10 years before and the 5 years after the midpoint year of
|Page 23
debt relief delivery for all 36 countries. The source of this data will be discussed in more detail in
the section below. The total and average yearly number of battle-related deaths from M-10 to M,
as well as between M and M+5, are shown in Table A2 of the Appendix for each of the HIPC’s.
Using the values of the average number of battle-related deaths, I define the coefficient
describing change in conflict (𝑅𝑖) as the ratio of the average number of deaths before the
midpoint year to the average number of deaths after that year. The calculated index is shown in
the last column of Table 1 (along with the measures of the explanatory variables of the model to
be discussed below) for each of the 36 countries:
𝑅𝑖 =𝐴𝑣𝑒𝑟𝑎𝑔𝑒 [𝑀−10,𝑀]
𝐴𝑣𝑒𝑟𝑎𝑔𝑒 [𝑀,𝑀+5] (1)
To determine the success of the HIPC Initiative, evaluating the value of 𝑅𝑖 with respect to
the value of 1 is useful: if the average number of deaths 10 years prior to M (the numerator) is
larger than the average number of deaths 5 years after M (the denominator), then the coefficient
will take on a value larger than 1. This would suggest that the HIPC Initiative was successful in
reducing the future conflict in the nation of interest. This information will be of value when
assessing the effect of 𝑅𝑖 on the different measures of the importance of debt relief.
II. THE REGRESSION MODEL
Based on the literature cited above, debt relief can be beneficial or harmful to a nation’s
economy depending on how the society chooses to use its resources. While the amount of debt
relief that each country collects varies according to differing debt stocks, debt-servicing
payments and country sizes, it is not the only explanatory variable that determines future
conflicts. I select three explanatory variables that affect future conflict. A linear regression model

|Page 24
is used to analyze the success of the HIPC Initiative in reducing future conflicts. Ordinary Least
Squares (OLS) estimates are derived from the regressions.
The explanatory variables, shown in Table 1, are a measure of economic growth (𝐺𝐷𝑃), a
measure of the importance of debt relief (𝐼𝑀𝑃), and the duration of the HIPC program (𝐻𝐼𝑃𝐶).
𝐺𝐷𝑃 is defined as the percentage change in real GDP per-capita. Two alternative variables are
used to define 𝐼𝑀𝑃: the debt relief-to-GDP ratio (𝐷𝐺𝐷𝑃) and the debt relief-to-exports ratio
(𝐷𝐸𝑥), both of which are recorded at the time of the completion date, or ‘graduation’ from the
HIPC Initiative. It is unknown which representation of the importance of debt relief will be
statistically significant. Therefore, two different specifications will be performed- one including
the debt relief-to-GDP ratio and the other with the debt relief-to-exports ratio. These values are
presented in the two middle columns of Table 1 above. The duration of debt relief is determined
by counting the number of years between the decision point and the completion point for each
country enrolled under the initiative.
The model is defined as follows:
𝑅𝑖 = 𝛼0 + 𝛼1𝐺𝐷𝑃𝑖 + 𝛼2𝐼𝑀𝑃𝑖 + 𝛼3𝐻𝐼𝑃𝐶𝑖 + 𝜀 (2)
where
𝑅𝑖 represents average change in conflict as described in terms of battle-related
casualties in each country, i,
𝐺𝐷𝑃𝑖 accounts for the percentage change in the average real per-capita GDP from
M-10 to M+5,
𝐼𝑀𝑃𝑖 represents the importance of debt relief which is specified as two alternative
indicators:

|Page 25
Table 1: Importance of Debt Relief and Conflict Coefficients for HIPC Countries
Country
Time
Measure of Importance of Debt
Relief Duration of
HIPC
Percentage Change in the Real GDP Per
Capita
Conflict Coefficient, R
Decision
Date Midpoint Year
[M] Completion
Date
% of debt-to-exports at
completion point
% of debt-to-GDP at
completion point (HIPC)
% Change (GDP)
AVE M-10 TO M : AVE OF M TO M+5
Afghanistan Jul-07 2009 Jan-10 0.10 0.00 3 243.43 0.49
Benin Jul-00 2002 Mar-03 0.80 0.30 3 53.50 5.45
Bolivia Feb-00 2000 Jun-01 1.40 0.10 1 8.99 0.18
Burkina Faso Jul-00 2001 Apr-02 1.60 1.20 2 36.12 0.03
Burundi Aug-05 2007 Jan-09 2.00 0.90 4 54.48 14.63
Cameroon Oct-00 2003 Apr-06 2.00 0.90 6 40.40 0.34
Central African Republic Sep-07 2008 Jun-09 2.80 0.50 2 40.51 0.26
Chad May-01 2008 Apr-15 2.80 0.60 14 110.75 4.36
Comoros Jun-10 2011 Dec-12 3.50 0.50 2 3.17 0.00
Republic of Congo Mar-06 2007 Jan-10 4.50 1.80 4 133.62 79.98
Democratic Republic of Congo Jul-03 2007 Jul-10 5.20 1.60 7 61.27 2.41
Cote D'Ivoire Mar-09 2011 Jun-12 5.40 1.80 3 13.70 2.45
Ethiopia Nov-01 2003 Apr-04 5.90 1.00 3 51.45 15.04
The Gambia Dec-00 2004 Dec-07 6.20 1.70 7 -19.43 0.19
Ghana Feb-02 2003 Jul-04 6.40 3.80 2 111.73 15.44
Guinea Dec-00 2006 Sep-12 7.10 2.20 12 9.52 1.84
Guinea-Bissau Dec-00 2005 Dec-10 7.30 2.00 10 74.60 4.65
Guyana Nov-00 2008 Dec-03 8.10 4.50 3 139.62 0.55
Haiti Nov-06 2008 Jun-09 8.10 1.50 3 52.62 0.00
Honduras Jun-00 2003 Apr-05 8.30 2.30 5 67.14 1.06
Liberia Mar-08 2009 Jun-10 8.40 2.30 2 106.93 70.77
Madagascar Dec-00 2003 Oct-04 8.50 1.00 4 26.82 1.19
Malawi Dec-00 2003 Aug-06 8.60 2.60 6 56.82 1.18
Mali Sep-00 2002 Mar-03 10.60 1.60 3 58.72 4.79
Mauritania Feb-00 2001 Jun-02 10.70 1.60 2 6.78 0.14
Mozambique Apr-00 2001 Sep-01 11.10 1.20 1 40.15 88.58
Nicaragua Dec-00 2003 Jan-04 11.50 3.30 4 35.58 0.00
Niger Dec-00 2002 Apr-04 12.40 1.00 4 24.83 1.48
Rwanda Dec-00 2003 Apr-05 13.70 1.70 5 42.97 4137.85
Sao Tome & Principe Dec-00 2004 Mar-07 14.30 2.20 7 318.39 0.00
Senegal Jun-00 2002 Apr-04 15.60 3.70 4 33.30 3.99
Sierra Leone Mar-02 2004 Dec-06 16.40 3.10 4 62.87 707.45
Tanzania Apr-00 2001 Nov-01 19.30 1.80 1 59.30 0.32
Togo Nov-08 2009 Dec-10 24.70 2.30 2 52.63 22.21
Uganda Feb-00 2000 May-00 36.60 9.90 1 11.41 0.69
Zambia Dec-00 2003 Apr-05 0.00 0.00 5 124.10 0.13
TOTAL OF ALL RATIOS 5190.10
AVE RATIO PER INTERVAL 144.17
TOTAL # >=1 21.00
% OF HIPCS>= 1 0.58

|Page 26
𝐷𝐺𝐷𝑃𝑖 denotes the debt relief-to-GDP ratio,
𝐷𝐸𝑥𝑖 characterizes the debt relief-to-exports ratio, and
𝐻𝐼𝑃𝐶𝑖 represents the duration of the HIPC Initiative in each country, measured by
counting the number of years between the decision and completion dates.
III. SOURCES OF DATA FOR THE EXPLANATORY VARIABLES
A. THE CHANGE IN THE REAL GDP PER-CAPITA
GDP per capita is a measure of standard of living; when this economic factor rises over
time, the expectation holds that the standard of living in that economy is improving, thus
indirectly implying a decrease in future conflicts, as suggested by Miguel et al (2004). This
economic factor is chosen as the measure of economic growth for this study because it is
measured in each year in all the countries. The data for this measure is extracted from The World
Bank Data Outlook (2017). The observations are organized into Table A3 in the Appendix for
each of the 10 years before and the 5 years after the midpoint year of debt relief delivery. The
inclusion of the percentage change of the real GDP per capita as an explanatory variable follows
from the study conducted by Addison (2003); by measuring economic growth which is an
indicator of debt relief, the success of the HIPC Initiative was reflected through a reduction in
future conflict in his study. The percentage change of the real GDP per-capita is calculated as
follows:
𝐺𝐷𝑃𝑖 =𝐴𝑣𝑒𝑟𝑎𝑔𝑒 [𝑀,𝑀+5] − 𝐴𝑣𝑒𝑟𝑎𝑔𝑒 [𝑀−10,𝑀]
𝐴𝑣𝑒𝑟𝑎𝑔𝑒 [𝑀−10,𝑀]× 100% (3)

|Page 27
where 𝐴𝑣𝑒𝑟𝑎𝑔𝑒 [𝑀 − 10, 𝑀] measures the average of the real GDP per-capita from M-10 to M,
and 𝐴𝑣𝑒𝑟𝑎𝑔𝑒 [𝑀, 𝑀 + 5] is similarly measured from M to M+5. The results of this measure are
shown in Table 1 above and the calculations are recorded in Table A4 in the Appendix for each
of the 36 countries.
B. THE MEASURES OF THE IMPORTANCE OF DEBT RELIEF:
THE DEBT RELIEF-TO-GDP AND DEBT RELIEF-TO-EXPORTS RATIOS
In this study, the debt relief-to-GDP and debt relief-to-exports ratios are defined as the
measures of the importance of debt relief, both of which are regressed separately. Expectations
with regards to debt sustainability and trends of future conflicts can be forecasted accurately by
determining the need of debt relief with respect to the GDP or exports in the country. Both ratios
are evaluated at the completion date for each country within the program. The first ratio
measures the country’s gross debt relief agreed upon within the HIPC Initiative to the gross
domestic product (GDP). The second ratio is defined as the ratio between the agreed amount of
debt relief in the country and the net exports. The data on the debt relief-to-exports is derived
from International Monetary Fund (2010).
By regressing the variables on conflicts, the expectation that an economy is more
financially stable can be observed through a lower value for both ratios. When the amount of
debt relief provided to a country is negligible compared to the GDP and net exports in that
country, then the debt servicing payments are also lower and less of a burden on the financial
health of the economy. On the contrary, it is important to consider that if a developing country
receives partial debt relief, then that country did not necessarily receive enough relief. In this
case, the effect on the dependent variable will be observed in the opposite direction. For that

|Page 28
reason, only data for the less developed countries that have reached the completion point of the
HIPC Initiative will be considered for this study. The data for both measures is extracted from
the international reports posted by the IMF.
C. THE DURATION OF THE HIPC INITIATIVE
The debt relief can be received by a poor country at any time either as a lump sum, or as a
flow between the decision date and the completion date. Therefore, the duration of the HIPC
Initiative is the total number of years between the two significant dates for each country. The
value of the duration of the initiative is shown in Table 1. It can be hypothesized that the longer
the duration of the HIPC Initiative, the more likely that conflict will be reduced. Countries that
take longer to implement a poverty reduction strategy are likely to be more efficient in their
approach, resulting in a more stable economy that appreciates reduced conflicts in the future.
IV. DATA ON CONFLICT
In this study, conflict is defined based on the physical violence that is observed between
groups of people residing in the same country, namely battle-related casualties due to civil wars.
The reasons for the clashes may include the fight to appropriate resources into the country by
rebel groups, whether the resources are monetary or not. In order to capture the resulting
casualties from most of the conflicts observed in the HIPC countries, I build a data set for the
same timeline as the one provided for the debt-relief data compiled earlier. Mueller (2014)
provides a guideline on the important factors to consider when measuring conflict and suggests
the use of an empirical data set alongside theory to determine the causes and effects of conflict
on the economy of a country, on both a micro and macro level.

|Page 29
Two primary data sources are used: The Armed Conflict Location and Event Data Project
(2017, ACLED) and The Uppsala Conflict Data Program (2015, UCDP). ACLED provides data
on battle-related casualties in all African countries after 2006. In addition to the recorded real-
time casualties in each country, the locations and dates of the battles are provided. In contrast,
UCDP offers data on war-related casualties for major civil wars around the world from the early
1970’s. The Peace Research Institute hosts the UCDP data set and provides information and
reports on the recorded armed conflicts.7 I use both data sets jointly, along with the detailed
information on the armed conflicts in the less developed countries, to get the most insightful and
significant information (Peace Research Institute, 2006, 2017)
Both sources contain a lot of information which is condensed to fit the general
requirements for this study. In grouping the observed number of battle-related deaths in each year
for each country, the first step is to select the appropriate years for which conflict was observed.
The midpoint year between the decision and completion dates for the HIPC Initiative is used
when determining the civil war casualties. These values are observed for each of the years in the
time interval from M-10 to M+5 and are entered in Table A1 in the Appendix. This is done by
choosing the UCDP data set as the main source of the study. The information collected from this
source is internationally based, whereas the other data set only provides detailed information for
Africa. If any of the data is missing in this source, the information is extracted from the ACLED
project. This procedure is conducted to correct possible measurement errors in the data collection
in either of the sources. Some countries did not experience any civil wars during the time interval
of this study, while other countries did experience conflict but the number of battle-related deaths
7 Lacina and Gleditsch(2005) provides informational literature on the contributions and differences in each of the
data programs used to measure conflict.
|Page 30
may not have been measured accurately. Therefore, assuming there is no conflict in the country
at the time, the value of conflict is recorded as zero deaths.
V. STATISTICAL RESULTS
I. CAPTURING THE RELATIONHIP BETWEEN Ri AND 𝐼𝑀𝑃𝑖 THROUGH A
GRAPHICAL REPRESENTATION
The conflict coefficient ( 𝑅𝑖) is graphed against the two measures of the importance of
debt relief, the debt relief-to-exports ratio in Figure 1 and the debt relief-to-GDP ratio in Figure
2. Both graphs display the relationship between the conflict coefficient 𝑅𝑖 and the importance of
debt relief. Overall, as the value of 𝑅𝑖 increases, the values of the debt relief-to-exports ratio
decreases, although not substantially. This coincides with the results by Miguel et al (2004) in
their study of economic growth and its effect on the on-set of future conflict. To show this
relationship, a linear trend line is added to the data.
Based on the graphical representation of this analysis, it is observed that the debt relief-
to-exports ratio provides a stronger relationship than the debt relief-to-GDP ratio. The visual
interpretation suggests that at least a small correlation between 𝑅𝑖 and the debt relief-to-exports
ratio exists. In the case of the debt relief-to-GDP ratio, no significant correlation is observed
between the variables.

|Page 31
Figure 1. Measure of the Importance of Debt Relief-to-Exports (𝐷𝐸𝑥𝑖) to 𝑅𝑖
Figure 2. Measure of the Importance of Debt Relief-to-GDP (𝐷𝐺𝐷𝑃𝑖) to 𝑅𝑖

|Page 32
II. GRAPHICAL ANALYSIS SEPARATELY FOR EACH COUNTRY
In this section, an alternative graphical analysis is presented to visualize the extent to
which debt relief played a role in influencing civil war in each of the 36 countries separately. In
capturing the trend of economic progress in each country, the battle-related number of deaths and
the GDP per-capita are graphed from 10 years before the midpoint year to 5 years after. These 36
individual graphs can be found in Figure A1 of the Appendix. In most countries, there is an
increase in GDP per-capita over time. For example, beginning at 10 years prior to the midpoint
year, real GDP per-capita values are as low as 120 USD in Afghanistan and 372 USD in Zambia.
At 5 years after the midpoint year of debt relief assistance, the values in these two countries are
690 and 1366 USD respectively. The steady increase in the real GDP per-capita supports the
claim by Reinhart and Trebesch (2014) that the increase implies higher economic growth as a
result of debt relief.
Comparing the number of battle-related deaths from M-10 to M+5 to the real GDP per-
capita allows for a more formal approach in analyzing the effect of debt relief on future conflict.
For example, in Burundi and The Democratic Republic of Congo, I observe a steady decrease in
the battle-related number of deaths. The number of civil war deaths during the period of debt
relief under the HIPC Initiative decreased from 4250 and 13884 to 31 and 1770 respectively.
Although the trend is not as smooth for the other countries an overall decrease is generally
observed.
Figure 3 summarizes the trend of the percentage change in the real GDP per capita and of
battle-related number of deaths in all the countries enrolled under the HIPC Initiative. The
overall increase in the real GDP per-capita is observed overtime as well as a simultaneous

|Page 33
decrease in the measure of conflict. This visual analysis acknowledges that as the percentage
change in the GDP per-capita increased overtime in all the HIPC countries combined, the
Figure 3. Combined Measure of Real GDP Per-Capita VS Conflict Related Number of Deaths
average change in the measure of conflict decreased, although not to the same level of
significance. Through the validation of the values of the line of best fit, R2, it can be inferred
that while the R2 value for the measure of conflict is quite low at 0.34, the value for the measure
of the real GDP per-capita is exceptionally high, recorded at 0.99. This graphical interpretation
suggests that real GDP per-capita does contribute to the decrease of conflict, although at a
moderate level.
R² = 0.988
R² = 0.3452 0
5000
10000
15000
20000
25000
30000
35000
0
100000
200000
300000
400000
500000
600000
M-10 M-9 M-8 M-7 M-6 M-5 M-4 M-3 M-2 M-1 M M+1 M+2 M+3 M+4 M+5
Battle
-Re
lated
Nu
mb
er o
f De
aths
Re
al G
DP
Pe
r-C
apit
a
Years Relative to M
Combined Conflicts and GDP

|Page 34
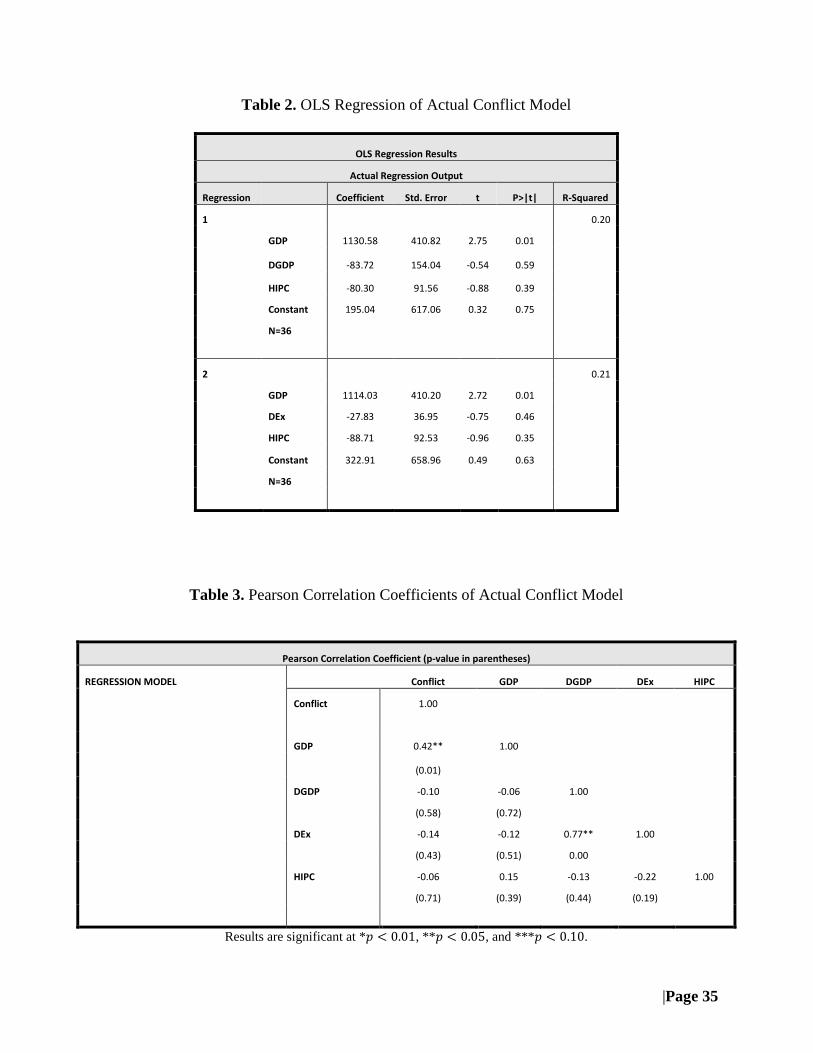
III. REGRESSION ANALYSIS
The results of the regression model presented in equation (1) are summarized below in
Table 2. There are two specifications, one involving the debt relief-to-GDP ratio and the other
with the debt relief-to-exports ratio, as a measure of the importance of the debt relief. The results
can be interpreted through the examination of the t-statistics and the p-values. The relationship
between the control variable (𝐺𝐷𝑃) and the change in average conflict result in an almost
identical t-statistic in both specifications. In the former model, the t-statistic is recorded at 2.75
with a probability of 0.01 while in the latter model, the recorded value is 2.72 with a probability
of 0.01. These results are consistent with the conclusion stated by Addison (2003) in that the
higher the growth in a country, the more likely the reduction of future conflict in that country
will be. Table 3 shows that the correlation coefficient between the GDP variable and the conflict
coefficient is 0.42, which is significant at the 5% level. In assessing the regression output directly
between the average change in conflict and the representations of the importance of debt relief,
different results are observed. In the first specification involving the debt relief-to-GDP ratio, the
t-statistic is recorded at -0.54, with a p-value of 0.59, while in the latter model involving the debt
relief-to-exports ratio, results provide a t-statistic of -0.75 with a p-value of 0.46. These results
coincide with those of Collier and Hoeffler (2002) in that development aid in the form of debt
relief has no significant direct effect on the reduction of civil conflict. While the coefficients
have the expected signs, there is no significant evidence of a relationship between the variable
and the measure of future conflict in this model. The Pearson correlations between conflict and
the two different measures of debt relief, shown in Table 3, are very low. The negative sign of
the duration coefficient (𝐻𝐼𝑃𝐶𝑖) is also reported as expected. However, the coefficient is not
significant at the 5% level.
|Page 35
Table 2. OLS Regression of Actual Conflict Model
OLS Regression Results
Actual Regression Output
Regression
Coefficient Std. Error t P>|t| R-Squared
1
0.20
GDP 1130.58 410.82 2.75 0.01
DGDP -83.72 154.04 -0.54 0.59
HIPC -80.30 91.56 -0.88 0.39
Constant 195.04 617.06 0.32 0.75
N=36
2
0.21
GDP 1114.03 410.20 2.72 0.01
DEx -27.83 36.95 -0.75 0.46
HIPC -88.71 92.53 -0.96 0.35
Constant 322.91 658.96 0.49 0.63
N=36
Table 3. Pearson Correlation Coefficients of Actual Conflict Model
Pearson Correlation Coefficient (p-value in parentheses)
REGRESSION MODEL
Conflict GDP DGDP DEx HIPC
Conflict 1.00
GDP 0.42** 1.00
(0.01)
DGDP -0.10 -0.06 1.00
(0.58) (0.72)
DEx -0.14 -0.12 0.77** 1.00
(0.43) (0.51) 0.00
HIPC -0.06 0.15 -0.13 -0.22 1.00
(0.71) (0.39) (0.44) (0.19)
Results are significant at *𝑝 < 0.01, **𝑝 < 0.05, and ***𝑝 < 0.10.

|Page 36
The limitations in the data could be a possible explanation for the inconsistency between
the results and the theoretical framework provided earlier. These limitations could include issues
of endogeneity with the error term, multicollinearity, measurement error, the omitted variable
bias, and reverse causality. The small sample size for this study of only 36 countries contributes
to another important shortcoming. Future studies may control for these inaccuracies, allowing for
the possibility of consistency between statistical results and historical literature and debates.
IV. FURTHER ANALYSIS OF THE CONFLICT COEFFICIENT
The results based on the regression analysis of the coefficient of conflict defined earlier
indicated a negative, but not significant relationship between the two measures of the importance
of debt relief and the change in conflict as measured by 𝑅𝑖. While in the regression analysis the
conclusion implied that debt relief did not play a role in reducing future conflict, a similar result
was found in the graphical investigation. In validating the fact that the best measure was chosen
to reach the conclusion in the following sections, this final questionable assumption will be
verified.
We observe that the value of the coefficient varies for each country as shown in Table 1.
In Burkina Faso, for instance, 𝑅𝑖 takes on the value of 0.03, indicating that the average number of
deaths prior to M was very small and after M was extremely large. In fact, the recorded number
of deaths in the country were 0.8 and 27.4 deaths per year respectively. In contrast, in Rwanda,
𝑅𝑖 is calculated at 4137.85. This observation indicates that the average number of deaths before
the midpoint year was very high, recorded at 51585.20 deaths per year and after the midpoint
year was 99.9% lower with 13.6 deaths per year. By examining the overall change in the number

|Page 37
of battle-related deaths in each of the countries through the calculation of 𝑅𝑖, a generalization
can be made about the success of the HIPC Initiative.
The value of the coefficient is found to be greater than or equal to 1 for 21 out of the 36
countries enrolled under the HIPC. Therefore, the data suggest that through the delivery of the
HIPC debt relief, 58% of the cases are shown to be successful in reducing future conflict.
Although this percentage is lower than expected, it is important to note that the conflict
coefficient was derived based on the average number of battle related deaths 10 years before M
and 5 years after. While this measure accounts for the analysis of the change in conflict due to
debt relief, it lacks the detailed interpretation of the reasons that certain civil wars came about -
was it due to financial tension, political tension or weak institutions? Since this detailed
information is not included in the model, the generalization is based exclusively on the activity of
the overall change in conflict 𝑅𝑖.
VI. CONCLUSION
This paper studied the impact of the 1999 Enhanced Heavily Indebted Poor Countries
Initiative (HIPC) on future conflicts. I generated an indicator for the observed change in conflict
during the initiative in each of the 36 countries of interest. While some countries showed little to
no conflict during the period, most of them were conflict inflicted both prior to and after the
delivery of debt relief. The general trend observed through the graphical approach was a modest
decrease in the number of battle-related deaths from M-10 to M+5, where M represents the
midpoint year between the decision and completion dates for the debt relief program.
The analysis of the conflict coefficient 𝑅𝑖 found that on average the HIPC Initiative was
only moderately effective in reducing future conflict. The results were not strong enough to

|Page 38
conclude that they were significant. Only 58% of the countries observed a numerical decrease in
the average number of deaths after receiving the final stock of debt relief. The consequence of
debt relief on future conflicts cannot be established with statistical significance when regressing
the proposed model relating the variables associated to debt relief and future conflict. The study
therefore concludes that even though debt relief may be a great economic advantage to countries,
there is no evidence that it had a bearing on the determination of future conflict. Although debt
relief frees up resources for increased development spending, it may also affect social conflicts in
different ways. For instance, debt relief can be considered as a source of financial resources that
caused the government to face a trade-off: either the government chooses to increase conflict-
reducing transfers to the rebel groups engaging in the conflict, or it chooses to increase the
fighting efforts against the rebel groups involved. It is important to note that most countries that
were conflict-inflicted prior to their enrollment into the HIPC were not completely stable during
and after the final delivery of debt relief.
Future studies can be conducted on how debt relief plays a role in reducing future conflict
with more relevant measures of civil war conflicts and more complete regressions. By identifying
precise explanatory variables in advanced regression analyses, the results may produce different
results. Many organizations, such as Plough Shares (2015), spend time on compiling data to
create geographic measures of armed conflicts on a yearly basis. Using this information to create
a detailed background has the potential to serve as a major asset in analyzing civil wars not only
within the HIPC’s, but also on a global scale to increase the sample size of the study. More
precise regressions could be performed with the importance of the measures of debt relief to
provide a deeper insight as to the role that these measures play in reducing future conflict.

|Page 39
VII. REFERENCES
Addison, T. (2003) ‘From Conflict to Recovery?’ In Addison, T. (ed.) From Conflict to
Recovery in Africa. Oxford University Press, 17–33
Addison, T., Hansen, H., and Tarp, F. (eds.) (2004) ‘Introduction.’ In Debt Relief for Poor
Countries. Palgrave Macmillan, 3–23
Addison, T., and Murshed, S (2003) ‘Debt Relief and Civil War.’ Journal of Peace
Research, 40(2), 159–176
African Development Bank Group (2017) ‘Debt Relief Initiatives.’ From
http://www.afdb.org/en/topics-and-sectors/initiatives-partnerships/debt-relief-initiatives/
(accessed June 1 2017)
Armed Conflict Location and Event Data Project (2017) ‘Home.’ From
http://www.acleddata.com/ (accessed May 6 2017)
Birdsall, N., and Williamson, J. (2002) Delivering on Debt Relief: From IMF Gold to a New
Aid Architecture. Washington, DC: Institute for International Economics
Collier, P., and Hoeffler, A (1998) On Economic Causes of Civil War. Oxford: University of
Oxford. Centre for the Study of African Economies
Collier, P., and Hoeffler, A (2002) ‘AID, Policy and Peace: Reducing the Risks of Civil
Conflict.’ Defense and Peace Economics 13(6), 435–450
Collier, P., and Hoeffler, A (2004) ‘Greed and Grievance in Civil War.’ Oxford Economic
Papers 56, 563–595
Collier, P., and Hoeffler, A (2007) ‘Unintended Consequences: Does Aid Promote Arms
Races?’ Oxford Bulletin of Economics and Statistics 69(1), 1–27
Collier, P., Hoeffler, A., and Soderbom, M (2004) ‘On the Duration of Civil War.’ Journal of
Peace Research 41(3), 253–273
Cruces, J., and Trebesch, C. (2013) ‘Sovereign Defaults: The Price of Haircuts.’ American
Economic Journal: Macroeconomics 5(3), 85–117
Das, U., Papaioannou, M., and Trebesch C (2012) ‘Restructuring Sovereign Debt: Lessons from
Recent History.’ From International Monetary Fund Seminar 19
De Ree, J., and Nillesen, E (2009) ‘Aiding Violence or Peace? The Impact of Foreign Aid on
the Risk of Civil Conflict in Sub-Saharan Africa.’ Journal of Development Economics
88(2), 301–313

|Page 40
International Monetary Fund and The World Bank (2001) ‘Assistance to Post-Conflict
Countries and the HIPC Framework.’ From
https://www.imf.org/external/np/hipc/2001/pc/042001.pdf (accessed May 13 2017)
International Monetary Fund (2001) ‘Debt Relief for Poverty Reduction: The Role of the
Enhanced HIPC Initiative.’ From http://www.imf.org/external/pubs/ft/exrp/debt/eng/
(accessed May 6 2017)
International Monetary Fund (2010) ‘Heavily Indebted Poor Countries (HIPC) Initiative and
Multilateral Debt Relief Initiative (MDRI)- Status of Implementation.’ From
http://www.imf.org/external/np/pp/eng/2010/091410.pdf (accessed May 12 2017)
International Monetary Fund (2017) ‘Factsheet - Debt Relief Under the Heavily Indebted Poor
Countries (HIPC) Initiative.’ From
http://www.imf.org/en/About/Factsheets/Sheets/2016/08/01/16/11/Debt-Relief-Under-
the-Heavily-Indebted-Poor-Countries-Initiative (accessed May 6 2017)
Lacina, B., and Gleditsch, N (2005) ‘Monitoring Trends in Global Combat: A New Dataset of
Battle Deaths.’ European Journal of Population 21, 145–166
Miguel, E., Satyanath, S., and Sergenti, E (2004) ‘Economic Shocks and Civil Conflict: An
Instrumental Variables Approach.’ Journal of Political Economy 112(4), 725–753
Mueller, H (2014) ‘How to Measure Conflict?’ From
http://focus.barcelonagse.eu/measure-conflict/ (accessed May 12 2017)
Peace Research Institute Oslo (2006) ‘Armed Conflicts 1946-2005.’ From
https://www.prio.org/Global/upload/CSCW/Data/UCDP/2006b/Conflict_List_1946-
2005.pdf
(accessed June 16 2017)
Peace Research Institute Oslo (2017) ‘Data on Armed Conflict.’ From
https://www.prio.org/Data/Armed-Conflict/ (accessed May 6 2017)
PloughShares (2015) ‘Armed Conflicts Report.’ From
http://pploughshares.wpengine.com/wp-content/uploads/2012/08/FINAL-VERSION-
2015-ARMED-CONFLICT-REPORT.pdf (accessed July 17 2017)
Reinhart, C., and Trebesch, C (2014) ‘A Distant Mirror of Debt, Default and Relief.’ NBER
Working Paper No. 20577
Reinhart, C., and Trebesch, C (2016) ‘Sovereign Debt Relief and its Aftermath.’ Journal of the
European Economic Association 14, 215–251
|Page 41
Ruggiero, G (1999) ‘The Latin American Debt Crisis: What were its Causes, and is it Over?”
From
http://www.angelfire.com/nj/GregoryRuggiero/latinamericancrisis.html (accessed June 1
2017)
Sarkees, M (2010) ‘The COW Typology of War: Defining and Categorizing Wars.’ From
http://www.correlatesofwar.org/data-sets/COW-war/the-cow-typology-of-war-defining-
and-categorizing-wars/view (accessed May 3 2017)
Uppsala Conflict Data Program (2015) ‘Recorded Fatalities in UCDP Organize Violence 1989-
2015.’ From http://ucdp.uu.se/#/exploratory (accessed May 6 2017)
World Bank (2016) ‘Heavily Indebted Poor Country (HIPC) Initiative.’ From
http://www.worldbank.org/en/topic/debt/brief/hipc (accessed May 6 2017)
World Bank Data Outlook (2017) ‘DataBank: Wold Development Indicator.’ From
http://databank.worldbank.org/data/reports.aspx?source=2&series=VC.BTL.DETH&coun
try=TCD# (accessed July 17 2017)

VIII. APPENDIX
Country Time Conflict Intensity (No. of Armed Conflict Deaths)
Decision
Date Midpoint Year [M]
Completion Date M-10 M-9 M-8 M-7 M-6 M-5 M-4 M-3 M-2 M-1 M M+1 M+2 M+3 M+4 M+5
Afghanistan Jul-07 2009 Jan-10 5065 5394 5553 1157 944 817 1711 4982 7004 5660 6499 7151 7565 7822 8131 12550
Benin Jul-00 2002 Mar-03 1 0 1 4 0 0 2 0 0 2 0 1 0 0 0 0
Bolivia Feb-00 2000 Jun-01 0 0 0 0 0 0 0 0 2
50 0 0 110 0 0
Burkina Faso Jul-00 2001 Apr-02 0 0 0 0 0 0 0 4 3 1 0 106 1 13 0 16
Burundi Aug-05 2007 Jan-09 4250 1258 1728 388 3915 2132 1471 536 586 174 61 190 68 153 112 31
Cameroon Oct-00 2003 Apr-06 47 102
56 6 8 1 16 3 4 4 10 52 31 71 234 Central African Republic Sep-07 2008 Jun-09 46 20 9 52 539 84 80 73 296 216 192 268 315 138 160 2364
Chad May-01 2008 Apr-15 85 180 560 133 499 155 470 517 1904 540 271 261 109 17 2 5
Comoros Jun-10 2011 Dec-12 0 0 0 0 0 0 0 0 0 0 0 0 0 0 0 0
Republic of Congo Mar-06 2007 Jan-10 10410 3761 977 96 3 234 33 10 15 1 2 1 100 0 1 2 Democratic Republic of Congo Jul-03 2007 Jul-10 13884 8019 7539 2974 1334 7863 3851 823 302 387 903 1737 5149 805 491 1770
Cote D'Ivoire Mar-09 2011 Jun-12 2 998 482 261 137 10 4 3 1 23 467 5 2 34 24 0
Ethiopia Nov-01 2003 Apr-04 133 76 1043 65 9 1005 30786 48666 388 809 1068 475 290 430 500 286
The Gambia Dec-00 2004 Dec-07 0 0 0 1 0 0 17 6 1 0 1 57 0 15 0 0
Ghana Feb-02 2003 Jul-04 2 2004 155
5 4 0 30 50 36 7 3 2 3 11 55
Guinea Dec-00 2006 Sep-12 13 27 0 12 13 256 430 14 2 5 3 15 45 6 160 1
Guinea-Bissau Dec-00 2005 Dec-10 0 0 0 505 199 0 13 1 3 7 5 68 2 5 6 0
Guyana Nov-00 2008 Dec-03 0 0 0 0 0 0 0 0 0 0 29 0 0 0 0 0
Haiti Nov-06 2008 Jun-09 0 11 0 0 0 0 231 40 46 4
0 0 0 0 0
Honduras Jun-00 2003 Apr-05 0 0 0 0 0 9 6
1 47 30
0
18 Liberia Mar-08 2009 Jun-10 70 101 481 2259 3281 19 16 0 1 0 0 1 18 0 3 26
Madagascar Dec-00 2003 Oct-04 0 0 0 0 0 0 0 1 2 79 5 1 5 2 25 2
Malawi Dec-00 2003 Aug-06 0 0 0 0 0 0 0 4 8 1 0 2 0 0 1 3
Mali Sep-00 2002 Mar-03 77 0 729 2
22 11 59 8 18 5 26 20 12 4 39
Mauritania Feb-00 2001 Jun-02 10 0 0 0 0 0 3 0 0 1 0 1 26 0 26 0
Mozambique Apr-00 2001 Sep-01 1914 521 0 0 0 0 0 0 0 1 0 0 0 1 12 2
Nicaragua Dec-00 2003 Jan-04 0 0 0 0 0 0 0 0 0 0 0 0 0 0 0 0
Niger Dec-00 2002 Apr-04 29 6 50 67 14 81 147 10 1 4 76 0 4 1 0 98
Rwanda Dec-00 2003 Apr-05 959 501961 4141 279 4698 1737 29
2044 1 3 16 4 17 19 9
Sao Tome & Principe Dec-00 2004 Mar-07 0 0 0 0 0 0 0 0 0 0 0 0 0 0 0 0
Senegal Jun-00 2002 Apr-04 135 285
330 5 366 344 31 56 47 45 39 3 1 129 8
Sierra Leone Mar-02 2004 Dec-06 2097 3194 943 1233 5165 4593 856 73 1 0 3 1 0 0 7 3
Tanzania Apr-00 2001 Nov-01 0 1 0 0 0 10 26 20 0 64 37 180 3 17 20 12
Togo Nov-08 2009 Dec-10 4 1 0 0 2 2 436 0 0 1 2 0 1 0 8 0
Uganda Feb-00 2000 May-00 809 1018 76
160 537 1765 1354 1220 1044 1229 212 1319 1627 2009 922
Zambia Dec-00 2003 Apr-05 1 0 0 0 1 1 4 3 7 0 14 6 0 25 75 11
TOTAL
40043 528938 24467 9874 20929 19945 42743 57276 13955 9177 11011 10833 15103 11285 12025 18449
Table A1: Decision Date, Midpoint Year, Completion Date and Conflict Intensity Every Year
Between M-10 and M+5 for HIPC Countries

|Page 43
Table A2: Total and Average Conflict Intensity during Sub-Periods for HIPC Countries
Country Total Number of Conflict Deaths Average Number of Conflict Deaths
M-10 to M-5 M-5 to M M-10 to M M to M+5 M-10 to M-5 M-5 to M M-10 to M M to M+5
Afghanistan 18930 26673 8.57 49718 3155.00 4445.50 4071.45 8286.33
Benin 6 4 7.86 1 1.00 0.67 0.91 0.17
Bolivia 0 52 846.29 160 0.00 8.67 4.73 26.67
Burkina Faso 0 8 35.19 136 0.00 1.33 0.73 22.67
Burundi 13671 4960 414.57 615 2278.50 826.67 1499.91 102.50
Cameroon 219 36 295.10 402 36.50 6.00 22.45 67.00 Central African Republic 750 941 0.00 3437 125.00 156.83 146.09 572.83
Chad 1612 3857 747.67 665 268.67 642.83 483.09 110.83
Comoros 0 0 3005.29 0 0.00 0.00 0.00 0.00
Republic of Congo 15481 295 116.81 106 2580.17 49.17 1412.91 17.67 Democratic Republic of Congo 41613 14129 4157.62 10855 6935.50 2354.83 4352.64 1809.17
Cote D'Ivoire 1890 508 5.19 532 315.00 84.67 217.09 88.67
Ethiopia 2331 82722 115.43 3049 388.50 13787.00 7640.73 508.17
The Gambia 1 25 55.05 73 0.17 4.17 2.36 12.17
Ghana 2170 127 40.48 81 361.67 21.17 208.45 13.50
Guinea 321 710 1.38 230 53.50 118.33 70.45 38.33
Guinea-Bissau 704 29 15.81 86 117.33 4.83 66.64 14.33
Guyana 0 29 11.69 29 0.00 4.83 2.64 4.83
Haiti 11 321 299.10 0 1.83 53.50 30.18 0.00
Honduras 9 93 20.67 48 1.50 15.50 8.45 8.00
Liberia 6211 36 1.95 48 1035.17 6.00 566.18 8.00
Madagascar 0 87 79.62 40 0.00 14.50 7.91 6.67
Malawi 0 13 4.71 6 0.00 2.17 1.18 1.00
Mali 830 123 118.43 106 138.33 20.50 84.64 17.67
Mauritania 10 4 0.00 53 1.67 0.67 1.27 8.83
Mozambique 2435 1 33.52 15 405.83 0.17 221.45 2.50
Nicaragua 0 0 24570.19 0 0.00 0.00 0.00 0.00
Niger 247 319 0.00 179 41.17 53.17 44.09 29.83
Rwanda 513775 3814 92.05 68 85629.17 635.67 46895.64 11.33
Sao Tome & Principe 0 0 865.71 0 0.00 0.00 0.00 0.00
Senegal 1121 889 22.05 225 186.83 148.17 149.45 37.50
Sierra Leone 17225 5526 22.14 14 2870.83 921.00 1650.73 2.33
Tanzania 11 157 759.86 269 1.83 26.17 14.36 44.83
Togo 9 441 10.57 11 1.50 73.50 40.73 1.83
Uganda 2600 7149 9212 7318 433.33 1191.50 837.45 1219.67
Zambia 3 29 31 131 0.50 4.83 2.82 21.83

|Page 44
Table A3: Real GDP Per-Capita as a Measure of Debt Relief Every Year Between M-10 and M+5 for HIPC Countries
Country Time Amount of Debt Relief GDP Per Capita
Decision
Date Midpoint Year [M]
Completion Date
NPV Terms (Mill USD)
Nominal Terms (Mill USD) M-10 M-9 M-8 M-7 M-6 M-5 M-4 M-3 M-2 M-1 M M+1 M+2 M+3 M+4 M+5
Afghanistan Jul-07 2009 Jan-10 582 1280
120 192 204 225 257 280 380 384 459 570 622 691
Benin Jul-00 2002 Mar-03 262 460 315 407 276 362 382 357 375 399 370 374 412 509 571 587 609 686
Bolivia Feb-00 2000 Jun-01 1330 2060 710 764 791 788 806 887 958 1007 1059 1013 1007 958 914 917 978 1046
Burkina Faso Jul-00 2001 Apr-02 553 930 346 241 244 193 236 249 229 256 265 226 235 261 324 371 407 422
Burundi Aug-05 2007 Jan-09 833 1366 152 137 122 129 126 115 106 119 141 155 159 183 190 214 241 244
Cameroon Oct-00 2003 Apr-06 1267 4917 1028 681 627 680 669 637 676 583 589 648 791 893 915 965 1071 1192 Central African Republic Sep-07 2008 Jun-09 578 804 270 274 245 246 257 291 318 333 354 404 464 454 447 488 473 322
Chad May-01 2008 Apr-15 170 260 225 191 166 197 221 293 455 660 712 801 929 804 896 988 973 985
Comoros Jun-10 2011 Dec-12 146 136 392 429 539 610 615 641 712 786 769 759 819 778 823 841 717 ..
Republic of Congo Mar-06 2007 Jan-10 7252 15222 808 660 776 1036 878 927 1049 1362 1738 2145 2259 3094 2428 2953 3453 3191 Democratic Republic of Congo Jul-03 2007 Jul-10 1575 1738 137 136 101 397 150 171 170 190 213 247 273 311 286 311 350 391
Cote D'Ivoire Mar-09 2011 Jun-12 1576 3415 664 718 875 930 942 963 1079 1258 1233 1236 1232 1281 1446 1544 1399 ..
Ethiopia Nov-01 2003 Apr-04 1935 3275 165 125 134 145 141 125 119 124 120 112 119 136 162 194 244 326
The Gambia Dec-00 2004 Dec-07 67 112 720 738 774 713 725 683 637 543 442 361 415 433 440 520 609 550
Ghana Feb-02 2003 Jul-04 2187 3500 375 333 386 404 392 416 420 265 275 312 376 426 502 930 1099 1234
Guinea Dec-00 2006 Sep-12 639 800 476 454 422 400 340 316 324 371 387 304 296 407 433 430 430 448
Guinea-Bissau Dec-00 2005 Dec-10 489 790 215 224 218 164 174 281 292 303 340 371 401 396 455 553 517 518
Guyana Nov-00 2008 Dec-03 610 1354 973 939 960 937 972 999 1059 1111 1961 2334 2570 2698 2999 3409 3759 3929
Haiti Nov-06 2008 Jun-09 140 213 451 494 462 414 393 330 388 465 505 616 675 668 662 741 767 810
Honduras Jun-00 2003 Apr-05 556 1000 655 629 700 705 796 869 879 1138 1187 1196 1228 1299 1406 1547 1721 1900
Liberia Mar-08 2009 Jun-10 2739 4600 161 183 174 177 133 149 168 178 210 231 302 327 379 414 453 458
Madagascar Dec-00 2003 Oct-04 836 1900 267 228 235 288 247 253 244 246 279 263 317 246 276 293 379 472
Malawi Dec-00 2003 Aug-06 939 1628 214 122 142 228 260 166 163 156 149 297 265 280 287 305 328 383
Mali Sep-00 2002 Mar-03 539 895 318 309 222 281 281 265 280 320 267 305 332 389 436 485 518 592
Mauritania Feb-00 2001 Jun-02 622 1100 694 684 568 581 606 600 566 539 535 477 463 459 525 598 693 938
Mozambique Apr-00 2001 Sep-01 2143 4300 238 161 162 160 158 215 251 281 298 275 254 260 281 333 366 382
Nicaragua Dec-00 2003 Jan-04 3308 4500 397 855 898 917 917 952 981 1016 1044 1010 1016 1092 1175 1245 1351 1518
Niger Dec-00 2002 Apr-04 644 1190 278 184 173 201 205 183 199 186 160 167 180 218 235 253 261 295
Rwanda Dec-00 2003 Apr-05 651 1316 313 126 219 227 285 282 240 216 201 196 213 237 287 337 398 492
Sao Tome & Principe Dec-00 2004 Mar-07 117 263
516 563 658 704 824 859 911 1149 1123
Senegal Jun-00 2002 Apr-04 488 850 751 690 457 560 567 510 536 535 475 482 513 643 732 773 808 949
Sierra Leone Mar-02 2004 Dec-06 675 994 236 227 246 221 173 170 157 256 280 295 294 321 360 400 454 441
Tanzania Apr-00 2001 Nov-01 2026 3000 194 174 156 160 181 217 251 298 301 308 306 310 326 348 446 476
Togo Nov-08 2009 Dec-10 282 360 332 266 266 287 317 357 379 384 428 523 509 496 572 573 589 630
Uganda Feb-00 2000 May-00 1027 1950 248 185 154 168 202 282 287 289 295 261 261 238 244 242 293 321
Zambia Dec-00 2003 Apr-05 2499 3900 372 405 411 379 441 353 330 340 377 376 429 531 692 1030 1103 1366

|Page 45
Table A4: Change in the Real GDP Per-Capita for HIPC Countries
Country
Time
Percentage Change in the Real GDP Per Capita
Decision Date Midpoint Year [M] Completion Date Ave M-10 to M Ave M to M+5 % Change (GDP)
Afghanistan Jul-07 2009 Jan-10 150.77 517.78 243.43
Benin Jul-00 2002 Mar-03 366.31 562.29 53.50
Bolivia Feb-00 2000 Jun-01 890.11 970.16 8.99
Burkina Faso Jul-00 2001 Apr-02 247.46 336.84 36.12
Burundi Aug-05 2007 Jan-09 132.85 205.23 54.48
Cameroon Oct-00 2003 Apr-06 691.73 971.19 40.40
Central African Republic Sep-07 2008 Jun-09 314.15 441.42 40.51
Chad May-01 2008 Apr-15 440.90 929.21 110.75
Comoros Jun-10 2011 Dec-12 642.71 663.11 3.17
Republic of Congo Mar-06 2007 Jan-10 1239.87 2896.53 133.62
Democratic Republic of Congo Jul-03 2007 Jul-10 198.69 320.42 61.27
Cote D'Ivoire Mar-09 2011 Jun-12 1011.79 1150.41 13.70
Ethiopia Nov-01 2003 Apr-04 129.90 196.74 51.45
The Gambia Dec-00 2004 Dec-07 613.66 494.45 -19.43
Ghana Feb-02 2003 Jul-04 359.46 761.10 111.73
Guinea Dec-00 2006 Sep-12 372.00 407.42 9.52
Guinea-Bissau Dec-00 2005 Dec-10 271.20 473.52 74.60
Guyana Nov-00 2008 Dec-03 1346.84 3227.33 139.62
Haiti Nov-06 2008 Jun-09 472.13 720.57 52.62
Honduras Jun-00 2003 Apr-05 907.48 1516.80 67.14
Liberia Mar-08 2009 Jun-10 187.91 388.85 106.93
Madagascar Dec-00 2003 Oct-04 260.62 330.51 26.82
Malawi Dec-00 2003 Aug-06 196.44 308.05 56.82
Mali Sep-00 2002 Mar-03 289.04 458.76 58.72
Mauritania Feb-00 2001 Jun-02 573.88 612.77 6.78
Mozambique Apr-00 2001 Sep-01 223.02 312.57 40.15
Nicaragua Dec-00 2003 Jan-04 909.18 1232.62 35.58
Niger Dec-00 2002 Apr-04 192.41 240.19 24.83
Rwanda Dec-00 2003 Apr-05 228.81 327.13 42.97
Sao Tome & Principe Dec-00 2004 Mar-07 221.88 928.33 318.39
Senegal Jun-00 2002 Apr-04 552.37 736.30 33.30
Sierra Leone Mar-02 2004 Dec-06 232.23 378.24 62.87
Tanzania Apr-00 2001 Nov-01 231.43 368.69 59.30
Togo Nov-08 2009 Dec-10 367.91 561.55 52.63
Uganda Feb-00 2000 May-00 239.11 266.40 11.41
Zambia Dec-00 2003 Apr-05 383.07 858.48 124.10

Figure A1. Real GDP Per-Capita VS Conflict Related Number of Deaths Every Year Between M-10 and M+5 for HIPC Countries
Note that the primary vertical axis (left axis) represents the Battle-Related Number of Deaths, while the secondary vertical axis
(right axis) represents the Real Per-Capita GDP. The bar graph characterizes the trend of the Real Per-Capita GDP over time, whereas
the dotted markers symbolize the conflict measure of civil war deaths.
Figure A1a. Afghanistan
Figure A1b. Benin
0
100
200
300
400
500
600
700
800
0
2000
4000
6000
8000
10000
12000
14000 Afghanistan
0
100
200
300
400
500
600
700
800
0
0.5
1
1.5
2
2.5
3
3.5
4
4.5 Benin

|Page 47
0
200
400
600
800
1000
1200
0
20
40
60
80
100
120Bolivia
0
50
100
150
200
250
300
350
400
450
0
20
40
60
80
100
120Burkina Faso
0
50
100
150
200
250
300
0
500
1000
1500
2000
2500
3000
3500
4000
4500Burundi
0
200
400
600
800
1000
1200
1400
0
50
100
150
200
250Cameroon
Figure A1c. Bolivia Figure A1d. Burkina Faso
Figure A1e. Burundi Figure A1f. Cameroon

|Page 48
0
100
200
300
400
500
600
0
500
1000
1500
2000
2500Central Africa
0
200
400
600
800
1000
1200
0
200
400
600
800
1000
1200
1400
1600
1800
2000Chad
0
100
200
300
400
500
600
700
800
900
0
0.1
0.2
0.3
0.4
0.5
0.6
0.7
0.8
0.9
1Comoros
0
500
1000
1500
2000
2500
3000
3500
4000
0
2000
4000
6000
8000
10000
12000Republic of Congo
Figure A1g. Central Africa Figure A1h. Chad
Figure A1i. Comoros Figure A1j. Republic of Congo

|Page 49
0
50
100
150
200
250
300
350
400
450
0
2000
4000
6000
8000
10000
12000
14000
16000Democratic Republic of Congo
0
200
400
600
800
1000
1200
1400
1600
1800
0
200
400
600
800
1000
1200Coté D'Ivoire
0
100
200
300
400
500
600
700
800
900
0
10
20
30
40
50
60The Gambia
0
50
100
150
200
250
300
350
0
10000
20000
30000
40000
50000
60000Ethiopia
Figure A1m. The Gambia Figure A1n. Ethiopia
Figure A1k. Democratic Republic of Congo Figure A1l. Coté D’Ivoire
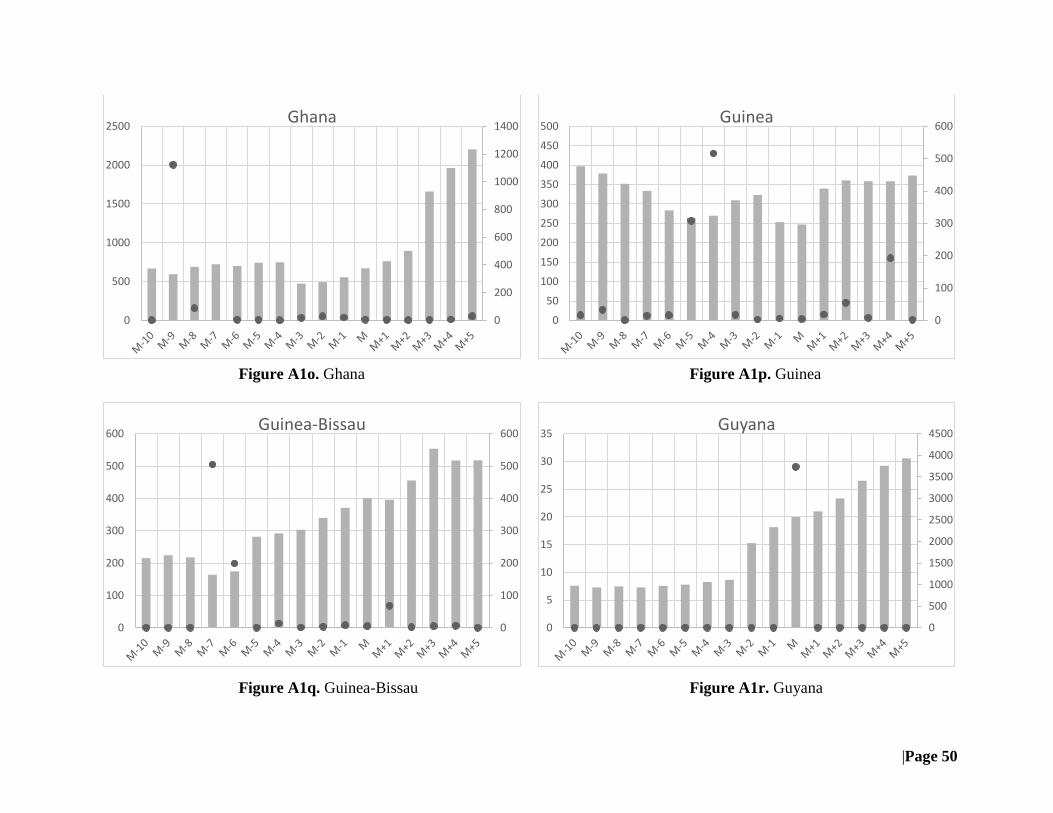
|Page 50
0
200
400
600
800
1000
1200
1400
0
500
1000
1500
2000
2500Ghana
0
100
200
300
400
500
600
0
50
100
150
200
250
300
350
400
450
500Guinea
0
100
200
300
400
500
600
0
100
200
300
400
500
600Guinea-Bissau
0
500
1000
1500
2000
2500
3000
3500
4000
4500
0
5
10
15
20
25
30
35Guyana
Figure A1o. Ghana Figure A1p. Guinea
Figure A1q. Guinea-Bissau Figure A1r. Guyana

|Page 51
0
100
200
300
400
500
600
700
800
900
0
50
100
150
200
250Haiti
0
200
400
600
800
1000
1200
1400
1600
1800
2000
0
5
10
15
20
25
30
35
40
45
50Honduras
0
50
100
150
200
250
300
350
400
450
500
0
500
1000
1500
2000
2500
3000
3500Liberia
0
50
100
150
200
250
300
350
400
450
500
0
10
20
30
40
50
60
70
80
90Madagascar
Figure A1s. Haiti Figure A1t. Honduras
Figure A1u. Liberia Figure A1v. Madagascar
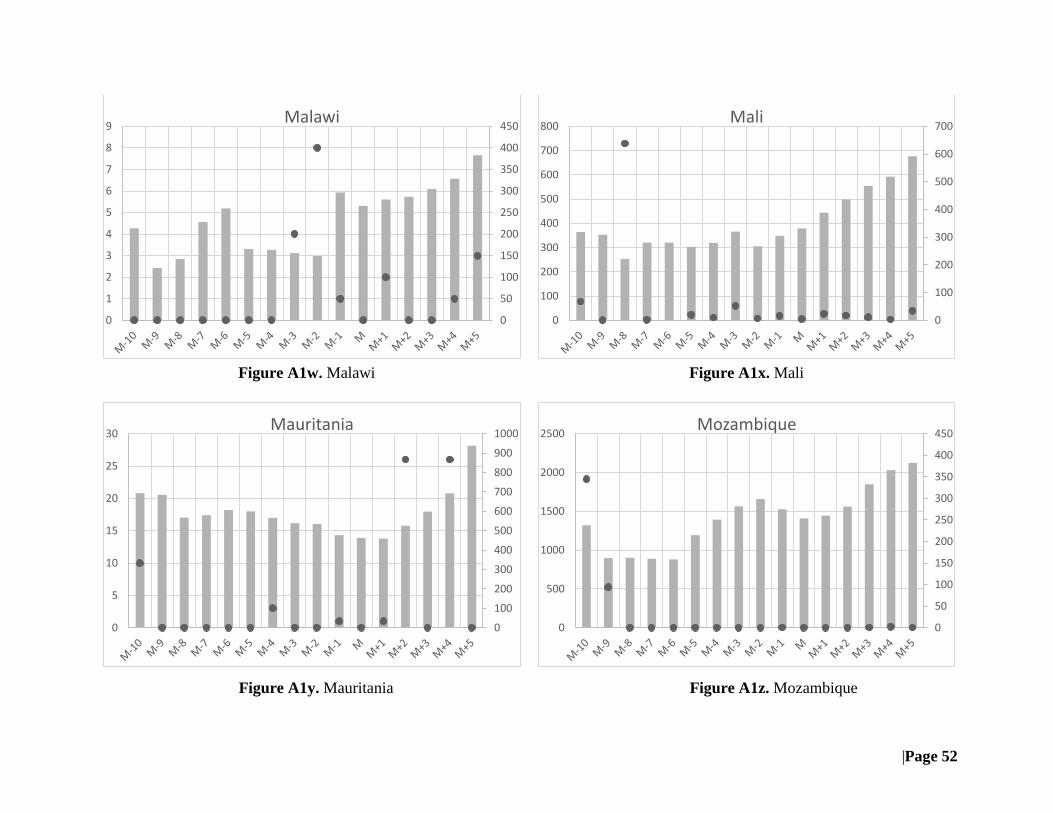
|Page 52
0
50
100
150
200
250
300
350
400
450
0
1
2
3
4
5
6
7
8
9Malawi
0
100
200
300
400
500
600
700
0
100
200
300
400
500
600
700
800Mali
0
100
200
300
400
500
600
700
800
900
1000
0
5
10
15
20
25
30Mauritania
0
50
100
150
200
250
300
350
400
450
0
500
1000
1500
2000
2500Mozambique
Figure A1w. Malawi Figure A1x. Mali
Figure A1y. Mauritania Figure A1z. Mozambique
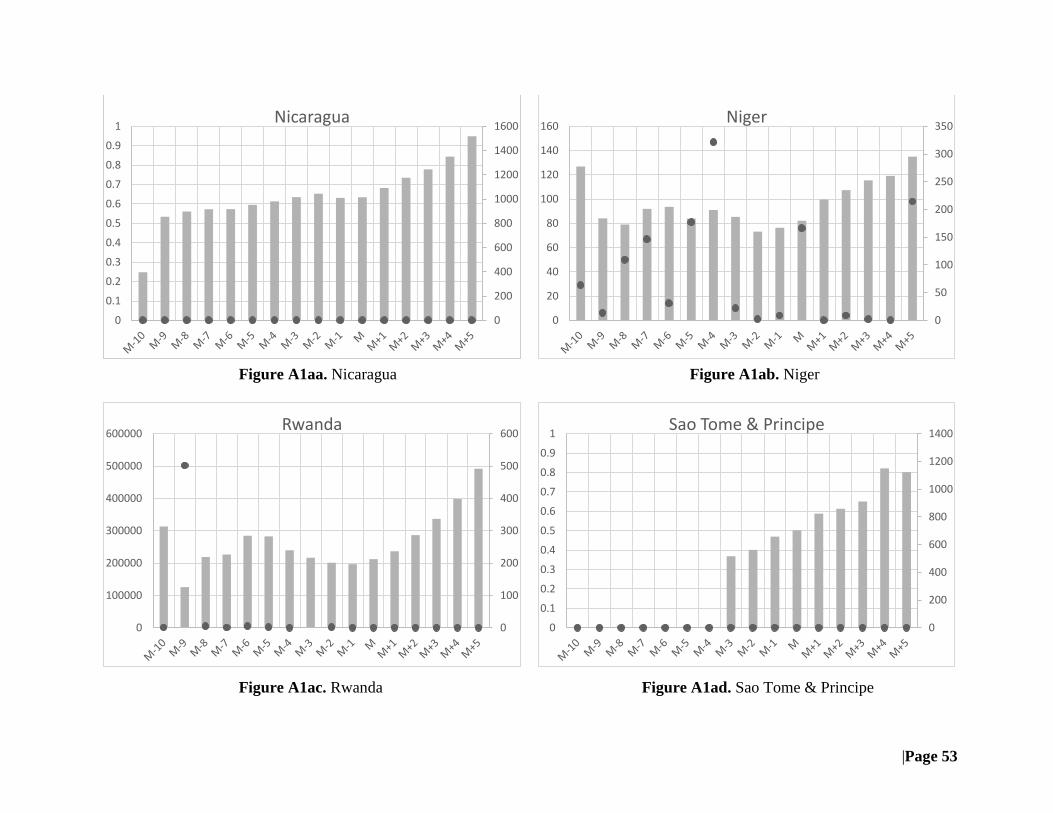
|Page 53
0
200
400
600
800
1000
1200
1400
1600
0
0.1
0.2
0.3
0.4
0.5
0.6
0.7
0.8
0.9
1Nicaragua
0
50
100
150
200
250
300
350
0
20
40
60
80
100
120
140
160Niger
0
100
200
300
400
500
600
0
100000
200000
300000
400000
500000
600000Rwanda
0
200
400
600
800
1000
1200
1400
0
0.1
0.2
0.3
0.4
0.5
0.6
0.7
0.8
0.9
1Sao Tome & Principe
Figure A1aa. Nicaragua Figure A1ab. Niger
Figure A1ac. Rwanda Figure A1ad. Sao Tome & Principe

|Page 54
0
100
200
300
400
500
600
700
800
900
1000
0
50
100
150
200
250
300
350
400Senegal
0
50
100
150
200
250
300
350
400
450
500
0
1000
2000
3000
4000
5000
6000Sierra Leone
0
50
100
150
200
250
300
350
400
450
500
0
20
40
60
80
100
120
140
160
180
200Tanzania
0
100
200
300
400
500
600
700
0
50
100
150
200
250
300
350
400
450
500Togo
Figure A1ae. Senegal Figure A1af. Sierra Leone
Figure A1af. Tanzania Figure A1ag. Togo

|Page 55
0
50
100
150
200
250
300
350
0
500
1000
1500
2000
2500Uganda
0
200
400
600
800
1000
1200
1400
1600
0
10
20
30
40
50
60
70
80Zambia
Figure A1ah. Uganda Figure A1ag. Zambia