the age of scarcity - cibcwm.comresearch.cibcwm.com/economic_public/download/sapr08.pdfcibc world...
TRANSCRIPT

JeffreyRubin AveryShenfeld BenjaminTal PeterBuchanan WarrenLovely DavidBezic (416)594-7357 (416594-7356 (416)956-3698 (416)594-7354 (416)594-7359 (416)956-3219
CIBC World Markets Inc. • PO Box 500, 161 Bay Street, BCE Place, Toronto, Canada M5J 2S8 • Bloomberg @ WGEC1 • (416) 594-7000C I B C W o r l d M a r k e t s C o r p • 3 0 0 M a d i s o n A v e n u e , N e w Yo r k , N Y 1 0 0 1 7 • ( 2 1 2 ) 8 5 6 - 4 0 0 0 , ( 8 0 0 ) 9 9 9 - 6 7 2 6
Strategecon
Economics & Strategy
http://research.cibcwm.com/res/Eco/EcoResearch.html
JeffreyRubin(416)594-7357
AveryShenfeld(416)594-7356
BenjaminTal(416)956-3698
PeterBuchanan(416)594-7354
MenyGrauman(416)956-6527
KrishenRangasamy(416)956-3219
Whetherwearealreadyatthepeakinworldoilproductionremainstobeseen,but it isincreasingly clear that the outlook for oilsupply signals a period of unprecedentedscarcity.
Ourlatestreviewofprobablesupplysuggestsoilproductionwill hardlygrowatall,withaveragedailyproductionbetweennowand2012 rising by barely more than a millionbarrelsperday(seepages4-7).Despitetherecentrecordjumpinoilprices,theoutlooksuggeststhatoilpriceswillcontinuetorisesteadily over the next five years, almostdoublingfromcurrentlevels.
By recent benchmarks, our supply outlookis moderately optimistic. Widely followedestimatesofglobaloilproduction, suchasthosefromtheInternationalEnergyAgency,includemillionsofbarrelsperdayofotherhydrocarbons commonly referred to asnaturalgasliquids.Crudeoilproductionhasnotgrownatall in the last two-and-a-halfyears,despiteadoublinginworldoilprices.All of the supply increase has come fromnaturalgasliquids.
That’sfineifyouneedtorefillyourlighter,butnotsogreatifyourgastankrunsdry.Whilenaturalgasliquidssuchasbutane,propane,and hexane are valuable hydrocarbons intheirownright,theycannotbeusedtomeetthe world’s growing appetite for gasoline,diesel,orjetfuel.
Transportfuelsnowaccountforhalfoftheworld’soilusage,andhavedrivenover90%ofdemandgrowthinrecentyears.Therisein natural gas liquids found in current oilproduction is not a technical coincidencethat will soon reverse itself. Instead it is asign of accelerating depletion as decliningwellpressurereleasesincreasingamountsoftrappednaturalgasinmatureoilfields.
It is also a sign of a growing mismatchbetweendemandandsupply.Whatnewcarowners inBRICcountriesandelsewhere inthedevelopingworldwillbedemandingisgasolineanddiesel,notbutane.
While global oil supply is not growing,globalgasolinedemandis,andwillcontinuetogrowascheapcarsfromTataandCherydramatically cut barriers to car ownershipin the developing world. Millions of newhouseholds will suddenly have straws tostartsuckingattheworld’srapidlyshrinkingoilreserves.
As they do, world oil prices will continueto rise andkill demand in themoreprice-sensitive OECD markets. In order toaccommodatemoredriverson the road inRussia,ChinaandIndia,theremustbefewerdriversintheUSandtherestoftheOECD.Andsotherewillbe.USoilconsumptionislikelytofallbyover2mnbbl/dayoverthenextfiveyearsas retailgasolineprices risefrom the current US$3.60/gallon mark toalmostUS$7/gallonby2012.
“Despite the recent record jump in oil prices, the outlook suggests that oil prices will continue to rise steadily over the next five years, almost doubling f r o m c u r r e n t levels.”
The Age of ScarcitybyJeffRubin
April 24, 2008

CIBC World Markets InC. StrategEcon - April 24, 2008
2
MARKET CALL
INTEREST & FOREIGN EXCHANGE RATES
AdividedFedisgoingtobelimitedto25-bpratecutsfromhereon,andwithgrowthlikelytoresumeinthesecondhalf,we’vereducedourcallforfurthercutsbyaquarter-point,leavingabitlessscopeforarallyinTreasuries.Our1.5%targetwillstillseethefundsrategobeyondwhat’scurrentlypricedin,asastringofjoblosseskeepthepressureontheFedtoaddtotheexistingstimulus.
TheCanadiancurveisalreadypricinginourcallforonefurtherquarter-pointeasingbytheBankofCanada,butcouldrallyabitinsympathywithTreasuries.Lookforasecond-halfsell-offasboththeUSandCanadianeconomiesgathermomentum,andriskaversionthathasbenefitedgovernmentbondsbeginstoabate.
Althoughtheeurohashadastrongrun,we’readdingabitmoreupsidetoourforecastinthenearterm,asFedratecutsandhawkishtalk(butnoaction)fromtheECBkeepthedollarundersiege.FortheC$,thebestdaysarelikelytocomelaterintheyearastheUSeconomyshowssignsoflife,dampeningdownsideriskstotheCanadianeconomy.Whilewe’reexpectingasmalleryieldedgeforCanadathanearlier,thatwillbeoffsetbyahigherforecasttrajectoryforenergyprices.
•
•
•
2008 2009
END OF PERIOD: 23-Apr Jun Sep Dec Mar Jun
CDA Overnight target rate 3.00 2.75 2.75 2.75 2.75 3.0098-Day Treasury Bills 2.55 2.30 2.40 2.65 2.70 2.80Chartered Bank Prime 4.75 4.50 4.50 4.50 4.50 4.752-Year Gov't Bond (3.75% 6/10) 2.78 2.45 2.70 3.10 3.35 3.5010-Year Gov't Bond (4% 06/17) 3.67 3.45 3.50 3.70 3.80 4.0030-Year Gov't Bond (5% 06/37) 4.16 4.00 4.00 4.10 4.15 4.20
U.S. Federal Funds Target 2.25 1.50 1.50 1.50 1.50 1.7591-Day Treasury Bills 1.22 0.95 1.00 1.20 1.45 1.652-Year Gov't Note (1.75% 3/10) 2.20 1.80 1.85 2.00 2.45 2.8010-Year Gov't Note (3.5% 02/18) 3.74 3.45 3.50 3.85 3.95 4.2030-Year Gov't Bond (4.375% 02/38) 4.49 4.20 4.25 4.30 4.35 4.45
Canada - US T-Bill Spread 1.33 1.35 1.40 1.45 1.25 1.15Canada - US 10-Year Bond Spread -0.07 0.00 0.00 -0.15 -0.15 -0.20
Canada Yield Curve (30-Year — 2-Year) 1.38 1.55 1.30 1.00 0.80 0.70US Yield Curve (30-Year — 2-Year) 2.29 2.40 2.40 2.30 1.90 1.65
EXCHANGE RATES — (US¢/C$) 98.4 101.5 104.7 105.0 103.1 102.0— (C$/US$) 1.016 0.985 0.955 0.952 0.970 0.980— (Yen/US$) 103 100 103 103 98 96— (US$/euro) 1.59 1.62 1.62 1.56 1.50 1.49— (US$/pound) 1.98 2.00 1.99 1.96 1.90 1.88— (US¢/A$) 94.5 95.0 94.0 93.0 92.5 91.0

CIBC World Markets InC. StrategEcon - April 24, 2008
�
STRATEGY AND EARNINGS OUTLOOK
•
•
•
WithmoreinterestratecutsexpectedfromboththeFederalReserveBoardandtheBankofCanada,weremainedoverweightbondsattheexpenseofcash.Whilefurthersubprime-relatedwritedownscreatenear-termrisksforstocks,promptingustoremainjustindex-weightthatassetgroupfornow,weseetheTSXrecoveringtonearrecordhighslaterthisyear.Afurtherlegupto16,200islikelyoverthecourseof2009.
Resourcestocks,withtheirpredominantlyglobaldemandexposure,remainoneofthebetterplacesforridingoutahousingandfinancialservices-centredUSrecession.Energystocksinparticularappeartorepresentgoodvalue,givenabullishoutlookfornaturalgasandourupdatedaverageWTIpriceforecastofUS$115/bblin2008andUS$130/bblin2009(seepages4-7).MaterialstockshavealsocontributedtotheTSXmarkedoutperformanceoftheS&Pthisyear.Addedgreenbackselling,alongsideFedcutsandinflationjittersshouldhelpgoldrecoupitsrecentlosses.Thecontinuingliftfromtheglobalfoodcrisistoagriculturalchemicalsvaluationsisanotherreasonforremainingoverweightmaterials.
ThesofterglobalM&Aclimateandgrowingsaturationonthehighlyprofitablewirelesssidecontributestoourcautiononthetelecoms.Offsettingourheightenedenergyexposure,weconsequentlylightenedupfurtheronthatsector.Wealsoremainedunderweightfinancialstocksgiventhetwo-prongedthreatofmoreassetwritedownsanddragonearningsfromweakeninglevelsofcapitalmarketactivityandeconomicgrowth.
Source: Thomson First Call, CIBC WM
ASSET MIX (%) Benchmark Strategy Rec-ommendation
Stocks 54 54Bonds 38 42Cash 8 4GICS SECTOR EQUITIES (%)Consumer Discretionary 4.3 1.8Consumer Staples 2.4 2.9Energy 29.0 35.0Financials 28.3 25.8 -Banks 15.7 13.7 -Insur., REITs, oth. 12.6 12.1Healthcare 0.4 0.4Industrials 5.3 3.3Info Tech 4.8 3.8Materials 19.0 21.0 -Gold 8.4 9.4 -Other Metals 5.5 6.5Telecom 4.9 2.4Utilities 1.6 3.6Note: Bold indicates recommended overweight.
14,50016,200
12,90813,833
0
4,000
8,000
12,000
16,000
20,000
2006 2007 2008 2009
TSX Composite Index (close) Projected
733826
9171027
0
200
400
600
800
1000
1200
2006 2007 2008 2009
CIBCWM Fcst
TSX Index-Adj. Oper. Earnings
12%
17%
11%13%
2005 2006 2007 2008 LatestConsumer Discretionary 1.4 12.1 21.0 7.0 13.1Materials 56.6 81.0 1.6 15.0 24.7Consumer Staples 1.1 -2.3 -3.6 7.0 13.5Health Care 5.0 26.9 -37.3 -11.0 19.0Industrials 26.0 12.5 39.3 -3.0 15.2Utilities 10.4 15.2 53.7 8.0 9.3Financials 12.8 18.1 14.1 4.5 10.7Info Tech 260.9 44.2 151.9 17.0 38.8Telecom Svcs 6.1 34.2 27.9 6.0 13.2Energy 54.5 14.1 7.2 16.0 16.0
TSX Composite 31.2 17.4 12.7 11.0 14.6
34.713.0
17.9
15.65.410.932.3
18.627.517.049.7
Last 10 yrs.
TSX - Earnings Outlook & Forward PE
PE4-qtr Fw dOperating Earnings
(% ch)

CIBC World Markets InC. StrategEcon - April 24, 2008
4
Much smaller netproductiongains thanwepreviouslyforecastnowpointtoamorerapidescalation incrudepricesoverthenextseveralyears,withpriceslikelytosoartoanaverageofUS$150/bblby2010andcontinuingtorisetooverUS$200/bblby2012.Wehavereducedourestimatesfornetglobalsupplyincreasesbynearly1mnbbl/dayforthe2008through2010period,andbyoverhalfamillionbarrelsforthetwoyearsafterthat,leadingtoadiscerniblytighteroilmarketthanwehadpreviouslyprojected(Chart1).
Atthesametime,thereislittleevidencetosuggestthatthere isanycompensating reduction inglobaldemandgrowth. Instead, aggregate crude demand remainsrobustasburgeoningdemandforcrudeoiloutsideoftheOECD,andinmajoroil-producingcountriesinparticular,has more than offset demand destruction in OECDmarkets.Juxtaposedagainstmore limitedsupplygains,theresilienceofdemandindevelopingcountriespointsto increasingglobal competition for increasingly scarceoilresources.
While the International Energy Agency (IEA) estimatescontinue to peg current oil production at around86mnbbl/day,over9%ofthisdailyproductionisnotoilatallbutrather,naturalgasliquids(NGL).Whilenaturalgas liquids such as propane and butane are valuablehydrocarbons in their own right, they are not a viablesubstitute foroil.Neither canbeeconomically usedasa feedstock for gasoline, or diesel. Propane is used as
HowMuchHigherWillOilPricesGo?JeffRubinandPeterBuchanan
Chart 1TheSupplyCrunchisHere
Chart 2BoomingCarSalesinBRICCountries
a transport fuel, but in less than 2% of all the motorvehiclesintheworld.Hence,increasesintheproductionof natural gas liquids cannot satisfy steadily growingglobaldemandforgasolineanddiesel,ascarownershipratesinBRICcountries,andotherpartsofthedevelopingworldtakeoff.
CarpurchasesinRussia,forexample,areexplodingasUSsalesstagnate(Chart2),whileinIndiatheadventoftheTataNano,acarthatwillsellforaslittleasUS$2,500willallowmillionsofhouseholdsinthedevelopingworldtoownautomobileswhentheyotherwisecouldnot.Itisthesavingsnecessarytobuyacar,notthepriceofgasolinethatposesthegreatestobstacletofueldemandgrowthinthosecountries.Butbetweenrapidlyrisingdomesticincomes and rapidly falling car prices, that obstacle isbecomingmoreandmoresurmountable.
The inability of existing supply sources to meet thatdemand growth has been highlighted recently by thefact thatvirtuallyallof the increase inso-calledoilhasbeen in theseotherhydrocarbons,which come largelyfrom natural gas and are ill-suited for gasoline anddieselproduction.Theratioofnaturalgasliquidstototal“oil”productionhasbeenrisingsteadilyandislikelytocontinuetorisefortheforeseeablefuture.Whereasthesehydrocarbons represented only about 4% of total oilproductionbackinthe1970s,theyarelikelytoaccountforover10%oftotalproductionby2012.
-10
0
10
20
30
40
50
60
70
Russia Brazil China Europe US
y/y % chg in sales in 2007
-0.4
-0.2
0.0
0.2
0.4
0.6
0.8
1.0
2008 2009 2010 2011 2012
Previous Estimate, including NGLRevised estimate, excl NGL
Mn.bbl/day, annual supply chg

CIBC World Markets InC. StrategEcon - April 24, 2008
�
The increasing ratio is coincident with acceleratingdepletionratesinmanyoftheworld’slargestandmostmature oil fields. Beyond methane which is what thehome consumer burns, natural gas at the wellheadcontains a range of readily liquefiable gases, whichagenciesliketheIEAhavetraditionallyincludedintotaloilsupply.Theseproducts—propaneandbutane,alongwithsmalleramountsofpentanes,hexanesandheptanes—areremovedatspecializedupstreamprocessingfacilities,inpart toexpeditemovementof thetreatedgasthroughthepipelinedistributionnetwork.
While natural gas can occur on its own, much of theworld’snaturalgasis“associated”gas—foundtogetherwith oil. As an oil field matures, the resulting loss ofreservoir pressure releases dissolved natural gas. Thereleasedgasformsanexpandingcapovermanymatureoilfields, resulting inarisingratioofnaturalgastooiland hence, a rising ratio of natural gas liquids to oilproduction.ThisispreciselywhatisoccurringinrapidlydepletingfieldslikeMexico’sCantarell.
While the steady, but very gradual rise in the ratio ofnaturalgasliquidstototalpetroleumliquidsproductionmay not, in itself, trigger particular alarm, recentdevelopmentsdo.Whatcountsintermsofmeetingfuturetransportationfueldemandgrowthiswhatpercentageofnewsupplythatiscomingon-streamwillbeoilandwhatpercentagewillbenaturalgasliquids?Whilenaturalgasliquidsonlyaccountfor10%oftotalsupply,theyaccountfor virtually all of the increase in petroleum liquidsproductionsince2005(Chart3).Strippingoutnaturalgas
liquids,oilproductionhasnotgrownforovertwo-and-a-halfyears,whichcertainlygoesalongwaytoexplainingwhyoilpriceshavedoubledoverthatperiod.
Inlightofthesedevelopmentswehavere-examinedourprojected supply increases, stripping out the expectedincreasesinactualpetroleumproductionasopposedtonaturalgasliquids.Thedistinctionturnsouttobecritical.Roughly50%oftheincreaseinexpectedproductionislikelytocomefromnaturalgasliquids,leavingonlysmallmarginal gains in petroleum supply over the next twoyears.
Indeed, stripping out natural gas liquids, underlyingworldoilsupplywillrisefrom78mnbbl/day(equivalentof86mnbarrelstodaywithnaturalgasliquids)toonly79mnbarrelsby2010.Andlookingbeyond,itisunclearwhetherthatlevelcanbemuchexceededinthefollowingyears,atleastthroughtheendofourforecasthorizonin2012.
Ournewestimatessuggestthatwearelikelytoseebarelymorethanamillion-barrelincreaseinglobalproductionbetweennowandtheendofthedecade.Oilproductionedgesupanother200,000bbl/dayin2011butthenfallsagainin2012.
Whether in fact, these levels will define ultimateproduction peaks or not, cannot of course be knownatthistime,butwhethertheydoordonotdefinesuchpeaks,theyindicateataminimumthatworldoilmarketswillremainastightoverthenextfiveyearsastheyhaveoverthelasttwoyears.
RationingDemand:HowHighMustPricesRise?
Demandmustultimatelybeconstrainedbysupplysotheprice equation, given a fixed supply, depends on howprice-sensitive demand is. As we have argued before(seeOccasional Report #62, “OPEC’s Growing Call on Itself”),thereareessentiallytwoworldoilmarkets,onefairlyprice-sensitiveandonenotatall.Inthestill-senioroilmarket,theOECD,consumersarenotonlyexpectedto bear the full costs of world oil prices, but also paysubstantialexcisetaxesaswell.Thisiswheretherubbermeetstheroadinsofaraspricerationingglobaldemand.Thevirtualdoubling inworldoilprices since2005hasled to back-to-back reductions in OECD consumption(Chart4)forthefirsttimesincetheearly1980s.
Chart �NewOilSupplyOvertheLast3Years—NaturalGasLiquidsorOil
Source: US Dept. of Energy
-1
0
1
2
3
4
5
6
7
95-2000 2000-05 2005-07
Crude Oil Natural Gas Liquids
Chg in production(mn bbl/day)
64
66
68
70
72
74
76
78
80
Jan-02 Jan-04 Jan-06 Jan-08
Mn bbl/day of Crude Oil
CIBC World Markets InC. StrategEcon - April 24, 2008
6
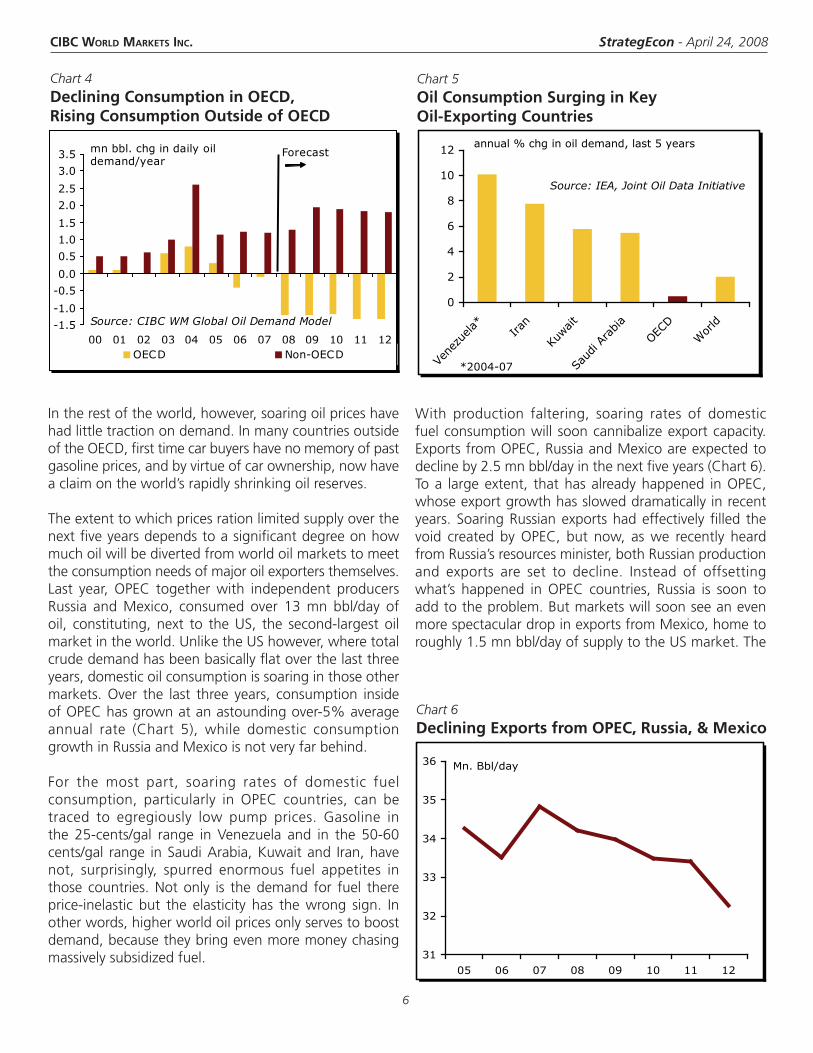
Intherestoftheworld,however,soaringoilpriceshavehadlittletractionondemand.InmanycountriesoutsideoftheOECD,firsttimecarbuyershavenomemoryofpastgasolineprices,andbyvirtueofcarownership,nowhaveaclaimontheworld’srapidlyshrinkingoilreserves.
Theextenttowhichpricesrationlimitedsupplyoverthenextfiveyearsdependstoasignificantdegreeonhowmuchoilwillbedivertedfromworldoilmarketstomeettheconsumptionneedsofmajoroilexportersthemselves.Last year, OPEC together with independent producersRussia and Mexico, consumed over 13 mn bbl/day ofoil, constituting,next to theUS, the second-largestoilmarketintheworld.UnliketheUShowever,wheretotalcrudedemandhasbeenbasicallyflatoverthelastthreeyears,domesticoilconsumptionissoaringinthoseothermarkets.Over the last three years, consumption insideofOPEChasgrownatanastoundingover-5%averageannual rate (Chart 5), while domestic consumptiongrowthinRussiaandMexicoisnotveryfarbehind.
For the most part, soaring rates of domestic fuelconsumption, particularly in OPEC countries, can betraced to egregiously low pump prices. Gasoline inthe 25-cents/gal range in Venezuela and in the 50-60cents/gal range inSaudiArabia,Kuwaitand Iran,havenot, surprisingly, spurred enormous fuel appetites inthose countries.Notonly is thedemand for fuel thereprice-inelastic but the elasticity has the wrong sign. Inotherwords,higherworldoilpricesonlyservestoboostdemand,becausetheybringevenmoremoneychasingmassivelysubsidizedfuel.
With production faltering, soaring rates of domesticfuelconsumptionwillsooncannibalizeexportcapacity.ExportsfromOPEC,RussiaandMexicoareexpectedtodeclineby2.5mnbbl/dayinthenextfiveyears(Chart6).Toa largeextent, thathasalreadyhappened inOPEC,whoseexportgrowthhassloweddramaticallyinrecentyears.SoaringRussianexportshadeffectivelyfilled thevoid created by OPEC, but now, as we recently heardfromRussia’sresourcesminister,bothRussianproductionand exports are set to decline. Instead of offsettingwhat’s happened in OPEC countries, Russia is soon toaddtotheproblem.ButmarketswillsoonseeanevenmorespectaculardropinexportsfromMexico,hometoroughly1.5mnbbl/dayofsupplytotheUSmarket.The
Chart 4DecliningConsumptioninOECD,RisingConsumptionOutsideofOECD
Chart 6DecliningExportsfromOPEC,Russia,&Mexico
31
32
33
34
35
36
05 06 07 08 09 10 11 12
Mn. Bbl/day
Chart �OilConsumptionSurginginKeyOil-ExportingCountries
-1.5
-1.0
-0.5
0.0
0.5
1.0
1.5
2.0
2.5
3.0
3.5
00 01 02 03 04 05 06 07 08 09 10 11 12OECD Non-OECD
mn bbl. chg in daily oil demand/year
Source: CIBC WM Global Oil Demand Model
Forecast
0
2
4
6
8
10
12
Vene
zuela* Ira
n
Kuwai
t
Saud
i Ara
bia
OECD
Wor
ld
annual % chg in oil demand, last 5 years
Source: IEA, Joint Oil Data Initiative
*2004-07

CIBC World Markets InC. StrategEcon - April 24, 2008
�
tandemofstrongdomesticgasolinedemandgrowthandplummetingproductionatitsmassiveCantarellfieldwillseeMexico’sexportsvirtuallydisappearwithinfiveyears(Chart6).
Themoreoilisconsumedinoil-producingcountries,thelessoilwillbeconsumedintheOECD.Sinceoil-producingcountries effectively have first call on their own oil,thebalance is the residualwhich thepricemechanismmust ration. Boosted by the explosive growth in oilconsumptioninoil-producingcountries,weexpectthatby2012,consumptionintherestoftheworldwillexceedOECD consumption, a virtually unthinkable prospect alittleoveradecadeago,whenconsumptionoutsideoftheOECDmeasuredlittlemorethanhalfoftheOECD’sannualoilintake(Chart7).The rise in world oil prices to over US$200/bbl shouldtranslate into steadily rising retail gaspumpprices.USgasolineprices,alreadyaveragingUS$3.60/galnationally,shouldpeakatwelloverUS$4/galthissummer,risingtoasmuchasUS$7/galby2012(Table1).
SmalldeclinesinOECDconsumptionin2006and2007are likely tobe followedbya2.6%annualdecline forthe next three years, with declines averaging 3% peryearafter2010(Table1).Referencedoffits2006peak,oilconsumptionwillfallbyalmostsixmillionbarrelsperdayintheOECDby2012,withroughlyhalfofthedeclineoccurringintheUS,theworld’slargestoilmarket.
Chart �ShiftingPatternofWorldOilConsumption(OECDvsRestofWorld)
Table 1GlobalOilSupplyForecast
Source: Oil Megaprojects Task Force/The Oil Drum, company, industry & govt. reports. Field start-up dates have been adjusted by CIBC World Markets where appropriate to reflect expected delays due to political, technological and other factors.
2008 2009 2010 2011 2012
All Petroleum Liquids Production (Jan. Forecast) 86.1 87.0 87.9 88.4 88.4
Minus: Natural Gas Liquids Production 8.2 8.5 8.8 9.1 9.4Latest Global Supply Forecast (ex NGL) 77.9 78.5 79.1 79.3 79.0
World Oil Demand 77.8 78.0 78.4 78.7 79.0 - % ch. -0.3 0.3 0.5 0.4 0.4 OECD 43.8 42.7 41.6 40.3 39.0 - % ch. -2.5 -2.6 -2.6 -3.0 -3.1 non-OECD 34.0 35.4 36.8 38.4 40.0 - % ch. 2.7 4.1 4.2 4.3 4.1
PricesWest Texas Crude 115 130 150 190 225Retail Gasoline (annual avg) (US$) 3.90 4.50 5.00 5.75 6.50 (summer peak) (US$) 4.25 4.80 5.50 6.00 7.00
20
25
30
35
40
45
90 92 94 96 98 00 02 04 06 08 10 12
OECD Non-OECD
mn. bbl/day Forecast

CIBC World Markets InC. StrategEcon - April 24, 2008
8
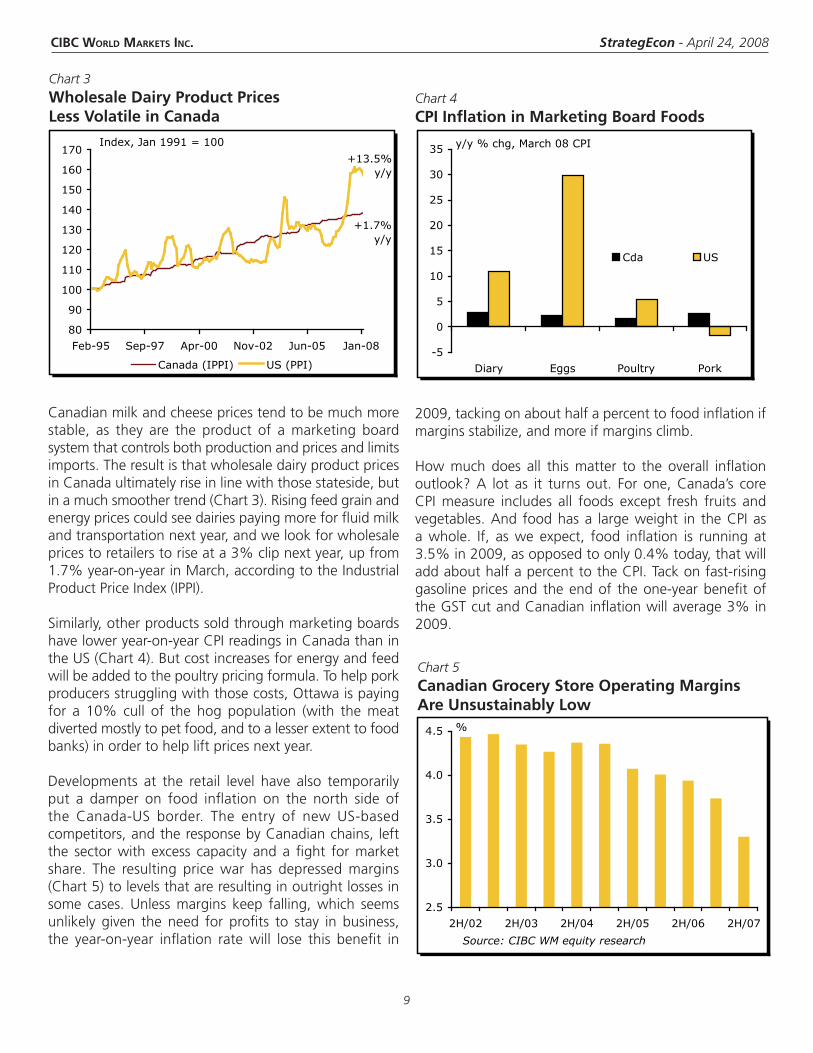
Worldwidecropshortages,soaringretailfoodprices,riotsoverthecostoffeedingthepoor—thesehavebeentheheadlines on food inflation in recent months. Adverseweatherinmajorgraingrowingregions,risingincomesandcalorieconsumptionindevelopingAsia,energycostsintransport,tractorsandfertilizer,andthediversionofcropstobiofuelsarebehindthoseheadlines.Seeminglyeverywhere,thatis,exceptCanada.Evenrelativetoourclosest neighbour, food prices have been remarkablytameinthelastyear(Chart1).Butafterlookingatwhat’sbehindthatexceptionalgap,it’sclearthatCanada’sgoodluckonfoodpricesislikelytorunoutin2009.
As is thecaseglobally, retail consumersare seeing thepass-through of record grain prices into related fooditems,suchasbakeryproducts,pastaandflour(Chart2).Butthat’sbeenoffsetbytameor,insomecases,sharplylower prices on other food products, both in absolutetermsandrelativetotheUS.
Partofthedifferencereflectstheone-timebenefitsofamuchstrongerCanadiandollar.TheshareofimportsinCanadianconsumptionisover90%forfruitandnearly50%forvegetables.Since,inmanycases,theseproductsturn over quickly, foreign exchange movements don’ttakelongtotranslateintoCanadianretailprices.
FoodInflation:ComingtoaGroceryStoreNearYouAveryShenfeld
Chart 1FoodCPI:LargestCdnAdvantagein38Years
Chart 2SelectedFoodCPIComponents
That explains why Canadian fresh produce prices aredownroughly15%,whilethesameitems(oftensourcedat this time of year from the same growing regions)areupslightlystateside.Butevenwithourcall for theCanadiandollartoreachUS$1.05byyear-end,thelooniewillnotcomeclosetomatchingthe17%year-on-yearappreciation that is currently cushioning retail produceprices.Aswell,onbothsidesoftheborder,freshproducecosts look lighter because the prior year saw elevatedpricesafteraCaliforniafrosthitsupply.
Formostotheritems,theimportshareoftheCanadianmarketis20%orless,toolighttoaccountforthehugedifferencesininflationrates.Herethereareotherforcesatwork,mostofwhichwillbelesspowerfulcome2009.Fordairyproducts,theenormousgap inretail inflationwiththeUSreflectsdifferencesfurtherupstreamatthewholesale and farm gate level. US PPI prices for dairyproducts soared in the past year, in line with a globalsupply-demandcrunch.AdverseweatherinNewZealandandtheearlierlossofproducersinEuropeduringaperiodof soft prices hit supply, while demand captured EastAsia’snewtastefordairyproducts.
-20
-15
-10
-5
0
5
10
15
20
Bakery prd Bread Pasta andRice
Freshfruit/veg
Cda US
y/y % chg, March 2008
-5
0
5
10
15
20
25
Apr-70 Jul-76 Oct-82 Jan-89 Apr-95 Jul-01 Oct-07
Canada US
y/y % chg, food CPI
Mar-08
CIBC World Markets InC. StrategEcon - April 24, 2008
�
Chart �WholesaleDairyProductPricesLessVolatileinCanada
2009,tackingonabouthalfapercenttofoodinflationifmarginsstabilize,andmoreifmarginsclimb.
How much does all this matter to the overall inflationoutlook? A lot as it turns out. For one, Canada’s coreCPI measure includes all foods except fresh fruits andvegetables.And foodhasa largeweight in theCPIasa whole. If, as we expect, food inflation is running at3.5%in2009,asopposedtoonly0.4%today,thatwilladdabouthalfapercenttotheCPI.Tackonfast-risinggasolinepricesand theendof theone-yearbenefitoftheGSTcutandCanadianinflationwillaverage3%in2009.
Canadianmilkandcheesepricestendtobemuchmorestable, as they are the product of a marketing boardsystemthatcontrolsbothproductionandpricesandlimitsimports.TheresultisthatwholesaledairyproductpricesinCanadaultimatelyriseinlinewiththosestateside,butinamuchsmoothertrend(Chart3).Risingfeedgrainandenergypricescouldseedairiespayingmoreforfluidmilkandtransportationnextyear,andwelookforwholesalepricestoretailerstoriseata3%clipnextyear,upfrom1.7%year-on-yearinMarch,accordingtotheIndustrialProductPriceIndex(IPPI).
Similarly,otherproductssoldthroughmarketingboardshaveloweryear-on-yearCPIreadingsinCanadathanintheUS(Chart4).Butcostincreasesforenergyandfeedwillbeaddedtothepoultrypricingformula.Tohelpporkproducersstrugglingwiththosecosts,Ottawaispayingfor a 10% cull of the hog population (with the meatdivertedmostlytopetfood,andtoalesserextenttofoodbanks)inordertohelpliftpricesnextyear.
Developments at the retail level have also temporarilyput a damper on food inflation on the north side ofthe Canada-US border. The entry of new US-basedcompetitors,andtheresponsebyCanadianchains, leftthe sectorwith excess capacity and afight formarketshare. The resulting price war has depressed margins(Chart5)tolevelsthatareresultinginoutrightlossesinsome cases. Unless margins keep falling, which seemsunlikely given the need for profits to stay in business,the year-on-year inflation rate will lose this benefit in
Chart 4CPIInflationinMarketingBoardFoods
Chart �CanadianGroceryStoreOperatingMarginsAreUnsustainablyLow
80
90
100
110
120
130
140
150
160
170
Feb-95 Sep-97 Apr-00 Nov-02 Jun-05 Jan-08
Canada (IPPI) US (PPI)
Index, Jan 1991 = 100
+1.7% y/y
+13.5% y/y
-5
0
5
10
15
20
25
30
35
Diary Eggs Poultry Pork
Cda US
y/y % chg, March 08 CPI
2.5
3.0
3.5
4.0
4.5
2H/02 2H/03 2H/04 2H/05 2H/06 2H/07
%
Source: CIBC WM equity research
%

CIBC World Markets InC. StrategEcon - April 24, 2008
10
HastheGlobalCreditCrunchHitaBottom?MenyGrauman
Chart 1USStocksRoseonDayswithBigWritedowns
Chart 2CorporateSpreadsMayHavePlateaued
WiththeS&P500downbyover6%sincethestartoftheyearandinter-banklendingspreadsstilloverfourtimestheirhistoricalaverages,thesearehardlyheadytimesforglobalfinancialmarkets.YetdespitetheconstantstreamofbadnewscomingoutofWallStreet,insomeaspects,theworstofthecreditcrunchappearstobeover.
Financialmarketsareunlikelytoreturntonormaloverthenextfewmonths,butthereisasensethat,attheveryleast,thecreditsituationwon’tgetanyworse.Despitethe fall of Bear Stearns, investors’ deepest fears havenotbeenrealizedandtheglobalfinancialsystemishitbutnothobbled.Financialfirmshaveseentheircapitalratiosbruised,buthavebeenabletohandilyaccessglobalequitymarkets inordertorecapitalize.Meanwhile, theFedhasalsodoneitspartthroughaseriesofwell-timedtargeted liquidity measures, including opening up thediscountwindowtosecuritiesdealers.
GettingUsedtoBadNews
Tobesure,thefundamentaleconomicdatawillcertainlygetworsebefore theygetbetter,but investorsappeartobewillingtolookpastthat,eveniftheyarenotyetwillingtobetonafullblownUSeconomicrecovery.Thereisclearevidencethatexpectationshavehitabottomandthatmarketsarelearningtolivewithsignificantlyhigherriskpremiumsandongoingmarketlosses.
Just how inured investors have gotten to the ongoingstreamofbilliondollarwritedownsfromglobalbanksandbrokeragefirmscanclearlybeseenintheequitymarket’sperformance in the wake of these announcements.Over thepast30days,fiveof thefifteenwinningS&P500tradingsessionscameondaysduringwhichmajorfinancialinstitutionsreportedatleast$2bninwritedowns(Chart1).
Signs of market stress are still clearly visible, but havecertainlymoderatedsincespikinginmid-March.Spreadson highly rated corporate bonds are still close to thehighest they have been since this latest crisis started(Chart2),butafterblowingouttorecordlevels,spreadsonboththeinvestment-gradeandhigh-yieldCDXindicesarethelowestthattheyhavebeensincethestartoftheyear(Chart3).
Equitymarketvolatilityhasalsodroppedoffsignificantly,andalthoughfinancial stockshave certainlynot ralliedverymuch,theyhavemanagedtoleveloff.Furthermore,ifcreditconditionscontinuetomodestlyimprove,thesesame firms may even be able to avoid further mark-to-marketwritedownsnextquarteras thevalueof therelatedassetsbouncesbackfromtheirMarchlows.
0.0%
2.0%
4.0%
6.0%
March
18
March
20
April 1
April 16
April 18
Daily return, S&P 500
-$20.00
-$16.00
-$12.00
-$8.00
-$4.00
$0.00
March
18
March
20
April 1
April 16
April 18
$bn, announced financial sector writedowns
80
100
120
140
160
180
200
4/23/076/26/07 8/29/0711/1/07 1/4/08 3/8/08
bps, Spread over Treasuries
A-Rated Industrial Bonds, 10-Yr

CIBC World Markets InC. StrategEcon - April 24, 2008
11
Chart �CreditConditionsImproving
Chart 4InflationExpectationsTameintheTIPSMarket
The implications for Treasuries are significant. Bondshavesoldoffacrossthecurveandthespreadbetween2sand10shasnarrowedby50bpsover the last fourweeks.Therearethosewhowouldliketoattributethismove to soaring inflation concerns as crude oil nearsUS$120/bblandrisingfoodpricessparkriotsacrosstheglobe.However,althoughinflationiscertainlyapersistentandglobalproblem,therecentmovesintheyieldcurvehavemoretodowithscaled-backriskintolerancethanrisingprices.Afterall,inflationexpectationsasmeasuredbytheTIPSmarketarelowbyhistoricalstandards,andevenlowerthantheywereinMarch(Chart4).
EasingWillSurpassExpectations
Turning tomonetarypolicy, only amonth ago the fedfund futures market was pricing in a better-than-50%probabilityofsub-2%FedfundsratebyAugust,butthatpredictionhasnowslippedtoaround20%(Chart5).
Consideringthefinancialandeconomicrisksstillaheadof us, our view on administered rates is a little morecircumspect, but is also more optimistic than it wasa month ago. We continue to call for rates to dropbelow2%,butthereisnodoubtthatacalmermarketenvironmentwillmakeitharderfortheFederalReservetodriveitstargetratebelow1.50%,especiallyasthevoicesoftheFOMC’sinflationhawksgetevenlouder.
Still,despitemeagermarketexpectations,moresignificantmonetaryeasingisstillparforthecourse,innosmallpartbecausetheeconomydemandsit.Policymakerswilllikelyhavetomoveinsmaller25-bpincrements,buttheywillstillneedtocontinuetoeasethepressureonfloatingrateborrowers,especiallyhomeowners.DefaultscontinuetoriseandaccordingtotheCase-Shillerhomepriceindexhomevaluesarenotjustcontinuingtodecline,butaredroppingfasterwitheachpassingmonth.
Whenallissaidanddone,thesecond-quarterwilllikelybringasignificantdeclineinrealGDPgrowthintheUS,andbethelowpointofthecurrentrecession.However,it appears that itwill alsomarka stabilization-point, ifnotyettheturning-point,forthenine-montholdcreditcrunch. Both the markets and the economy will takesometimetofullyrecover,butanendisfinallyinsight.
Chart �MarketNowBelievesFedtoStopat2%
1.0
2.0
3.0
4.0
10/2
8/20
04
6/28
/200
5
2/28
/200
6
10/2
8/20
06
6/28
/200
7
2/28
/200
8
%
Breakeven Inflation Rate (2-Yr)
Breakeven Inflation Rate (5-Yr)
1.0
1.2
1.4
1.6
1.8
2.0
2.2
2.4
2/1/08 2/15/08 2/29/08 3/14/08 3/28/08 4/11/08
August Fed Funds Futures, %
80
100
120
140
160
180
200
1/2/08 1/31/08 2/29/08 4/1/08500
550
600
650
700
750bps, Spread
10-Yr Investment Grade CDX Index (LHS)
10-Yr High Yield CDX
Index (RHS)
bps

CIBC World Markets InC. StrategEcon - April 24, 2008
12
CANADA
ECONOMIC UPDATE
UNITED STATES
ConflictsofInterest:CIBCWorldMarkets’analystsandeconomistsarecompensatedfromrevenuesgeneratedbyvariousCIBCWorldMarketsbusinesses,includingCIBCWorldMarkets’InvestmentBankingDepartment.CIBCWorldMarketsmayhavealongorshortpositionordealasprincipalinthesecuritiesdiscussedherein,relatedsecuritiesorinoptions,futuresorotherderivativeinstrumentsbasedthereon.Thereadershouldnotrelysolelyonthisreportinevaluatingwhetherornottobuyorsellthesecuritiesofthesubjectcompany.LegalMatters:Thisreportisissuedandapprovedfordistributionby(i)inCanadabyCIBCWorldMarketsInc.,amemberoftheIDAandCIPF,(ii)intheUK,CIBCWorldMarketsplc,whichisregulatedbytheFSA,and(iii)inAustralia,CIBCWorldMarketsAustraliaLimited,amemberoftheAustralianStockExchangeandregulatedbytheASIC(collectively,“CIBCWorldMarkets”).ThisreportisdistributedintheUnitesStatesbyCIBCWorldMarketsInc.andhasnotbeenreviewedorapprovedbyCIBCWorldMarketsCorp.,amemberoftheNewYorkStockExchange(“NYSE”),NASDandSIPC.ThisreportisintendedfordistributionintheUnitedStatesonlytoMajorInstitutionalInvestors(assuchtermisdefinedinSEC15a-6andSection15oftheSecuritiesExchangeActof1934,asamended)andisnotintendedfortheuseofanypersonorentitythatisnotamajorinstitutionalinvestor.MajorInstitutionalInvestorsreceivingthisreportshouldeffecttransactionsinsecuritiesdiscussedinthereportthroughCIBCWorldMarketsCorp.Thisreportisprovided,forinformationalpurposesonly,toinstitutionalinvestorandretailclientsofCIBCWorldMarketsinCanada,anddoesnotconstituteanofferorsolicitationtobuyorsellanysecuritiesdiscussedhereininanyjurisdictionwheresuchofferorsolicitationwouldbeprohibited.ThisdocumentandanyoftheproductsandinformationcontainedhereinarenotintendedfortheuseofprivateinvestorsintheUnitedKingdom.SuchinvestorswillnotbeabletoenterintoagreementsorpurchaseproductsmentionedhereinfromCIBCWorldMarketsplc.ThecommentsandviewsexpressedinthisdocumentaremeantforthegeneralinterestsofclientsofCIBCWorldMarketsAustraliaLimited.Thisreportdoesnottakeintoaccounttheinvestmentobjectives,financialsituationorspecificneedsofanyparticularclientofCIBCWorldMarketsInc.Beforemakinganinvestmentdecisiononthebasisofanyinformationcontainedinthisreport,therecipientshouldconsiderwhethersuchinformationisappropriategiventherecipient’sparticularinvestmentneeds,objectivesandfinancialcircumstances.CIBCWorldMarketsInc.suggeststhat,priortoactingonanyinformationcontainedherein,youcontactoneofourclientadvisersinyourjurisdictiontodiscussyourparticularcircumstances.Sincethelevelsandbasesoftaxationcanchange,anyreferenceinthisreporttotheimpactoftaxationshouldnotbeconstruedasofferingtaxadvice;aswithanytransactionhavingpotentialtaximplications,clientsshouldconsultwiththeirowntaxadvisors.Pastperformanceisnotaguaranteeoffutureresults.Theinformationandanystatisticaldatacontainedhereinwereobtainedfromsourcesthatwebelievetobereliable,butwedonotrepresentthattheyareaccurateorcomplete,andtheyshouldnotberelieduponassuch.Allestimatesandopinionsexpressedhereinconstitutejudgementsasofthedateofthisreportandaresubjecttochangewithoutnotice.AlthougheachcompanyissuingthisreportisawhollyownedsubsidiaryofCanadianImperialBankofCommerce(“CIBC”),eachissolelyresponsibleforitscontractualobligationsandcommitments,andanysecuritiesproductsofferedorrecommendedtoorpurchasedorsoldinanyclientaccounts(i)willnotbeinsuredbytheFederalDepositInsuranceCorporation(“FDIC”),theCanadaDepositInsuranceCorporationorothersimilardepositinsurance,(ii)willnotbedepositsorotherobligationsofCIBC,(iii)willnotbeendorsedorguaranteedbyCIBC,and(iv)willbesubjecttoinvestmentrisks,includingpossiblelossoftheprincipalinvested.TheCIBCtrademarkisusedunderlicense.(c)2008CIBCWorldMarketsInc.Allrightsreserved.Unauthorizeduse,distribution,duplicationordisclosurewithoutthepriorwrittenpermissionofCIBCWorldMarketsInc.isprohibitedbylawandmayresultinprosecution.
OurmacroeconomicoutlookislittlechangedfromthedetailedpresentationinourApril14thissueofForecast.WemadeoffsettingadjustmentswithinourCPIforecast,loweringthenear-termcoreoutlookinresponsetosofter-than-expectedMarchdataandacoolinginnewhomeprices,butmakingthatupintheheadlinerategiventhesteeperclimbnowbuiltintoouroilforecast.
TheresiliencyoftheUSeconomyisapparenteveninrecession.Althoughfirst-quarterrealGDPgrowthwillstillbetheweakestresultsinceQ42002,itwillbeveryclosetoflat,duetosluggish,butstillbetterthanex-pectedconsumerspendingandindustrialproduction.Itisunlikely,however,thatthesecondquarterwillalsobesofortunate,andwecontinuetoexpectanannualizeddeclineof1.9%.Ontheinflationfront,wedonotexpectamildandshortslowdowntohaveasignificantimpactonCPI,whichwilllikelybestuckatover4%untiltheendoftheyear.
CANADA 07Q4A 08Q1F 08Q2F 08Q3F 08Q4F 2007F 2008F 2009F
Real GDP Growth (AR) 0.8 1.0 0.7 1.8 3.8 2.7 1.6 3.0
Real Final Domestic Demand (AR) 6.9 4.5 3.6 3.0 3.0 4.3 4.6 3.4
All Items CPI Inflation (Y/Y) 2.4 1.8 1.9 2.6 3.1 2.1 2.4 3.0
Core CPI Ex Indirect Taxes (Y/Y) 1.6 1.4 1.2 1.4 2.1 2.1 1.5 2.1
Unemployment Rate (%) 5.9 5.8 6.2 6.5 6.4 6.0 6.2 6.2
Merchandise Trade Balance (C$ Bn) 37.1 46.4 42.7 37.8 40.1 49.4 41.8 43.1
U.S.
Real GDP Growth (AR) 0.6 -0.2 -1.9 1.7 3.2 2.2 0.9 2.3
Real Final Sales (AR) 2.4 -0.5 -2.3 1.0 2.5 2.5 0.9 2.3
All Items CPI Inflation (Y/Y) 4.0 4.2 4.3 4.5 4.0 2.9 4.4 3.6
Core CPI Inflation (Y/Y) 2.3 2.4 2.4 2.3 2.3 2.3 2.4 2.3
Unemployment Rate (%) 4.8 4.9 5.3 5.5 5.5 4.6 5.3 5.3