the agrifood system of emilia-romagna...
TRANSCRIPT

The agrifood system of Emilia-Romagna regionStructure, Economy, Excellence

0
10
20
30
40
50
60
70
80
2008 2009 2010 2011 2012 2013 2014 2015
Employees Self-employed Total
Thou
sand
farms UAA (ha) farms UAA (ha)< 5 ha 26,525 57,494 2.5 3.35-10 ha 14,570 105,316 8.5 8.610-20 ha 11,252 157,293 10.0 9.920-50 ha 7,879 245,827 9.4 9.4
> 50 ha 4,254 472,122 9.5 8.9Total 64,480 1,038,052 4.4 8.4
Class of UAAEmilia-Romagna % Emilia-Romagna
/Italy< 5 ha
6% 5-10 ha10%
10-20 ha15%
20-50 ha
24%
> 50 ha 45%
n. % change (ha) % change (ha) % change mean1961* 242,770 - 1,964,955 - - - -1970* 198,216 -18.4 1,845,405 -6.1 1,348,279 - 6.81982 171,482 -13.5 1,760,279 -4.6 1,290,712 -4.3 7.51990 148,057 -13.7 1,705,896 -3.1 1,249,164 -3.2 8.42000 106,102 -28.3 1,462,505 -14.3 1,129,280 -9.6 10.62010 73,466 -30.8 1,361,153 -6.9 1,064,214 -5.8 14.52013 64,480 -12.2 1,348,363 -0.9 1,038,052 -2.5 16.1
* Italy Universe
Years Farms Total Agricultural Area (TAA) Utilised Agricultural Area (UAA)
Land area(sq.km)
% ofland
% of Italy
Inhabitantsas from
1st Jan 2015
% of inhabitants
% of Italy
Density(inhabitants
/sq.km)Emilia-Romagna 22,453 Mountains 5,677 Hills 6,202 Lowlands 10,573
4,457,115190,108
1,234,1573,032,850
100.025.327.647.1
100.04.3
27.768.0
7.45.34.9
15.1
7.52.55.3
10.5
198.533.5
199.0286.8
Land and population (Source: Istat)Farms by size of UAA (2013)(Source: Istat - SPA 2013)
Structural data: Employment trends (2008-2015)(Source: 2015 Report)• 66,000workersinagriculturein2015(75,000in2009)• Strongerreductionofself-employedfarmers
Territorial data
Agricultural data
An European Region with :• ContinentalandMediterranean
productsandexcellences• LeaderinItalyandEuropeinfood• Opentotheworld
Main features:• Territory and agriculture• The food industry• Agricultural output• Foreign trade and export• Sustainable agriculture
• ThereductionofUAAhasbeensignificantfrom1990to2010• ThereductionofTAAandUAAaremanlyconcentratedin
mountainandhillareas• Increaseoffarm’saveragesize:16.1hectaresin2013
(almostdoublethannationalaverage).
UtilisedAgriculturalArea(UAA)
farms UAA (ha) farms UAA (ha)< 5 ha 26,525 57,494 2.5 3.35-10 ha 14,570 105,316 8.5 8.610-20 ha 11,252 157,293 10.0 9.920-50 ha 7,879 245,827 9.4 9.4
> 50 ha 4,254 472,122 9.5 8.9Total 64,480 1,038,052 4.4 8.4
Class of UAAEmilia-Romagna % Emilia-Romagna
/Italy< 5 ha
6% 5-10 ha10%
10-20 ha15%
20-50 ha
24%
> 50 ha 45%TOTAL REGIONAL VALUE ADDED :• 134,041MioEuro• 9.1%ofItalyVA
Agriculture value added in Emilia-Romagna 2015(Source: ISTAT, Territorial Economic Accounts)
AGRICULTURAL VALUE ADDED (current prices) :• 3,387MioofEuro• 2.5%ofregionalVA• 10.2%ofagriculturalVAinItaly
Farms and utilized area (1961-2013) (Source: Istat - 6° General Agricultural Census)

Employment level Agrifoodsystem:consideringrelatedsectorsupwardsanddownwards.
More than 300,000 workers(16.7%ofregionaltotal).
Food and beverage industry data(Structural data: Firms and employment)
Agriculture, food and drinks industry, and related sectors
Region Employees Local Units
1 Bretagne 81,175 4,751
2 Île de France 80,470 8,346
3 Cataluña 76,327 3,428
4 Lombardia 69,734 6,625
5 Pays de la Loire 66,285 4,142
6 Emilia-Romagna 61,251 5,603
7 Mazowieckie 60,658 2,511
8 Wielkopolskie 54,604 2,030
9 Rhône-Alpes 53,737 7,497
50,512 5,415
Source: Eurostat
Top 10 European Regionsfor number of workers and �rms
10 Andalucía
12
3
45
6
78
9
10
Top 10 European Regions for number of employed and firms (2014)
Food-processing firms: 4,910 (2015)- 8%offood-processingfirmsinItaly- 10.9%ofmanufacturingfirmsintheregion
28.4%
0.9%
6.3%
1.8%17.1%
3.4%
18.3%
12.7%
3.3%7.5%
Cured meat Fish Tinned vegetables
MillingOlive and seed oil Dairy
Animal feedPastry and farinaceous
Drinks
Others
Shareofcraftsfood-producingfirmsbysectors(%) Sharesofindustrialfood-producingfirmsbysectors(%)
The agrifood system in Emilia-Romagna 2011 (number of workers) Workers % on (number) ItalyFood and drinks industries 53,396 12.7
Agricultural Machinery, food industry equipments .. 33,512 36.6Activities related to agriculture, forestry .. 6,885 10.7Chemistry for agrifood 2,550 15.1Packaging materials 2,892 12.7
Food distribution (Wholesale) 43,691 9.2Food retail 21,169 7.0Restaurants 52,018 9.2Collective catering services 12,554 10.4Services for food industries 2,246 11.0Total number of workers (without agriculture) 230,913Total number of workers (with agriculture)* 76,000Total workers in agrifood and related sectors 306,913
Source: work force. * For the agricolture the units of labor employed was 206,000, including part time workers.
14.5% 0.2%1.4%0.4%
6.7%2.1%
67.5%
5.0%1.0%
1.2%
Cured meat Fish Tinned vegetables
MillingOlive and seed oil Dairy
Animal feedPastry and farinaceous
Drinks
Others
Value of turnover in 2014
Morethan25billionseuro19.7%ofthenationalturnover
Performance in 2014 / 2015
Production+0.6%Export+6.5%(2015)
Value added in 2014
3.8billionseuro
Internationalization
18%ofexportingfirms(2010)Valueofexport:4.9Mioeuro(2015)
Food and beverage industries in Emilia-Romagna(Source: Istat)

Agriculture, Forest and FishingSource: Istat, regional economic accounts
Value of Agricultural output and value added 2014-2015(000euroat basic prices)
ProductionIntermediate ConsumptionValue added
20146,212,1893,000,3213,214,845
20156,172,0622,984,7903,189,908
ProductionIntermediate ConsumptionValue added
20147,248,4953,563,3633,685,133
20156,706,8013,376,5503,330,251
Value of Agricultural output and value added 2014-2015(000europreviousyear prices)
ProductionIntermediate ConsumptionValue added
20146,212,1893,000,3213,214,845
20156,172,0622,984,7903,189,908
ProductionIntermediate ConsumptionValue added
20147,248,4953,563,3633,685,133
20156,706,8013,376,5503,330,251
Agricultural output and value added: trends 1980-2015Positivetrendofagricultureoutputbeforetherecenteconomiccrisis.Increaseofvalueofintermediateconsumptionafter2000.TheValueaddedshowsamoderatedecliningtrendafter2000.
0
1,000
2,000
3,000
4,000
5,000
6,000
7,000
8,000
198019811982198319841985198619871988198919901991199219931994199519961997199819992000200120022003200420052006200720082009201020112012201320142015
AAggrriiccuullttuurree oouuttppuutt
VVaalluuee AAddddeedd
II
Support to agriculture and Secondary activities
nntteerrmmeeddiiaattee ccoonnssuummppttiioonn
MMiillllii
oonnss
Emilia-Romagna
Lombardia
Veneto
Sicilia
Puglia
Piemonte
Toscana
Trentino Alto Adige
Campania
Lazio
1,232,582
1,106,823
976,928
910,299
860,299
678,043
674,518
629,186
620,443
573,983
EMILIA-ROMAGNAThevalueofsupportandsecondaryactivitieshasincreasedtoaroundthe19%oftheproductionin2015.n Support activities: mechanicaloutsoursing,primaryprocessingofagricultural
productsecc.n Secondary activities: agritourism,renewableenergies,careofparksandgardens,
socialactivitiesecc.
Agricolture diversification: support and secondary activities - 2015
Cereals and Industrial crops
14%Potatoes and
vegetables11%
Other herbaceous
4%
Tree crops17%
Wine8%
Beef4%
Pigsmeat7%
Poultry and rabbits
7%
Milk21%
Eggs6%
Other livestock1%
CA
B
ContinentalandMediterraneantypesofproducts:
A 14%cerealsandindustrialcropsB 41%fruitandvegetableC 45%animalproduction
Agricultural output by product group(Source: 2015 Report)
744 Mio € 488 Mio €

Agrifood import-export Top 10 items of export in E-R and Italy (2015)(Source: 2015 Report)
0
1,000
2,000
3,000
4,000
5,000
6,000
0
200
400
600
800
1,000
1,200
Italy
Main origins of import in E-R(Source: 2015 Report)
14.8
10.09.2
6.95.4 5.1 4.9 4.6 4.1
0
2
4
6
8
10
12
14
16
10.7
8.5 8.27.6
4.4 4.23.3 3.3 3.0
0
2
4
6
8
10
12
Agricultural sector (in %)(1,474MioofEuro)
14.8
10.09.2
6.95.4 5.1 4.9 4.6 4.1
0
2
4
6
8
10
12
14
16
10.7
8.5 8.27.6
4.4 4.23.3 3.3 3.0
0
2
4
6
8
10
12
Food and beverage sector (in %)(4,643MioofEuro)
Agrifood import-export in E-R Main origins of export(Source: 2015 Report)
1,474
4,643
6,117
894
4,8985,792
0
1,000
2,000
3,000
4,000
5,000
6,000
7,000AGRICOLTURE FOOD INDUSTRY AGRI-FOOD SYSTEM
Import Export
Foreign trade of the agro-food products (2015)(Source: 2015 Report)
Emilia-Romagna
0
1,000
2,000
3,000
4,000
5,000
6,000
0
200
400
600
800
1,000
1,200
29.3
8.34.9 4.8 4.6 3.8 2.9 2.5 2.5
0
5
10
15
20
25
30
35
17.5
15.0
7.9 7.4
4.42.6 2.6 2.5 2.4
02468
101214161820
Agricultural sector (in %)(894MioofEuro)
Food and beverage sector (in %)(4,898MioofEuro)
29.3
8.34.9 4.8 4.6 3.8 2.9 2.5 2.5
0
5
10
15
20
25
30
35
17.5
15.0
7.9 7.4
4.42.6 2.6 2.5 2.4
02468
101214161820
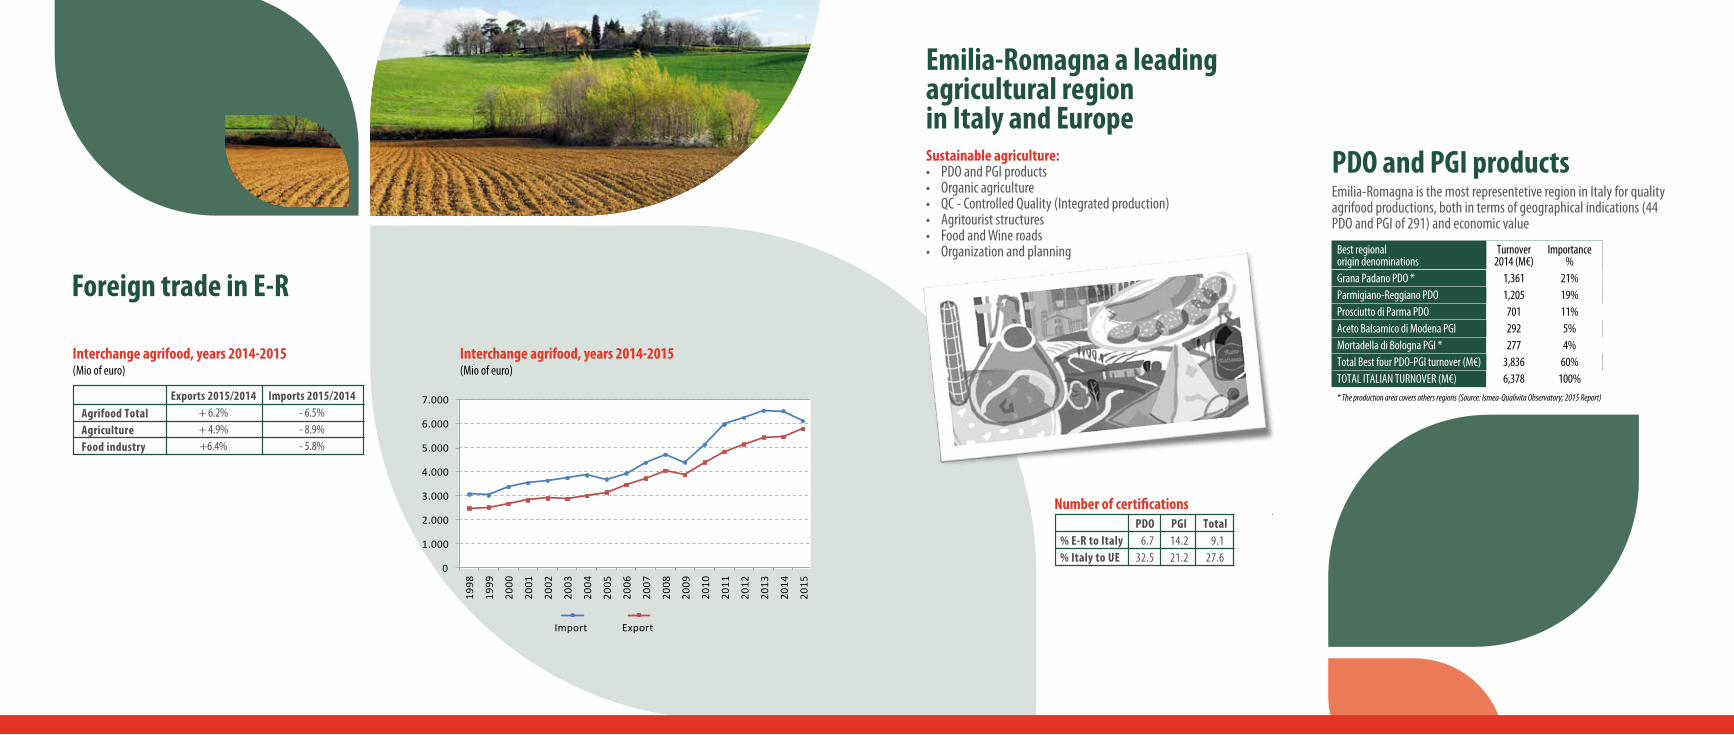
Foreign trade in E-R
Interchange agrifood, years 2014-2015(Mioofeuro)
Agrifood TotalAgricultureFood industry
Exports 2015/2014+ 6.2%+ 4.9%+6.4%
Imports 2015/2014- 6.5%- 8.9%- 5.8%
0
1.000
Import Export
3.000
4.000
5.000
6.000
7.000
1998
1999
2000
2001
2002
2003
2004
2005
2006
2007
2008
2009
2010
2011
2012
2013
2014
2015
2.000
Interchange agrifood, years 2014-2015(Mioofeuro)
Sustainable agriculture:• PDOandPGIproducts• Organicagriculture• QC-ControlledQuality(Integratedproduction)• Agritouriststructures• FoodandWineroads• Organizationandplanning
Emilia-Romagna a leading agricultural region in Italy and Europe
PDO and PGI productsEmilia-RomagnaisthemostrepresentetiveregioninItalyforqualityagrifoodproductions,bothintermsofgeographicalindications(44PDOandPGIof291)andeconomicvalue
Best regional Turnover Importanceorigin denominations 2014 (M€) %Grana Padano PDO * 1,361 21%Parmigiano-Reggiano PDO 1,205 19%Prosciutto di Parma PDO 701 11%Aceto Balsamico di Modena PGI 292 5%Mortadella di Bologna PGI * 277 4%Total Best four PDO-PGI turnover (M€) 3,836 60%TOTAL ITALIAN TURNOVER (M€) 6,378 100%* The production area covers others regions (Source: Ismea-Qualivita Observatory; 2015 Report)
Number of certifications PDO PGI Total% E-R to Italy 6.7 14.2 9.1% Italy to UE 32.5 21.2 27.6

PDO and PGI products in Emilia-Romagnahttp://url.emr.it/sm002g7h
MODENA
PIACENZA
PARMA
REGGIO-EMILIA
BOLOGNA RAVENNA
RIMINI
FORLI’
MODENA
PIACENZA
PARMA
REGGIO EMILIA
FERRARA
CESENA
I prodotti DOP e IGP dell’Emilia-Romagna: nati qui, apprezzati in tutto il mondoThe PDO and PGI products of Emilia-Romagna: born here, enjoyed worldwide
Assessorato Agricolturaagricoltura.regione.emilia-romagna.itemiliaromagnaturismo.it
COPPA PIACENTINA
DOPSALAME
PIACENTINO DOP
FUNGO DIBORGOTARO
IGP
PARMIGIANOREGGIANODOP
ASPARAGO VERDEDI ALTEDOIGP
PESCA E NETTARINADI ROMAGNAIGP
COPPIAFERRARESE
IGP
CULATELLODI ZIBELLO
DOP
COTECHINOMODENAIGP
PANCETTAPIACENTINA
DOP
SALAMECREMONA
IGP
GRANAPADANO
DOP
OLIO EXTRA VERGINE
DI OLIVA COLLINEDI ROMAGNA
DOP
OLIO EXTRA VERGINEDI OLIVA
DI BRISIGHELLADOP
ACETOBALSAMICODI MODENA
IGP
VITELLONE BIANCODELL’ APPENNINO CENTRALE
IGP
FORMAGGIODI FOSSADI SOGLIANODOP
ACETOBALSAMICO
TRADIZIONALEDI MODENA
DOP
SCALOGNO DI ROMAGNA
IGP
PAMPAPATOPAMPEPATODI FERRARA
IGP
PATATA DI BOLOGNA
DOP
RISO DELDELTA DEL POIGP
MARRONE DI CASTEL DEL RIO
IGP
CASCIOTTAD’URBINODOP
PROVOLONEVALPADANA
DOP
SQUACQUERONE DI ROMAGNADOP
PROSCIUTTODI MODENA
DOP
CILIEGIA DI VIGNOLA
IGP
AMARENEBRUSCHE DI MODENAIGP
AGNELLODEL CENTRO ITALIA IGP
ZAMPONE MODENA
IGP
PERADELL’ EMILIA-ROMAGNAIGP
MELONEMANTOVANO
IGP
SALAMA DA SUGOIGP
PIADINA ROMAGNOLAIGP
MORTADELLABOLOGNAIGP
AGLIODI VOGHIERADOP
CAPPELLACCI DI ZUCCAFERRARESIIGP
ACETOBALSAMICOTRADIZIONALEDI REGGIO EMILIA DOP
ANGURIAREGGIANAIGP
COPPADI PARMA
IGP
PROSCIUTTODI PARMA
DOP
SALAME FELINO
IGP
SALAMINIITALIANI
ALLACACCIATORA
DOP
List of Emilia-Romagna P.D.O. wineshttp://url.emr.it/kt338w6l

Organic production(Source: 2015 Report)
AN AGRICULTURE THAT IS RESPECTFUL OF THE ENVIRONMENT:• NoGMOs• Researchandinnovationtoproducemoreandbetter,
withefficientutilizationofnaturalresource• Safety,reliabilityandqualityasthemainaxesof
developmentpolicies
ORGANIC FARMINGThe5thregioninItalyforthenumberoperators:• 4,165operators• 3,212farms• 953processingfirms• 95,000hectaresarecultivatedwithorganiccrops(9%oftheregionalUAA)
Integrated Production(Source: 2015 Report)
Farming productions system for better management of water and soil in the food chain, containing rules:• forpestandweedcontroltoreducetheuseofpesticides;• toreduceandoptimizetheuseoffertilizers,accordingtothetypeofsoil,manuretreatmentanddisposal;• forcroprotation,soilmanagementirrigationtechnicaladvisoryserviceincludingforecastingmodelsbasedonweatherconditions.
INTEGRATED PRODUCTION IN EMILIA-ROMAGNA • morethan4,4miliontonoffruitsanvegetables• 82,000hectares
4000
4500
3500
3000
2500
2000
1500
1000
500
02010
2715
763
2009
2675
691
2738
776
2011
2924
794
2012
867
798
2013
3212
953
2015
3009
867
2014
organic processors organic producers
nr. operators
Integrated productions (campaign 2014/2015) vegetables fruitsProduction obtained with thedisciplinary of integrated production (tons) 2,089,540 2,285,471
Utilised agricoltural area used the disciplinaryof integrated production (ha) 42,306 39,556

Diffusion of Sustainable Farming in Emilia-Romagna
INTEGRATED PRODUCTION
• 4,300Farms• 124,000hectares• 12%UAA
ECOLOGICAL AGRICULTURE
• 3,983Farms• 117,000hectares• 11%UAA
TOTAL
• 8,283Farms• 241,000hectares• 23%UAA
Freshwater quality
• ReductionofNitrogenfertilizers-38%(-25,8kgN/ha)
• Decreaseduseofpesticidesendangeringtheenvironmentandhumanhealth-52%toxicpesticides
• Overallpesticidesreduction,basedon«weigthedload»-39%.
Soil erosion decrease
• Soilerosiondecrease(wheresustainablefarmingisapplied)-26.6%.
Increase of soil organic matter content
• Soilorganicmattercontentisexpectedtoincreaseonlyaslight0.03%onaverage,after7yearsofagri-environmentcommitment,underRuralDevelopmentProgramrules.
Impact of Sustainable Farming in Emilia-Romagna (2007-2013)
Fighting climate change
• GreenHouseGasesannualemissiondecreasedbyabout237,000tonsCO2eq.

Cooperative Firms, PO, APO, IO(Source: 2014 Report)
The778cooperativefirmsactiveintheregionproducethe60%oftheturnoverofthefoodindustryandrepresentonethirdofcooperativefirmsintheItalianagrifoodsystem.In the year 2014 Emilia-Romagna were active also in 2014:• Vegetableandfruitsector:27ProducersOrganizations(POs)and6AssociationofPOwithaturnoverofabout1,700,000,000€• Othersector(milkandcheese,beefandpork,cereals,potatoes,fodder,honey,seeds,beetsandsugar,ect);21ProducersOrganizations(POs),
22,000producersassociatedand900,000,000€ofturnover• 4Inter-branchOrganizations(IO)(processedtomato,pork,pear,eggs)workinginseveralregions
Agritourist structuresIn2014,over1,100agritouristproperties(+2.75%over2013)wereactive,withalmost9,200bedsand4.45mlnmealsservedperyear.In2013,thereweremorethan300activeeducationalfarms.
Food and Wine Roads(Source: 2014 Report)
15 Food and Wine roads have been created in all the provinces• Theitinerariesjoinrestaurants,wineries,agritouriststructuresguest-houses,farms,cheesefactories,craftsandartsworkshopsspecializedintypicalhigh-qualityproductions,whichworktogethertoenhancetherichculinaryheritageoftheRegion
mountains
hills
plains
35%
16%
49%
Strade dei vini e dei sapori

Formoreinformationpleasevisitourwebsite:
agr i co l tura . reg ione.emi l ia - romagna. i t
Thanksto:CristinaBrasili,RobertoFanfani,LucianaFinessi,PaoloPirani,GiampaoloSarno,AndreaSartoriandLucillaSpinelli.