the all breast cancer report was published in october 2009 breastscreen/research.html#breast-...
TRANSCRIPT
The All Breast Cancer Report was
published in
October 2009http://www.cancerscreening.nhs.uk/breastscreen/research.html#breast-cancer-report

Introduction• The ‘All Breast Cancer Report’ brings together information on nearly
50,000 people diagnosed with breast cancer in the UK in 2006. The report analyses the differences in prognosis and clinical outcome for women with breast cancer in relation to route of presentation (i.e. screening or symptomatic), age at diagnosis, tumour characteristics, deprivation status and ethnicity.
• The NHS Breast Screening Programme audit of screen-detected breast cancers and the Breast Cancer Clinical Outcome Measures (BCCOM) Project which audits symptomatic breast cancers are now well established national audits, but never before have the data included in these audits been analysed as a single cohort with screening and symptomatic breast cancers diagnosed in the UK compared directly.
Figure and Table numbers are taken from the ‘All Breast Cancer Report’

Methodology

Data Sources
Table 1: Hierarchy of data sources used to produce the final dataset.
Where did the data come from?
Cancer Registration
data
Hospital Episode Statistics
data
National Strategic Tracing Service
Index of Deprivation
2007
BCCOM validated
data (sympto-
matic)
NHSBSP validated
data (screen-
detected)
Patient demographics
Deprivation
Ethnicity
Tumour characteristics
Therapeutic treatment
Reconstructive surgery
Survival
Data item England Northern Ireland
Scotland Wales
Morphology
Invasive size, invasive grade, nodal status and Nottingham Prognostic Index for invasive cancers
Receptor status
Surgery
Number of operations
Final therapeutic operation type
Sentinel lymph node biopsy
Immediate reconstruction
Radiotherapy *
Chemotherapy *
Survival
Table 2: Data items in each country included in the analyses in the ‘Tumour Characteristics and Treatment’ sections of the report (*Selected English registries only based on data completeness)

Data Quality and Completeness
Data item Number of
cases % UK % England
Deprivation score 41,412 84 100
Ethnicity 28,239 57 68
Surgical treatment (UK) 39,462 80 -
Surgical treatment (invasive cancers) UK 34,891 71 -
*Morphology (UK) 39,261 99 - Surgical treatment (England) 33,717 - 81
Surgical treatment (invasive cancers) England 29,663 - 72
Morphology (England) 33,545
- 81 *Invasive tumour size (England) 25,350 - 85
*Invasive tumour grade (England) 28,462 - 96
*Nodal status (invasive cancers, England) 20,798 - 70
*NPI (invasive cancers, England) 19,832 - 67
*Oestrogen receptor status (invasive cancers, England) 14,330 - 48
*Progesterone receptor status (invasive cancers, England) 10,954 - 37
*HER2 status (invasive cancers, England) 10,487 - 35
*Number of operations (England) 31,145 - 92
Final therapeutic operation (England) 38,198 - 92
Sentinel lymph node biopsy (England) 18,155 - 44
Immediate reconstruction (England) 3,751 - 9
*Radiotherapy (invasive cancers, England) 19,217 - 65
*Chemotherapy (invasive cancers, England) 20,391 - 69
*Hormone therapy (invasive cancers, England) 17,103 - 58
Table 3: Number and proportion of data items with known values *expressed as a proportion of surgically treated invasive cancers (except Number of operations, all cancers)

Data Quality and CompletenessData Item Screen-detected Symptomatic
Age <1% <1%
Ethnicity 28.6% 33.4%
Deprivation <1% <1%
Invasive size 1.1% 21.3%
Invasive grade <1% 5.7%
Nodal status 2.4% 43.8%
Nottingham Prognostic Index 3.8% 48.0%
Surgery 1.1% 11.3%
Radiotherapy 13.4% 53.2%
Chemotherapy 13.7% 45.7%
Hormone therapy 12.6% 57.3%
Table 4: Proportions of unknown data items for screen-detected and symptomatic cancers

Cohort Characteristics
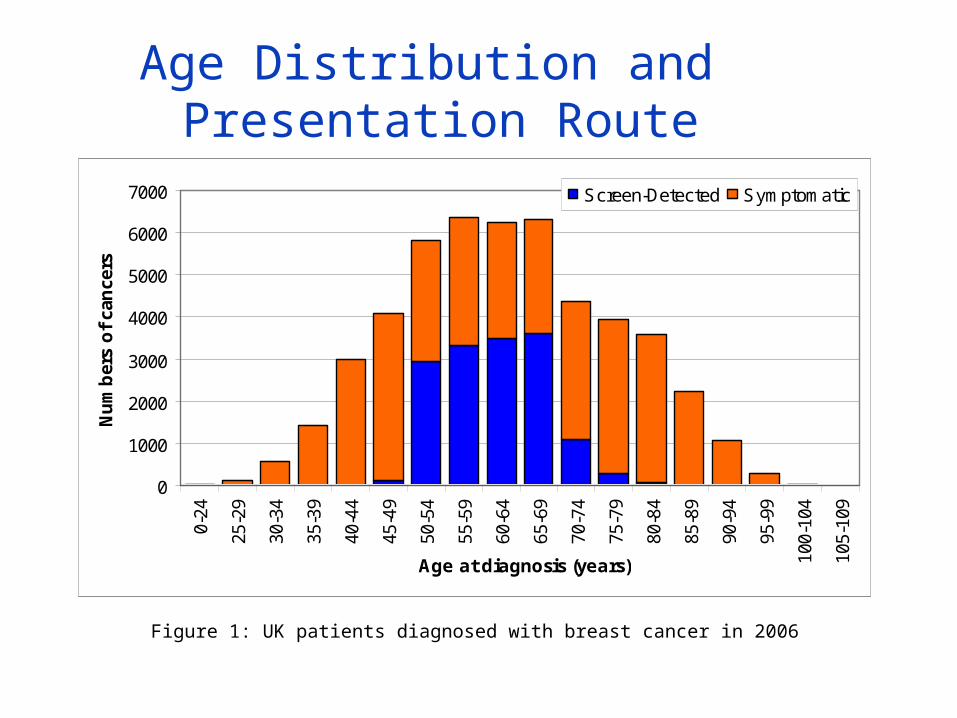
Age Distribution and Presentation Route
0
1000
2000
3000
4000
5000
6000
70000-
24
25-2
9
30-3
4
35-3
9
40-4
4
45-4
9
50-5
4
55-5
9
60-6
4
65-6
9
70-7
4
75-7
9
80-8
4
85-8
9
90-9
4
95-9
9
100-
104
105-
109
Age at diagnosis (years)
Nu
mb
ers
of
can
cers
Screen-Detected Symptomatic
Figure 1: UK patients diagnosed with breast cancer in 2006

Country Profile and Invasive StatusRegion/Celtic country
Total cases
Population covered (million)
Eastern 4,731 5.66
North West 5,260 6.58
Northern & Yorkshire 5,460 6.76
Oxford 2,138 2.86 South West 6,839 7.02
Thames 8,305 11.84
Trent 4,168 4.99
West Midlands 4,581 5.38
England 41,482 51.09
Northern Ireland 1,019 1.76
Scotland 4,392 5.14 Wales 2,559 2.98
UK 49,452 60.98
Table 5: Total number of breast cancer cases included in each region/Celtic country
Age (years) Invasive (%) Non-invasive (%) Total cases
<50 92 8 9,226
50-70 85 15 25,856
>70 96 4 14,365
Unknown 80 20 5
Total 90 10 49,452
Table 6: Proportion of invasive and non-invasive breast cancers diagnosed in each age group

Deprivation and Presentation Route
0
1000
2000
3000
4000
5000
6000
7000
Quintile 1 Most Deprived
Quintile 2 Quintile 3 Quintile 4 Quintile 5 Most Affluent
Deprivation (ID2007 Quintile)
Nu
mb
er
of
can
cers
dia
gn
osed
Screen-detected Symptomatic
Figure 2: Patients in England diagnosed with breast cancer in 2006

Ethnicity and Presentation Route
0
10
20
30
40
50
60
70
80
90
100
White Asian Black Chinese Mixed Other
Ethnic Group
Pro
po
rtio
n o
f can
cers
dia
gn
osed
(%
)
Screen-detected Symptomatic
Screen-detected Symptomatic Ethnic group No. % No. %
Total cases
White 8,746 33 18,061 67 26,807
Asian 191 31 420 69 611
Black 81 19 347 81 428
Chinese 23 31 51 69 74
Mixed 22 23 75 77 97
Other 72 32 151 68 222
Total 9,135 32 19,104 68 28,239
Table 7: Number and proportion of breast cancers diagnosed in England with known ethnicity in each presentation route
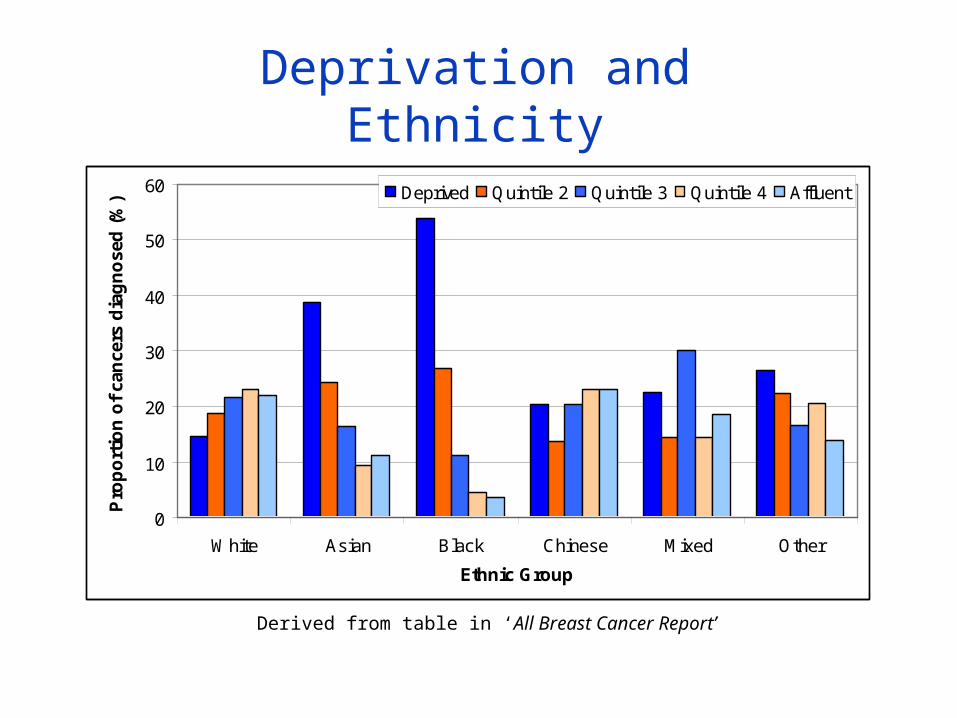
Deprivation and Ethnicity
0
10
20
30
40
50
60
White Asian Black Chinese Mixed Other
Ethnic Group
Pro
po
rtio
n o
f ca
nce
rs d
iag
no
sed
(%
) Deprived Quintile 2 Quintile 3 Quintile 4 Affluent
Derived from table in ‘All Breast Cancer Report’

TumourCharacteristics
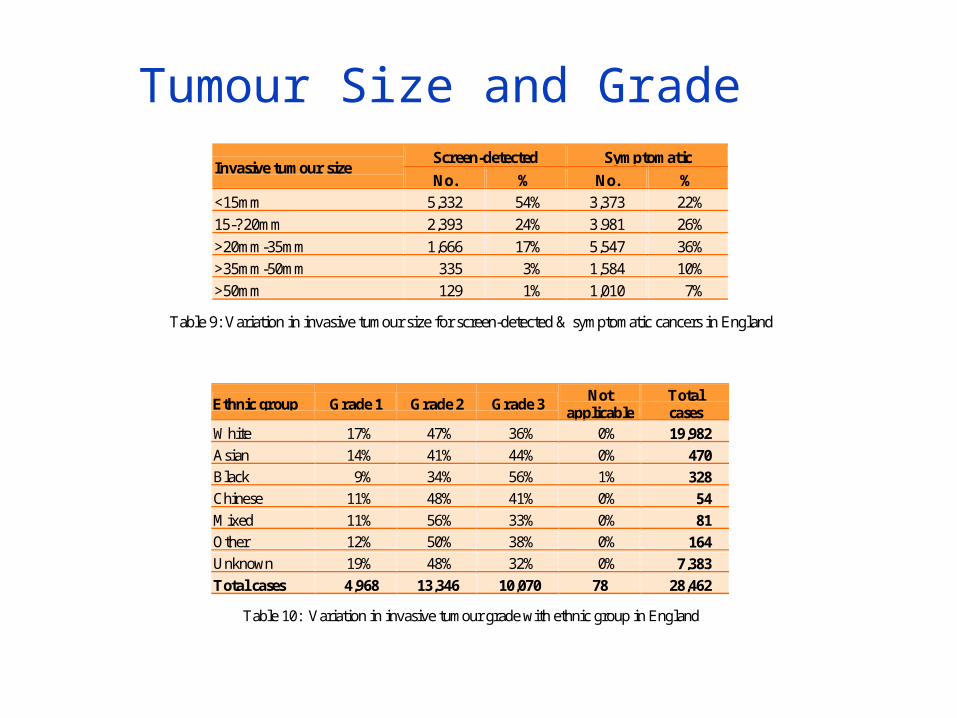
Tumour Size and Grade
Ethnic group Grade 1 Grade 2 Grade 3 Not
applicable Total cases
White 17% 47% 36% 0% 19,982
Asian 14% 41% 44% 0% 470
Black 9% 34% 56% 1% 328
Chinese 11% 48% 41% 0% 54
Mixed 11% 56% 33% 0% 81
Other 12% 50% 38% 0% 164
Unknown 19% 48% 32% 0% 7,383
Total cases 4,968 13,346 10,070 78 28,462
Table 10: Variation in invasive tumour grade with ethnic group in England
Screen-detected Symptomatic Invasive tumour size
No. % No. %
<15mm 5,332 54% 3,373 22%
15-?20mm 2,393 24% 3.981 26%
>20mm-35mm 1,666 17% 5,547 36%
>35mm-50mm 335 3% 1,584 10%
>50mm 129 1% 1,010 7%
Table 9: Variation in invasive tumour size for screen-detected & symptomatic cancers in England

Nodal Status and Receptor Status
Ethnic group Positive Negative Total cases
White 38% 62% 14,627
Asian 43% 57% 308
Black 64% 36% 221
Chinese 29% 71% 35
Mixed 47% 53% 49
Other 48% 52% 115
Unknown 36% 64% 5,443
Total cases 7,922 12,876 20,798
Table 11: Variation in invasive tumour nodal status with ethnic group in England
ER positive
PR positive
HER2 positive Ethnic group
No. % No. % No. %
White 8,681 84% 5,334 68% 1,289 17%
Asian 187 80% 146 71% 41 21%
Black 84 71% 58 57% 21 22%
Chinese 19 86% 14 70% 4 27%
Mixed 26 90% 20 74% 8 33%
Other 65 84% 40 75% 9 16%
Unknown 3,065 87% 1,994 73% 345 13%
Total cases 12,127 7,606 1,717
Table 14: Variation in receptor status with ethnic group in England

Nottingham Prognostic Index and Presentation Route
NPI = 0.2 X Invasive Size (cm) + Grade + Nodes
Groups = Excellent, Good, Moderate 1, Moderate 2, Poor
0
5
10
15
20
25
30
35
40
EPG GPG MPG1 MPG2 PPG
NPI group
Pro
po
rtio
n o
f ca
nce
rs d
iag
no
sed
(%
) Screen-detected Symptomatic
Figure 3: Patients in England diagnosed with breast cancer in 2006

NPI and Ethnicity (all ages)
0
5
10
15
20
25
30
35
40
White Asian Black Chinese Mixed Other
Ethnic Group
Pro
po
rtio
n o
f can
cers
dia
gn
osed
(%
)
EPG GPG MPG1 MPG2 PPG
Derived from table in ‘All Breast Cancer Report’
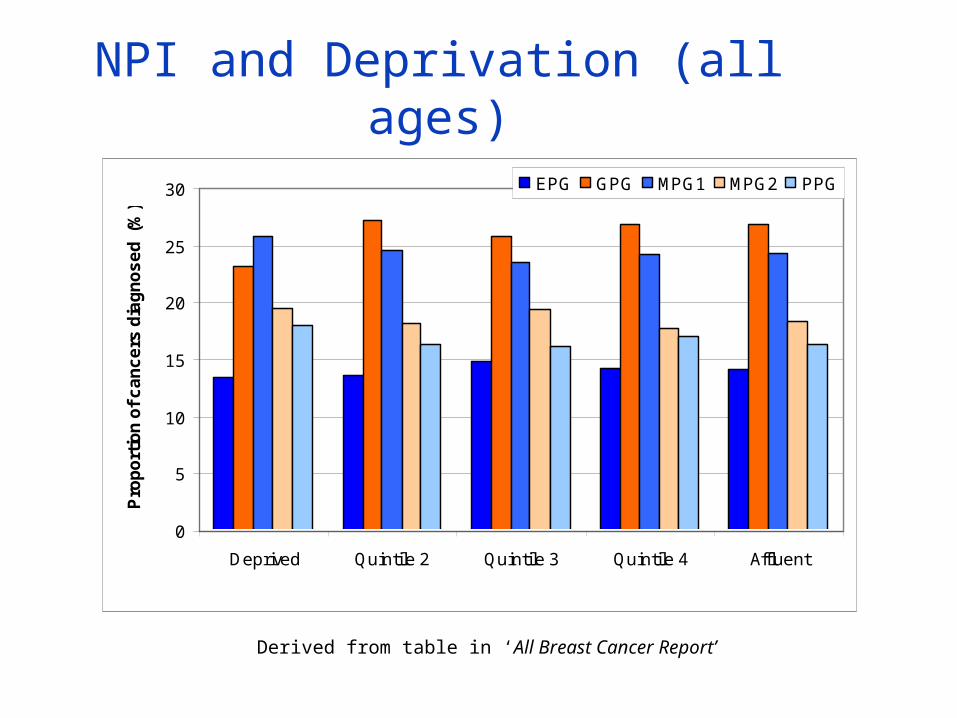
NPI and Deprivation (all ages)
0
5
10
15
20
25
30
Deprived Quintile 2 Quintile 3 Quintile 4 Affluent
Pro
po
rtio
n o
f c
an
ce
rs d
iag
no
se
d (
%)
EPG GPG MPG1 MPG2 PPG
Derived from table in ‘All Breast Cancer Report’

Surgical Treatment
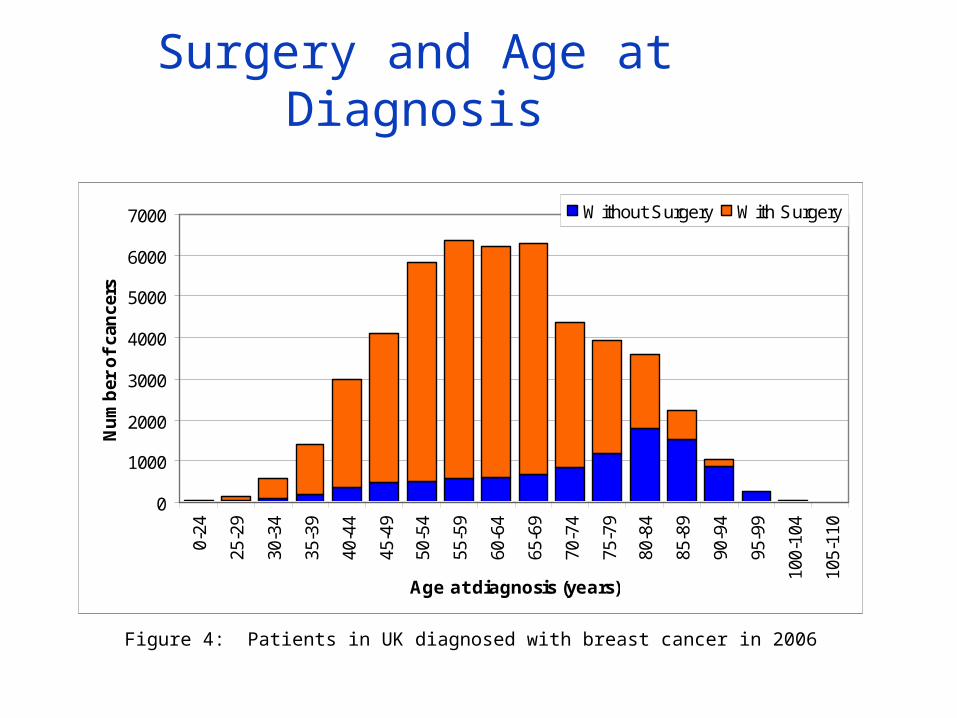
Surgery and Age at Diagnosis
0
1000
2000
3000
4000
5000
6000
70000-
24
25-2
9
30-3
4
35-3
9
40-4
4
45-4
9
50-5
4
55-5
9
60-6
4
65-6
9
70-7
4
75-7
9
80-8
4
85-8
9
90-9
4
95-9
9
100-
104
105-
110
Age at diagnosis (years)
Nu
mb
er o
f ca
nce
rs
Without Surgery With Surgery
Figure 4: Patients in UK diagnosed with breast cancer in 2006
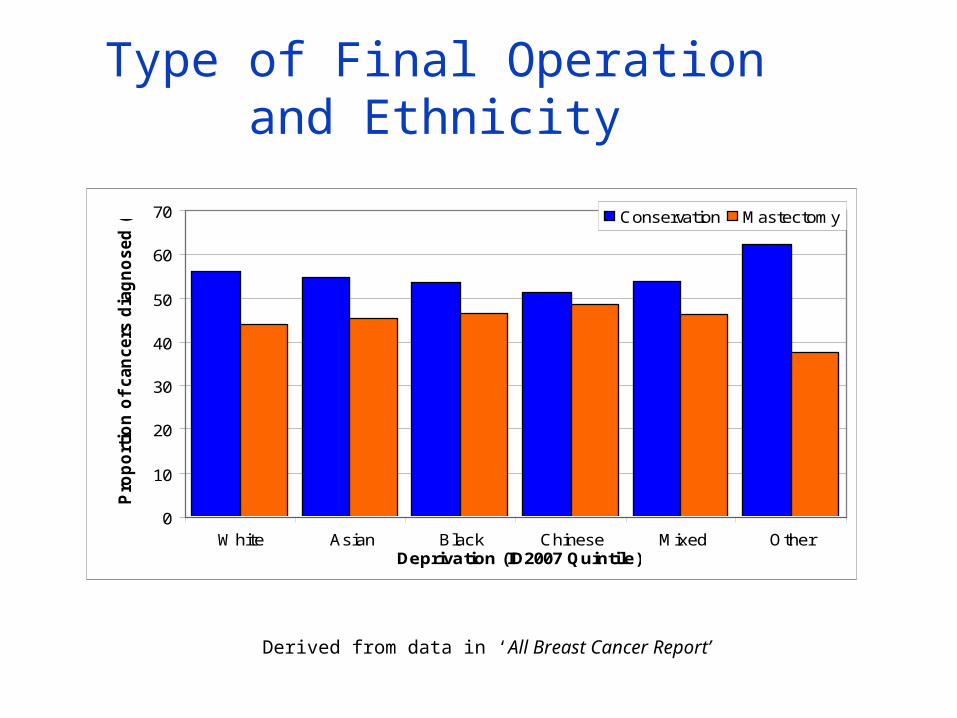
Type of Final Operation and Ethnicity
0
10
20
30
40
50
60
70
White Asian Black Chinese Mixed OtherDeprivation (ID2007 Quintile)
Pro
po
rtio
n o
f can
cers
dia
gn
osed
(%
)
Conservation Mastectomy
Derived from data in ‘All Breast Cancer Report’

Type of Final Operation and Deprivation
0
10
20
30
40
50
60
70
Quintile 1 Most Deprived
Quintile 2 Quintile 3 Quintile 4 Quintile 5 Most Affluent
Deprivation (ID2007 Quintile)
Pro
po
rtio
n o
f can
cers
dia
gn
osed
(%
)
Conservation Mastectomy
Figure 4: Patients in England diagnosed with breast cancer in 2006

Adjuvant Treatment

Radiotherapy and ChemotherapyCohort
With Radiotherapy
recorded Total cases
All breast invasive cancers 66% 16,133
Female 66% 16,030
Male 45% 103
Screen-detected 69% 5,207
Symptomatic 64% 10,926
Aged <50 70% 3,642
Aged 50-70 69% 9,080
Aged >70 53% 3,408
Breast conserving surgery (England only) 82% 6,944
Mastectomy (England only) 45% 5,573
Table 16: Variation with gender, route of presentation and age in the radiotherapy treatment recorded by the six UK regions with the most complete radiotherapy data
Cohort With
Chemotherapy recorded
Total cases
All breast invasive cancers 41% 26,198
Female 41% 26,032
Male 31% 166
Screen-detected 23% 8,563
Symptomatic 49% 17,635
Aged <50 72% 5,729
Aged 50-70 38% 14,857
Aged >70 16% 5,608
Breast conserving surgery (England only) 34% 12,995
Mastectomy (England only) 48% 9,587
Table 18: Variation with gender, route of presentation and age in the chemotherapy treatment recorded by the eight UK regions with the most complete chemotherapy data

Adjuvant Therapy and Ethnicity and Deprivation
Cohort
With Radiotherapy
recorded Total cases
Ethnic group
White 67% 8,990
Asian 69% 174
Black 71% 83
Chinese 58% 24
Mixed 58% 24
Other 81% 27
Unknown 62% 3,195
Deprivation group
Most deprived 67% 1,639
Quintile 2 64% 2,133
Quintile 3 66% 2,563
Quintile 4 65% 2,957
Most affluent 66% 3,222
Cohort With
Chemotherapy recorded
Total cases
Ethnic group
White 41% 15,763
Asian 48% 439
Black 65% 327
Chinese 45% 33
Mixed 53% 76
Other 44% 149
Unknown 35% 5,795
Deprivation group
Most deprived 44% 3,204
Quintile 2 40% 4,201
Quintile 3 40% 4,779
Quintile 4 39% 5,112
Most affluent 38% 5,283
Table 17 and Table 19

Survival

1-year and 5-year Relative Survival
Table 20: 1-year and 5-year relative survival for cohorts of breast cancer patients diagnosed in 2006 and 2001/02 (England only)
1-year relative survival (%)
1-year relative survival (%)
5-year relative survival (%) Cohort
2006 2001/02 2001/02
All breast cancers 95.8 94.6 82.0
Female 95.8 94.6 82.0
Male 94.6 90.9 81.2 Non-invasive 100.4 100.3 100.2
Invasive 95.3 94.0 80.3 Surgically treated 99.7 - -
No surgery recorded 77.0 - -
Invasive breast cancers
Aged <50 98.4 97.7 84.2 Aged 50-70 97.7 96.8 86.0 Aged >70 88.7 87.2 67.6

Age at Diagnosis and 1-year Relative Survival
80
85
90
95
100
<50 50-70 71+
Age at diagnosis
1 y
r re
lati
ve s
urv
ival
(%)
2001/02
2006
Figure 6: Patients in England diagnosed with breast cancer in 2001/02 and 2006

Relative Survival and Presentation Route and NPI
1-year relative survival (%)
1-year relative survival (%)
5-year relative survival (%) Cohort
2006 2001/02 2001/02
All invasive breast cancers 95.8 94.6 82.0
Screen-detected 100.2 100.1 97.4
Symptomatic 93.7 93.0 77.6 Aged 50-70 all invasive breast cancers
97.7 96.8 86.0
Aged 50-70 screen-detected 100.1 100.0 96.2
Aged 50-70 symptomatic 95.2 94.9 80.3
Table 21: 1-year and 5-year relative survival rates; breast cancer patients diagnosed in 2006 and 2001/02 (England only)
80
85
90
95
100
EPG GPG MPG1 MPG2 PGP
NPI groups
1 yr
rel
ativ
e su
rviv
al (
%)
Screen-detected
Symptomatic
Figure 7: Variation in 1-year survival with presentation route and NPI (50-70 age group)
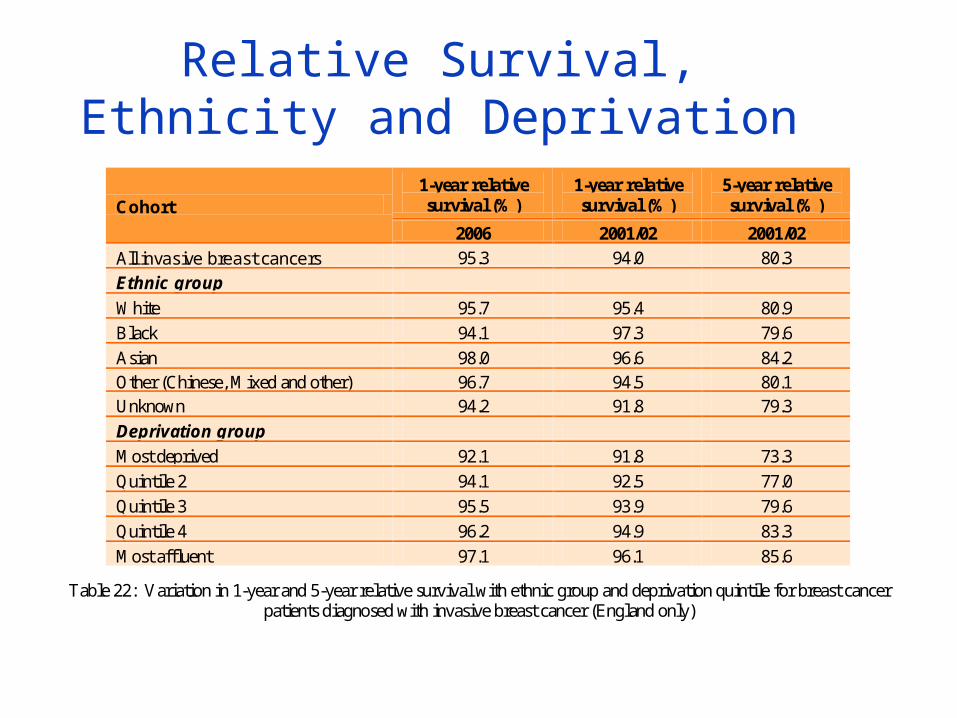
Relative Survival, Ethnicity and Deprivation
1-year relative survival (%)
1-year relative survival (%)
5-year relative survival (%) Cohort
2006 2001/02 2001/02
All invasive breast cancers 95.3 94.0 80.3
Ethnic group
White 95.7 95.4 80.9
Black 94.1 97.3 79.6
Asian 98.0 96.6 84.2 Other (Chinese, Mixed and other) 96.7 94.5 80.1 Unknown 94.2 91.8 79.3
Deprivation group
Most deprived 92.1 91.8 73.3
Quintile 2 94.1 92.5 77.0
Quintile 3 95.5 93.9 79.6
Quintile 4 96.2 94.9 83.3
Most affluent 97.1 96.1 85.6
Table 22: Variation in 1-year and 5-year relative survival with ethnic group and deprivation quintile for breast cancer patients diagnosed with invasive breast cancer (England only)

Presentation Route, Relative Survival, Ethnicity and Deprivation
80
85
90
95
100
Quintile 1 Quintile 2 Quintile 3 Quintile 4 Quintile 5
Deprivation (ID2007 Quintile)
1 yr
rel
ativ
e su
rviv
al (
%)
Screen-detected
Symptomatic
Most Deprived Most Affluent
Figure 8: Patients in England diagnosed with breast cancer in 2001/02
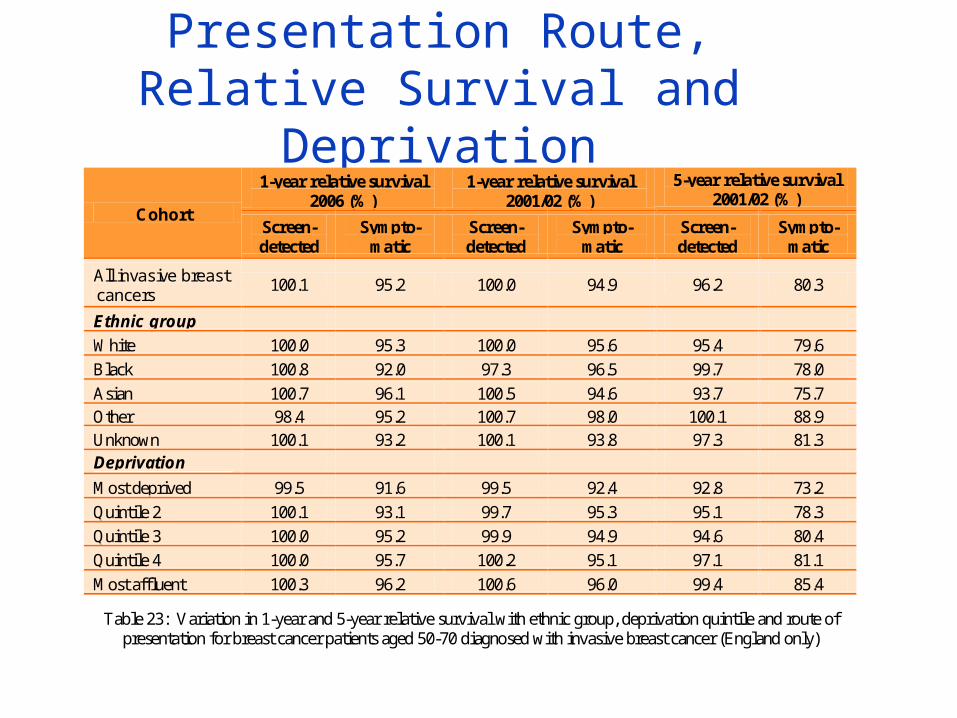
Presentation Route, Relative Survival and Deprivation
1-year relative survival 2006 (%)
1-year relative survival 2001/02 (%)
5-year relative survival 2001/02 (%)
Cohort Screen-detected
Sympto-matic
Screen-detected
Sympto-matic
Screen-detected
Sympto-matic
All invasive breast cancers
100.1 95.2 100.0 94.9 96.2 80.3
Ethnic group
White 100.0 95.3 100.0 95.6 95.4 79.6
Black 100.8 92.0 97.3 96.5 99.7 78.0
Asian 100.7 96.1 100.5 94.6 93.7 75.7 Other 98.4 95.2 100.7 98.0 100.1 88.9 Unknown 100.1 93.2 100.1 93.8 97.3 81.3 Deprivation group
Most deprived 99.5 91.6 99.5 92.4 92.8 73.2
Quintile 2 100.1 93.1 99.7 95.3 95.1 78.3
Quintile 3 100.0 95.2 99.9 94.9 94.6 80.4
Quintile 4 100.0 95.7 100.2 95.1 97.1 81.1
Most affluent 100.3 96.2 100.6 96.0 99.4 85.4
Table 23: Variation in 1-year and 5-year relative survival with ethnic group, deprivation quintile and route of presentation for breast cancer patients aged 50-70 diagnosed with invasive breast cancer (England only)