the allstate corporation · improve pricing sophistication and offer basic connected services for...
TRANSCRIPT
®
The Allstate CorporationCECP Strategic Investor InitiativeThomas J. Wilson, Chairman and Chief Executive OfficerSeptember 19, 2017

1
Forward-Looking Statements and Non-GAAP Financial Information
This presentation contains forward-looking statements and information. Additional information on factors that could
cause results to differ materially from those projected in this presentation is available in the 2016 Form 10-K, in our
most recent earnings release and at the end of these slides. These materials are available on our website,
allstateinvestors.com, under the “Financials” link.
This presentation also contains some non-GAAP measures that are denoted with an asterisk. You can find the
reconciliation of those measures to GAAP measures within our most recent earnings release or investor supplement.
These materials are available on our website, allstateinvestors.com, under the “Financials” link.

2
Allstate Creates Long-Term Value By Leveraging Our Capabilities and Strategic Assets
▪ Nation’s largest publicly held personal lines insurer
▪ Serve more than 16 million households
▪ Over 36,000 Allstate licensed sales professionals
▪ Diversified portfolio of businesses
− Auto, homeowners, life, other personal lines insurance
− Voluntary workforce benefits
− Consumer warranties and services
▪ 75 million policies in force1
▪ $80+ billion investment portfolio
Note: Data as of December 31, 20161 As of June 30, 2017
3
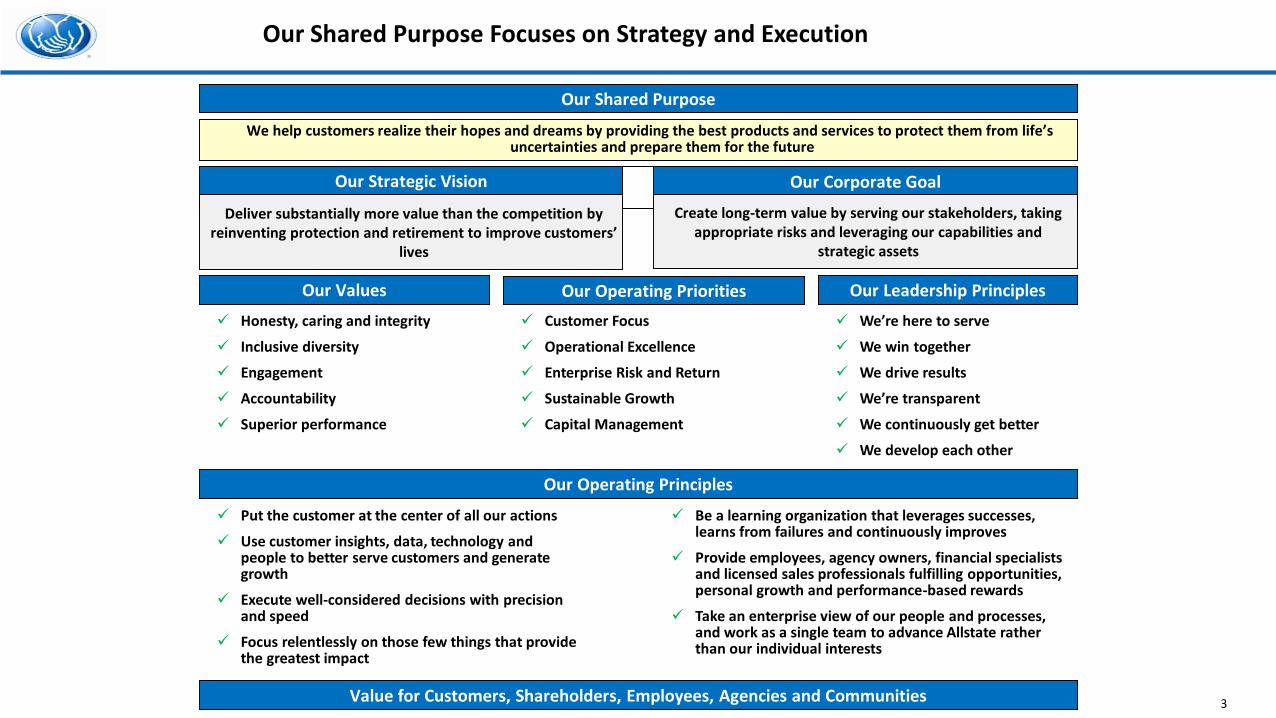
Our Shared Purpose Focuses on Strategy and Execution
Our Shared Purpose
We help customers realize their hopes and dreams by providing the best products and services to protect them from life’s uncertainties and prepare them for the future
Our Operating Priorities
✓ Customer Focus
✓ Operational Excellence
✓ Enterprise Risk and Return
✓ Sustainable Growth
✓ Capital Management
Our Strategic Vision
Deliver substantially more value than the competition by reinventing protection and retirement to improve customers’
lives
Our Corporate Goal
Create long-term value by serving our stakeholders, taking appropriate risks and leveraging our capabilities and
strategic assets
Our Values
✓ Honesty, caring and integrity
✓ Inclusive diversity
✓ Engagement
✓ Accountability
✓ Superior performance
Our Leadership Principles
✓ We’re here to serve
✓ We win together
✓ We drive results
✓ We’re transparent
✓ We continuously get better
✓ We develop each other
Our Operating Principles
✓ Put the customer at the center of all our actions
✓ Use customer insights, data, technology and people to better serve customers and generate growth
✓ Execute well-considered decisions with precision and speed
✓ Focus relentlessly on those few things that provide the greatest impact
✓ Be a learning organization that leverages successes, learns from failures and continuously improves
✓ Provide employees, agency owners, financial specialists and licensed sales professionals fulfilling opportunities, personal growth and performance-based rewards
✓ Take an enterprise view of our people and processes, and work as a single team to advance Allstate rather than our individual interests
Value for Customers, Shareholders, Employees, Agencies and Communities

4
Revenue (Ex. RCGL) - $37.3 Billion
Allstate Life 2.0 Allstate Benefits 4.1
Allstate Annuities 0.2
SquareTrade31.3
Encompass 0.9 Esurance 1.5
Allstate Brand Other
9.4
Allstate Home6.1
Allstate Auto19.5
(in millions, as of 6/30/17)
Policies in Force - 75.0 Million
Allstate Life $239
Allstate Benefits $95
Allstate Annuities $153
P-L Investment Income $918
Allstate Brand Other $92
Allstate Home$709
Allstate Auto$610
Operating Income* - $2.4 Billion
(1) Trailing Twelve Months (2) Represents underwriting income excluding the amortization of purchased intangibles, after-tax
($M, TTM(1) June 30, 2017)
($M, TTM(1) June 30, 2017)P-L & Corp Inv Inc.
$1,392
AF Inv Inc. $1,802
AF Prem $2,329
SquareTrade$129
Esurance$1,689
Encompass$1,146
Other Business
Lines $578
Other P&C Lines $2,111
Allstate Home$6,753
Allstate Auto
$19,341
Allstate’s Broad-Based Business Model is Built on Core Strengths
(2)
(2)
(2)
Other (Not Graphed)Esurance(2) ($57)Encompass(2) ($7)SquareTrade ($7)AFI ($1)Disc Lines ($72)Other P-L $36Corp/Interest ($309)
Return on Common Shareholders’ Equity(TTM(1))
6/30/17
Net Income 13.1%
Operating Income 13.5%

5
Deliver the Best Value to Each Customer Segment by Offering Unique Products and Services at a Competitive Price
Brand
Neutral
Self-
Serve
Local Advice
and Assistance
Brand
Sensitive
Progressive IA Travelers
Liberty Mutual Hartford
State Farm Nationwide
Farmers
Goji CoverHound
Non-Traditional Competitors
GEICO USAA
Progressive Direct
Source: SNL and Allstate internal analysis, based on 2016 market data; “other” market share channel is not included, but accounts for ~1% in auto and ~5% in Home
6
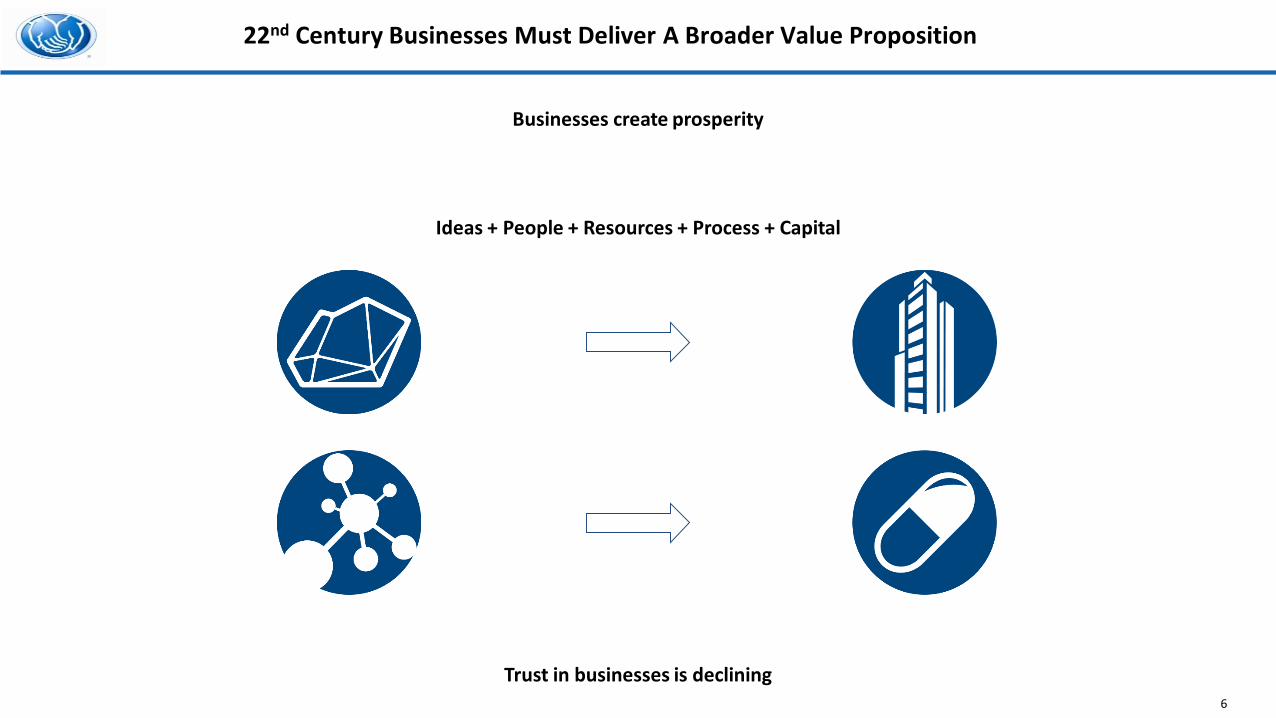
22nd Century Businesses Must Deliver A Broader Value Proposition
Businesses create prosperity
Ideas + People + Resources + Process + Capital
Trust in businesses is declining
7
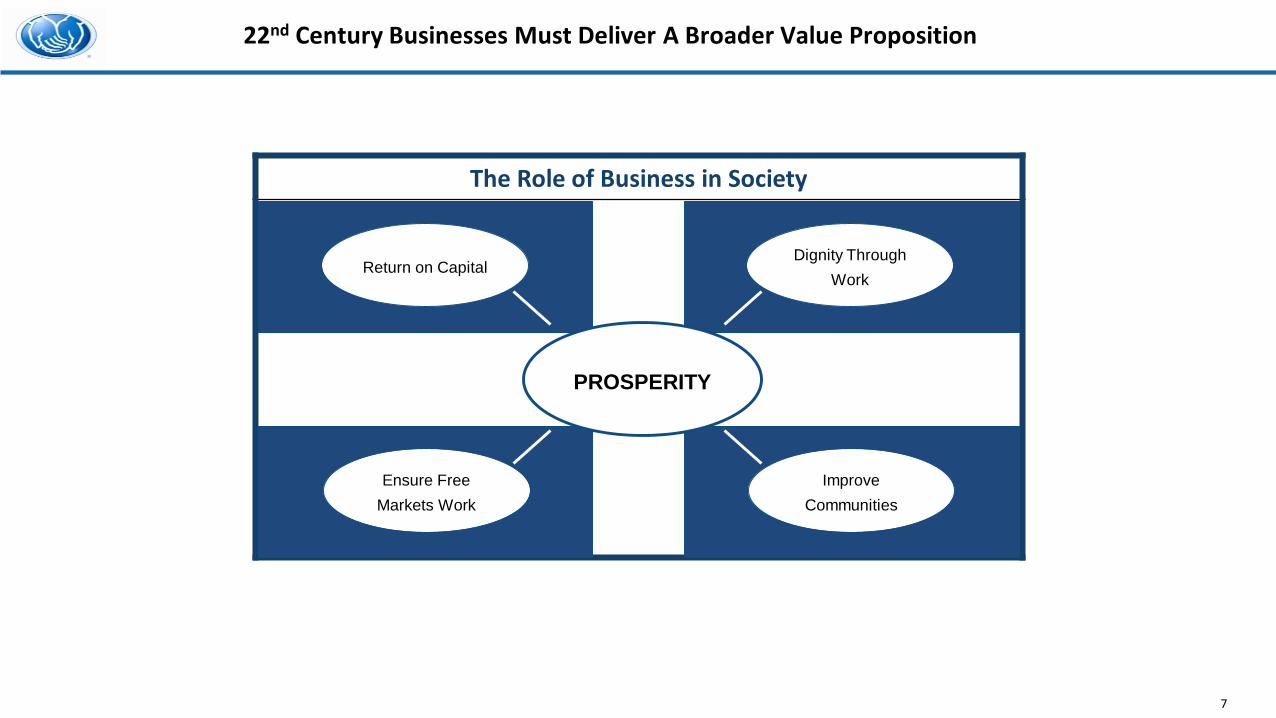
22nd Century Businesses Must Deliver A Broader Value Proposition
The Role of Business in Society
Return on Capital
Ensure Free
Markets Work
Dignity Through
Work
Improve
Communities
PROSPERITY

8
Allstate Focuses on Value Creation Across Time Horizons
2017 Operating Priorities
▪ Better serve our customers
▪ Achieve target economic returns on capital
▪ Grow customer base
▪ Proactively manage investments
▪ Build long-term growth platforms
▪ Allstate agencies – Trusted Advisors
▪ Esurance
▪ Integrated digital enterprise
▪ Telematics
Continually Strengthen
Existing Business Models
▪ Strategic Platforms - connected cars
Current Results
Create New Growth Platforms

9
Allstate is Building a Strategic Platform for Connected Cars
Strategic Platform
Proprietary Businesses Third-Parties
Existing ExtensionsEnhancing Proprietary Businesses
Leveraging Platform
Capabilities
Assets
Information from Users and External Sources
Platform Interfaces
Rules in Utilizing Platform
Shared Intelligence Among Users and Allstate

10
Improve pricing sophistication and offer basic connected
services for auto insurance
Public sector and transportation analytics
Safety, assistance, diagnostics (e.g., roadside assistance, car
health insights)
▪ Allstate is combining its assets and capabilities with technology advances to enhance its business model and build a connected car strategic platform
Insurers1
Consumers2
Non-Insurance Businesses3
Value Creation
Arity Connected Car Technology and Analytics Focused on New Growth Opportunities
Customer Interaction

11
Long-Term Growth Opportunities Created from Restructuring of the Personal Transportation System
(1)DOT, 2015: includes cars and light duty trucks; (2)$16,800 value per car (USA Today, 2014) x 240M; (3)Allstate Analysis; (4)Morgan Stanley “Auto & Auto-Related”, 2015; (5)NHTS, 2009;
Autonomous Vehicles
Vehicles ~240 million1
Value of Fleet ~$4 trillion2
Annual Direct Costs ~$2.1 trillion3
Annual Indirect Costs ~$1 trillion3
Total Utilization ~4%4
Peak Hours Utilization ~33%5
Personal Transportation System
U.S. Personal Household Income Increases By 5% ($3,000 per year) with a 20% Efficiency Gain

12Source: Bloomberg
Allstate’s Total Shareholder Return Compares Favorably to Major Indices and Peers
Total Shareholder Return3 Year
1/1/15-9/15/17
5 Year1/1/13-9/15/17
Allstate 36.1% 147.5%
S&P P/C 42.1% 127.5%
S&P Life 24.5% 107.5%
S&P MLIN 16.4% 80.4%
S&P 500 28.6% 93.5%
Proxy Peers 29.0% 103.6%
ISS Peers 30.2% 108.1%
6.4
9.612.2
8.8
13.3
-1.6
24.2
-5
0
5
10
15
20
25
30
ALL S&P P/C S&P LIFE S&P MLIN S&P 500 Proxy
Peers
ISS Peers
2017 YTD Allstate vs. Major Indices Total Shareholder Return
(%)
P/B & P/E Ratios at 9/15/17
P/B 1.7 1.5 1.0 0.8 3.2 n/a n/a
P/E '17 14.8 15.4 10.8 11.0 19.1 n/a n/a

13
▪ Sophisticated and diverse board
▪ Strong shareholder engagement
▪ A World’s Most Ethical Company 3 years running – Ethisphere Institute
▪ Top 50 Companies for Diversity® 12 years running – DiversityInc
Allstate Has A Proactive Approach To Corporate Governance
Dialogue Transparency Responsiveness
Good Governance
✓ Formal director evaluation process
✓ Comprehensive Board dialogue and interaction with stockholders and governance firms
✓ Annual report on corporate involvement with public policy highlights our robust disclosure initiatives
✓ 10/11 Board members are independent
✓ Independent lead director
Shareholder Rights
✓ Proxy Access Right (3% / 3 year / 20% / 20)
✓ Annually elected directors
✓ Majority vote standard to elect directors in uncontested elections
✓ No supermajority voting provisions
✓ Shareholder right to call special meeting at 10% threshold
✓ Shareholder right to act by written consent
14
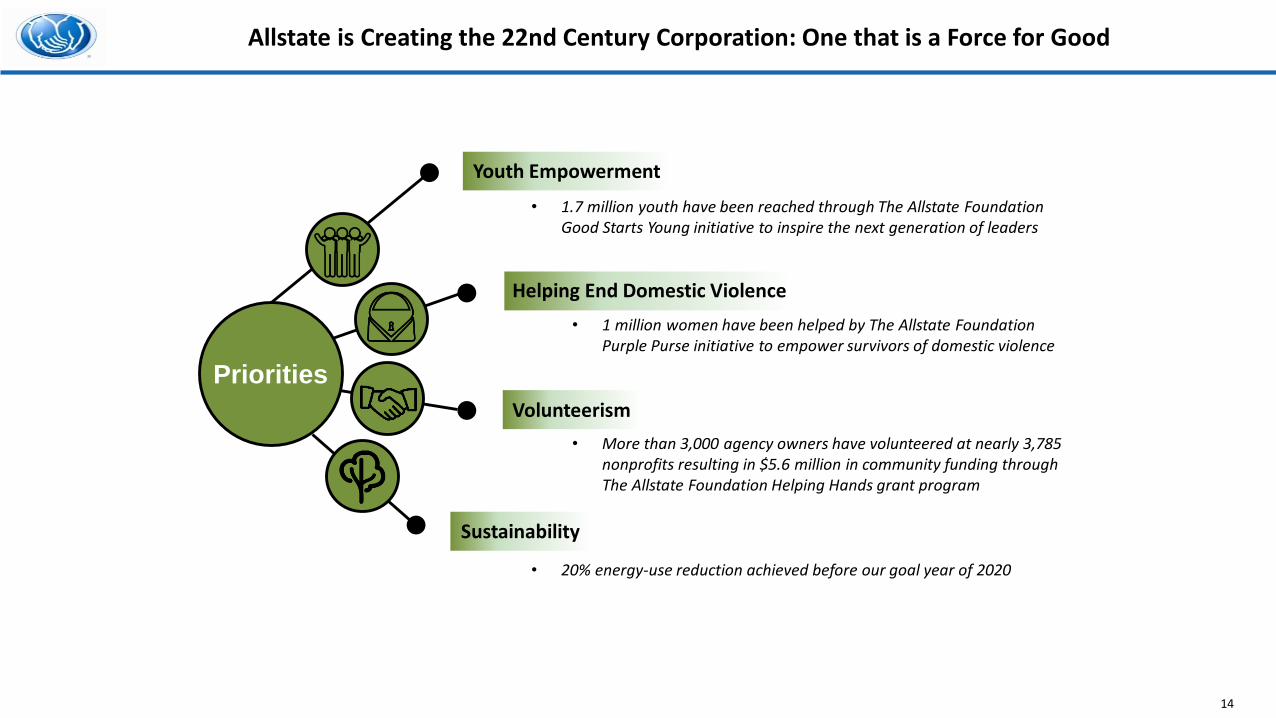
Allstate is Creating the 22nd Century Corporation: One that is a Force for Good
Youth Empowerment
Sustainability
Volunteerism
Helping End Domestic Violence
Priorities
• 1.7 million youth have been reached through The Allstate Foundation Good Starts Young initiative to inspire the next generation of leaders
• 1 million women have been helped by The Allstate Foundation Purple Purse initiative to empower survivors of domestic violence
• More than 3,000 agency owners have volunteered at nearly 3,785 nonprofits resulting in $5.6 million in community funding through The Allstate Foundation Helping Hands grant program
• 20% energy-use reduction achieved before our goal year of 2020

15
Allstate Is An Attractive Investment
▪ Strategy focused on value creation across time horizons
• Current results
• Continuously strengthening existing business models
• Create new growth platforms
▪ Attractive risk adjusted shareholder returns
▪ Building a 22nd Century Business
16
Forward-Looking StatementsThis presentation contains “forward-looking statements” that anticipate results based on our estimates, assumptions and plans that are subject to uncertainty. These statements are made subject to the safe-harbor provisions of the Private Securities Litigation Reform Act of 1995. These forwardlooking statements do not relate strictly to historical or current facts and may be identified by their use of words like “plans,” “seeks,” “expects,” “will,” “should,” “anticipates,” “estimates,” “intends,” “believes,” “likely,” “targets” and other words with similar meanings. We believe these statements are based on reasonable estimates, assumptions and plans. However, if the estimates, assumptions or plans underlying the forward-looking statements prove inaccurate or if other risks or uncertainties arise, actual results could differ materially from those communicated in these forward-looking statements. Factors that could cause actual results to differ materially from those expressed in, or implied by, the forward-looking statements include risks related to: (1) adverse changes in the nature and level of catastrophes and severe weather events; (2) our catastrophe management strategy on premium growth; (3) unexpected increases in the frequency or severity of claims; (4) regulatory changes, including limitations on rate increases and requirements to underwrite business and participate in loss sharing arrangements; (5) impacts from the Covered Agreement, including possible new capital and solvency regulations and changes in state insurance laws; (6) the cyclical nature of the property and casualty business; (7) market convergence and regulatory changes on our risk segmentation and pricing; (8) reestimates of reserves for claims; (9) adverse legal determinations regarding discontinued product lines and other legal and regulatory actions; (10) changes in underwriting and actual experience; (11) changes in reserve estimates for life-contingent contract benefits payable; (12) the influence of changes in market interest rates or performance-based investment returns on spread-based products; (13) changes in estimates of profitability on interest-sensitive life products; (14) reducing our concentration in spread-based business and exiting certain distribution channels; (15) changes in tax laws; (16) our ability to mitigate the capital impact associated with statutory reserving and capital requirements; (17) a decline in Lincoln Benefit Life Company’s financial strength ratings; (18) market risk and declines in credit quality relating to our investment portfolio; (19) our subjective determination of the fair value of our fixed income and equity securities and the amount of realized capital losses recorded for impairments of our investments; (20) competition in the insurance industry; (21) impacts of new or changing technologies on our business; (22) conditions in the global economy and capital markets; (23) losses from legal and regulatory actions; (24) restrictive regulation and regulatory reforms; (25) the availability of reinsurance at current levels and prices; (26) risk of our reinsurers; (27) our participation in state industry pools and facilities; (28) a downgrade in our financial strength ratings; (29) the effect of adverse capital and credit market conditions; (30) failure in cyber or other information security; (31) the impact of a large scale pandemic, the threat or occurrence of terrorism or military action; (32) acquisitions of businesses; (33) possible impairments in the value of goodwill; (34) changes in accounting standards; (35) the realization of deferred tax assets; (36) restrictions on our subsidiaries’ ability to pay dividends; (37) restrictions under the terms of certain of our securities on our ability to pay dividends or repurchase our stock; (38) changing climate and weather conditions; (39) loss of key vendor relationships or failure of a vendor to protect confidential and proprietary information; and (40) intellectual property infringement, misappropriation and third party claims. Additional information concerning these and other factors may be found in our filings with the Securities and Exchange Commission, including the “Risk Factors” section in our most recent annual report on Form 10-K. Forward-looking statements speak only as of the date on which they are made, and we assume no obligation to update or revise any forward-looking statement.
Forward-Looking Statements
