the amcp format for version 2.1... · the amcp format for formulary submissions version 2.1 april...
TRANSCRIPT

The AMCP Format for Formulary SubmissionsV E R S I O N 2 . 1 A P R I L 2 0 0 5
A Format for Submission of Clinical and Economic Datain Support of Formulary Consideration byHealth Care Systems in the United States
®Foundation for Managed Care Pharmacy
Table of Contents [---] Formulary Submission Guidelines (Health care systems should personalize the guidelines by
inserting their organization’s name wherever [---] appears in the document).
Foreword iv.
Acknowledgements vi.
Preface vii.• Foundation of a Sound Formulary System vii.• Guidelines and Drug Coverage Decisions vii.• Promotion and Adoption of the AMCP Format ix.• Recognition of the AMCP Format ix.• Version 2.1 ix.• The Role of the AMCP Format x.• Advantages for the Manufacturer xi.• Confidentiality Issues xii.• Communication – The Key to Success xiii.• Dialogue with the Food and Drug Administration (FDA) xiii.• The Importance of Clinical Information xiv.• Customizing the Economic Model xv.• Barriers to Adoption xvi.• Conclusion xvii.
Introduction - Developing an AMCP Format-based Dossier xviii.• Manufacturer Responsibilities xviii.• Content xix.• Standards of Care and Data Source xix.• Disclosure of Potential Reporting Bias xix.• Recommended Formulary Submission Processes – New Products xx.• Periodic Review of Therapeutic Classes and Requests for Updated Dossiers When
Competitor Products are Being Reviewed xxi.• Agenda for Pre-Submission Meeting xxii.• Roles and Responsibilities of the Health System xxii.
Health System Guidelines for Manufacturers (Evidentiary Requirements for Formulary Submission Dossiers)
1
Sample Unsolicited Request Letter 2
1. Product Information 31.1 Product Description 31.2 Plac e of the Product in Therapy 3
1.2.1 Disease Description 31.2.2 Approaches to Treatment 4
1.3 Evidence for Pharmacogenomic Tests and Drugs 4
2. Supporting Clinical and Economic Information 52.1 Summarizing Key Published and Unpublished Clinical and Economic Studies 5
ii

2.1.1 Evidence Table Spreadsheets 72.2 Outcomes Studies and Economic Evaluation Supporting Data 7
2.2.1 Evidence Table Spreadsheets 8
3. Modeling Report 83.1 Model Overview 8
3.2 Parameter Estimates for Models 113.3 Perspective, Time Horizon and Discounting 123.4 Analyses 123.5 Presentation of Model Results 123.6 Exceptions 13
4. Product Value and Overall Cost 13
5. Supporting Information 145.1 References Contained in Dossiers 145.2 Economic Models 145.3 Formulary Submission Checklist 15
Terms and Definitions 16References 21Appendices 25
A. Principles of a Sound Drug Formulary System B. Guidelines for Authors and Peer Reviewers of Economic Submissions to the
British Medical Journal (M.F. Drummond) C. Principles of Good Practice for Decision Analytic Modeling in Health-Care
Evaluation: Report of the ISPOR Task Force on Good Research Practices – Modeling Studies
D. Sample P&T Committee Monograph
Copyright © 2005 Academy of Managed Care Pharmacy
iii
F O R E W O R D
Peter J. Neumann, Sc.D. Associate Professor of Policy and Decision Sciences
Harvard School of Public Health
The AMCP Format for Formulary Submissions promises to change the paradigm of formulary decision making with a simple yet powerful idea: Pharmacy and Therapeutics (P&T) committees’ decisions could be improved if health plans requested that drug companies submit to them a standardized set of clinical and economic evidence. Rather than passively receiving information and worrying about biased or poor quality evidence, health plans could follow the example of health reimbursement authorities worldwide and develop their own expertise and procedures for evaluating effectiveness and cost-effectiveness information.
The Format, established in 2000, is above all a tool of empowerment for P&T committees -- one that levels a playing field traditionally favoring drug manufacturers. It urges plans to request formally that drug companies present a standardized “dossier,” which contains detailed information not only on the drug’s effectiveness and safety, but also on its overall economic value relative to alternative therapies. The Format further prescribes the layout for the submission, recommending that companies include unpublished studies, data on off-label indications, information on the drug’s place in therapy, related disease management strategies, and an economic model to provide evidence of the product’s value.
To date, dozens of health plans, pharmacy benefit management companies, hospitals, Medicaid
programs, and public agencies such as the Department of Defense have adopted the Format or a Format-like process.
The AMCP Format Version 2.1 continues in this tradition. It heralds some important improvements,
namely to clarify the presentation of model results and to differentiate more clearly between cost-effectiveness and budget impact models. More importantly, it signals the ongoing commitment of the Foundation for Managed Care Pharmacy, which has spearheaded the effort for formulary submission guidelines.
For the AMCP Format to succeed, however, progress must continue on several fronts:
Ensuring an efficient process. Plans adopting the Format should experience improvements over existing practices as adoption leads to more careful deliberation about evidence. Standardized guidelines promise to streamline formulary processes and lower administrative costs. But it will take time, effort, and patience to realize these gains. To its credit, the Format emphasizes that it represents a template rather than a mandate, and that it can be adapted by individual plans to meet their specific needs. Developing the expertise. A concern has always existed that health plans do not possess the expertise necessary to judge the information in dossiers, particularly evidence contained in the economic models featured prominently in the guidelines. In truth, health plans in the U.S., are a diverse lot with a varied ability to conduct dossier reviews. Some large organizations have strong in-house capabilities, while others are developing the expertise or contracting out these services. Ongoing training efforts will be critical.
Focusing on value. One of AMCP’s chief innovations is to focus P&T committees’ efforts on a drug’s overall value and place in therapy, rather than on its acquisition costs and impact on pharmacy budgets. Users should always keep in mind that the Format is not a cost-containment device but an analytic tool to improve the value of health care delivered.
iv

Improving economic models. One of the most important and challenging areas of the Format concerns the use of economic models. The Format calls for such models to inform decisions about the value or cost-effectiveness of pharmaceuticals, biologics, and vaccines. Research in the U.S. and abroad has shown that economic models are often incomplete or of poor quality. There is an ongoing need to monitor and improve models.
The confidentiality of dossiers. The confidentiality of dossiers has also emerged as an area of concern. Drug firms fear that proprietary information submitted in a dossier -- e.g., pharmacoeconomic models, unpublished studies, off-label information -- will become publicly available, thus exposing sensitive data to competitors, and potentially alarming regulatory authorities worried about misleading promotion. To a large extent, the concerns should be addressed through compliance with FDA standards on unsolicited requests and with appropriate confidentiality agreements. As AMCP notes, dossiers submitted to authorities in the U.K. and certain other countries are made available to the public but commercial in confidence information, when properly identified by the manufacturer, is removed for the online version of the evaluation report. Special arrangements with public payers, which require public disclosure of information received, may be needed.
Trust. Finally, the AMCP’s success will hinge critically on the development of trust between pharmaceutical companies and formulary committees. In the end the Format should foster a more rigorous and honest dialog about evidence. Drug companies will likely see opportunities for showcasing products, and for arguing for products on the company’s own terms – i.e., on the basis of a drug’s overall value rather than price and negotiated rebates. Health plans and their enrollees should experience gains, too, as the debate shifts in this direction. The Format rightly emphasizes the need for good communication.
All of this will require an investment on the part of producers and consumers of evidence. Indeed, the
Format should be seen as an important part of the ongoing movement towards evidence-based medicine. But simply stating that a process is “evidence-based” does not remove the hard work associated with sifting through information, balancing individual patient characteristics and preferences with population norms, and making difficult judgments in the face of uncertainty. Constructing an evidence-based process is only a start albeit a critical one.
The AMCP Format has the potential to serve as a national, unifying template for P&T committees to
consider clinical and economic information in a systematic and rigorous fashion. It is a welcome development for a U.S. health system that is in need of more rigorous evaluation of evidence.
v

A C K N O W L E D G E M E N T S The Academy of Managed Care Pharmacy (AMCP) and the Foundation for Managed Care Pharmacy (FMCP) gratefully acknowledge the contributions of many individuals who have devoted much time, expertise and commitment in the preparation of the newest version this valuable pharmacy tool. Following the release of Version 2.0 in October 2002, health systems continued the process of adopting the Format to the point that FMCP estimates that health plans and PBMs representing nearly 150 million Americans are in some stage of adoption of the Format or similar process. In addition, a 2003 survey of managed care organizations and PBMs concluded that the Format had become a pharmaceutical industry standard. During the ensuing two years FMCP continued to collect comments on the Format from numerous colleagues in the clinical pharmacy and health economics fields. In the spring of 2004 FMCP staff and the Format Executive Committee began the process of vetting the comments and developing Version 2.1. In all instances these comments have been constructive, but we have not been able to take on board all suggestions, as not everyone agrees on all points. We are deeply indebted to the members of the FMCP Format Executive Committee for their continuing support of the Format and for their sage advice and constructive comments: Kerri Chitwood, Pharm.D, B.S. Pharm, National Pharmacy Director, Great-West Life; D.S. (Pete) Fullerton, President, Strategic Pharmacy Innovations, LLC; Joseph A. Gricar, M.S., Consultant, New York, NY; Eric Klein, PharmD, Manager, Health Outcomes, Global Health Outcomes, Eli Lilly & Company; Bryan R. Luce, PhD, MBA, CEO & Senior Research Leader, MEDTAP International, Inc.; C. Alan Lyles, PhD, MPH, B.S. Pharm, Associate Professor, University of Baltimore; Pete Penna, Pharm.D, Partner, Formulary Resources, LLC; Eric Racine, PharmD, Senior Director, Pharmacy Affairs, sanofi-aventis; John Watkins, Pharmacy Manager, Formulary Development, Premera Blue Cross. This version would not have been possible without the considerable contributions of David Veenstra, PhD, Research Associate Professor, University of Washington Pharmaceutical Outcomes Research and Policy Program; Scott Ramsey, MD, PhD, Director, Cancer Outcomes Research Program, Fred Hutchinson Cancer Research Center; Danial E. Baker, Pharm.D., FASHP, FASCP,Associate Dean for Clinical Programs, Professor of Pharmacotherapy,Washington State University Spokane, College of Pharmacy, Dept. Pharmacotherapy; Lou Garrison, Ph.D., Professor, Pharmaceutical Outcomes Research and Policy Program, University of Washington, Department of Pharmacy; Diana I. Brixner, R.Ph., Ph.D., Associate Professor and Chair, Department of Pharmacy Practice, Director, Pharmacotherapy Outcomes Research Center, University of Utah College of Pharmacy; and Fadia T. Shaya, PhD, MPH, Assistant Professor and Associate Director, Center on Drugs and Public Policy, University of Maryland School of Pharmacy We are also grateful for to Lynda G. Bryant-Comstock, GlaxoSmithKline; Shahnaz Khan, RTI Health Solutions; Vanessa A. Jacobson, Walgreens Health Initiatives; Newell McElwee, Pfizer Inc; Josephine Mauskopf, Global Head of Health Economics, RTI Health Solutions and Craig S. Stern, Pro Pharma Pharmaceutical Consultants, Inc. for their comments received. Finally, we are especially indebted to Sean D. Sullivan, PhD, Professor and Director, Pharmaceutical Outcomes Research and Policy Program, Department of Pharmacy, University of Washington. The broad acceptance of these guidelines by managed health care systems and the pharmaceutical industry as well as the success of FMCP’s numerous training programs are the direct result of his tireless devotion to this project since its inception.
vi
P R E F A C E
FOUNDATION OF A SOUND FORMULARY SYSTEM
Rational product adoption decisions employing clinical, economic and humanistic data are built on the foundation of a sound formulary system. Newly approved pharmaceutical, biologic and vaccine products should be subjected to a rigorous clinical review (and periodic re-review) based on evidence from the clinical literature. Evidence-based assessment of product efficacy, safety, effectiveness and value provide the foundation for such a review. This process has gained additional attention and importance given recent concerns about drug safety relative to incremental effectiveness. These precepts are affirmed by the National Committee for Quality Assurance (NCQA) managed care organization accreditation standard Procedures for Pharmaceutical Management and by the Principles of a Sound Drug Formulary developed and endorsed in August 2000 by The Academy of Managed Care Pharmacy and the Alliance of Community Health Plans, the American Medical Association, the American Society of Health-System Pharmacists, the Department of Veterans Affairs, Pharmacy Benefit Management Strategic Healthcare Group, the National Business Coalition on Health and the U.S. Pharmacopeia [1]. The goal of the formulary review process is to provide a quality pharmaceutical benefit, determined through an evidence-based decision-making process, taking into account the reality of constrained health care budgets. Where feasible, health systems should make product comparisons relative to existing competitor products as well as to placebo. For products with similar safety and efficacy profiles, they may reasonably make such decisions primarily on net acquisition cost, unless manufacturers can support reasonable product value or other program efficiency arguments with pharmacoeconomic evidence. When two or more products have similar indications but different acquisition costs, pharmacoeconomic analyses—which consider total costs and value for expenditure--may be particularly relevant to those who must make formulary status decisions, including issues designed to limit coverage to areas with maximum value for expenditure (e.g., prior authorization, copays).
GUIDELINES AND DRUG COVERAGE DECISIONS
Health care professionals and health care systems worldwide are challenged daily to set priorities in an environment where demand for health care services outweighs the supply of resources allocated to provide it. In the absence of widely accepted models for legitimate and fair priority-setting in health care, health care professionals must rely on the best available evidence to reach consensus about what constitutes the best allocation of resources to meet competing health care needs. For example, health care systems frequently conduct formulary decision-making under uncertain conditions due to the variability of available evidence on safety, effectiveness and appropriateness of particular interventions. Gibson, et al. state, “In the absence of consensus on guiding principles, the problem of priority-setting becomes one of procedural justice – legitimate institutions using fair
vii

P R E F A C E continued
processes.”[2] Therefore, health systems need tools to support product evaluation and selection with clinical outcomes as the most important consideration, while avoiding the use of low acquisition cost and rebates as the primary basis for selection. In recent years P&T committees have begun to move away from a narrow focus on the impact of pharmaceuticals on the pharmacy budget to broader considerations of “value for money”. Simply stated, value in health care relates to whether a medical intervention (e.g., drug, device, program, surgery), improves health outcomes enough to justify the additional dollars spent compared to another intervention. To determine value, health care systems are increasingly utilizing formulary guidelines that standardize the format for clinical and economic information submitted to the P&T committee by product manufacturers. While the United States has not adopted national formulary guidelines, Australia, in 1992, became the first country to require pharmaceutical and biopharmaceutical companies to submit evidence of their products’ cost-effectiveness to national authorities as a condition for consideration on the national formulary. [3] Other countries, including Canada, the United Kingdom, Sweden, Italy and the Netherlands have adopted their own version of reimbursement and pricing guidelines. [4] However, with the exception of guidelines developed by The Regence Group in the United States in 1994, and substantially revised in 1998 [5], no standardized format for the submission of product clinical and economic information by manufacturers existed in America. In an attempt to fill this vacuum, the Academy of Managed Care Pharmacy published the AMCP Format for Formulary Submissions in October 2000 and revised it in 2002 (version 2.0). AMCP Leadership and its members were motivated to develop these guidelines by a growing need to ensure that any increased utilization of medications, biopharmaceuticals or vaccine products was appropriate, and that newer products would bring added clinical and economic value to covered populations. To satisfy this need, the Academy recognized that it had to provide its members with the means to (1) promote the concept of combining efficacy, safety, effectiveness and economic evaluation for the formulary decision-making process, (2) provide a consistent and direct means for manufacturers to supply information directly to health systems in order to support use of their products, and (3) break down cost silos and emphasize that simple acquisition cost reduction is not the best approach to controlling overall health care expenditures and achieving overall health objectives. The AMCP Format’s requirements mirror those of other countries by requiring manufacturers to provide product dossiers that contain sufficient detail to give transparency to study design, research protocols, analytical methods, and presentation of results. Although the Format suggests a formalized system, users should view it as a dynamic and individualized, rather than static, process. AMCP and FMCP anticipate that increased standardization of information will lead to progressive improvement in the quality of submitted evidence over time, and provide health systems with data often unavailable in the past. As feedback is integral to the process, AMCP welcomes comments on its most recent version of the Format.
viii

P R E F A C E continued
PROMOTION AND ADOPTION OF THE AMCP FORMAT
Since initial publication of the AMCP Format [6], The Foundation for Managed Care Pharmacy has spearheaded several initiatives to promote its usage. This effort has included presentations and forums at AMCP and other professional organizations’ national meetings and conferences, articles in newsletters, peer-reviewed and lay literature, and numerous seminars. As of the publication of this revision of the AMCP Format, FMCP, in collaboration with the University of Washington’s Pharmaceutical Outcomes Research and Policy Program, the University of Maryland School of Pharmacy Center on Drugs and Public Policy, and the University of Utah Outcomes Research Center has trained over 350 health system pharmacists and other health care professionals representing over 180 organizations on the appropriate use of the Format. As a result of these efforts and the interest of decision makers in an evidence-based process, implementation and use of the AMCP Format has been widespread. A 2003 survey of managed care organizations (MCOs) and pharmacy benefit management companies (PBMs) representing approximately 80 percent of covered lives by The Bruckner Group concluded “the AMCP Format is now an industry standard.”[7] Survey results also showed that MCOs and PBMs representing about 65 percent of covered lives have officially adopted the AMCP Format, and 80 percent of formulary submissions are prepared using the AMCP Format. Internationally, interest in the AMCP Format has come from markedly disparate sources. For example, an agency of the Japanese government requested permission to translate the Format into Japanese, and inquiries have come from health systems in the Netherlands and Jordan.
RECOGNITION OF THE AMCP FORMAT
The AMCP Format has been recognized at the national and international level. In a February 2003 speech at the Resources For the Future conference “Valuing Health Outcomes”, Mark McClellan, then Commissioner, Food and Drug Administration stated “…FDA does recognize that industry is responding to many requests for economic information from payers and others, and in doing so industry seems to be increasingly following standards created by the Academy of Managed Care Pharmacy in formulary submissions of clinical and economic data. We hope that the influence of these standards for economic data is increasing the quality and the reliability of economic data in medical studies, and it certainly seems to be an interesting basis for potential guidance.”[8] Under the Medicare Modernization Act, PBMs and MCOs administering the Medicare drug benefit will need to adopt decision-making processes that are more transparent, consistent and evidence-based. These entities may adopt the AMCP Format as a national model for formulary decision-making. Indeed, the Centers for Medicare and Medicaid Services (CMS) has publicly stated that it intends to look to existing national standards and guidelines such as those established by AMCP to develop a framework for formulary management.[9]
ix
P R E F A C E continued
Like Version 2.0 of the AMCP Format, which was approved by the AMCP Board of Directors and released in October 2002, Version 2.1 is part of an ongoing effort to issue contemporary evidentiary standards and to address user comments and concerns. Since the release of Version 2.0, FMCP staff has collected numerous comments from managed health care systems, PBMs and the pharmaceutical industry. These comments were incorporated into the guidelines and then vetted by the FMCP Format Executive Committee and other experts in formulary management. Current users will find that some of the sections of the Evidentiary Requirements have been streamlined. Other changes were implemented to:
• Provide clarity in specific sections in response to users’ comments • Describe evidence requirements for biologics • Encourage clarity in the presentation of economic model results • Emphasize the need for model transparency • Differentiate requirements for budget impact vs. cost-effectiveness
models • Provide updated information on the adoption and recognition of the
Format both nationally and internationally. • Provide additional definitions and references
As always, FMCP encourages comments and lively discussion on the AMCP Format and related issues. All comments should be directed to Richard Fry,
MCP Director of Programs, at F
www.fmcpnet.org.
THE ROLE OF THE AMCP FORMAT
The Format and other formulary submission guidelines support the informed selection of pharmaceuticals, biologics and vaccines by: a) Standardizing and communicating product and supporting program
information requirements; b) Requiring projections of product impact on both the organization and its
enrolled patient population; c) Requesting information on the value of products being evaluated; and d) Making evidence and rationale supporting all choice(s) more clear and
evaluable by the health system decision makers. These guidelines emphasize that, while cost-effectiveness analysis and economic modeling are important elements in the value equation, they are secondary to the principal clinical concerns of safety and efficacy. Clearly, the benefits to patients as reflected in safety and efficacy must underlie any projected economic
alue. v The AMCP Format’s process is designed to maintain a high standard of objectivity to achieve two important goals. First, it is intended to improve the timeliness, scope, quality and relevance of information available to a health system’s evaluators and ultimately to its P&T Committees. Further, by assessing the health system impact of using a product, the data requested can improve the P&T Committee’s ability to ompare the effects of c
x
VERSION 2.1

P R E F A C E continued
formulary alternatives on clinical outcomes, value, and economic consequences for the entire health system. According to Neumann, the type of rigorous clinical and economic analysis called for in the Format “forces and focuses discussions about the value of health and medical services within a clear theoretical framework. It generates a more careful consideration of available evidence and sheds light on how to target resources to particular clinical practices or subgroups of patients.”[10] However, it is important that this information is weighed in the context of other values such as equity, social justice, and the health of individuals as opposed to populations, the “rule of rescue” and democratic decision making [2,11,12].
Second, the AMCP Format streamlines the data acquisition and review process for health system staff pharmacists. By clearly specifying the standards of evidence implicit in the existing formulary process, the submission guidelines furnish pharmaceutical manufacturers with consistent direction concerning the nature and format of information that is expected. In addition, the standardized format allows clinical staff to formally evaluate the completeness of submissions received and to easily add the results of the health system’s own literature reviews and analysis. Manufacturers should understand that submission of information in the format recommended does not guarantee approval of their product for formulary listing. Manufacturers and health systems should view discussion about, and subsequent submission of a dossier, as a process to improve the quality and layout of information provided, but not as a formula for approval. The guidelines offer a clear, shared vision of the requirements to facilitate the collaboration necessary between health systems and manufacturers to support drug product evaluation. Recognizing that manufacturers may not have all the requested information, especially for new products, the document describes the minimum information requirements necessary to support a comprehensive assessment of the proposed product. AMCP is not a standard setting organization. Therefore, the Academy has always viewed the AMCP Format as a template or guide, not a mandate or standard. As such, it does not claim to establish a standard of practice for managed care pharmacy. It is up to individual health care systems to decide how they will implement the AMCP Format and how they will operate their formulary review processes.
ADVANTAGES FOR THE MANUFACTURER Using the AMCP Format, the pharmaceutical and biopharmaceutical industry will have the opportunity to present a full and scientific portfolio of clinical (benefit and safety data) and economic evidence to support formulary consideration. Thus, manufacturers are given the opportunity to supply information (e.g. adherence data, patient satisfaction, indirect and non-medical cost impacts) to demonstrate the broad value of their products when compared to usual treatments. In addition, manufacturers will have the opportunity to present economic evidence to justify the price of a new agent in terms of its overall value to the health system. The economic data requested must be broadly applicable to a health system’s population and address the system-wide impact of formulary changes on both clinical
xi

P R E F A C E continued
outcomes and resource utilization and costs. Early planning by manufacturers will help ensure that their product value message is supported by credible evidence. Therefore, planning for dossier development should start early in the drug development program (Phase II or III), depending on how much data generation is required. The goal for manufacturers should be to have dossiers completed by the time of product launch to avoid any delays in responding to an anticipated flood of unsolicited requests. The AMCP Format does not specify methods for assessing clinical benefit, harms or economic impact. It is the submitter’s responsibility to utilize appropriate study designs, analytic techniques and data sources, and the requester’s responsibility to critically evaluate them. CONFIDENTIALITY ISSUES The AMCP Format contains the following statement in the Unsolicited Request Letter Template “By submitting this request (the health system) recognizes that confidential information may be provided. (The health system) recognizes the need to respect and honor commercial-in-confidence information and may be willing to sign necessary confidentiality agreements under agreed circumstances.” As public agencies such as state Medicaid agencies and the Department of Defense (DoD) have begun to adopt the AMCP Format, some pharmaceutical companies have raised concern about the need for confidentiality. For example, manufacturers have expressed considerable concern over the decision of Oregon’s Medicaid agency to make dossiers available to any interested parties upon request. Concern has also been raised about dossiers submitted to the DoD, which could be obtained under the Freedom of Information Act. However, the DoD now has a committee review the dossiers and prepare a brief report summarizing the key points contained in the dossier. The committee’s summary reports are made public, while the dossiers presumably remain confidential. The Academy has counseled public agencies that are considering the use of the AMCP Format to develop procedures that will allow them to keep the dossiers confidential. AMCP encourages any organization that begins using AMCP’s Format to hold a presubmission meeting with pharmaceutical companies, which is called for in the AMCP Format, to disclose the level of confidentiality that will be possible and to ascertain what level of data can be expected to be furnished. It is important to point out that the issue of confidentiality is not unique to the United States, as product evaluations in Australia, Canada and the United Kingdom are available to the public and often downloadable over the Internet.[13-16] As pointed out by Peter Neumann in his Preface to this version, The concerns in this country in general have pertained to disclosure of unpublished information not already in the public domain. Manufacturers are concerned that disclosure of unpublished data may jeopardize scientific publications, regulatory approval of new drugs or label changes, new indications of already approved drugs, and may materially impact the company value (e.g., stock price). The latter issue may have both criminal (insider trading) and commercial implications (competitors using the information). The dossier often contains "off-label" information and FDA
xii

P R E F A C E continued
has previously expressed concerns about the potential for companies to intentionally or unintentionally promote these off label uses, notwithstanding the fact that the dossiers are distributed in response to unsolicited requests. COMMUNICATION – THE KEY TO SUCCESS There should be substantial on-going communication between the health system and the pharmaceutical company throughout the formulary submission process to manage expectations and maximize the quality of the deliverables. Those organizations that have been early adopters of the AMCP Format have expressed the importance of and concern for good communication. The most common element in the majority of project failures, whether it is from employee performance, the business plan or vendor relationships, is communication. When a dossier is requested from a health system, it is important for that organization to communicate to the pharmaceutical company basic information such as time-lines, the evaluation process, potential data sources, any special needs that might exist, etc. This also gives the pharmaceutical company an opportunity to discuss deliverables. If they cannot submit specific studies or provide a certain component of the economic analysis, it is better to understand the limitations up front. AMCP does not suggest to its members that they should significantly alter or disrupt their normal lines of communication with pharmaceutical manufacturers. However, both parties should recognize that when there is a high level of collaboration, there is a relative increase in the chances that the process will be smoother and the quality of the dossiers submitted will be higher [17]. Furthermore, MCOs may not want to make these documents fully public if they have shared confidential company-information with the manufacturer to allow plan-specific projections. DIALOGUE WITH THE FOOD AND DRUG ADMINISTRATION (FDA) A distinguishing feature of the AMCP Format is its use as an Unsolicited Request from a health system to a manufacturer for all possible clinical and economic information necessary to assess the overall clinical utility – in particular safety – and value that a product brings to a specific patient population and health care system. In response to this Unsolicited Request, manufacturers are asked to submit all available published and unpublished studies and information regarding both FDA-approved indications and anticipated off-label uses of the product (permitted under Section 114(a) of the Food and Drug Administration Modernization Act of 1997), should such information exist. [18]. Therefore, this request attempts to improve access to material that has been difficult to obtain in the past. It also enables manufacturers to submit such data within regulatory constraints mandated by the Food and Drug Administration. While no explicit FDA guidance regarding unsolicited requests exists, FDA officials have repeatedly stated their intention to issue such guidance in the future. Because the FDA closely regulates the information a pharmaceutical company can provide regarding their products, there has been apprehension that complying with the AMCP Format information requirements may raise concerns at the FDA. Beginning long before the AMCP Format’s
xiii

P R E F A C E continued
publication, the Academy has maintained an ongoing dialogue with the FDA to keep the agency apprised of the project’s progress and to seek their guidance. FDA officials have stated on several occasions that they are comfortable with the Academy’s position that the AMCP Format represents an unsolicited request from a health system to a pharmaceutical company for all possible published and unpublished studies and information regarding both FDA-approved indications and anticipated off-label uses of the product. FDA officials have stated they have four areas of concern regarding this process (1) that requests for off-label product information are truly unsolicited and unprompted, (2) that the information provided is not false and misleading, (3) that the response from manufacturers is specific to the requestor and (4) that pharmacoeconomic models are transparent and model assumptions are clearly stated. Regarding the first concern, health systems must initiate the request and clearly identify the information they desire. The AMCP Format is a template designed specifically for this purpose. AMCP recommends that health systems also submit a signed request letter to accompany the AMCP Format. Regarding the second concern, FDA regulations require pharmaceutical companies to provide accurate information. The pharmaceutical industry takes this responsibility seriously, and the AMCP Format recognizes the importance of these requirements. Issues regarding the third and fourth concerns are covered in more detail in the section on Customizing the Economic Model and in Section 3 of the Evidentiary Requirements respectively. However, FDA officials have stated that, regarding AMCP Format-based dossiers, pharmaceutical companies must refrain from taking any proactive steps that could be construed as marketing and promotion, such as preparing identical formulary submission documents (dossiers) for a product with the intent of soliciting health system pharmacist’s requests for the dossiers or informing health system pharmacists that an updated dossier is available. In these scenarios, the request would not be truly unsolicited nor would the contents of the response (the dossier) be specific to the requestor [19]. THE IMPORTANCE OF CLINICAL INFORMATION There has been a misperception among some users and potential users of the AMCP Format that it is merely a tool for presentation of a pharmacoeconomic model. Consequently, some health systems with less expertise in appraising economic models have been hesitant to utilize the Format. A careful examination of the AMCP Format document will clearly show that these guidelines, first and foremost, require the health system staff to perform a thorough clinical evaluation of the product based on all possible available information obtained from the manufacturer and other sources. If the evaluation concludes that the effectiveness of the product does not outweigh safety concerns or there are better alternatives, an economic review would be unnecessary. It is imperative to determine the potential clinical impact of a drug on its target patient population before considering the economic consequences. The field of pharmacoeconomics is relatively new. Therefore, the current number of individuals in this country with significant training and experience
xiv

P R E F A C E continued
in analyzing the type of cost-effectiveness information required by the AMCP Format is limited. While pharmacoeconomic models and outcomes research have become increasingly accepted as tools for helping health care systems make formulary decisions, many health systems do not have a pharmacist on staff with sufficient experience to analyze this information. This is a concern often expressed by pharmaceutical manufacturer officials and some health plan managers. There are at least two solutions to this problem. One solution would be to for one or two staff pharmacists to acquire the training in pharmacoeconomic evaluation. Numerous organizations around the country provide this type of training, including the Foundation for Managed Care Pharmacy, the International Society for Pharmacoeconomics and Outcomes Research (ISPOR) (www.ispor.org), the University of Arizona College of Pharmacy’s Center for Health Outcomes and Pharmacoeconomic Research (http://www.pharmacy.arizona.edu/centers/hope/hope.shtml) and the American College of Clinical Pharmacy. [20] Another solution is to engage an outside consultant to perform the reviews of the pharmacoeconomic modeling. Private consultants, faculty and students at colleges of pharmacy and experts in the public health arena can help meet health system needs. Part of the solution is for FMCP to continue to offer training workshops on the AMCP Format. Through generous educational grants from pharmaceutical companies, FMCP has been able to train nearly 400 pharmacists and other health care professionals from nearly 200 organizations on the use of the Format and application of pharmacoeconomic data to formulary decision-making. The Foundation will continue to pursue funding for these popular programs. In an editorial accompanying the publication of the AMCP Format Version 2.0 in the September/October 2003 issue of the journal Value in Health, the late Bernie O’Brien, PhD stated, “Helping to create the skilled receptors in managed care for the evidence and analyses submitted is almost as important as the studies themselves.”[21] CUSTOMIZING THE ECONOMIC MODEL Some health care system P&T committee members have been under the impression that only pharmacoeconomic models that strictly mirror a health system’s targeted patient population are acceptable. The AMCP Format describes in some detail the most important elements of the requested pharmacoeconomic model. The AMCP Format further stipulates that the economic data called for must be broadly applicable to a health system’s population and address the system-wide impact of formulary changes on both clinical outcomes and resource utilization and costs. The AMCP Format, does not, however, specify methods for economic evaluation. It is the submitter’s responsibility to utilize appropriate techniques and data sources. Ideally, a manufacturer would use a health system’s own data to customize the model. Realistically, a highly individualized model may not be necessary, feasible or scientifically plausible. Often, the information necessary to create a highly individualized model will not be available because health systems will be either unwilling or unable to supply it. A reasonable compromise may be for the health system to request a model based on national norms or a pre-existing model, with the manufacturer justifying the relevance of the data to the health system’s patient population.
xv

P R E F A C E continued
In addition, the model should be transparent and adaptable, allowing the health system to change multiple elements by inserting its own data. Once a manufacturer receives an unsolicited request letter, it can facilitate this process and avoid misunderstandings by asking the health system to answer a standard set of questions that would detail the information they would be willing to accept, such as national norm data or a pre-existing model. A manufacturer’s dossier that meets a health system’s criteria is more likely to conform to the FDA’s requirements for responses to Unsolicited Requests [17]. BARRIERS TO ADOPTION Adoption of the AMCP Format requires a commitment of resources by both health systems and manufacturers. Lack of human, technical (IT) and financial resources to support the process within the plan, including support of senior management and the P&T Committee, is one of the principal barriers to implementation of the Format process. Other barriers to implementation include:
• Lack of expertise in analyzing clinical and health outcomes studies and pharmacoeconomic models;
• Misconception that the Format process is merely a tool for presentation of a pharmacoeconomic model;
• Mistrust of any economic models prepared by pharmaceutical manufacturers;
• Commitment to a decision-making process based primarily on product cost and rebates (i.e., silo mentality);
• Manufacturer reliance on marketing and promotions to move market share;
• Concern over FDA scrutiny; • Concern about confidentiality of propriety information contained in
dossiers.
P&T committees could take the easy path and simply put new or expensive drugs on the third tier of their benefit structure and avoid the cost and effort of the AMCP Format process. One of the key purposes of a formulary is to make available to a plan’s membership medications that produce the best positive outcomes at reasonable costs, i.e., those drugs that show good value. The AMCP Format authors designed the guidelines specifically for that purpose. They allow a health system and its P&T Committee to determine the clinical benefits and risks of a drug, evaluate value, and determine the overall cost consequences to their health system. If a health system simply puts a new or expensive medication on the third tier, two negative consequences could arise. First, despite its high cost, the medication may have significant clinical value. Providing appropriate incentives for its use could ultimately improve health and possibly lower overall health care costs. For example, health systems commonly place preferred brand name products in the second co-payment tier. For brand name products with no generic equivalents that are known to offer significant clinical and economic benefit for the health system in terms of reduced patient morbidity, mortality, hospitalizations and emergency department
xvi
P R E F A C E continued
visits; it may be more appropriate to add the product to the first tier, which is generally reserved for generic products. By simply choosing to place the most expensive products on the third or higher tier, a plan can in effect create a disincentive for their members to use them, resulting in missed opportunities to improve the health outcomes for individuals and groups of patients. Second, automatically putting a medication on the third tier denies the P&T Committee or other decision making body the opportunity to fully assess the safety, effectiveness and economic impact of a product on a health system’s patient population. Paying for a drug that has little or no clinical value relative to an alternative wastes resources that members have contributed to their health plans and systems. While we are confident that the Format will provide health systems with the scientific evidence needed to determine which new technologies would provide little or no value to their patient populations, it is thought that its greatest impact will be in focusing questions about a product’s place in therapy such as: Is it on the preferred drug list? Is it restricted to use by certain specialists? Is it restricted to certain subpopulations of patients who are most likely to benefit? To which formulary tier does it belong? [22] CONCLUSION The persistent rise in health care expenditures, particularly prescription drugs, is attributable in part to the unwillingness of the American public to accept limits on the use of health care services. This is also a major factor contributing to resistance to the use of cost-effectiveness analysis in the United States as an important policy making tool. [10] Other contributing factors such as a lack of understanding about the conceptual approach, a mistrust of methods and motives, and regulatory and legal barriers may be more easily overcome. However, Daniels and Sabin, writing in Health Affairs in 1998 stated, “To change that culture requires a concerted effort at education, and education requires openness about the rationales for managed care plan’s decisions.” [23] By adhering to careful and thoughtful decision-making processes that provide the rationales for limits, health care systems will be able to show, over time, that “arguably fair decisions are being made and that those making them have established a procedure we should view as legitimate [23].” AMCP and FMCP believe that the AMCP Format is a valuable tool that will help health systems establish a record of commitment to rational evidence-based decision-making, thus gaining the confidence of patients, clinicians, payers and members.
xvii

Introduction - Developing an AMCP Format-Based Dossier
The Food and Drug Administration (FDA) and pharmaceutical manufacturers have generally regarded the AMCP Format as a detailed unsolicited request for information to support formulary evaluation by […] clinical pharmacists. This request has enabled manufacturers to submit such data within existing regulatory constraints of the Food and Drug Administration.
MANUFACTURER RESPONSIBIL IT IES As recommended previously, manufacturers should have dossiers completed by the time of product launch to avoid any delays in responding to an anticipated flood of unsolicited requests. Manufacturers should complete their formulary submission dossiers using this Format to integrate the relevant published and unpublished data evaluating the efficacy, safety, economic impact, and other medical outcomes associated with the use of their product. Sections 1 - 4 should be completed and presented in the order listed. Compliance with this standardized reporting format allows for efficient review and facilitates the use of the information provided by decision makers in coverage and formulary decisions. Marked deviations from this format may delay the review process. Where specific sections or data are unavailable or incomplete, the manufacturer should indicate and explain why they are missing and when they will be provided, if at all. Manufacturers should provide the following additional information:
1. A comprehensive list of references for all studies cited and for information sources from which estimates were drawn for use in the economic evaluation for section 2.4.
2. Identify the author(s) of the submission document. (see Disclosure section below)
3. Identify the author(s) of primary economic evaluations conducted for section 2.3 of this document (see Disclosure section above)
4. Identify a contact person who can answer questions and provide additional information regarding the submission materials for [---] reviewers.
5. Provide a transparent, unlocked model spreadsheet in which the data and calculations are visible allowing users to make changes in multiple elements to verify that the data is appropriate to the health system.
Ideally, health systems should only consider products for formulary review when the manufacturer can submit a complete dossier. Following an “unsolicited request” from a health system1, manufacturers should make every attempt to submit a complete dossier. When evidence is missing, the manufacturer should provide the health system with a detailed explanation of what evidence is missing and a plan that addresses this deficiency within a specific time limit. If a dossier
1 FDA does not allow manufacturers to proactively distribute information on economic models or other indications that are outside the existing label. Nor can manufacturers suggest (i.e. “solicit”) MCOs, PBMs and other decision-making entities and individuals to ask them for this information. However, if organizations, at their own choice (i.e. "unsolicited”), request information, then manufacturers are allowed to reply with the specific requested information.
xviii

Introduction - Developing an AMCP Format-Based Dossier
continued
is not submitted following a health system’s unsolicited request, the health system should reserve the right either to refuse to consider the product for formulary admission or to exercise other available options regarding the product’s benefit status that are in keeping with its formulary and drug benefit management policies and procedures. CONTENT A complete formulary submission dossier for pharmaceutical, biologic and vaccine products should include the following sections:
1. Disease and Product Information 2. Supporting Clinical and Economic Information 3. Cost-effectiveness and Budget Impact Model Report 4. Product Value and Overall Cost 5. Supporting Information: Reprints, Bibliography, Checklist,
Electronic Media and Appendices These guidelines are not intended to restrict the content, presentation of data and the research methods of studies that comprise the dossier. Rather, they are intended to specify evidentiary requirements for product review. However in preparation of the evidence, the approach and methodology adopted by the manufacturer and the techniques employed should be consistent with the formulary evaluation objectives of [---]. It is recommended that the manufacturer consult with [---] representatives to determine appropriate sources for data and to agree on specific requirements and model assumptions. (See below-Agenda for Pre-Submission Meeting) STANDARDS OF CARE AND DATA SOURCE […] recognizes that clinical development programs are designed, in large part, to meet regulatory requirements. When feasible, manufacturers are encouraged to consider the broader clinical and payer audience who require evidence on new drugs. For example, trial designs might be modified to reflect comparators of interest to [---]. Furthermore, economic evaluations should be capable of reflecting the characteristics of the treatment environment of [---]. Analyses based on clinical trials alone or data from other health systems or PBMs may be insufficient unless the manufacturer shows them to be directly applicable to [---] membership. The manufacturer should focus on patterns of medical services provided directly by reasonable peer organizations. In some cases, there may be differences of opinion as to what constitutes appropriate standards of care. This should be resolved with [---] prior to submission. DISCLOSURE OF POTENTIAL REPORTING BIAS To minimize the potential for bias in formulary submissions, manufacturers should follow generally accepted rules of scientific conduct and reporting of clinical and economic evaluation data. [24,25] At a minimum, the following should be disclosed for economic evaluation studies, budget impact models and authors of the submission dossier:
1. Identify all investigators/authors and give the details of their affiliations.
xix

Introduction - Developing an AMCP Format-Based Dossier
continued
2. All financial or contractual relations that might impact on the independence of the investigators/authors.
RECOMMENDED FORMULARY SUBMISSION PROCESSES NEW PRODUCTS The following steps are recommended for a submission of dossiers for new drug products: Step 1: Manufacturers should keep [---] clinical pharmacy staff informed
of the status of drugs in their pipeline. Both parties should identify specific contacts to ensure efficient communication.
Approximately 6 months prior to expected product launch, the [--
-] pharmacy staff will issue a formal Unsolicited Request letter that contains a copy of the formulary submission requirements. The letter will be directed to the appropriate company employee who can engage in health professional-to-health professional communication, in compliance with FDA regulations on provision of label and off-label information.
Step 2: Following submission of the Unsolicited Request, [---] pharmacy
staff and manufacturer representatives may schedule an initial pre-submission meeting to establish a deadline for dossier submission based on the anticipated review date, and to discuss other pertinent issues such as commercial-in-confidence data, economic model assumptions, availability of spreadsheet models, etc. (See below: Agenda for Pre-Submission Meeting).
Step 3: At least 2 months prior to the product review, the manufacturer
will present 1 paper copy and 1 electronic copy of the submission dossier to [---]. It is understood that the manufacturer cannot submit a full and complete dossier until AFTER FDA final approval for product marketing.
Step 4: The [---] clinical staff assigned to the product will review the
submission. Based on the initial review, the manufacturer may be asked to clarify certain points or submit additional information before a formulary monograph is prepared by [---] staff for P&T review.
Step 5: The designated clinical pharmacists will prepare a detailed
summary (monograph) for the P&T review. The summary presents an overview of all data, and the principal arguments for and against listing the product on formulary, and any conditions that may apply.
xx

Introduction - Developing an AMCP Format-Based Dossier
continued
Step 6: As soon as possible, [---] staff will inform the manufacturer of the P&T Committee’s recommendation. Upon request, staff may provide the manufacturer with the rationale for a product's denial or restriction as well as guidance for reconsideration or appeal.
NOTE: ESTABLISHMENT OF A FORMAL APPEALS PROCESS IS AT THE
DISCRETION OF INDIVIDUAL HEALTH CARE SYSTEMS. PUBLIC ENTITIES, SUCH AS STATE MEDICAID AGENCIES, THE DEPARTMENT OF DEFENSE OR THE VETERANS ADMINISTRATION MAY BE REQUIRED BY STATE OR FEDERAL LAW TO HAVE FORMAL APPEALS PROCESSES IN PLACE TO DEAL WITH DENIALS RELATED TO FORMULARY DECISIONS.
PERIODIC REVIEW OF THERAPEUTIC CLASSES AND REQUESTS FOR UPDATED DOSSIERS WHEN COMPETITOR PRODUCTS ARE BEING REVIEWED Periodically, [---] will undertake reviews of all drugs in each therapeutic class, including drugs currently listed and those that are non-formulary. Manufacturers may be asked to update their product dossiers with the most recent clinical data and economic modeling information. [---] must request this information through issuance of a separate Unsolicited Request letter. A verbal request does not meet the requirements of the FDA. Ideally health systems should submit unsolicited requests for dossiers or dossier updates for currently marketed products 3 months in advance of a class review. Health systems must remember that FDA requires that responses to an unsolicited request (i.e. a dossier or dossier update) must contain information specific to the requestor. Requests that stipulate a short timeline, such as 2-3 weeks, for submission of a dossier are in contrast to FDA’s requirement for specificity. FDA may presume that manufacturers that respond within a few days or even 2-3 weeks are not providing the required requestor specificity and may view the information as marketing and promotion rather than a response to an unsolicited request. In addition, when a new competitor product is being reviewed, [---] may, through a new Unsolicited Request letter, ask manufacturers for an updated dossier for products with the same or very similar clinical profiles. In each case, manufacturers will be given as much notice as possible. NOTE: Manufacturers may not, at any time, solicit health systems
to request updated AMCP Format-based product dossiers. These updates may only be submitted under the auspices of an Unsolicited Request from the health system.
NOTE: Health care systems may choose to delete this section on
annual review if their current P&T committee procedures do not include a regular therapeutic class review.
xxi

Introduction- Developing an AMCP Format-Based Dossier
continued
AGENDA FOR PRE-SUBMISSION MEETING This meeting(s) should take place at least 4-to-6 months before the actual date of anticipated product review to allow time for the manufacturer to gather the necessary data for [---]. This meeting will also serve as a forum to discuss the consequences of missing information deemed necessary by [---]. This agenda can serve as a discussion guide to ensure that […] and the manufacturer address relevant topics. On-going communication between […] should occur as deemed necessary. The representatives for the manufacturer should provide a copy of, and be prepared to discuss, the following at the first meeting(s):
a. List of intended indications b. Summary of studies to be included in the formulary submission. This
will include: • Clinical trials (experimental and non-experimental) • Outcomes studies • Meta analysis • Retrospective studies • Economic evaluations
c. Use of comparator products and their appropriateness d. A general description of how the cost and outcomes impact assessments
will be developed. This should include: • List of data sources (studies, databases, etc.), • Discussion of incorporation of health system data, • Discussion of conversion of efficacy to effectiveness for both drug
and comparators, • Approach to modeling the health care environment of [---], • Discuss level of patient switching and impact on overall costs, • Assumptions and suggested approach for determining patient
characteristics for switching. e. Summary of anticipated studies to be completed within 1-3 years. f. A filled out submission checklist
ROLE AND RESPONSIBIL IT IES OF HEALTH SYSTEMS Successful implementation of the AMCP Format process by a health system will include:
a) Human, technical (IT) and financial resources to support the process within the plan including support of senior management and the P&T Committee;
b) A commitment by all staff to the process; c) Clear communication of AMCP Format requirements to
pharmaceutical industry representatives; d) Health system pharmacy staff trained to interpret and integrate the
data presented into the formulary process; e) Accessibility to health system staff by industry representatives for
presentations on clinical data and economic models. [---] clinical pharmacists should be available to meet with manufacturers to review dossier submission requirements and to discuss data and analysis. In
xxii

Introduction- Developing an AMCP Format-Based Dossier
CONTINUED
addition, the health system should provide the manufacturer with timely information regarding product submission and evaluation such as:
a) A dossier submission deadline (Ideally 6 months in advance for a new product and 3 months in advance for a currently marketed product;
b) Anticipated date of initial product review or re-evaluation; c) General demographic information to assist in development of
economic analyses, if feasible; d) Notification of additional information or data clarification
requirements; e) The P&T Committee’s recommendation.
By submitting this request [---] recognizes that confidential information may be provided. [---] recognizes the need to respect and honor commercial-in-confidence information and may be willing to sign necessary confidentiality agreements under agreed circumstances. [16]
As noted throughout this document, the success of the formulary submission process depends on an active collaboration between [---] and the pharmaceutical industry.
xxiii
Health System Guidelines
for Manufacturers
Evidentiary Requirements for Formulary Submission
Dossiers
The AMCP Format for Formulary Submissions
VERSION 2 .1 n APRIL 2005

Health System Guidelines for Manufacturers (Evidentiary Requirements for Formulary Submission Dossiers)
Sample Unsolicited Request Letter Date Name of Acct Manager/Medical Science Liaison Name of Company Address Address Dear…: The [Organization name] has adopted the Academy of Managed Care Pharmacy’s (AMCP) Format for Evidence-Based Formulary Submissions detailing the process and evidentiary requirements for the provision of clinical and economic information to support drug formulary consideration. [Organization name] considers this document an unsolicited request for medical, economic and other scientific information (including any unpublished and/or off-label study data that are to be considered by our organization) and pharmacoeconomic modeling on all pharmaceutical products that we consider for formulary inclusion or as part of therapeutic class reviews. The specific details of the [Organization name] request have been sent to you previously and are available on the [Organization name] web site (www.xxx.com). We consider this unsolicited request to represent the desired information to accompany a formulary submission. Manufacturers should submit a complete dossier well before they expect the product to be considered for formulary review. Our goal is to enable all of the [Organization name] Pharmacy & Therapeutics (P&T) Committees to make evidence-based decisions representing good value for money when selecting preferred treatment options. The AMCP Format describes a standardized template for pharmaceutical manufacturers to construct and submit a formulary dossier. The dossier is designed to make the product evaluation process in formulary development more complete, evidence-based and rational. By submitting this request [---] recognizes that confidential information may be provided. [---] recognizes the need to respect and honor commercial-in-confidence information and may be willing to sign necessary confidentiality agreements under agreed circumstances. Please consider this letter as an unsolicited request for information required by [Organization name] for your product Name of Product or Products here. If you require additional information, please call ……… Sincerely,
2
Health System Guidelines for Manufacturers (Evidentiary Requirements for Formulary Submission Dossiers)
1 . P R O D U C T I N F O R M A T I O N 1.1 PRODUCT DESCRIPTION [20 PAGES MAXIMUM] Manufacturers are required to provide detailed information about their product. They should compare the new product with other agents commonly used to treat the condition, whether or not these products are currently on [---] formulary. The product description consists of information that traditionally has been incorporated in a product monograph or formulary kit and includes the following:
a. Generic, brand name and therapeutic class of the product, b. All dosage forms, including strengths and package sizes, c. The National Drug Code (NDC) for all formulations, d. A copy of the official product labeling/literature, and e. The AWP and WAC cost per unit size. (The [---] contract price, if
available, should be included as well). f. AHFS or other Drug Classification g. FDA Approved and other Studied Indication(s): A detailed discussion of
the approved Food and Drug Administration (FDA) indications and the date approval was granted (or is expected to be granted) must be included.
h. Information on current and pending off-label indications and other non-labeled uses, if available.
i. Pharmacology j. Pharmacokinetics/Pharmacodynamics k. Contraindications l.Warnings/Precautions/Adverse Effects m. Interactions, with suggestions on how to avoid them
• Drug/Drug • Drug/Food • Drug/Disease
n. Dosing and Administration o. Access, e.g. restrictions on distribution, supply limitations, anticipated
shortages p. Current or anticipated product market share information q. Co-Prescribed / Concomitant Therapies, including dosages r. Concise comparison with the primary comparator products in the same
therapeutic area to include: dosing, indications, pharmacokinetic / pharmacologic profile, adverse effects, warnings, contraindications, interactions and other relevant characteristics. (Expand as appropriate for the therapeutic class.) The material may include a discussion of comparator product(s) or services that the proposed product is expected to substitute for, or replace. This information should be presented in tabular form.
1.2 PLACE OF THE PRODUCT IN THERAPY THIS SECTION INCLUDES TWO PARTS:
1.2.1 DISEASE DESCRIPTION (Limit to 2-4 pages per disease) The disease description should include the disease and characteristics of the patients who are treated for the condition. Manufacturers should provide a
3

Health System Guidelines for Manufacturers (Evidentiary Requirements for Formulary Submission Dossiers)
description of specific patient subpopulations in which the drug is expected to be most effective. Include clinical markers, diagnostic or genetic criteria, etc. that can be used to identify these subpopulations. Present a brief summary of information from the literature for each topic. When information from studies is presented, the manufacturer should compile the results in detailed evidence tables.
Disease specific descriptive information should include, but not be limited to:
a. Epidemiology and relevant risk factors b. Pathophysiology c. Clinical presentation d. Societal and/or economic impact
1.2.2 APPROACHES TO TREATMENT (Limit to 2-3 pages per major indication) The key questions are: how is the disease/condition treated and how does the new product fit in therapy. Present a brief summary of information from the literature for each topic: a. Approaches to treatment - principal options / practice patterns b. A description of alternative treatment options (both drug and non-drug) c. The place and anticipated uses of the proposed therapy in treatment (e.g.
first line), d. Proposed ancillary disease or care management intervention strategies
that are intended to accompany the product at launch. e. Relevant treatment guidelines from national or international bodies f. The expected outcomes of therapy and g. Other key assumptions and their rationale.
Next, an attempt should be made to generalize these findings to the populations of [---]. Discuss the implications of any differences that exist between the literature and typical practice patterns and patient populations. When more than one disease is addressed, complete the description for each separate condition. [---] and the manufacturer should determine the relevant treatment options for comparison during the initial pre-submission meeting. 1.3 EVIDENCE FOR PHARMACOGENOMIC TESTS AND DRUGS In considering the appropriate use of genetic testing to guide drug therapy (variously referred to as ‘pharmacogenomics’, ‘pharmacogenetics’, ‘individualized medicine’, or ‘targeted therapy’), clinicians and healthcare system decision makers must consider the accuracy with which a test identifies a patient’s genetic status (analytic validity), clinical status (clinical validity), and the risks and benefits resulting from test use (clinical utility). [26] The following evidence should be presented as appropriate in support of submissions involving pharmacogenomic testing, or drugs for which pharmacogenomic testing is available:
4
Health System Guidelines for Manufacturers (Evidentiary Requirements for Formulary Submission Dossiers)
Analytic Validity • Accuracy with which a particular genetic characteristic can be identified
using a genetic test in relation to professional standards and federal
regulation requirements.
Clinical Validity • Strength of the association between the genetic variant(s) and clinical
outcome(s) (e.g., efficacy, adverse drug reaction)
• Expected prevalence of genetic variant(s) in target population; positive
predictive value (PPV) and negative predictive value (NPV) of test
Clinical Utility • Effectiveness and safety of the clinical intervention implemented as a
result of the genetic test, as per Sections 2.1-2.3 of the Format
Cost Effectiveness • Expected difference in costs and outcomes with pharmacogenomic testing
compared to usual care, as per Section 2.4 of the Format, including cost
offsets from changes in drug utilization and health outcomes.
2 . S U P P O R T I N G C L I N I C A L A N D E C O N O M I C I N F O R M A T I O N
2.1 SUMMARIZING KEY CLINICAL AND ECONOMIC STUDIES: [3-4 page maximum per study; please complete evidence tables in the format presented in appendix D] Submit summaries of the key clinical and economic studies that have been conducted, whether published or not, in each of the following categories:
1. Pivotal safety and efficacy trials [No more than 3-4 pages per study + evidence table]
2. Relevant published and unpublished safety, efficacy and effectiveness trials regarding off-label uses. [No more than 3-4 pages per study + evidence table]
3. Prospective effectiveness (e.g. large simple) trials [No more than 3-4 pages per study + evidence table]
4. Additional prospective studies examining other non-economic endpoints such as health status measures and quality of life. If the instruments utilized in these studies are supported by previous validation and reliability studies, also reference these studies. [No more than 3-4 pages per study]
5. Retrospective studies [No more than 3-4 pages per study + evidence table]
6. Systematic reviews and meta-analyses. [No more than 3-4 pages per study + evidence table] Place particular emphasis on the inclusion and exclusion criteria and main outcome measure(s) for studies analyzed.
5
Health System Guidelines for Manufacturers (Evidentiary Requirements for Formulary Submission Dossiers)
When a Cochrane Collaboration systematic review or Agency for Healthcare Research and Quality (AHRQ) evidence summary is available and relevant, manufacturers should include the major conclusions.
Studies reported in this section should be summarized in a clear, concise format and include all relevant positive and negative findings. [---] is particularly interested in head-to-head comparison clinical studies between the proposed product and the principal comparators. Summaries of trial results of key comparator products are desirable but not required. Discuss important study findings and comment on their implications for the patient populations represented by [---]. Systematic reviews or meta-analyses may be referenced in item (6). In the appendix, include a reprint or unpublished manuscript of each study discussed or referenced.
All of the following items that apply should be included in the study summaries:
a. Name of the clinical trial or study, location and study date; b. Trial design, randomization and blinding procedures;
• Research question(s); • Study perspective;
c. Washout, inclusion and exclusion criteria; d. Sample characteristics (demographics, number studied, disease severity,
co-morbidities); • Treated population (actual or assumed)
e. Patient follow-up procedures (e.g., If an intention-to-treat design is used, were drop-outs followed and for what time period?); • Treatment period
f. Treatment and dosage regimens; • Treatment framework • Resource utilization classification • Unit costs;
g. Clinical outcome(s) measures; • Outcomes evaluated • Delineate primary vs. secondary study endpoints and their
corresponding results h. Other outcome measures (e.g., quality of life);
• Principal findings i. Statistical significance of outcomes and power calculations; j. Validation of outcomes instrument (if applicable); k. Compliance behavior; l. Generalizability of the population treated;
• Relevance to enrolled populations of [---]. m. Publication citation(s)/references used. n. Relevant data and findings from the Center for Drug Evaluation and
Research’s Office of Drug Safety. o. Manufacturers should state whether trials for the product are
registered in a public trials registry, and if so, provide access information (e.g. www.clinicaltrials.gov). [27]
6
Health System Guidelines for Manufacturers (Evidentiary Requirements for Formulary Submission Dossiers)
2.1.1 EVIDENCE TABLE SPREADSHEETS (NOTED ABOVE) OF ALL PUBLISHED AND UNPUBLISHED TRIALS:
Information from all known studies on the product should be summarized in evidence tables (spreadsheet format) noting which studies were presented previously (items 1 - 6). Include negative or null findings as well as positive findings.
A standard evidence table format, such as that contained in Appendix D, Template for P&T Monograph, should include the following data elements:
• Citation, if published Design • Sample size Inclusion/exclusion criteria • Primary Endpoints Statistical significance • Secondary Endpoints Results • Treatments Study dates
2.2 OUTCOMES STUDIES AND ECONOMIC EVALUATION SUPPORTING DATA [3-4 PAGES MAXIMUM PER STUDY] Many researchers have expressed concern over the quality of some published economic evaluations. [28,29] Since the focus of this portion of the dossier is a comprehensive assessment of available evidence, the number of studies considered will not be restricted by imposing methodological standards. However, [---] and its consultants will judge the merit of individual studies based on published standards for conducting and reporting these analyses. [30-36]
Provide summaries addressing items a-o (see 2.1 above) for all studies in each of the categories listed below (items 1 – 7). Studies reported in this section should be summarized in a clear, concise format and include all relevant positive and negative findings. [---] is particularly interested in head-to-head comparison studies between the proposed product and the principal comparators. Analyses that focus on actual outcomes rather than intermediate endpoints are preferred. Summaries of principal trial results of key comparator products when these data are referenced or used in economic models are extremely helpful, but not required. Discuss important study findings and comment on their implications for the patient populations of [---]. In the appendix, include a reprint of each study discussed or referenced.
1. Prospective, trial-based cost-effectiveness studies [No more than 3-4 pages per study + evidence table]
2. Economic modeling studies [No more than 3-4 pages per study + evidence table]
3. Cross-sectional or retrospective costing studies and treatment pattern studies
4. Systematic review articles 5. Quality of life studies 6. Patient reported outcomes (PRO) studies, including quality of life studies 7. Other relevant economic studies (cost-utility, cost-benefit, cost-
consequence)
7
Health System Guidelines for Manufacturers (Evidentiary Requirements for Formulary Submission Dossiers)
2.2.1 EVIDENCE TABLE SPREADSHEETS (NOTED ABOVE) OF ALL PUBLISHED AND UNPUBLISHED OUTCOMES STUDIES.
Information from all relevant outcomes studies on the product should be summarized in evidence tables (spreadsheet format) as indicated in Section 2.1.1, noting which studies were presented previously (items 1 – 7 above). Include negative or null findings as well as positive findings. 3. M O D E L I N G R E P O R T [maximum 20 pages] “Far better an approximate answer to the right question, which is often vague, than an exact answer to the wrong question, which can always be made precise.” John W. Tukey, 1962
3.1 MODEL OVERVIEW The International Society for Pharmacoeconomics and Outcomes Research’s (ISPOR) task force on good modeling practices stated: “Although evidence from randomized clinical trials remains central to efficacy testing, taken alone it can be misleading if endpoints are not translated into measures that are valued by patients, providers, insurers and the general public.”[37] When comparing two or more interventions, properly constructed model-based evaluations can combine evidence on health consequences and costs from many different sources, including data from clinical trials, observational studies, claims databases, case registries, public health statistics and preference surveys, and a measure of uncertainty in any estimates. The goal is to evaluate the value of the product and project the health and economic consequences to the health plan of potential formulary changes. Manufacturers are strongly urged to provide cost-effectiveness models. They are the best means to accomplish this goal because they establish the value of a new technology relative to the most clinically appropriate comparator(s). They are disease-based and take into account the impact of the new technology on the clinical outcomes for the target population, and include evidence on the incidence of the disease or condition in the target population, the medical care required to diagnose and treat the disease, the relative and absolute risk reductions offered by the technology, survival and quality of life impacts, and the costs of the interventions. Models developed in this manner can: • Aid decisions regarding the addition of a new product to the formulary, • Help define a product’s specific role, and • Assist in creating benchmarks against which the product's future performance
can be measured. In contrast, budget impact models, by strict definition, are not used to establish the overall value of new technologies because they do not include the impact of the technology on clinical outcomes, non-pharmacy or medical resource use and adverse effects. These models provide an estimate only of the financial impact of a new technology on the pharmacy budget because they typically only include drug costs, network or other discounts, rebates, co-payment and other benefit
8

Health System Guidelines for Manufacturers (Evidentiary Requirements for Formulary Submission Dossiers)
design impacts. Although these models may be provided as part of the manufacturer’s submission, they are not central to the evidence- and value-based decision making process. These limitations should be noted and the budget impact model presented separately from the cost-effectiveness model. Cost-effectiveness analyses should depict the following:
a) Disease or condition, patient population, natural history, clinical course and outcomes.
b) Primary treatment options and the treatment process for each option. Each process of treatment utilizing a specific product or other intervention follows a clinical pathway. If the [---] employs a treatment guideline for this condition, this framework should be followed. Alternative clinical pathways presented by the manufacturer may also be considered.
c) Patient population eligible for treatment. d) Product and other medical resources used when following clinical
pathway (include treatments for complications related to treatment). e) Costs of product and other medical resources consumed within each
clinical pathway. f) Outcomes of therapy for each clinical pathway, including expected
proportion of treatment failures and mean or median time to failure, if known. These outcomes can be broadly and uniquely defined by the manufacturer and can be modeled from other data sources. The manufacturer should address the relevance of the selected outcomes measure and generate both baseline and projected outcome impact assessments.
g) Incremental cost and outcomes analysis presented in either cost/consequences tables or as cost-effectiveness ratios.
h) Time horizon for expected costs and outcomes. Suggested time horizons include 1-year, 5-year and over the course of the disease. The exact time horizon used will depend on the natural course of the disease. In some cases, multiple time horizons might be appropriate.
In addition, the manufacturer is requested to:
i) Separate the volume of resources utilized and the unit costs for each resource;
j) Perform sensitivity analyses on pivotal estimates and assumptions [in presentation section];
k) Consult with [---] staff in the early stages of model development to ensure the incorporation of appropriate comparator products and endpoints; and
l) Present the following information in tabular form: data and sources, assumptions, total resource utilization, total costs, total effectiveness, incremental costs, and incremental effectiveness. Measures of total and incremental effectiveness should incorporate natural units (e.g. clinically important events avoided) as well as quality-adjusted survival when possible.
The analysis should be based on scientifically appropriate clinical trial, epidemiological and economic data and should be capable of being modified by [---] to better reflect practice patterns in their enrolled population. For the analysis and model to be realistic, it may be necessary to include data from [---], e.g. demographic data. Data derived from expert panels are not generally acceptable,
9
Health System Guidelines for Manufacturers (Evidentiary Requirements for Formulary Submission Dossiers)
especially for key clinical and treatment pattern variables. However, this approach may be reasonable for other variables where estimates are not available through literature, databases, trials or other normal sources. The model framework should consider recommendations published by the Panel on Cost-Effectiveness in Health and Medicine convened by the U.S. Public Health Service.[38] Although no standard model approach is proposed, we recommend that producers and users of modeling studies subscribe to the sound guidance provided by the ISPOR Good Practice Modeling Principles.[37] (Also Appendix C) We have found that models have certain desirable qualities. These are listed below and are not meant to proscribe model development or impede good scientific design. Rather, this list is to provide some guidance to the manufacturer as to those elements of an economic model that are desirable to [---] evaluators.
Desirable Qualities of Economic Models for Inclusion in [---] Submissions:
Model Structure
• To the extent feasible, the model, its logic and its calculations should be clear and self-documenting using best practices for formatting, comments and explanatory guides such as text boxes. [39]
• It is a transparent disease progression model with an appropriate time horizon for a health system.
• Treatment pathways are relevant to the formulary decision andcorrespond to nationally recognized or [---] treatment guidelines. To help illuminate the proposed treatment pathways, the manufacturer is encouraged to provide decision trees.
• Usual clinical practice, including relevant comparators to [---], is included in the model.
• Mathematics and calculations included in the model are accurate and available for inspection.
• Allowance is made for analysis of relevant sub-populations (age,gender, co-morbidities) where applicable.
• The model is interactive and allows the health system to incorporate its own data (membership size, prevalence rates, cost estimates, etc.) or, if requested, use default data, such as national norms.
Data
• Sources of data are clearly defined and from the most recent stud• Data have been interpreted and accurately incorporated into the
ies.
model. • Uncertainty is defined, especially for key variables.
Linkages between intermediate and longer-ter• m endpoints are valid
Assumptions that drive the model are clearly identified.
and based on reasonable scientific evidence. •
10
Health System Guidelines for Manufacturers (Evidentiary Requirements for Formulary Submission Dossiers)
Results/Output • Outcomes need to be relevant to the [---] formulary decision. • Incremental analyses of both health effects and costs are conducted. • Results are verifiable and traceable back to the inputs. • Uncertainty in the model and data are tested in a reasonable fashion
and reported. • Results are presented in such a fashion that facilitates incorporation
into drug reviews and monographs.
The model's time frame is a critical element. For chronic illnesses, a one to three-year period should be adopted as well as a longer period, as appropriate for the clinical problem and its resolution. For this longer period, a final and disease appropriate health outcome determination is recommended, possibly including more patient-centered outcomes, such as Quality of Life Year Saved. For acute illness, shorter periods may be appropriate.
3.2 PARAMETER ESTIMATES FOR MODELS Randomized, controlled efficacy studies are required for licensing and registration. These data comprise the foundation for FDA approval, labeled indications and marketing. [---] recognizes that manufacturers must conduct these studies for the FDA. In addition, [---] recognizes that the results observed in randomized trials are likely to represent optimal effects and are difficult to generalize to populations because of patient selection and the close oversight
iven subjects in clinical trials. g In general, the best quantitative estimates of clinical effectiveness are required, with uncertainty in the estimate(s) handled analytically via sensitivity analysis. Thus, where possible, feasible and scientifically plausible, scientists preparing the economic model are encouraged to attempt transformation of efficacy results into effectiveness parameters. This may involve inclusion of an adherence parameter into the model or may involve the creative use of retrospective data. Documentation and clear description of the methodology will be necessary in
rder for [---] staff to evaluate the validity of this approach. o Translation of claims from an efficacy to an effectiveness context should be cons ride ed when:
a) The model's treatment period extends beyond that represented by the clinical trial;
b) Outcomes supported by the trial are intermediate or surrogate in nature; or c) Compliance, dosing, co-morbid conditions and the population of interest
(e.g., children, elderly) are expected to differ from the efficacy trial data. Poor adherence to therapy, especially for chronic conditions, can impact manufacturer claims that are based exclusively on carefully monitored clinical efficacy trials. All claims (promotional or otherwise) made for new products should state clearly the assumptions concerning patient adherence. It is suggested that manufacturers provide documentation of anticipated adherence patterns from populations similar to the treatment populations of [---], if available. This may be more plausible for manufacturers who have launched products in other countries
efore the US introduction. b
11
Health System Guidelines for Manufacturers (Evidentiary Requirements for Formulary Submission Dossiers)
3.3 PERSPECTIVE, TIME HORIZON AND DISCOUNTING The payer perspective is recommended for the primary analysis. We welcome a societal perspective analysis as a secondary evaluation. The analytic model should consider a time horizon that is appropriate to the disease being studied and reflect the decision-making and financial and budget constraints of [---]. When appropriate, adjustment for the time preference should be incorporated and should follow US PHS Panel recommendations.[38]
3.4 ANALYSES Analyses should follow accepted approaches for economic models. Transparency and clarity of presentation are a necessity. Therefore, we recommend that all data and calculations be contained in the model spreadsheet and visible to the user. This will help ensure transparency and allow the user to verify that the data used in the model is appropriate. The need for and value of transparency is widely recognized and can provide some protection against the negative effects of bias and error. The users of models need to be able to understand all steps in the modeling process to improve their understanding of the key factors and variables in the model and its limitations.[40] Therefore, researchers are encouraged to focus efforts on the clarity and transparency of results. All assumptions must be presented and justification should be provided. Also, detailed notes that show the flow of data through the model are recommended. All calculations should be explained in a simple straightforward manner to allow a non-health economist to comprehend the analysis. This information may be accessible both in a manual form as well as shown directly in the model, to maximize the ease of review. This said model users should act responsibility when changing values in a model to avoid erroneous results. Comprehensive (all variables) one-way sensitivity analysis is highly recommended. Other evaluations of uncertainty such as confidence interval determination, best/worse case scenario analyses, net-benefit and acceptability curve estimation are also useful. When a product is to be used in the treatment of more than one disease, its impact should be modeled for each approved indication, unless a reasonable case can be made for a single model. Because of the complexity involved in constructing a model that simultaneously addresses several indications, we recommend using a separate model for each condition. 3.5 PRESENTATION OF MODEL RESULTS At a minimum, manufacturers should present models and model results as follows:
1. Provide a figure displaying the structure of the model (e.g., a decision tree or Markov model). A simplified schematic diagram may be used for ease of presentation, but a detailed figure should also be included.
12

Health System Guidelines for Manufacturers (Evidentiary Requirements for Formulary Submission Dossiers)
2. Provide a table listing all of the model inputs, including probabilities, costs, and utility estimates if appropriate.
a. Provide a range of values upon which sensitivity analyses are based for each input.
b. Include references in the table for all inputs, including ranges. c. Note in the table estimates that lack supporting evidence.
3. Provide an explicit list of model assumptions, including assumptions about comparator interventions, clinical events, patient management, and costs.
4. Present the disaggregated results in a table (e.g., cost-consequence style, with costs presented separately from health outcomes). Data presented in this format are more easily understood and interpreted by health-system formulary committees.
a. Further disaggregate costs into total medical and pharmacy costs and then various resource components including drug costs, as appropriate.
b. Include the total cost of implementing the therapy and the resulting cost offsets.
c. Finally, present incremental cost-effectiveness ratios, if appropriate.
5. Present one-way sensitivity analyses on all model inputs in a figure (e.g., tornado diagram) or a table. Ideally, the sensitivity diagram should be dynamic and allow the health system to pick specific variables to evaluate and to determine the upper and lower limit for each.
a. Clearly present the model inputs or assumptions that drive the difference in costs, effects, and incremental cost-effectiveness.
b. When appropriate, present multi-way (e.g., 2-way, best/worst case scenario, probabilistic) sensitivity analyses
3.6 EXCEPTIONS A pre-existing model developed for another health system or for another country may eliminate the need to develop a new model for this submission. A model based on national norms may also be acceptable provided it is submitted in such a manner (spreadsheet) that […] can either use the default values or insert its own. To be acceptable, the existing model should follow the general framework described in this document and must be able to demonstrate the system-wide impact of introducing the product to [---] formularies. It is the manufacturer's responsibility to justify the adequacy of pre-existing models. Developing a model that can be adaptable and allow […] to make changes in multiple elements will greatly enhance this process. 4 . P R O D U C T V A L U E A N D O V E R A L L C O S T
[ 2 - 3 P A G E M A X I M U M ] This section of the submission requirements represents the principal opportunity for a manufacturer to communicate the value of its product to [---]. The manufacturer should briefly summarize all clinical and economic information presented previously and state the expected per unit product cost. Based on this information, the manufacturer should articulate a value argument to justify these
13
Health System Guidelines for Manufacturers (Evidentiary Requirements for Formulary Submission Dossiers)
expected expenditures for this product in the context of its anticipated effects on the clinical and other outcomes and the economic consequences for [---] and its clients and members. Through this process, product value is redefined as both parties move beyond cost containment to focus on optimizing drug utilization in an environment of limited resources.
5 . S U P P O R T I N G I N F O R M A T I O N 5.1 REFERENCES CONTAINED IN DOSSIERS Submissions should list and provide copies of all relevant clinical and pharmacoeconomic references made in Sections 2 and 3 above.
5.2 ECONOMIC MODELS Media: In addition to the written report, the manufacturer must provide a transparent, unlocked copy of the model without the graphical interface. It should be presented on a 3.5" disk or CD ROM as an Excel workbook, ASCII tab-delimited file or an alternative format that is agreed upon by [---] or its consultants and the manufacturer. The model should be transparent, i.e., designed to allow staff or consultants to investigate the assumptions and calculations, and to perform independent sensitivity analyses by varying individual parameters. […] will retain this model for internal analyses and will not release it to any other party. Manuscripts that support the development and reporting of the model are to be attached as appendices.
14
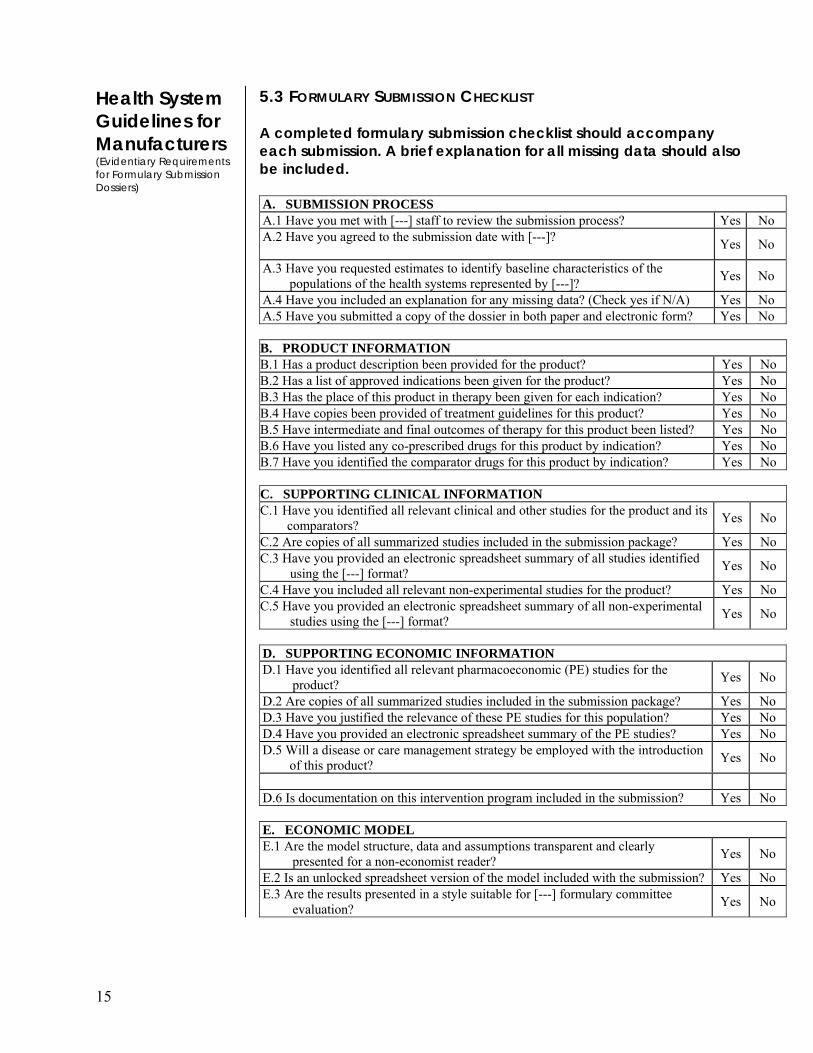
Health System Guidelines for Manufacturers (Evidentiary Requirements for Formulary Submission Dossiers)
5.3 FORMULARY SUBMISSION CHECKLIST A completed formulary submission checklist should accompany each submission. A brief explanation for all missing data should also be included. A. SUBMISSION PROCESS A.1 Have you met with [---] staff to review the submission process? Yes No A.2 Have you agreed to the submission date with [---]? Yes No
A.3 Have you requested estimates to identify baseline characteristics of the populations of the health systems represented by [---]? Yes No
A.4 Have you included an explanation for any missing data? (Check yes if N/A) Yes No A.5 Have you submitted a copy of the dossier in both paper and electronic form? Yes No B. PRODUCT INFORMATION B.1 Has a product description been provided for the product? Yes No B.2 Has a list of approved indications been given for the product? Yes No B.3 Has the place of this product in therapy been given for each indication? Yes No B.4 Have copies been provided of treatment guidelines for this product? Yes No B.5 Have intermediate and final outcomes of therapy for this product been listed? Yes No B.6 Have you listed any co-prescribed drugs for this product by indication? Yes No B.7 Have you identified the comparator drugs for this product by indication? Yes No C. SUPPORTING CLINICAL INFORMATION C.1 Have you identified all relevant clinical and other studies for the product and its
comparators? Yes No
C.2 Are copies of all summarized studies included in the submission package? Yes No C.3 Have you provided an electronic spreadsheet summary of all studies identified
using the [---] format? Yes No
C.4 Have you included all relevant non-experimental studies for the product? Yes No C.5 Have you provided an electronic spreadsheet summary of all non-experimental
studies using the [---] format? Yes No
D. SUPPORTING ECONOMIC INFORMATION D.1 Have you identified all relevant pharmacoeconomic (PE) studies for the
product? Yes No
D.2 Are copies of all summarized studies included in the submission package? Yes No D.3 Have you justified the relevance of these PE studies for this population? Yes No D.4 Have you provided an electronic spreadsheet summary of the PE studies? Yes No D.5 Will a disease or care management strategy be employed with the introduction
of this product? Yes No
D.6 Is documentation on this intervention program included in the submission? Yes No E. ECONOMIC MODEL E.1 Are the model structure, data and assumptions transparent and clearly
presented for a non-economist reader? Yes No
E.2 Is an unlocked spreadsheet version of the model included with the submission? Yes No E.3 Are the results presented in a style suitable for [---] formulary committee
evaluation? Yes No
15

Terms and Definitions
Budget Impact Models: These models are used to evaluate the budget impact of pharmaceutical expenditures as a consequence of new product introduction. These models typically include: drug costs, network or other discounts, rebates, co-payment and other benefit design impacts, product market share and market share changes, Per Member Per Month Expenditures, and total pharmacy budget impact. By strict definition, budget impact models are not used to establish the value of new technology because they do not include the impact of drugs on clinical outcomes, non-pharmacy resource use and adverse effects. [41] Care pathways: A general method of using predetermined, time-staged, evidence-based actions for managing the care of patients who have clearly defined diagnoses or require certain procedures. Ideally, care pathways should be applicable to the management of patients moving among a managed health care system's multiple levels of care and practice settings. Other terms for care pathways include clinical care plans, clinical pathways, critical pathways, care guides, and care maps. Cost-Benefit Analysis: An analytical technique derived from economic theory that enumerates and compares the net costs of a health care intervention with the benefits that arise as a consequence of applying that intervention. For this technique, both the net costs and the benefits of the health intervention are expressed in monetary units. [41] Cost-consequence Analysis: An analytical technique that compares the health intervention of interest to one or more relevant alternatives, listing the cost components and various outcomes of each intervention separately. This type of economic analysis does not indicate the relative importance of the components listed and leaves it to the decision maker to form his or her own view.[41] Cost-Effectiveness Analysis: A systematic method of comparing two or more alternative programs by measuring the costs and consequences of each. A distinguishing feature of cost-effectiveness analysis is that the consequences (health outcomes) of all programs to be compared must be measured in the same common units-natural units related to the clinical objective of the programs (e.g., symptom-free days gained, cases prevented, quality of life years gained). [41] Cost-Minimization Analysis: A type of pharmacoeconomic analysis comparing two alternative therapies only in terms of costs because their outcomes (effectiveness and safety) are found to be or expected to be identical. [41] Cost-Utility Analysis: A specific type of cost-effectiveness analysis that compares two or more alternative choices in terms of both their costs and outcomes, where the outcomes are measured in units of utility or preference, often as quality-adjusted life years gained. Cost-utility analysis can be considered the “gold standard” methodology for evaluating the cost-effectiveness of health care choices. [41]
16

Terms and Definitions
continued
Cost-Effectiveness Model: These models are used to establish the value of a new technology relative to an appropriate comparator, and often use decision analysis techniques. They can be based directly on clinical trials. They are disease-based and account for the impact of new technology on clinical outcomes (efficacy, adverse events), resource use and costs in the short and long-term. They also reveal the relation between data inputs and assumptions and outcomes. These models can be used to conduct a cost-benefit, cost-minimization, cost-effectiveness, and/or cost-utility analysis [41] Decision Analysis: A quantitative approach to decision making under uncertainty in which all relevant elements of the decision – alternative actions, chance events (along with their probabilities of occurrence), and final consequences – are stated explicitly in a model. Multiple types of data can be incorporated from a variety of sources. This model typically takes the form of a decision tree or an influence diagram and permits the decision maker to determine systematically the relative value of alternative courses of action. [41]
Decision Tree: A schematic diagram depicting the logical structure of a choice under conditions of uncertainty, including all relevant alternative decisions available to the decision maker as well as the values and probabilities of all relevant downstream consequences. [41]
Dossier: A detailed report (in paper and electronic form) for each product submitted by the manufacturer for consideration that contains (1) clinical and economic data from published and unpublished studies and (2) a disease-based economic model to project the potential impact that introducing the product would have on health and economic consequences occurring across the entire system. Effectiveness: The actual effects of treatment by the drug under "real life" conditions [patients not always remembering to take their doses, physicians often not prescribing the lowest FDA recommended doses, side effects not all controlled, etc]. 'Head to head' effectiveness studies with similar medications are preferable. Efficacy: The potential effects of treatment by the drug under optimal circumstances [e.g. patients all taking their doses at the right times, physicians prescribing FDA recommended doses, side effects appropriately monitored, etc]. Efficacy studies are typically the foundation of new drug submissions to the FDA. Studies that compare the efficacy of similar drugs, rather than just efficacy compared to placebo are preferable. Evidence-Based Medicine (EBM): An approach to health care decision making in which the decision maker is aware of all the relevant evidence and its strengths and weaknesses and is then able to apply that knowledge to decisions. EBM, therefore, consists of clinical expertise and patient preferences combined with critical appraisal of clinical research, with the goal of providing optimal individual patient care. Optimal care thus takes into account patient outcomes and the relative efficiencies among competing alternatives, as demonstrated in the medical literature. This approach to patient care demands that the decision
17
Terms and Definitions
continued
makers’ expertise and the appraisal of the clinical evidence base are current and up to date. [41]
Evidence-Based Medicine – Alternate Definition: The conscientious, explicit, and judicious use of current best evidence in making decisions about the care of individual patients. The practice of evidence based medicine means integrating individual clinical expertise with the best available external clinical evidence from systematic research. [42] Formulary: A periodically updated list of medications, related products and information, representing the clinical judgment of physicians, pharmacists, and other experts in the diagnosis and/or treatment of disease and promotion of health. Formulary system: An ongoing process whereby a health care system, through its physicians, pharmacists and other health care professionals, establishes policies on the use of drugs, related products and therapies, and identifies drugs, related products and therapies that are the most medically appropriate and cost-effective to best serve the health interests of the patient populations of the health systems it represents. Health Economics: A discipline that analyses the economic aspects of health and health care and that usually focuses on the costs (inputs) and the consequences (outputs) of health care interventions using methods and theories from economics and medicine. [41] Health-Related Quality of Life (HRQOL): A broad theoretical construct developed to explain and organize measures concerned with the evaluation of health status, attitudes, values and perceived levels of satisfaction and general well being with respect to either specific health conditions or life as a whole form the individual’s perspective. (see Patient-Reported Outcomes). [41]
Markov Model: A complex health economics treatment model that describes the natural history of particular diseases, with or without treatment. To capture all critical events, Markov models can categorize health status with a higher level of detail and divide the model’s time perspective into finer intervals than is possible with decision trees. [41]
Model: In the context of health care evaluation, a model is an analytic methodology that accounts for events over time and across populations, that is based on data drawn from primary and/or secondary sources and whose purpose is to estimate the effects of an intervention on valued health consequences and costs. [37] Modeling: The development of a simplified representation of a system (e.g. population). A particular model may be analytical, visual or both. In pharmacoeconomics specifically or health economics in general, analytical models can be used to pose and answer questions about interventions that cannot be directly answered by clinical trials due to time and financial constraints. [41]
18
Terms and Definitions
continued
Outcomes Research: The scientific discipline that evaluates the effect of health care interventions on patient-related, if not patient-specific, clinical, humanistic and economic outcomes. Outcomes research is generally based on the conceptual framework that evaluation of treatment alternatives involves the simultaneous assessment of multiple types of outcomes that are disease-related. [41]
Patient-Reported Outcomes: An umbrella term that includes outcome data reported directly by the patient. It is one source of data that may be used to describe a patient’s condition and response to treatment. It includes such outcomes as global impressions, functional status, well-being, symptoms, health-related quality of life, satisfaction with treatment and treatment adherence. [41]
Pharmacoeconomics: The scientific discipline that assesses the overall value of pharmaceutical health care products, services and programs. Of necessity, it addresses the clinical, humanistic and economic aspects of health care interventions in the prevention, diagnosis, treatment and management of disease. Pharmacoeconomics thus provides information critical to the optimal allocation of heath care resources. The field encompasses experts in health economics, risk analysis, technology assessment, clinical evaluation, epidemiology, decision analysis and health services research. [41]
Quality-Adjusted Life Year (QALY): A universal health outcome measure applicable to all individuals and all diseases, thereby enabling comparisons across diseases and across programs. A QALY combines, in a single measure, gains or losses in both quantity of life (mortality) and quality of life (morbidity). [41]
Rule of Rescue: A term applied to the ethical imperative to save individual lives regardless of the cost if rescue measures are available. Regarding the distribution of health care services, the “rule of rescue” supplements rather than substitutes for the evidence-based consideration of comparative cost-effectiveness. For example, Australia’s Pharmaceutical Benefits Advisory Committee considers the rule of rescue a relevant factor when the cost-effectiveness level is unacceptable and:
1. No alternate pharmacological or non-pharmacological intervention exists to treat patients with the identified condition;
2. The defined condition must be severe, progressive and expected to lead to premature death;
3. The defined condition must apply to only a very small number of patients. [43]
Sensitivity Analysis: A way to analyze the impact of uncertainty in an economic analysis or a decision (see Decision Analysis, Modeling, Cost-Effectiveness Model). The simplest form of sensitivity analysis is a one-way analysis where the value of one variable is changed while keeping the other variables constant, and the impact on results evaluated. [41]
19

Terms and Definitions
continued
Tornado Diagram: A set of one-way sensitivity analyses displayed in a single graph, with the most critical variable in terms of impact at the top of the graph and the rest ranked according to their impact thereafter; hence the “tornado” or funnel appearance of the graph. [41]
20

References
1. Consensus document. Principles of a sound drug formulary. Alexandria, VA: Academy of Managed Care Pharmacy, October 2000. Available from http://www.amcp.org/publications/drugformulary.pdf.
2. Gibson JL, Martin DK, Singer PA. Priority setting for new technologies in medicine: A transdisciplinary study. BMC Health Services Research 2002; 2:14, 18 July 2002.
3. Neumann PJ. Evidence-based and value based formulary guidelines. Health
Affairs (2004). 23; 1:124-134. 4. Hjelmgren J, Berggren F and Andersson F. Health economic guidelines-
similarities, differences, and some implications. Value Health 4, no. 3 (2001): 225-250.
5. Mather DB, Sullivan SD, Augenstein D, Fullerton DS and Atherly D.
Incorporating clinical outcomes and economic consequences into drug formulary decisions: a practical approach. Amer J Man Care 1999; 5(3):277-285.
6. Sullivan SD, Lyles A, Luce B and Gricar J. AMCP Guidance for submission
of clinical and economic evaluation data to support formulary listing in U.S. health plans and pharmacy benefit management organizations. J Managed Care Pharm 2001; 7(4):272-82.
7. Balekdjian D and Russo M. Managed care mandate: show us the value.
Pharmaceutical Executive. September 2003, 80-88. 8. McClellan M. Valuing health outcomes: an assessment of approaches.
Speech at the Resources for the Future Conference, Valuing Health Outcomes:Session I: The Policy Context. February 13, 2003. Accessed at www.rff.org May 9, 2003.
9. United States Department of Health and Human Services, Centers for
Medicare and Medicaid Services. Medicare Modernization Act Guidelines – Formularies, CMS Strategy for Affordable Access to Comprehensive Drug Coverage, Guidelines for Reviewing Prescription Drug Plan Formularies and Procedures. December 3, 2004. http://www.cms.hhs.gov/pdps/. Accessed December 6, 2004.
10. Neumann PJ. Why don’t Americans use cost-effectiveness analysis?
Am J Manag Care. 2004;10:308-312. 11. Daniels N. Four unsolved rationing problems. Hastings Center Report. 1994, 24:27-9. 12. Richardson J and McKie J. The rule of rescue. Working paper #112 (2000).
Centre for Health Program Evaluation, Health Economics Unit, Monash University, Australia.http://chpe.buseco.monash.edu.au/pubs/wp112.pdf .
21
References continued
13. Australia Pharmaceutical Benefits Scheme. Guidelines for the pharmaceutical industry on preparation of submissions to the pharmaceutical benefits
advisory committee: including major submissions involving economic analyses. Canberra, Australia, 1995 and 2000, http://www.health.gov.au/pbs/pubs/pharmpac/gusubpac.htm and http://www.health.gov.au/pbs/pubs/pharmpac/interim/.
14. Canadian Coordinating Office of Health Technology Assessment. Guidelines
for economic evaluation of pharmaceuticals. Ottawa, Ontario, Canada, 1997. http://www.ccohta.ca/entry_e.html
15. National Institute for Clinical Excellence. A Guide for manufacturers and
sponsors contributing to a technology appraisal. London: The Institute, November 2004. Available from http://www.nice.org.uk.
16. Drummond M. Should commercial-in-confidence data be used by decision
makers when making assessments of cost-effectiveness? Editorial. Applied Health Economics and Health Policy. 2002:1(2), 3-4.
17. Foundation for Managed Care Pharmacy. Response to comments for AMCP’s
format for formulary submissions version 2.0. Alexandria, VA. October 2002. Available at www.fmcpnet.org.
18. US Food and Drug Administration. FDA Modernization Act. [Internet]
Washington: The Administration, November 21, 1997. Available from: www.fda.gov/opacom/7modact.html.
19. Conversations between FMCP staff and officials from FDA’s Center for Drug
Evaluation and Research, May 2001 20. American College of Clinical Pharmacy. Pharmacoeconomics and outcomes:
applications for patient care, second edition. 2003, Kansas City, MO. 21. O’Brien BJ. Academy of Managed Care Pharmacy Format: relevance, rigor,
regulation, and realism. Value Health 2003, 6; 5:501-502. 22. Neumann PJ. Using cost-effectiveness analysis to improve health care.
Oxford University Press: New York, NY, 2005 23. Daniels N, Sabin JE. The ethics of accountability in managed care reform.
Health Affairs. 1998; 17(5):50-64.
24. Drummond MF, Jefferson TO. Guidelines for authors and peer reviewers of economic submissions to the BMJ. The BMJ Economic Evaluation Working Party. BMJ 1996; 313:275-83.
25. Task Force on Principles for Economic Analysis of Health Care Technology. Economic analysis of health care technology, Ann Intern Med, 1995; 123:61-70.
22
References continued
and medicine. New York, NY, Oxford University Press, 1996.
26. U.S. Department of Health and Human Services, Food and Drug Administration, Center for Drug Evaluation and Research, Center for
Biologics Evaluation and Research and Center for Devices and Radiologic Health. Draft guidance for industry: pharmacogenomic data submissions. November 2003. (http://www.fda.gov/cber/gdlns/pharmdtasub.pdf). Accessed December 17, 2004.
27. DeAngelis C , Drazen JM, Frizelle FA, et al. Clinical trial registration: a
statement from the international committee of medical journal editors. N Engl J Med. 351;12:1250-51.
28. Hillman AL, Eisenberg JM, Pauly MV, Bloom BS, Glick H, Kinosian B,
Schwartz JS. Avoiding bias in the conduct and reporting of cost-effectiveness research sponsored by pharmaceutical companies. N Engl J Med 1991; 324:1362-5.
29. Johannesson M, Jönsson B, Göran K. Outcome measurement in economic
evaluation. Health Econ 1996;5:279-96. 30. Agro KE, Bradley CA, Mittmann N, et. al. Sensitivity analysis in health
economic and pharmacoeconomic studies: an appraisal of the literature. PharmacoEconomics 1997; 11(1):75-88.
31. Detsky AS. Guidelines for economic analysis of pharmaceutical products: a
draft document for Ontario and Canada. PharmacoEconomics 1993; 3(5):354-61.
32. Drummond MF, Stoddart GL, Torrance GW. Methods for the economic
evaluation of health care programs. Oxford, Oxford University Press, 1987. 33. Glick H, Kinosian B, Schulman K. Decision analytic modeling: some uses in
the evaluation of new pharmaceuticals. Drug Information Journal 1994, 28:691-707.
34. Henry D. Economic analysis as an aid to subsidisation decisions: the
development of Australian guidelines for pharmaceuticals. PharmacoEconomics 1992; 1:54-67.
35. Kassirer JP, Angell M. The journal's policy on cost-effectiveness analyses. N
Engl J Med 1994; 331:669-70.
36. Sheldon TA. Problems of using modeling in the economic evaluation of health care. Health Econ 1996;5:1-11.
37. Weinstein MC, O’Brien B, Hornberger J, et al. Principles of good practice
fordecision analytic modeling in health-care evaluation: report of the ISPOR task force on good research practices – modeling studies.
Value Health. 2003; 6: 9-17. 38. Gold MR, Siegel JE, Russell LB, Weinstein MC. Cost-effectiveness in health
38.
23
References Continued
39. Winston WL and Albright SC. Practical Management Science, 2nd edition. Duxbury Press, Thomson Learning. Pacific Grove, California. 2001. ISBN 0-534-37135-3. pp. 29-30, 62-63.
40. Garrison LP. The ISPOR good practice modeling principles – a sensible
approach: be transparent, be reasonable. Value Health 2003; 6:6-8. 41. International Society for Pharmacoeconomics and Outcomes Research.
Health care cost, quality, and outcomes: ISPOR book of terms. 2003. 42. Sackett DL, Rosenberg WMC, Gray JAM, Haynes RB, Richardson WS.
Evidence based medicine: what it is and what it isn't. BMJ 1996; 312: 71-2) 43. Richardson J and McKie J. The rule of rescue. Centre for Health Program
Evaluation. Working Paper 112 [Internet] West Heidelberg, Australia. Available from http://www.buseco.monash.edu.au/centres/che/pubs/wp112.pdf
24

Appendices
• Appendix A – Principles of a Sound Drug Formulary System
• Appendix B – Guidelines for Authors and Peer
Reviewers of Economic Submissions to the British Medical Journal (M.F. Drummond)
• Appendix C - Principles of Good Practice for
Decision Analytic Modeling in Health-Care Evaluation: Report of the ISPOR Task Force on Good Research Practices – Modeling Studies
• Appendix D – Sample P & T Committee
Monograph
25
Principles of a Sound Drug Formulary System
October 2000
These principles have been endorsed by the following
organizations:
• Academy of Managed Care Pharmacy
• Alliance of Community Health Plans
• American Medical Association
• American Society of Health-System Pharmacists
• Department of Veterans Affairs,
Pharmacy Benefits Management
Strategic Healthcare Group
• National Business Coalition on Health
• U. S. Pharmacopeia
APPENDIX A
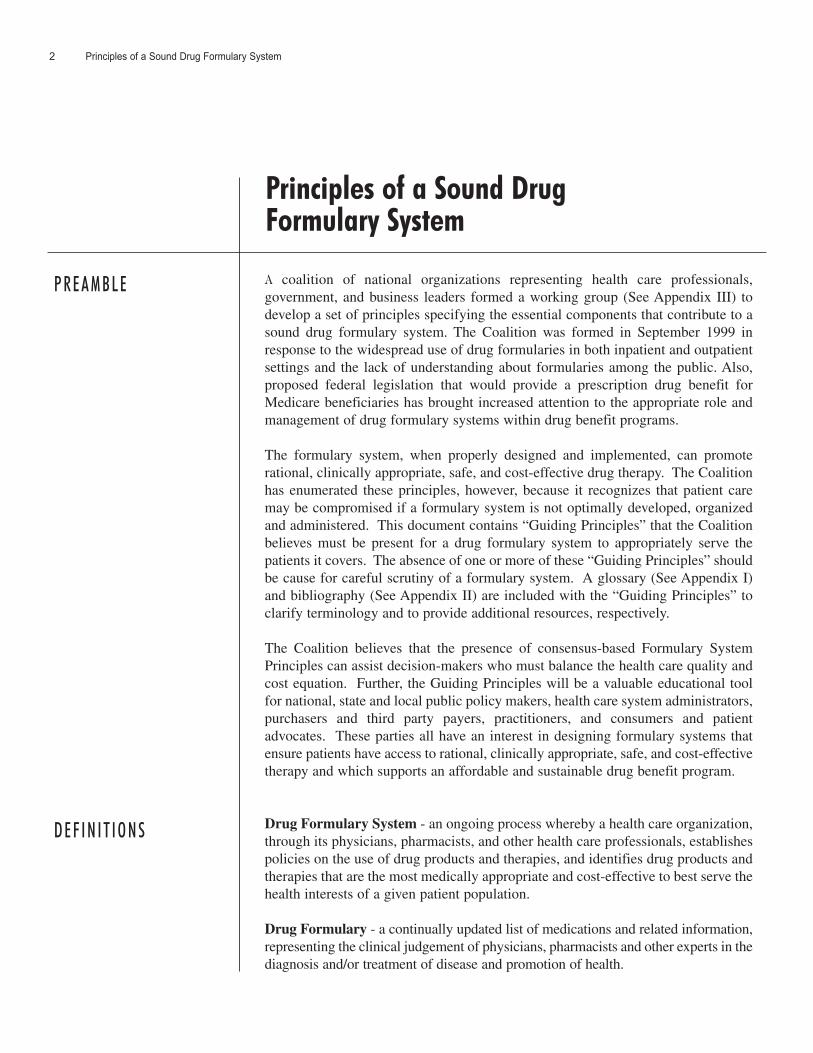
2 Principles of a Sound Drug Formulary System
A coalition of national organizations representing health care professionals,government, and business leaders formed a working group (See Appendix III) todevelop a set of principles specifying the essential components that contribute to asound drug formulary system. The Coalition was formed in September 1999 inresponse to the widespread use of drug formularies in both inpatient and outpatientsettings and the lack of understanding about formularies among the public. Also,proposed federal legislation that would provide a prescription drug benefit forMedicare beneficiaries has brought increased attention to the appropriate role andmanagement of drug formulary systems within drug benefit programs.
The formulary system, when properly designed and implemented, can promoterational, clinically appropriate, safe, and cost-effective drug therapy. The Coalitionhas enumerated these principles, however, because it recognizes that patient caremay be compromised if a formulary system is not optimally developed, organizedand administered. This document contains “Guiding Principles” that the Coalitionbelieves must be present for a drug formulary system to appropriately serve thepatients it covers. The absence of one or more of these “Guiding Principles” shouldbe cause for careful scrutiny of a formulary system. A glossary (See Appendix I)and bibliography (See Appendix II) are included with the “Guiding Principles” toclarify terminology and to provide additional resources, respectively.
The Coalition believes that the presence of consensus-based Formulary SystemPrinciples can assist decision-makers who must balance the health care quality andcost equation. Further, the Guiding Principles will be a valuable educational toolfor national, state and local public policy makers, health care system administrators,purchasers and third party payers, practitioners, and consumers and patientadvocates. These parties all have an interest in designing formulary systems thatensure patients have access to rational, clinically appropriate, safe, and cost-effectivetherapy and which supports an affordable and sustainable drug benefit program.
Drug Formulary System - an ongoing process whereby a health care organization,through its physicians, pharmacists, and other health care professionals, establishespolicies on the use of drug products and therapies, and identifies drug products andtherapies that are the most medically appropriate and cost-effective to best serve thehealth interests of a given patient population.
Drug Formulary - a continually updated list of medications and related information,representing the clinical judgement of physicians, pharmacists and other experts in thediagnosis and/or treatment of disease and promotion of health.
Principles of a Sound Drug Formulary System
P R E A M B L E
D E F I N I T I O N S
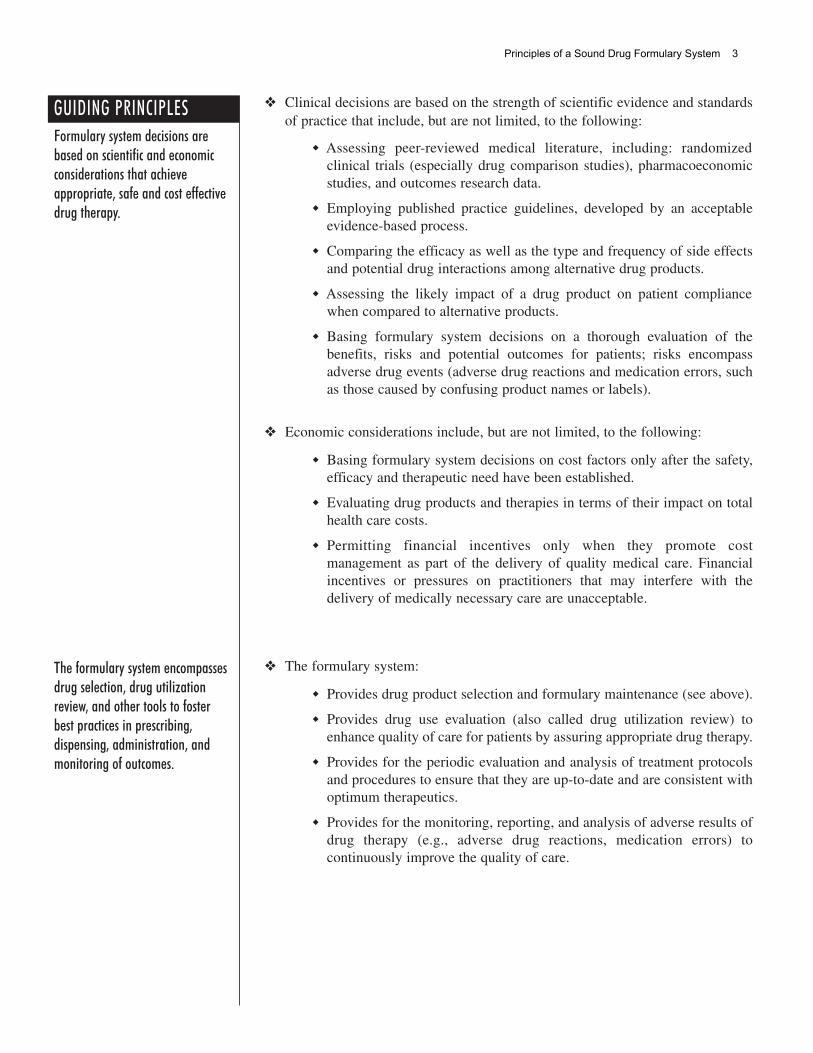
❖ Clinical decisions are based on the strength of scientific evidence and standardsof practice that include, but are not limited, to the following:
� Assessing peer-reviewed medical literature, including: randomizedclinical trials (especially drug comparison studies), pharmacoeconomicstudies, and outcomes research data.
� Employing published practice guidelines, developed by an acceptableevidence-based process.
� Comparing the efficacy as well as the type and frequency of side effectsand potential drug interactions among alternative drug products.
� Assessing the likely impact of a drug product on patient compliancewhen compared to alternative products.
� Basing formulary system decisions on a thorough evaluation of thebenefits, risks and potential outcomes for patients; risks encompassadverse drug events (adverse drug reactions and medication errors, suchas those caused by confusing product names or labels).
❖ Economic considerations include, but are not limited, to the following:
� Basing formulary system decisions on cost factors only after the safety,efficacy and therapeutic need have been established.
� Evaluating drug products and therapies in terms of their impact on totalhealth care costs.
� Permitting financial incentives only when they promote costmanagement as part of the delivery of quality medical care. Financialincentives or pressures on practitioners that may interfere with thedelivery of medically necessary care are unacceptable.
❖ The formulary system:
� Provides drug product selection and formulary maintenance (see above).
� Provides drug use evaluation (also called drug utilization review) toenhance quality of care for patients by assuring appropriate drug therapy.
� Provides for the periodic evaluation and analysis of treatment protocolsand procedures to ensure that they are up-to-date and are consistent withoptimum therapeutics.
� Provides for the monitoring, reporting, and analysis of adverse results ofdrug therapy (e.g., adverse drug reactions, medication errors) tocontinuously improve the quality of care.
Formulary system decisions arebased on scientific and economicconsiderations that achieveappropriate, safe and cost effectivedrug therapy.
The formulary system encompassesdrug selection, drug utilizationreview, and other tools to fosterbest practices in prescribing,dispensing, administration, andmonitoring of outcomes.
GUIDING PRINCIPLES
Principles of a Sound Drug Formulary System 3

4 Principles of a Sound Drug Formulary System
❖ The Pharmacy and Therapeutics Committee:
� Objectively appraises, evaluates, and selects drugs for the formulary.
� Meets as frequently as is necessary to review and update theappropriateness of the formulary system in light of new drugs and newindications, uses, or warnings affecting existing drugs.
� Establishes policies and procedures to educate and inform health careproviders about drug products, usage, and committee decisions.
� Oversees quality improvement programs that employ drug useevaluation.
� Implements generic substitution and therapeutic interchange programsthat authorize exchange of therapeutic alternatives based upon writtenguidelines or protocols within a formulary system. (Note: Therapeuticsubstitution, the dispensing of therapeutic alternates without theprescriber’s approval, is illegal and should not be allowed-See Glossary.)
� Develops protocols and procedures for the use of and access to non-formulary drug products.
� Health care organization policies should ensure appropriate oversight ofthe P&T Committee and its decisions by the medical staff or equivalentbody.
❖ Formulary system policies should:
� Require P&T committee members to reveal, by signing a conflict ofinterest statement, economic and other relationships with pharmaceuticalentities that could influence Committee decisions.
� Exclude product sponsor representatives from P&T committeemembership and from attending P & T committee meetings.
� Require P&T committee members to adhere to the formulary system’spolicy on disclosure and participation in discussion as it relates toconflict of interest.
The Pharmacy and Therapeutics(P&T) Committee, or equivalentbody, comprised of activelypracticing physicians, pharmacistsand other health careprofessionals, is the mechanism foradministering the formularysystem, which includes developingand maintaining the formularyand establishing andimplementing policies on the useof drug products.
Physicians, pharmacists, and otherhealth care professionals provideoversight of the formulary system.
The formulary system must haveits own policies, or adhere to otherorganizational policies, thataddress conflicts of interest anddisclosure by P&T committeemembers.
GUIDING PRINCIPLES

❖ The formulary system should:
� Inform physicians, pharmacists, other health care professionals, patients,and payers about the factors that affect formulary system decisions,including: cost containment measures; the procedures for obtaining non-formulary drugs; and the importance of formulary compliance toimproving quality of care and restraining health care costs.
� Proactively inform practitioners about changes to the formulary or toother pharmaceutical management procedures.
� Provide patient education programs that explain how formulary decisionsare made and the roles and responsibilities of the patient, especially theimportance of patient compliance with drug therapy to assure the successof that therapy.
� Disclose the existence of formularies and have copies of the formularyreadily available and accessible.
� Provide rationale for specific formulary decisions when requested.
❖ The formulary system should:
� Enable individual patient needs to be met with non-formulary drugproducts when demonstrated to be clinically justified by the physician orother prescriber.
� Institute an efficient process for the timely procurement of non-formulary drug products and impose minimal administrativeburdens.
� Provide access to a formal appeal process if a request for a non-formulary drug is denied.
� Include policies that state that practitioners should not be penalized forprescribing non-formulary drug products that are medically necessary.
The formulary system should includea well-defined process for thephysician or other prescriber to use anon-formulary drug when medicallyindicated.
The formulary system should includeeducational programs for payers,practitioners, and patientsconcerning their roles andresponsibilities.
GUIDING PRINCIPLES
Principles of a Sound Drug Formulary System 5

6 Principles of a Sound Drug Formulary System
Drug Formulary System - an ongoing process whereby a health care organization,through its physicians, pharmacists and other health care professionals, establishespolicies on the use of drug products and therapies, and identifies drug products andtherapies that are the most medically appropriate and cost effective to best serve thehealth interests of a given patient population.
Drug Formulary - a continually updated list of medications and relatedinformation, representing the clinical judgement of physicians, pharmacists, andother experts in the diagnosis and/or treatment of disease and promotion of health.
Pharmacy & Therapeutics (P&T) Committee - an advisory committee that isresponsible for developing, managing, updating, and administering the drugformulary system.
Generic Substitution - the substitution of drug products that contain the sameactive ingredient(s) and are chemically identical in strength, concentration, dosageform, and route of administration to the drug product prescribed.
Therapeutic Alternates - drug products with different chemical structures butwhich are of the same pharmacological and/or therapeutic class, and usually can beexpected to have similar therapeutic effects and adverse reaction profiles whenadministered to patients in therapeutically equivalent doses.
Therapeutic Interchange - authorized exchange of therapeutic alternates inaccordance with previously established and approved written guidelines orprotocols within a formulary system.
Therapeutic Substitution - the act of dispensing a therapeutic alternate for thedrug product prescribed without prior authorization of the prescriber. This is anillegal act because only the prescriber may authorize an exchange of therapeuticalternates.
Drug Utilization Review (Drug Use Review, DUR, and Drug Use Evaluation) -process used to assess the appropriateness of drug therapy by engaging in theevaluation of data on drug use in a given health care environment againstpredetermined criteria and standards.
G LO S S A R YAPPENDIX I

1. Academy of Managed Care Pharmacy, Concepts in Managed Care Pharmacy Series -Formulary Management (Alexandria, VA: 1998).
2. American Medical Association. Board of Trustees Report PPP, Principles of Drug UtilizationReview. In, American Medical Association House of Delegates Proceedings, 140th AnnualMeeting. Chicago: American Medical Association; June 1991; 225-227.
3. American Medical Association. Board of Trustees Report 45, Drug Formularies andTherapeutic Interchange. In, American Medical Association House of Delegates Proceedings,47th Interim Meeting. New Orleans: American Medical Association; December 1993; 155-158.
4. American Medical Association. Council on Ethical and Judicial Affairs Report 2, ManagedCare Cost Containment Involving Prescription Drugs. In, American Medical AssociationHouse of Delegates Proceedings, 144th Annual Meeting. Chicago: American MedicalAssociation; June 1995; 207-213.
5. American Medical Association. Board of Trustees Report 9, Pharmaceutical BenefitsManagement Companies. In, American Medical Association House of Delegates Proceedings,51st Interim Meeting. Dallas: American Medical Association; December 1997; 33-44.
6. American Society of Consultant Pharmacists. Guidelines for the Development of FormularySystems in Nursing Facilities; July 1996.
7. American Society of Hospital Pharmacists. ASHP Statement on the Formulary System. Am JHosp Pharm. 1983; 40:1384-5.
8. American Society of Hospital Pharmacists. ASHP Guidelines on Formulary SystemManagement. Am J Hosp Pharm. 1992; 49:648-52.
9. American Society of Hospital Pharmacists. ASHP Statement on the Pharmacy andTherapeutics Committee. Am J Hosp Pharm. 1992; 49:2008-9.
10. American Society of Health-System Pharmacists. ASHP Guidelines on Medication-UseEvaluation. Am J Health-Syst Pharm. 1996; 53:1953-5.
11. American Society of Hospital Pharmacists. ASHP Technical Assistance Bulletin on DrugFormularies. Am J Hosp Pharm. 1991; 48:791-3.
12. American Society of Hospital Pharmacists. ASHP Technical Assistance Bulletin on theEvaluation of Drugs for Formularies. Am J Hosp Pharm. 1988; 45:386-7.
13. Covington TR and Thornton JL. The formulary system: A cornerstone of drug benefitmanagement, in A Pharmacist’s Guide to Principles and Practices of Managed Care Pharmacy.Ito S and Blackburn S. eds. Foundation for Managed Care Pharmacy, Alexandria VA. 1995:35-49.
14. Dillon MJ. Drug Formulary Management, in Managed Care Pharmacy Practice. Navarro RPed. Aspen Publishers, Inc., Gaithersburg, MD. 1999: 145-165.
15. Hejna CS and Shepherd MD. Pharmacy and therapeutics committee and formularydevelopment, in A Pharmacist’s Guide to Principles and Practices of Managed Care Pharmacy.Ito S and Blackburn S. eds. Foundation for Managed Care Pharmacy, Alexandria VA. 1995:27-34.
16. National Committee for Quality Assurance. UM 10 procedures for pharmaceuticalmanagement. 2000 Standards for Accreditation of MCOs. 1999: 58-60.
17. National Committee for Quality Assurance. UM 10 procedures for pharmaceuticalmanagement. 2000 Surveyor Guidelines for the Accreditation of MCOs. 1999: 173-182.
18. PCMA Response to American Medical Association Report, I-97, “Pharmaceutical BenefitsManagement Companies.” September 1998.
19. Rucker TD and Schiff GD, Drug formularies: myths-in-formation. Medical Care 1990;28:928-942. Reprinted in Hospital Pharmacy 1991; 26:507-514.
B I B L I O G R A P H YAPPENDIX II
Principles of a Sound Drug Formulary System 7

APPENDIX III Academy of Managed Care PharmacyJudith A. Cahill, C.E.B.S.Executive Director
Richard FrySenior Director, Pharmacy Affairs
American Medical AssociationJoseph W. Cranston, Ph.D.Director-Science, Research andTechnology
American Society of Health-SystemPharmacistsWilliam A. Zellmer, M.P.H.Deputy Executive Vice President
Department of Veterans AffairsJohn E. OgdenDirector, Pharmacy Services
Michael A. ValentinoAssociate Chief Consultantfor Pharmacy Benefits Management
National Business Coalition on HealthCatherine KunkleVice President
U.S. PharmacopeiaJacqueline L. EngSenior Vice President, ProgramDevelopment
Keith W. JohnsonVice President and DirectorNew and Off-Label Uses
Thomas R. FuldaProgram Director, Drug UtilizationReview Programs
Nancy B. MabieAssistant Director, Pharmacy Affairs
ObserverAARPDavid GrossSenior Policy AdvisorPublic Policy Institute
C O A L I T I O N W O R K I N G G R O U P
Public Comment RequestedTo ensure that knowledgeable and interested parties beyond the Coalition WorkingGroup had an opportunity to contribute to the Principles development process, apreliminary set of principles was distributed for public comment to 50-plusorganizations in February 2000. Comments received were thoroughly reviewed andconsidered by the Coalition Working Group.
PSP002M
Principles of a Sound Drug Formulary System 8

Format for Formulary Submissions, Version 2.1 w1
BMJ 1996;313:275–283 (3 August)
M F Drummond, chair of working [email protected],a T O Jefferson, secretary of working [email protected],b on behalf of the BMJ Economic Evaluation Working Partya Centre for Health Economics, University of York, York YOI 5DD, b Ministry of
Defence, Army Medical Directorate 5, Keogh Barracks, Ash Vale, Hampshire GUI2 5RR
Members of the working party are listed at the end of the paper. Correspondence to:Dr Jefferson.
Over the past decade interest in the economic evaluation of health care interventionshas risen.1 Reviews of published studies have, however, shown gaps in the quality ofwork.2 3 4 5 As far back as 1974 Williams listed the essential elements of economicevaluations,6 and more recently Drummond and colleagues set out the methodologicalareas generally agreed among economists.7 Guidelines for economic evaluations havebeen promulgated and reviewed by many bodies,8 9 10 11 12 13 14 but few medical journalshave explicit guidelines for peer review of economic evaluations or consistently useeconomist reviewers for economic papers even though they are a major publicationoutlet for economic evaluations.15 16 17 In January 1995 the BMJ set up a working partyon economic evaluation to improve the quality of submitted and published economicarticles.
It was not our intention to be unduly prescriptive or stifle innovative methods; ouremphasis is on improving the clarity of economic evaluations. We also did notaddress those issues of conduct that have been emphasised in other guidelines.13 14 15 16 17 18
The working party’s methods
The working party’s objectives were to improve the quality of submitted and pub-lished economic evaluations by agreeing acceptable methods and their systematicapplication before, during, and after peer review. Its task was to produce: (a) guide-lines for economic evaluation, together with a comprehensive supporting statementwhich could be easily understood by both specialist and non-specialist readers; (b) achecklist for use by referees and authors; and (c) a checklist for use by editors.
In producing the guidelines the working party has concentrated on full economicevaluations comparing two or more health care interventions and considering bothcosts and consequences.19 Articles sent to the BMJ and other medical journals areoften more broadly based “economic submissions,”20 which comprise essentially clini-cal articles that report approximate cost estimates or make statements that a giventreatment was “cost effective.”
We took the view that submissions reporting partial evaluations, such as a costingstudy or an estimate of the value to individuals of improved health, should adhere tothe relevant sections of the guidelines given below, as should anecdotal reports orcommentaries drawing economic conclusions about alternative forms of care. Inaddition to a referees’ (and authors’) checklist, therefore, the working party has pro-duced shorter checklists to help BMJ editors distinguish between full economic evalu-
APPENDIX B—Guidel ines for
Authors and PeerReviewers of
EconomicSubmissions
to the Brit ishMedical Journal

2 w Academy of Managed Care Pharmacy
ations and other types of economic submission and to help them decide which articlesshould be sent to referees. The main checklist and the editors’ checklists are given inthe boxes and a flow chart explaining their use is given in figure 1. The checklists donot replace the need for an overall judgment on the suitability of a paper.
Drafts of the guidelines and their supporting statement and the checklists have been cir-culated to health economists and journal editors and were debated at the biannual meet-ing of the UK Health Economists’ Study Group in January 1996. A survey of membersattending the meeting was used to identify those items of the full referees’ checklist thatshould be used by editors.
The final document reflects a broad consensus among the working party. Any differ-ences reflect different perspectives on the role of economic evaluation and the extent ofmembers’ interests in particular aspects of methodology rather than basic differencesover the need to improve standards of reporting.
Finally, in drafting the guidelines, the working party recognised that authors may not beable to address all the points in the published version of their paper. This being so, theymay care to submit supplementary documents (containing, for example, the details ofany economic model used) or refer the reader to other published sources.
Guidelines for submission of economic evaluations
The guidelines are given below, grouped in 10 sections under three headings: studydesign, data collection, and analysis and interpretation of results. Under each section isa commentary outlining the reasons for the requirements and the main unresolvedmethodological issues and explaining why firm guidelines cannot be given in somecases. The guidelines are designed to be read in conjunction with other more generalguidance to authors from the BMJ and the existing BMJ guidelines on statistical meth-ods.21
Study design (1) STUDY QUESTION
• The economic importance of the research question should be outlined.
• The hypothesis being tested, or question being addressed, in the economic evaluation should be clearly stated.
• The viewpoint(s) — for example, health care system, society — for the analysis should be clearly stated and justified.
The research question, or hypothesis, needs to satisfy three criteria.
Firstly, the question should be economically important (in terms of its resource implica-tions) and be relevant to the choices facing the decision maker. The question “Is healthpromotion worthwhile?” does not meet this criterion because it fails to specify alterna-tives — worthwhile compared with what? Furthermore, any alternatives need to be real-istic. An option of “doing nothing,” or maintaining the status quo, should be includedwhen appropriate.
Secondly, the question should be phrased in a way that considers both costs and out-comes. The research question “Is drug X more costly than the existing therapy?” will
APPENDIX B —Guidel ines for
Authors and PeerReviewers of
EconomicSubmissions
to the Brit ishMedical Journal

Format for Formulary Submissions, Version 2.1 w3
provide incomplete information because the decision maker also needs to considercomparative effectiveness.
Thirdly, the research question should clearly state the viewpoint of the economic eval-uation, and this should be justified. Possible viewpoints include those of the providerinstitution, the individual clinician or professional organisation, the patient or patientgroup, the purchaser of health care (or third party payer), and society itself. Forexample, hospital and other providers may need information to help in making pro-curement and related technology management decisions; individual clinicians toinform patient care decisions; health insurers or purchasers to support decisions onwhether to pay for a procedure or which services to develop; and patients to know thelevel of costs they may incur in travelling to hospital or providing informal nursingcare at home. The viewpoint chosen will in turn influence both the costs included inthe evaluation — for example, whether to limit these to a given department, hospital,or locality and whether patient costs are included — and the types of outcome meas-ured — for example, disease specific outcomes or generic measures of patients’ quality of life.
Health economists generally advocate adopting the broader societal viewpoint whenpossible. This is because data can usually be disaggregated and the analysis carriedout from a number of viewpoints. Also, the additional cost of adopting a broader per-spective at the outset of a study is probably less than the cost of attempting to gatheradditional information later. Researchers should therefore identify key potential deci-sion makers (government, purchaser, or provider) at the outset and be able to showthat the research question posed will meet the needs of all key groups.
(2) SELECTION OF ALTERNATIVES
• The rationale for choice of the alternative programmes or interventions for com-parison should be given.
• The alternative interventions should be described in sufficient detail to enable the reader to assess the relevance to his or her setting — that is, who did what, to whom, where, and how often.
APPENDIX B—Guidel ines for
Authors and PeerReviewers of
EconomicSubmissions
to the Brit ishMedical Journal
Different forms of economic evaluation
Study type Measurement of benefits Question posed
Cost minimisation analysis Benefits found to be equivalent Which is the most efficient way of achiev-ing a given goal (or objective)?
Cost effectiveness analysis Natural units (eg life years gained) or What is the most efficientCost-utility analysis Healthy years (eg quality adjusted way of spending a given
life years, healthy years equivalents) budget?
Cost-benefit analysis Monetary terms Should a given goal (or objective) be pursued to a greater or lesser extent?
4 w Academy of Managed Care Pharmacy
The choice of the alternative must be designed to help get as close a measure as possibleof the opportunity cost of using the new treatment. In principle the comparator shouldbe the most cost effective alternative intervention currently available. In practice thecomparator is usually the most widely used alternative treatment. Unless current prac-tice is “doing nothing,” it is usually best not to use placebo as the comparator. Such astudy could, however, if well conducted and reported, provide information for use inconjunction with studies of other treatments also compared with placebo.
The alternatives being compared should be described in enough detail to enable thereader to relate the information on costs and outcomes to the alternative courses ofaction. The use of decision trees and other decision analytic techniques (discussed insection 7) can help to clarify the alternative treatment paths being followed and providea framework for incorporating cost and outcome data. Clear exposition of alternativetreatment paths and the probabilities, cost, and outcomes linked to them should enabledecision makers to use those parts of the analysis that are relevant to their viewpoint.
(3) FORM OF EVALUATION
• The form(s) of evaluation used — for example, cost minimisation analysis, cost effectiveness analysis — should be stated.
• A clear justification should be given for the form(s) of evaluation chosen in rela-tion to the question(s) being addressed.
There are two types of question which require the use of different forms of evaluation(see box).
The first is: “Is it worth achieving this goal?” or “How much more or how much less ofsociety’s resources should be allocated to pursuing this goal?” Such questions can beanswered formally only by the use of cost-benefit analysis. Looking at one interventionalone, cost-benefit analysis addresses the question of whether its benefits are greaterthan its costs — that is, the best alternative use of the resources. When several compet-ing interventions are being considered the costs and benefits of each should be examinedand that combination which maximises benefits chosen.
The main practical problem with cost-benefit analysis is that of valuing benefits, such asthe saving of life or relief of pain, in money units. However, if we are to examinewhether more or less should be spent on health care, we need to find a way of compar-ing the costs (benefits forgone elsewhere) with the benefits of improved health and anyother resulting benefits. Even when all benefits cannot be measured in terms of money,cost-benefit analysis provides a useful framework for structuring decision making prob-lems.
The second type of question is: “Given that a goal is to be achieved, what is the mostefficient way of doing so?” or “What is the most efficient way of spending a givenbudget?” Such questions are addressed by cost effectiveness analysis, which can takeone of two forms. In the first the health effects of the alternatives are known to beequal, so only the costs need to be analysed, and the least costly alternative is the mostefficient. This type of analysis is often referred to as cost minimisation analysis.Secondly, alternatives may differ in both cost and effect, and a cost effectiveness ratio(cost per unit of health effect) is calculated for each. For example, given a fixed budget
APPENDIX B —Guidel ines for
Authors and PeerReviewers of
EconomicSubmissions
to the Brit ishMedical Journal

Format for Formulary Submissions, Version 2.1 w5
for dialysis, the modality (home dialysis, hospital dialysis, or continuous ambulatoryperitoneal dialysis) with the lowest cost per life year saved would, if implemented,maximise the amount of life years produced by the dialysis programme. In practice,however, the selection of the most efficient mix of programmes, given a budget con-straint, is more complicated: it depends on whether alternative programmes are mutu-ally exclusive and whether the scale of programmes can be changed without changingtheir incremental cost effectiveness ratios.
The concept “within a given budget” is also crucial. Often authors produce a ratio ofextra costs per extra unit of health effect for one intervention over another and arguethat a low cost effectiveness ratio, relative to other existing health care programmes,implies that a given intervention should be provided. However, judgment is stillrequired as the resources to meet such extra costs would inevitably come from anoth-er programme, from within or outside health care. (This point is returned to in section10.)
The third category of evaluation, cost-utility analysis, lies somewhere between costeffectiveness and cost benefit analysis. It can be used to decide the best way ofspending a given treatment budget or the health care budget. The basic outcome ofcost-utility analysis is “healthy years.” Years of life in states less than full health areconverted to healthy years by the use of health state preference values, resulting ingeneric units of health gain, such as quality adjusted life years (QALYs) or healthyyears equivalents.22 (These approaches are discussed in section 5.)
Data Collection (4) EFFECTIVENESS DATA
• If the economic evaluation is based on a single effectiveness study — for example, a clinical trial — details of the design and results of that study should be given — for example, selection of study population, method of allocation of subjects, whether analysed by intention to treat or evaluable cohort, effect size with confidence intervals.
• If the economic evaluation is based on an overview of a number of effectiveness studies details should be given of the method of synthesis or meta-analysis of evidence — for example, search strategy, criteria for inclusion of studies in the overview.
Economic evaluation of interventions relies on the assessment of their clinical effec-tiveness. The data can come from a single clinical study, a systematic overview ofseveral studies, or an ad hoc synthesis of several sources. Any limitations whichweaken the assessment of effectiveness weaken any economic evaluation based on it.The gold standard for assessing the efficacy of interventions is the randomised, dou-ble blind controlled trial. This design has the highest internal validity — that is, free-dom from bias.
In most clinical trials the primary assessment is based on an intention to treat analy-sis, which assesses the clinical outcomes of all randomised patients, whether or notthey completed their allocated treatment. Other analyses serve as secondary orexploratory analyses in clinical studies and should be justified if used as the primaryanalysis for the economic evaluation.
APPENDIX B —Guidel ines for
Authors and PeerReviewers of
EconomicSubmissions
to the Brit ishMedical Journal

6 w Academy of Managed Care Pharmacy
Clinical trials may include active or placebo controls. In active controlled studies theappropriate comparator for economic analysis is the most cost effective available thera-py, or the most widely used therapy. In placebo controlled studies the economic analysisshould indicate whether there are active comparators that could be considered as alterna-tive therapies.
The generalisability of the study population is important in assessing the results of clini-cal trials and hence their suitability for economic evaluations. Factors that can limitgeneralisability include: differences across countries or health systems; costs and bene-fits resulting only from the trial protocol but which would not arise in practice; unrealis-tically high compliance rates; or the appropriateness of usual practice in clinical studiesthat compare a therapy with best usual care. Clinical data from studies employing a“pragmatic” protocol are often more generalisable and hence preferable for economicevaluation.
In a pragmatic trial subjects are still randomised to treatment groups, but the patient anddoctor may not necessarily be blind to the treatments. The treatment protocol is alsokept as close to normal care as possible and monitoring kept to a minimum. Such trialsare attractive for economic analysis since they reflect what may happen in practice, butthe results apply only to similar settings. Unfortunately many clinical studies are stillperformed under fairly restrictive conditions, so some adjustments may be required foreconomic evaluation (discussed below).
Clinical data can also be generated from overviews or syntheses of clinical literature.Before the data from any such overview are used in economic assessments the methodsused for the overview, including the search strategy and the criteria for inclusion andexclusion of studies, need reporting.
Effectiveness data from overviews have the advantage that the confidence intervalaround the point estimate of clinical effect is usually narrower than that from an individ-ual trial and the result may be more generalisable. 23 Typically the economic analystwould take the point estimate of effect from the overview as the base case value and usethe confidence interval as the relevant range for sensitivity analysis (see section 9).
Sometimes clinical trial data may be insufficient for economic evaluation because someof the relevant endpoints have not been measured, patients have not been followed forlong enough, or the design was not pragmatic. In such cases it may be possible to adjustor supplement the data by modelling.
Ad hoc synthesis of effectiveness data from several sources, including expert opinion, isjustifiable when no relevant well controlled clinical studies have been performed.24 Inmany cases the economic evaluation may be based on a previously published clinicaltrial or systematic overview. In such a case it would be sufficient to provide a briefsummary, addressing the points in the guidelines, and to refer the reader to the publishedsource.
(5) BENEFIT MEASUREMENT AND VALUATION
• The primary outcome measure(s) for the economic evaluation should be clearly stated — for example, cases detected, life years, quality adjusted life years (QALYs), willingness to pay.
APPENDIX B —Guidel ines for
Authors and PeerReviewers of
EconomicSubmissions
to the Brit ishMedical Journal
Format for Formulary Submissions, Version 2.1 w7
• If health benefits have been valued details should be given of the methods used — for example, time trade off, standard gamble, contingent valuation — and the subjects from whom valuations were obtained — for example, patients, members of the general public, health care professionals.
• If changes in productivity (indirect benefits) are included they should be reported separately and their relevance to the study question discussed.
In cost effectiveness analysis benefits are usually measured in natural units. For pro-grammes whose main effect is to extend life the usual measure is life years gained.When the main effect is on quality of life a disease specific or generic quality of lifeindex might be used.
Sometimes the benefit measure may be an intermediate marker rather than a final out-come. For example, in comparing programmes for preventing coronary heart diseasereductions in blood pressure might be used. Similarly, if two antenatal screening pro-grammes are being compared cases detected might be chosen. Such intermediateendpoints need to be justified, however, as they may be poor surrogates for final out-comes.
Only a single measure can be used in the calculation of a given cost effectivenessratio. It cannot reflect the effects of a particular intervention on both quantity andquality of life; nor can more than one aspect of quality of life be expressed. Thisrestriction is the main limitation of cost effectiveness analysis, as other important ben-efits may be overlooked. Nevertheless, several cost effectiveness ratios could be cal-culated relating to different outcomes — but this may lead to problems of interpreta-tion. Authors using cost effectiveness analysis should explain why they have chosena particular outcome measure for calculation of the ratio and reassure the reader thatimportant outcomes are not being overlooked.
In cost-utility analysis the outcome is healthy years. Quality adjusted life years meas-ure healthy years by combining data on the life years gained by programmes with avalue (usually obtained from samples of patients or the population in general) reflect-ing the quality of those years. Two years of life in a health state judged to be halfwaybetween death and full health would be equivalent to one year in full health.Incremental health gain is given by the difference in quality adjusted life years pro-duced by one intervention as compared to another.
Rather than obtaining valuations for each health state and then multiplying by thetime spent in each, the use of healthy years equivalents requires a scenario of a speci-fied sequence of health states and their duration. Respondents are asked how manyhealthy years of life this scenario is equivalent to — hence the term “healthy yearsequivalents.”
Most methods of measuring quality adjusted life years and healthy years equivalentsare based on the notion of sacrifice. In economics something is not of value unlessone is prepared to give up something else in order to get it. For example, using atime trade off a respondent is asked how many years of life in a health state he or shewould be prepared to give up to be in full health. Using a “standard gamble” therespondent is asked to choose between a certain health state and a gamble with twopossible outcomes (one worse and the other better than the health state being valued).
APPENDIX B—Guidel ines for
Authors and PeerReviewers of
EconomicSubmissions
to the Brit ishMedical Journal
8 w Academy of Managed Care Pharmacy
Estimates obtained by time trade off methods reflect respondents’ attitudes to time aswell as their attitudes to the health state being valued. Likewise, estimates obtained bystandard gamble methods reflect respondents’ attitudes to risk as well as their attitudesto the health state being valued. Economists are still debating which approach is mostdesirable.
Another cheaper approach is to include in the clinical trial a generic health state prefer-ence instrument, such as the EuroQoL (EQ5D)25 or McMaster health utilities index.26
The responses from patients to a simple questionnaire can then be expressed as a healthstate preference value by reference to pre-scaled responses (obtained by standard gambleor time trade oft) from a relevant reference group.
Values can be provided by the population at large or by a sample of patients with thecondition for which the treatment is being evaluated. The choice depends on the per-spective of the study. If the issue is allocating resources between competing pro-grammes the former might be used; if it is deciding the best way to treat a given condi-tion the latter might be used. In reporting their results authors should explain why a par-ticular source of values has been used.
In cost-benefit analysis the benefits of health care are traditionally valued in moneyterms by using either the human capital approach or the willingness to pay approach.The former values a health improvement on the basis of future productive worth to soci-ety from being able to return to work. Values have to be imputed for activities such ashomemaking, so the human capital approach suffers from problems of how to valuehealth improvements for retired and unemployed people.27 This fairly narrow view ofthe value of improved health is rarely used nowadays.
Debate continues about whether productivity gains from improved health (“indirect ben-efits”) should be included alongside other measures of the value of improved health.Some analysts argue it introduces inequalities between those interventions that areaimed at individuals who could potentially return to productive activity return to produc-tive activity and those that are not. Other researchers are concerned about the potentialfor double counting if indirect benefits are calculated alongside another method of valu-ing improved health. Finally, some researchers are concerned about the standardmethod of measuring productivity gains, which values work days lost by gross earnings.Koopmanschap et al have proposed an approach for measuring productivity changes,
APPENDIX B —Guidel ines for
Authors and PeerReviewers of
EconomicSubmissions
to the Brit ishMedical Journal
Manuscript management flow diagram and checklists for editors
See page 43

Format for Formulary Submissions, Version 2.1 w9
called the friction cost method, which recognises that the amount of production lostdue to disease depends on the time an organisation needs to restore the initial produc-tion level.28 Whatever estimation method is used, indirect benefits should be reportedseparately so that readers can decide whether or not they should be included in theoverall result of the study.
The other approach values health improvement (or types of health care) on the basisof people’s willingness to pay for them — usually associated with individuals’ abilityto pay. If diseases affect rich and poor in different proportions, and if richer peopletend to have different preferences from poor people, then treatment of diseases of therich may appear to be “valued” more highly. A willingness to pay value will, to anextent, reflect ability to pay as well as strength of preference. It is the latter (strengthof preference) which reflects “values,” so when using willingness to pay a check isneeded for its association with income and social class.
Willingness to pay has advantages over techniques like quality adjusted life yearssince the latter focuses on valuation of health gains only, while willingness to paypermits respondents to take into account other factors (such as the value they attach tothe process of care). In some cases health gain is not even an issue. For example,two different ways of screening may simply provide information in different waysfrom those screened,29 and respondents will still have preferences which can beassessed by use of willingness to pay. Also, in some situations individuals other thanthe patient may be willing to pay for improved health — for example, in the case ofcommunicable diseases.
(6) COSTING
• Quantities of resources should be reported separately from the prices (unit costs) of those resources.
• Methods for the estimation of both quantities and prices (unit costs) should be given.
• The currency and price date should be recorded and details of any adjustment for inflation, or currency conversion, given.
Costing involves estimating the resources used — for example, days in hospital —and their prices (unit costs). These estimates must be reported separately to help thereader judge their relevance to his or her setting. When there are many cost itemsreporting should concentrate on the main costs.
When economic evaluations are undertaken alongside clinical trials data on physicalquantities may be gathered as part of the trial. The interpretation of resource useresulting from the trial protocol may, however, prove difficult. One view is thateverything done to a patient during a clinical trial could potentially influence out-come, so the costs of all procedures should be included. On the other hand, proce-dures such as clinic visits solely for data collection would not take place in regularclinical care and may seem unlikely to affect outcome. Authors should considerwhether the procedures followed in the trial are typical of normal clinical practice andshould justify any adjustments they make to the actual observed resource use.
APPENDIX B —Guidel ines for
Authors and PeerReviewers of
EconomicSubmissions
to the Brit ishMedical Journal
10 w Academy of Managed Care Pharmacy
Outside the context of a trial, estimates of resource quantities should be based on dataon real patients, collected either prospectively or retrospectively from medical records.The use of physician “expert panels” to estimate resource quantities, while common,runs the risk that respondents may give inaccurate estimates or specify the resourcesrequired for ideal care, rather than that provided in practice.
Prices of resources can be obtained from the finance departments of particular institu-tions or from national statistics, but charges (or fees) can differ from real costs. Theauthors of studies should comment on the extent to which the use of charges may biastheir estimates.
Guidelines on economic appraisal rarely discuss in detail whether the interventionsbeing compared should be costed at marginal or average cost. Marginal costs are theadditional costs of changes in the production of a service. Some authors claim the supe-riority of marginal costing over average costing, but this choice can be related to contextand timeframe. In the short run few costs may be variable if a change in treatment isintroduced, whereas over longer periods all resources, including buildings, can beswitched to other uses.
Thus if the study relates to a decision of a hospital manager the short run marginal costsof the various options in his or her hospital may be the relevant costs in the currentbudget period. If the decision relates to a matter of national policy, however, averagecosts may be more appropriate as these reflect the true variable costs when many servic-es are provided in a large number of facilities across the country.
Finally, the dates of both the estimates of resource quantities and prices should berecorded, along with details of any adjustments to a more recent price level. Also, atten-tion should be paid to the generalisation of cost estimates, since relative prices and theopportunities to redeploy resources may differ from place to place.30 Currency conver-sions should, when possible, be based on real purchasing power, rather than financialexchange rates, which fluctuate according to money market changes.31 32
(7) MODELLING
• Details should be given of any modelling used in the economic study — for example, decision tree model, epidemiology model, regression model.
• Justification should be given of the choice of the model and the key parameters.
Modelling techniques enable an evaluation to be extended beyond what has beenobserved in a single set of direct observations. The model will necessarily be simplified,and the extent to which the simplification is appropriate will be a matter of judgment.Modelling may involve explicit and recognised statistical or mathematical techniques. Itmay, however, simply bring together data from a variety of sources into a formal pre-specified conceptual framework, such as a decision analysis model incorporating bestavailable evidence from a wide variety of sources. It may be “what if” modelling,exploring what values for particular uncertain parameters would be needed for a treat-ment to be cost effective.
Modelling may be required (a) to extrapolate the progression of clinical outcomes (suchas survival) beyond that observed in a trial — for example, the progression of disease in
APPENDIX B —Guidel ines for
Authors and PeerReviewers of
EconomicSubmissions
to the Brit ishMedical Journal

Format for Formulary Submissions, Version 2.1 w11
patients with asymptomatic AIDS33; (b) to transform final outcomes from intermediatemeasures — for example, survival and coronary heart disease events from cholesterolconcentrations34; (c) to examine the relation between inputs and outputs in productionfunction models to estimate or apportion resource use — for example, in a cost analy-sis of neonatal intensive care35; (d) to use data from a variety of sources to undertake adecision analysis — for example, of screening options for prostate cancer36; (e) to useevidence from trials, or systematic reviews of trials, to reflect what might happen in adifferent clinical setting or population — for example, treatments for respiratory dis-tress syndrome in preterm infants.37
The key requirements are that the modelling should be explicit and clear. The authorsshould explain which of the reported variables/parameters have been modelled ratherthan directly observed in a particular sample; what additional variables have beenincluded or excluded; what statistical relations have been assumed or derived; andwhat evidence supports these assumptions or derivations.
All this information may not be included in the published paper, but it should beavailable to the reviewer. The overall aim of published reports should be to ensuretransparency so that the importance and applicability of the methods can be clearlyjudged (see section 9).
Analysis and interpretation of results (8) ADJUSTMENTS FOR TIMING OFCOSTS AND BENEFITS
• The time horizon over which costs and benefits are considered should be given.
• The discount rate(s) should be given and the choice of rate(s) justified.
• If costs or benefits are not discounted an explanation should be given.
The time horizon should be long enough to capture all the differential effects of theoptions. It should often extend to the whole life of the treated individuals and even tofuture generations. If the time horizon is shortened for practical reasons this decisionshould be justified and an estimate made of any possible bias introduced. Justifying ashort time horizon on the grounds of the duration of the available empirical evidencemay be fallacious.38 If the relevant horizon for the decision is long term additionalassumptions may need to be made.
In health care there is a still debate on discounting.39 40 Most analysts agree that costsshould be discounted in any study having a time horizon longer than one year. Atpresent most recommendations seem to vary between 3 and 6%, and a common ratein the literature is 5% per year. Certainly the analyst should use the government rec-ommended rate, probably as the baseline value, and provide a sensitivity analysiswith other discount rates. It is also helpful to provide the undiscounted data to allowthe reader to recalculate the results using any discount rate.
Most analysts argue that health benefits should be discounted at the same rate as costsin the baseline analysis, even if they are expressed in non-monetary units, such as lifeyears or quality adjusted life years. A zero discount rate — or one lower than thatused for costs — can be introduced in the sensitivity analysis. A lower rate is advo-cated so as not to penalise preventive programmes and also because the results ofsome studies seem to suggest it.39
APPENDIX B—Guidel ines for
Authors and PeerReviewers of
EconomicSubmissions
to the Brit ishMedical Journal
12 w Academy of Managed Care Pharmacy
However, there is no a priori economic reason to favour preventive programmes and thecomparisons may be between them. Imagine two programmes having the same dis-counted costs and the same total (undiscounted) amount of benefits, say 100 life years,but programme A obtains these benefits between years 2 and 3 and programme Bbetween years 52 and 53. Not discounting health benefits would result in both pro-grammes having the same cost effectiveness ratio, which seems absurd. Moreover, ifthe absolute benefits of programme B were 100 years and 1 day, it would be preferred— again absurdly.
It is doubtful if there is enough empirical evidence on which to base a decision on theappropriate discount rate. Moreover, if the empirical argument is accepted it should alsobe applied to the discounting of costs. In favour of a single discount rate for costs andbenefits are, firstly, consistency between cost effectiveness and cost-benefit analysis and,secondly, the idea that it is always possible to transform wealth (resources) into health atany point in time. Then, if resources are discounted, why should health not be discounted?
Given the current debates about discounting, the main emphasis should be on trans-parency in reporting the methods used.
(9) ALLOWANCE FOR UNCERTAINTY
• When stochastic data are reported details should be given of the statistical tests performed and the confidence intervals around the main variables.
• When a sensitivity analysis is performed details should be given of the approach used — for example, multivariate, univariate, threshold analysis — and justifica-tion given for the choice of variables for sensitivity analysis and the ranges over which they are varied.
A recent review suggested that one in four published economic evaluations failed toconsider uncertainty at all, and only one in eight handled it well. Without proper con-sideration of uncertainty the reader may be unable to judge whether conclusions aremeaningful and robust.41
At least three broad types of uncertainty are recognised.42
Uncertainty relating to observed data inputs — When observed data have been sampledfrom an appropriate population standard statistical methods should be used. Typically,confidence intervals might be presented. When both costs and effects have been derivedfrom a single set of individual patient data a stochastic approach may be used to thepresentation of the confidence intervals surrounding the cost effectiveness ratio.43 44 45
When data come from a sample attention should also be given to sample size and power.In many studies alongside clinical trials sample size may have been determined entirelyby clinical endpoints. In some cases a subsample is assumed to be adequate for collect-ing data on resource use, but in many cases the variability in resource use data is greaterthan for clinical parameters, and the distribution of values is often non-normal.Attention must be paid to whether sample sizes are adequate for the economic analyses.Ideally power calculations should be presented.
APPENDIX B—Guidel ines for
Authors and PeerReviewers of
EconomicSubmissions
to the Brit ishMedical Journal
Format for Formulary Submissions, Version 2.1 w13
Uncertainty relating to extrapolation — When data have been extrapolated or mod-elled (see section 7) the uncertainty inherent in that process is best handled by appro-priate sensitivity analysis.
Uncertainty relating to analytical methods — Uncertainties may stem from the exis-tence of alternative analytical methods. Some issues will be avoided by an explicitstatement of the approach to be adopted, but others may be usefully handled by usingsensitivity analysis — for example, to present results for different discount rates, orwith and without indirect costs.
Except for sampled data, uncertainty is usually handled using some form of sensitivi-ty analysis. Simple sensitivity analysis (one way or multi-way), threshold analysis,analysis of extremes, and probabilistic sensitivity analysis may each be appropriate inparticular circumstances.42 The ranges of values tested need to be justified and ideallyshould be based on evidence or logic.
Authors and reviewers should pay particular attention to whether the important ques-tion is the precision of the quantitative results or the robustness of the conclusionsdrawn from them. Firm conclusions may be shown to hold despite considerableuncertainty; on the other hand, relatively tight estimates of parameters may still leavesubstantial uncertainty about the policy implications of the study.
(10) PRESENTATION OF RESULTS
• An incremental analysis — for example, incremental cost per life year gained —should be reported, comparing the relevant alternatives.
• Major outcomes — for example, impact on quality of life — should be presentedin a disaggregated as well as aggregated form.
• Any comparisons with other health care interventions — for example, in terms of relative cost effectiveness — should be made only when close similarity in study methods and settings can be demonstrated.
• The answer to the original study question should be given; any conclusions should follow clearly from the data reported and should be accompanied by appropriate qualifications or reservations.
The main emphasis in the reporting of study results should be on transparency. Themain components of cost and benefit — for example, direct costs, indirect costs, lifeyears gained, improvements in quality of life — should be reported in a disaggregatedform before being combined in a single index or ratio.
The results of economic evaluations are usually presented as a summary index suchas a cost effectiveness or cost-utility ratio. When two or more interventions are beingcompared in a given study, the relevant ratio is the one that relates the additional (orincremental) benefits to the additional costs. Reporting disaggregated data allows thereader to calculate other ratios that he or she sees fit.
Beyond the individual study the reporting and interpretation of cost effectivenessratios need to be handled with care. For example, authors often compare the costeffectiveness ratios generated in their own study with those for other interventionsevaluated in previous studies in “league tables,” where rankings are produced, rang-
APPENDIX B —Guidel ines for
Authors and PeerReviewers of
EconomicSubmissions
to the Brit ishMedical Journal

14 w Academy of Managed Care Pharmacy
ing from the intervention with the lowest cost per life year (or cost per quality adjustedlife year) gained to the one with the highest.
Study design: (1) The research question is stated (2) The economic importance of theresearch question is stated (3) The viewpoint(s) of the analysis are clearly stated and jus-tified (4) The rationale for choosing the alternative programmes or interventions com-pared is stated (5) The alternatives being compared are clearly described (6) The form ofeconomic evaluation used is stated (7) The choice of form of economic evaluation is jus-tified in relation to the questions addressed
Data collection: (8) The source(s) of effectiveness estimates used are stated (9) Detailsof the design and results of effectiveness study are given (if based on a single study)(10) Details of the method of synthesis or meta-analysis of estimates are given (if basedon an overview of a number of effectiveness studies) (11) The primary outcome meas-ure(s) for the economic evaluation are clearly stated (12) Methods to value health statesand other benefits are stated (13) Details of the subjects from whom valuations wereobtained are given (14) Productivity changes (if included) are reported separately (15)The relevance of productivity changes to the study question is discussed (6) Quantitiesof resources are reported separately from their unit costs (17) Methods for the estimationof quantities and unit costs are described (18) Currency and price data are recorded (19)Details of currency of price adjustments for inflation or currency conversion are given(20) Details of any model used are given (21) The choice of model used and the keyparameters on which it is based are justified
APPENDIX B —Guidel ines for
Authors and PeerReviewers of
EconomicSubmissions
to the Brit ishMedical Journal
Referees’ checklist (also to be used, implicitly, by authors)
Item Yes No Not Clear Not Appropriate
Analysis and interpretation of results
(22) Time horizon of costs and benefits is stated(23) The discount rate(s) is stated(24) The choice of rate(s) is justified(25) An explanation is given if costs or benefits are not discounted(26) Details of statistical tests and confidence intervals are given for stochastic data(27) The approach to sensitivity analysis is given(28) The choice of variables for sensitivity analysis is justified(29) The ranges over which the variables are varied are stated(30) Relevant alternatives are compared(31) Incremental analysis is reported(32) Major outcomes are presented in a dissaggregated as well as aggregated form(33) The answer to the study question is given(34) Conclusions follow from the data reported(35) Conclusions are accompanied by the appropriate caveats
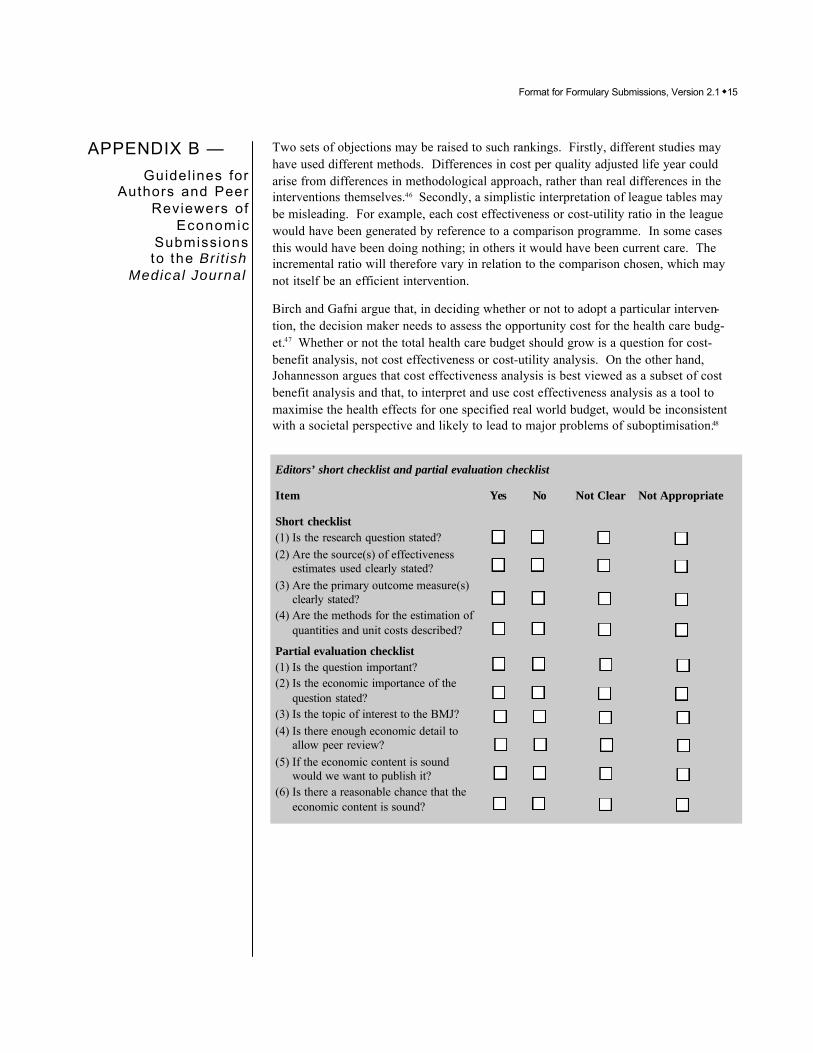
Format for Formulary Submissions, Version 2.1 w15
Two sets of objections may be raised to such rankings. Firstly, different studies mayhave used different methods. Differences in cost per quality adjusted life year couldarise from differences in methodological approach, rather than real differences in theinterventions themselves.46 Secondly, a simplistic interpretation of league tables maybe misleading. For example, each cost effectiveness or cost-utility ratio in the leaguewould have been generated by reference to a comparison programme. In some casesthis would have been doing nothing; in others it would have been current care. Theincremental ratio will therefore vary in relation to the comparison chosen, which maynot itself be an efficient intervention.
Birch and Gafni argue that, in deciding whether or not to adopt a particular interven-tion, the decision maker needs to assess the opportunity cost for the health care budg-et.47 Whether or not the total health care budget should grow is a question for cost-benefit analysis, not cost effectiveness or cost-utility analysis. On the other hand,Johannesson argues that cost effectiveness analysis is best viewed as a subset of costbenefit analysis and that, to interpret and use cost effectiveness analysis as a tool tomaximise the health effects for one specified real world budget, would be inconsistentwith a societal perspective and likely to lead to major problems of suboptimisation.48
APPENDIX B —Guidel ines for
Authors and PeerReviewers of
EconomicSubmissions
to the Brit ishMedical Journal
Editors’ short checklist and partial evaluation checklist
Item Yes No Not Clear Not Appropriate
Short checklist(1) Is the research question stated?(2) Are the source(s) of effectiveness
estimates used clearly stated?(3) Are the primary outcome measure(s)
clearly stated?(4) Are the methods for the estimation of
quantities and unit costs described?
Partial evaluation checklist(1) Is the question important?(2) Is the economic importance of the
question stated?(3) Is the topic of interest to the BMJ?(4) Is there enough economic detail to
allow peer review?(5) If the economic content is sound
would we want to publish it?(6) Is there a reasonable chance that the
economic content is sound?
16 w Academy of Managed Care Pharmacy
In practice, the answer may lie in the way the results of economic evaluations are inter-preted. Published data are inevitably specific to a context and will need some reinter-pretation by decision makers in other settings. Transparency in reporting can help deci-sion makers generalise results from one setting to another.
Finally, apart from being modest about the generalisability of their results, authorsshould ensure that their analysis is relatively conservative. Sensitivity analysis plays animportant part here, and enough results should be presented to enable the reader toassess the robustness of the study conclusions.
Evaluating the guidelines
We intend to evaluate the guidelines. The options are still under discussion, but theevaluation will probably focus on four questions:
(1) Do the guidelines help BMJ editors filter out unpublishable economic studies at an early stage? This has two components: (a) distinguishing full economic evaluations from other types of economic submissions and (b) avoiding wast-ing time refereeing papers that are fundamentally flawed. This question could be answered by undertaking a study of economic submissions before and after the publication of the guidelines.
(2) How satisfied are editors, reviewers, and authors with their respective check-lists? This question could be answered by assessing the checklists with a questionnaire.
(3) Do the guidelines improve the quality of referees’ reports on economic evalu-ations? This question could be answered by a prospective study to compare reports from reviewers who had and had not been asked to apply the referees’ checklist.
(4) Do the guidelines improve the quality of the economic evaluations that are eventually published? This is probably the most difficult question to answer, since it requires a view to be taken about the methodological principles of economic evaluation. However, the evaluation might focus on the trans-parency of reporting of results, since the main objective of the guidelines is to improve this. Again, a prospective evaluation would be required, comparing the version of economic evaluations submitted to the BMJ with the version eventually published. We forsee two practical problems with this componentof the evaluation. Firstly, the BMJ currently receives only a limited number of full economic evaluations, so a prospective study might take some time. Secondly, it will be difficult to separate out the distinctive contribution of theguidelines from the benefits of the peer review process more generally.
Members of the working party were: M Buxton, London; V Demicheli, Pavia, Italy; CDonaldson, Aberdeen; M Drummond (chair), York; S Evans, London; TO Jefferson (sec-retary), Aldershot, UK; B Jonsson, Stockholm; M Mugford, Oxford; D Rennie, Chicago;J Rovira, Barcelona; F Rutten, Rotterdam; K Schulman, Washington, DC; R Smith (edi-tor, BMJ), London; A Szczepura, Warwick, UK; A Tonks (assistant editor, BMJ),London; G Torrance, Hamilton, Canada; A Towse, London.
APPENDIX B—Guidel ines for
Authors and PeerReviewers of
EconomicSubmissions
to the Brit ishMedical Journal
Format for Formulary Submissions, Version 2.1 w17
We thank Vanessa Windass and Gaby Shockley for secretarial help and an anonymousreferee for helpful comments.
Funding: Since no funding was sought for this project we thank our own institutionsfor bearing the cost.
Conflict of interest: None.
1 Elixhauser A, ed. Health care cost benefit and cost-effectiveness analysis (cost benefit analysis/cost effectiveness analysis). From 1979 to 1990: a bibliography. Medical Care 1993;31 (suppl):JS1–149.
2 Gerard K. Cost-utility in practice: a policy maker’s guide to the state of the art. Health Policy 1992;21 :249–79. [Medline]
3 Udvarhelyi S, Colditz GA, Rai A, Epstein AM. Cost-effectiveness and cost benefit analyses in the medical literature. Are methods being used correctly? Ann Intern Med 1992: 116:238–44.
4 Adams ME, McCall NT, Gray DT, Orza MJ, Chalmers TC. Economic analysis in randomised controlled trials. Medical Care 1992;30:231–8. [Medline]
5 Jefferson TO, Demicheli V. Is vaccination against hepatitis B efficient? A review of world literature. Health Economics 1994; 3:25–37.
6 Williams AH. The cost-benefit approach. Br Med Bull 1974;30:252–6. [Medline]
7 Drummond MF, Brandt A, Luce B, Rovira J. Standardising methodologies for eco-nomic evaluation in health care. International Journal of Technology Assessment in Health Care 1993;9:26–36. [Medline]
8 Commonwealth Department of Health, Housing and Community Services. Guidelines for the pharmaceutical industry on preparation of submissions to the pharmaceutical benefits advisory committee. Canberra: Australian Government Publishing Service, 1992.
9 Ministry ofHealth (Ontario). Ontario guidelines for economic analysis of pharma-ceutical products. Toronto: Ministry of Health, 1994.
10 Clemens K, Townsend R, Luscombe F, Mauskopf J, Osterhaus J, Bobula J. Methodological and conduct principles for pharmacoeconomic research. Pharmacoeconomics 1995;8: 169–74. [Medline]
11 Department of Health and Association of British Pharmaceutical Industry. Guidelines for the economic evaluation of pharmaceuticals [press release]. London: Department of Health, 1994.
12 Canadian Coordinating Office for Health Technology Assessment. Guidelines for economic evaluation of pharmaceuticals: Canada. Ottawa: CCOHT A, 1994.
APPENDIX B —Guidel ines for
Authors and PeerReviewers of
EconomicSubmissions
to the Brit ishMedical Journal
18 w Academy of Managed Care Pharmacy
13 Task Force on Principles for Economic Analysis of Health Care Technology. Economic analysis of health care technology. A report on principles. Ann Intern Med1995;123:61–70. [Medline]
14 NHS Centre for Reviews and Dissemination. The NHS economic evaluation data-base. York: CRD, 1996.
15 Kassirer JP, Angel M. The journal’s policy on cost effectiveness analyses. N Engl J Med 1994;331:669–70. [Medline]
16 Schulman K, Sulmasy DP, Roney D. Ethics, economics and the publication policies of major medical journals. JAMA 1994;272: 154–6. [Medline]
17 Jefferson TO, Demicheli V. Are guidelines for peer reviewing economic evaluations necessary? A survey of current editorial practice. Health Economics 1995;4:383–8. [Medline]
18 Smith R. Conflict of interest and the BMJ. BMJ 1994;308:4–5. [Full Text]
19 Drummond, MF, Stoddart GL, Torrance oW. Methods for the economic evaluation of health care programmes. Oxford: Oxford University Press, 1987.
20 Jefferson TO, Demicheli V, Entwistle V. Assessing quality of economic submissions to the BMJ. BMJ 1995;311:393–4. [Full Text]
21 Guidelines for referees. BMJ 1996;312:41–4. [Full Text]
22 Mehrez A, Gafni A. Quality-adjusted life years, utility theory and healthy years equivalents. Medical Decision Making 1989;9:142–9. [Medline]
23 Mugford M, Kingston J, Chalmers I. Reducing the incidence of infection after caesarean section: implications of prophylaxis with antibiotics for hospital resources. BMJ 1989;299:1003–6. [Medline]
24 Sackett DL, Haynes RB, Guyatt GH, Tugwell P. Clinical epidemiology: a basic sci-ence for clinical medicine. 2nd ed. Boston: Little Brown, 1991.
25 Kind P. The EuroQoL Instrument: an index of health-related quality of life. In Spilker B, ed. Quality of life and pharmacoeconomics in clinical trials. 2nd ed. Philadelphia: Lippincott-Raven, 1996:191–202.
26 Feeny D, Furlong W, Boyle M, Torrance aw. Multi-attribute health status classifica-tion systems: health utilities index. PharmacoEconomics 1995;7:490–502. [Medline]
27 A vorn J. Benefit and cost analysis in geriatric care: turning age discrimination into health policy. N EnglJ Med 1994;310:1294–1300.
28 Koopmanschap MA, Rut ten FFH, van Ineveld BM, van Roijen L. The friction cost method for measuring indirect costs of disease. Journal of Health Economics 1995;14: 171–89. [Medline]
29 Wald N. Couple screening for cystic fibrosis. Lancet 1991;338:1318. [Medline]
APPENDIX B —Guidel ines for
Authors and PeerReviewers of
EconomicSubmissions
to the Brit ishMedical Journal

Format for Formulary Submissions, Version 2.1 w19
30 Drurnrnond MF, Bloom BS, Carrin a, Hillman AL, Hutchings HC, Knill-Jones RP, et al. Issues in the cross-national assessment of health technology. International Journal of Technology Assessment in Health Care 1992;8:671–82. [Medline]
31 Organisation for Economic Cooperation and Development. Purchasing power pari-ties. Paris: OECD, 1993.
32 World Bank. World development report 1993. New York: Oxford University Press, 1993.
33 Schulman KA, Lynne LA, alick HN, Eisenberg JM. Cost-effectiveness oflow-dose zidovudine therapy for asymptomatic patients with human immunodeficiency virus (HIV) infection. Ann Intern Med 1991;114:798–801. [Medline]
34 Oster a, Epstein AM. Cost-effectiveness of antihyperlipidemic therapy in the pre-vention of coronary heart disease: the case of cholestyramine. JAMA 1987;258:2381–7 .[Medline]
35 Fordham R, Field Dl, Hodges S, Normand C, Mason E, Burton P, et al. Cost of neonatal care across a health authority. J Pub Health Med 1992;61:127–30.
36 Krahn MD, Mahoney JE, Eckman MH, Trachtenberg l, Pauker sa, Detsky AS. Screening for prostate cancer: a decision analytic view. JAMA 1994;272:773–80. [Medline]
37 Egberts J. Estimated costs of different treatments of the respiratory distress syn-drome in a large cohort of preterm infants of less than 30 weeks gestation. Biology of the Neonate 1992;61:59–85. [Medline]
38 Schulman KA, Yabroff R, Glick H. A health services approach for the evaluation of innovative pharmaceutical and biotechnology products. Drug Information Journal1995;29:1405–14.
39 Parsonage M, Neuburger H. Discounting and health benefits. Health Economics1992;1:71–6. [Medline]
40 Cairns J. Discounting and health benefits: another perspective. Health Economics1992;1:76–9. [Medline]
41 Briggs A, Sculpher M. Sensitivity analysis in economic evaluation: a review ofpub-
lished studies. Health Economics 1995;4(5):355–72.
42 Briggs AH, Sculpher Ml, Buxton MJ. Uncertainty in the economic evaluation of health care technologies: the role of sensitivity analysis. Health Economics1994;3:95–104. [Medline]
43 O’Brien B, Drummond MF, Labelle R, Willan A. In search ofpower and signifi-cance: issues in the design and analysis of stochastic economic appraisals. Medical Care 1994;32:150–63. [Medline]
44 van Hout BA, Al MJ, Gordon GS, Rutten FFH. Costs, effects and cost effectiveness ratios alongside a clinical trial. Health Economics 1995;3(5):309–19.
APPENDIX B—Guidel ines for
Authors and PeerReviewers of
EconomicSubmissions
to the Brit ishMedical Journal
20 w Academy of Managed Care Pharmacy
45 Wakker P, Klaassen MF. Confidence intervals for cost effectiveness ratios. Health Economics 1995;4(5):373–81.
46 Drummond, MF, Mason J, Torrance G. Cost-effectiveness league tables: more harm than good? Soc Sci Med 1993;37:33–40.
47 Birch S, Gafni A. Cost-effectiveness ratios: in a league of their own. Health Policy1994;28:133–41. [Medline]
48 Johannesson M. The relationship between cost effectiveness analysis and cost bene-fit analysis. Soc Sci Med 1995;41:483–9. [Medline]
(Accepted 11 July 1996)
This article has been cited by other articles:
• Kernick, D P (1998). Economic evaluation in health: a thumb nail sketch. BMJ316:1663–1665 [Full text]
• Coast, J., Richards, S. H, Peters, T. J, Gunnell, D. J, Darlow, M. A., Pounsford, J. (1998). Hospital at home or acute hospital care? A cost minimisation analysis. BMJ 316:1802–1806 [Abstract] [Full text]
• Kernick, D P (1998). Personal paper: Has health economics lost its way? BMJ 317:197–199 [Full text]
• Barber , J. A, Thompson, S. G (1998). Analysis and interpretation of cost data in randomised controlled trials: review of published studies. BMJ 317:1195–1200 [Abstract] [Full text]
• Briggs, A. H, Gray, A. M (1999). Methods in health service research: Handling uncertainty in economic evaluations of healthcare interventions. BMJ 319:635–638 [Full text]
• Elkabir, J. J, Patel, A., Vale, J. A, Witherow, R. O’N, Emberton, M., Anson, K. (1999). Acute urinary retention in men. BMJ 319:1004–1004 [Full text]
• Lattimer, V., Sassi, F., George, S., Moore, M., Turnbull, J., Mullee, M., Smith, H. (2000). Cost analysis of nurse telephone consultation in out of hours primary care: evidence from a randomised controlled trial. BMJ 320:1053–1057 [Abstract] [Full text]
• Cook, J. R. (1999). Challenges In Economic Outcomes Research. Hepatology29: 23–25 [Abstract] [Full text]
APPENDIX B —Guidel ines for
Authors and PeerReviewers of
EconomicSubmissions
to the Brit ishMedical Journal

Format for Formulary Submissions, Version 2.1 w21
APPENDIX B—Guidel ines for
Authors and PeerReviewers of
EconomicSubmissions
to the Brit ishMedical Journal
Economic submissions(A paper that makes explicit comments about resource allocation
or costs of intervention)
Editorial screening(Are costs and consequences of competing alternatives considered?)
Full economic evaluation Not a full economic evaluation
Editors’ short checklist(1) Is the research question stated?(2) Are the source(s) of effective-
ness estimates used clearly stated?
(3) Are the primary outcome meas-ure(s) clearly stated?
(4) Are the methods for the estima-tion of quantities and unit costs described?
Partial evaluation checklist(1) Is the question important?(2) Is the economic importance of
the question stated?(3) Is the topic of interest to the
BMJ?(4) Is there enough economic detail
to allow peer review?(5) If the economic content is
sound would we want to publish it?
(6) Is there a reasonable chance that the economic content is sound?
Yes No
Referee and referees’ checklist
Editorial decision Editorial decision Editorial decision
Yes to all No to one or more
Referee(and relevant
section ofreferees’checklist)
Minimaleconomic
input paper
1
A Report of the ISPOR Health Science Committee –
Task Force on Good Research Practices – Modeling Studies Task Force Chair Milton C. Weinstein PhD, Center for Risk Analysis, Harvard School of Public Health, Boston,
Massachusetts, and Innovus Research, Inc., Medford, Massachusetts, USA. Core Group Chris McCabe MSc, Senior Lecturer in Health Economics, Trent Institute for Health Services
Research, University of Sheffield, Sheffield, UK. John Hornberger MD, MS, Acumen, LLC, and Stanford University School of Medicine, Stanford, California, USA.
Joseph Jackson PhD, Group Director, Pharmaceutical Research Institute, Bristol-Myers Squibb, Princeton, New Jersey, USA.
Magnus Johannesson PhD, Associate Professor, Centre for Health Economics, Stockholm School of Economics, Stockholm, Sweden.
Bryan R. Luce PhD, Senior Research Leader and CEO, MEDTAP International, Bethesda, Maryland, USA.
Bernie O’Brien PhD, Professor, Department of Clinical Epidemiology and Biostatistics, McMaster University, Hamilton, Ontario, Canada
Reference Group Andrea K. Biddle MPH, PhD, Associate Professor, Department of Health Policy and Administration,
School of Public Health, University of North Carolina at Chapel Hill, Chapel Hill, NC, USA. Donald Chafin MD, MS, Director, SICU/Associate Professor of Medicine & Epidemiology, Beth Israel
Medical Center/Albert Einstein College of Medicine, New York, NY, USA. Daniel Halberg PhD, Assistant Professor, University of Arkansas for Medical Sciences, Little Rock,
AK, USA. Matthew Rousculp MPH, The University of Alabama at Birmingham, Birmingham, AL, USA. Phantipa Sathkong MS, Faculty of Pharmaceutical Sciences, Chulalongkorn University, Pathumwan,
Bangkok, Thailand. Daniel Sarpong PhD, Associate Professor of Biostatistics, College of Pharmacy, Xavier University of
Louisiana, New Orleans, LA, USA. Hemal Shah PharmD, Director, Boehringer Ingelheim Pharmaceuticals, Inc., Ridgefield, CN, USA. Mendel Singer PhD, Assistant Professor, Case Western Reserve University, Cleveland, OH, USA. Dong-Churl Suh PhD, Assistant Professor, Rutgers University, College of Pharmacy, Piscataway, NJ
USA. John Walt MBA, Manager, Global Pharmacoeconomic Strategy & Research, Allergan, Irvine, CA,
USA. Leslie Wilson PhD, MS Adjunct Assistant Professor, University of California San Francisco, San
Francisco, California, CA, USA. This report was published in Value in Health as follows. The citation for this report is: Weinstein MC, O'Brien B, Hornberger J, et al. Principles of good practice of decision analytic modeling in health care evaluation: Report of the ISPOR Task Force on Good Research Practices-Modeling Studies. Value Health 2003; 6:9-17
APPENDIX C

2
Principles Of Good Practice For Decision Analytic Modeling In Health Care Evaluation: Report of the ISPOR Task Force on Good Research Practices – Modeling Studies
Milton C. Weinstein PhD1 (Chair), Bernie O’Brien PhD2, John Hornberger MD, MS3, Joseph Jackson PhD4, Magnus Johannesson PhD5, Chris McCabe MSc6, Bryan R. Luce PhD7
1 Center for Risk Analysis, Harvard School of Public Health, Boston, Massachusetts, and Innovus Research, Inc., Medford, Massachusetts, USA. 2 Department of Clinical Epidemiology and Biostatistics, McMaster University, Hamilton, Ontario, Canada. 3 Acumen, LLC, and Stanford University School of Medicine, Stanford, California, USA. 4 Pharmaceutical Research Institute, Bristol-Myers Squibb, Princeton, New Jersey, USA. 5 Centre for Health Economics, Stockholm School of Economics, Stockholm, Sweden. 6 Trent Institute for Health Services Research, University of Sheffield, Sheffield, UK. 7 MEDTAP International, Bethesda, Maryland, USA.
ABSTRACT OBJECTIVES: Mathematical modeling is used widely in economic evaluations of pharmaceuticals and other health care technologies. Users of models in government and the private sector need to be able to evaluate the quality of models according to scientific criteria of good practice. This report describes the consensus of a task force convened to provide modelers with guidelines for conducting and reporting modeling studies.
METHODS: The task force was appointed with the advice and consent of the Board of Directors of ISPOR. Members were experienced developers or users of models, worked in academia and industry, and came from several countries in North America and Europe. The task force met on three occasions, conducted frequent correspondence and exchanges of drafts by electronic mail, and solicited comments on three drafts from a core group of external reviewers and more broadly from the membership of ISPOR.
RESULTS: Criteria for assessing the quality of models fell into three areas: model structure, data used as inputs to models, and model validation. Several major themes cut across these areas. Models and their results should be represented as aids to decision making, not as statements of scientific fact; therefore, it is inappropriate to demand that models be validated prospectively prior to use. However, model assumptions regarding causal structure and parameter estimates should be continually assessed against data, and models revised accordingly. Structural assumptions and parameter estimates should be reported clearly and explicitly, and opportunities for users to appreciate the conditional relationship between inputs and outputs should be provided through sensitivity analyses.
CONCLUSIONS: Model-based evaluations are a valuable resource for health-care decision makers. It is the responsibility of model developers to conduct modeling studies according to the best practicable standards of quality and to communicate results with adequate disclosure of assumptions and with the caveat that conclusions are conditional upon the assumptions and data upon which the model is built.
INTRODUCTION
Mathematical modeling is used widely in economic evaluations of pharmaceuticals and other health care technologies. The purpose of modeling is to structure evidence on clinical and economic outcomes in a form that can help to inform decisions about clinical practices and health-care resource allocations.

3
Models synthesize evidence on health consequences and costs from many different sources, including data from clinical trials, observational studies, insurance claim databases, case registries, public health statistics, and preference surveys. A model is a logical mathematical framework that permits the integration of facts and values, and that links these data to outcomes that are of interest to health-care decision makers. For decisions about resource allocation, the end result of a model is often an estimate of cost per quality-adjusted life year (QALY) gained or other measure of value-for-money. Although evidence from randomized clinical trials (RCTs) remains central to efficacy testing, taken alone it can be misleading if endpoints are not translated into measures that are valued by patients, providers, insurers, and the general public. For example, suppose that an RCT demonstrates that a treatment reduces the risk of a rare sequela of a chronic disease by 50%. Further, suppose that another trial shows that a different treatment reduces the risk of a different, more common, sequela by 10%. The latter intervention may well be more effective, and cost-effective, than the former, but a simple comparison of the trial results would not suffice. However, a model could be helpful in revealing that fact to decision makers. The comparison between the two interventions would depend on a synthesis of evidence on the incidence of the sequelae in the target population, the relative risk reductions offered by treatment, survival and quality of life with and without the sequelae, and the costs of the interventions and the medical care required to diagnose and treat the sequelae. The value of a model lies not only in the results it generates, but also in its ability to reveal the logical connection between inputs (i.e., data and assumptions) and outputs in the form of valued consequences and costs. For this reason, a model should not be a “black box” for the end-user but be as transparent as possible, so that the logic behind its results can be grasped at an intuitive level. Also for this reason, model results should never be presented as point estimates, or as unconditional claims of effectiveness or cost. Instead, the outputs of models should be represented as conditional upon the input data and assumptions, and they should include extensive sensitivity analysis to explore the effects of alternative data and assumptions on the results.
The purpose of this document is to state a consensus position of the ISPOR Task Force on Good Research Practices – Modeling Studies. Like models themselves, this position represents the best judgment of the Task Force at this time, and is subject to change as new technologies for modeling emerge, through advances in computing and analysis, and as fundamentally new dimensions of health care technology and the environment, such as genomic or microbial resistance to drugs, become more pervasive.
TASK FORCE PROCESS
The Chair of the ISPOR Task Force on Good Research Practices -- Modeling Studies, Milton C. Weinstein, was appointed in 2000 by the Chairman of the ISPOR Health Sciences Committee, Bryan R. Luce. The members of the Task Force were invited to participate by the Chair, with advice and consent from the ISPOR Board of Directors. We sought individuals who were experienced as developers or users of pharmacoeconomic models, who were recognized as scientific leaders in the field, who worked in academia, industry, and as advisors to governments, and who came from several countries. A reference group of ISPOR members was also identified as individuals from whom comments would be sought. The Task Force held its first meeting at the Annual North American Scientific Meeting of ISPOR in Arlington, Virginia, May 2000. The Task Force utilized electronic mail to exchange outlines and ideas during the subsequent months. A draft report was prepared by the Chair, and circulated to the Task Force members for revision and additional comment. The revised draft was circulated to the reference group, and after receiving their comments, another draft was prepared. A summary of this draft was presented at a plenary session of the Annual North American Scientific Meeting of ISPOR in Arlington, Virginia, May 2001. Comments from the audience were incorporated into a newly revised draft, which was posted on the ISPOR web site for general comment. The next draft was presented at the Annual European Scientific Meeting of ISPOR in Cannes, France, November, 2001, and a revised draft was posted for

4
further comment on the ISPOR website. This report reflects the input from all of these sources of comment.
Model Defined
The National Research Council, in its report on the uses of microsimulation modeling for social policy, offered this definition of a simulation model: “… a replicable, objective sequence of computations used for generating estimates of quantities of concern…[1].” We define a health-care evaluation model as an analytic methodology that accounts for events over time and across populations, that is based on data drawn from primary and/or secondary sources, and whose purpose is to estimate the effects of an intervention on valued health consequences and costs. As part of our working definition, we assume that cost-effectiveness models are meant to be aids to decision making. This means that their purpose is not to make unconditional claims about the consequences of interventions, but to reveal the relation between assumptions and outcomes. These assumptions include structural assumptions about causal linkages between variables; quantitative parameters such as disease incidence and prevalence, treatment efficacy and effectiveness, survival rates, health-state utilities, utilization rates, and unit costs; and value judgments such as the nature of the consequences that are valued by decision makers. A good study based on a model makes all of these assumptions explicit and transparent, and states its conclusions conditionally upon them.
Model Evaluation
Models should be used only after careful testing to ensure that the mathematical calculations are accurate and consistent with the specifications of the model (internal validity), to ensure that their inputs and outputs are consistent with available data (calibration), and to ensure that their results make sense and can be explained at an intuitive level (face validity). To the extent that different models of the same decision come to different conclusions, modelers should also be expected to explain the sources of the differences (cross-validation). The description of the model should be sufficiently detailed that the model can be replicated mathematically.
Tests of predictive validity – the ability of the model to make accurate predictions of future events -- are valuable, but not absolutely essential. Since future events convey information that is not available at the time the model is developed and calibrated, a model should not be criticized for failing to predict the future. However, a good model should be susceptible to recalibration or respecification to adapt to new evidence as it becomes available. The criterion for determining whether, and to what degree, tests of predictive validity are required prior to model use depends on the benefits in terms of improving the model for decision making, and the costs of delaying the flow of information while obtaining the additional data [2].
ASSESSING THE QUALITY OF MODELS
The remainder of this statement describes the consensus of the Task Force regarding the attributes that define a good health-care decision model. We borrow heavily from several excellent papers that propose criteria for assessing the quality of models [3-6]. The attributes are organized under the major headings of structure, data, and validation.
Structure
1. The model should be structured so that its inputs and outputs are relevant to the decision-making perspective of the economic evaluation. Both costs and health consequences should reflect the

5
chosen decision-making perspective. For example, if the study is meant to assist decision makers in allocating resources across a broad range of health interventions at the societal level, then the outputs of the model should be broadly applicable, and important costs and consequences for all members of the affected population should be included. If a perspective narrower than societal is used, then the report should discuss, at least qualitatively, the implications of broadening the perspective to the societal perspective.
2. The structure of the model should be consistent both with a coherent theory of the health condition being modeled and with available evidence regarding causal linkages between variables. This does not mean that all causal linkages must have been proven, as is commonly understood in tests of hypotheses by showing that the effect size is statistically significant at a generally accepted level of significance (e.g., p < .05). Instead, it does mean that the linkages assumed are not contradicted by available evidence and are consistent with widely accepted theories.
3. If evidence regarding structural assumptions is incomplete, and there is no universally accepted theory of disease process, then the limitations of the evidence supporting the chosen model structure should be acknowledged. If possible, sensitivity analyses using alternative model structures – for example, using alternative surrogate markers or intermediate variables -- should be performed.
Items 4-8 relate to state-transition (or compartmental, or Markov) models:
4. Health states may be defined to correspond either to the underlying disease process, which may be unobserved or unobservable, or to observed health status, or to a combination of both. For example, screening models may define health states based on underlying pathology, or on clinical status, or both. However, care should be taken to avoid structural bias when interventions modify both the underlying disease and the clinical presentation, as, for example, in models of cancer screening where cases of detected cancer may have different prognoses depending on the method or frequency of screening. In general, structural bias is avoided by modeling underlying disease states, and then by calibrating outputs to data on observed clinical status.
5. When transition rates or probabilities depend on events or states that may have been experienced in prior time periods, this dependence, or “memory”, should be reflected in the model. This may be done either by incorporating clinical or treatment history in the definition of health states, or by including history as a covariate in specifying the transition probabilities.
6. States should not be omitted because of lack of data. Examples might be chronic health states corresponding to uncommon adverse events, or disease sequelae that are not observed within clinical trials. However, inclusion of a health state should be based on evidence consistent with recommendation # 2 above.
7. Reasons to include additional subdivisions of health states may be based on their clinical importance, their relation to mortality, their relation to quality of life or patient preferences, their relation to resource costs, or any combination. Disease states that may not be considered clinically important may well be important to include separately in the model for these other reasons. Conversely, health states that are regarded as having clinical importance may be included to enhance face validity, even if they do not materially affect the model’s results.

6
8. The cycle length of the model should be short enough so that multiple changes in pathology, symptoms, treatment decisions, or costs within a single cycle are unlikely. The choice of cycle length should be justified.
9. The structure of the model should be as simple as possible, while capturing underlying essentials of the disease process and interventions. It is not necessary to model the full complexity of a disease if the decision can be informed by a more aggregated structure, in terms of disease states or population subgroups. If simplifications are made, these should be justified on grounds that they would be unlikely to materially affect the results of the analysis. Sometimes a structural sensitivity analysis that uses a less aggregated model can provide reassurance that the simplifications do not materially affect the results.
10. Options and strategies should not be strictly limited by the availability of direct evidence from clinical trials. Neither should the range of modeled options and strategies be limited by currently accepted clinical practice. There should be a balance between including a broad range of feasible options and the need to keep the model manageable, interpretable, and evidence-based.
11. While the structure of the model should reflect the essential features of the disease and its interventions irrespective of data availability, it is expected that data availability may affect choices regarding model structure. For example, if a particular staging system has been used most frequently in clinical studies, then health states might well be defined according to that staging system even if other staging systems perform better in terms of predicting outcomes or in terms of differentiating quality of life and cost.
12. Failure to account for heterogeneity within the modeled population can lead to errors in model results. When appropriate, modeled populations should be disaggregated according to strata that have different event probabilities, quality of life, and costs. This is particularly important when recurrent event rates over time are correlated within subpopulations that have different event rates, since failure to do so can lead to biased estimates of long-term outcomes.
13. The time horizon of the model should be long enough to reflect important and valued differences between the long-run consequences and costs of alternative options and strategies. Lifetime horizons are appropriate for many models, and are almost always required for models in which options have different time-varying survival rates. Shorter horizons may be justified if survival and long-term chronic sequelae do not differ among options, or based on an understanding of the disease process and the effect of interventions. In any case, the lack of long-term follow-up data should not be used as a rationale for failing to extend the time horizon as long as is relevant to the decision under analysis.
Data
Our recommendations on data inputs to models are grouped into three categories: data identification, data modeling, and data incorporation.
Data Identification
1. A model should not be faulted because existing data fall short of ideal standards of scientific rigor. Decisions will be made, with or without the model. To reject the model because of incomplete evidence would imply that a decision with neither the data nor the
7
model is better than a decision with the model but without the data. With the model, the available evidence can be used in a logical way to inform the decision; without the model, an opportunity to utilize the available evidence within the logical framework will have been forgone.
2. Systematic reviews of the literature should be conducted on key model inputs. Evidence that such reviews have been done, or a justification for failing to do so based on the adequacy and generalizability of readily obtained data, should accompany the model.
3. Ranges (i.e., upper and lower bounds) should accompany base-case estimates of all input parameters for which sensitivity analyses are performed. The choice of parameters for sensitivity analysis is a matter of judgment by the analyst, but failure to perform sensitivity analysis on a parameter whose value could be disputed leaves the conclusions open to question.
4. Specification of probability distributions for input parameters based on sampling uncertainty and/or between-study variations may be incorporated into formal probabilistic sensitivity analysis. This is not always necessary or cost-effective, however. For purposes of assessing input distributions, the preferred methodology is to use posterior distributions obtained from formal meta-analyses and Bayesian analysis, but practical considerations may lead to the use of expert judgment (see item 7 below).
5. If known data sources are excluded from consideration in estimating parameters, the exclusion should be justified.
6. Data sources and results should not be rejected solely because they do not reach generally accepted probability thresholds defining “statistical significance” (e.g., p > .05). All evidence, even if insufficient to rule out randomness as a cause, may be legitimately incorporated into models. This is subject to the proviso that uncertainty about the estimates is disclosed and tested in sensitivity analyses, and that conclusions are clearly framed as conditional upon the input estimates used.
7. Expert opinion is a legitimate method for assessing parameters, provided either that these parameters are shown not to affect the results importantly, or that a sensitivity analysis is reported on these parameters with a clear statement that results are conditional upon this (these) subjective estimate(s). If expert opinion is elicited, and the results are sensitive to the elicitations, then the process of elicitation should be disclosed in detail. Expert estimates derived from formal methods such as Delphi or Nominal Group techniques are preferred.
8. A case should be made that reasonable opportunities to obtain new additional data prior
to modeling have been considered. “Reasonable” in this context means that the cost and delay inherent in obtaining the data are justified by the expected value of the new information in the analysis. While formal methods of assessing value of information exist, it is sufficient to give a heuristic argument as to why the current body of evidence was optimal from the point of view of informing current decisions. This can often be accomplished using sensitivity analysis, to show that reasonable ranges of data would lead to qualitatively similar findings, or by arguing that the cost and delay in obtaining the data are not worth the forgone benefits of acting on current evidence.
8
Data Modeling
1. Data modeling refers to the mathematical steps that are taken to transform empirical observations into a form that is useful for decision modeling. Examples include:
a. The method for incorporating estimates of treatment effectiveness from clinical trials with estimates of baseline outcomes from epidemiologic or public health data. Effectiveness estimates may be based on either intention-to-treat or on-treatment data, depending on the objectives of the analysis. Often, an appropriate approach is to derive estimates of relative risk (or odds ratios) between treatment options from clinical trials, and to superimpose these on estimates of baseline (e.g., untreated or with conventional treatment) probabilities of survival or other endpoints from population-based sources.
b. The method for transforming interval probabilities from the literature or from a clinical trial into an instantaneous rate, and then into a transition probability or event probability corresponding to the time interval used in the model.
c. The method for combining disease-specific and all-cause mortality into the model. In general, it is acceptable to derive all-cause mortality probabilities from national life tables, unless an alternative source can be justified. In general, it is not necessary to correct for the fact that all-cause mortality includes disease-specific mortality in the general population, unless the disease represents a major cause of death in the demographic groups being modeled.
d. The method for modeling survival (e.g., as an exponential, gamma, Weibull, or Gompertz distribution). The choice of functional form for disease-specific mortality should be specified and justified. In general, all-cause mortality should be modeled non-parametrically based on life table data.
e. Modeling risk factors or interventions as having an additive or multiplicative effect on baseline probabilities or rates of disease incidence or mortality. Evidence supporting either the additive or multiplicative form should be sought from studies that examine the effect of the risk factor or intervention in a population stratified by base risk.
f. The method for combining domain-specific utilities into a multi-attribute utility function. It is preferable to use validated health-related quality-of-life instruments with pre-specified scoring systems based on “forced-choice” methods (standard gamble, time tradeoff).
g. The method for transforming health status values (such as rating scales or health-state classifications) into quality-of-life weights.
h. The method for transforming charges to costs.

9
i. The method for adjusting for inflation or purchasing power across time and among countries. Adjustment for inflation should be based on the Consumer Price Index (CPI), its health care components, or one or more of its subcomponents such as medical care services or equipment. The choice between the general CPI and its health-care component or subcomponents depends on whether the resources being priced are better represented by the general “market basket” in the CPI or by the health-care “market basket”. A limitation of the health-care CPI is that it reflects not only the prices but also to some degree the quantities of input resources used to produce health care services. The method of choice for making adjustments across countries is to use purchasing power parity. However, a simple currency conversion would be appropriate if there is an international market for an input at a fixed price.
j. The method for discounting costs and health effects to present value.
2. Data modeling assumptions should be disclosed and supported by evidence of their general acceptance and, preferably, of their empirical validity. Key steps taken in developing the model should be carefully documented and recorded. Model credibility may be enhanced by showing how a model was conceived, for example, prior to or during a phase III or IV clinical trial, and how its structure and data inputs evolved in light of new evidence (e.g., after completion of a clinical trial) in response to subsequent discussions with clinical, regulatory, and policy experts.
3. When alternative, but equally defensible, data modeling approaches may lead to materially different results, sensitivity analyses should be performed to assess the implications of these alternatives. For example, if a model predicts smaller gains in life expectancy at older ages, but the model uses a multiplicative specification of the effect of an intervention of baseline mortality, then the alternative of an additive model should be tested. If there is stronger empirical evidence in support of one functional form, then that form should be the base case, and the alternative form(s) should be tested in sensitivity analysis.
4. Data modeling methods should follow generally accepted methods of biostatistics and epidemiology. For modeling, meta-analysis is a valid and desirable approach, provided that care is taken to recognize heterogeneity among data sources. Heterogenity can be considered either by segregating estimates based on different groupings of primary studies, or by estimating formal hierarchical models to combine information from heterogeneous studies can do this either.
Data Incorporation
1. Measurement units, time intervals, and population characteristics should be mutually consistent throughout the model.
2. Either probabilistic (Monte Carlo, first-order) simulation or deterministic (cohort) simulation is acceptable.
10
3. If first-order, Monte Carlo simulation is used, evidence should be provided that the random simulation error (e.g., the standard deviation of output values per run) is appreciably smaller than the effect sizes of interest.
4. All modeling studies should include extensive sensitivity analyses of key parameters. Either deterministic (one-way and multi-way) or probabilistic sensitivity analyses are appropriate.
5. When possible, sensitivity analyses within models that use Monte Carlo simulations should use fixed random number “seeds” within each sensitivity analysis, in order to minimize random simulation error.
6. If cohort simulation is used, sensitivity analysis may be done using probabilistic (Monte Carlo, second-order) simulation, using the specified probability distributions of parameter inputs. In specifying those parameter distributions, care should be taken to ensure that interdependence among parameters is reflected properly in the joint distribution of parameters.
7. When appropriate, and if the differences in quality-adjusted survival between alternatives are less than one cycle length, the half-cycle correction should be used to adjust time-related estimates in the model.
Validation Our recommendations on validation of models are grouped into three categories: internal validation, between-model validation, and external validation.
Internal Validation
1. Models should be subjected to thorough internal testing and “debugging”. Evidence that this has been done should be provided. This process should include using null or extreme input values to test whether they produce the expected outputs. It may also include examination of the program code for syntactical errors, and tests of replication using equivalent input values.
2. Models should be calibrated against data when possible. Calibration is possible when there exist data on both model outputs and model inputs, over the time frame being modeled. Calibration data can come from national health statistics, such as aggregate and age-gender-specific numbers of deaths, hospitalizations, procedures, or resource costs. The calibration data should be from sources independent of the data used to estimate input parameters in the model. A model should not be criticized if independent calibration data do not exist. However, a model is subject to criticism if independent data suitable for validation do exist and either the model fails to produce outputs consistent with those data (or discrepancies cannot be explained), or the modeler has not examined the concordance between model outputs and such data.
3. While the source code should generally remain the property of the modeler, reasonable requests for copies of models with adequate user interface should be made available for peer review purposes, under conditions of strict security and protection of property rights.
11
Between-Model Validation
1. Models should be developed independently from one another, in order to permit tests of between-model corroboration (convergent validity).
2. If a model’s outputs differ appreciably from published or publicly available results based on other models, the modeler should make a serious effort to explain the discrepancies. Are the discrepancies due to differences in model structure or input values?
3. Modelers should cooperate with other modelers in comparing results and articulating the reasons for discrepancies. (We applaud funding agencies that support this type of collaboration, e.g., the CISNET program of cancer modeling supported by the U.S. National Cancer Institute.)
External and Predictive Validation
Models should be based on the best evidence available at the time they are built. In areas such as HIV and hyperlipidemia, early models assumed that health consequences are mediated by risk factors (CD4 cell counts, serum cholesterol). Subsequent data from some clinical trials have been found to be at variance with the estimates from initial models, while others are consistent with the model assumptions. Insights from clinical trials have led to a second generation of models in both HIV and hyperlipidemia, the estimates from which track more closely with those of the clinical trials. In HIV, this has been accomplished by incorporating antiretroviral drug resistance into treatment efficacy estimates and HIV-RNA as a marker of disease virulence; in hyperlipidemia, this has been accomplished by modeling the lipid fractions LDL and HDL as risk factors. Remaining discrepancies between direct empirical evidence and model results are unexplained. Whether these relate to artifacts of clinical trial design (e.g., patient selection, treatment crossovers) or underlying biological factors (e.g., C-reactive protein and statins, immunological recovery and antiretroviral therapy) is still unknown. Models therefore not only capture the understanding of the science at the time the model is constructed (at a time when there still might be limited long-term data on new treatment), but they can also provide a basis for contrasting and interpreting information from new studies. The ability of models to adapt to new evidence and scientific understanding should be regarded as a strength, not as a weakness, of the modeling approach.
1. Since models are intended as aids to current decision-making, and since their outputs should be reported as conditional upon the input assumptions, it is not necessary that every data estimate or structural assumption be tested in prospective studies, in advance of model use.
2. The decision to obtain additional data to inform a model should be based on a balance between the expected value of the additional information and the cost of the information.
a. The “expected value of information” refers to the decision-theoretic concept which values
information in terms of its expected (or average) effect on the consequences of decisions. For example, the expected value of information would be zero for a study of a model parameter whose prior range does not include the threshold for the choice among decision options. Judgment concerning prior probabilities of possible study results is inevitably part of the assessment of “expected value of information”.
b. The “cost of the information” includes the resource cost of performing an empirical study or trial, as well as the expected forgone benefits of delaying decisions until the study or

12
trial is completed. Judgment concerning prior probabilities of treatment effects is inevitably part of the assessment of “cost of information”.
c. Recommendations for the conduct or design of research investigations to guide future decision-making can be based on formal analysis of the value of information or on informal interpretation of the implications of sensitivity analyses.
3. Models should never be regarded as complete or immutable. They should be repeatedly updated, and sometimes abandoned and replaced, as new evidence becomes available to inform their structure or input values. As a corollary, models that have been shown to be inconsistent with subsequent evidence, but that have not been revised to calibrate against or incorporate this new evidence, should be abandoned until such recalibration has been accomplished.
CONCLUDING COMMENTS While these guidelines represent the views of this Task Force at this time, they should not be regarded as rigid or cast in stone. This is not a “rule book”. Different circumstances will lead to deviations from these guidelines, depending on resources available to the modeler (time, money, and data) and on the purpose of the model. In our view, the most important thing to keep in mind in evaluating a health-care evaluation model is that its outputs must not be regarded as claims about the facts or as predictions about the future. Rather, its purpose is to synthesize evidence and assumptions in a way that allows end-users to gain insight into the implications of those inputs for valued consequences and costs. Its outputs are always contingent on its inputs, which is why it is so important that its inputs be as transparent and accessible as is practical.
FURTHER READING ON MODELING METHODOLOGY The purpose of this report is not to provide an overview of modeling methodology, but rather to identify those aspects of methodology that the Task Force regards as good research practice. We recommend the following sources for readers who wish to acquaint themselves with the basics of modeling methods. For an introductory textbook on decision analysis, including decision trees and Markov models, see Hunink et al [7]. For contemporary methods of modeling in economic evaluations, including an overview of methods for modeling survival from trial data, and an overview of deterministic and stochastic approaches to modeling, see Kuntz and Weinstein [8]. For an overview of methods for handling uncertainty in models, see Briggs [9], and chapter 11 of Hunink et al. [7].
ACKNOWLEDGMENTS The following members of ISPOR provided helpful written comments on drafts of this report: Phantipa Sakthong, MS, Faculty of Pharmaceutical Sciences, Chulalongkorn University, Bangkok, Thailand; Mendel Singer, PhD, Case Western Reserve University, Cleveland, Ohio, USA; Leslie Wilson, PhD, MS, University of California, San Francisco, San Francisco, California, USA. The authors also wish to thank Executive Director of ISPOR, Dr. Marilyn Dix Smith, PhD, for administrative support in convening meetings of the Task Force.
13
REFERENCES
1 National Research Council: Improving Information for Social Policy Decisions: The Uses of Microsimulation Modeling, Vol. 1, Review and Recommendations. Washington: National Academy Press, 1991.
2 Weinstein MC, Toy, EL, Sandberg EA, et al. Modeling for Health Care and Other Policy Decisions: Uses, Roles, and Validity. Value Health 2001;4:348-61.
3 Sculpher M, Fenwick E, Claxton K. Assessing quality in decision analytic cost-effectiveness models: a suggested framework and example of application. Pharmacoeconomics 2000;17:461-77.
4 Hay J, Jackson J, Luce B, et al. Methodological issues in conducting pharmacoeconomic evaluations – modeling studies. Value Health 1999;2:78-81.
5 Akehurst R, Anderson P, Brazier J, et al. Decision analytic modeling in the economic evaluation of health technologies. Pharmacoeconomics 2000;17:443-44.
6 Gold MR, Siegel JE, Russell LB, Weinstein MC (eds). Cost-Effectiveness in Health and Medicine. Report of the Panel on Cost-Effectiveness in Health and Medicine. New York: Oxford University Press, 1996.
7 Hunink M, Glasziou P, Siegel J, et al. Decision Making in Health and Medicine: Integrating Evidence and Values. Cambridge, UK: Cambridge University Press, 2001.
8 Kuntz K, Weinstein M: Modelling in economic evaluation. (Drummond M, McGuire A, Eds.) Economic Evaluation in Health Care: Merging Theory with Practice. Oxford, UK: Oxford University Press, 2001.
9 Briggs A: Handling uncertainty in economic evaluation and presenting the results. (Drummond M, McGuire A, Eds.) Economic Evaluation in Health Care: Merging Theory with Practice. Oxford, UK: Oxford University Press, 2001.
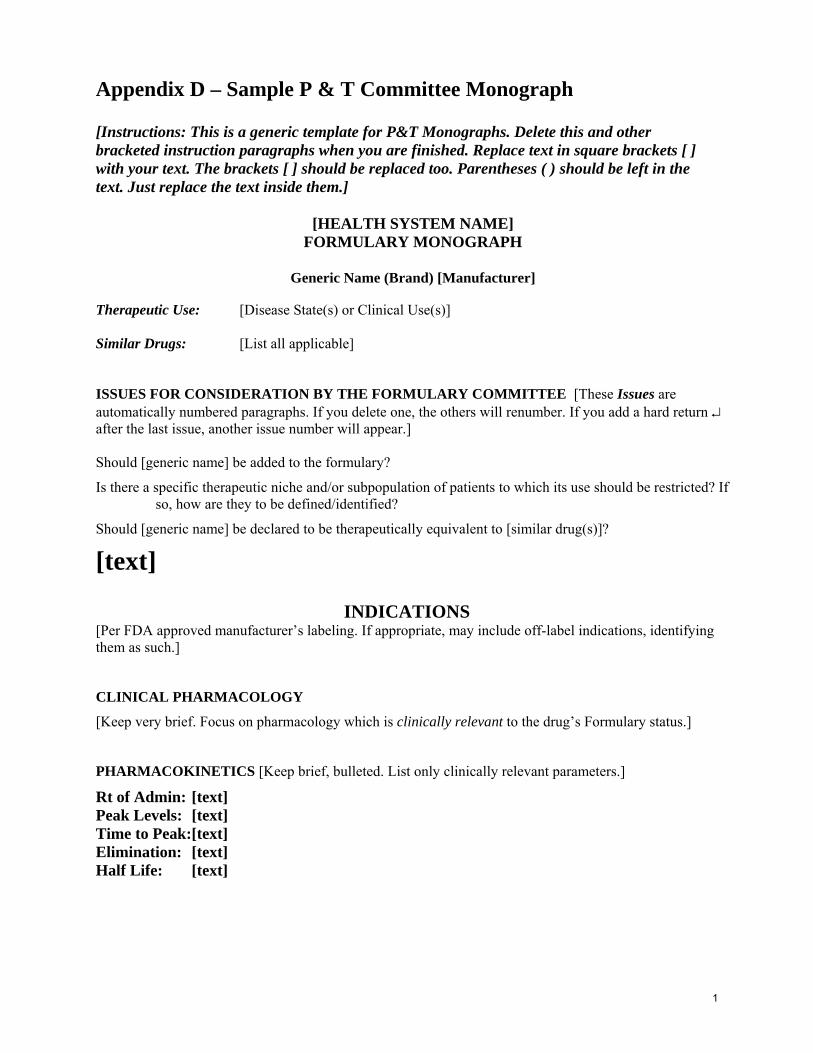
Appendix D – Sample P & T Committee Monograph [Instructions: This is a generic template for P&T Monographs. Delete this and other bracketed instruction paragraphs when you are finished. Replace text in square brackets [ ] with your text. The brackets [ ] should be replaced too. Parentheses ( ) should be left in the text. Just replace the text inside them.]
[HEALTH SYSTEM NAME] FORMULARY MONOGRAPH
Generic Name (Brand) [Manufacturer]
Therapeutic Use: [Disease State(s) or Clinical Use(s)] Similar Drugs: [List all applicable] ISSUES FOR CONSIDERATION BY THE FORMULARY COMMITTEE [These Issues are automatically numbered paragraphs. If you delete one, the others will renumber. If you add a hard return ↵ after the last issue, another issue number will appear.] Should [generic name] be added to the formulary?
Is there a specific therapeutic niche and/or subpopulation of patients to which its use should be restricted? If so, how are they to be defined/identified?
Should [generic name] be declared to be therapeutically equivalent to [similar drug(s)]?
[text]
INDICATIONS [Per FDA approved manufacturer’s labeling. If appropriate, may include off-label indications, identifying them as such.]
CLINICAL PHARMACOLOGY
[Keep very brief. Focus on pharmacology which is clinically relevant to the drug’s Formulary status.]
PHARMACOKINETICS [Keep brief, bulleted. List only clinically relevant parameters.]
Rt of Admin: [text] Peak Levels: [text] Time to Peak:[text] Elimination: [text] Half Life: [text]
1
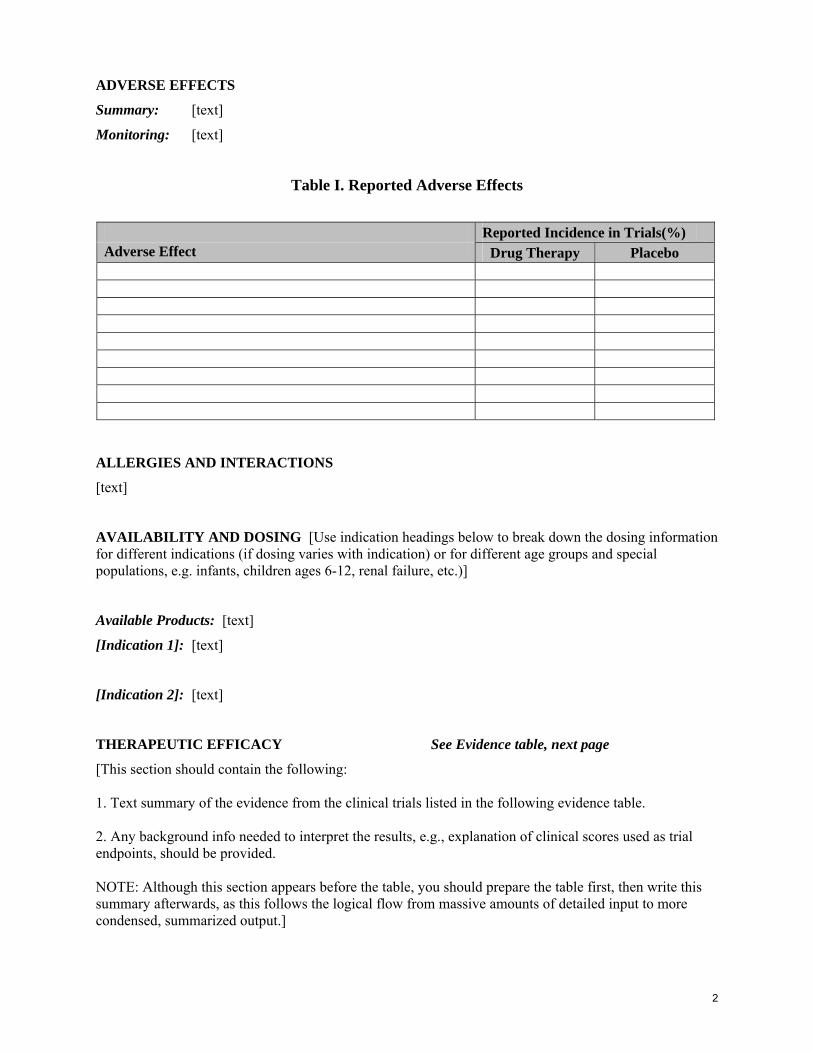
ADVERSE EFFECTS
Summary: [text]
Monitoring: [text]
Table I. Reported Adverse Effects
Reported Incidence in Trials(%) Adverse Effect Drug Therapy Placebo
ALLERGIES AND INTERACTIONS
[text]
AVAILABILITY AND DOSING [Use indication headings below to break down the dosing information for different indications (if dosing varies with indication) or for different age groups and special populations, e.g. infants, children ages 6-12, renal failure, etc.)]
Available Products: [text]
[Indication 1]: [text]
[Indication 2]: [text]
THERAPEUTIC EFFICACY See Evidence table, next page
[This section should contain the following: 1. Text summary of the evidence from the clinical trials listed in the following evidence table. 2. Any background info needed to interpret the results, e.g., explanation of clinical scores used as trial endpoints, should be provided. NOTE: Although this section appears before the table, you should prepare the table first, then write this summary afterwards, as this follows the logical flow from massive amounts of detailed input to more condensed, summarized output.]
2
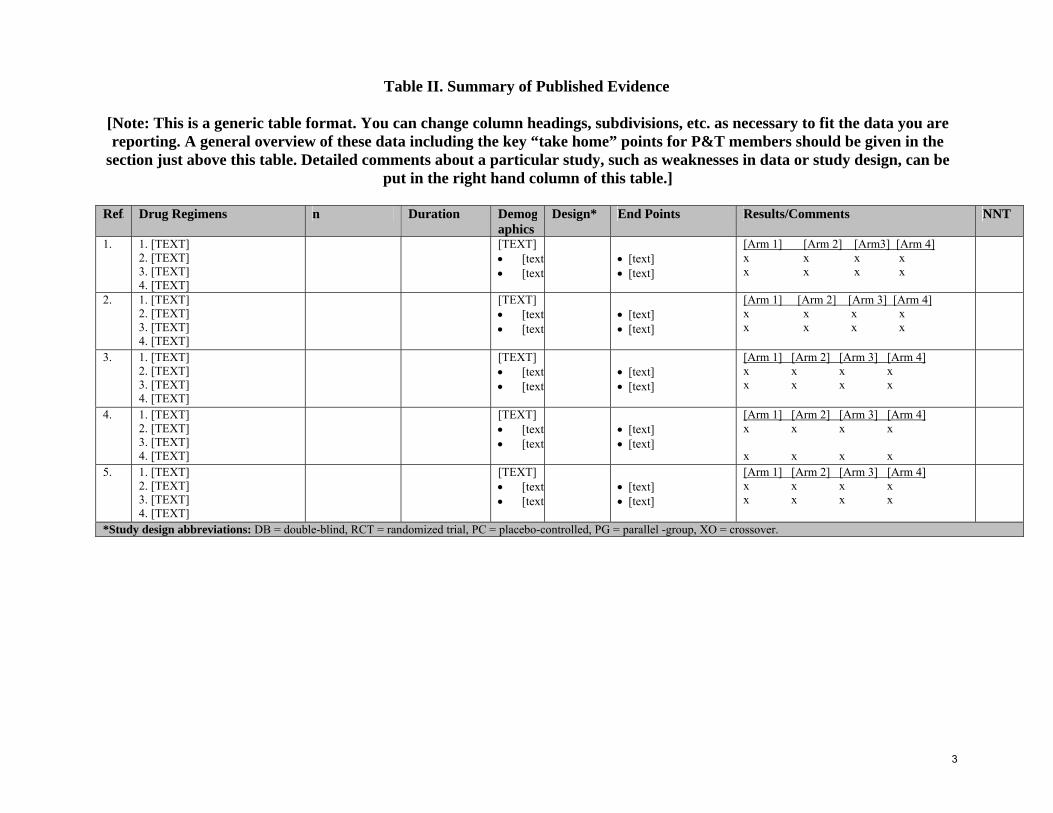
Table II. Summary of Published Evidence
[Note: This is a generic table format. You can change column headings, subdivisions, etc. as necessary to fit the data you are reporting. A general overview of these data including the key “take home” points for P&T members should be given in the
section just above this table. Detailed comments about a particular study, such as weaknesses in data or study design, can be put in the right hand column of this table.]
Ref. Drug Regimens n Duration Demogr
aphics Design* End Points Results/Comments NNT
1. 1. [TEXT] 2. [TEXT] 3. [TEXT] 4. [TEXT]
[TEXT] • [text• [text
• [text] • [text]
[Arm 1] [Arm 2] [Arm3] [Arm 4] x x x x x x x x
2. 1. [TEXT] 2. [TEXT] 3. [TEXT] 4. [TEXT]
[TEXT] • [text• [text
• [text] • [text]
[Arm 1] [Arm 2] [Arm 3] [Arm 4] x x x x x x x x
3. 1. [TEXT] 2. [TEXT] 3. [TEXT] 4. [TEXT]
[TEXT] • [text• [text
• [text] • [text]
[Arm 1] [Arm 2] [Arm 3] [Arm 4] x x x x x x x x
4. 1. [TEXT] 2. [TEXT] 3. [TEXT] 4. [TEXT]
[TEXT] • [text• [text
• [text] • [text]
[Arm 1] [Arm 2] [Arm 3] [Arm 4] x x x x x x x x
5. 1. [TEXT] 2. [TEXT] 3. [TEXT] 4. [TEXT]
[TEXT] • [text• [text
• [text] • [text]
[Arm 1] [Arm 2] [Arm 3] [Arm 4] x x x x x x x x
*Study design abbreviations: DB = double-blind, RCT = randomized trial, PC = placebo-controlled, PG = parallel -group, XO = crossover.
3

Table III. ECONOMIC EVALUATIONS:
[Note: This is similar in format to Table 2. Since pharmacoeconomic studies vary considerably more in format than clinical trials, you should feel free to change this around. Delete the columns that don’t apply. A general overview of these data
including the key “take home” points for P&T members should be given in the section just above this table. Detailed comments about a particular study, such as weaknesses in data or study design, can be put in the right hand column of this table.]
Ref. Drug/Treatment Arms n Time
Horizon Method* Outcome
Measures Cost Measures Results/Comments
1. 1. [TEXT] 2. [TEXT] 3. [TEXT] 4. [TEXT]
[TEXT] • [text] • [text]
• [text] • [text]
[Arm 1] [Arm 2] [Arm 3] [Arm 4] x x x x x x x x
2. 1. [TEXT] 2. [TEXT] 3. [TEXT] 4. [TEXT]
[TEXT] • [text] • [text]
• [text] •
[Arm 1] [Arm 2] [Arm 3] [Arm 4] x x x x x x x x
3. 1. [TEXT] 2. [TEXT] 3. [TEXT] 4. [TEXT]
[TEXT] • [text] • [text]
• [text] •
[Arm 1] [Arm 2] [Arm 3] [Arm 4] x x x x x x x x
4. 1. [TEXT] 2. [TEXT] 3. [TEXT] 4. [TEXT]
[TEXT] • [text] • [text]
• [text] •
[Arm 1] [Arm 2] [Arm 3] [Arm 4] x x x x x x x x
5. 1. [TEXT] 2. [TEXT] 3. [TEXT] 4. [TEXT]
[TEXT] • [text] • [text]
• [text] •
[Arm 1] [Arm 2] [Arm 3] [Arm 4] x x x x x x x x
*Method abbreviations: CEA=cost- effective analysis, CUA=cost-utility analysis, CBA=cost- benefit analysis, CCA=cost-consequence analysis. Evidence grades: Grade 1 = randomized controlled trials, Grade 2 = nonrandomized concurrent studies, Grade 3 = historical cohort & case-control studies, Grade 4 = case series, Grade 5 = expert opinion. (move evidence grades to the clinical table)
4
SUMMARY OF PHARMACOECONOMIC STUDIES [Summarize the key “take home” points from Table III.]
BUDGET IMPACT/COST-EFFECTIVENESS MODELLING:
• Describe type of model (Budget Impact, Markov, Decision Analysis, Simulation, etc…) [Show illustration of model, if applicable]
• List key assumptions and elements of the model [What drives the model and its results?]
• Describe sensitivity analyses and scenarios
• List model results and conclusions
• Discuss the projected impact of Formulary addition on the plan’s drug budget.
SUMMARY AND RECOMMENDATION: [Final summary of findings: a further condensation of the Therapeutic Efficacy and Pharmacoeconomic summaries into one or more sentences.]
MONOGRAPH PREPARED BY: [Author’s name and title.]
REFERENCES: [List of references. (Package inserts can be referenced as: Nudrug Prescribing Information, Blank Pharmaceuticals, 2001. Unpublished studies supplied by the manufacturer should be referenced as: Unpublished. Data on file with …)]
5

100 North Pitt Street I Suite 400 I Alexandria, VA 22314Phone: 703 683 8416 I Toll-Free: 800 827 2627 I Fax: 703 683 8417
http://www.amcp.org I http://www.fmcpnet.org
® Foundation for Managed Care Pharmacy