the analysis of business model canvas for burger king
TRANSCRIPT
Jurnal Ekonomika dan Manajemen Vol. 7 No. 2 Oktober 2018, hlm. 174-192
ISSN: 2252-6226 (print), ISSN: 2622-8165 (online) | 174
THE ANALYSIS OF BUSINESS MODEL CANVAS FOR BURGER KING
INDONESIA AFFECTING CUSTOMER BUYING DECISION
Berlian Karlina
Email: [email protected] Fakultas Ekonomi dan Bisnis, Universitas Budi Luhur
ABSTRACT
The purpose of the study is to identify whether a business model canvas owned by Burger
King Indonesia affecting consumer buying decision. The business model canvas includes
the nine-elements: customer segments, value propositions, channels, customer
relationship, revenue streams, key resources, key activities, key partnership, and cost
structure. The analysis focusing the four model canvas: value proposition, customer
segmentation, customer relationship and channel affecting consumer buying decision.
Data obtained in this study were primary data get through questionnaires, and quantitatvie
approach was used in this study. 100 people has become sample in this study. The analysis
of the data has been performed according to conceptual framework developed from critical
literature review in order to serve as a tool for deriving reliable and relevant conclusions.
The results of this research are value proposition, customer segments, customer
relationship have significantly and positively influence on customer buying decision. While
channels have not signifcant influence on customer buying decision.
Keywords : Business Model Canvas, Burger King, Customer Buying Decision
INTRODUCTION
Business Model Canvas: nine business model building blocks that is a strategic
management and lean startup template for developing new or documenting existing
business models (Osterwalder, Pigneur & al. 2010). It is a visual chart with elements
describing a firm's or product's value proposition, infrastructure, customers, and finances.
Business model canvas is essential in most business activities for companies. There are two
parties that are actively involved in franchising activities: franchisee, and franchisor.
Franchisee is a person or entity to whom the right to conduct a business is granted by the
franchisor or licensor, while franchisor is the company owning or controlling the rights to
grant franchises to potential franchisees (Franchoice 2012). In controlling and monitoring
the business activities between two parties; the franchisee and the franchisor, certain
agreement must be taken. Franchise agreement includes the legal document that governs
the relationship between the two entities; franchisee and franchisor, for a specified period
of time. The relationship between the two entities and countries that are engage in the form
of franchising become the most crucial aspect to the successful of the business activities.

The Analysis Of Business Model Canvas For Burger King Indonesia Affecting Customer Buying Decision
(Berlian Karlina)
175| Jurnal Ekonomika dan Manajemen Vol. 7 No. 2 Oktober 2018
In addition, franchising activities may also create a future benefit for both the
franchisor and the franchisee. The franchisor may expand their business to another
potential market in different geographic area, whereas franchisee benefit of a pre-sold
customer base which would ordinarily takes years to establish. A franchise increases firm’s
chances of business success because the firm is associating with proven products and
methods. Franchises may also offer consumers attraction of a certain level of quality and
consistency.
There are some businesses in different industry that can involve running franchising
activities such as food and beverage, restaurant, fashion, and also department store. Each
company within the same industry or different industry may have different business
models to be applied. The business model is having the most important factor in
determining the successful of franchising activities.
Problem Statement
Over a decade fast food restaurant dominated by McDonald as a major player. The
power of McDonadl business model is emphasized in collaboration between franchisees,
suppliers and employees. This business model bring McDonald’s to consistently deliver
the best and unforgettable restaurant experiences to customers and be the whole part of the
communities it serves. Franchisees often live in the communities they serve and are
committed to making a positive impact locally – from providing good food, customer
service and job opportunities, to supporting local charities and other ways of giving back.
Burger King is the second largest fast food hamburger chain in the world with
majority 90%, franchised business scheme and 10% operated by company. The original
HOME OF THE WHOPPER, the Burger King system operates in approximately 14,000
locations serving more than 11 million guests daily in nearly 100 countries and territories
worldwide. Approximately 100 percent of BURGER KING Restaurants are owned and
operated by independent franchisees, many of them family owned operations that have
been in business for decades.
For years, Burger King has lost and left far away behind in competition with
McDonald for capturing potential Fast Food market share globally. In order, to create a
Burger King new power of competitiveness, we suggest a new improvement by analyzing
current practical and theoretical method based on Business Model of both company.
The Analysis Of Business Model Canvas For Burger King Indonesia Affecting Customer Buying Decision
(Berlian Karlina)
Jurnal Ekonomika dan Manajemen Vol. 7 No. 2 Oktober 2018 | 176
Research Restriction
This research emphasize more on the four blocks of business model: Value
Proposition, Customer Segments, Customer Relationship, and Value Proposition.
LITERATURE REVIEW
Business Model
There are some dimensions to identify the business models of company. In theory
and practice, the term business model is used for a broad range of informal and formal
descriptions to represent core aspects of a business, including purpose, business process,
target customers, offerings, strategies, infrastructure, organizational structures, sourcing,
trading practices, and operational processes and policies including culture (George,G and
Bock AJ, 2011). A business model describes the rationale of how an organization creates,
delivers, and captures value, in economic, social, cultural or other contexts (Alexander
Osterwalder, Yves Pigneur, Alan Smith 2010). The process of business model construction
is part of business strategy.
According to (Al-Debei, M. M., &Avison, D., 2010) value proposition, value
architecture (the organizational infrastructure and technological architecture that allows the
movement of products, services, and information), value finance (modeling information
related to total cost of ownership, pricing methods, and revenue structure), and value
network articulate the primary constructs or dimensions of business models. Business
model is not requiring being the same between one business activities to another business
activity. Franchising is one of the examples of business activities that need a proper
business model to be settled between franchisor and franchisee. The four values of
business models are given the significant contribution to the successful of franchising
activities. Within the four values, both parties of franchisee and franchisor are take part.
Business Model Canvas
Modelling a business structure framework based on textual concept or visual
description have an important meaning for strategic aspect and management goal. The
organized, abstract, representation of process and organization block will have a better for
stakeholder to understand how to run, analyse, design, plan, change and documenting a
business logic . The type of business model will vary depend on the industry, organization
The Analysis Of Business Model Canvas For Burger King Indonesia Affecting Customer Buying Decision
(Berlian Karlina)
177| Jurnal Ekonomika dan Manajemen Vol. 7 No. 2 Oktober 2018
and the development of the technology trend. Business Model framework will
encompasses of four major component :Value Proposition, Value Architecture, Value
Network, and Value Finance articulate the primary constructs or dimensions of business
models, (Al-Debei and Avison,2010)
One of the most used and famous as a business framework for partitioning a model
of organization and process is Business Model Canvas, developed by A. Osterwalder, Yves
Pigneur, Alan Smith, and 470 practitioners from 45 country. It outline main activities or
process within body of organization that will giving more insight and drive manager as
decision maker into a well-planned management action and strategy. Block structure of the
canvas stimulate the creativity and improvisation to put any alternative choice, decision
and idea freely within each box. The Business model canvas was made easy for every
person to see a simple abstraction of organization building block structure from small to
big enterprise.
The above picture shows the detail of Business Model Canvas building block which
consist of nine basic elements that form a business foundation organization concept.
Through the idea of this concept, should be able to make someone easy to define, describe,
manipulate and look into the organization, anticipate threat from the competitor. The nine
block element covers most of the four main dimension of a business model, which
comprise of customer, infrastructure, financial sustainability and offering. These are the
simple description of the nine building block of the model:
RESEARCH METHODOLOGY
The research method is the organization of research for data collection of research as
well as information to answer the problem formulation. Quantitative approach is data
which can be presented numerically or classified by some numerical value. Normally it
presents in the form of numbers, and most of the time can be analyzed by using basic
statistical techniques, as an example, test validity. Formost, it thoughts of as being most
scientific and objective when comparing to the qualitative approach. Also, it represents that
it was being counted or researched can be quantified. So it is only valid to phenomenon
that can be measured and counted.
The Analysis Of Business Model Canvas For Burger King Indonesia Affecting Customer Buying Decision
(Berlian Karlina)
Jurnal Ekonomika dan Manajemen Vol. 7 No. 2 Oktober 2018 | 178
However, the quantitative approach is used in the research by the author to elaborate
the relationship between the four block of business models which are; value proposition,
customer relationship, customer segmentation, and channels with customer buying
decision. As Figure 3.1 below, the author focusing only the four block of business models.
To support this research, closed questionnaires are spreading through the Internet by using
Google Form to collect the data. Type of questionnaire used was close question with five-
point Likert Scale range by 1 as “strongly disagree” to 5 as “strongly agree”. Thus, to make
this research become more specific to find the result, the respondents only allowed to
choose the given options. The author used Statistical Package for Social Sciences (SPSS)
version 22. While the analysis itself was using multiple linear regression, determination
coefficient F-test and T-test.
Population
Finding out a population of the research is very important. As Sekaran & Bougie
(2013: 55) stated that the meaning of population itself is described as the whole group of
people, events, or things of interest that the author wanted to investigate to make
inferences. For example, when the Managing Director of a FMCG firms want to know the
kinds of promotion strategies adopted by Nestle, then all FMCG firms located there will be
the population. For that, this research’s population would be Burger King Indonesian
customers living in DKI Jakaerta
Sample
According to Sekarang & Bougie (2013: 55) sample is explained as a subgroup of
the population. It contains some numbers chosem from it. In other words, most of all, but
not all, constituents of the population from the sample. For instance, when there are 165 in-
patients in a hospital and 50 of them are as the survey respondents conducted by the
hospital administrator to evaluate their level of satisfaction with the treatment received,
then these 50 numbers will be the sample of the survey. By learning the sample, the
researcher must be able to make conclusions that are generalizable to the interest’s
population.
Futhermore, purposive sampling technique was used in specifying the sampling with
certain criteria was considered. However, the sample size determination was based on the
number of population in the city of Jakarta. As stated on the website of Badan Pusat
The Analysis Of Business Model Canvas For Burger King Indonesia Affecting Customer Buying Decision
(Berlian Karlina)
179| Jurnal Ekonomika dan Manajemen Vol. 7 No. 2 Oktober 2018
Statistik DKI Jakarta (https://jakarta.bps.go.id/statictable/2017/01/30/137/jumlah-
penduduk-dan-rasio-jenis-kelamin-menurut-kabupaten-kota-di-provinsi-dki-jakarta-
2015.html) that the population number of Jakarta resudents per January 2017 has reached
10,177,924. However, the author would only be focusing on specific criteria of sample
which is residents of Jakarta that have done any kind of buying transaction in Burger Kinrg
Indonesia at least once.
Research Testing
a. Reliability Testing
According to Sekaran & Bougie (2013: 33): “Reliability is a test of how consistently
a measuring instrument measures whatever concept itis measuring. The reliability of a
measure is an indication of the stability and consistency with which the instrument
measures the concept and helps ti assess the “goodness” of a measure.
Furthermore, as stated by Zimund, Babin, Griffin, and Carr (2009: 306) in Tan
(2017: 41) that “Scales with a coefficient a between 0.80 and 0.95 are considered to have
very good reliability. Scale with a coefficient a between 0.60 and 0.70 indicates fair
relliability, and when the coefficient a is below 0.60 the scale has poor reliability”.
b. Validity Testing
Meanwhile, based on Saunders, et al. (2007: 150) “Validity is concerned with
whether the findings are reallly about what they appear to be about. Is the relationship
between two variables a causal relationship? For example, in a study of an electronics
factory we found that employee’s failure to look at new product displays was caused not
by employee apathy but by lack opportunity (the displays were located in a part of the
factory that empolyees rarely visited). This potential lack of validity in the conclusions was
minimized by a research design that built in the opportunity for focus groups after the
questionnaire results had been analyzed. However, validity applied in this study was tested
over significant level of correlation. As stated by Sekaran & Bougie (2013: 33) that
“validity is test of how well an instrument that is developed measures the particular
concept it is intended to measure. In other words, validity is concerned with whether we
measure the right concept, and reliability with stability and consistency of measurement.
The Analysis Of Business Model Canvas For Burger King Indonesia Affecting Customer Buying Decision
(Berlian Karlina)
Jurnal Ekonomika dan Manajemen Vol. 7 No. 2 Oktober 2018 | 180
Research Tools
a. Multiple Linear Regression
Based on Higgins (2005:2) “A statistical tool that allows you to examine how
multiple independet variables are related to a dependent variable. Once you have identified
how these multiple variables relate to your dependent variable, you can take information
about all of the independent variables and use it to make much more powerful and accurate
prediction about why thing are the way they are”. However, multiple regression analysis
was used as a statistical technique to determine the influence of value proposition,
customer segmentation, customer relationship, and channels on customer buying decision
of Burger King Indonesia. Thus the formulation is as describe below:
Y = 𝒃𝟎+𝒃𝟏 𝑿𝟏+ 𝒃𝟐 𝑿𝟐+𝒃𝟑 𝑿𝟑+𝒆
Source: Statistical for Business and Economics by Newbold, Carison, and
Throne (2007 ) in Permatasari (2017: 42)
Which Where:
Y = Customer Buying Decision
𝑋𝟏 = Value Proposition
𝑋2 = Customer Segmentation
𝑋3 = Customer Relationship
𝑋4 = Channels
𝑏0 = Constants
𝑏1- 𝑏3 = Regression Coefficient
𝑒 = Error Standard
Thus, measurement scale used in this study is Likert Scale. As stated by Sekaran &
Bougie (2013: 32) “the Liker scale us designed to examine how strongly subjects agree or

The Analysis Of Business Model Canvas For Burger King Indonesia Affecting Customer Buying Decision
(Berlian Karlina)
181| Jurnal Ekonomika dan Manajemen Vol. 7 No. 2 Oktober 2018
disagree with statements on a five-point scale with the following anchors: 1= strongly
disagree, 2 = disagree, 3 = neither agree or disagree, 4= agree, 5= strongly agree. The
responses over a number of items tapping a particular concept or variable can be analyzed
item by item, but it is also possible to calculate a total or summated score for each
respondent by summing across items.”
In other words, Liker scale is a scale used to determine agreement level of
respondents towards a research object. Furthermore, through the Likert scale the researcher
would find out that every answer from a questionnaire’s questions has different values.
Finally, in order to recognize the approval level respondents, values for each answer of this
study are sorted as:
1) 5 = Strongly Agree
2) 4 = Agree
3) 3 = Neutral
4) 2 = Disagree
5) 1 = Strongly Disagree
Moreover, statement’s types provided to respondents in this study are positive
statement form, thus, questions and values applied in grouping questionnaire data are 5-4-
3-2-1.
b. Determination Coefficient (𝑅2)
According to Saunders, et al (2007: 442), it has been used to “to assess the strength
of a relationship between one dependent and one independent variable.” More specifically,
the determinatin coefficient (𝑅2) is normally used to emphasis how a difference in a
second variable can explain the differences in one.
Moreover, as stated by Greener (2008: 62) that “determination coefficient can be
calculated by squaring the value of Pearson’s and multiplying it by 100. This produces a
percentage, which describes the proportion of variation in one dependent variable between
age and weight in a sample, producing a Perason’s r value of -0.35, then the coefficient
determination woukd be 12.25% which suggests that in our sample 12.25% of the variation
in weight was accounted for by variation in age”.

The Analysis Of Business Model Canvas For Burger King Indonesia Affecting Customer Buying Decision
(Berlian Karlina)
Jurnal Ekonomika dan Manajemen Vol. 7 No. 2 Oktober 2018 | 182
So hypothesus testing by applying the F-test, where F count and F table can be
copare at the lever of a = 0.05 which can obtain the variance.
c. T- test
Based on Saunders, et al (2007: 442) “indepent t-test or paired t-test (often used to
test for changes over time). It to test whether two groups (categories) are different”. The
formula stated below:
t = √(𝑛−2)
(1−𝑟2))
Source: Riset Pemasaran by Freddy Rangkuty (1997); Hardiyanti (2015)
Whereas:
t = observation
r = correlation coefficient
n = the number of observation
Decison making previsions as stated:
1) If it count > t table at the 95% of the confidence level (where a = 0.05) thus it reflects
that the independent variable has partially influenced dependent variables (Rangkuty
1997 ; Permatasari : 45)
2) If it count < t table at the 95% of the confidence level (where a = 0.05) thus it reflects
that the independent variable has not partially influenced dependent variables
(Rangkuty 1997 ; Hardiyanti 2015).
Regression Analysis Assumption
Regression Analysis Assumption test is a must with the purpose of performing
multiple linear regression analysis, even more to Ordinary Least Square (OLS) based.
However, there are many assumptions to consider such as: Normality test,
Multicolinieruty test, Heteroscedasicity test, Autocorrelation and Linearity test. Thus, in
this research, the author will only focus on the major ones which are Normality test,
Multicolinieruty test, and Heteroscedasicity test.
a. Normality Test

The Analysis Of Business Model Canvas For Burger King Indonesia Affecting Customer Buying Decision
(Berlian Karlina)
183| Jurnal Ekonomika dan Manajemen Vol. 7 No. 2 Oktober 2018
Centralized to statistic is the concept of normality. In order data to be normal, they
required to have the form of a bell curve or Gaussian, distribution, with values dropping
off in a particular shapes as they decrease or even increase from the mean. To be more
specific, a normal distribution comprises 68.2% of the data within 1 standard deviation
from the mean (Flynn, 2005: 16). Moreover, in this study, histogram approach will be
used. Independent and dependent variables data are included as normal if the histogram
shift to the right nor left.
b. Multicolinierity Test
Multicolinierity (or colliniearity) happens when there are high intercorrelation in
some set of the predictor variables. In other words, ir occurs when mych of the same
information is contained by two or more prdictors. Even though the intercorrelations
indicated as a correlation matrix among all pairs of predictors, it is useful in determining
whether multicollinearity is a problem. But it will not forever indicate thate the condition
exists. Several predictors are occurring multicollinearity. They are related to some other
predictors or set of predictors (Leech et al, 2005: 90)
c. Heteroscedasicity Test
Heteroscedasicity is data with unequal variability (scatter) over a set of second,
predictor variables. Thus, parametric statistics to run more optimal, the data set must be
the same as the variance of the data (Flynn, 2005: 16). However, having data that shows
heteroscedasicity in running any king of regression analysis, can ruin the result or the least,
it will give biased coefficients. Therefore, it must be checked to ensure that the data
doesn’t have this condition.

The Analysis Of Business Model Canvas For Burger King Indonesia Affecting Customer Buying Decision
(Berlian Karlina)
Jurnal Ekonomika dan Manajemen Vol. 7 No. 2 Oktober 2018 | 184
Research Framework
Figure 1
Source: Processed Data
RESULT
Result of Validity Testing
Variable R Table
(α =
5%)
Pearson
Correlation
Sig. Result
Value Proposition (X1.1) 0.193 .546 .00 Valid
Value Proposition (X1.2) 0.193 .612 .00 Valid Value Proposition (X1.3) 0.193 .846 .00 Valid Value Proposition (X1.4) 0.193 .481 .00 Valid
Customer Relationship (X2.1) 0.193 .718 .00 Valid Customer Relationship (X2.2) 0.193 .618 .00 Valid Customer Relationship (X2.3) 0.193 .512 .00 Valid Customer Relationship (X2.4) 0.193 .729 .00 Valid Customer Segmentation (X3.1) 0.193 .812 .00 Valid Customer Segmentation (X3.2) 0.193 .619 .00 Valid Customer Segmentation (X3.3) 0.193 .593 .00 Valid
Channel (X4.1) 0.193 .689 .00 Valid Channel (X4.2) 0.193 .823 .00 Valid Channel (X4.3) 0.193 .749 .00 Valid
Table 1. Output of Validity
** Correlation is signifivant at the 0.01 level (2-tailed)
Source: self-constrcuct, process through SPSS 22.0 for Windows
In this study, validity is being tested to variable Y (customer buying decision), and
variable X1, X2, X3, and X4 (value proposition, customer relationship, customer

The Analysis Of Business Model Canvas For Burger King Indonesia Affecting Customer Buying Decision
(Berlian Karlina)
185| Jurnal Ekonomika dan Manajemen Vol. 7 No. 2 Oktober 2018
segmentation, and channels). Based on table 4.5 above the validity test measurement on all
questions are declared valid because the value of r count is greater that r table (0193), and
the siginificance level is lower than 0.01. For thatm there is no need to do a re-test of
validiy and foremost, variables used in study can be used for further research activity.
Result of Reliability Testing
Variable Number of
Questions
Cronbach’s Alpha Result
Value Proposition (X1) 5 .836 Reliable
Customer Relationship (X2) 5 .823 Reliable Customer Segmentation (X3) 4 .816 Reliable
Channel(X4) 4 .845 Reliable Customer Buying Decision (Y) 5 .803 Reliable
Table 2. Output Reliability
Source: self-construct, processed through SPSS 22.0 software for Windows
Based on table 4.6, result of reliability test shows that each variable has Cronbach’s Alpha
of .836, .823, .816, .845, and .803. Test result of all variables presented that all variables
Cronbach’s Alpha values more than (>) 0.60. Meaning that questions asked and used in
this study has the reliability or in other words it is reliable enough for further and feasible
to be used for research analysis.
Normality Test
Figure 2. Histogram of Normal Distribution
Source: self-construct, processed through SPSS 22.0 software for Windows
The Analysis Of Business Model Canvas For Burger King Indonesia Affecting Customer Buying Decision
(Berlian Karlina)
Jurnal Ekonomika dan Manajemen Vol. 7 No. 2 Oktober 2018 | 186
It can be seen from Figure 4.2 , Histogram of normal distribution, it describes bell-
shaped of the histogram. So, it can be concluded that data in this study is being distributed
normally.
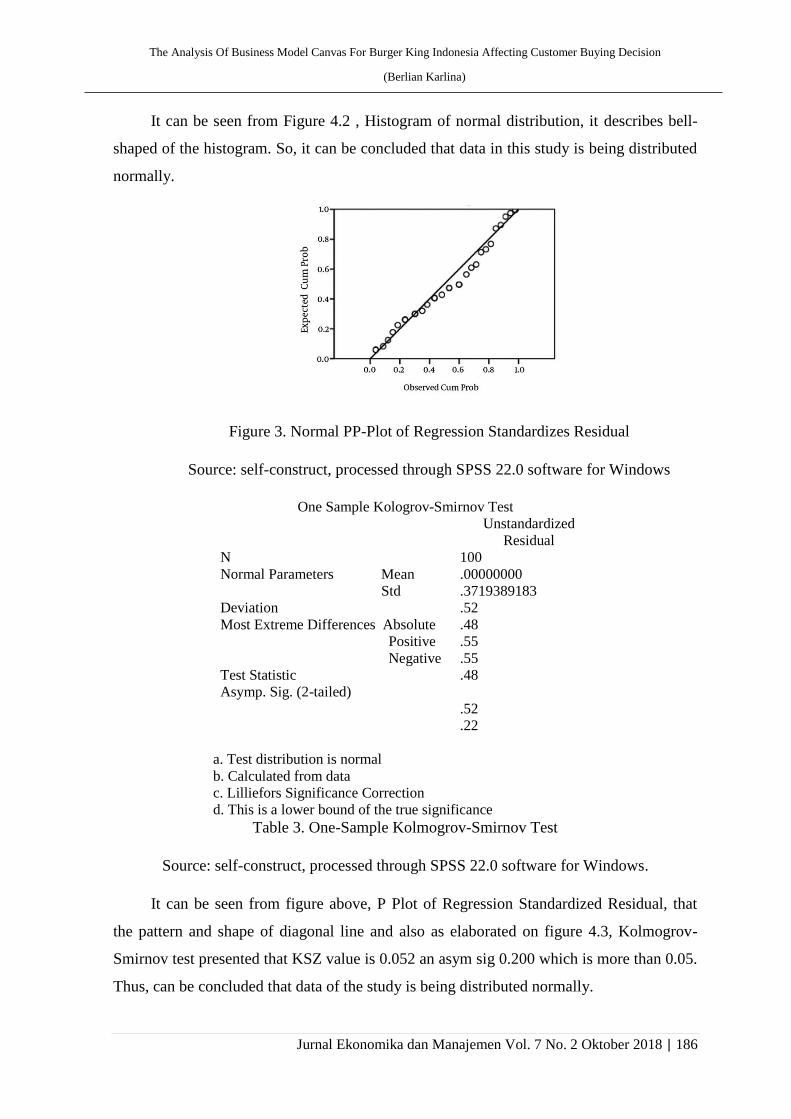
Figure 3. Normal PP-Plot of Regression Standardizes Residual
Source: self-construct, processed through SPSS 22.0 software for Windows
One Sample Kologrov-Smirnov Test
Unstandardized
Residual
N
Normal Parameters Mean
Std
Deviation
Most Extreme Differences Absolute
Positive
Negative
Test Statistic
Asymp. Sig. (2-tailed)
100
.00000000
.3719389183
.52
.48
.55
.55
.48
.52
.22
a. Test distribution is normal
b. Calculated from data
c. Lilliefors Significance Correction
d. This is a lower bound of the true significance
Table 3. One-Sample Kolmogrov-Smirnov Test
Source: self-construct, processed through SPSS 22.0 software for Windows.
It can be seen from figure above, P Plot of Regression Standardized Residual, that
the pattern and shape of diagonal line and also as elaborated on figure 4.3, Kolmogrov-
Smirnov test presented that KSZ value is 0.052 an asym sig 0.200 which is more than 0.05.
Thus, can be concluded that data of the study is being distributed normally.
The Analysis Of Business Model Canvas For Burger King Indonesia Affecting Customer Buying Decision
(Berlian Karlina)
187| Jurnal Ekonomika dan Manajemen Vol. 7 No. 2 Oktober 2018
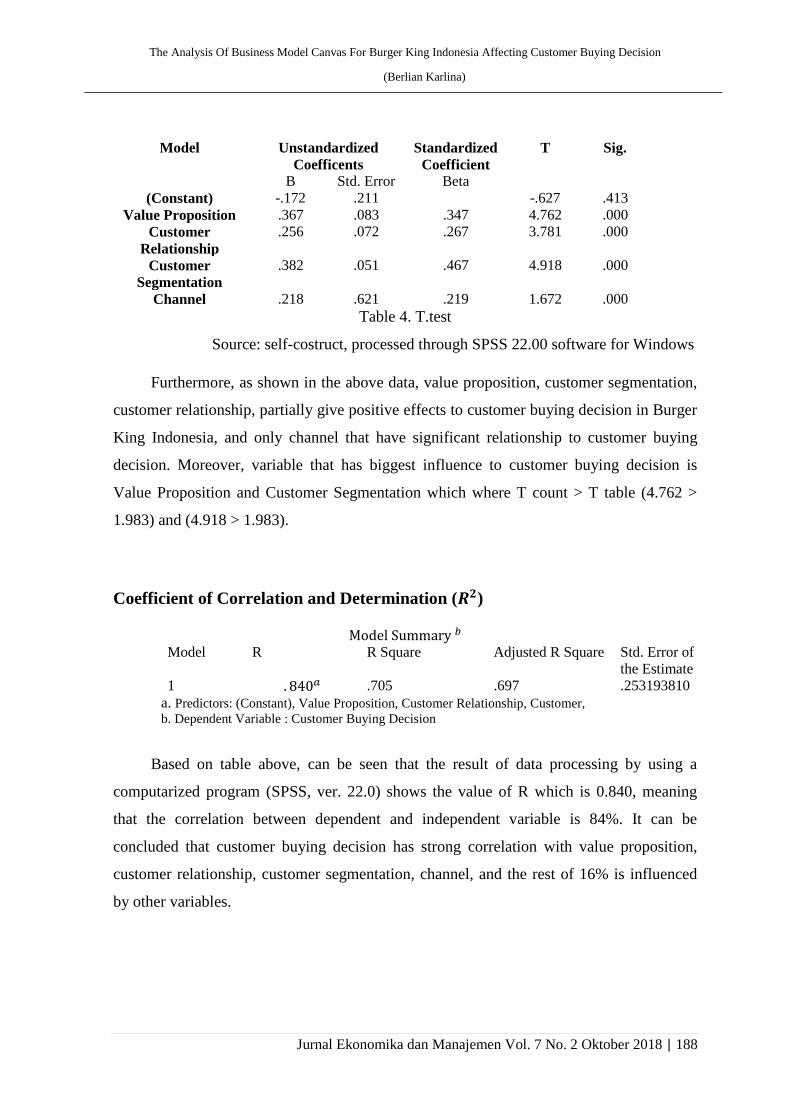
T-Test T test is mostly used to test the significance level of variable X to Y partially.
Sample that are used in this study are 100 respondents, which where N = 100 and sig.=
0.005. So the t table is counted as 1.983
Based on table 4.5, result of each variable is obtained by using computarized
program (SPSS version 22.0) as follows
1. X1 (Value Proposition)
T count = 4.762, where T count > T table which means 4.762 >1.983 and the
significant level in 0.000 which shows that the significant level < 0.05, then the value
proposition significantly and positively be as strong variable that influence customer
buying decision variable
2. X2 (Customer Relationship)
T count = 3.781, where T count > T table which means 3.781 >1.983 and the
significant level in 0.000 which shows that the significant level < 0.05, then the
customer relationship significantly and positively be as strong variable that influence
customer buying decision variable
3. X3 (Customer Segmentation)
T count = 4.918, where T count > T table which means 4.918 >1.983 and the
significant level in 0.000 which shows that the significant level < 0.05, then the
customer segmentation significantly and positively be as strong variable that
influence customer buying decision variable
4. X4 (Channel)
T count = 1.672, where T count > T table which means 1.672 <1.983 and the
significant level in 0.000 which shows that the significant level < 0.05, then the
channel has no significantly influence on customer buying decision variable.
The Analysis Of Business Model Canvas For Burger King Indonesia Affecting Customer Buying Decision
(Berlian Karlina)
Jurnal Ekonomika dan Manajemen Vol. 7 No. 2 Oktober 2018 | 188
Model Unstandardized
Coefficents
Standardized
Coefficient
T Sig.
B Std. Error Beta
(Constant) -.172 .211 -.627 .413
Value Proposition .367 .083 .347 4.762 .000
Customer
Relationship
.256 .072 .267 3.781 .000
Customer
Segmentation
.382 .051 .467 4.918 .000
Channel .218 .621 .219 1.672 .000
Table 4. T.test
Source: self-costruct, processed through SPSS 22.00 software for Windows
Furthermore, as shown in the above data, value proposition, customer segmentation,
customer relationship, partially give positive effects to customer buying decision in Burger
King Indonesia, and only channel that have significant relationship to customer buying
decision. Moreover, variable that has biggest influence to customer buying decision is
Value Proposition and Customer Segmentation which where T count > T table (4.762 >
1.983) and (4.918 > 1.983).
Coefficient of Correlation and Determination (𝑹𝟐)
Model Summary 𝑏 Model R R Square Adjusted R Square Std. Error of
the Estimate
1 . 840𝑎 .705 .697 .253193810
a. Predictors: (Constant), Value Proposition, Customer Relationship, Customer,
b. Dependent Variable : Customer Buying Decision
Based on table above, can be seen that the result of data processing by using a
computarized program (SPSS, ver. 22.0) shows the value of R which is 0.840, meaning
that the correlation between dependent and independent variable is 84%. It can be
concluded that customer buying decision has strong correlation with value proposition,
customer relationship, customer segmentation, channel, and the rest of 16% is influenced
by other variables.
The Analysis Of Business Model Canvas For Burger King Indonesia Affecting Customer Buying Decision
(Berlian Karlina)
189| Jurnal Ekonomika dan Manajemen Vol. 7 No. 2 Oktober 2018
Interpretation of Result
1. X1 (Value Proposition)
T count = 4.762, where T count > T table which means 4.762 >1.983 and the
significant level in 0.000 which shows that the significant level < 0.05, then the value
proposition significantly and positively be as strong variable that influence customer
buying decision variable
2. X2 (Customer Relationship)
T count = 3.781, where T count > T table which means 3.781 >1.983 and the
significant level in 0.000 which shows that the significant level < 0.05, then the
customer relationship significantly and positively be as strong variable that influence
customer buying decision variable
3. X3 (Customer Segmentation)
T count = 4.918, where T count > T table which means 4.918 >1.983 and the
significant level in 0.000 which shows that the significant level < 0.05, then the
customer segmentation significantly and positively be as strong variable that
influence customer buying decision variable.
4. X4 (Channel)
T count = 1.672, where T count > T table which means 1.672 <1.983 and the
significant level in 0.000 which shows that the significant level < 0.05, then the
channel has no significantly influence on customer buying decision variable.
Conclusion
Based on the research of Business Models of Franchise Activities for Burger King in
competing with McDonald, can be concluded:
1. Value Proposition.
Value Propositions is finding the answer and trying to solve customer problem,
giving the most satisfactory service to the customers. The answer to solve customer
problems is giving the qualiy of product offered with affordable price charged. The
survey content under the Fast Food Brand Preferences, Burger King is at sixth
position while McDonald at second. It is can be seen from the preferences that
consumption in Indonesia from Class B is higher than Class A. People with income
3.5 million – 8.5 million are categorized as Class B, and income above 8.5 million
The Analysis Of Business Model Canvas For Burger King Indonesia Affecting Customer Buying Decision
(Berlian Karlina)
Jurnal Ekonomika dan Manajemen Vol. 7 No. 2 Oktober 2018 | 190
and above are at Class A. From the data, it is shown that price provided will be so
much matter for people in Indonesia. Comparing the price of Burger King and
McDonald, McDonald is charging a lower price than Burger King. Thus McDonals
is at second popular for fast food preferences.
Moreover, the survey content on Fast Food Restauran Product and Service
Performance is divided into 5 elements: Product, Price, Place, Process. In terms of
Products, hygienic food is become the most options to be choosed for people in
Indonesia. In terms of price, affordable price is the most matters rather than any other
promotion. Promotion for fast food restaurant with many programmes for loyal
customers become the most attractie promotion to be used by any fast food
restaurants. Moreover, easy to find for fast food restaurant is also another matter in
terms of places. The other service performance is the process required to prepare the
food, which is a quick food serving is the highest result.
From the finding of the research, value proposition significantly and positively be as
strong variable that influence customer buying decision variable.
2. Customer Relationship
The relationship between customer and seller can be seen on how seller giving
promotion to customers. From the data, promotion for fast food restaurant with many
programmes for loyal customers become the most attractie promotion to be used by
any fast food restaurants. Moreover, from the finding of the research, customer
relationship significantly and positively be as strong variable that influence customer
buying decision variable.
3. Customer Segments
The target segmentation should be clearly defined to answer on customers need.
From the survey content under the Fast Food Consumption Habit in Indonesia, price
offered is the first important since the most largest consumption number in Indonesia
are between middle to low level. The most popular consideration of choosing Fast
Food Brand is good taste with 60% and affordable price with 54.5%. The level of
agreement for tasteful is also having the highest value compare to other level of
agreement. The spending amount of fast food brand in Indonesia is falling between
20.001 – 60.000, whereas 40.001 – 60.000 is the highest. The price offered should be
at the range between 20.001 – 60.000. Moreover, from the finding of the research,

The Analysis Of Business Model Canvas For Burger King Indonesia Affecting Customer Buying Decision
(Berlian Karlina)
191| Jurnal Ekonomika dan Manajemen Vol. 7 No. 2 Oktober 2018
customer segments significantly and positively be as strong variable that influence
customer buying decision variable.
4. Channels
Channels are designed to communicate between companies as a seller with
customers and reach them to get the value proposition. To have a good
communication between customers and sellers, sellers should understand what
customer wants and need. The channels might be tasteful food, have manystores,
various dishes, affordable price, favourite of friends, have many promotions, nice
/oreye-catching store decoration. All those elements are come up at the survey
content under the brand imagery with McDonald is the top-two of Brand Imagery
Fast Food Brand Imagery, while Burger King not even included in top-five restaurant
with brand imagery. From the finding of the research, channel have not significantly
and positively influence on customer buying decision variable.
Recommendation
1. Burger King should improve the unaided brand awareness as a fast food restaurant in
Indonesia by adjusting to what people like in Indonesia, in terms of taste, price,
place, and promotion.
2. Burger King should reevaluate the target market class in Indonesia, since the highest
consumption level in Indonesia are between middle and low class for fast food
restaurant.
3. Burger King should learn the local taste so that they can adjust their taste based on
local taste preferences, because the local consumption habits depends on good taste
offerd by restaurants. The menu offered also have to be adjusted with local taste
preferences.
4. To improve the product and service performance for Burger King, they should adjust
their price based on the highes local consumption at the middle to low level. Adding
up the number of stores also take under consideration for Burger King to grab more
loyal customers in consuming Burger King as their meals.
The Analysis Of Business Model Canvas For Burger King Indonesia Affecting Customer Buying Decision
(Berlian Karlina)
Jurnal Ekonomika dan Manajemen Vol. 7 No. 2 Oktober 2018 | 192
References
Amaratunga, D., Baldry, D., Sarshar, M., & Newton, R. (2002). Quantitative and
qualitative research in the built environment: application of "mixed" research
approach. 51.
Baron, E. & Schmidt, R. (1991) 'Operational aspects of retail franchisees. International
Journal of retail and distribution management, pp. 13-19.
Bernard, H. (2006). Research Methods in Anthropology: Qualitative and Quantitative
approaches (4th ed.). AltaMira Press.
Knight, R. (2005) 'Franchising form the franchisors and franchisee points of view'. Journal
of Small Business Management, pp.1-15.
Martin, R. (2002) 'Franchising and risk Management'. American Economic Review, vol.
78, no. 5, pp. 954-968.
Mathewson, G. & Winter, R. (2007) 'The Economics of Franchise Contracts'. Journal of
Law and Economics, vol. 27, no. 3, pp. 503-526.
Mendelsohn, E. (2004) The guide to Franchising, 7th edn., London, Cassell.
Patton, M. (2002).Qualitative Evaluation and Research Methods. (2nd ed.). Newbury Park,
CA: Sage Publications, Inc.
Preble, J. F., Hoffman, R. C. & Watson, S. (2013). U.S. Franchisors’ Future International
Expansion Trends.Unpublished manuscript.
Preble, J.F. and Hoffman, R.C. 2010. Franchising systems around the globe: a status
report. Journal of Small Business Management, 33(2): 80-88.
Peterson, A. &Dant, R. (2002) 'Perceived advantages of the franchise option from the
franchisee perspective: Empirical insights from a service franchise'. Journal of
Small business Management, July.
Rubin, H. (2003) 'The theory of the firm and the structure of the franchise contract'.Journal
of law and Economics, vol. 21, no.1, pp. 223-33.
Shah, D. 2008. India: Market for the masses, Franchising World, Vol. 40 No. 6, pp. 61-63.
Schlentrich, U. and Aliouche, H. 2006. Rosenberg Center study confirms franchise growth,
Franchising World, August (http://www.franchise.org/article.asp?article-
1491&paper=91&cat=372) Accessed August 11, 2017.
Teegen, H. 2000. Examining strategic and economic development implications of
globalizing through franchising. International Business Review, 9(4): 497-521.
W&SHoldingsJointStockCompany, 2015, Comparative report on Fast Food study in
Thailand, Indonesia and Vietnam in 2015