the analysis of stock market development indicators ...ijtef.org/papers/314-b00056.pdf · was...
TRANSCRIPT

Abstract—This paper proposes indicators to assess the
development of the stock markets in ASEAN-5 countries,
namely Indonesia, Malaysia, the Philippines, Singapore and
Thailand. The results show the distinctions among these equity
markets. The indicators in this research separate these stock
markets into two tiers. The results indicate that SGX, SET, and
BM have higher level of development comparing to other stock
markets in the same region. Their main strengths are in their
accessibility. SGX has higher level of development in most
aspects, specifically in size when measured by market
capitalization. BM gains its advantage on access dimension.
SET is outstanding in stability dimension. The other group is
IDX and PSE. The latter equity markets need to improve in
most aspects. These findings convey important messages to
less-developed stock markets to establish the well-planned
strategy and policy to build up the development before full
participation of ASEAN Economic Community in 2015.
Index Terms—ASEAN economic community, equity market,
market development indicator, stock market development.
I. INTRODUCTION
The ASEAN has been a regional economic integration
which was initiated in 1967. This collaboration aims to
increase the potential of bargaining in the global, and share
resources among members in this region. The cooperation
has been started by ASEAN Free Trade Area (AFTA)
initiating in 1993. In 2009, the ASEAN step forward to
ASEAN Economic Community (AEC) for establishing
market base and working together to strengthen in the region.
The initiation of ASEAN Exchanges linkage between seven
stock markets from six countries in ASEAN has been
established. This includes stock market of Thailand,
Malaysia, Indonesia, Philippine, Singapore, Ho Chi Min, and
Hanoi, hope to make the expediency for funding and
investment in the region. There are 3,613 companies listed in
seven stock markets. Total stock market value is 1,980.37
billion USD or eighth ranked in the world, as in [1]
Therefore, understanding the development of stock markets
among this emerging countries within this region become
more interesting in global investor’s perspective.
In this study, we propose a set of indicators to measure the
development level of the ASEAN-5 equity markets, which
are the Stock Exchange of Thailand (SET), the Singapore
Exchange (SGX), Bursa Malaysia (BM), the Indonesia Stock
Manuscript received June 20, 2013; revised August 26, 2013. This work
was supported in part by the National Research Council of Thailand.
Pariyada Sukcharoensin and Sorasart Sukcharoensin are with the
Graduate School of Development Economics, the National Institute of
Development Administration, Klongchan, Bangkapi, Bangkok, 10240
Thailand (e-mail: [email protected], [email protected]).
Exchange (IDX), and the Philippine Stock Exchange (PSE).
The findings are useful for public and private sectors
involved in the development and policy making to promote
funding and investment efficiency among these stock
markets. More importantly, the results shed lights on the
well-planned development strategy and policy to build up the
competitive advantage of each stock market.
II. LITERATURE REVIEW
Previous works on developing indicators to assess the
development of stock markets have focused on
disaggregating data to understand trends and development in
individual equity market. Analysts equipped with
disaggregated data would focus on one aspect at a time to
study the issue of stock market development. Most of the
studies use the ratio of market capitalization to GDP, the ratio
of total value of shares traded to GDP, or the ratio of total
value of shares traded to market capitalization as measures
for stock market development (for example, [2]-[5]). Stock
market capitalization is a measure of both the stock market's
ability to allocate capital to investment projects and its ability
to provide significant opportunities for risk diversification
for investors. The ratio of total value of shares traded to GDP
and the ratio of total value of shares traded to market
capitalization are indicators of market liquidity. The former
measures the ability to trade economically significant
positions on the stock market, and the latter is an indicator of
liquidity of assets traded on the market, not adjusted for the
size of the market relative to the economy, as in [6]-[7].
These variables are only good proxies for size, a general
development perspective of the market. Since the size of the
market focus on only one dimension, so the assessments are
not taking into account other elements of the development.
The World Bank Economic Review also dedicates its May
1996 issue to the role of the stock markets in economic
growth. The Financial Sector Development Indicators
(FSDI) project was established to set up a new perspective to
look at stock market development. The project aims to be the
first dock of call for statistics and analytical tools to evaluate
financial sector. The FSDI project employs several variables
covering banking systems, capital markets, non-bank
financial sectors, the accessibility to finance, as well as
institutional environments. The project strong point is to
provide ability for comprehensiveness, yet retains flexibility
for customized assessments. The FSDI harbors capacity to
pool the multitude dimensions of a financial sector—size,
access, efficiency and stability—with traditional financial
sub-sectors, such as banking, capital markets, etc.
Since stock markets are multi-dimensional, to assess their
The Analysis of Stock Market Development Indicators:
Evidence from the ASEAN-5 Equity Markets
Pariyada Sukcharoensin and Sorasart Sukcharoensin
International Journal of Trade, Economics and Finance, Vol. 4, No. 6, December 2013
343DOI: 10.7763/IJTEF.2013.V4.314
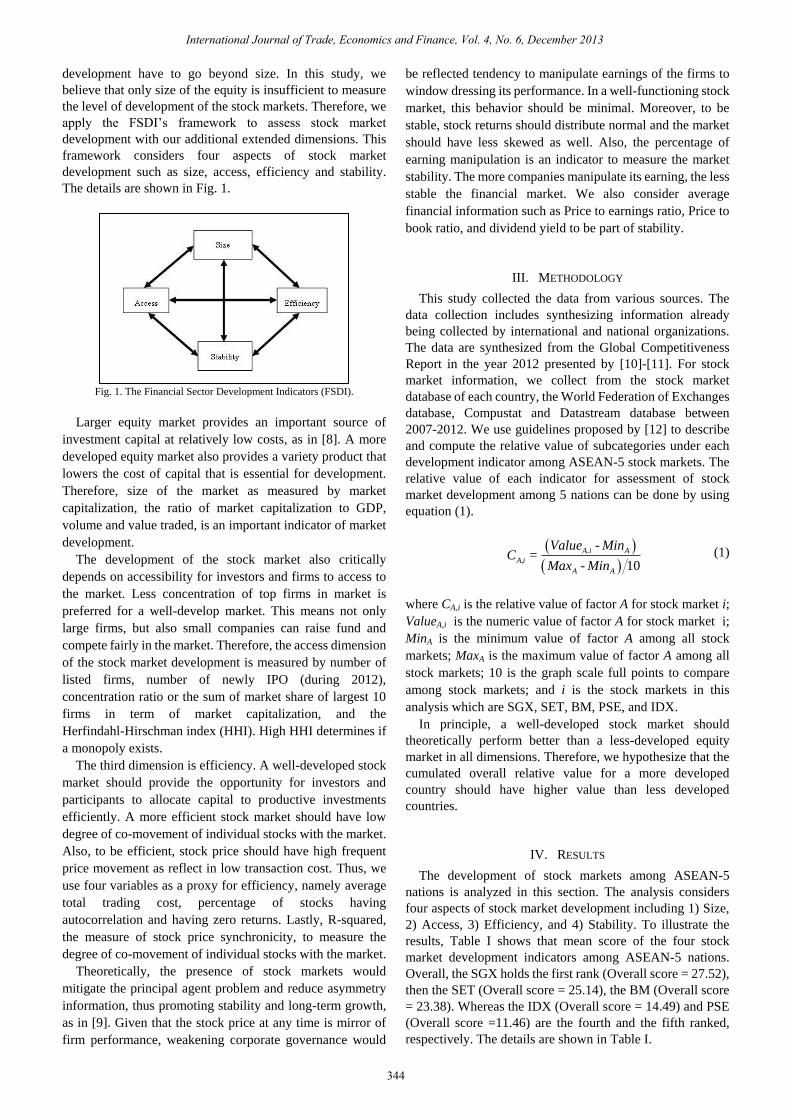
development have to go beyond size. In this study, we
believe that only size of the equity is insufficient to measure
the level of development of the stock markets. Therefore, we
apply the FSDI’s framework to assess stock market
development with our additional extended dimensions. This
framework considers four aspects of stock market
development such as size, access, efficiency and stability.
The details are shown in Fig. 1.
Fig. 1. The Financial Sector Development Indicators (FSDI).
Larger equity market provides an important source of
investment capital at relatively low costs, as in [8]. A more
developed equity market also provides a variety product that
lowers the cost of capital that is essential for development.
Therefore, size of the market as measured by market
capitalization, the ratio of market capitalization to GDP,
volume and value traded, is an important indicator of market
development.
The development of the stock market also critically
depends on accessibility for investors and firms to access to
the market. Less concentration of top firms in market is
preferred for a well-develop market. This means not only
large firms, but also small companies can raise fund and
compete fairly in the market. Therefore, the access dimension
of the stock market development is measured by number of
listed firms, number of newly IPO (during 2012),
concentration ratio or the sum of market share of largest 10
firms in term of market capitalization, and the
Herfindahl-Hirschman index (HHI). High HHI determines if
a monopoly exists.
The third dimension is efficiency. A well-developed stock
market should provide the opportunity for investors and
participants to allocate capital to productive investments
efficiently. A more efficient stock market should have low
degree of co-movement of individual stocks with the market.
Also, to be efficient, stock price should have high frequent
price movement as reflect in low transaction cost. Thus, we
use four variables as a proxy for efficiency, namely average
total trading cost, percentage of stocks having
autocorrelation and having zero returns. Lastly, R-squared,
the measure of stock price synchronicity, to measure the
degree of co-movement of individual stocks with the market.
Theoretically, the presence of stock markets would
mitigate the principal agent problem and reduce asymmetry
information, thus promoting stability and long-term growth,
as in [9]. Given that the stock price at any time is mirror of
firm performance, weakening corporate governance would
be reflected tendency to manipulate earnings of the firms to
window dressing its performance. In a well-functioning stock
market, this behavior should be minimal. Moreover, to be
stable, stock returns should distribute normal and the market
should have less skewed as well. Also, the percentage of
earning manipulation is an indicator to measure the market
stability. The more companies manipulate its earning, the less
stable the financial market. We also consider average
financial information such as Price to earnings ratio, Price to
book ratio, and dividend yield to be part of stability.
III. METHODOLOGY
This study collected the data from various sources. The
data collection includes synthesizing information already
being collected by international and national organizations.
The data are synthesized from the Global Competitiveness
Report in the year 2012 presented by [10]-[11]. For stock
market information, we collect from the stock market
database of each country, the World Federation of Exchanges
database, Compustat and Datastream database between
2007-2012. We use guidelines proposed by [12] to describe
and compute the relative value of subcategories under each
development indicator among ASEAN-5 stock markets. The
relative value of each indicator for assessment of stock
market development among 5 nations can be done by using
equation (1).
10
A.i A
A,i
A A
Value - MinC =
Max - Min (1)
where CA,i is the relative value of factor A for stock market i;
ValueA,i is the numeric value of factor A for stock market i;
MinA is the minimum value of factor A among all stock
markets; MaxA is the maximum value of factor A among all
stock markets; 10 is the graph scale full points to compare
among stock markets; and i is the stock markets in this
analysis which are SGX, SET, BM, PSE, and IDX.
In principle, a well-developed stock market should
theoretically perform better than a less-developed equity
market in all dimensions. Therefore, we hypothesize that the
cumulated overall relative value for a more developed
country should have higher value than less developed
countries.
IV. RESULTS
The development of stock markets among ASEAN-5
nations is analyzed in this section. The analysis considers
four aspects of stock market development including 1) Size,
2) Access, 3) Efficiency, and 4) Stability. To illustrate the
results, Table I shows that mean score of the four stock
market development indicators among ASEAN-5 nations.
Overall, the SGX holds the first rank (Overall score = 27.52),
then the SET (Overall score = 25.14), the BM (Overall score
= 23.38). Whereas the IDX (Overall score = 14.49) and PSE
(Overall score =11.46) are the fourth and the fifth ranked,
respectively. The details are shown in Table I.
International Journal of Trade, Economics and Finance, Vol. 4, No. 6, December 2013
344

TABLE I: STOCK MARKET DEVELOPMENT INDICATORS
Indonesia Malaysia Philippines Singapore Thailand
Size
-Mkt. Cap 3.7 4.4 0.0 10.0 3.0 World Federation Exchange 2012
-Mkt/GDP 0.0 5.0 1.4 10.0 1.5 World Bank 2012
-Volume of share trading 7.2 0.0 0.8 3.7 10.0 DataStream 2012
-Value of share trading 2.8 3.7 0.0 10.0 6.9 DataStream 2012
Average scores 3.43 3.30 0.53 8.41 5.35
Access
-Companies Listed 3.0 10.0 0.0 7.8 4.4 World Federation Exchange 2012
-Newly list companies (2012) 10.0 6.7 0.0 9.4 7.2 World Federation Exchange 2012
-CR-10 0.7 7.1 0.7 10.0 0.0 Calculated from Compustat 2012
-HHI-Mkt cap 2.9 10.0 0.0 2.9 4.3 Calculated from Compustat 2012
Average scores 4.1 8.5 0.2 7.5 4.0
Efficiency
-Average total cost (Bp) 5.7 9.7 0.0 10.0 7.2 The Elkins/Mcsherry Global Trading Cost Analysis Report 2012
-% of companies with autocorrelation 10.0 4.9 6.3 0.0 8.2 Calculated from DataStream 2012
-Zero return (%) 3.5 4.5 9.4 0.0 10.0 Calculated from DataStream 2012
-Synchronity (R-square) 1.9 6.3 5.9 10.0 0.0 Calculated from DataStream 2012
Average scores 5.3 6.4 5.4 5.0 6.3
Stability
-SKEW 6.3 0.0 10.0 9.6 9.5 Calculated from DataStream 2012
-Manipulation Earning (% of Companies) 0.0 9.7 9.7 0.0 10.0 Calculated from Compustat 2012
-Fundamental information
PE ratio 1.4 3.5 0.0 9.6 10.0 Calculated from DataStream 2012
PB ratio 0.0 7.3 7.0 10.0 7.9 Calculated from DataStream 2012
DY 0.5 5.9 0.0 3.7 10.0 Calculated from DataStream 2012
Average scores 1.6 5.3 5.3 6.6 9.5
Overall scores 14.49 23.38 11.46 27.52 25.14
DimensionScore (0-10)
Remark
Comparing size dimension of the equity market between 5
countries, SGX earns the highest level of development in
term of market capitalization relative to its economy and
value of share trading. The average relative value for size
dimension of SGX is far beyond other equity market in the
region with an average relative value of 8.41, followed by
SET, IDX, BM, and PSE, with average relative value for size
of 5.35, 3.43, 3.3, and 0.53 respectively.
Considering the access dimension, BM gains its
competitiveness in providing opportunity for firms to raise
capitals in the stock exchange. The average relative value for
access dimension of BM is 8.50, closely followed by SGX
with an average relative value of 7.50. These two equity
markets are less concentrated and has a large number of
newly companies listed on the exchanges. SET and IDX have
moderate average relative value of 4.0 for access dimension.
However, PSE needs to be improved for small companies to
get access to equity market.
Details of efficiency dimension are found and all equity
market in this region has relatively similar level of efficiency.
SGX is the lead in terms of low trading costs and low
com-movement of individual stock returns relative to the
market. IDX and SET have strengths on their less proportion
of firms that are correlated to the market.
Regarding to stability dimension, SET has highest average
score in this dimension, followed by SGX, BM, PSE, and
IDX. The SET takes a lead in low P/E ratio and high dividend
yield compared to other equity markets in the region, while
IDX loses its ground in all aspects.
Next, we describe the level of stock market development
using area within each equity market’s diamond. Different
shape of a diamond illustrates the overall different in each
dimension of stock market development. We can separate the
diamond of ASEAN-5 equity markets into two groups
according to their relative position in each dimension. The
first set is composed of IDX and PSE as shown in Fig. 2.
Fig. 2. The four dimension of the Stock market development indicators of
IDX and PSE.
From the figure, we can see that PSE has to improve on its
access and size dimension comparing to IDX. Only stability
dimension of PSE is superior to its counterparts, IDX.
The second group is comprised of SGX, SET, and BM.
Fig. 3 illustrates the graphical presentation of the four
dimensions in assessing the stock market development
indicators. SGX signifies the highest level of development.
This is due to the strongest dimension in size and relatively
strong in access and stability dimension. SGX holds the top
position for size dimension. The access of the SGX is in the
second position of the analyzed equity markets; followed
BM. BM has its strength in high efficiency and access
dimension. SET has its strength in stability and efficiency,
but need to improve its access dimension.
The areas under the graph for all stock market
development dimensions are calculated and compare among
countries in this region. SGX has the highest stock market
development among ASEAN-5 as demonstrated in Fig. 4,
followed by SET, BM, and IDX, and whereas PSE was the
lowest ranked in overall dimensions.
International Journal of Trade, Economics and Finance, Vol. 4, No. 6, December 2013
345

Fig. 3. The four dimension of the Stock market development indicators of
SGX, BM and SET.
Fig. 4. The area under the graph for all dimensions among ASEAN-5 equity
markets.
V. CONCLUSION
This study analyzes the stock market development
indicators among ASEAN-5 equity markets. We apply the
FSDI’s framework to assess stock market development. This
framework considers four aspects of stock market
development including size, access, efficiency and stability.
The analysis based on these four dimensions separate these
stock markets into two groups. The well-developed equity
markets are the SGX, SET, and BM. Overall, there is a high
tendency that after full participation of ASEAN Exchange,
SGX will take the lead. However, efficiency is its major
pullbacks. BM has high level of development close to SGX.
SET has high potential to move from its current position as it
has highest score in stability aspect. BM has built on its
accessibility since it has highest number of listed firms and
least concentrated market. However, the volume and
turnover rate of BM is low. IDX has advantage in size and
number of listed firms, while its weaknesses are efficiency
and stability. PPE is ranked lowest in most aspects and
needed to improve its current status to achieve higher level of
stock market development.
REFERENCES
[1] World Federation of Exchanges. (February 2013). WFE 2012 market
highlights. [Online]. Available:
http://www.world-exchanges.org/files/statistics/2012%20WFE%20M
arket%20Highlights.pdf
[2] M. Pagano, ―Financial markets and growth: An overview,‖ Eupropean
Economic Reviews, vol. 37, no. 2-3, pp. 613-622, 1993.
[3] A. Demirguc-Kunt and R. Levine, ―Stock market development and
Financial Intermediaries: Stylized Facts,‖ The World Bank Economic
Review, vol. 10, no. 2, pp. 291-321, 1996.
[4] B. Thorsten and R. Levine, ―Stock markets, banks, and growth: panel
evidence,‖ Journal of Banking and Finance, vol. 28, pp. 423–442,
2003.
[5] B. Seetanah and S. Ramessur, "Financial development and economic
growth," Journal of Economic Studies, vol. 36, no. 2, pp. 124-134,
2008.
[6] R. Levine and S. Zervos, ―Stock markets, banks, and economic
growth,‖ American Economic Review, vol. 88, no. 3, pp. 537-58, 1998.
[7] V. F. Garcia and L. Liu, ―Macroeconomic determinants of stock market
development,‖ Journal of Applied Economics, vol. 2, no. 1, May 29-59,
1999.
[8] M. Dailami and M. Atkin, "Stock markets in developing countries: key
issues and a research agenda," Policy Research Working Paper Series
515, The World Bank, 1990.
[9] C. Adjasi and N. Biekpe, ―Stock market development and economic
growth: the case of selected African countries,‖ African Development
Review, vol. 18, pp. 144–161, April 2006.
[10] World Economic Forum. (December 2012). Global Competitiveness
Report 2012-2013. [Online]. Available:
http://www3.weforum.org/docs/WEF_GlobalCompetitivenessReport_
2012-13.pdf
[11] International Institute for Management Development, IMD World
Competitiveness Yearbook 2012, Lausanne, Switzerland: IMD, 2012.
[12] H. B. J. Stone and A. Ranchhod. (2006). Competitive advantage of
nation in the global arena: A quantitative advancement to Porter’s
diamond applied to the UK, USA and BRIC nations. Strategic Change.
[Online]. 15. pp. 283-294. Available: http://www.relooney.info/
0_New_12638.pdf
Pariyada Sukcharoensin was born in Bangkok,
Thailand. She received her doctoral degree in finance
from Thammasat University. Previously, she worked
with the Stock Exchange of Thailand (SET). She is now
a full-time lecturer at the Graduate School of
Development Economics, National Institute of
Development Administration (NIDA) and also a visiting
lecturer for many graduate programs. Further, she is the
exam committee of the securities analyst program for
investment professionals. She is an author of the chapters about derivatives
market in the books published by the Stock Exchange of Thailand and
Thammasat Business School.
Dr. Sukcharoensin had participated in conducting the Master Plan for
Thailand’s Capital Markets proposed to the Minister of Finance. She had also
engaged in the project funded by the Thailand Research Fund (TRF). Her
academic experiences also include various working papers in finance and the
presentations at the top international conferences in the USA and Asia. She
had received the best research paper awards from the National Research
Council of Thailand (NRCT) and the Capital Market Research Institute
(CMRI), the Stock Exchange of Thailand. Her research interests include risk
management, derivatives, portfolio management, financial econometrics,
corporate finance, and personal finance.
Sorasart Sukcharoensin was born in Bangkok,
Thailand. He earned his doctoral degree in finance
from Thammasat University. Currently, he is an
associate dean for academic affairs at the Graduate
School of Development Economics at the National
Institute of Development Administration (NIDA). He
is an author of the article on the role of debt in good
governance published by the Thai Bond Dealing
Centre (ThaiBDC).
Dr. Sukcharoensin had been the project supervisor and consultant to the
corporate governance project of the Thai Institute of Directors (IOD), the
Stock Exchange of Thailand (SET), and Sasin Graduate Institute of Business
Administration. He had also engaged in many research projects funded by
the National Research Council of Thailand (NRCT), the Thailand Research
Fund (TRF), the Small Business Credit Guarantee Corporation (SBCG), and
the Student Loans Fund. He had received a professional trainer award from
the Stock Exchange of Thailand and achieved the Rajapruk award for
teaching excellence from the National Institute of Development
Administration. His research interests include capital market development,
corporate governance, corporate finance, derivatives, insider trading, market
microstructure, and securities analysis.
International Journal of Trade, Economics and Finance, Vol. 4, No. 6, December 2013
346