the annual cost of corrosion for air force aircraft...
TRANSCRIPT

THE ANNUAL COST OF CORROSION FOR AIR FORCE AIRCRAFT AND MISSILE EQUIPMENT
REPORT MEC81T2
Dav id A . Forman
Ron Ba ty
Er i c F. Herzberg
Amel ia R . Ke l l y
Muthu V. Kumaran
Norman T. O ’Meara , Ph .D.
J U N E 2 0 0 9
NOTICE:
THE VIEWS, OPINIONS, AND FINDINGS CON-
TAINED IN THIS REPORT ARE THOSE OF LMI
AND SHOULD NOT BE CONSTRUED AS AN OFFI-
CIAL AGENCY POSITION, POLICY, OR DECISION,
UNLESS SO DESIGNATED BY OTHER OFFICIAL
DOCUMENTATION.
LMI © 2009. ALL RIGHTS RESERVED.

The Annual Cost of Corrosion for Air Force Aircraft and Missile Equipment MEC81T2/JUNE 2009
Executive Summary
We know from earlier studies that the annual cost of corrosion for Department of Defense (DoD) facilities, infrastructure, and equipment is between $9 billion and $20 billion.1 Although the spread between these estimates is large, both figures confirm that corrosion costs are substantial. Congress, concerned with the high cost of corrosion and its negative effect on military equipment and facilities and infrastructure, enacted legislation in December 2002 that endowed the office of the Under Secretary of Defense for Acquisition, Technology, and Logistics (USD[AT&L]) with the overall responsibility for preventing and mitigating the effects of corrosion on military equipment and infrastructure.2,3
Under the leadership and sponsorship of the USD(AT&L), LMI assessed the cost of corrosion for Air Force aircraft and ballistic missile equipment, using FY2007 as a measurement baseline. Using a method approved by the Corrosion Prevention and Control Integrated Product Team (CPC IPT), we estimated the annual corro-sion cost for Air Force aircraft and missiles to be $5.4 billion.
The method we used to measure corrosion-related cost4 focuses on tangible direct material and labor costs, but it also considers some indirect costs that are outside normal maintenance reporting, like research and development (R&D) and train-ing. We used a combined top-down and bottom-up approach to arrive at this cor-rosion cost estimate. The top-down portion uses summary-level cost and budget documentation to establish spending ceilings for depot- and field-level mainte-nance for both organic and commercial maintenance activities. This establishes a maximum cost of corrosion in each activity. The bottom-up portion uses detailed work order records to account for actual occurrences of corrosion maintenance
1 The $9 billion estimate is from Kinzie and Jett, DoD Cost of Corrosion, 23 July 2003, p. 3.
The $20 billion estimate is from Gerhardus H. Koch et al., Corrosion Cost and Prevention Strate-gies in the United States, CC Technologies and NACE International in cooperation with the Department of Transportation, Federal Highway Administration, 30 September 2001.
2 The Bob Stump National Defense Authorization Act for Fiscal Year 2003, Public Law 107-314, 2 December 2002, p. 201.
3 Public Law 107-314 was enhanced by Public Law 110-181, The National Defense Authori-zation Act for Fiscal Year 2008, 28 January 2008, Section 371.
4 “Cost” includes known or identified actual expenditures.
iii

and prevention actions. This establishes a minimum level of corrosion costs in each activity area. When necessary, we use statistical methods to bridge any sig-nificant gaps between the top-down and bottom-up figures to derive a final esti-mate for the cost of corrosion in each area.
This cost estimation method was documented in an August 2004 report issued by the CPC IPT.5 The current cost-of-corrosion study of Air Force aircraft and mis-siles is part of a multiple-year plan to measure the cost of corrosion for DoD using the proposed method. Past and future study areas are listed in Table ES-1. At 32 percent, the Air Force’s corrosion costs as a percentage of total maintenance are the highest of the studies completed thus far.
Table ES-1. Cost-of-Corrosion Studies
Study year Study segment Annual cost of corrosion Data baseline
2005–2006 Army ground vehicles $2.0 billion FY2004 Navy ships $2.4 billion FY2004
2006–2007 DoD facilities and infrastructure $1.8 billion FY2005 Army aviation and missiles $1.6 billion FY2005 Marine Corps ground vehicles $0.7 billion FY2005
2007–2008 Navy and Marine Corps aviation $3.0 billion FY2005 and FY2006 Coast Guard aviation and ves-
sels $0.3 billion FY2005 and FY2006
2008–2009 Air Force aircraft and missiles $5.4 billion FY2006 and FY2007 Army ground vehicles $2.4 billion FY2006 and FY2007 Navy ships pending FY2006 and FY2007
2009–2010 Repeat 2006–2007 2010–2011 Repeat 2007–2008
We used 2 years of data for the most recent study, as compared to a single year of data in previous efforts. This enhancement to our study method yielded more in-depth data and additional data points for analysis. We base our discussion and primary analysis on the most recent data (FY2007), but provide both FY2006 and FY2007 results in the database.
The scope of our study included an inventory of 5,774 Air Force aircraft and 2,258 Air Force missiles. We estimated $5.3 billion for corrosion costs for 112 types of Air Force aircraft and $100 million for corrosion costs for 9 types of Air Force missiles.
We used three schema groups to categorize corrosion costs associated with air-craft and missile equipment: Group 1—Depot-level maintenance (DLM) costs, field-level maintenance (FLM) costs, and costs that are outside normal reporting (ONR); Group 2—Corrective versus preventive costs; and Group 3—Structure-related versus parts-related costs.
5 CPC IPT, Proposed Method and Structure for Determining the Cost of Corrosion for the Department of Defense, August 2004.
iv
Executive Summary
In Figure ES-1, we show the study results segregated by schema. Percentages reflect the relative ratio of the different schemas.
Figure ES-1. Cost of Corrosion for Air Force Aircraft and Missile Equipment by Schema (FY2007 data)
Aviation Type 141 Cost Percentage of total
Aviation Type 080 Cost Percentage of total
Parts corrosion costs
Structure corrosion costs
Preventive corrosion costs
Corrective corrosion costs
ONR corrosion costs
FLM corrosion costs
DLM corrosion costs
Percentage of totalCostAviation Type 001
72%$3,810Parts corrosion costs
25%$1,340Structure corrosion costs
52%$2,736Preventive corrosion costs
48%$2,551Corrective corrosion costs
3%$147ONR corrosion costs
42%$2,289FLM corrosion costs
55%$2,997DLM corrosion costs
Percentage of total cost
Total cost(in millions)Schema
Note: This figure does not depict the $136 million in corrosion costs that we are unable to assign to either
structure or parts.
Corrosion-related DLM costs ($2.997 billion) exceed corrosion-related FLM costs ($2.289 billion) by more than $700 million; however, each is approximately 32 per-cent of their respective total aircraft and missile maintenance cost (see Table ES-2). Together, DLM and FLM account for 97 percent of the total combined corrosion cost for Air Force aircraft and missiles ($5.286 billion). ONR corrosion costs are minor ($147 million) when compared to those associated with DLM and FLM.
Table ES-2. Comparison of Air Force DLM and FLM Corrosion Cost as a Percentage of Maintenance Cost (FY2007)
Maintenance level
Total aircraft and missile maintenance cost
Corrosion cost
Corrosion as a percentage of total aircraft and missile
maintenance
Depot $9,289 million $2,997 million 32.3%
Field $7,121 million $2,289 million 32.1%
Total $16,410 million $5,286 million 32.2%
v
Slightly more of the corrosion costs are associated with preventive (52 percent) rather than corrective maintenance (48 percent). It’s not clear what the optimum corrective-to-preventive ratio of corrosion costs should be, but DoD hopes to learn about optimum ratios as studies continue. In addition, the corrosion cost of parts greatly exceeds the corrosion cost of structures by a ratio of almost 3 to 1.
We stratified the corrosion costs of Air Force aircraft and missiles mission design series (MDS) by total cost and cost per item. We then ranked the top 10 for average corrosion cost and total corrosion cost (see Table ES-3). The aircraft listed in Table ES-3 are candidates for further focus. The order in which they are listed suggests a priority for further examination.
Table ES-3. Air Force Aircraft and Missiles with the Highest Combined Rankings of Average Corrosion Cost Per Item and Total Corrosion Cost
Top 10
General nomenclature
Corrosion cost per item
(in millions)
Per-item corrosion cost
rank Total corrosion
cost (in millions) Total corrosion
cost rank Combined
rank
1 B-1B $3.7 1 $251.2 5 6
2 B-52H $2.6 5 $240.3 6 11
3 C-5A $3.5 2 $203.8 9 11
4 KC-135R $1.2 12 $451.4 2 14
5 A-10A $1.1 14 $276.2 3 17
6 C-5B $1.7 7 $81.1 12 19
7 C130-J $2.1 6 $80.5 13 19
8 B-2A $3.0 3 $63.3 17 20
9 C130-H $1.0 16 $273.8 4 20
10 MC-130H $2.9 4 $58.4 18 22
Since the early 1990s, the Air Force has sponsored a series of studies to determine its annual direct corrosion maintenance costs. The most recent study—completed in FY2004—estimated the Air Force’s annual direct corrosion cost to be $1.5 bil-lion (FY2004 dollars). There are several significant reasons for the $3.93 billion difference between the results of that most recent study ($1.5 billion) and our re-sults ($5.43 billion). The major differences, which account for $3.44 billion (or 88 percent of the difference), are as follows:
CPC IPT method includes commercial depot costs (difference of $1.33 billion)
CPC IPT method includes indirect labor costs (difference of $1.62 billion)
Increase in labor rates (difference of $0.65 billion)
Difference in study elements (difference of −$0.16 billion).
vi

Contents
Chapter 1 Background and Analysis Method............................................1-1
STUDY OBJECTIVES................................................................................................... 1-2
STUDY DEFINITIONS AND ASSUMPTIONS...................................................................... 1-2
Types of Corrosion Cost Decisions ................................................................... 1-3
Effects of Corrosion ........................................................................................... 1-3
What Is a Corrosion Cost? ................................................................................ 1-4
Deferred Maintenance ....................................................................................... 1-5
Identifying Corrosion Cost ................................................................................. 1-6
Use of Corrosion Cost Information .................................................................... 1-6
CORROSION COST CATEGORIES................................................................................. 1-7
DLM, FLM, and ONR Costs............................................................................... 1-7
Corrective and Preventive Costs ....................................................................... 1-8
Structure and Parts Costs ............................................................................... 1-10
TOP-DOWN AND BOTTOM-UP COSTING OF DOD CORROSION ..................................... 1-11
Top-Down Cost Measurement......................................................................... 1-11
Bottom-Up Cost Measurement ........................................................................ 1-12
Combined Top-Down and Bottom-Up Cost Measurement .............................. 1-13
CORROSION COST TREE.......................................................................................... 1-14
DATA STRUCTURE AND ANALYSIS CAPABILITIES......................................................... 1-16
AIR FORCE AIRCRAFT ORGANIZATION ....................................................................... 1-17
Aircraft Maintenance Structure ........................................................................ 1-18
Aircraft Corrosion Organization ....................................................................... 1-20
Aircraft and Missiles Equipment List................................................................ 1-21
REPORT ORGANIZATION........................................................................................... 1-22
Chapter 2 Air Force Aircraft and Missile Corrosion Costs.........................2-1
DETERMINATION OF CORROSION COSTS ..................................................................... 2-1
vii

DLM COST OF CORROSION (NODES A AND B ) ........................................................ 2-2
Maintenance Process Versus Maintenance Repair ........................................... 2-2
Organic DLM Corrosion Costs (Nodes A1 and B1 )....................................... 2-5
Commercial DLM Corrosion Costs (Nodes A2 and B2 ) .............................. 2-20
FLM COST OF CORROSION (NODES C AND D ) ...................................................... 2-22
FLM Top-Down Analysis ................................................................................. 2-24
FLM Bottom-Up Analysis................................................................................. 2-28
ONR COST OF CORROSION (NODES E , F , AND G ) .............................................. 2-34
Labor of Non-Maintenance Aircraft and Missile Operators (Node E )............. 2-34
Priority 2 and 3 Costs (Node F ) ..................................................................... 2-36
Purchase Cards (Node G )............................................................................. 2-38
FINAL AIR FORCE AIRCRAFT AND MISSILE CORROSION COST TREE (NODES A THROUGH G ) ........................................................................... 2-39
Chapter 3 Summary and Analysis of Corrosion Costs..............................3-1
AIR FORCE CORROSION COSTS BY NODE.................................................................... 3-1
AIR FORCE CORROSION COSTS BY EQUIPMENT TYPE .................................................. 3-2
AIR FORCE CORROSION COSTS BY WUC.................................................................... 3-6
AIR FORCE CORROSION COSTS—CORRECTIVE VERSUS PREVENTIVE COSTS................ 3-8
AIR FORCE CORROSION COSTS—PARTS VERSUS STRUCTURE .................................... 3-9
2004 USAF DIRECT COSTS OF CORROSION STUDY .................................................. 3-10
Appendix A Corrosion Cost Element Definitions
Appendix B Typical Corrosion Activities
Appendix C Air Force Aircraft and Ballistic Missile Equipment
Appendix D Air Force Aircraft and Missile Corrosion Cost Data Sources by Node
Appendix E Depot-Level Corrosion Profile
Appendix F Key Corrosion Words
Appendix G Mapping Work Unit Codes to Work Breakdown Structure and Parts and Structure
viii
Contents
Appendix H Field-Level Corrosion Profile
Appendix I Air Force Survey Results
Appendix J Abbreviations
Figures Figure 1-1. Corroded Helicopter.............................................................................. 1-4
Figure 1-2. Preventive and Corrective Corrosion Cost Curves ............................... 1-9
Figure 1-3. Top-Down Corrosion Cost Measurement Method .............................. 1-11
Figure 1-4. Bottom-Up Corrosion Cost Measurement Method.............................. 1-12
Figure 1-5. Combined Top-Down and Bottom-Up Approach ................................ 1-14
Figure 1-6. Corrosion Cost Tree ........................................................................... 1-14
Figure 1-7. Corrosion Cost Tree—Depot Maintenance Costs............................... 1-15
Figure 1-8. Data Structure and Methods of Analysis............................................. 1-16
Figure 1-9. Air Force Major Command Structure .................................................. 1-18
Figure 1-10. AFMC Structure for Depot-Level Aircraft Maintenance..................... 1-19
Figure 1-11. AFCPCO Command Structure.......................................................... 1-21
Figure 2-1. Air Force Aircraft and Missile Equipment Sustainment Corrosion Cost Tree........................................................................................................... 2-1
Figure 2-2. Air Force Aircraft and Missile DLM Corrosion Costs (in millions).......... 2-4
Figure 2-3. Air Force Aircraft and Missile Organic DLM Corrosion Costs (in millions, FY2007).......................................................................................... 2-6
Figure 2-4. Air Force Aircraft and Missile Organic DLM Labor Cost Tree (in millions) ...................................................................................................... 2-11
Figure 2-5. Air Force Aircraft and Missile Organic DLM Materials Cost Tree (in millions) ...................................................................................................... 2-17
Figure 2-6. Air Force Aircraft and Missile Commercial DLM Cost Tree Section (in millions) ...................................................................................................... 2-20
Figure 2-7. Use of Corrosion Ratios to Determine Commercial DLM Corrosion Cost (Example—B1-B, Lancer [MDS: B001B])................................................ 2-22
Figure 2-8. Air Force Aircraft and Missile FLM Corrosion Cost (in millions).......... 2-23
Figure 2-9. Air Force Aircraft and Missile Organic FLM Labor Corrosion Cost (in millions) ...................................................................................................... 2-29
ix

Figure 2-10. Air Force Aircraft and Missile Organic FLM Materials Corrosion Cost (in millions) .............................................................................................. 2-32
Figure 2-11. Air Force Aircraft and Missile Commercial FLM Labor and Materials Corrosion Costs (in millions) ..................................................... 2-33
Figure 2-12. Air Force Aircraft and Missile Corrosion ONR Costs ........................ 2-34
Figure 2-13. Final Air Force Aircraft and Missile Corrosion Cost Tree .................. 2-39
Figure 3-1. MDS: F016C; F-16C Fighting Falcon.................................................... 3-3
Tables Table 1-1. Cost-of-Corrosion Studies to Date and Future Efforts ........................... 1-2
Table 1-2. Prioritization of Corrosion Cost Elements .............................................. 1-6
Table 1-3. Classification of Corrosion Cost Elements into Preventive or Corrective Natures ........................................................................................ 1-9
Table 1-4. Air Force Aircraft and Missiles by Component ..................................... 1-21
Table 2-1. DLM Action Steps for Air Force Aircraft and Missile Equipment ............ 2-3
Table 2-2. Air Force Aircraft and Missile Equipment DLM Organic and Commercial Corrosion Cost (in millions)..................................................... 2-5
Table 2-3. Percentage of DLM Workload for Air Force Aircraft and Missiles .......... 2-8
Table 2-4. Distribution of Organic DLM Labor Costs by Maintenance Action Step ...................................................................................................... 2-12
Table 2-5. Work Records Assigned to DLM Steps 1, 4, 7, or M (Notional Example—F-16 Fighting Falcon at ALC Ogden) .............................. 2-13
Table 2-6. Organic DLM Data with Labor Records Analyzed for Corrosion Cost using Corrosion-Related Keywords (Notional Example— F-16 Fighting Falcon at ALC Ogden)............................................................... 2-14
Table 2-7. Applying the Corrosion Percentages to Determine Organic DLM Labor Corrosion (Notional Example—F-16 Fighting Falcon at ALC Ogden) ... 2-15
Table 2-8. Organic DLM Aircraft and Missile Labor and Corrosion Costs by Process Step .............................................................................................. 2-16
Table 2-9. Relationship of Labor Maintenance Operation to JON (Notional Example—F-16 Fighting Falcon at ALC Ogden) .............................. 2-18
Table 2-10. Relationship of Materials Requisition to JON (Notional Example—F-16 Fighting Falcon at ALC Ogden) .............................. 2-19
Table 2-11. Allocation of Material Costs to Labor Records (Notional Example—F-16 Fighting Falcon at ALC Ogden) .............................. 2-19
x

Contents
Table 2-12. Staffing Levels and Cost by Military Component for Air Force FLM Maintainers.............................................................................................. 2-24
Table 2-13. Air Force FLM Spares and Repair Parts Consumables Budget for FY2007....................................................................................................... 2-25
Table 2-14. Percentage of Air Force FLM Workforce Involved in Aircraft and Missile Maintenance ................................................................................. 2-27
Table 2-15. Air Force Aircraft and Missile FLM Totals from Spares and Repair Parts Consumables Budget for FY2007........................................ 2-28
Table 2-16. Air Force Aircraft and Missile Operator Duty Positions ...................... 2-35
Table 2-17. DMDC Air Force Aircraft and Missile Operator Manning Levels ........ 2-35
Table 2-18. Corrosion Cost of Non-Maintenance Air Force Personnel Who Operate Aircraft and Missile Equipment .................................................. 2-36
Table 2-19. Possible Air Force Aircraft and Missile Weapon System or Equipment Corrosion RDT&E Projects........................................................ 2-37
Table 2-20. Air Force Corrosion-Related Facility Costs (in millions) ..................... 2-37
Table 3-1. Air Force Aircraft and Missile Equipment Corrosion Cost by Node and Sub-Node (FY2007) ..................................................................... 3-1
Table 3-2. Top 20 Contributors to Aircraft and Missile Corrosion Cost by Type (FY2007).............................................................................................. 3-2
Table 3-3. Top 20 Aircraft and Missile Corrosion Cost per Item (FY2007).............. 3-4
Table 3-4. Air Force Aircraft and Missiles with the Highest Combined Ranks of Average Corrosion Cost per Item and Total Corrosion Cost (FY2007).......... 3-5
Table 3-5. Top 20 Air Force Aircraft and Missile Equipment Corrosion Cost Ranking by WUC (FY2007) ............................................................................... 3-6
Table 3-6. Air Force Aircraft and Missile Equipment Corrosion Cost by WUC as a Percentage of Maintenance Cost (FY2007)............................................... 3-7
Table 3-7. Air Force Aircraft and Missile Equipment Corrective and Preventive Corrosion Cost (FY2007)................................................................................... 3-8
Table 3-8. Air Force Aircraft and Missile Equipment Corrective to Preventive Corrosion Cost Ratio (FY2007) ......................................................................... 3-9
Table 3-9. Air Force Aircraft and Missile Equipment Corrosion Cost by Parts Versus Structure (FY2007).............................................................................. 3-10
Table 3-10. Cost Comparison—Differences Between the LMI Study and 2004 C2 Technology Study (in billions)..................................................................... 3-12
xi

xii

Chapter 1 Background and Analysis Method
We know from two separate studies that the cost of corrosion for Department of Defense infrastructure and equipment is estimated to be between $9 billion and $20 billion per year.1 Although the spread between these estimates is large, both studies confirm that corrosion costs are significant.
Congress, concerned with the high cost of corrosion and its negative effect on mili-tary equipment and infrastructure, enacted legislation in December 2002 that en-dowed the office of the Under Secretary of Defense for Acquisition, Technology, and Logistics (USD[AT&L]) with the overall responsibility for preventing and mitigating the impact of corrosion on military equipment and infrastructure.2 To perform its mission of corrosion prevention and mitigation, fulfill congressional requirements, and respond to Government Accountability Office (GAO) recommendations, the USD(AT&L) established the Corrosion Prevention and Control Integrated Prod-uct Team (CPC IPT), a cross-functional team of personnel from all the military services, other government agencies, academia, and private industry.
In response to a GAO recommendation to “develop standardized methodologies for collecting and analyzing corrosion cost, readiness, and safety data,”3 the CPC IPT created a standard method to measure the cost of corrosion of military equipment and infrastructure.4 Because the data-gathering effort is large and complex, the CPC IPT is measuring the total DoD cost of corrosion in segments. In April of 2006, the CPC IPT published the results of its first study using the standard corrosion cost estimation method.5
We present the results of the completed and current studies and the timeline for future corrosion studies in Table 1-1.
1 The $9 billion estimate is from Kinzie and Jett, DoD Cost of Corrosion, 23 July 2003, p. 3.
The $20 billion estimate is from Gerhardus H. Koch et al., Corrosion Cost and Prevention Strate-gies in the United States, CC Technologies and NACE International, in cooperation with the Department of Transportation, Federal Highway Administration, 30 September 2001.
2 The Bob Stump National Defense Authorization Act for Fiscal Year 2003, Public Law 107-314, 2 December 2002, p. 201.
3 GAO-03-753, Opportunities to Reduce Corrosion Costs and Increase Readiness, July 2003, p. 39. 4 DoD Corrosion Prevention and Control Integrated Product Team, Proposed Method and
Structure for Determining the Cost of Corrosion for the Department of Defense, August 2004. 5 LMI, The Annual Cost of Corrosion for Army Ground Vehicles and Navy Ships, Report
SKT50T1, Eric F. Herzberg et al., April 2006.
1-1

Table 1-1. Cost-of-Corrosion Studies to Date and Future Efforts
Study year Study segment Annual cost of corrosion Data baseline
2005–2006 Army ground vehicles $2.0 billion FY2004 Navy ships $2.4 billion FY2004 2006–2007 DoD facilities and infrastructure $1.8 billion FY2005
Army aircraft and missiles $1.6 billion FY2005
Marine Corps ground vehicles $0.7 billion FY2005 2007–2008 Navy aircraft $2.2 billion FY2005 and FY2006 Marine Corps aircraft $0.8 billion FY2005 and FY2006 Coast Guard aircraft $0.1 billion FY2005 and FY2006 Coast Guard ships $0.2 billion FY2005 and FY2006 2008–2009 Air Force aircraft and missiles $5.4 billion FY2006 and FY2007
Army ground vehicles $2.4 billion FY2006 and FY2007 Navy ships pending FY2006 and FY2007
2009–2010 Repeat 2006–2007 FY2007 and FY2008 2010–2011 Repeat 2007–2008 FY2008 and FY2009
LMI was tasked by the CPC IPT to measure in 2008–2009 the cost of corrosion for Air Force aircraft and ballistic missiles, Army ground vehicles, and Navy ships. This is the fourth segment of the CPC IPT plan. We chose to present the study results in separate reports to make them easier for each service to use. The results of the Air Force aircraft and ballistic missiles portion of the cost-of-corrosion study include data for FY2006 and FY2007. We present those results in this report, with FY2007 being the focus year.
STUDY OBJECTIVES We had two specific objectives for this study:
Measure the annual cost of corrosion for Air Force aircraft and ballistic missiles after their initial fielding.
Identify opportunities for corrosion cost reductions for Air Force aircraft and ballistic missiles.
STUDY DEFINITIONS AND ASSUMPTIONS To ensure consistency, we used the definition of corrosion stipulated by Congress: “The deterioration of a material or its properties due to a reaction of that material with its chemical environment.”6
6 Op. cit., Public Law 107-314, p. 202.
1-2

Background and Analysis Method
Types of Corrosion Cost Decisions When the CPC IPT developed the cost-of-corrosion study method, it wanted to determine the overall cost of corrosion as well as provide data that would allow users to make effective decisions to help prevent and mitigate the effects of corro-sion on their vehicles, aircraft, and vessels.
The CPC IPT’s method facilitates decision-making in five fundamental areas:
1. Quantify the overall problem to determine the level of resources (both in funding and manpower) to apply to the issue and provides a performance metric to assess effectiveness of the overall strategy to reduce the effect of corrosion.
2. Maximize the overall effectiveness of maintenance activities by classifying the costs as either preventive or corrective, and striking the proper balance between them.
3. Prioritize efforts by the source of the problem to determine which sources of corrosion to attack first.
4. Make project approval decisions and follow up on their effectiveness to help decision-makers prioritize projects according to their projected return on investment (ROI); projects with the highest ROI are addressed first. Once solutions are implemented, project leaders track the before and after costs to determine the effectiveness of the project.
5. Determine potential design deficiencies and feed that information back to the acquisition community.
The data provided in this report will help decision-makers in the first three areas. The data, data sources, and analysis method serve as a starting point, but effective decisions in areas 4 and 5 will require decision-makers to determine each project’s ROI and potential design deficiencies in more detail.
Effects of Corrosion Past studies have had difficulty isolating corrosion costs from non-corrosion costs because corrosion affects cost, readiness, and safety. We decided the clearest course was to treat all three areas separately and not try to determine the cost im-plications of corrosion-induced equipment readiness issues or safety concerns.
Cost information is extremely useful for facilitating decision-making. Decision-makers cannot use readiness and safety information to judge the cost-benefit tradeoffs on a project-by-project basis; nor can they use this information to meas-ure the scope of the corrosion problem or judge the overall effectiveness of a cho-sen corrosion mitigation strategy.
1-3

Focusing on cost information also eliminates the difficult task of turning non-cost measurements into costs. Imagine the difficulty in trying to put a value on the loss of life or a lost training opportunity. Trying to quantify the cost of readiness lost because of corrosion is similarly elusive.
What Is a Corrosion Cost? The task of defining a corrosion cost is challenging, even when its effects on readi-ness and safety are excluded. To illustrate, we use a generic example of an obviously corroded aircraft (see Figure 1-1).
Figure 1-1. Corroded Helicopter
Source: Lloyd Hihara, Professor, Hawaii Corrosion Laboratory,
Department of Mechanical Engineering.
Is there a corrosion cost if the aircraft has all of its capabilities, and merely looks unpleasing? If the aircraft was inspected for corrosion and an accurate estimate of corrosion treatment costs was determined, would these become corrosion costs, even if the maintenance was deferred due to a lack of currently available funds? If we design a more expensive aircraft that corrodes at a slower rate and is lighter (which results in fuel savings), how much of the increased cost of the aircraft is a corrosion cost?
We addressed these types of questions by defining corrosion costs as historical costs incurred because of a corrosion correction or prevention after the system or end item is fielded. This is known as the operating, support, or sustainment phase of a weapon system’s life cycle.
1-4

Background and Analysis Method
We measured the following specific cost elements of corrosion:
Man-hours (e.g., for inspection, repair, and treatment)
Materials usage
Corrosion facilities
Training
Research, development, testing, and evaluation (RDT&E).
We included RDT&E costs even though they may occur before the weapon sys-tem is fielded because we were able to separate efforts expended specifically for corrosion from other non-corrosion RDT&E efforts. The definition of each of these costs elements is presented in Appendix A.
Deferred Maintenance Identified but unresolved maintenance issues that cannot be corrected because of a lack of funding, scheduling conflicts, or operational requirements are known as “deferred maintenance.” DoD’s identification and reporting of deferred mainte-nance on military equipment and real property is governed by guidance issued by the Federal Accounting Standards and Advisory Board (FASAB). The reporting is included in the annual DoD Performance and Accountability Report.7
Although reporting of deferred maintenance per FASAB guidance is an annual requirement and may include potential future Air Force aircraft and missile equipment corrosion costs, we elected to exclude deferred maintenance from the study for the following reasons:
DoD deferred maintenance equipment reporting only includes depot main-tenance and does not identify corrosion as a separate maintenance issue.
Deferred maintenance equipment reporting only includes non-critical maintenance issues. Equipment maintenance requirements that affect safety or materiel readiness are not deferred and, if accomplished in FY2006–FY2007, are already included in the costing method.
Deferred maintenance equipment reporting only identifies estimated costs by system or end item. It does not provide cost information for individual maintenance issues, such as corrosion.
From an accounting standpoint, deferred maintenance is not a current-year cost. It is noted as a potential future expense. The maintenance identified as deferred may never be performed.
7 Required supplementary information of the DoD Performance and Accountability Report
available at http://www.defenselink.mil/comptroller/par/fy2004/03-06_RSI.pdf.
1-5

Identifying Corrosion Cost Maintenance required as a result of corrosion is rarely identified as such in report-ing systems. Therefore, it was necessary to develop a list of maintenance activities that typically counter the effects of corrosion. We found corrosion costs by look-ing for the costs associated with these activities.
Typical corrosion activities include cleaning, media blasting, and painting. The complete list of the anti-corrosion activities that serve as surrogates for corrosion costs is provided in Appendix B.
Use of Corrosion Cost Information Decision-makers can use cost information to pick which “battles” to fight first, choose the level of resources to dedicate, and predict or monitor the effect of cho-sen solutions on overall cost. Such information is tactically useful. Cost as a tacti-cal indicator is a useful measure of the effect of changes to potential root causes of corrosion. For example, the impact of a new aircraft corrosion treatment com-pound can be measured by its effect on the rate of aircraft degradation due to cor-rosion. This change in degradation rate eventually is reflected in higher or lower maintenance costs.
But not all costs are useful for these tactical decisions. Only costs that vary ac-cording to changes in root-cause corrosion conditions should be used. Because some costs are more useful in this type of tactical decision-making than others, they have more value and we considered them a higher priority to acquire.
Table 1-2 indicates which cost elements are the most tactically useful and their acquisition priority within this study.
Table 1-2. Prioritization of Corrosion Cost Elements
Cost element Is it tactically useful? Priority to acquire
Man-hours Yes 1
Materials Yes 1
Corrosion facilities Potentially 2
Training No 3
RDT&E No 3
Training and RDT&E are not tactically useful because, although they represent real expenditures, their costs and potential benefits are generally not attributable to a specific source of corrosion. While there are occasional exceptions (such as a training class that deals with a specific type of corrosion on a specific weapon system), the costs and benefits of training and RDT&E are usually spread over
1-6

Background and Analysis Method
many different sources of corrosion and weapon systems. Knowledge of these ex-penditures is necessary to determine the overall cost of corrosion.
Facilities costs can be tactically useful if their potential benefits can be tied to a single or a few weapon systems or root causes of corrosion. For example, the cost of a new maintenance facility has little tactical cost-of-corrosion benefit because it can be used by several types of weapon systems and it has many uses other than corrosion mitigation. The cost of a wash and corrosion treatment facility for heli-copters, on the other hand, may be tactically useful because the costs and benefits associated with the facility can be tied directly to a type of aircraft platform, and the main purpose of the facility is to prevent corrosion.
For the remainder of this report, we refer to corrosion facilities, training, and RDT&E costs as “outside normal reporting” costs.
CORROSION COST CATEGORIES It is advantageous to classify corrosion costs into major groupings that further de-scribe their overall nature and source of origin. We identified the following three schemas for analysis:
Schema 1: Depot-level maintenance (DLM), field-level maintenance (FLM), or outside normal reporting (ONR) costs
Schema 2: Corrective versus preventive costs
Schema 3: Structure versus parts costs.
DLM, FLM, and ONR Costs Based upon their general source of funding and level of maintenance, we segre-gated corrosion costs into three categories: DLM, FLM (both intermediate and organizational maintenance), and ONR.
DLM costs are incurred because of
materiel maintenance requiring major overhaul or a complete re-building of parts, assemblies, subassemblies, and end items, includ-ing the manufacture of parts, modifications, testing, and reclamation as required.8
8 Joint Publication 1-02, Department of Defense Dictionary of Military and Associated Terms,
12 April 2001 (as amended through 17 October 2007).
1-7
FLM costs are incurred because of materiel maintenance at both the in-termediate and organizational levels.
Intermediate maintenance is
the responsibility of and performed by designated maintenance activities for direct support of using organizations. Its phases normally consist of a) calibration, repair, or replacement of dam-aged or unserviceable parts, components, or assemblies; b) the emergency manufacture of non-available parts; and c) providing technical assistance to using organizations.9
Organizational maintenance is
the responsibility of and performed by a using organization on its assigned equipment. Its phases normally consist of inspecting, servicing, lubricating, and adjusting, as well as the replacing of parts, minor assemblies, and subassemblies.10
ONR costs cover corrosion prevention or correction activities that are not identified in traditional maintenance reporting systems. Examples of these costs include the time an aircraft crew member with a non-maintenance skill specialty spends inspecting the aircraft or the cost of corrosion-related training.
By identifying corrosion costs by their source of funding and level of mainte-nance, decision-makers can prioritize opportunities and allocate resources to mini-mize the effects of corrosion.
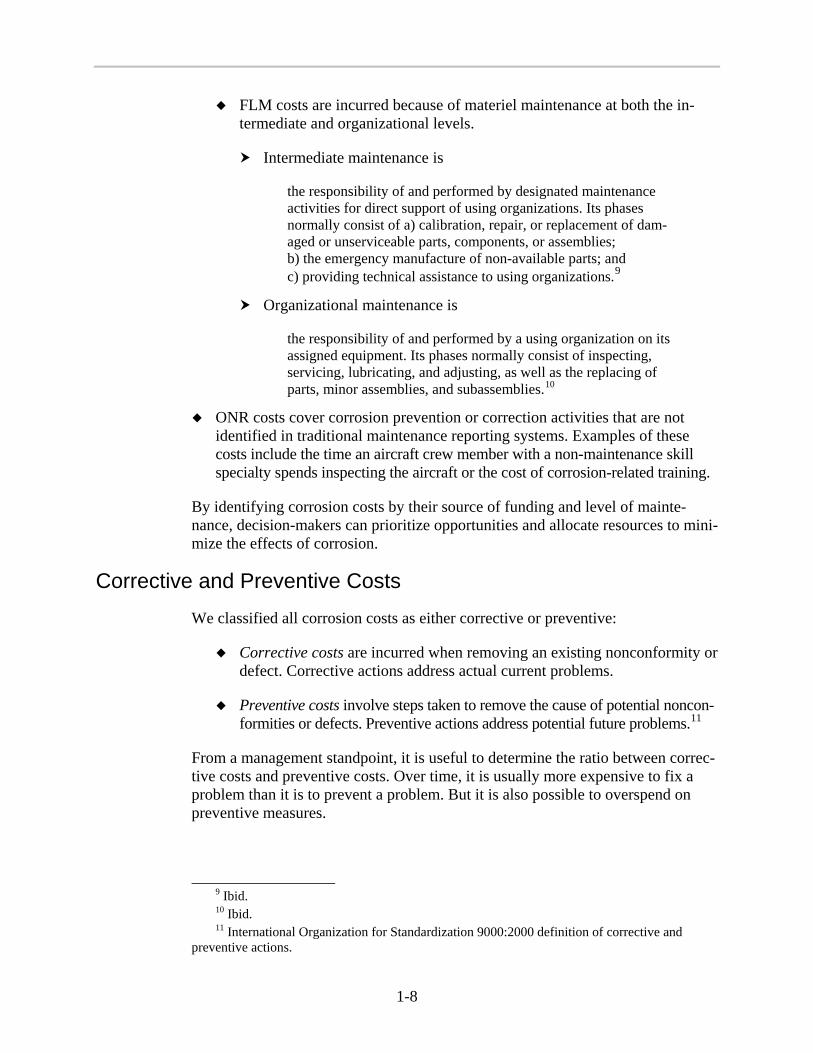
Corrective and Preventive Costs We classified all corrosion costs as either corrective or preventive:
Corrective costs are incurred when removing an existing nonconformity or defect. Corrective actions address actual current problems.
Preventive costs involve steps taken to remove the cause of potential noncon-formities or defects. Preventive actions address potential future problems.11
From a management standpoint, it is useful to determine the ratio between correc-tive costs and preventive costs. Over time, it is usually more expensive to fix a problem than it is to prevent a problem. But it is also possible to overspend on preventive measures.
9 Ibid. 10 Ibid. 11 International Organization for Standardization 9000:2000 definition of corrective and
preventive actions.
1-8

Background and Analysis Method
As shown in Figure 1-2, classifying the cost elements into categories helps decision-makers find the proper balance between preventive and corrective ex-penses to minimize the overall cost of corrosion.
Figure 1-2. Preventive and Corrective Corrosion Cost Curves
Ratio of preventive to corrective cost
Cos
t of
corro
sion
Total cost ofcorrosion curve
Preventivecost curve
Minimum overall cost of corrosion
Correctivecost curve
High Low
The task of classifying each cost element as either preventive or corrective could become an enormously challenging undertaking, one that involves classifying millions of activities and billions of dollars of cost in a standard method. The real value of classifying costs into preventive and corrective categories is to determine the ratio between the natures of these costs; the classification does not require precision. To simplify, we classified the preventive and corrective cost elements as depicted in Table 1-3.
Table 1-3. Classification of Corrosion Cost Elements into Preventive or Corrective Natures
Cost element Classification
Man-hours Corrective or preventive
Materials Corrective or preventive
Corrosion facilities Preventive
Training Preventive
RDT&E Preventive
The classification of man-hours and the associated materials as corrective or pre-ventive must be determined case by case.
1-9

To ensure consistency, we classified direct man-hours and the associated material costs based on the following convention:
Hours and materials spent repairing and treating corrosion damage, includ-ing surface preparation and media blasting, are classified as corrective costs.
Hours and materials spent gaining access to equipment that has corrosion damage so that it can be treated are classified as corrective costs.
Hours spent on maintenance requests and planning for the treatment of corrosion damage are classified as corrective costs.
Hours and materials spent cleaning, inspecting, painting, and applying corrosion prevention compounds or other coatings are classified as preventive costs.
Hours and materials spent at a facility built for the purpose of corrosion mitigation (such as a wash facility) are classified as preventive costs.
Structure and Parts Costs Direct costs can be attributed to a specific system or end item. We sorted all direct materials and direct labor costs into either structure or parts costs.
We defined structure and parts as follows:
Structure is the body frame of the system or end item. It is not removable or detachable.
Parts are items that can be removed from the system or end item and can be ordered separately through government or commercial supply channels.
By segregating direct corrosion costs into structure and parts categories, we help decision-makers give the design community more precise feedback about the source of corrosion problems.
DoD has a major concern about the effects and costs of aging weapon systems. The age of a typical weapon system is calculated starting with the year of manu-facture of the individual piece of equipment—essentially, the structural age of the weapon system. The age of a removable part is not tracked, with the exception of major, more expensive components like engines. Separating the corrosion costs related to the structure of the weapon system (which has an age measurement) from the corrosion costs related to removable parts (which do not have an age measurement) may give further insight into the relationship between structural costs and the effects of aging on weapon systems.
1-10
Background and Analysis Method
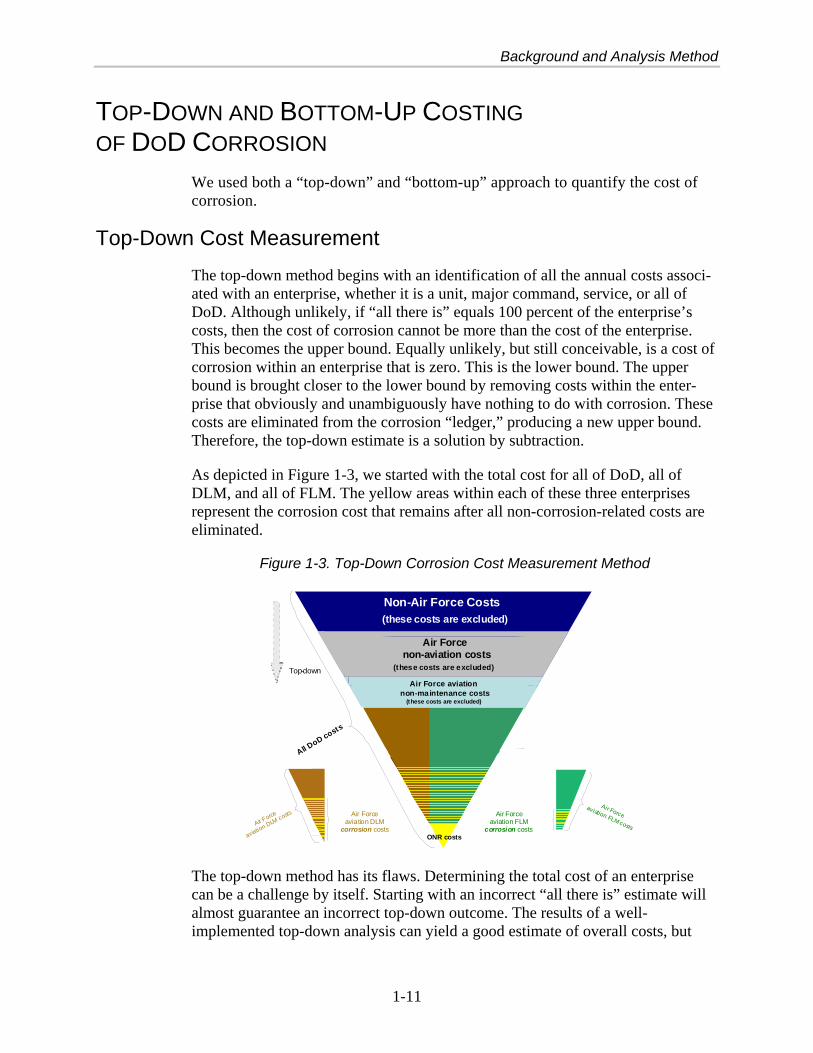
TOP-DOWN AND BOTTOM-UP COSTING OF DOD CORROSION
We used both a “top-down” and “bottom-up” approach to quantify the cost of corrosion.
Top-Down Cost Measurement The top-down method begins with an identification of all the annual costs associ-ated with an enterprise, whether it is a unit, major command, service, or all of DoD. Although unlikely, if “all there is” equals 100 percent of the enterprise’s costs, then the cost of corrosion cannot be more than the cost of the enterprise. This becomes the upper bound. Equally unlikely, but still conceivable, is a cost of corrosion within an enterprise that is zero. This is the lower bound. The upper bound is brought closer to the lower bound by removing costs within the enter-prise that obviously and unambiguously have nothing to do with corrosion. These costs are eliminated from the corrosion “ledger,” producing a new upper bound. Therefore, the top-down estimate is a solution by subtraction.
As depicted in Figure 1-3, we started with the total cost for all of DoD, all of DLM, and all of FLM. The yellow areas within each of these three enterprises represent the corrosion cost that remains after all non-corrosion-related costs are eliminated.
Figure 1-3. Top-Down Corrosion Cost Measurement Method
Top-down
All DoD costs
Non-Air Force Costs (these costs are excluded)
Air Force
aviation DLM costs Air Forceaviation FLM
corrosion costs
Air Forceaviation FLM costs
ONR costs
Air Forcenon-aviation costs
(these costs are excluded)
Air Force aviationnon-maintenance costs
(these costs are excluded)
Air Forceaviation DLM
corrosion costs
The top-down method has its flaws. Determining the total cost of an enterprise can be a challenge by itself. Starting with an incorrect “all there is” estimate will almost guarantee an incorrect top-down outcome. The results of a well-implemented top-down analysis can yield a good estimate of overall costs, but
1-11

that estimate can lack the detail necessary to pinpoint major cost drivers within the enterprise.
Bottom-Up Cost Measurement The bottom-up costing method aggregates the data associated with individual cor-rosion events. The corrosion-related labor and materials cost components of these individual events are identified separately and must be linked through a unique task identifier, such as job order number, to determine the total cost of the event.
As illustrated in Figure 1-4, the starting point for the bottom-up method is an ana-lysis of all maintenance activity, segregating activities that are related to corrosion and accumulating the associated corrosion costs.
Figure 1-4. Bottom-Up Corrosion Cost Measurement Method
Sum ofcorrosion
costs
Corrosion activities
All DoD maintenance
activities
$$
$
$
$ $ $ $ $
$
Materials cost
Labor cost
This approach by addition can produce very accurate, auditable information so long as the maintenance data collection systems accurately capture all relevant labor and materials costs, identify corrosion-related events, and are used with dis-cipline. If any of these three boundary conditions are missing, corrosion costs are likely to be determined incorrectly. In most cases, they will be understated.
1-12

Background and Analysis Method
Combined Top-Down and Bottom-Up Cost Measurement A more powerful method of determining the cost of corrosion is to combine the bottom-up and top-down approaches. By applying both methods and determining if the results are approaching each other, we can validate our overall method and assumptions. Theoretically, the top-down method could produce the same esti-mate as the bottom-up method. If the two values converge, it is confirmation that the corrosion data collection methods and analysis assumptions are acceptable, and the data are adequate. When the two results initially do not converge, we cor-rect our approach to prevent erroneous cost information, assumptions, or incom-plete data from corrupting the final outcome.
USE OF SCALING
We commonly applied a scaling method to ensure the final cost estimate is cor-rect. Typically, the aggregated bottom-up data does not sum to the top-down total, primarily because not all hands-on maintenance tasks are recorded, and a single source that contains all the data is rarely—if ever—available.
When we encounter a gap between the top-down total and the aggregated bottom-up total, we confirm the gap is not the result of a missing database or a missing end item type or model. In other words, we ensure the gap comprises random data that is similar to the bottom-up data we acquired. Doing this, we can confidently apply scaling factors to the bottom-up data to bridge the gap between the top-down and bottom-up totals. Statistically, this is the same as applying a conclusion about an entire population from a well-drawn statistical sample. In our case, the statistical sample is very large; the bottom-up data, when aggregated, is usually between 25 and 100 percent of the top-down total.
MANAGEABLE SECTIONS
We broke the entire cost problem up into manageable and easily segregated sec-tions and were able to check for convergence of the bottom-up and top-down results within each section. As illustrated in Figure 1-5, we applied the combined approach to three main sections: DLM costs, FLM costs, and ONR costs.
1-13

Figure 1-5. Combined Top-Down and Bottom-Up Approach
Non-Air Force( thes e cost s are excluded)
Air Forc eNon-Aviation Cost s
(these costs are excluded)
A ir For ce avia tionN on-M aint enance Costs
(t he se co st s are exc lu ded )
Top-down
Corrosi on acti vit ies
Al l DoD m aintenance
acti vit ies
$$
$ $$
$ $$ $ $
B ottom-up
DLM co rrosion costs FLM co rrosion costs
ONR corrosion costs
CORROSION COST TREE We developed a “corrosion cost tree” to depict the details of our cost measure-ment approach. Figure 1-6 is a generalized example of the cost tree; we discuss the actual cost figures on the tree in detail in Chapter 2 of this report.
Figure 1-6. Corrosion Cost Tree
Labor of equipmentoperators who are not
maintenance specialists
Priority 2 and 3 costs
Purchasecards
Labor-related cost of corrosion
Materials-related cost of corrosion
$x billion DoD maintenance
$y million depot-level maintenance
$x−y million field-level maintenance
Labor-related cost of corrosion
Materials-related cost of corrosion
A B C D E F G
$z million Costs outside normal maintenance reporting
Figure 1-6 shows the relationship between the main cost categories and the cost categories depicted in Figure 1-5. We started with all DoD maintenance costs and then separated costs into two main categories: DLM and FLM. The third cost category identifies costs outside normal maintenance reporting.
1-14

Background and Analysis Method
We further identified cost groupings within the three major cost categories and labeled them as “cost nodes.” For example, node A represents the DLM labor-related cost of corrosion; node D refers to the FLM materials-related cost of corrosion.
We then examined each of the major cost categories (DLM, FLM, and ONR) in further detail. The preliminary corrosion cost tree for DLM costs (shown in Figure 1-7) illustrates the application of this visual tool.
Figure 1-7. Corrosion Cost Tree—Depot Maintenance Costs
$y billionDepot maintenance
$a billionOrganic depot
$ ? billionAviation
$ ? billionNon-aviation
$ ? billionAviation
$ ? billionNon-aviation
$y – a billionCommercial depot
$ ? billionMaterials
$ ? billionOverhead
$ ? billionLabor
$Corrosion
A1 A2
$Corrosion
B1
$Non-
corrosion
B2
$ ? billionMaterials
$ ? billionOverhead
$ ? billionLabor
$Corrosion
$Non-
corrosion
$Corrosion
$Non-
corrosion
$Non-
corrosion
The node-labeling convention remains, except there is a further level of indenture. For example, node A may represent the Air Force’s DLM labor cost of corro-sion, but node A1 refers to the Air Force’s organic depot aircraft labor cost of corrosion and node A2 is the Air Force’s commercial depot aircraft labor cost of corrosion.
We expanded each level of the tree into groupings that account for all of the costs of the level above it. For example, we separated the depot maintenance costs into organic (work performed by government-owned depots) and commercial (work performed by private companies). We did not expand cost groupings that are not related to corrosion (such as organic depot overhead), or are not within the scope of this study (such as Navy or Army costs). This expansion continued until we reached a logical end point, and the costs in the node were entirely corrosion-related and within the scope of this study.
We determined the total cost of corrosion for Air Force aircraft and ballistic mis-siles by combining the costs found at all nodes in all three segments of the cost tree.
1-15
DATA STRUCTURE AND ANALYSIS CAPABILITIES To accommodate the anticipated variety of decision-makers and data users, we de-signed a corrosion cost data structure that maximizes analysis flexibility. Figure 1-8 outlines the data structure and the different methods of analysis.
Figure 1-8. Data Structure and Methods of Analysis
Percentage of totalCostEquipment Type xxx
(Age z years)
Percentage of totalCost
Equipment Type 100(Age 5 years)
WUCMaterialsLabor
Parts direct corrosion costs
Structure direct corrosion costs
Preventive corrosion costs
Corrective corrosion costs
ONR corrosion costs
FLM corrosion costs
DLM corrosion costs
Percentage of totalCost
Equipment Type 001(Age 12 years)
Note: WUC = work unit code.
Using this data structure, we were able to analyze the data against the following:
Equipment type
Age of equipment type
Corrective versus preventive costs
DLM, FLM, or ONR costs
Structure versus parts cost
1-16

Background and Analysis Method
Material costs
Labor costs
Work unit code (WUC) or work breakdown structure (WBS).12
Any of these data elements can be grouped with another (with the exception of ONR) to create a new analysis category. For example, a data analyst can isolate corrective corrosion costs for FLM materials if desired.
AIR FORCE AIRCRAFT ORGANIZATION The Department of the Air Force is administered by a civilian secretary and su-pervised by a military chief of staff. The Secretariat and the Air Staff help the Secretary and the Chief of Staff direct the Air Force mission. Together, the Secre-tariat and Air Staff constitute the Headquarters, U.S. Air Force (HQ USAF), which is responsible for organizing, training, and equipping U.S. air and space forces. HQ USAF oversees maintenance at all levels.
The Air Force is subdivided into nine major commands (MAJCOMs). Each is as-signed a major part of the Air Force mission and directly subordinate to HQ USAF.13 Each MAJCOM performs military operations and conducts aircraft maintenance. In addition, there are two reserve components: the Air Force Re-serve (which is also a major command) and the Air National Guard. These or-ganizations provide total lifecycle support—from cradle to grave—for Air Force aircraft forces worldwide.
We show the MAJCOM organizational structure in Figure 1-9. Each of the nine major commands performs some amount of field-level maintenance. The Air Force Materiel Command (AFMC) activities are highlighted in yellow. The Air Force relies on AFMC to support depot-level aircraft maintenance operations.
12 We use the WUC to uniquely identify the hierarchical structure, in increasing detail, of sys-
tems, sets, groups, installations, reparables, or parts of an end item for documenting maintenance tasks. The WUC convention is established in the Air Force Technical Manual on Maintenance Data Documentation, TO 00-20-2, 15 June 2003 (Change 1–15, August 2004).
13 In addition to the nine MAJCOMs, there are numerous others, including centers, field oper-ating agencies, and direct reporting units.
1-17

Figure 1-9. Air Force Major Command Structure
HQ USAF
MAJCOM
Air Combat Command(ACC)
Air Education and Training Command (AETC)
Air Force Space Command (AFSPC)
Air Force Special Operations Command (AFSOC)
Air Force Materiel Command (AFMC)
Air Mobility Command (AMC)
Pacific Air Forces (PACAF)
Secretariat
Oversees depot maintenance responsibilities for Air Force aviation platforms and equipment
Air Staff
U.S. Air Forces in Europe (USAFE)
Air Force Reserve Command (AFRC)
Aircraft Maintenance Structure HQ USAF/A4M oversees aircraft maintenance at all levels, from the maintainers on the flight line to the technicians and engineers in the depot support shops. Each MAJCOM performs some amount of field-level maintenance on aircraft equip-ment (e.g., combat operations, mission support, training, test, or RDT&E).
AFMC is responsible for depot-level maintenance and logistics support for air-craft equipment. It also conducts RDT&E, and provides acquisition management services necessary to keep Air Force weapon systems mission ready. AFMC con-ducts RDT&E under the direction of the Air Force Research Laboratory (AFRL), which oversees nine technology directorates. AFMC conducts depot-level mainte-nance through three air logistics centers (ALCs): Ogden Air Logistics Center (OO-ALC), Oklahoma City Air Logistics Center (OC-ALC), and Warner Robins Air Logistics Center (WR-ALC). The AFMC organization is shown in Figure 1-10.
1-18

Background and Analysis Method
Figure 1-10. AFMC Structure for Depot-Level Aircraft Maintenance
HQ USAF
MAJCOM
AFMC
Secretariat Air Staff
OO- ALC—ICBM, F-4, F-16, OA-10, F-5, T-37/T-38, F-22
WR-ALC—F-15, C-130, C-5, C-141, U-2, C-17, E-8, RQ-4
OC-ALC—B-2, B-1B, B-52, E-3, E-4, -135 series, ALCM, engines
Air Force aviation maintenance depots
Air Force Research Laboratory (AFRL)
9 technology directorates
The Air Force requires varying degrees of maintenance capability at different lo-cations. This capability is described (in order of increasing capability) as either organizational, intermediate, or depot. The Air Force maintenance structure in-volves approaches that leverage combinations of these capabilities.
Two-level maintenance (2LM) uses two of the three levels of maintenance to support weapons systems. The 2LM approach modifies or eliminates the intermediate (off-equipment) function whenever possible, consolidat-ing that repair function at the depot level (e.g., F100 engines).
Three-level maintenance (3LM) uses all three levels of maintenance. The 3LM approach typically addresses legacy systems (e.g., F-15, B-52, T-38) and the majority of line replacement units (LRUs).
It is useful to understand how DLM and FLM are specifically applied to Air Force aircraft and missile assets.
FLM involves the daily care and upkeep of an aircraft platform as it is used in an operational environment. FLM includes both organizational (O) and intermediate (I) levels.
O-level maintenance is performed by Air Force aircraft maintenance specialists who support their own unit’s day-to-day operations. Re-ferred to as Level 1 or the First Level, O-level maintenance is per-formed on-equipment (directly on aircraft or support equipment) on the flight line. This level generally includes repair, remove and re-place, inspection, testing, servicing, and calibration efforts.
I-level maintenance is performed in centrally located facilities estab-lished to support all operating units within a geographical area or at a particular base. Referred to as Level 2 or the Second Level, I-level maintenance is performed off-equipment (on removed component parts
1-19

or equipment) and in “back-shops” for aircraft subsystems and compo-nents. It focuses on testing and repair or replacement of component parts. I-level maintenance also includes centralized intermediate repair facilities (CIRFs).
DLM supports FLM by providing engineering assistance and performing maintenance that is beyond the capabilities of O- and I-level activities. DLM is the more comprehensive and complex repair work performed by civilian artisans in a government-owned and operated Air Force facility (called an organic depot or ALC) or at a commercial contractor facility. Referred to as Level 3 or the Third Level, DLM is performed on or off equipment at a major repair facility. The three aircraft maintenance depots (located in Ogden, Utah; Warner Robins, Georgia; and Oklahoma City, Oklahoma) are subordinate organizations under AFMC. These are high-lighted in green in Figure 1-10.
Aircraft Corrosion Organization The Air Force Corrosion Prevention and Control Office (AFCPCO) manages the Air Force’s corrosion program. Its mission is to ensure the Air Force has an effec-tive program to prevent, detect, and control corrosion and to minimize the impact of corrosion on Air Force aircraft equipment. AFCPCO is the Air Force’s focal point for all corrosion guidance and policy. It serves Air Force field units, com-mand-level corrosion managers, depots, and system program managers, and it is the Air Force representative to industry, the sister services, and other organiza-tions on corrosion-related matters.
AFCPCO is directed by HQ USAF (through the AFRL) to manage the Air Force cor-rosion maintenance program. It operates in accordance with Air Force Instruction 21-105.14 The Air Force corrosion organization is depicted in Figure 1-11.
14 Air Force Instruction 21-105, Air and Space Equipment Structural Maintenance,
April 2003.
1-20

Background and Analysis Method
Figure 1-11. AFCPCO Command Structure
HQ USAF
MAJCOM
AFMC
Secretariat Air Staff
OO-ALC—ICBM, F-4, F-16, OA-10, F-5, T-37/T-38
WR-ALC—F-15, C-130, C-5, C-141, U-2, C-17, E-8
OC-ALC—B-2, B-1B, B-52, E-3, E-4, -135 series, ALCM, engines
Air Force aviation maintenance depots
AFRL9 technology directorates
Materiel and Manufacturing Directorate
8 other technology directorates
Logistics Systems Support Branch
AFCPCO
Aircraft and Missiles Equipment List The scope of this study includes all Air Force aircraft and ballistic missiles. We also incorporated aircraft engines that often show up as depot-level reparables. We looked at 121 unique types of aerospace vehicles (aircraft and ballistic mis-siles) at the mission design series (MDS)15 level of detail (see Appendix C). Table 1-4 shows the breakdown of this equipment by Air Force component.
Table 1-4. Air Force Aircraft and Missiles by Component
Owning level Aircraft types by MDS
Active aircraft only 76 Reserve aircraft only 2 National Guard aircraft only 9 Air Force aircraft in common 25 Air Force ballistic missiles 9
Total 121
15 MDS structure and format are governed by Air Force Joint Instruction 16-401, Designating and
Naming Defense Military Aerospace Vehicles, 14 March 2005. The MDS is the official designation for DoD aerospace vehicles. In general, an MDS designator is an alpha-numeric code that represents a spe-cific category of aerospace vehicles on which work is performed.
1-21

In FY2007, more than 5,700 aircraft were in the Air Force inventory (4,066 active Air Force aircraft; 393 Air Force Reserve aircraft; and 1315 Air Force National Guard aircraft) as reported in the HQ USAF Program Data System (PDS).16 The inventory of 5,700 is the total midyear quantity reported in PDS.
REPORT ORGANIZATION Having explained our analysis approach, outlined the Air Force maintenance and corrosion organizations, discussed the maintenance structure, and outlined the air-craft and missile assets included within the scope of the study, we are now ready to describe how we determined the corrosion costs. Chapter 2 explicitly details the corrosion-related costs for Air Force aircraft and missile equipment (based on FY2007 costs). Chapter 3 presents our analysis of the cost data. The appendixes provide supporting data and analyses.
16 PDS is the HQ USAF database of record. It pulls its data from the Air Force’s Reliability
and Maintainability Information System (REMIS) and provides HQ USAF with up-to-date and consistent inventory, readiness data, and flight/utilization data for each aircraft in the Air Force inventory. We used the midyear inventory level as reported on 31 March 2007 to represent our average annual inventory.
1-22

Chapter 2 Air Force Aircraft and Missile Corrosion Costs
In this chapter we determine the corrosion cost for Air Force aircraft and ballistic missiles. For ease of discussion, we focus on FY2007 costs, because they are the most recent. The estimated total annual cost of corrosion for Air Force aircraft and missile equipment (based on FY2007 costs) is $5.4 billion.
DETERMINATION OF CORROSION COSTS We developed the cost tree illustrated in Figure 2-1 as a visual tool to help illus-trate the cost of corrosion for Air Force aircraft and missile equipment. This cost tree serves as a guide for the remainder of this chapter.
Figure 2-1. Air Force Aircraft and Missile Equipment Sustainment Corrosion Cost Tree
$83.9 billion DoD maintenance
Labor of non-maintenanceaircraft operators
E
Total Air Force ONR
F
Priority 2 and 3 costsa
G
Purchasecards
$10.1 billion Total Air Force DLM
$11.1 billion Total Air Force FLM
C
Labor-related cost of corrosion
D
Materials-related cost of corrosion
A
Labor-related cost of corrosion
B
Materials-related cost of corrosion
$62.7 billion Non–Air Force maintenance
Air Force aircraft and missiles only
a Priority 2 and 3 costs include training, research and development, and new corrosion mitigation and treatment facilities.
At the top of the cost tree is $83.9 billion, which is the entire cost of DoD mainte-nance for FY2007.1 Eliminating non–Air Force costs and segregating the cost tree into DLM, FLM, and ONR costs results in the second level of the tree. The cost figures for DLM and FLM are entirely Air Force–related.
Cost nodes A through G depict the main segments of corrosion cost. Using separate cost trees for DLM, FLM, and ONR, we determined the overall corrosion costs by combining the costs at each node. We provide the documentation of data sources for each of the cost figures in each node in Appendix D.
1 LMI, “The Estimated Total Cost of DoD Materiel Maintenance for FY2007,” briefing pre-
pared for the Office of the Secretary of Defense, April 11, 2008.
2-1

DLM COST OF CORROSION (NODES A AND B ) DLM corrosion costs are significant both at organic2 and commercial DLM facilities. We identified a total aircraft and ballistic missile DLM corrosion cost of $2.997 billion.
For both organic and commercial DLM, the Air Force’s aircraft and missile maintenance is subdivided according to maintenance process actions and maintenance repair actions.
Maintenance Process Versus Maintenance Repair Both organic and commercial DLM corrosion costs are found in maintenance “process” actions and maintenance “repair” actions:
A maintenance process includes any action performed on a system or end item that is the same for each piece of equipment of the same type, regard-less of its material condition. We consider these to be routine maintenance actions applied to all like equipment as if they were on an assembly line.
Maintenance repair involves targeted actions that are different for each piece of equipment and based on the material condition of the equipment. We consider these to be diagnostically driven actions to fix malfunction-ing parts and systems.
At the organic depot level, more than 75 percent of labor costs ($1.407 billion out of $1.838 billion) are incurred as part of the maintenance repair actions. It is diffi-cult to extract the corrosion costs from maintenance repair data because those ac-tions (e.g., replace faulty bearings) require more careful analysis of the work description to decide whether they are corrosion-related. By contrast, maintenance process actions, such as inspection, cleaning, and painting, are more easily cate-gorized as corrosion-related because of the very nature of the work. This distinc-tion becomes critical in how we determine corrosion costs.
The depot maintenance action and activity type for aircraft and missiles and the corresponding corrosion cost percentages3 are listed in Table 2-1.
2 The Air Force’s three organic ALCs are responsible for providing DLM for both Air Force
aircraft and missiles. 3 The corrosion cost percentage is the ratio of corrosion costs to maintenance costs.
2-2

Air Force Aircraft and Missile Corrosion Costs
Table 2-1. DLM Action Steps for Air Force Aircraft and Missile Equipment
Step Maintenance action Type of activity Corrosion cost?Corrosion
percentage Corrective or preventivea
1 Inspect equipment Process Potentiallyb 0–100% Preventive
2 Wash/steam clean equipment Process Yes 100% Preventive
3 Sand blast/chemical clean equipment Process Yes 100% Corrective
4 Repair or replace parts/structure Repair Potentiallyb 0–100% Corrective
5 Treat/metal finish equipment Process Yes 100% Preventive
6 Prepare and paint equipment Process Yes 100% Preventive
7 Final wash/clean/inspection Process Potentiallyb 0–100% Preventive
Mc Miscellaneous administrative tasks Process Potentiallyb 0–100% Preventive a We defined corrective and preventive costs in Chapter 1. b We only cost the known corrosion-related repair or replacement work records at 100 percent. c Miscellaneous administrative tasks include mostly non-corrosion-related activities, such as paperwork and
record keeping; however, a few tasks, such as management of shipping containers and engineering support, may contain corrosion costs.
Although the order of these actions may vary among depots, only step 4, repair or replace parts/structure, differs from one piece of equipment to another within the same depot—depending on the type of maintenance being performed. In general, all other steps are applied to each item of the same type of equipment, regardless of its condition.
This has important implications for corrosion-related costs:
The corrosion costs from DLM process actions for each aircraft or missile within the same aircraft or missile type are almost the same. The only sig-nificant difference is the cost of parts replacement or repair (step 4), which can be linked to a corrosion cause. Because DLM information systems rarely report corrosion as a reason for maintenance, it is difficult to isolate corrosion as a cause for parts replacement or repair.
Because depots incur corrosion costs as part of the processing of each aircraft, the total process cost of corrosion (steps 1–3 and steps 5–7) at the depot level is generally a function of how many items have been processed.
Major subcomponents and depot-level reparables, such as engines, show relatively few corrosion-related process costs because the majority of the maintenance process steps apply only to aircraft end items.
2-3

As explained in Chapter 1, we used a combined top-down and bottom-up approach to determine the costs of corrosion. We examined DLM costs by presenting the de-tailed DLM corrosion tree in Figure 2-2. In this cost tree, we separated organic DLM from commercial DLM and segregated the labor, materials, and overhead costs.
Figure 2-2. Air Force Aircraft and Missile DLM Corrosion Costs (in millions)
$10,107Depot
maintenance
$5,311Organic depot
$4,796Commercial
depot
$2,000Labor
$1,806Labor
$202Overheada
$182Overheada
$1,838Aviation
labor
$1,660Aviation
labor
$162Non-
aviation labor
$146Non-
aviation labor
$1,081Non-corrosion
$757Corrosion
labor
$915Corrosion materials
$1,943 Non-corrosion $1,035
Non-corrosion
$625 Corrosion
labor
$3,109Materials
$2,858Aviation materials
$251Non-
aviation materials
$2,808Materials
$2,581Aviation materials
$227Non-
aviation materials
$1,881Non-
corrosion
$700Corrosion materials
A2B1A1 B2 Note: Numbers may not add because of rounding. a Overhead does not contain any corrosion costs.
We started with a top-down DLM cost of $10.107 billion for the Air Force using an annual DLM congressional reporting requirement to determine this cost.4 The same document details the split between organic DLM ($5.311 billion) and costs incurred at commercial depots ($4.796 billion). This is reflected in the second level of the tree in Figure 2-2.
Through continued top-down analysis, we determined the cost at each level in the tree until we reached the cost-of-corrosion nodes. We then used detailed bottom-up data to determine the corrosion costs at each sub-node. Those costs are shown in Table 2-2.
4 Deputy Under Secretary of Defense (Logistics and Materiel Readiness), Distribution of DoD
DM Workloads: Fiscal Years 2007–2009, April 2008, p. 5. This annual report to Congress is also known as the “50-50 Report” in reference to Section 2474(f) of Title 10, United States Code, which requires a 50-percent limit on DLM funds being used to contract for performance by non–federal government personnel.
2-4

Air Force Aircraft and Missile Corrosion Costs
Table 2-2. Air Force Aircraft and Missile Equipment DLM Organic and Commercial Corrosion Cost (in millions)
Aircraft and missile equipment costs Corrosion-related costs
Maintenance provider Labor Materials Overhead Total DLM Labor Materials
Total maintenance
Organic DLMa $1,838 $2,858 $185 $4,882 $757 $915 $1,672
Commercial DLM $1,660 $2,581 $167 $4,409 $625 $700 $1,325 Total $3,499 $5,439 $353 $9,291 $1,382 $1,615 $2,997
Note: Numbers may not add because of rounding. a The three organic ALCs are responsible for Air Force aircraft and missile equipment DLM.
The total aircraft and missile equipment overhead costs for organic depot ($185 million) and commercial depots ($167 million) are the aircraft and missile portions of the total organic depot overhead costs ($202 million) and commercial depot overhead cost ($182 million) from the depot corrosion cost tree in Figure 2-2.
As we show in Table 2-2, the total DLM corrosion cost for materials ($1.615 bil-lion) exceeds the DLM corrosion cost for labor ($1.382 billion) by a moderate amount (17 percent). Organic DLM corrosion costs ($1.672 billion) moderately exceed (26 percent) commercial DLM corrosion costs ($1.325 billion). We dis-cuss these and other observations in more detail in the next chapter.
Organic DLM Corrosion Costs (Nodes A1 and B1 )
We continued our top-down analysis at the top of the organic side of the DLM cost tree in Figure 2-2. We depict the organic DLM corrosion cost tree in Figure 2-3.
We split the $5.311 billion of organic DLM costs into labor, overhead, and materi-als using a report on DoD depot operating expenses for FY2007.5 That report used the FY2007 Financial Statement (AR[M]1307, Statement of Financial Position) for all DoD depots. Using the AR(M)1307 for the ALCs at Oklahoma City, Ogden, and Warner Robins, we identified the specific aircraft and missile costs.
5 LMI, DoD Maintenance DLM Operating Expenses for FY2007, Report LG705T2,
Clark L. Barker, April 2008. The report includes the FY2007 Financial Statement (AR[M]1307, Statement for Financial Position), known as the “1307 report.” The 1307 presents a summary of operating expenses for DoD depot-level maintenance. It includes the major categories of person-nel, material, contractual, and other expenses.
2-5

Figure 2-3. Air Force Aircraft and Missile Organic DLM Corrosion Costs (in millions, FY2007)
$5,311Organic depot
$2,000Labor
$202Overheada
$1,838Aviation labor
$162Non-aviation
labor
$1,081Non-corrosion
$757Corrosion
labor
$915Corrosion materials
$1,943Non-corrosion
$3,109Materials
$2,858Aviation materials
$251Non-aviation
materials
B1A1 Note: Numbers may not add because of rounding. a Overhead does not contain any corrosion costs.
The depot operating expenses in the 1307 report contain labor, materials, overhead, and contractual costs. We used the categories of labor, materials, and overhead and apportioned the contractual costs into the respective labor, materials, and overhead schema. Labor costs include both organic and contractual labor; materials costs in-clude both direct and contractual materials; and overhead includes depreciation, contractual overhead, and other overhead costs. We separated the costs according to what is incurred at depots that maintain Air Force aircraft and missiles and what is incurred at depots that do not maintain Air Force aircraft and missiles.
Next, we scaled the labor, materials, and overhead costs from the 1307 report to balance with the top-down organic DLM total. We needed to do this because the statements of financial position do not precisely add up to the amount reported in the annual 50-50 report to Congress. The scaling factor for Air Force depots is 1.017, which increased the labor, materials, and overhead costs by 1.7 percent from the 1307 report.
2-6

Air Force Aircraft and Missile Corrosion Costs
Based on the depot accounting report information, the organic DLM costs depicted in the second level of the organic DLM cost tree (Figure 2-3) are as follows:
Labor—$2.000 billion. The labor cost is the sum of each depot’s Air Force aircraft and missile labor costs. Labor costs include potential corro-sion costs.
Materials—$3.109 billion. The materials cost is the sum of each depot‘s Air Force aircraft and missile materials costs. Materials costs include po-tential corrosion costs.
Overhead—$202 million. The overhead cost is the sum of each depot’s non-labor and non-material Air Force aircraft and missile service costs, depreciation, and other indirect costs. There are no potential corrosion-related overhead costs.
We then analyzed the depot workload according to the type of equipment. By com-paring bottom-up Air Force depot maintenance records to the aircraft and missile list mentioned earlier, we determined which maintenance tasks are performed on Air Force equipment that is within the scope of this study and which tasks are out of the current scope. We did a similar analysis on the Army and Navy depots that perform some maintenance on Air Force equipment using the data provided by the Depot Maintenance Cost System (DMCS).6 Examples of out-of-scope tasks include maintenance performed on non–Air Force aircraft, retired aircraft, conventional munitions/missiles, and foreign military sales items.
By comparing the costs of the tasks that are within the scope of this study to the costs of those that are out of scope, we calculated the percentage of the total work-load for each depot that was expended on Air Force aircraft and missiles. This workload breakdown is summarized in Table 2-3.
6 DMCS collects depot maintenance cost and production data on all depot maintenance ser-
vices performed by or for DoD, including commercial depot workloads. The DMCS report we used was the AP-MP[A]1397 report, which is also referred to as the “1397.”
2-7

Table 2-3. Percentage of DLM Workload for Air Force Aircraft and Missiles
Depot Service Total DLM costa
(in millions)
Percentage of workload expended on Air Force aircraft and missilesb
DLM cost on Air Force aircraft and missiles
(in millions)
Ogden Air Force $1,432.8 95.0% $1,361.2
Oklahoma City Air Force $2,375.0 80.5% $1,911.9
Warner Robins Air Force $1,503.2 95.0% 1,428.0
Air Force ALC subtotal $5,311.0 — $4701.1
Corpus Christi Army $1,471.7 3.8% $55.9 Cherry Point Navy $687.8 11.1% $76.4
Jacksonville Navy $661.5 8.2% $54.2
North Island Navy $500.4 1.3% $6.5
Non–Air Force depots subtotal $3,321.4 — $193.0 Note: Numbers may not add because of rounding. a DLM costs are based on the adjusted amounts (increased by 1.7 percent) from the FY2007 AR(M)1307.
As expected, Ogden, Oklahoma City, and Warner Robins have the highest per-centage of their workload dedicated to Air Force aircraft and missiles, 95.0 per-cent, 80.5 percent, and 95.0 percent, respectively. Using those percentages, we split the organic depot costs for labor and materials into “aircraft and missiles” and “non-aircraft and non-missile” costs.
Based on our analysis of DMCS data we separated depot costs into “in-scope” and “out-of-scope.” The in-scope organic DLM costs depicted in the third level of the organic DLM cost tree (Figure 2-3) are $1.838 billion for aircraft and missile labor and $2.858 billion for aircraft and missile materials.
To this point, we determined the in-scope labor and materials cost figures by us-ing a top-down costing method. We needed to take the final step and determine the corrosion costs at each node using a bottom-up cost analysis.
ORGANIC DLM DATA
We used detailed bottom-up data from several DLM data sources to separate Air Force aircraft and missile costs from non–Air Force aircraft and missile costs for the equipment on our equipment list. DLM data sources include the Defense Maintenance Accounting and Production System (DMAPS)7 database, Program Depot Maintenance Schedule System (PDMSS) (G097) 8 database, Job Order
7 DMAPS is an Air Force accounting information tool supporting the Defense Finance and
Accounting Service (DFAS) mission. Some of the key data elements provided by DMAPS are the aircraft and missile equipment MDS, JON, WBS, and material and labor costing.
8 PDMSS (G097) is a management planning tool designed for scheduling manufacturing ac-tivities with known demand. Some of its key data elements include labor hours, descriptive main-tenance text, and maintenance codes.
2-8
Air Force Aircraft and Missile Corrosion Costs
Production Management System (JOPMS) (G004L),9 and the Depot Maintenance Material Support System (DMMSS) (G005M)10 database. We analyzed the data from these sources at the individual aircraft and job order number (JON)11 levels of detail. We extracted all associated and available data records from DMAPS, PDMSS, JOPMS, and DMMSS for each aircraft on our equipment list. Each data source contributed several important data fields. Using the common data fields from each database, we joined the related records and revealed the detailed DLM story for each piece of aircraft and missile equipment.
Data Organization and Gaps
Although the data files from ALCs Odgen, Oklahoma City, and Warner Robbins were similar, they still required formatting and placement of the data into a com-mon data structure. In cases of incomplete data, we applied logical processes to fill the gaps. For example, if a record lacked the aircraft MDS but provided the description, we cross-referenced the description to the equipment list to derive the MDS. In this fashion, we produced the “virtual” data needed to complete many records. In some instances, we were unable to generate the virtual data, and re-cords were used as best as possible.
After resolving data gaps and joining the files from each database, each mainte-nance record contained the essential elements of information needed to perform a bottom-up corrosion cost analysis.
We associated a maintenance action step from Table 2-1 to each resource cost center (RCC) code. The RCC code represents a work cost center and describes which location or organization in the depot performs a specific type of function, such as painting or welding. For example, RCC code MBCCB (Warner Robins paint shop) is associated with depot action step 6 (prepare and paint equipment). By associating each RCC with a maintenance action step, we classified each labor record as either a maintenance process or repair action.
We then applied the combined top-down and bottom-up method described in Chapter 1. Consistent with this method, we adjusted the detailed bottom-up DLM data to balance with top-down cost figures. Specifically, we balanced each de-tailed bottom-up DLM record proportionally so the sum of the labor costs and material costs matched the depot’s top-down AR(M)1307 accounting report.
9 JOPMS (G004L) provides a count of repairable components (by national stock number, or
NSN) that were actually repaired by the depots (serviceable repairs). Some of the key data ele-ments provided for non-aircraft maintenance were labor hours, material costs, and descriptive maintenance text.
10 DMMSS (G005M) supports workload planning which includes the bill of materials. It has three primary purposes: to identify material that will support maintenance workloads; to assess supportability of the workload given the current material posture; and to identify the material component cost for depot maintenance repair. The system also calculates material standards for maintaining end-items.
11 A JON serves as a reference to the work package description and associated costs.
2-9

Scaling Bottom-Up to Top-Down Organic DLM Labor Costs
We did not expect the bottom-up DLM labor cost total to match the top-down to-tal. The top-down total labor cost reflects a “fully loaded” salary total that in-cludes all benefits, vacation time, training, and other indirect costs of labor. The bottom-up total labor cost reflects only the labor hours recorded for each JON by cost work center. It essentially includes only the direct cost of DLM labor.
We calculated the DLM labor costs for each maintenance action inside each work center by using the recorded depot labor hours. Theoretically, this shows all the work done on each aircraft and missile in the depot. By applying per capita pay rates12 and a scaling factor to these labor hours, we balanced the detailed bottom-up DLM labor costs13 to the depot’s top-down 1307 report information.
Specifically, we totaled the labor hours from each ALC’s databases for all RCC maintenance actions. We then applied the per capita rate to obtain a figure of $980 million. We compared that figure to the top-down 1307 labor cost total of $1.797 billion. Realizing we had not accounted for all the labor costs, we applied a scaling factor of 1.8314 to each labor record so that our bottom-up total matched our top-down figure.
We did this for each data record for each JON. As a result, the detailed bottom-up data for each depot was adjusted appropriately, and the total depot costs were in balance with the top-down cost figures.
12 We derived the per capita rates from FY2007 “actual” data in the Department of Defense
Fiscal Year 2009 President’s Budget. The civilian annualized rate for FY2007 was $84,451. This rate is a generalized rate and is not location- or DLM-specific.
13 DLM materials costs were calculated similarly using the material costs from DMAPS for each maintenance action.
14 This factor is calculated as $1,797 million ÷ $980 million = 1.83.
2-10

Air Force Aircraft and Missile Corrosion Costs
ORGANIC DLM AIRCRAFT AND MISSILE LABOR COST OF CORROSION (NODE A1 )
Our task was to extract the organic DLM labor cost of corrosion for the Air Force (node A1 , $757 million [from Figure 2-4]) from the total DLM labor cost.
Figure 2-4. Air Force Aircraft and Missile Organic DLM Labor Cost Tree (in millions)
$5,311Organic depot
$2,000Labor
$1,838Aviation labor
$162Non-aviation labor
$1,081Non-corrosion
$757Air Force
corrosion labor
$202Overhead
$3,109Materials
A1
Determining Corrosion Costs from Organic DLM Records
We began our bottom-up organic DLM labor corrosion analysis using the data from all three ALCs. The data provided details on the maintenance operation per-formed on each aircraft or missile, the work center performing the operation, and the associated labor hours for the operation.
We first examined each of the RCC work centers that perform DLM and assigned them to one of the eight maintenance action steps (1–7 and M), as outlined in Table 2-1. We show this work center–to–process step mapping in Appendix E. Since each in-scope bottom-up record contains an RCC code, we assigned each record to one of the maintenance action steps.
We also characterized each process step as either preventive or corrective mainte-nance.15 We show the distribution of all organic DLM costs by maintenance ac-tion step and the corresponding preventive or corrective nature of those costs in Table 2-4.
15 Corrective costs are incurred when removing an existing nonconformity or defect. Correc-
tive actions address actual problems. Preventive costs involve steps taken to remove the causes of potential nonconformities or defects. Preventive actions address future problems. These defini-tions are in accordance with the International Organization for Standardization 9000:2000 defini-tion of corrective and preventive actions.
2-11

Table 2-4. Distribution of Organic DLM Labor Costs by Maintenance Action Step
Step Maintenance action
Total labor cost
(in millions)
Percentage of total labor
cost Is this a
corrosion cost?
Is this a corrective or preventive
cost?
1 Inspect equipment $54.1 2.9% Potentiallya Preventive
2 Wash/steam clean equipment $0.7 0.0% Yes Preventive
3 Sand blast/chemical clean equipment $108.3 5.9% Yes Corrective
4 Repair or replace parts/structure $1,406.9 76.5% Potentiallya Corrective
5 Treat/metal finish equipment $15.7 0.9% Yes Preventive
6 Prepare and paint equipment $46.2 2.5% Yes Preventive
7 Final wash/clean/inspection $151.4 8.2% Potentiallya Preventive Mb Miscellaneous administrative tasks $54.8 3.0% Potentiallya Preventive
Total $1,838.0 a We only cost the known corrosion-related repair or replacement work records at 100 percent. b Miscellaneous administrative tasks include mostly non-corrosion-related activities, such as paperwork and record keeping;
however, a few tasks, such as management of shipping containers and engineering support, may contain corrosion costs.
Because each bottom-up record was assigned to one of the eight maintenance ac-tion steps, our corrosion analysis is now partially complete. Per Table 2-1, we re-garded the costs associated with the records in steps 2, 3, 5, and 6 as 100 percent corrosion-related because of the nature of the tasks. Records in steps 1, 4, 7, and M required further analysis to determine whether they were corrosion-related. We accomplished that analysis using a search of corrosion keywords in each record’s descriptive maintenance text fields. We used a list of corrosion keywords (such as “rust,” “paint,” and “clean”) to identify activities that are related to corrosion. That list of key corrosion words is provided in Appendix F.
In Table 2-5, we show a notional application of the method we used to determine overall organic DLM corrosion costs.
The example in Table 2-5 shows the activity of a notional F-16 Fighting Falcon go-ing through DLM at ALC Ogden. All RCCs are assigned to one of the eight DLM steps outlined in Table 2-1. For RCCs assigned to a DLM step that is not fully cor-rosion-related by nature (DLM steps 1, 4, 7, and M), we performed a corrosion keyword search on the descriptive maintenance text for that record. Records that required this corrosion keyword search are highlighted in blue in Table 2-5.
2-12

Air Force Aircraft and Missile Corrosion Costs
Table 2-5. Work Records Assigned to DLM Steps 1, 4, 7, or M (Notional Example—F-16 Fighting Falcon at ALC Ogden)
DLM step RCC Resource work center description
RCC corrosion
percentage Type
of action
1 MNLCE Examination and Inventory 0–100% Process
2 MNLCD Disassemble and clean 100% Process
2 MNGBN Clean 100% Process
3 MBRSA Paint/Bead Blast 100% Process
3 MNLWA Cadmium strip, rust strip 100% Process
3 MNLWA Chrome strip 100% Process
4 MXDPAA Computer/Inertial & Optics Shop 0–100% Repair
4 MXDPAD Processor Pneumatics Shop 0–100% Repair
4 MXDPAE Rotary Actuators & Motor Shop 0–100% Repair
4 MXDPAF Radar Transmitter Shop 0–100% Repair
4 MBRNS Plastics/Rubber/Line Support 0–100% Repair
4 MBGPC F-16 Bonding, Mill, Manufacture 0–100% Repair
4 MBRSB F-16 Wing 0–100% Repair
4 MBRSS F-16 Miscellaneous 0–100% Repair
5 MNLWC Chrome plate 100% Process
5 MNLWA Cadmium plate 100% Process
6 MBFFF F-16 Paint 100% Process
6 MBFFJ Small Parts Paint 100% Process
7 MBRNR Egress/Seat Shop/Flight Test 0–100% Process
M MBGAM Planning/Scheduling/Material 0–100% Process
M MBRSZ Production Overhead 0–100% Process
M MBRNB Transportation 0–100% Process Note: This data sample is for illustrative purposes.
Continuing with this notional example, we multiplied the labor hours associated with each maintenance record by a standard average hourly maintenance techni-cian labor rate ($47.55) to estimate a standard maintenance cost for each DLM action.16 We show the estimated maintenance labor cost for each record in the far right column of Table 2-6.
16 According to OMB Circular A-76 (March 2003), a civilian full-time equivalent (FTE) is
1,776 hours. We used the per capita yearly rate ($84,451) derived from the Department of De-fense Fiscal Year 2008 President’s Budget divided by 1,776 hours to calculate the equivalent hourly rate ($47.55).
2-13

Table 2-6. Organic DLM Data with Labor Records Analyzed for Corrosion Cost using Corrosion-Related Keywords (Notional Example—F-16 Fighting Falcon at ALC Ogden)
DLM step and type of action RCC Resource work center description
Corrosion percentage
Corrosion keyword found
Maintenance labor cost
1 - Process MNLCE Examination and Inventory 40% “Inspect” $1,250
2 - Process MNLCD Disassemble and clean 100% N/A $1,050
2 - Process MNGBN Clean 100% N/A $1,250
3 - Process MBRSA Paint/Bead Blast 100% N/A $1,500
3 - Process MNLWA Cadmium strip, rust strip 100% N/A $1,900
3 - Process MNLWA Chrome strip 100% N/A $1,800
4 - Repair MXDPAA Computer/Inertial & Optics Shop 0% None $2,500
4 - Repair MXDPAD Processor Pneumatics Shop 0% None $2,200
4 - Repair MXDPAE Rotary Actuators & Motor Shop 0% None $2,750
4 - Repair MXDPAF Radar Transmitter Shop 0% None $2,250
4 - Repair MBRNS Plastics/Rubber/Line Support 100% “cracking” $750
4 - Repair MBGPC F-16 Bonding, Mill, Manufacture 100% “intergranular cracking”
$3,500
4 - Repair MBRSB F-16 Wing 100% “corroded” $3,250
4 - Repair MBRSS F-16 Miscellaneous 0% None $500
5 - Process MNLWC Chrome plate 100% N/A $650
5 - Process MNLWA Cadmium plate 100% N/A $750
6 - Process MBFFF F-16 Paint 100% N/A $1,700
6 - Process MBFFJ Small Parts Paint 100% N/A $2,150
7 - Process MBRNR Egress/Seat Shop/Flight Test 40% “test” $3,250
M - Admin MBGAM Planning/Scheduling/Material 0% None $350
M - Admin MBRSZ Production Overhead 0% None $400
M - Admin MBRNB Transportation 0% None $500 Note: “Flagged” records highlighted in yellow.
We then examined the highlighted records using our corrosion keywords (Appen-dix F). Those not flagged for having a corrosion-related keyword in the text field are highlighted in pink in Table 2-6. The records that had a corrosion-related keyword from our list in one of the record’s descriptive maintenance text fields were flagged for corrosion and are highlighted in yellow in Table 2-6. Their cor-responding corrosion percentages are also shown.
The final step was to multiply the labor cost by the corresponding corrosion per-centage to calculate the corrosion-related labor cost for each record. That step is shown in Table 2-7. Corrosion costs are highlighted in blue.
2-14

Air Force Aircraft and Missile Corrosion Costs
Table 2-7. Applying the Corrosion Percentages to Determine Organic DLM Labor Corrosion (Notional Example—F-16 Fighting Falcon at ALC Ogden)
DLM step and type of action RCC Resource work center description
Corrosion percentage
Maintenance labor cost
Corrosion labor cost
1 - Process MNLCE Examination and Inventory 40% $1,250 $500
2 - Process MNLCD Disassemble and clean 100% $1,050 $1,050
2 - Process MNGBN Clean 100% $1,250 $1,250
3 - Process MBRSA Paint/Bead Blast 100% $1,500 $1,500
3 - Process MNLWA Cadmium strip, rust strip 100% $1,900 $1,900
3 - Process MNLWA Chrome strip 100% $1,800 $1,800
4 - Repair MXDPAA Computer/Inertial & Optics Shop 0% $2,500 $0
4 - Repair MXDPAD Processor Pneumatics Shop 0% $2,200 $0
4 - Repair MXDPAE Rotary Actuators & Motor Shop 0% $2,750 $0
4 - Repair MXDPAF Radar Transmitter Shop 0% $2,250 $0
4 - Repair MBRNS Plastics/Rubber/Line Support 100% $750 $750
4 - Repair MBGPC F-16 Bonding, Mill, Manufacture 100% $3,500 $3,500
4 - Repair MBRSB F-16 Wing 100% $3,250 $3,250
4 - Repair MBRSS F-16 Miscellaneous 0% $500 $0
5 - Process MNLWC Chrome plate 100% $650 $650
5 - Process MNLWA Cadmium plate 100% $750 $750
6 - Process MBFFF F-16 Paint 100% $1,700 $1,700
6 - Process MBFFJ Small Parts Paint 100% $2,150 $2,150
7 - Process MBRNR Egress/Seat Shop/Flight Test 40% $3,250 $1,300
M - Admin MBGAM Planning/Scheduling/Material 0% $350 $0
M - Admin MBRSZ Production Overhead 0% $400 $0
M - Admin MBRNB Transportation 0% $500 $0
Using this iterative method and aggregating the corrosion labor costs, we esti-mated the overall organic DLM aircraft and missile corrosion labor costs as $757 million (node A1 ).
Categorizing Corrosion Labor Activities
Finally, we assigned a WUC17 (when available), a WBS code,18 and a designation of parts or structures to each labor record.
17 As explained in Chapter 1, we use the WUC to identify the structure or parts of an aircraft
requiring maintenance. 18 WBS coding identifies the weapon subsystem on which work is being performed. We used
the WUC as our primary convention because it is the recognized coding for Air Force aircraft and missile maintenance. We also provided the WBS to be consistent with past reports. The WBS convention is established in DoD Financial Management Regulation, Volume 6, Chapter 14, Ad-dendum 4, January 1998.
2-15

We examined the WUC at the first two-character level of detail, which allowed us to distinguish between airframe and structure (WUC: 11) and subsystems or parts (all other WUCs). The three-character WBS code identified the subsystem of the aircraft was being worked on as well as the type of aircraft. We provide a list of the WUC and WBS as well as the parts and structure19 mapping of these codes in Appendix G.
Because we assigned each DLM record to one of eight DLM action steps (using Table 2-1), we could show both the maintenance labor and corrosion-related labor cost for each DLM step. We also classified each corrosion cost as either a preven-tive cost or a corrective cost.20
In Table 2-8, we present a summary of the organic DLM aircraft and missile labor and corrosion-related labor costs by type of maintenance action. Sixty-four per-cent of the total organic DLM corrosion-related labor cost ($757 million) arises from depot-level repair and replacement of parts and structure, step 4 in Table 2-8. This is to be expected, as the DLM data from the ALCs show that depot maintain-ers frequently use the term “corrosion” or a variation within their descriptive text field write-ups. This accounts for 82 percent of the total labor corrosion costs in DLM step 4.
Table 2-8. Organic DLM Aircraft and Missile Labor and Corrosion Costs by Process Step
DLM step Maintenance action
Total labor cost
(in millions)
Net Corrosion
percentage
Corrosion labor cost
(in millions)
Preventive or corrective
cost
1 Inspect equipment $54.1 36% $19.3 Preventive
2 Wash/steam clean equipment $0.7 100% $0.7 Preventive
3 Sand blast/chemical clean equipment $108.3 100% $108.3 Corrective
4 Repair or replace parts/structure $1,406.9 35% $487.0 Corrective
5 Treat/metal finish equipment $15.7 100% $15.7 Preventive
6 Prepare and paint equipment $46.2 100% $46.2 Preventive
7 Final wash/clean/inspection $151.4 40% $60.3 Preventive
M Miscellaneous administrative tasks $54.8 36% $19.6 Preventive Corrosion total $1,838.1 41% $757.1 —
Because we characterized each maintenance record by RCC and process step, we could reproduce maintenance and corrosion labor cost data by end item and weapon subsystem in a variety of ways. We could also determine the preventive-to-corrective corrosion labor cost ratio and parts-to-structure cost ratio by weapon system. We explore some of this analytical capability in Chapter 3.
19 We defined parts and structure costs in Chapter 1. 20 We defined preventive and corrective costs in Chapter 1.
2-16

Air Force Aircraft and Missile Corrosion Costs
ORGANIC DLM AIRCRAFT AND MISSILE MATERIALS COST OF CORROSION (NODE B1 )
We continued our bottom-up approach by extracting the corrosion-related organic DLM aircraft and missile materials cost from the total aircraft and missile materi-als cost (node B1 , $915 million [from Figure 2-5]).
Figure 2-5. Air Force Aircraft and Missile Organic DLM Materials Cost Tree (in millions)
$5,311Organic depot
$2,000Labor
$202Overheada
$915Air Force
corrosion materials
$1,943Non-corrosion
$3,109Materials
$2,858Aviation materials
$251Non-aviation materials
B1
We analyzed information provided by ALCs Ogden, Oklahoma City, and Warner Robins in their DMAPS and DMMSS (G005M) data files. We used the materials cost from DMAPS, with the parts detail provided primarily by DMMSS (G005M). Together, those files provided the material purchases and cost for work performed.
We used internal depot coding to associate the materials costs with the labor costs. We also associated the records by JON, project number, and MDS as much as possible.21 The better we could link records, the better we could associate ma-terial costs to labor.
21 These are the same JONs used to describe the work package and accumulate the labor hours
we discussed earlier in this chapter.
2-17

Comparing Bottom-Up to Top-Down Organic DLM Materials Costs
When we totaled the materials costs from our bottom-up data sources, we obtained a figure of $923 million. This total is not equal to the top-down materials cost total ($2.858 billion) from Figure 2-5. Because we could not account for all the top-down material costs in the parts analysis reports, we needed to apply a scaling factor of 3.1.22
We expected to account for most of the top-down materials costs with our bot-tom-up materials records because detailed electronic parts requisitioning is stan-dard practice. Initially, we did account for most of our top-down materials costs with our bottom-up materials records. However, many of the corresponding la-bor records were incomplete and unusable for our analysis. Because material records are joined to labor records in our approach, we could not use the mate-rial records that were aligned with the unusable labor records. This largely ac-counts for our need to scale.
Extracting and Categorizing Corrosion Materials Costs
Maintenance operations and parts requisitions are linked through the JON; how-ever, there is no mechanism to determine which parts costs are associated with a specific maintenance operation (i.e., RCC). We illustrate this situation in Table 2-9, which shows a notional example of the labor maintenance operations by JON, and Table 2-10, which shows the parts requisitions for the same JONs.
Table 2-9. Relationship of Labor Maintenance Operation to JON (Notional Example—F-16 Fighting Falcon at ALC Ogden)
JON Maintenance operation (RCC) Labor cost
T8531N Repair flight control circuit card (MXDPAA) $3,000
T8531N Replace seal (MBRNS) $7,500
T8531N Inspect and repair pneumatics (MXDPAD) $1,000
T8531N Chemical clean bell housing (MNGBN) $2,000
Total for T8531N $13,500
T0782N Replace pilot seat (MBRNR) $5,000
T0782N Prepare housing for painting (MBFFF) $500
T0782N Paint housing (MBFFJ) $1,000
T0782N Inspect aircraft (MNLCE) $4,000
Total for T0782N $10,500
22 We calculated this scaling factor as $2,858 million ÷ $923 million = 3.1.
2-18
Air Force Aircraft and Missile Corrosion Costs
Table 2-10. Relationship of Materials Requisition to JON (Notional Example—F-16 Fighting Falcon at ALC Ogden)
JON Part nomenclature Materials cost
T8531N Housing, frame $11,000
T8531N Engine seal assembly $30,000
T8531N Valve core $12,000
T8531N Lead assembly $3,000
T8531N Body panel $3,500
T8531N Seal, plain $500 Total for T8531N $60,000
T0782N Fastening bracket $480
T0782N Gun turret bracket $2,520
T0782N Seat $21,000 Total for T0782N $24,000
Although some logical associations can be made between parts and the labor for each maintenance operation within each JON, they would be guesses at best. In-stead, materials costs are shown at the JON level of detail, making corrosion-related materials cost estimates imprecise.
Labor records flagged as corrosion-related have an associated materials cost. To determine the corrosion-related materials costs, we calculated the materials costs by JON and allocated those costs to each labor record at the WCC level of detail within that JON. We show an example of this in Table 2-11 using the same data we provided in Table 2-9 and Table 2-10.
Table 2-11. Allocation of Material Costs to Labor Records (Notional Example—F-16 Fighting Falcon at ALC Ogden)
Maintenance operation (RCC) Labor cost
Allocated materials
cost
Record flagged for corrosion?a
Corrosion percentage
Corrosion labor cost
Corrosion materials
cost
T8531N Repair flight control circuit card (MXDPAA) $3,000 $15,000 No 0% $0 $0
Replace seal (MBRNS) $7,500 $15,000 Yes 50% $3,750 $7,500
Inspect and repair pneumatics (MXDPAD) $1,000 $15,000 Yes 40% $400 $6,000
Chemical clean bell housing (MNGBN) $2,000 $15,000 Yes 100% $2,000 $15,000 T0782N Replace pilot seat (MBRNR) $5,000 $6,000 No 0% $0 $0
Prepare housing for painting (MBFFF) $500 $6,000 Yes 100% $500 $6,000
Paint housing (MBFFJ) $1,000 $6,000 Yes 100% $1,000 $6,000
Inspect aircraft (MNLCE) $4,000 $6,000 Yes 40% $1,600 $2,400 Note: Material costs are spread evenly to each maintenance operation within a JON. For example, JON: T8531N has $60,000 in
material costs spread evenly to each of the four maintenance operations ($15,000 each). a Each record was flagged for corrosion based on the RCC and corrosion keyword search associated with the maintenance action.
2-19

We also examined the material purchase information to properly categorize the corrosion costs. Using the WUC from the labor record—which allowed us to categorize material costs as either parts or structure—and the convention pre-sented in Appendix G, we mapped materials to a WBS and then to its parts or structure classification. We used the parts nomenclature and the aircraft described by the JON to align materials to the WBS.
In this way, we estimated a total of $915 million in organic corrosion-related DLM materials costs (node B1 from Figure 2-5).
Commercial DLM Corrosion Costs (Nodes A2 and B2 )
We followed a slightly different method to determine the commercial DLM cor-rosion costs because we did not have extensive bottom-up data like we had for the organic DLM work. Figure 2-6 represents the commercial DLM branch of the overall DLM cost tree shown in Figure 2-2.
Figure 2-6. Air Force Aircraft and Missile Commercial DLM Cost Tree Section (in millions)
$4,796Commercial
depot
$1,806Labor
$182Overheada
$1,660Aviation labor
$146Non-aviation labor
$1,035Non-corrosion
$625 Corrosion
labor
$2,808Materials
$2,581Aviation materials
$227Non-aviation
materials
$1,881Non-corrosion
$700Corrosion materials
A2 B2 a Overhead does not contain any corrosion costs.
We started our top-down analysis at the top of the cost tree in Figure 2-6. Using the annual DLM congressional reporting requirement, we determined the total commercial DLM cost was $4.796 billion.23
23 Op. cit., DUSD(L&MR), April 2008, p. 5.
2-20

Air Force Aircraft and Missile Corrosion Costs
For the organic DLM analysis, we used the DLM operating expenses 1307 re-port24 to determine the costs at the second level of the tree. Because there is no similar reporting requirement for commercial DLM work, we used the organic de-pot ratios for labor, overhead, and materials to determine the corresponding commer-cial depot labor ($1.806 billion), overhead ($182 million), and materials ($2.808 billion) costs. These are the costs in the second row of Figure 2-6.
We continued our top-down approach using the Air Force organic depot ratios for aircraft and missile labor compared to total labor ($1.838 billion:$2.000 billion, or 0.919) and aircraft and missile materials compared to total materials ($2.858 bil-lion: $3.109 billion, or 0.919). We used these ratios to estimate the corresponding commercial depot aircraft and missile-related totals. The commercial depot air-craft and missile labor cost is $1.660 billion, and the commercial depot aircraft and missile materials cost is $2.581 billion. These are the costs in the third row of Figure 2-6.
We then used information reported in the DMCS to complete the corrosion analy-sis. DMCS contains aggregated maintenance task information by aircraft and mis-sile type. Essentially, it is a summary by MDS of the bottom-up maintenance records. DMCS provides “summarized bottom-up” maintenance cost data that we used for our corrosion cost analysis.
To begin our analysis, we assigned each DMCS record to an MDS. Then we re-moved the records for those MDSs that do not fall within the scope of this study. Because the remaining “in-scope” records contain summary maintenance infor-mation, we could not conduct a separate corrosion analysis on each record. In-stead, we used the organic corrosion-related DLM ratios for those MDSs that have maintenance performed by commercial depots to determine the corrosion cost. Past studies indicate the organic depot action steps (from Table 2-1) are gener-ally the same for commercial depots. Because the steps are the same, we comforta-bly assumed the resulting corrosion cost percentages by MDS are also similar.
Before extracting the corrosion costs, we had to scale the summarized bottom-up totals to the in-scope aircraft and missile labor and materials costs. To do this we multiplied all costs by a ratio of $4.241 billion (the top-down Air Force aircraft and missile commercial DLM cost) to $2.306 billion (the original summarized-bottom-up Air Force aircraft and missile commercial DLM cost from DMCS), which equates to a scaling factor of 1.84.
Using our organic DLM corrosion analysis, we extracted the proportional amount of labor and materials corrosion costs by MDS from our commercial data. We also used the organic DLM corrective versus protective and parts versus structure ratios by MDS to characterize the costs for each commercial MDS. We il-lustrate this method in Figure 2-7.
24 Op. cit., LMI, Report LG705T2, April 2008.
2-21

Figure 2-7. Use of Corrosion Ratios to Determine Commercial DLM Corrosion Cost (Example—B1-B, Lancer [MDS: B001B])
Ratios from MDS: B001B from organic depot data applied to DMCS commercial funding data
$28.2 million 16.7%$19.4 million11.5%$102.6 million$66.0 million$168.6 millionB1-B, Lancer
Corrosion Materials Cost
Corrosion Materials %
Corrosion Labor cost
Corrosion Labor %
Maintenance Materials cost
Maintenance Labor cost
DMCS Commercial
Funding AmountEnd Item
$9.8 million$37.8 million20.5%79.5%$35.4 million$12.2 million74.4%25.6%
Structure Corrosion
Cost
Parts Corrosion
CostStructure Cost
%Parts Cost %
Corrective Corrosion
Cost
Preventive Corrosion
Cost
Corrective CorrosionCost %
Preventive CorrosionCost %
We used this convention to determine the corrosion cost for each MDS listed in the DMCS commercial depot data. We then applied the WUC and related charac-teristics from our organic DLM results to our commercial corrosion results. Using this technique, we characterized the commercial DLM corrosion work into parts and structure costs, preventive and corrective costs, and by process step.
In this fashion, we estimated the commercial depot labor corrosion costs to be $625 million (node A2 ) and the material corrosion costs to be $700 million (node B2 ), and we were able to characterize the commercial depot corrosion costs for each aircraft and missile.
FLM COST OF CORROSION (NODES C AND D ) FLM corrosion costs are estimated to be $2.289 billion of the total aircraft FLM expenditure of $7.127 billion, or 32 percent of the total aircraft FLM expenditure.
Although FLM costs exceed DLM costs by more than $3 billion, the FLM corro-sion costs are far less ($700 million) than DLM corrosion costs.
The detailed FLM cost tree in Figure 2-8 guides our discussion for the remainder of this section.
2-22

Air Force Aircraft and Missile Corrosion Costs
Figure 2-8. Air Force Aircraft and Missile FLM Corrosion Cost (in millions)
$13,253Field
maintenance
$11,058Organic
labor
$979Organic materials
$5,084Non-aviation
$5,974Aviation
labor
$4,027Non-corrosion
$1,947Air Force
corrosion labor
$241Overhead
$975Commercial maintenance
$275Non-aviation
$704Aviationmaterials
$487Non-corrosion
$217Air Forcecorrosionmaterials
C1
$659Non-aviation
$315Aviation
$276Labor
$33Materials
$164Non-corrosion
$112Air Forcecorrosion
labor
$20Non-corrosion
$13Air Forcecorrosionmaterials
$6Overhead
$107Non-aviation
$134Aviation
D1
D2C2
Note: Numbers may not add because of rounding.
We began our top-down analysis with the realization that we needed to calculate the costs at the second level of the tree to determine the total Air Force FLM costs. Unlike DLM, there is no legal requirement to aggregate FLM costs and report them at the service level. We started our analysis at the second level of the cost tree in Figure 2-8 because we could estimate those costs from various data sources. We aggregated them to estimate the total FLM costs.
Once we determined the costs at the second level of the tree for FLM labor mate-rials, commercial maintenance, and overhead, we calculated the cost at each sub-sequent level until we reached the cost-of-corrosion nodes. We then used detailed bottom-up data to determine the corrosion cost at each node.
2-23

FLM Top-Down Analysis
ORGANIC FLM COSTS
We started our top-down analysis with the organic labor costs in the second level of the cost tree in Figure 2-8. Using data from the Defense Manpower Data Center (DMDC) to identify Air Force personnel with maintenance skill specialties and the staffing level for each specialty, we estimated the organic FLM labor costs. These personnel come from different service components: active duty, reserves, National Guard, and civilian workforce.
Based on DMDC staffing levels and per capita pay rates,25 we determined the top-down organic FLM labor cost was $11.058 billion. Table 2-12 details these staffing levels, rates, and costs.
Table 2-12. Staffing Levels and Cost by Military Component for Air Force FLM Maintainers
Component Staffing level Per capita cost Total cost
(in millions)
Active duty 90,790 $79,972 $7,261
Reserve 16,440 $24,177 $397
National Guard 35,294 $24,177 $853
Civilian 30,156 $84,451a $2,547 Total 172,680 $11,058
Note: Figures may not add because of rounding. a The civilian annualized rate for FY2007 (Source: DoD FY2009 President’s Budget).
Continuing our top-down approach, we moved to “materials” in the second level of the cost tree. We identified the Air Force’s organic FLM materials costs using the Air Force’s OP-31 exhibits, “Spares and Repair Parts.”26 We provide a summary of the OP-31 information for FY2007 in Table 2-13.
25 Op cit., DoD FY2009 President’s Budget. The DoD active duty annualized rate for FY2007
was $79,972, while the reserve and National Guard annualized rate was $24,177. 26 Operations and Maintenance (O&M), Air Force, Volume II, Air Force Reserve, and Air Na-
tional Guard budget material submitted in February 2008. These documents were submitted as part of the Department of the Air Force Fiscal Year 2009 Budget Estimates Submission. The costs include the supplemental appropriation.
2-24

Air Force Aircraft and Missile Corrosion Costs
Table 2-13. Air Force FLM Spares and Repair Parts Consumables Budget for FY2007
Military component Commodity category Total (in millions)
Active Airframes $507
Active Aircraft engines —
Active Missiles — Active Communications equipment — Active Other miscellaneous $270 Reserves All categories $62 National Guard All categories $140
Total $979
The total cost of $979 million was the Air Force’s estimate of spares and repair part costs for FY2007. We used that total as our top-down Air Force organic ma-terials cost figure.
COMMERCIAL FLM CORROSION COSTS
We next moved to Air Force’s commercial FLM (i.e., contract maintenance) in the second level of the cost tree.
We identified commercial FLM costs using the Air Force and Air Force Reserve’s OP-31 exhibits from the same budget documents we used for organic FLM mate-rials.27 Commercial maintenance costs are captured inside budget line 922, “Equipment Maintenance by Contract.” We isolated all costs associated with line 922 for each budget activity, which provided all the contractual equipment main-tenance costs (other than DLM). Adding all line 922 contract maintenance costs yielded $975 million in Air Force commercial FLM costs.
FLM OVERHEAD COSTS
Next, we calculated the separate overhead costs for Air Force FLM. A previous study of FLM costs 28 determined overhead was approximately 2 percent of total organic FLM labor and materials costs. That total did not include indirect labor or materials, but it did include utilities, fuel, and other miscellaneous costs. Using that statistic, we estimated the total organic FLM overhead cost to be $241 million.29
27 Op. cit., O&M, Department of the Air Force Fiscal Year 2009 BES, February 2008. 28 LMI, FLM Cost Visibility, Report LG301T7, Eric F. Herzberg et al., March 2005, pp. 1–5. 29 The Air Force’s overhead ($241 million) is 2 percent of all organic Air Force FLM costs
($11,058 million labor and $979 million materials). There are no corrosion maintenance costs in overhead.
2-25

We apportioned this number between aircraft and missile and non-aircraft and non-missile using the ratio of organic FLM aircraft and missile-related labor and materi-als to non-aircraft and non-missile costs:
($5,974 million + $704 million) ÷ ($11,058 million + $979 million) = 55 percent.
We then calculated the organic FLM aircraft and missile-related overhead to be $134 million.
OVERALL FLM COST
Adding the FLM organic labor and material costs, contract maintenance costs, and overhead costs yielded a total Air Force FLM cost of $13.253 billion, the top of the cost tree. Our next step was to isolate the aircraft and missile costs from the non-aircraft and missile costs and estimate the FLM aircraft and missile corrosion cost for each node.
Isolating Aircraft and Missile FLM Costs
We split organic FLM labor costs into aircraft and missile and non-aircraft and non-missile labor using DMDC data.
We used the DoD Occupational Conversion Index to identify Air Force military oc-cupation specialties that perform maintenance on aircraft and missile equipment.30 We then determined the staffing level and military component for each aircraft and missile specialty.
For broad occupational groups (e.g., metalworking, machinists, and electrical/ electronic) that perform maintenance on more than aircraft and missiles, we analyzed each occupation specialty more closely. We needed to analyze some aircraft-related costs further to strip out maintenance costs on equipment that is not within the scope of this study. (Examples of out-of-scope maintenance costs include aircraft simulators, ground support equipment, and airfields.)
By looking at the individual skill title, we estimated the number of personnel who spend time maintaining aircraft and missile equipment that is within scope. This analysis resulted in the workforce percentages in Table 2-14.
30 Department of Defense 1312.1-I, Occupational Conversion Index (Enlisted, Officers, and
Civilians), November 2006. This index serves as an occupational coding structure that groups similar occupations into logical and consistent structure suitable for analysis. We analyzed the structure and data at the service-specific occupational title level of detail.
2-26

Air Force Aircraft and Missile Corrosion Costs
Table 2-14. Percentage of Air Force FLM Workforce Involved in Aircraft and Missile Maintenance
DoD occupational group Air Force aircraft and missile
maintenance percentage
Aircraft engines 100%
Aircraft structures 100%
Aircraft general 100%
Aircraft and missile maintenance and allied 100%
Communication and Radar 100%
Missile guidance, control, and checkout 100%
Missile mechanic 100%
Sheet metal 100%
Electrical/electronic 78%
Electronic instruments, NEC 75%
Aircraft accessories 72%
Metalworking, general 71%
Ordnance 68%
Machinists 19%
Other mechanical and electronic equipment, general
12%
Armament and munitions 10%
Navigation, communication, and countermeasures
9%
Auxiliary labor, general 7% Note: Percentages are based on the actual number of aircraft and missile maintainers found
within all the individual skill specialties under each DoD occupational group. Personnel invento-ries came from DMDC data for personnel who are technically classified as maintainers.
Using these factors and the DMDC data, we determined that 96,133 Air Force personnel perform organic field-level aircraft and missile maintenance for an an-nual cost of $5.974 billion. This figure is shown on the third level of the cost tree of Figure 2-8.
Continuing our top-down analysis, we separated the Air Force’s organic materials into aircraft and missile and non–aircraft and missile materials costs. Using the Air Force OP-31 exhibits (shown in Table 2-13), we isolated the aircraft and mis-sile commodities. We identified $704 million in organic FLM aviation materials. We show those results in Table 2-15. The lines highlighted were excluded.
2-27

Table 2-15. Air Force Aircraft and Missile FLM Totals from Spares and Repair Parts Consumables Budget for FY2007
Military component Commodity category Total (in millions)
Active Airframes $507.0
Active Aircraft engines —
Active Missiles — Active Communications equipment — Active Other miscellaneous $270.0 Reserves Airframes and engines $57.2 Reserves Other $5.2 National Guard All categories $140.2
Total (excluding active: other miscellaneous and reserves: other)
$704.4
Note: Lines highlighted were excluded.
Finally, we analyzed Air Force commercial FLM aircraft and missile costs. We refined our analysis to isolate the labor and materials costs for aircraft and mis-siles. Using the detailed budget information, we isolated all costs associated with line 922 for each budget activity. We summed the FLM contract maintenance costs by budget activity, which yielded our estimated $975 million total commer-cial FLM costs.
Some of those maintenance costs are out-of-scope. For example, some are for air-craft and missile simulators and training devices, ground support equipment, and airfields. We needed to remove those costs. When we more closely analyzed the OP-32 budget exhibits for line 922 at the sub-activity level of detail, we identified $315 million as aircraft- and missile-related. This amount is depicted on the third tier of the cost tree (Figure 2-8).
Separating Commercial Labor, Materials, and Overhead FLM Costs
To further separate the commercial aircraft and missile cost of $315 million into la-bor, materials, and overhead, we apportioned the commercial aircraft and missile cost using the same organic FLM ratios by MDS. This resulted in $276 million in labor, $33 million in materials, and $6 million in overhead. These are the costs shown in the fourth row of Figure 2-8 and are reflected at the MDS level of detail.
FLM Bottom-Up Analysis
ORGANIC FLM AIRCRAFT AND MISSILE LABOR CORROSION COST (NODE C1 )
After we separated organic FLM labor costs into aircraft and missile and non-aircraft and non-missile costs using DMDC data, our next task was to extract the corrosion-related labor costs (node C1 from Figure 2-9) from this total using
2-28

Air Force Aircraft and Missile Corrosion Costs
a bottom-up analysis. We used FLM data from REMIS, the Air Force’s authorita-tive data warehouse for FLM aircraft and missile maintenance.31
Figure 2-9. Air Force Aircraft and Missile Organic FLM Labor Corrosion Cost (in millions)
$11,058Organic
labor
$5,084Non-aviation
$5,974Aviation
labor
$4,027Non-corrosion
$1,947Air Force
corrosion labor
C1
We obtained FY2007 closed work records from REMIS. These electronic mainte-nance action forms provided detailed labor information for each Air Force aircraft maintained in the field. By aggregating the individual labor hours by MDS for Air Force aircraft and missiles, and using the DoD per capita rates, we accounted for $2.838 billion in Air Force aircraft- and missile-related direct labor costs from the detailed bottom-up labor data.
At first glance, there seems to be a large gap between these totals and the top-down aircraft and missile FLM labor costs of $5.974 billion; however, we de-termined the top-down cost figure by multiplying a staffing level by a yearly per capita rate. We determined the bottom-up cost of $2.838 billion for in-scope FLM records by aggregating direct hands-on maintenance labor hours and multiplying those recorded labor hours by the corresponding hourly equivalent of the per capita rate.32
31 REMIS is the Air Force’s primary data warehouse for FLM aircraft maintenance, flight,
and usage data. It contains the data provided by aircraft and missile maintainers on the mainte-nance they performed on Air Force aircraft and missile equipment.
32 According to OMB Circular A-76 (March 2003), a civilian FTE employee works 1,776 hours annually. Therefore, we used the corresponding yearly per capita rate (active duty: $79,972; National Guard/reserves: $24,177; civilian: $84,451) divided by 1,776 hours to calculate the equivalent hourly rate.
2-29

In other words, the top-down costs are the total yearly cost of the 96,133 Air Force personnel with aircraft- and missile-related maintenance skill specialties. Even if labor hours were accurately recorded by each maintainer, the bottom-up cost would still fall significantly short because it would only be a calculation of the actual hours recorded for hands-on maintenance. We know aircraft and missile maintenance personnel do not spend 100 percent of their time performing hands-on maintenance.
The bottom-up labor costs, which directly reflect recorded labor hours from REMIS for in-scope FLM, were approximately 50 percent of the top-down totals. To account for this gap, we scaled the REMIS labor data by a factor of 2.10 ($5.974 billion ÷ $2.838 billion). This is not out of the ordinary. Based on a cus-tomary military maintenance manpower utilization rate of 50 percent,33 we ex-pected to see corrosion-related FLM labor costs of $3.0 billion for the Air Force in the bottom-up in-scope data (50 percent of the respective top-down figures).
To complete the bottom-up analysis and extract the corrosion costs, we flagged re-cords for corrosion based on maintenance codes and keyword search techniques.
The maintenance code fields we used, per Technical Order 00-20-2,34 are listed below:
“How” malfunction codes (MAL codes)
“When Discovered” codes
“Action Taken” codes
“Workcenter” codes.
We used codes from each category that were explicitly intended to identify corro-sion maintenance, such as the following:
MAL 170 (corroded mild/moderate)
When Discovered 4 (corrosion control inspection)
Action Taken Z (corrosion treatment)
Workcenter 314 (corrosion control).
To further help with our use of the MAL codes used in REMIS, we administered a corrosion survey to mechanics from multiple aircraft and missile units. We asked the FLM mechanics to estimate the corrosion percentages for a list of prescreened MAL codes based on a simple set of percentages and their corresponding relationship to
33 Army Regulation 750-1, Army Materiel Maintenance Policy, 5 September 2006, Section 4-14, p. 42.
34 Technical Order 00-20-2, Maintenance Data Documentation, August 2004,
2-30

Air Force Aircraft and Missile Corrosion Costs
corrosion maintenance: 0 percent (never), 10 percent (rarely), 25 percent (some-times), 50 percent (half the time), 75 percent (most of the time), and 100 percent (always). More than 90 aircraft and missile mechanics (rotary and fixed wing) re-sponded to our survey. Their responses provided a corrosion percentage for the amount of maintenance time they spend on aircraft and missile equipment as a result of given MAL codes. We averaged the results and assigned a corrosion percentage to each MAL code on our list. We then used the FLM corrosion profile to further flag records and extract the appropriate corrosion costs from REMIS records. We provide the FLM corrosion profile in Appendix H. In this way, we accumulated a total of $948 million in corrosion-related costs.
We then used the corrosion keyword list in Appendix F to complete the analysis of the unflagged bottom-up records. Using the corrosion-related keywords, we searched the fault descriptions of the remaining records, specifically in the fields marked “descriptive maintenance text” and “corrective action text.” We searched for corrosion words, such as paint, wash, coatings, and clean, and flagged those records as corrosion-related. Using this technique, we accumulated corrosion costs of $999 million.
We accumulated a total of $1.947 billion for FLM corrosion labor costs using code and keyword techniques. Because we captured these costs at the record-level of de-tail, we could further characterize the costs by parts and structure and corrective and preventive. The total $1.947 billion is our organic Air Force FLM corrosion labor cost (node C1 in Figure 2-9).
ORGANIC FLM AIRCRAFT AND MISSILE MATERIALS COST OF CORROSION (NODE D1 )
Our next task was to extract the corrosion-related materials costs (node D1 in Figure 2-10) from the $704 million top-down aircraft and missile total. We again used information from REMIS to accomplish this task.
2-31

Figure 2-10. Air Force Aircraft and Missile Organic FLM Materials Corrosion Cost (in millions)
$979Organic materials
$275Non-aviation
$704Aviationmaterials
$487Non-corrosion
$217Air Forcecorrosionmaterials
D1
Our approach was similar to that for organic FLM aircraft and missile labor cor-rosion costs. We used the same flagged records from our analysis of organic labor corrosion costs and we applied the same percentages based on maintenance codes and keyword search techniques. We accumulated a total of $217 million in FLM corrosion materials cost using this method (node D1 from Figure 2-10).
COMMERCIAL FLM AIRCRAFT AND MISSILE LABOR AND MATERIALS COSTS OF CORROSION (NODES C2 AND D2 )
We began our estimate of corrosion costs for commercial FLM aircraft and missile labor and materials corrosion costs with the top-down totals of $276 million in labor and $33 million in materials (see Figure 2-11).
To conduct the corrosion analysis, we used the REMIS data, which contains both organic and commercial FLM data. We isolated the commercial data by flagging the records that had the labor category code of “6” (contractor labor hours), which is used for contracted maintenance. Since each flagged record contains both labor and materials cost data, we were able to analyze the commercial REMIS bottom-up data as we did the organic REMIS data to estimate these costs.
2-32

Air Force Aircraft and Missile Corrosion Costs
Figure 2-11. Air Force Aircraft and Missile Commercial FLM Labor and Materials Corrosion Costs (in millions)
$975Commercial maintenance
$659Non-aviation
$315Aviation
$276Labor
$33Materials
$164Non-corrosion
$112Air Forcecorrosion
labor
$20Non-corrosion
$13Air Forcecorrosionmaterials
$6Overhead
D2C2
First, we aggregated the direct hands-on maintenance labor hours (code 6) reported in REMIS for in-scope FLM records. We determined the bottom-up labor cost of $193 million for in-scope FLM records by multiplying military personnel labor hours by the corresponding hourly equivalent of the per capita rate, $47.55.35
As we found with organic FLM, the gap of $83 million ($276 million − $193 million) can be explained by incomplete or inaccurate maintenance labor data recording in REMIS. To account for this top-down–to–bottom-up gap, we scaled the in-scope REMIS commercial labor data by a factor of 1.43 ($276 million ÷ $193 million). We then summed the commercial FLM materials for the in-scope FLM records and de-termined the bottom-up materials cost of $21 million. Again, there was a gap ($33 million − $21 million) between the bottom-up and top-down costs. We applied a scaling factor of 1.59 ($33 million ÷ $21 million) to the bottom-up records.
As previously explained, we calculated the overhead cost of $6 million using the same convention used to calculate the organic FLM overhead; we estimated com-mercial overhead to be approximately 2 percent of the total commercial FLM labor and materials costs.
35 We used the corresponding yearly per capita rate for civilians ($84,451) divided by the FTE
of 1,776 hours to calculate the equivalent hourly rate.
2-33

Our approach to estimate the commercial FLM labor and materials corrosion costs was similar to what we used to estimate organic FLM labor and materials corrosion costs. We flagged the commercial REMIS records for corrosion based on the use of specific corrosion maintenance codes and corrosion keywords. We applied the appropriate corrosion percentages to both the labor and materials costs.
The results of our analysis yielded $125 million in commercial FLM corrosion-related labor and materials costs: $112 million in commercial FLM labor corrosion costs (node C2 ), and $13 million in commercial FLM materials corrosion costs (node D2 ). These are the corrosion costs in Figure 2-11.
ONR COST OF CORROSION (NODES E , F , AND G ) ONR corrosion costs are a minor contributor to the overall cost of corrosion for Air Force aircraft and missiles. The corrosion costs for this area are $147 million, with the majority of the costs being the military construction of corrosion-related facilities ($88 million). The cost tree in Figure 2-12 guides our discussion.
Figure 2-12. Air Force Aircraft and Missile Corrosion ONR Costs
Labor of non-maintenanceaviation operators
Priority 2and 3 costs
Purchasecards
E
$40 million
F
$89 million
G
$18 million
We calculated each of the corrosion costs in nodes E through G in a unique way because they are not recorded as part of a standard maintenance reporting system.
Labor of Non-Maintenance Aircraft and Missile Operators (Node E )
This node contains the cost of Air Force aircraft and missile equipment operators (pilots and flight crew) with non-maintenance specialties that perform corrosion-related tasks, such as inspecting aircraft. To obtain a cost estimate, we first deter-mined the staffing level of non-maintenance personnel for the aircraft and missile equipment within the scope of this study.
To do so, we accessed the DMDC data for the number of pilots and crew in duty positions coded for operators (see Table 2-16).
2-34

Air Force Aircraft and Missile Corrosion Costs
Table 2-16. Air Force Aircraft and Missile Operator Duty Positions
Primary duty position Skill group title
1050—Enlisted Air crew
2201—Officers Fixed-wing fighter and bomber pilots
2202—Officers Other fixed-wing aircraft pilots
2203—Officers Helicopter pilots
2204—Officers Aircraft crews
We included both active duty and reserve officers and enlisted for a total of 33,568 personnel (Table 2-17).
Table 2-17. DMDC Air Force Aircraft and Missile Operator Manning Levels
Military compo-nent
September 2007officer strength
September 2007enlisted strength Total strength
Active 16,177 4,476 20,653
National Guard 4,446 2,031 6,477
Reserves 4,248 2,190 6,438
Total 24,871 8,697 33,568
From a survey we administered on the Air Force Knowledge Now and the Air Force Portal websites, we determined the average number of hours per day opera-tors or pilots spend on both corrosion and non-corrosion maintenance. The aver-age time spent by operators doing some aircraft and missile-related maintenance (such as inspections and cleaning) is about 30 minutes per workday for active duty operators and 15 minutes for National Guard and Reserve operators. We also found approximately one-third of that time (10 minutes for active duty and 5 min-utes for National Guard and Reserves) is spent on corrosion-related actions (e.g., inspections). Using our hourly rates36 for active duty and reserve officers and enlisted personnel on flight status, we calculated a total ONR labor cost for non-maintenance operators of $40 million. This is our figure for node E .
Detailed results are shown in Table 2-18. This is an additional labor cost (there are no materials cost associated with node E ).
36 Rates are derived from Office of the Secretary of Defense FY2007 DoD Military Personnel Composite Standard Pay and Reimbursement Rates. We distinguish by enlisted (E-3), officer (O-2) and active duty/reserve. The enlisted composite hourly rate for E-3 is $26.29/hour; yearly rate ($44,633 + annual flight pay incentive of $2,064) divided by FTE 1,776 hours. The active duty officer composite hourly rate for O-2 is $53.58/hour (yearly rate ($93,087 + annual flight pay incentive of $2,064) divided by FTE 1,776 hours). We adjusted for reserve and National Guard equivalent rates by using the average workdays per year.
2-35

Table 2-18. Corrosion Cost of Non-Maintenance Air Force Personnel Who Operate Aircraft and Missile Equipment
Military component and Status Strength Hourly rate
Workdays per year
Corrosion hours per day
Corrosion labor cost (in millions)
Active Duty – Officer 16,177 $53.58 222 0.170 $32.7
Active Duty – Enlisted 4,476 $26.29 222 0.170 $4.4
National Guard – Officer 4,446 $53.58 67 0.085 $1.3
National Guard – Enlisted 2,031 $26.29 67 0.085 $0.3
Reserve – Officer 4,248 $53.58 67 0.085 $1.2
Reserve - Enlisted 2,190 $26.29 67 0.085 $0.3
Total 33,568 — — — $40.2
We provide complete details of the survey in Appendix I.
Priority 2 and 3 Costs (Node F )
There are four corrosion-related costs for this node:
RDT&E
Facilities
Training
Corrosion staffing.
CORROSION-RELATED AIRCRAFT AND MISSILE RDT&E COSTS
Corrosion-related RDT&E costs are traceable to an RDT&E program that is used to develop methods or technologies for mitigating or preventing the corrosion of Air Force aircraft and missile equipment.
We considered the Air Force’s budget data for FY2007 contained in the FY2009 President’s Budget along with CPC IPT–funded corrosion project listings. The RDT&E projects in Table 2-19 contain funding for corrosion prevention and con-trol for Air Force aircraft and missile equipment.
2-36

Air Force Aircraft and Missile Corrosion Costs
Table 2-19. Possible Air Force Aircraft and Missile Weapon System or Equipment Corrosion RDT&E Projects
Project title Project or index number Service funding
Flexible primer W07AF04 $100,000
Sand erosion test W07AF06 $168,000
Qualification and integration of Av-DEC antenna gaskets on C-17 aircraft
W07AF08 $920,000
Total $1,188,000 Source: DoD Report, Efforts to Reduce Corrosion on the Military Equipment and Infrastructure of the De-
partment of Defense, June 2008, p. V-3.
We concluded the corrosion cost of Air Force aircraft and missile RDT&E in FY2007 was $1.2 million.
CORROSION-RELATED AIRCRAFT AND MISSILE FACILITIES COSTS
Corrosion facilities costs are expenditures on facilities that have the primary pur-pose of preventing or correcting corrosion. Examples of these types of facilities include paint booths, curing ovens to heat treat protective coatings, and aircraft and missile platform wash-and-rinse facilities.
We examined the Air Force’s military construction actuals data for FY2007 con-tained in the FY2008 President’s Budget and the CPC IPT–funded corrosion fa-cilities-related listings. We searched for corrosion keywords (“corrosion,” “paint,” “blast,” “clean,” and “wash”) and identified the following Air Force corrosion-related facility listings.
Table 2-20. Air Force Corrosion-Related Facility Costs (in millions)
Military component Installation Project number
Installation/command and project title
Authorization request Appropriation
Active Elmendorf, Alaska FXSB053007B F-22A Corrosion Control/Low Ob-servable/Composite Repair
$31.75 $31.75
Active Robins Air Force Base, Georgia
UHHZ033011 Advanced Metal Finishing Facility $30.00 $30.00
Active Hill Air Force Base, Utah KRSM033002 F/A-22 Fueled Composite Aircraft Overhaul/Test Facility
$26.00 $26.00
Total $87.75 $87.75
We used the appropriated dollar amounts and concluded the Air Force corrosion fa-cilities cost in FY2007 for aircraft and missile equipment was $87.8 million.
CORROSION-RELATED AIRCRAFT AND MISSILE TRAINING COSTS
Corrosion training costs are the labor-hours, materials, travel, and other related costs expended by instructors and students teaching or learning corrosion-related subject matter.
2-37

We canvassed the data and the Air Force Corrosion Office for those costs and de-termined they were not identifiable. Therefore, we concluded that the corrosion-related aircraft and missile training costs were zero.
AIR FORCE CORROSION STAFFING
We canvassed the data and the Air Force Corrosion Office for those costs and de-termined they were not identifiable. Therefore, we concluded that the corrosion-related aircraft and missile training costs were zero.
Purchase Cards (Node G )
Purchase card corrosion costs are expenditures for corrosion-related materials or services that are made with the use of a charge card. We account for these costs separately because purchases made with charge cards are not included in the maintenance recording systems we examined as part of DLM and FLM costs.
We obtained a list of the FY2007 charge card purchases for the Air Force. This data includes the purchasing organization, the merchant category code (MCC), transac-tion dates, merchant description, and transaction amounts. The MCC describes the material or service much like the government’s Federal Supply Class codes.
We isolated potential corrosion-related purchase card items by performing a key-word search to flag merchant descriptions that contain corrosion words, such as “paint,” “wash,” “coatings,” and “clean.” We show the standard keyword list in Appendix F. We then examined each flagged transaction to determine whether it was a corrosion-related Air Force aircraft and missile materials or service pur-chase. We separated records that contained purchases for Air Force facilities ma-terials by searching through the flagged purchase records against a keyword list of building materials. Records that contain building materials are for facilities, not weapon systems.
Once we separated the facilities records from the non-facilities records, we deter-mined the aircraft and missile corrosion-related purchase card costs from among the non-facilities records by applying a ratio of Air Force aircraft and missile maintenance costs to total Air Force weapon system maintenance costs.
Based on the valid corrosion-related Air Force aircraft and missile equipment transactions, we determined the cost of corrosion based on purchase card expendi-tures in FY2007 was $17.4 million (out of $870.6 million).
2-38

Air Force Aircraft and Missile Corrosion Costs
FINAL AIR FORCE AIRCRAFT AND MISSILE CORROSION COST TREE (NODES A THROUGH G )
In Figure 2-13, we present the aircraft and missile corrosion cost tree with the fi-nal calculated corrosion costs at each node.
Figure 2-13. Final Air Force Aircraft and Missile Corrosion Cost Tree
$83.9 billion DoD maintenance
Labor of non-maintenanceaircraft operators
E
Total Air Force ONR
F
Priority 2 and 3 costs
G
Purchasecards
$10.1 billion Total Air Force DLM
$11.1 billion Total Air Force FLM
C
Labor-related cost of corrosion
D
Materials-related cost of corrosion
A
Labor-related cost of corrosion
B
Materials-related cost of corrosion
$62.7 billion Non–Air Force maintenance
Air Force aircraft and missiles only
$1,382million
$1,615 million
$2,059million
$230million
$40million
$89million
$18million
FY2007 Air Force aviation corrosion cost estimate is $5.43 billion
2-39

2-40 2-40

Chapter 3 Summary and Analysis of Corrosion Costs
The total annual corrosion cost estimate for Air Force aircraft and missile equipment is $5.43 billion.
While conducting this study, we created a data structure that allows many dif-ferent views of the cost data—far too many to depict within the body of this re-port. In this chapter, we extract several of the more interesting FY2007 summaries and discuss their significance.
AIR FORCE CORROSION COSTS BY NODE We present the Air Force aircraft and missile equipment corrosion costs by node and sub-node in Table 3-1.
Table 3-1. Air Force Aircraft and Missile Equipment Corrosion Cost by Node and Sub-Node (FY2007)
Node or sub-node Description of corrosion cost node
Total aircraft and missile maintenance
cost (in millions) Corrosion cost
(in millions)
Corrosion cost as a percentage of total aircraft and missile maintenance cost
A1 Organic DLM direct labor $1,838 $757 41.2%
A2 Commercial DLM labor $1,660 $625 37.6%
B1 Organic DLM materials $2,858 $915 32.0%
B2 Commercial DLM materials $2,581 $700 27.1%
Depot overhead (organic and commercial) $384 $0 0.0%
DLM total $9,321 $2,997 32.3% C1 Organic FLM labor $5,974 $1,947 32.6%
C2 Commercial FLM labor $276 $112 40.4%
D1 Organic FLM materials $704 $217 30.9%
D2 Commercial FLM materials $33 $13 39.1%
FLM overhead $134 — 0.0%
FLM total $7,121 $2,289 32.1%
E Labor of non-maintenance aircraft operators $118 $40 33.7%
F Priority 2 and 3 $89 $89 N/A
G Purchase cards $871 $18 2.0%
ONR total $1,078 $147 14.0% Total—all costs $17,520 $5,433 31.0%
3-1

The cost of corrosion-related labor ($3.481 billion) is the largest contributor to corrosion costs. The labor cost of corrosion equates to the costs for DLM labor at nodes A1 and A2 , FLM labor at nodes C1 and C2 , and non-maintenance air-craft operators labor at node E . The labor cost of these five nodes account for 64 percent of the Air Force’s total corrosion-related aircraft and missile equip-ment costs.
The FLM and DLM cost of corrosion as a percentage of total aircraft and missiles of FLM and DLM cost are almost the same (32.1 percent and 32.3 percent, re-spectively). But in terms of cost, DLM corrosion costs ($2.997 billion) are $708 million more than FLM corrosion costs ($2.289 billion). The primary reason is the overall aircraft and missile maintenance costs attributable to DLM ($9.289 billion) exceed the aircraft and missile maintenance costs attributable to FLM ($7.121 billion) by $2.168 billion. This additional DLM maintenance cost accounts for the additional $708 million of DLM corrosion cost.
Although the FLM and DLM corrosion costs as a percentage of their respective overall maintenance costs are nearly identical, their compositions are not. Within DLM, parts repair and replacement accounts for almost 77 percent of the total DLM corrosion cost, while FLM corrosion costs are largely attributable to corro-sion-related inspections (80 percent).
AIR FORCE CORROSION COSTS BY EQUIPMENT TYPE We calculated the total corrosion cost by MDS as well as the average corrosion cost per aircraft and missile equipment type for each MDS. We show the top 20 con-tributors to Air Force aircraft and missile equipment corrosion costs in Table 3-2.
Table 3-2. Top 20 Contributors to Aircraft and Missile Corrosion Cost by Type (FY2007)
Rank General
nomenclature Total
inventory Maintenance
cost (in millions) Corrosion cost
(in millions)
Corrosion as a percentage
of maintenance
1 F-16C 1,073 $1,761 $489 28%
2 KC-135R 363 $1,302 $451 35%
3 A-10A 248 $851 $276 32%
4 C-130H 275 $623 $274 44%
5 B-1B 67 $845 $251 30%
6 B-52H 94 $698 $240 34%
7 F-15C 335 $742 $240 32%
8 F-15E 223 $597 $204 34%
9 C-5A 59 $576 $204 35%
10 C-5C 2 $330 $147 44%
11 C-130E 142 $368 $139 38%
12 C-17A 164 $472 $138 29%
3-2

Summary and Analysis of Corrosion Costs
Table 3-2. Top 20 Contributors to Aircraft and Missile Corrosion Cost by Type (FY2007)
Rank General
nomenclature Total
inventory Maintenance
cost (in millions) Corrosion cost
(in millions)
Corrosion as a percentage
of maintenance
13 C-5B 47 $217 $81 37%
14 C-130J 38 $186 $80 43%
15 F-16D 177 $309 $77 25%
16 LGM-30G 564 $327 $72 22%
17 HH-60G 87 $190 $64 34%
18 B-2A 21 $204 $63 31%
19 MC-130H 20 $149 $58 39%
20 T-38C 398 $139 $55 40%
With more than $489 million in corrosion costs, the F-16C Fighting Falcon (see Figure 3-1 ), is the greatest contributor to Air Force aircraft and missile equipment corrosion costs. This is largely due to the fact that it has the largest aircraft inven-tory (1,073) in the Air Force.
Figure 3-1. MDS: F016C; F-16C Fighting Falcon
Note: The F-16C is the greatest contributor to total Air Force aircraft and missile equipment
corrosion costs.
The only ballistic missile to make the top 20 list is the LGM-30G, Minuteman In-tercontinental Ballistic Missile (ICBM), which contributes $72 million in corrosion costs. The high inventory (564) is a likely factor in the LGM-30G ranking 16th overall (see Table 3-2).
Table 3-3 shows the top 20 MDSs by average corrosion cost per item. We calcu-lated these costs by attributing the total corrosion costs by MDS to the number of
3-3

items in the inventory for each MDS. We only included MDSs that have more than 10 items in inventory to avoid portraying a skewed picture of the data.
Table 3-3. Top 20 Aircraft and Missile Corrosion Cost per Item (FY2007)
Rank General
nomenclature Total
inventory Corrosion cost
(in millions)
Average corrosion cost per item (in millions)
1 B-1B 67 $251.2 $3.7
2 C-5A 59 $203.9 $3.5
3 B-2A 21 $63.3 $3.0
4 MC-130H 20 $58.4 $2.9
5 B-52H 94 $240.3 $2.6
6 C-130J 38 $80.5 $2.1
7 C-5B 47 $81.1 $1.7
8 MC-130P 27 $46.4 $1.7
9 MH-53M 20 $30.4 $1.5
10 F-16B 13 $18.7 $1.4
11 E-3B 23 $29.0 $1.3
12 KC-135R 363 $451.4 $1.2
13 AC-130U 17 $19.2 $1.1
14 A-10A 248 $276.2 $1.1
15 MC-130E 14 $14.4 $1.0
16 C-130H 275 $273.8 $1.0
17 C-130E 142 $139.5 $1.0
18 F-15E 223 $204.5 $0.9
19 F-15D 54 $49.2 $0.9
20 HC-130P 23 $20.7 $0.9
At more than $3.7 million in corrosion repairs per aircraft, the B-1B Lancer bomber is the aircraft with the highest annual corrosion cost per item. The multi-ple-mission B-1 is the backbone of America’s long-range bomber force. Final fielding was in 1988, making the newest aircraft 21 years old. With an increased operational role in support of recent and ongoing combat requirements, the B-1B has needed to maintain a high readiness rate. Since there are relatively few of these aircraft (67), they receive priority maintenance to ensure combat readiness. With an average annual maintenance cost of almost $13 million per aircraft (Table 3-2), the B-1B ranks the highest of all the aircraft with inventories more than 10 from our top 20 list of contributors to aircraft and missile corrosion cost by type (Table 3-4). The B-1B is also a top 10 contributor to the overall corrosion cost, adding more than $251 million to that total.
3-4

Summary and Analysis of Corrosion Costs
The aircraft with the second highest average per-item corrosion cost is the C-5A Gal-axy transport aircraft. The C-5A is a heavy-cargo transport designed to provide stra-tegic airlift for deployment and supply of combat and support forces. It has played a vital role in past and ongoing combat operations. The average age of the C-5A is more than 35 years. Its mission, age, history of maintenance issues, and small inven-tory (59) are all likely factors that contribute to the high average annual per-item cor-rosion cost of $3.5 million per aircraft.
Another observation when looking at the first eight weapons systems in Table 3-3 is they are all large aircraft with more surface area exposed to the elements. It is intuitive that those large aircraft (e.g., cargo, transport, and bombers) would have more corrosion costs per item than smaller aircraft (e.g., fighters, trainers, and drones) based simply on their greater structural exposure.
The aircraft that merit the most attention have both a high total corrosion cost and a high average per-item corrosion cost (see Table 3-4).
Table 3-4. Air Force Aircraft and Missiles with the Highest Combined Ranks of Average Corrosion Cost per Item and Total Corrosion Cost (FY2007)
Top 20 General
nomenclature
Corrosion cost per item (in millions)
Per-item corrosion cost
ranking
Total corrosion cost
(in millions) Total corrosion
cost rank Combined rank
1 B-1B $3.7 1 $251.2 5 6
2 B-52H $2.6 5 $240.3 6 11
3 C-5A $3.5 2 $203.8 9 11
4 KC-135R $1.2 12 $451.4 2 14
5 A-10A $1.1 14 $276.2 3 17
6 C-5B $1.7 7 $81.1 12 19
7 C-130J $2.1 6 $80.5 13 19
8 B-2A $3.0 3 $63.3 17 20
9 C-130H $1.0 16 $273.8 4 20
10 MC-130H $2.9 4 $58.4 18 22
11 F-15E $0.9 18 $204.5 8 26
12 C-130E $1.0 17 $139.5 10 27
13 F-15C $0.7 22 $239.8 7 29
14 MC-130P $1.7 8 $46.4 22 30
15 F-16C $0.5 29 $489.4 1 30
16 C-17A $0.8 21 $137.5 11 32
17 MH-53M $1.5 9 $30.4 24 33
18 E-3B $1.3 11 $29.0 25 36
19 F-15D $0.9 19 $49.2 21 40
20 HH-60G $0.6 24 $64.4 16 40
3-5
The B-1B Lancer bomber aircraft has the highest combined ranking of total corro-sion cost and corrosion cost per item. The sequence the systems are listed in Table 3-4 suggests a priority for investigating corrosion costs by MDS.
AIR FORCE CORROSION COSTS BY WUC Another way to view the cost data is by WUC.1 Table 3-5 shows the top 20 corro-sion costs ranked by WUC.
Table 3-5. Top 20 Air Force Aircraft and Missile Equipment Corrosion Cost Ranking by WUC (FY2007)
Rank WUC description Corrosion cost
(in millions) WUC
1 Airframe $960.2 11
2 Special inspection $375.5 04
3 Inspection $313.1 03
4 Fuel systems $279.1 46
5 Directional flight $248.8 14
6 Alighting/launching system $236.0 13
7 Shop support $146.7 09
8 Turbojet engines $113.8 23
9 Electrical power supply/distribution/lighting system $107.7 42
10 Equipment and facility cleaning $99.4 02
11 Furnishings/compartments $90.1 12
12 Environmental control/pneumatic systems $77.0 41
13 Weapon delivery systems $75.1 75
14 Weapon control systems $64.9 74
15 Hydraulic systems $62.7 45
16 Countermeasures systems $62.1 76
17 Ground handling $60.5 01
18 Turboshaft/turboprop engines $52.1 22
19 Auxiliary power systems $46.4 24
20 Instrumentation systems $38.0 51
— Commercial depot maintenance records $1,325.0 Unassigned
— Records with unrecognizable or blank WUC entries $93.4 Unassigned
Commercial depot bottom-up records contain a WBS, but not a WUC. Many of the organic FLM bottom-up records either have blank data entries in the WUC field or unrecognizable codes. To ensure we did not introduce bias by arbitrarily assigning a WUC, we left them “unassigned.” The corrosion costs
1 We defined WUC in Chapter 1.
3-6

Summary and Analysis of Corrosion Costs
of these unassigned records (see last two rows of Table 3-5) total more than $1.418 billion, or approximately 26 percent of the total corrosion cost.
The aircraft structure (i.e., WUC: 11, airframe) incurs the overwhelming majority of corrosion costs ($960 million). Its corrosion costs are more than two-and-one-half times higher than the next highest WUC (WUC:04, special inspections).
Table 3-6 shows the corrosion costs as a percentage of overall maintenance costs ranked by WUC. We show only those WUCs that have a minimum of $10 million in maintenance to avoid depicting a skewed result.
Table 3-6. Air Force Aircraft and Missile Equipment Corrosion Cost by WUC as a Percentage of Maintenance Cost (FY2007)
Costs (in millions)
Rank WUC description Total
maintenance Corrosion
Corrosion as a percentage of maintenance WUC
1 Equipment and facility cleaning $112 $99 89% 02
2 Shop support $206 $147 71% 09
3 Special inspection $983 $376 38% 04
4 Airframe $2,553 $960 38% 11
5 Fuel systems $757 $279 37% 46
6 Oxygen systems $60 $21 35% 47
7 Rotary wings $20 $7 35% 15
8 Alighting/launching system $690 $236 34% 13
9 Propellers $59 $20 34% 32
10 Directional flight $731 $249 34% 14
11 Vertical takeoff and landing/short takeoff and landing transmissions/drives
$11 $4 33% 26
12 Environmental control/pneumatic systems $244 $77 32% 41
13 Auxiliary power systems $148 $46 31% 24
14 Inspection $1,001 $313 31% 03
15 Hydraulic systems $201 $63 31% 45
16 Miscellaneous emergency/utility systems $73 $23 31% 49
17 Emergency equipment $24 $7 31% 91
18 Turboshaft/turboprop engines $169 $52 31% 22
19 VHF communications systems $20 $6 30% 62
20 Electrical power supply, distribution, or lighting systems
$359 $108 30% 42
Total $4,405 $1,418 32% Unassigned
While cleaning of equipment (WUC: 02) is the greatest contributor to corrosion costs from the standpoint of percentage of maintenance costs (89 percent), it can be considered a more detailed variant of structural maintenance. This is because WUC 02 is often used to capture the washing or degreasing as well as cleaning
3-7

and corrosion prevention treatment of aircraft which are structural maintenance actions. When combined with WUC: 11 (airframe), the blended corrosion per-centage of maintenance is 40 percent. The fact that such a high percentage of cor-rosion costs occurs on the structural components of airframes could be seen as an opportunity for even more preventive measures. For example, several common coatings are effective in mitigating corrosion on the common airframe of multiple aircraft types.
AIR FORCE CORROSION COSTS—CORRECTIVE VERSUS PREVENTIVE COSTS
We also segregated the data into corrective versus preventive costs.2 Table 3-7 depicts the breakout of Air Force aircraft and missile equipment corrosion costs (excluding a few ONR costs) into the two categories of corrective and preventive and maintenance by level of maintenance.
Table 3-7. Air Force Aircraft and Missile Equipment Corrective and Preventive Corrosion Cost (FY2007)
Category Corrosion cost (in millions) Percentage of total corrosion cost
Corrective DLM $2,242.0 74.8%
Preventive DLM $755.5 25.2%
DLM subtotal $2,997.5 100.0%
Corrective FLM $308.5 13.5%
Preventive FLM $1,980.3 86.5%
FLM subtotal $2,288.8 100.0%
Corrective total $2,550.5 48.2%
Preventive total $2,735.8 51.8%
Maintenance total $5,286.3 100.0%
For DLM, the percentage of corrective corrosion costs is nearly three times greater than the percentage of preventive corrosion costs. For FLM, however, the ratios are reversed; the percentage of preventive corrosion costs is nearly six and one half times greater than corrective corrosion costs. This makes some intuitive sense because DLM personnel are better able to react to all types of corrosion problems because they have the proper facilities, tools, and training. Field-level maintainers spend more time inspecting and performing cleaning and protection operations on the aircraft, which are preventive measures planned for all aircraft. They also lack the comprehensive facilities and tools, and do not have the time to perform the more exhaustive corrective repairs on aircraft structures and compo-nents. It is reasonable to expect a much higher level of preventive costs for FLM because of their prevention-oriented approach, which includes intensive and
2 We defined corrective and preventive costs in Chapter 1.
3-8

Summary and Analysis of Corrosion Costs
constant aircraft inspections, and the field-level emphasis on protection and cleaning of all types of equipment.
When we looked at the Air Force’s overall maintenance distribution, we saw corro-sion-related maintenance costs are split almost evenly (48.2 percent corrective; 51.8 percent preventive). This suggests a near-balanced approach to corrosion mainte-nance across the Air Force.
Table 3-8 depicts the ratio of corrective to preventive corrosion costs by level of maintenance.
Table 3-8. Air Force Aircraft and Missile Equipment Corrective to Preventive Corrosion Cost Ratio (FY2007)
Ratio of corrective to preventive cost
Depot maintenance 2.97 to 1
Field-level maintenance 0.16 to 1
Total maintenance 0.93 to 1
The optimum ratio of corrective to preventive corrosion costs for Air Force aircraft and missile equipment has not been determined except for general maintenance; how-ever, evidence suggests a ratio close to 1:1 is desirable to minimize total mainte-nance costs.3 More study is required to determine the optimum preventive-to-corrective corrosion cost ratio for each weapon system.
AIR FORCE CORROSION COSTS—PARTS VERSUS STRUCTURE
For a final view of the cost data, we segregated it according to parts and struc-ture.4 Table 3-9 depicts the breakout of Air Force aircraft and missile corrosion costs into these two categories. Again, ONR is excluded from this display because we lacked the information necessary to properly categorize those costs.
3 Machinery Management Solutions Inc., Five Steps to Optimizing Your Preventive Mainte-
nance System, Jim Taylor, available at www.reliabilityweb.com/art06/5_steps_optimized_pm.htm. 4 We defined parts and structure in Chapter 1.
3-9

Table 3-9. Air Force Aircraft and Missile Equipment Corrosion Cost by Parts Versus Structure (FY2007)
Cost category Total maintenance cost
(in millions) Corrosion cost
(in millions)
Corrosion as a percentage of total
maintenance costs
DLM structure $2,966 $1,056 35.6%
DLM parts $5,892 $1,924 32.6%
DLM total $8,858 $2,980 33.6%
FLM structure $809 $283 35.1%
FLM parts $5,943 $1,887 31.7%
FLM total $6,752 $2,170 32.1%
Total structure $3,775 $1,340 35.5%
Total parts $11,835 $3,810 32.2%
Total maintenance $15,610 $5,150 33.0% Note: This table does not depict approximately $313 million in total maintenance cost and $136 million in
corrosion costs that we are unable to assign to structure or parts due to inadequate data.
There is a pattern to the parts-versus-structure data at all levels—DLM, FLM and total. Parts corrosion costs are considerably higher than their counterpart structure costs. For example, the total corrosion cost incurred by removable parts of Air Force aircraft equipment ($3.81 billion) exceeds the total corrosion costs incurred by the maintenance on structures ($1.34 billion) by a ratio of almost 3 to 1. The opposite is true from a percentage-of-maintenance standpoint, where structure corrosion costs as a percentage of maintenance are greater than the equivalent parts percentage. For example, the overall structure cost as a percentage of total maintenance (35.5 percent) is slightly greater than the overall parts corrosion cost as a percentage of total maintenance (32.2 percent).
Although this pattern is found within DLM and FLM, it does not present a clear picture of the best opportunities for combating corrosion from a cost standpoint. Because of the compiling of many WUC into the parts and structure analysis, we were unable to definitely discern which is the biggest target of opportunity.
2004 USAF DIRECT COSTS OF CORROSION STUDY In 2004, the Air Force sponsored a study to determine its total annual direct cor-rosion maintenance costs.5 That study estimated a total corrosion cost of $1.497 billion (FY2004 dollars).
5 The 2004 study was conducted by C2 Technology, Inc and sponsored by the Air Force Cor-
rosion Prevention and Control Office. It was the most recent in a series of four studies (1990, 1997, 2001, and 2004) conducted by C2 Technology to determine the total annual direct corrosion maintenance costs for the Air Force.
3-10

Summary and Analysis of Corrosion Costs
There are several significant explanations for the $3.93 billion difference be-tween the results of that study ($1.50 billion) and the results herein ($5.43 bil-lion). The major differences, which account for $3.44 billion (88 percent), are explained below:
Commercial depot analysis (difference of $1.33 billion)—This study at-tempted to measure the contribution of commercial depots to the DLM cost of corrosion. The C2 Technology study did not. That difference the $1.33 billion in additional corrosion costs in the current study.
Indirect labor analysis (difference of $1.62 billion)—We attempted to measure the contributions of both indirect labor and materials. These contri-butions are important because only 40 percent of the total labor cost is re-corded as direct “hands-on” maintenance. The total organic DLM and FLM labor costs in FY2007 were $1.838 billion and $5.974 billion, respectively. The total is $7.812 billion, of which approximately $3.125 billion is direct (accounted for by C2 Technology) and $4.687 billion is indirect (unac-counted for by C2 Technology). The corrosion rate is 34.6 percent for organic labor. When applied to the indirect labor maintenance cost, that rate yields a difference of $1.62 bil-lion ($4.68 billion × 0.346 = $1.62 billion) between the LMI and C2 stud-ies, explaining $1.62 billion in additional corrosion costs in our study.
Labor rates (difference of $0.65 billion)—The growth in FLM labor rates from $37.25/hour in CY2004 to $45.03/hour in FY2007 resulted in a 20.9 percent increase in FLM labor costs. Applied to the total corrosion-related FLM labor cost (direct only) yields a change of $652 million ($3.125 billion × 0.209 = $652 million), explaining the additional corro-sion costs in our study.
“In-scope” methodology (difference of −$0.16 billion)—The C2 Technol-ogy methods included vehicles, support equipment, waste disposal, muni-tions and weapon systems that were outside the scope of our study. This resulted in a lower corrosion estimate herein (−$283 million). The C2 Technology method did not include facilities, training, R&D, charge cards, and the labor of non-maintenance personnel, whereas our method does. These differences resulted in a higher corrosion estimate ($123 mil-lion). The net difference between the methodologies is $160 million less in the current study.
3-11
This analysis is summarized in Table 3-10
Table 3-10. Cost Comparison—Differences Between the LMI Study and 2004 C2 Technology Study (in billions)
Study LMI FY2007
study C2 Technology
2004 study Difference (LMI − C2)
Commercial depot cost of labor and materials $1.33 — $1.33
Indirect labor cost $1.62 — $1.62
Labor rates $0.65 — $0.65
In-scope methodology — $0.16 −$0.16 Total $3.60 $0.16 $3.44
3-12

Appendix A Corrosion Cost Element Definitions
Man-hours Any time spent in corrosion prevention or correction that can be attributed directly to a specific system or end item. The labor can be military, civilian, or contract.
Materials usage The cost of all materials used for corrosion prevention or correction. This includes both consumables and reparables.
Corrosion facilities The acquisition and installation costs of an asset constructed primarily or partially for corrosion prevention or correction. The labor spent to acquire and install the facility would be counted in this cost category. The labor to operate a facility that is used for corrosion correction or prevention would be counted in the direct man-hours cost category if the labor can be attrib-uted to a specific weapon system or family of systems.
Training The cost of training related to corrosion. Such cost would in-clude all labor, materials, educational aids, and travel. It also includes the cost of training development and the training itself.
Research, development, testing, and evaluation
The cost of creating a new product, process, or application that may be used for corrosion correction or prevention. All labor costs spent in research and development are collected in this cost category rather than as direct man-hours.
A-1

do not run CLEANUP macro; it will destroy the node formatting

Appendix B Typical Corrosion Activities
We used the following list of corrosion activities to develop keyword searches and other methods to extract corrosion costs from maintenance reporting databases:
1. Cleaning to remove surface contaminants
2. Stripping of protective coatings
3. Inspection to detect corrosion or corrosion-related damage
4. Repair or treatment of corrosion damage:
a. Corrosion removal
b. Sheet metal or machinist work
c. Replacement of part
5. Application of surface treatment (such as alodine or other surface)
6. Application of protective coatings, regardless of reason
7. Maintaining facilities for performing corrosion maintenance
8. Time spent gaining access to and closure from parts requiring any of activities 1–6
9. Preparation and clean up activities associated with activities 1–7
10. Documentation of inspection results
11. Maintenance requests and planning for corrosion correction
12. Replacing cathodic protection systems (such as zinc)
13. Maintaining environmental control facilities (such as dehumidification tents).
B-1

Appendix C Air Force Aircraft and Ballistic Missile Equipment
The scope of this study included all Air Force aircraft and ballistic missiles. We also incorporated aircraft engines that often show up as depot-level reparables. We looked at 121 unique types of aerospace vehicles (aircraft and ballistic missiles) at the mission design series (MDS)1 level of detail.
In FY2007, there were more than 5,700 aircraft in the Air Force inventory (4,066 active Air Force aircraft; 393 Air Force Reserve aircraft; and 1,315 Air Force Na-tional Guard aircraft) as reported in the HQ USAF Program Data System (PDS).2 This inventory is the total midyear quantity reported in PDS.
Table C-1 lists the Air Force’s active duty aircraft in the inventory in FY2007. Table Table C-2 is a list of the Air Force Reserve’s aircraft; Table Table C-3 is list of the Air Force National Guard’s aircraft; and Table
a
ballistic missiles. Table C-4 is a list of
Air Force
Table C-1. Air Force Active Duty (Aircraft)
Classification description MDS Inventory Average age
(in years)
A010A 127 25.4
OA010A 74 25.1
Attack A010 201 25.3
FA022A 85 1.8
Fighter A022 85 1.8
B001B 67 19.6
Bomber B001 67 19.6
B002A 21 12.6
Bomber B002 21 12.6
1 MDS structure and format are governed by Air Force Joint Instruction 16-401 (14 March 2005)
and are the official designation for DoD aerospace vehicles. In general, an MDS designator is an alpha numeric code that represents a specific category of aerospace vehicles on which work is performed.
2 PDS is the HQ USAF database of record. It pulls its data primarily from the Air Force’s Re-liability and Maintainability Information System (REMIS) and provides the AF headquarters with up-to-date and consistent aircraft inventory, readiness data, and flight/utilization data for each air-craft in the Air Force inventory. We used the midyear inventory level as reported on 31 March 2007 to represent our average annual inventory.
C-1

Table C-1. Air Force Active Duty (Aircraft)
Classification description MDS Inventory Average age
(in years)
B052H 85 45.3
Bomber B052 85 45.3
C005A 4 34.7
C005B 36 19.3
C005C 2 36.7
Cargo and/or Transport C005 42 21.6
C009C 3 32.0
Cargo and/or Transport C009 3 32.0
KC010A 59 22.2
Cargo and/or Transport C010 59 22.2
C012C 16 30.6
C012D 6 22.9
C012F 2 22.8
C012J 4 19.2
Cargo and/or Transport C012 28 26.8
C017A 148 6.3
Cargo and/or Transport C017 148 6.3
C020B 5 19.8
C020C 3 19.9
C020H 2 12.0
Cargo and/or Transport C020 10 18.2
C021A 39 22.2
Cargo and/or Transport C021 39 22.2
VC025A 2 16.4
Cargo and/or Transport C025 2 16.4
C032A 4 8.5
Cargo and/or Transport C032 4 8.5
C037A 9 6.2
Cargo and/or Transport C037 9 6.2
C040B 4 3.1
Cargo and/or Transport C040 4 3.1
C130E 109 42.1
C130H 61 26.9
AC130H 8 37.4
EC130H 14 33.8
MC130H 20 18.7
NC130H 1 41.0
TC130H 1 41.4
C-2

Air Force Aircraft and Ballistic Missile Equipment
Table C-1. Air Force Active Duty (Aircraft)
Classification description MDS Inventory Average age
(in years)
C130J 9 2.1
HC130N 3 36.8
HC130P 16 40.1
MC130P 23 38.9
AC130U 17 16.1
MC130W 2 18.4
Cargo and/or Transport C130 284 33.2
OC135B 2 44.9
NKC135B 1 42.5
WC135C 1 42.8
KC135E 1 48.1
NKC135E 1 49.6
KC135R 166 44.9
RC135S 3 44.9
TC135S 1 44.7
KC135T 30 47.0
RC135U 2 42.1
RC135V 8 42.4
NC135W 1 45.0
RC135W 9 44.7
TC135W 2 44.7
WC135W 1 44.9
Cargo and/or Transport C135 229 45.1
MD001C 9 1.0
MD001D 1 1.5
Other (Includes Helicopter) D001 10 1.1
RD002B 2 1.5
Other (Includes Helicopter) D002 2 1.5
E003B 23 28.5
E003C 9 24.0
Cargo and/or Transport E003 32 27.3
E004B 4 32.8
Cargo and/or Transport E004 4 32.8
F015C 276 23.3
F015D 47 23.9
F015E 223 15
Fighter F015 546 19.9
C-3

Table C-1. Air Force Active Duty (Aircraft)
Classification description MDS Inventory Average age
(in years)
F016A 2 19.2
F016B 9 13.4
F016C 570 15.6
F016D 128 16.8
Fighter F016 709 15.8
F117A 52 20.9
YF117A 2 24.7
Fighter F117 54 21.1
TG010A 1 12.1
TG010B 12 4.6
TG010C 5 4.5
TG010D 4 4.4
Trainers (Glider) G010 22 4.9
TG012A 1 6.5
Trainers (Glider) G012 1 6.5
TG014A 14 4.2
Trainers (Glider) G014 14 4.2
TG015A 2 3.3
TG015B 3 3.2
Trainers (Glider) G015 5 3.2
UH001H 27 35.4
UH001N 62 36.2
UH001V 3 34.2
Other (Includes Helicopter) H001 92 35.9
MH053J 9 37.9
MH053M 20 36.0
Other (Includes Helicopter) H053 29 36.6
HH060G 68 16.9
Other (Includes Helicopter) H060 68 16.9
RQ001B 2 7.5
Other (Drone) Q001 2 7.5
RQ004A 7 2.2
YRQ004A 4 6.6
Other (Drone) Q004 11 3.8
MQ009A 6 1.5
YMQ009A 3 3.8
Other (Drone) Q009 9 2.2
C-4
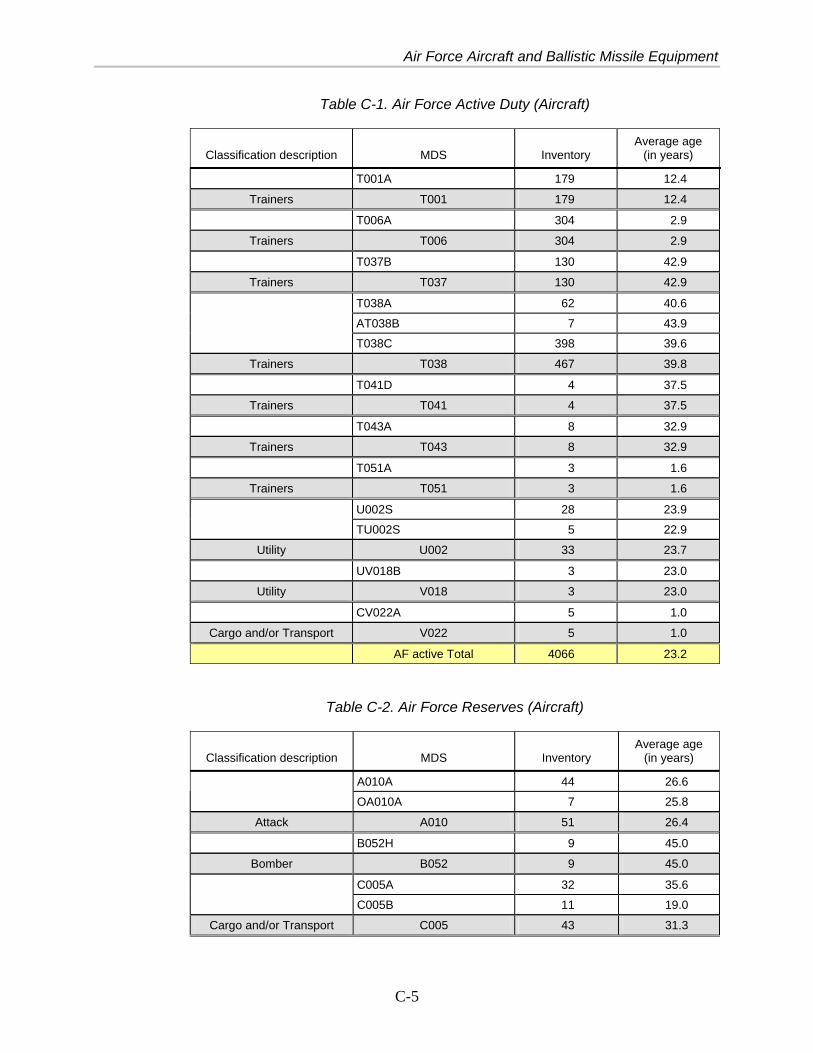
Air Force Aircraft and Ballistic Missile Equipment
Table C-1. Air Force Active Duty (Aircraft)
Classification description MDS Inventory Average age
(in years)
T001A 179 12.4
Trainers T001 179 12.4
T006A 304 2.9
Trainers T006 304 2.9
T037B 130 42.9
Trainers T037 130 42.9
T038A 62 40.6
AT038B 7 43.9
T038C 398 39.6
Trainers T038 467 39.8
T041D 4 37.5
Trainers T041 4 37.5
T043A 8 32.9
Trainers T043 8 32.9
T051A 3 1.6
Trainers T051 3 1.6
U002S 28 23.9
TU002S 5 22.9
Utility U002 33 23.7
UV018B 3 23.0
Utility V018 3 23.0
CV022A 5 1.0
Cargo and/or Transport V022 5 1.0
AF active Total 4066 23.2
Table C-2. Air Force Reserves (Aircraft)
Classification description MDS Inventory Average age
(in years)
A010A 44 26.6
OA010A 7 25.8
Attack A010 51 26.4
B052H 9 45.0
Bomber B052 9 45.0
C005A 32 35.6
C005B 11 19.0
Cargo and/or Transport C005 43 31.3
C-5

Table C-2. Air Force Reserves (Aircraft)
Classification description MDS Inventory Average age
(in years)
C017A 8 1.4
Cargo and/or Transport C017 8 1.4
C040C 1 0.0
Cargo and/or Transport C040 1 0.0
C130E 7 43.3
MC130E 14 41.8
C130H 76 16.8
WC130H 7 41.2
C130J 8 1.4
WC130J 10 5.9
HC130N 1 37.0
HC130P 4 41.4
Cargo and/or Transport C130 127 21.5
KC135E 10 46.5
KC135R 64 45.6
KC135T 8 46.9
Cargo and/or Transport C135 82 45.9
F016C 52 19.1
F016D 5 19.0
Fighter F016 57 19.1
HH060G 15 16.2
Other (Includes Helicopter) H060 15 16.2
AF Reserve Total 393 27.8
Table C-3. Air Force National Guard (Aircraft)
Classification description MDS Inventory Average age
(in years)
A010A 77 26.3
OA010A 27 26.4
Attack A010 104 26.3
C005A 23 35.3
Cargo and/or Transport C005 23 35.3
C017A 8 3.0
Cargo and/or Transport C017 8 3.0
C021A 18 21.9
Cargo and/or Transport C021 18 21.9
C-6

Air Force Aircraft and Ballistic Missile Equipment
Table C-3. Air Force National Guard (Aircraft)
Classification description MDS Inventory Average age
(in years)
RC026B 11 12.8
Cargo and/or Transport C026 11 12.8
C032B 2 3.7
Cargo and/or Transport C032 2 3.7
C038A 2 9.0
Cargo and/or Transport C038 2 9.0
C040C 3 3.8
Cargo and/or Transport C040 3 3.8
C130E 26 43.4
C130H 138 17.9
LC130H 10 15.0
WC130H 3 41.2
C130J 21 4.8
EC130J 7 6.7
HC130N 6 13.2
HC130P 3 40.8
MC130P 4 40.4
Cargo and/or Transport C130 218 20.1
KC135E 95 48.0
KC135R 133 45.7
KC135T 16 47.3
Cargo and/or Transport C135 244 46.7
TE008A 1 16.2
E008C 17 6.4
Other (Surveillance) E008 18 7.0
F015A 67 29.1
F015B 12 29.2
F015C 59 26.0
F015D 7 26.5
Fighter F015 145 27.7
F016A 2 23.4
F016B 4 23.1
F016C 451 18.8
F016D 44 18.1
Fighter F016 501 18.8
HH060G 18 16.3
Other (includes Helicopter) H060 18 16.3
ANG Total 1315 25.7
C-7

Table C-4. Air Force Missiles
Classification description MDS Inventory Average age
(in years)
LGM030G 564 33.2
Ballistic Missile M030 564 33.2
BQM034A 29 5.7
Drone Target M034 29 5.7
AGM086B 969 23.0
AGM086C 188 22.6
AGM086D 40 22.1
Cruise Missile M086 1197 22.9
MQM107D 4 9.8
MQM107E 2 7.3
Drone Target M107 6 9.0
LGM118A 67 16.1
Ballistic Missile M118 67 16.1
AGM129A 395 14.3
Cruise Missile M129 395 14.3
MSL Total 2258 23.5
C-8

Appendix D Air Force Aircraft and Missile Corrosion Cost Data Sources by Node
This appendix lists by node the data sources we used to determine the annual cost of corrosion for Air Force aircraft and missiles.
AIR FORCE AIRCRAFT AND MISSILE EQUIPMENT The HQ USAF Program Data System (PDS) pulls its data primarily from the Air Force’s Reliability and Maintainability Information System (REMIS). We used the midyear inventory level as reported on 31 March 2007 to represent our aver-age annual inventory.
DEPOT-LEVEL LABOR COST OF CORROSION A1 Primary organic depot labor data sources:
Distribution of DoD Depot Maintenance Workloads: Fiscal Years 2007–2009, April 2008 (known as the 50-50 Report).
DOD Maintenance Depot Operating Expenses for FY2007, LMI Report LG705T2, April 2008. Includes the FY2007 Financial Statement [AR(M) 1307, Statement of Financial Position], also known as the 1307 report.
Depot Maintenance Cost System (DMCS) report AP-MP(A) 1397, also re-ferred to as the 1397.
Defense Maintenance and Accounting and Production System (DMAPS); the Air Force accounting information tool linked to the Defense Industrial Financial Management System (DIFMS) database for all three air logistics centers (ALCs).
Program Depot Maintenance Schedule System (PDMSS) (G097) database.
Depot-Level Resource Cost Center (RCC) work center mapping to our de-pot maintenance action steps (1–7, M) (based on RCC information pro-vided by each ALC).
DoD FY2009 President’s Budget for per capita rates.
D-1
A2 Primary commercial depot data sources:
Distribution of DoD Depot Maintenance Workloads: Fiscal Years 2007–2009, April 2008 (known as the 50-50 Report).
DOD Maintenance Depot Operating Expenses for FY2007, LMI Report LG705T2, April 2008. Includes the FY2007 Financial Statement [AR(M) 1307, Statement of Financial Position], also known as the 1307 report.
DMCS report AP-MP(A) 1397, also referred to as the 1397.
DEPOT-LEVEL MATERIALS COST OF CORROSION B1 Primary organic depot materials data sources:
Distribution of DoD Depot Maintenance Workloads: Fiscal Years 2007–2009, April 2008 (known as the 50–50 Report).
DOD Maintenance Depot Operating Expenses for FY2007, LMI Report LG705T2, April 2008. Includes the FY2007 Financial Statement [AR(M) 1307, Statement of Financial Position], also known as the 1307 report.
DMCS report AP-MP(A) 1397, also referred to as the 1397.
Defense Maintenance and Accounting and Production System (DMAPS); the Air Force accounting information tool linked to the DIFMS database for all three ALCs.
Job Order Production Management System (JOPMS) (G004L) database.
Depot Maintenance Material Support System, (DMMSS) (G005M) database.
Depot-level RCC work center mapping to our depot maintenance action steps (1-7, M) (based on RCC information provided by each ALC).
B2 Primary commercial depot materials data sources:
Distribution of DoD Depot Maintenance Workloads: Fiscal Years 2007–2009, April 2008 (known as the 50–50 Report).
DOD Maintenance Depot Operating Expenses for FY2007, LMI Report LG705T2, April 2008. Includes the FY2007 Financial Statement (AR[M] 1307, Statement of Financial Position), known as the “1307 report.”
DMCS report AP-MP(A) 1397, also referred to as the 1397.
D-2

Air Force Aircraft and Missile Corrosion Cost Data Sources by Node
FIELD-LEVEL LABOR COST OF CORROSION C1 Primary organic field-level labor data sources:
Defense Manpower Data Center (DMDC) data on staffing levels for per-sonnel with maintenance specialties.
DoD 1312.1-I, Occupational Conversion Index (enlisted/officers/civilians), November 2006.
DMDC information.
DoD FY2009 President’s Budget for per capita rates.
REMIS maintenance records.
C2 Primary commercial field-level labor data sources:
Line 922 “Equipment Maintenance by Contract,” Operations and Mainte-nance, Air Force Active Duty, Volume II, Air Force Reserve, and Air Na-tional Guard (OP-31 exhibits, “Spares and Repair Parts”); submitted in February 2008 as part of the Department of the Air Force Fiscal Year 2009 Budget Estimates Submission.
REMIS maintenance records.
FIELD-LEVEL MATERIALS COST OF CORROSION D1 Primary organic field-level materials data sources:
Line 922 “Equipment Maintenance by Contract,” Operations and Mainte-nance, Air Force Active Duty, Volume II, Air Force Reserve, and Air Na-tional Guard (OP-31 exhibits, “Spares and Repair Parts”); submitted in February 2008 as part of the Department of the Air Force Fiscal Year 2009 Budget Estimates Submission.
“LogiQuest”® logistics research service for stocked parts and materials.
REMIS maintenance records.
D2 Primary commercial field-level materials data sources:
Line 922 “Equipment Maintenance by Contract,” Operations and Mainte-nance, Air Force Active Duty, Volume II, Air Force Reserve, and Air Na-tional Guard (OP-31 exhibits, “Spares and Repair Parts”); submitted in February 2008 as part of the Department of the Air Force Fiscal Year 2009 Budget Estimates Submission.
REMIS maintenance records.
D-3

COSTS OUTSIDE NORMAL MAINTENANCE REPORTING E Non-maintenance aircraft operator labor:
DMDC information.
Survey information administered from Air Force Knowledge Now and Air Force Portal (www.my.af.mil) websites.
Air Force equipment list.
DoD FY2009 President’s Budget for per capita rates and the OSD-published FY2007 DoD Military Personnel Composite Standard Pay and Reimbursable Rates.
F Priority 2 and 3 costs:
Budget documents for facilities and RDT&E expenditures.
Air Force input to the Corrosion Prevention and Control Integrated Prod-uct Team–funded corrosion facilities–related listings.
Input from the Air Force Corrosion Office (corrosion training and staffing).
G Purchase cards: Air Force credit card purchases.
D-4

Appendix E Depot-Level Corrosion Profile
This appendix provides the depot-level corrosion profile from each air logistics center (Ogden [OO-ALC], Oklahoma City [OC-ALC], and Warner Robins [WR-ALC]) that we used in the study. Results in (Table E-1) map each ALC’s resource cost center (RCC) code (which we interpret to be a work center) to the assigned depot process step, the maintenance repair action, and the assigned corrosion percentage for work done in that work center. It also describes the corrosion cost as corrective or preventive based on those definitions explained in Chapter 1.
The corrosion percentages indicate the corresponding relationship to corrosion maintenance: 0 percent (never), 10 percent (rarely), 25 percent (sometimes), 50 percent (half the time), 75 percent (most of the time), and 100 percent (always). Working through depot representatives, we surveyed each ALC to establish the corrosion percentage for the work done by each depot work center. Results were modified as necessary to fit our basic set of corrosion percentages (for example, a reported corrosion percentage of 40 percent would be rounded up to 50 percent, while a percentage of 15 percent would be rounded down to 10 percent). In many cases, we had a range of possible corrosion percentages. In those instances, we relied on the corrosion keyword search to flag corrosion records and to assign the appropriate corrosion percentage.
In some instances, we used established corrosion percentages for specific depot maintenance actions. For example, painting is recognized as a 100-percent corro-sion-related maintenance action even though it provides other functionality, such as camouflage and stealth capabilities. These conventions support an approved analytical method and permit consistency among all related corrosion cost studies.
Table E-1. Depot-Level Corrosion Profile
CC Work center description Corrosion
percentageDepot
process stepMaintenance
action Corrective or preventive ALC
MXDPAB A-10 Blast 100 3 Process Corrective OO
MXDPAB A-10 Blast 100 3 Process Corrective OO
MXDPAB A-10 Blast 100 3 Process Corrective OO
MXDPAB A-10 Blast 100 3 Process Corrective OO
MXDPAB A-10 Blast 100 3 Process Corrective OO
MXDPAB A-10 Blast 100 3 Process Corrective OO
MXDPAB A-10 Paint 100 6 Process Preventive OO
MXDPAB A-10 Paint 100 6 Process Preventive OO
MXDPAB A-10 Paint 100 6 Process Preventive OO
E-1

Table E-1. Depot-Level Corrosion Profile
CC Work center description Corrosion
percentageDepot
process stepMaintenance
action Corrective or preventive ALC
MXDPAB A-10 Paint 100 6 Process Preventive OO
MXDPAB A-10 Paint 100 6 Process Preventive OO
MXDPAB A-10 Paint 100 6 Process Preventive OO
MBAAP A-10 Sheet Metal 100 4 Repair Corrective OO
MBAAP A-10 Sheet Metal 100 4 Repair Corrective OO
MBAAP A-10 Mechanic 100 4 Repair Corrective OO
MBAAP A-10 Fuel Mechanic 100 4 Repair Corrective OO
MBCXX C-130 Fixer Branch 0–100 M Process Preventive OO
MBCAX C-130 Production Section 0–100 M Process Preventive OO
MBCAA C-130 Production 0–100 4 Repair Corrective OO
MBCAC C-130 Production 0–100 4 Repair Corrective OO
MBCAE C-130 Production 0–100 4 Repair Corrective OO
MBCAF C-130 Flight Test 40–100 7 Process Preventive OO
MBCAF C-130 Blast 100 3 Process Corrective OO
MBCAF C-130 Paint 100 6 Process Preventive OO
MBCAM C-130 Strip & Eng Fuel & E&I 100 3 Process Corrective OO
MBCAT TDY 0–100 M Process Preventive OO
MBCWX C-130 WSSC 0–100 M Process Preventive OO
MBCWM Materiel Supportability 0–100 M Process Preventive OO
MBCWS Schedule Execution 0–100 M Process Preventive OO
MBFFF F-16 Paint 100 6 Process Preventive OO
MBFFJ Small Parts Paint 100 6 Process Preventive OO
MBSFJ F-22 Paint 100 6 Process Preventive OO
MBSPA F-22 Production 0–100 4 Repair Corrective OO
MBRXX Technical Repair Branch/EPSC 0–100 M Process Preventive OO
MBRNX Production Mgmt. Support Sec./Tool Cribs 0–100 M Process Preventive OO
MBRNB Transportation 0–100 M Process Preventive OO
MBRNP Canopys/Plastics/Hydrostatic 0–100 4 Repair Corrective OO
MBRNR Egress/Seat Shop/Flight Test 0–100 M Process Preventive OO
MBRNS Plastics/Rubber/Line Support 0–100 4 Repair Corrective OO
MBRNZ Production Overhead 0–100 M Process Preventive OO
MBRSX Aircraft Structural Repair/Support Sec. 0–100 M Process Preventive OO
MBRSA Paint/Bead Blast 100 3 Process Corrective OO
MBRSB F-16 Wing 0–100 4 Repair Corrective OO
MBRSC C-130 Flight Controls 0–100 4 Repair Corrective OO
MBRSD A-10 Miscellaneous 0–100 4 Repair Corrective OO
MBRSE Paint/Bead Blast (Routes) 100 3 Process Corrective OO
MBRSF Planning/Scheduling/SSC 0–100 M Process Preventive OO
MBRSG Machine Shop 0–100 M Process Preventive OO
E-2
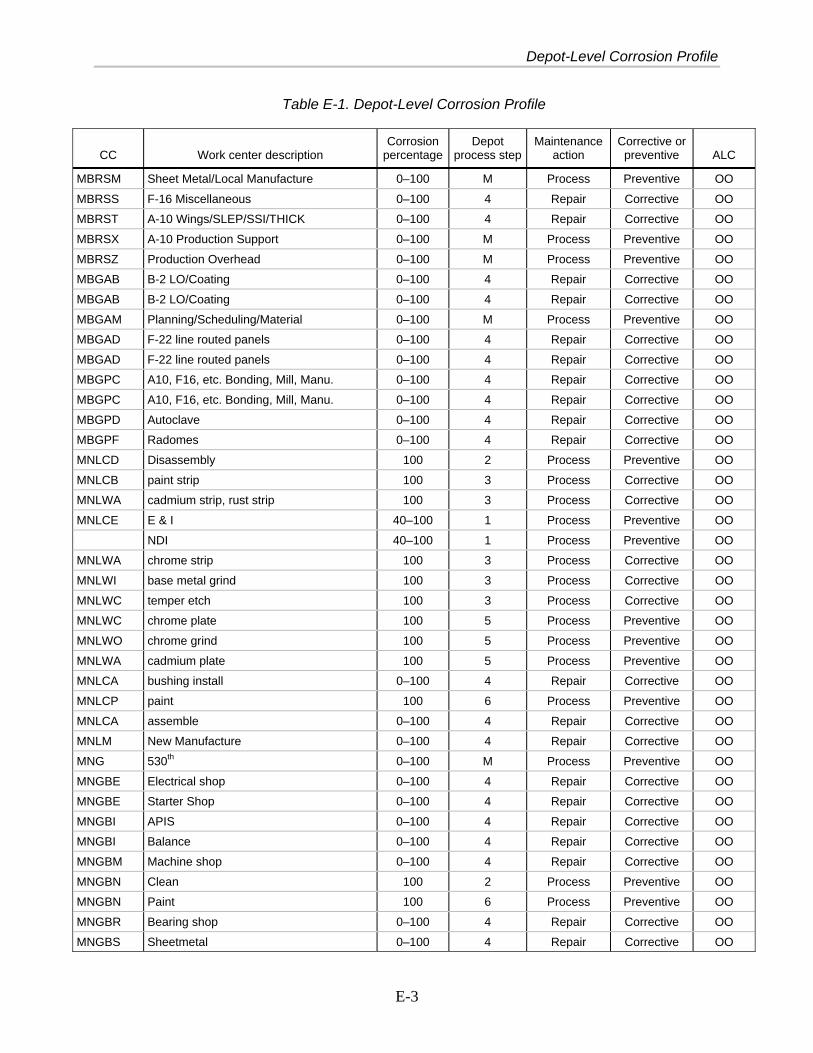
Depot-Level Corrosion Profile
Table E-1. Depot-Level Corrosion Profile
CC Work center description Corrosion
percentageDepot
process stepMaintenance
action Corrective or preventive ALC
MBRSM Sheet Metal/Local Manufacture 0–100 M Process Preventive OO
MBRSS F-16 Miscellaneous 0–100 4 Repair Corrective OO
MBRST A-10 Wings/SLEP/SSI/THICK 0–100 4 Repair Corrective OO
MBRSX A-10 Production Support 0–100 M Process Preventive OO
MBRSZ Production Overhead 0–100 M Process Preventive OO
MBGAB B-2 LO/Coating 0–100 4 Repair Corrective OO
MBGAB B-2 LO/Coating 0–100 4 Repair Corrective OO
MBGAM Planning/Scheduling/Material 0–100 M Process Preventive OO
MBGAD F-22 line routed panels 0–100 4 Repair Corrective OO
MBGAD F-22 line routed panels 0–100 4 Repair Corrective OO
MBGPC A10, F16, etc. Bonding, Mill, Manu. 0–100 4 Repair Corrective OO
MBGPC A10, F16, etc. Bonding, Mill, Manu. 0–100 4 Repair Corrective OO
MBGPD Autoclave 0–100 4 Repair Corrective OO
MBGPF Radomes 0–100 4 Repair Corrective OO
MNLCD Disassembly 100 2 Process Preventive OO
MNLCB paint strip 100 3 Process Corrective OO
MNLWA cadmium strip, rust strip 100 3 Process Corrective OO
MNLCE E & I 40–100 1 Process Preventive OO
NDI 40–100 1 Process Preventive OO
MNLWA chrome strip 100 3 Process Corrective OO
MNLWI base metal grind 100 3 Process Corrective OO
MNLWC temper etch 100 3 Process Corrective OO
MNLWC chrome plate 100 5 Process Preventive OO
MNLWO chrome grind 100 5 Process Preventive OO
MNLWA cadmium plate 100 5 Process Preventive OO
MNLCA bushing install 0–100 4 Repair Corrective OO
MNLCP paint 100 6 Process Preventive OO
MNLCA assemble 0–100 4 Repair Corrective OO
MNLM New Manufacture 0–100 4 Repair Corrective OO
MNG 530th 0–100 M Process Preventive OO
MNGBE Electrical shop 0–100 4 Repair Corrective OO
MNGBE Starter Shop 0–100 4 Repair Corrective OO
MNGBI APIS 0–100 4 Repair Corrective OO
MNGBI Balance 0–100 4 Repair Corrective OO
MNGBM Machine shop 0–100 4 Repair Corrective OO
MNGBN Clean 100 2 Process Preventive OO
MNGBN Paint 100 6 Process Preventive OO
MNGBR Bearing shop 0–100 4 Repair Corrective OO
MNGBS Sheetmetal 0–100 4 Repair Corrective OO
E-3

Table E-1. Depot-Level Corrosion Profile
CC Work center description Corrosion
percentageDepot
process stepMaintenance
action Corrective or preventive ALC
MNGBV Grind Shop 100 3 Process Corrective OO
MNGCC C-17 GTE 0–100 4 Repair Corrective OO
MNGCD F-16 ADG 0–100 4 Repair Corrective OO
MNGCF F-22 0–100 4 Repair Corrective OO
MNGCJ F-16 JFS 0–100 4 Repair Corrective OO
MNGCK ATS 0–100 4 Repair Corrective OO
MNGCO T-38 Gearbox 0–100 4 Repair Corrective OO
MNGCP PTO 0–100 4 Repair Corrective OO
MNGCP PTO 0–100 4 Repair Corrective OO
MNGFG F-15 CGB 0–100 4 Repair Corrective OO
MNGFH Hydraulics shop 0–100 4 Repair Corrective OO
MNGFJ JFS -15 0–100 4 Repair Corrective OO
MNGGA 180 GTE 0–100 4 Repair Corrective OO
MNGGB 85-71 GTE 0–100 4 Repair Corrective OO
MNGGJ 36-50 GTE 0–100 4 Repair Corrective OO
MNGGQ 165 GTE 0–100 4 Repair Corrective OO
MNGGU Pneumatics shop 0–100 4 Repair Corrective OO
MNGPP Prototypes 0–100 4 Repair Corrective OO
MNGTF Fuels, Fuel Controls 0–100 4 Repair Corrective OO
MNGTF FUELS, Manifolds/ Nozzles
0–100 4 Repair Corrective OO
MNGTT Test Cell 0–100 4 Repair Corrective OO
MXDPAA Screw Jacks 0–100 4 Repair Corrective OO
MXDPAB Guns 0–100 4 Repair Corrective OO
MXDPAC Tanks 0–100 4 Repair Corrective OO
MXDPAD Pylons 0–100 4 Repair Corrective OO
MXDPAE Winches 0–100 4 Repair Corrective OO
MXDPAP Phys. Trainers 0–100 4 Repair Corrective OO
MXDPBA Pumps & Motors 0–100 4 Repair Corrective OO
MXDPBB EPU Repair 0–100 4 Repair Corrective OO
MXDPBC PRCA Element 0–100 4 Repair Corrective OO
MXDPBD Pumps & Motors 0–100 4 Repair Corrective OO
MXDPBE Pneu. Repair 0–100 4 Repair Corrective OO
MXDPBF Mechanical Valves 0–100 4 Repair Corrective OO
MXDPBG Mechanical Valves 0–100 4 Repair Corrective OO
MXDPBB B-1/F-4 Flt Control Element 0–100 4 Repair Corrective OO
MXDPBC Hydraulic Repair 0–100 4 Repair Corrective OO
MXDPCAA F-16 Flt Control Element 0–100 4 Repair Corrective OO
MXDPCAB C-5 Flt. Control Element 0–100 4 Repair Corrective OO
E-4

Depot-Level Corrosion Profile
Table E-1. Depot-Level Corrosion Profile
CC Work center description Corrosion
percentageDepot
process stepMaintenance
action Corrective or preventive ALC
MXDPCAC A-10/C-5 Flt. Control Element 0–100 4 Repair Corrective OO
MXDPCAD C/130 Flt Control Element 0–100 4 Repair Corrective OO
MXDPCBA Machine Shop 0–100 4 Repair Corrective OO
MXDPCBC F-15/16 Flt. Control Element 0–100 4 Repair Corrective OO
MXDPCBD F-15 Stabilator Element 0–100 4 Repair Corrective OO
MKPBA Missile Maintenance (PRP Production) 0–100 4 Repair Corrective OO
MKPBA Missile Maintenance (PRP Production) 0–100 4 Repair Corrective OO
MKPBA Missile Maintenance (PK/RSLP Production) 0–100 4 Repair Corrective OO
MKPBA Missile Maintenance (PK/RSLP Production) 0–100 4 Repair Corrective OO
MKPBA Missile Maintenance (PK/RSLP Production) 0–100 4 Repair Corrective OO
MKPBA Missile Maintenance (PK/RSLP Production) 0–100 4 Repair Corrective OO
MKPBC PSRE Production 0–100 4 Repair Corrective OO
MKPBC PSRE Production 0–100 4 Repair Corrective OO
MKPBC PSRE Production 0–100 4 Repair Corrective OO
MKPBC PSRE Production 0–100 4 Repair Corrective OO
MKPBC PSRE Production 0–100 4 Repair Corrective OO
MKPBC PSRE Production 0–100 4 Repair Corrective OO
MKPBC PSRE Production 0–100 4 Repair Corrective OO
MKPBC PSRE Production 0–100 4 Repair Corrective OO
MKPBC PSRE Production 0–100 4 Repair Corrective OO
MKPBC PSRE Production 0–100 4 Repair Corrective OO
MKPBC PSRE Production 0–100 4 Repair Corrective OO
MKPBC PSRE Production 0–100 4 Repair Corrective OO
MKPCP Air Conditioning Repair 0–100 4 Repair Corrective OO
MKPCS Shelter Repair 0–100 4 Repair Corrective OO
MKPCS Shelter Repair 0–100 4 Repair Corrective OO
MKPCS Shelter Repair 0–100 4 Repair Corrective OO
MKPCS Shelter Repair 0–100 4 Repair Corrective OO
MKPCS Shelter Repair 0–100 4 Repair Corrective OO
MKPCS Shelter Repair 0–100 4 Repair Corrective OO
MKPCS Shelter Repair 0–100 4 Repair Corrective OO
MKPCS Shelter Repair 0–100 4 Repair Corrective OO
MKPCS Shelter Repair 0–100 4 Repair Corrective OO
MKPCS Shelter Repair 0–100 4 Repair Corrective OO
MKPCS Shelter Repair 0–100 4 Repair Corrective OO
MKPCS Shelter Repair 0–100 4 Repair Corrective OO
MKPCS Shelter Repair 0–100 4 Repair Corrective OO
MKPCS Shelter Repair 0–100 4 Repair Corrective OO
MKPCS Shelter Repair 0–100 4 Repair Corrective OO
E-5

Table E-1. Depot-Level Corrosion Profile
CC Work center description Corrosion
percentageDepot
process stepMaintenance
action Corrective or preventive ALC
MKPCS Shelter Repair 0–100 4 Repair Corrective OO
MKPCT Radome Repair 0–100 4 Repair Corrective OO
MKPCT Radome Repair 0–100 4 Repair Corrective OO
MKPCT Radome Repair 0–100 4 Repair Corrective OO
MKPEA Sheet Metal Repair 0–100 4 Repair Corrective OO
MKPEA Sheet Metal Repair 0–100 4 Repair Corrective OO
MKPEA Sheet Metal Repair 0–100 4 Repair Corrective OO
MKPEA Sheet Metal Repair 0–100 4 Repair Corrective OO
MKPEB Truck/Trailer Inspect/Service/Repair 0–100 4 Repair Corrective OO
MKPEC Cruise Missile 0–100 4 Repair Corrective OO
MKPEC Cruise Missile 0–100 4 Repair Corrective OO
MKPED Paint & Blast 100 6 Process Preventive OO
MKPED Paint & Blast 100 6 Process Preventive OO
MKPED Paint & Blast 100 6 Process Preventive OO
MKPED Paint & Blast 100 6 Process Preventive OO
MKPED Paint & Blast 100 6 Process Preventive OO
MKPED Paint & Blast 100 6 Process Preventive OO
MKPED Paint & Blast 100 6 Process Preventive OO
MKPED Paint & Blast 100 6 Process Preventive OO
MKPED Paint & Blast 100 6 Process Preventive OO
MKPED Paint & Blast 100 6 Process Preventive OO
MKPEF Truck/Trailer Overhaul 0–100 4 Repair Corrective OO
MKPEF Truck/Trailer Overhaul 0–100 4 Repair Corrective OO
MKPEF Truck/Trailer Overhaul 0–100 4 Repair Corrective OO
MKPEF Truck/Trailer Overhaul 0–100 4 Repair Corrective OO
MKPEF Truck/Trailer Overhaul 0–100 4 Repair Corrective OO
MKPEF Truck/Trailer Overhaul 0–100 4 Repair Corrective OO
523/B9B F-16 Display Indicators 0–100 4 Repair Corrective OO
523-B9N F-16 Radar 0–100 4 Repair Corrective OO
523/B9F F-16 Avionics SRU 0–100 4 Repair Corrective OO
523/B9L F-16 Avionics SRU 0–100 4 Repair Corrective OO
523/B9D F-16 Avionics SRU 0–100 4 Repair Corrective OO
523/B9J F-16 Avionics SRU 0–100 4 Repair Corrective OO
523/B9K F-16 Avionics SRU 0–100 4 Repair Corrective OO
MXDPAA Computer/Inertial & Optics Shop 0–100 4 Repair Corrective OO
MXDPAA Computer/Inertial & Optics Shop 0–100 4 Repair Corrective OO
MXDPAA Computer/Inertial & Optics Shop 0–100 4 Repair Corrective OO
MXDPAA Computer/Inertial & Optics Shop 0–100 4 Repair Corrective OO
MXDPAA Computer/Inertial & Optics Shop 0–100 4 Repair Corrective OO
E-6
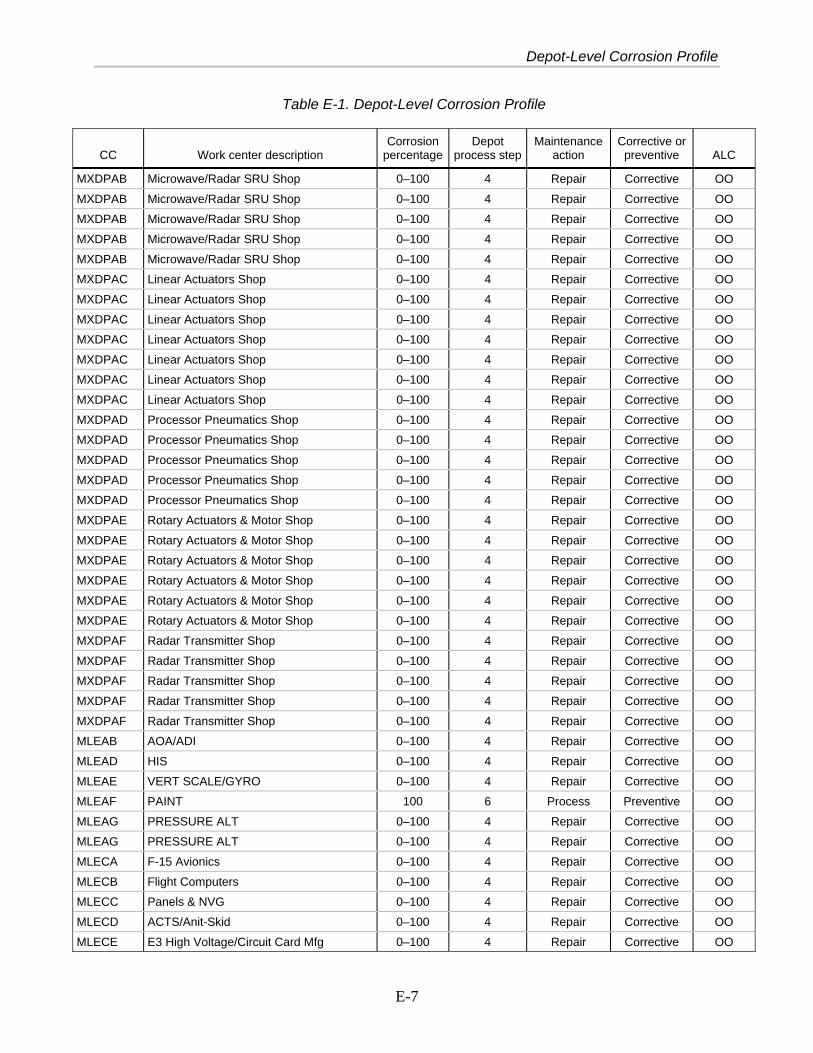
Depot-Level Corrosion Profile
Table E-1. Depot-Level Corrosion Profile
CC Work center description Corrosion
percentageDepot
process stepMaintenance
action Corrective or preventive ALC
MXDPAB Microwave/Radar SRU Shop 0–100 4 Repair Corrective OO
MXDPAB Microwave/Radar SRU Shop 0–100 4 Repair Corrective OO
MXDPAB Microwave/Radar SRU Shop 0–100 4 Repair Corrective OO
MXDPAB Microwave/Radar SRU Shop 0–100 4 Repair Corrective OO
MXDPAB Microwave/Radar SRU Shop 0–100 4 Repair Corrective OO
MXDPAC Linear Actuators Shop 0–100 4 Repair Corrective OO
MXDPAC Linear Actuators Shop 0–100 4 Repair Corrective OO
MXDPAC Linear Actuators Shop 0–100 4 Repair Corrective OO
MXDPAC Linear Actuators Shop 0–100 4 Repair Corrective OO
MXDPAC Linear Actuators Shop 0–100 4 Repair Corrective OO
MXDPAC Linear Actuators Shop 0–100 4 Repair Corrective OO
MXDPAC Linear Actuators Shop 0–100 4 Repair Corrective OO
MXDPAD Processor Pneumatics Shop 0–100 4 Repair Corrective OO
MXDPAD Processor Pneumatics Shop 0–100 4 Repair Corrective OO
MXDPAD Processor Pneumatics Shop 0–100 4 Repair Corrective OO
MXDPAD Processor Pneumatics Shop 0–100 4 Repair Corrective OO
MXDPAD Processor Pneumatics Shop 0–100 4 Repair Corrective OO
MXDPAE Rotary Actuators & Motor Shop 0–100 4 Repair Corrective OO
MXDPAE Rotary Actuators & Motor Shop 0–100 4 Repair Corrective OO
MXDPAE Rotary Actuators & Motor Shop 0–100 4 Repair Corrective OO
MXDPAE Rotary Actuators & Motor Shop 0–100 4 Repair Corrective OO
MXDPAE Rotary Actuators & Motor Shop 0–100 4 Repair Corrective OO
MXDPAE Rotary Actuators & Motor Shop 0–100 4 Repair Corrective OO
MXDPAF Radar Transmitter Shop 0–100 4 Repair Corrective OO
MXDPAF Radar Transmitter Shop 0–100 4 Repair Corrective OO
MXDPAF Radar Transmitter Shop 0–100 4 Repair Corrective OO
MXDPAF Radar Transmitter Shop 0–100 4 Repair Corrective OO
MXDPAF Radar Transmitter Shop 0–100 4 Repair Corrective OO
MLEAB AOA/ADI 0–100 4 Repair Corrective OO
MLEAD HIS 0–100 4 Repair Corrective OO
MLEAE VERT SCALE/GYRO 0–100 4 Repair Corrective OO
MLEAF PAINT 100 6 Process Preventive OO
MLEAG PRESSURE ALT 0–100 4 Repair Corrective OO
MLEAG PRESSURE ALT 0–100 4 Repair Corrective OO
MLECA F-15 Avionics 0–100 4 Repair Corrective OO
MLECB Flight Computers 0–100 4 Repair Corrective OO
MLECC Panels & NVG 0–100 4 Repair Corrective OO
MLECD ACTS/Anit-Skid 0–100 4 Repair Corrective OO
MLECE E3 High Voltage/Circuit Card Mfg 0–100 4 Repair Corrective OO
E-7

Table E-1. Depot-Level Corrosion Profile
CC Work center description Corrosion
percentageDepot
process stepMaintenance
action Corrective or preventive ALC
MXDPAA Industrial 0–100 4 Repair Corrective OO
MXDPAB Conventional Avionics 0–100 4 Repair Corrective OO
MXDPAC F-15 / F-16 Avionics 0–100 4 Repair Corrective OO
MXDPAD Hydraulics 0–100 4 Repair Corrective OO
MWCCX Commander’s Action Group 0–100 M Process Preventive OC
MWAFX Financial Management Office 0–100 M Process Preventive OC
MLMRZ TAC 0–100 M Process Preventive OC
MBCEJ E-3 specialized Sec. 0–100 4 Repair Corrective OC
MBCEK E-3 specialized Sec. 0–100 4 Repair Corrective OC
MBCEL E-3 specialized Sec. 0–100 4 Repair Corrective OC
MXXXX Engineering Office 0–100 M Process Preventive OC
MWFXX Financial Management Office 0–100 M Process Preventive OC
MWFXX Financial Analysis Sec. 0–100 M Process Preventive OC
MWFXX Financial Mgmt. & Budget Sec. 0–100 M Process Preventive OC
MWXXX Business Operations Office 0–100 M Process Preventive OC
MWHXX Human Resources Development Sec. 0–100 M Process Preventive OC
MWHBX Blue Collar Human Resources Development Element
0–100 M Process Preventive OC
MWHWX White Collar Human Resources Development Element
0–100 M Process Preventive OC
MWWXX Workload & Business Development Sec. 0–100 M Process Preventive OC
MWWWX Workloading Office Element 0–100 M Process Preventive OC
MWWBX Business Development Office Element 0–100 M Process Preventive OC
MOXXX Management Operations Office 0–100 M Process Preventive OC
MOAXX Administrative Section 0–100 M Process Preventive OC
MOBXX Personnel Section 0–100 M Process Preventive OC
MPXXX Quality Assurance/Process Improvement Office
0–100 M Process Preventive OC
MPEXX Safety & Environmental Compliance Assurance Section
0–100 M Process Preventive OC
MPQXX Quality Assurance Section 0–100 M Process Preventive OC
MPQAX Quality Metrics And Analysis Element 0–100 M Process Preventive OC
MPQBX Quality Audit Element 0–100 M Process Preventive OC
MPPXX Depot Maintenance Transformation Sec. 0–100 M Process Preventive OC
MRXXX Transformation Division 0–100 M Process Preventive OC
MBXXX 76 Aircraft Maintenance Group 0–100 M Process Preventive OC
MBAXX 564 Aircraft Maintenance Sqdn (Tankers) 0–100 M Process Preventive OC
MBATX Tanker Production Flight 0–100 M Process Preventive OC
MBATA Tanker Aircraft Section 0–100 4 Repair Corrective OC
MBATB Tanker Structure Sec. 0–100 4 Repair Corrective OC
E-8

Depot-Level Corrosion Profile
Table E-1. Depot-Level Corrosion Profile
CC Work center description Corrosion
percentageDepot
process stepMaintenance
action Corrective or preventive ALC
MBATF Tanker Contract Field Team 0–100 4 Repair Corrective OC
MBATC Tanker Pre-Dock Sec. 0–100 4 Repair Corrective OC
MBATH Tanker Post-Dock Sec. 0–100 4 Repair Corrective OC
MBATS Tanker Support Section 0–100 4 Repair Corrective OC
MBAWZ Tanker Weapon System Support Center (WSSC) Flight
0–100 M Process Preventive OC
MBAPZ Tanker Planning Section (Support & Materiel Mgmt.)
0–100 M Process Preventive OC
MBASZ Tanker Scheduling Sec. 0–100 M Process Preventive OC
MBBXX 565 Aircraft Maintenance Sqdn. (Bombers) 0–100 M Process Preventive OC
MBBBX B-1B Bomber Aircraft Production Flight 0–100 M Process Preventive OC
MBBBA B-1B Aircraft Section 0–100 4 Repair Corrective OC
MBBBB B-1B Structural Section 0–100 4 Repair Corrective OC
MBBBC B-1B Electrical Section 0–100 4 Repair Corrective OC
MBBBH B-1B Avionics Section 0–100 4 Repair Corrective OC
MBBFX B-52 Bomber Aircraft Modification Flight 0–100 M Process Preventive OC
MBBFA B-52 Aircraft Section 0–100 4 Repair Corrective OC
MBBFB B-52 Structural Section 0–100 4 Repair Corrective OC
MBBFC B-52 Electrical Section 0–100 4 Repair Corrective OC
MBBFG B-52 Egress Section 0–100 4 Repair Corrective OC
MBBFH B-52 Avionics Section 0–100 4 Repair Corrective OC
MBBWZ Bomber WSSC Flight 0–100 M Process Preventive OC
MBBCZ B-1B Scheduling Sec. (Foward Support) 0–100 M Process Preventive OC
MBBEZ B-1B Planning Section (Supportability & Material
0–100 M Process Preventive OC
MBBPZ B-52B Planning Sec. (Support & Material Mgmt.)
0–100 M Process Preventive OC
MBBSZ B-52 Scheduling Sec. (Foward Support) 0–100 M Process Preventive OC
MBCXX 566 Aircraft Maintenance Squadron (E-3/Services)
0–100 M Process Preventive OC
MBCCX Services Flight 0–100 M Process Preventive OC
MBCCA Disassembly/Cleaning Section 100 3 Process Corrective OC
MBCCB Paint Section 100 6 Process Preventive OC
MBCCD Servicing Section 0–100 4 Repair Corrective OC
MBCCS Services Support Section 0–100 4 Repair Corrective OC
MBCEX E-3 Aircraft Production Flight 0–100 4 Repair Corrective OC
MBCEA E-3 Aircraft Section 0–100 4 Repair Corrective OC
MBCEB E-3 Structural Section 0–100 4 Repair Corrective OC
MBCEC E-3 Electrical Section 0–100 4 Repair Corrective OC
MBCEH E-3 Avionics Section 0–100 4 Repair Corrective OC
E-9

Table E-1. Depot-Level Corrosion Profile
CC Work center description Corrosion
percentageDepot
process stepMaintenance
action Corrective or preventive ALC
MBCEI E-3 Idg Section 0–100 4 Repair Corrective OC
MBCEJ E-3 Specialized Section 0–100 4 Repair Corrective OC
MBCEK E-3 Specialized Section 0–100 4 Repair Corrective OC
MBCEL E-3 Specialized Section 0–100 4 Repair Corrective OC
MBCEN E-3 Navy Section 0–100 4 Repair Corrective OC
MBCET E-3 C-130 Section 0–100 4 Repair Corrective OC
MBCEM E-3 Special Workload 0–100 4 Repair Corrective OC
MBCWZ E-3/Services WSSC Flight 0–100 M Process Preventive OC
MBCPZ E-3/Services Planning Section (Supportability & Materiel Mgmt.)
0–100 M Process Preventive OC
MBCSX IDG Planning 0–100 M Process Preventive OC
MBCSZ E-3/Services Scheduling Section (Forward Support)
0–100 M Process Preventive OC
MBFXX Flight Test Branch 40–100 7 Process Preventive OC
MBFXZ Flight Test Section (P) 40–100 7 Process Preventive OC
MBLLX CLSS Aircraft Squadron (P) 40–100 7 Process Preventive OC
MBLLS CLSS Aircraft Squadron (P) 40–100 7 Process Preventive OC
MBPXX Process Control & Improvement Div. 0–100 M Process Preventive OC
MBPEX Facilities Engineering Branch 0–100 M Process Preventive OC
MBPIX Nondestructive Inspection Branch 40–100 1 Process Preventive OC
MBPIA Nondestructive Inspection Branch 40–100 1 Process Preventive OC
MBPPX Production Engineering Branch 0–100 M Process Preventive OC
MBPQX Ground Support Equip (GSE) Branch 0–100 M Process Preventive OC
MBPQB GSE Branch 0–100 M Process Preventive OC
MPBQX Quality Assurance Division 0–100 M Process Preventive OC
MPBAX Tanker Quality Branch 0–100 M Process Preventive OC
MPBBX Bomber/E-3/Services Branch 0–100 M Process Preventive OC
MBWXX Resources Management Division 0–100 M Process Preventive OC
MBWFX (Financial) Analysis Branch 0–100 M Process Preventive OC
MBWOX Operations Branch 0–100 M Process Preventive OC
MBWOZ Operations Section 0–100 M Process Preventive OC
MBWOY Control Center Section 0–100 M Process Preventive OC
MBWOR Control Center Section (P) 0–100 M Process Preventive OC
MBWTZ Training Branch 0–100 M Process Preventive OC
MBMXX Aircraft Support Flight 0–100 M Process Preventive OC
MBMAX Tanker Materiel Supportability Section 0–100 M Process Preventive OC
MBMAX Tanker MS&D Support Element 0–100 M Process Preventive OC
MBMAX Tanker Swing/Grave MS&D Support Element 0–100 M Process Preventive OC
MBMAX Tanker WSSC Stock Control Element 0–100 M Process Preventive OC
E-10

Depot-Level Corrosion Profile
Table E-1. Depot-Level Corrosion Profile
CC Work center description Corrosion
percentageDepot
process stepMaintenance
action Corrective or preventive ALC
MBMBX Bomber Material Supportability Sec. 0–100 M Process Preventive OC
MBMBX Bomber/E-3/Services Swing/Grave MS&D Sup Section
0–100 M Process Preventive OC
MBMBX Bomber MS&D Support Element 0–100 M Process Preventive OC
MBMBX Bomber WSSC Stock Control Element 0–100 M Process Preventive OC
MBMCX E-3 Services Material Supportability Sec. 0–100 M Process Preventive OC
MWGBZ 76 AMXG Medically Restricted 0–100 M Process Preventive OC
MTXXX 76 Commodities Maintenance Group 0–100 M Process Preventive OC
MTAXX Air Accy, Avionic & Electronic Prod. Sqdn 0–100 M Process Preventive OC
MTAAX Air Accessories Flight 0–100 M Process Preventive OC
MTAAP Air Accessories Test Element 0–100 4 Repair Corrective OC
MTAAR Mach, Weld & Inspection Element 0–100 4 Repair Corrective OC
MTAAS Drive Element 0–100 4 Repair Corrective OC
MTAAU Turbine Element 0–100 4 Repair Corrective OC
MTAAV Hydraulic Element 0–100 4 Repair Corrective OC
MTAAJ Cabin Pressure Element 0–100 4 Repair Corrective OC
MTAAM Valve Element 0–100 4 Repair Corrective OC
MTAAN Regulator Element 0–100 4 Repair Corrective OC
MTAAT Miscellaneous Valve Element 0–100 4 Repair Corrective OC
MTAAW Electric Actuator Element 0–100 4 Repair Corrective OC
MTAAF Oxygen Reg. Element 0–100 4 Repair Corrective OC
MTAAF LOX & A-21 Reg. Element 0–100 4 Repair Corrective OC
MTAAE Cruise Missile Element 0–100 4 Repair Corrective OC
MTAEZ Air Accy. Avionics & Elec Production Support Flight
0–100 M Process Preventive OC
MTAPZ Planning Section A 0–100 M Process Preventive OC
MTAPZ Planning Section B 0–100 M Process Preventive OC
MTASZ Scheduling Section 0–100 M Process Preventive OC
MTAQZ Shop Support Center 0–100 M Process Preventive OC
MTAFX Avionics & Electronics Flight 0–100 M Process Preventive OC
MTAFA B-1 LRU Element 0–100 4 Repair Corrective OC
MTAFA B-1 SRU Element 0–100 4 Repair Corrective OC
MTAFE C5 Avionics Element 0–100 4 Repair Corrective OC
MTAFE C130 Avionics Element 0–100 4 Repair Corrective OC
MTAFF Electronic Eng. Control (EEC) Element 0–100 4 Repair Corrective OC
MTAFP Engine Electronics Element 0–100 4 Repair Corrective OC
MTAFS Fighter Avionics Element 0–100 4 Repair Corrective OC
MTAFT Guidance & Control Element 0–100 4 Repair Corrective OC
MTAFU Flight Instruments Element 0–100 4 Repair Corrective OC
E-11

Table E-1. Depot-Level Corrosion Profile
CC Work center description Corrosion
percentageDepot
process stepMaintenance
action Corrective or preventive ALC
MTAFV Planning, Scheduling, Material Element
0–100 4 Repair Corrective OC
MTAFW Pdm Support Element 0–100 4 Repair Corrective OC
MTBXX Sheet Metal & Composite Production Squadron
0–100 4 Repair Corrective OC
MTBBX Sheet Metal Component Flight 0–100 4 Repair Corrective OC
MTBBE Flight Controls Element 1 0–100 4 Repair Corrective OC
MTBBE COWLS & Misc. Element 2 0–100 4 Repair Corrective OC
MTBBE Misc. S/S Element 3 0–100 4 Repair Corrective OC
MTBBD PDM Element 1 0–100 4 Repair Corrective OC
MTBBD MISTR Element 2 0–100 4 Repair Corrective OC
MTBBD Misc. S/S Element 3 0–100 4 Repair Corrective OC
MTBBF Boom Shop Element 1 0–100 4 Repair Corrective OC
MTBBF Boom Shop Element 2 0–100 4 Repair Corrective OC
MTBBF Flight Controls Element 3 0–100 4 Repair Corrective OC
MTBBF Misc. Element 4 0–100 4 Repair Corrective OC
MTBBF Misc. G/S Element 5 0–100 4 Repair Corrective OC
MTBDX Composite & Bomber Sheet Metal Flight 0–100 4 Repair Corrective OC
MTBDS Side COWLS & Misc. Element 1 0–100 4 Repair Corrective OC
MTBDS Nose COWL & Misc Element 2 0–100 4 Repair Corrective OC
MTBDS Sheet Metal Misc. Element 3 0–100 4 Repair Corrective OC
MTBDS Misc. S/S Element 4 0–100 4 Repair Corrective OC
MTBDT Planning, Scheduling, Material Element
0–100 4 Repair Corrective OC
MTBDG Side COWLS & Misc. Element 1 0–100 4 Repair Corrective OC
MTBDG B-1 Struts & Misc Element 2 0–100 4 Repair Corrective OC
MTBDG Flaps & Misc. Element 3 0–100 4 Repair Corrective OC
MTBDG Misc. S/S Element 4 0–100 4 Repair Corrective OC
MTBDH Composite Mfg. & Repair Element 1 0–100 4 Repair Corrective OC
MTBDH Composite Mfg. & Repair Element 2 0–100 4 Repair Corrective OC
MTBDH Composite Mfg. & Repair Element 3 0–100 4 Repair Corrective OC
MTBEZ Sheet Metal & Composites Production Support Flight
0–100 4 Repair Corrective OC
MTBPZ Sheet Metal Planning Section 0–100 4 Repair Corrective OC
MTBTZ B-52 Strut Mod Planning & Eng. Section (P)
0–100 4 Repair Corrective OC
MTBSZ Sheet Metal Scheduling Section 0–100 4 Repair Corrective OC
MTBQZ Shop Support Center 0–100 4 Repair Corrective OC
MTCXX Fuel Accessories & Manufacture Prod. Squadron
0–100 4 Repair Corrective OC
MTCCX Fuel Control, Csd & Bearing Flight 0–100 4 Repair Corrective OC
E-12

Depot-Level Corrosion Profile
Table E-1. Depot-Level Corrosion Profile
CC Work center description Corrosion
percentageDepot
process stepMaintenance
action Corrective or preventive ALC
MTCCA Fuel Control Overhaul Element #1 0–100 4 Repair Corrective OC
MTCCA Fuel Control Overhaul Element #2 0–100 4 Repair Corrective OC
MTCCA Fuel Control Overhaul Element #3 0–100 4 Repair Corrective OC
MTCCR Bearing Element 0–100 4 Repair Corrective OC
MTCCT Fuel Cntrl.Test Element #1 0–100 4 Repair Corrective OC
MTCCT Fuel Cntrl Test Element #2 0–100 4 Repair Corrective OC
MTCCT Fuel Cntrl Test Element #3 0–100 4 Repair Corrective OC
MTCCH Csd O/H Element #1 0–100 4 Repair Corrective OC
MTCCH Csd O/H Element #2 0–100 4 Repair Corrective OC
MTCCH Csd Test Element #3 0–100 4 Repair Corrective OC
MTCCK Wheel & Tire Element 0–100 4 Repair Corrective OC
MTCEZ Fuel Accy. & Manufacture Production Support Flight
0–100 4 Repair Corrective OC
MTMPZ Planning Section A 0–100 M Process Preventive OC
MTMPZ Planning Section B 0–100 M Process Preventive OC
MTCSZ Scheduling Section 0–100 M Process Preventive OC
MTMCZ Shop Support Center 0–100 M Process Preventive OC
MTCFX Fuel Accessories Flight 0–100 M Process Preventive OC
MTCFA Governor & Accessories Element #1 0–100 4 Repair Corrective OC
MTCFA Governor & Accessories Element #2 0–100 4 Repair Corrective OC
MTCFA Elec. Pump & Accessories Element #3 0–100 4 Repair Corrective OC
MTCFB Electrical Accessories Element #1 0–100 4 Repair Corrective OC
MTCFB Elect Accy/Fuel Flow Element #2 0–100 4 Repair Corrective OC
MTCFB Accessories Element #3 0–100 4 Repair Corrective OC
MTCFT Fuel Accy. Test Element #1 0–100 4 Repair Corrective OC
MTCFT Fuel Accy. Test Element #2 0–100 4 Repair Corrective OC
MTCMX Manufacture & Repair Flight 0–100 4 Repair Corrective OC
MTCME Cable Repair Element 0–100 4 Repair Corrective OC
MTCME Cable Mfg. Element 0–100 4 Repair Corrective OC
MTCMG Rubber Element 0–100 4 Repair Corrective OC
MTCML Fabric Element 0–100 4 Repair Corrective OC
MTCMD Gen. Machining Element 0–100 4 Repair Corrective OC
MTCMD Grinding Element 0–100 4 Repair Corrective OC
MTCMM Tooling & Modification Element 0–100 4 Repair Corrective OC
MTCMK Planning, Scheduling, Material Element 0–100 4 Repair Corrective OC
MTCMN Numerical Control Mfg. & Repair Element 0–100 4 Repair Corrective OC
MTCMA Sheetmetal Mfg.& Repair Element 0–100 4 Repair Corrective OC
MTCMH B-52 Strut Mod Element (P) 0–100 4 Repair Corrective OC
MTCMC Tube & Cable Element 0–100 4 Repair Corrective OC
E-13

Table E-1. Depot-Level Corrosion Profile
CC Work center description Corrosion
percentageDepot
process stepMaintenance
action Corrective or preventive ALC
MTCMT Tank & Cooler Element 0–100 4 Repair Corrective OC
MTCMW Welding Element 0–100 4 Repair Corrective OC
MTPXX Process Control & Improvement Div. 0–100 M Process Preventive OC
MTPAZ Air Accy/Avionic/Elec Production Eng Branch
0–100 4 Repair Corrective OC
MTPBZ Sheetmetal & Composite Production Engineering Branch
0–100 4 Repair Corrective OC
MTPTZ B-52 Strut Mod Production Engineering Branch (P)
0–100 4 Repair Corrective OC
MTPOZ Engineering Branch 0–100 4 Repair Corrective OC
MTPMZ Fuel Accy & Mfg Production Engineering Branch
0–100 M Process Preventive OC
MPNQX Commodities Quality Assurance Div. 0–100 M Process Preventive OC
MPNAX Management Systems Branch 0–100 M Process Preventive OC
MPNBX Quality Deficiency Support Point Branch 0–100 M Process Preventive OC
MTWXX Resources Management Division 0–100 M Process Preventive OC
MTWFZ Financial & Analysis Branch 0–100 M Process Preventive OC
MTWOZ Operations Branch 0–100 M Process Preventive OC
MTAQZ Commodities Support Flight 0–100 M Process Preventive OC
MTAQZ Air Accessories/Aircraft Structure Supply Support Section
0–100 M Process Preventive OC
MTAQZ Air Accessories Material Support Element A
0–100 M Process Preventive OC
MTAQZ Air Accessories Material Support Element B
0–100 M Process Preventive OC
MTBQZ Aircraft Structures Material Support Element C
0–100 M Process Preventive OC
MTMQZ Fuel Accessories/Manufacture & Repair Supply Support Section
0–100 M Process Preventive OC
MTMQZ Fuel Accessory Supply Support Element A
0–100 M Process Preventive OC
MTMQZ Manufacture & Repair Supply Support Element B
0–100 M Process Preventive OC
MTAQZ Avionics/Electronics Supply Support Sec. 0–100 M Process Preventive OC
MWGTZ 76 Cmxg Medically Restricted 0–100 M Process Preventive OC
MGXXX 76 Maintenance Support Group 0–100 M Process Preventive OC
MDXXX Industrial Services Squadron 0–100 M Process Preventive OC
MDEXX Infrastructure Planning & Engineering Flight
0–100 M Process Preventive OC
MDEEX Facility Engineering Design Flight 0–100 M Process Preventive OC
MDEHX Equipment Engineering Flight 0–100 M Process Preventive OC
MDPXX Plant Management Flight 0–100 M Process Preventive OC
MDDXX Installation Section 0–100 M Process Preventive OC
E-14
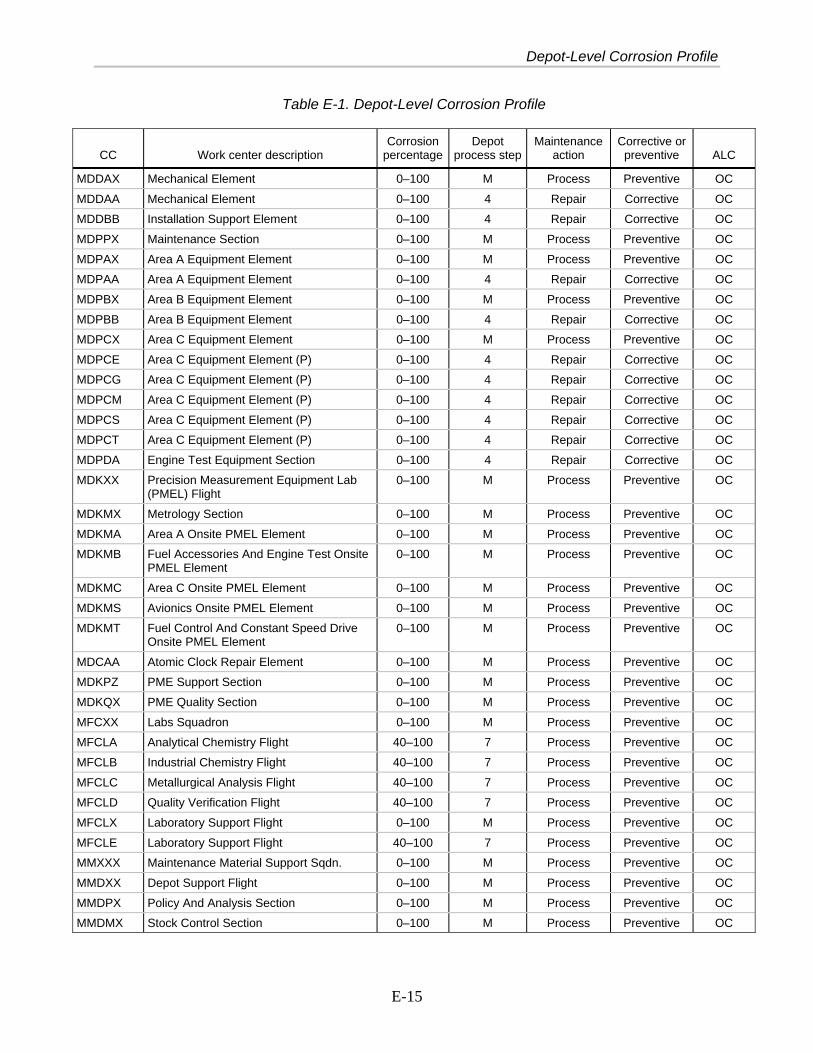
Depot-Level Corrosion Profile
Table E-1. Depot-Level Corrosion Profile
CC Work center description Corrosion
percentageDepot
process stepMaintenance
action Corrective or preventive ALC
MDDAX Mechanical Element 0–100 M Process Preventive OC
MDDAA Mechanical Element 0–100 4 Repair Corrective OC
MDDBB Installation Support Element 0–100 4 Repair Corrective OC
MDPPX Maintenance Section 0–100 M Process Preventive OC
MDPAX Area A Equipment Element 0–100 M Process Preventive OC
MDPAA Area A Equipment Element 0–100 4 Repair Corrective OC
MDPBX Area B Equipment Element 0–100 M Process Preventive OC
MDPBB Area B Equipment Element 0–100 4 Repair Corrective OC
MDPCX Area C Equipment Element 0–100 M Process Preventive OC
MDPCE Area C Equipment Element (P) 0–100 4 Repair Corrective OC
MDPCG Area C Equipment Element (P) 0–100 4 Repair Corrective OC
MDPCM Area C Equipment Element (P) 0–100 4 Repair Corrective OC
MDPCS Area C Equipment Element (P) 0–100 4 Repair Corrective OC
MDPCT Area C Equipment Element (P) 0–100 4 Repair Corrective OC
MDPDA Engine Test Equipment Section 0–100 4 Repair Corrective OC
MDKXX Precision Measurement Equipment Lab (PMEL) Flight
0–100 M Process Preventive OC
MDKMX Metrology Section 0–100 M Process Preventive OC
MDKMA Area A Onsite PMEL Element 0–100 M Process Preventive OC
MDKMB Fuel Accessories And Engine Test Onsite PMEL Element
0–100 M Process Preventive OC
MDKMC Area C Onsite PMEL Element 0–100 M Process Preventive OC
MDKMS Avionics Onsite PMEL Element 0–100 M Process Preventive OC
MDKMT Fuel Control And Constant Speed Drive Onsite PMEL Element
0–100 M Process Preventive OC
MDCAA Atomic Clock Repair Element 0–100 M Process Preventive OC
MDKPZ PME Support Section 0–100 M Process Preventive OC
MDKQX PME Quality Section 0–100 M Process Preventive OC
MFCXX Labs Squadron 0–100 M Process Preventive OC
MFCLA Analytical Chemistry Flight 40–100 7 Process Preventive OC
MFCLB Industrial Chemistry Flight 40–100 7 Process Preventive OC
MFCLC Metallurgical Analysis Flight 40–100 7 Process Preventive OC
MFCLD Quality Verification Flight 40–100 7 Process Preventive OC
MFCLX Laboratory Support Flight 0–100 M Process Preventive OC
MFCLE Laboratory Support Flight 40–100 7 Process Preventive OC
MMXXX Maintenance Material Support Sqdn. 0–100 M Process Preventive OC
MMDXX Depot Support Flight 0–100 M Process Preventive OC
MMDPX Policy And Analysis Section 0–100 M Process Preventive OC
MMDMX Stock Control Section 0–100 M Process Preventive OC
E-15

Table E-1. Depot-Level Corrosion Profile
CC Work center description Corrosion
percentageDepot
process stepMaintenance
action Corrective or preventive ALC
MMDLX Levels Maintenance, Local Purchase/ Mfg & Research Element
0–100 M Process Preventive OC
MMDSX Stock Control Element 0–100 M Process Preventive OC
MBMXX Aircraft Support Flight 0–100 M Process Preventive OC
MBMAX 135 Materiel Supportability Section 0–100 M Process Preventive OC
MBMAX 135 MS&D Support Element 0–100 M Process Preventive OC
MBMAX 135 Swing/Grave MS&D Support Element
0–100 M Process Preventive OC
MBMAX 135 WSSC Stock Control Element 0–100 M Process Preventive OC
MBMBX Bomber Material Supportability Section 0–100 M Process Preventive OC
MBMBX Bomber/E-3/Services Swing/Grave MS&D Sup Section
0–100 M Process Preventive OC
MBMBX Bomber MS&D Support Element 0–100 M Process Preventive OC
MBMBX Bomber WSSC Stock Control Element 0–100 M Process Preventive OC
MBMCX E-3 Services Material Supportability Section
0–100 M Process Preventive OC
MWEDZ Propulsion Support Flight 0–100 M Process Preventive OC
MWEAZ Tf 33 Engine Support Section 0–100 M Process Preventive OC
MWEAZ Tf 33 P7/P100 & Qec (Engine) Support Element
0–100 M Process Preventive OC
MWEAZ Tf 33 P102/P103 & Rotor (Engine) Support Element
0–100 M Process Preventive OC
MWEGZ Ge & Tf 30 Engine Support Section 0–100 M Process Preventive OC
MWEGZ F Series/TF 30 & Blade Support Element 0–100 M Process Preventive OC
MWEGZ GE & TF 30 Rotor Support Element 0–100 M Process Preventive OC
MWEKZ F100 & Engine Test Support Section 0–100 M Process Preventive OC
MEKAZ F100 Inlet Fan/Drive Section Overhead Supply Cell Element
0–100 M Process Preventive OC
MEKAA F100 Inlet Fan/Drive Section Direct Sup-ply Cell Element
0–100 4 Repair Corrective OC
MEKBZ F100 Core Section Overhead Supply Cell Element
0–100 M Process Preventive OC
MEKBA F100 Core Section Direct Supply Cell Element
0–100 4 Repair Corrective OC
MEKCZ F100-229 Section Overhead Supply Cell Element
0–100 M Process Preventive OC
MEKCA F100-229 Section Direct Supply Cell Element
0–100 4 Repair Corrective OC
MEKDZ F100 Engine Section Overhead Supply Cell Element
0–100 M Process Preventive OC
MEKDA F100 Engine Section Direct Supply Cell Element
0–100 4 Repair Corrective OC
MWEKZ F100 & Engine Test Support Element 0–100 M Process Preventive OC
E-16

Depot-Level Corrosion Profile
Table E-1. Depot-Level Corrosion Profile
CC Work center description Corrosion
percentageDepot
process stepMaintenance
action Corrective or preventive ALC
MWEKZ F100 Rotor Support Element 0–100 M Process Preventive OC
MWESZ Machine/Weld/Process/MS&D Support Section
0–100 M Process Preventive OC
MWESZ Storage/Machine & Weld Support Element 0–100 M Process Preventive OC
MWESZ Distribution & Process Support Element
0–100 M Process Preventive OC
MTAQZ Commodities Support Flight 0–100 M Process Preventive OC
MTAQZ Air Accessories/Aircraft Structure Supply Supt Section
0–100 M Process Preventive OC
MTAQZ Air Accessories Material Support Element A
0–100 M Process Preventive OC
MTAQZ Air Accessories Material Support Element B
0–100 M Process Preventive OC
MTBQZ Aircraft Structures Material Support Element C
0–100 M Process Preventive OC
MTMQZ Fuel Accessories/Manufacture & Repair Supply Support Section
0–100 M Process Preventive OC
MTMQZ Fuel Accessory Supply Support Element A
0–100 M Process Preventive OC
MTMQZ Manufacture & Repair Supply Support Element B
0–100 M Process Preventive OC
MTAQZ Avionics/Electronics Supply Support Section
0–100 M Process Preventive OC
MGPXX Quality Assurance/Process Improvement Division
0–100 M Process Preventive OC
MGPAX Operations Branch 0–100 M Process Preventive OC
MGPBX Quality Branch 0–100 M Process Preventive OC
MGPCX Tool Services Branch 0–100 M Process Preventive OC
MDWTX Central Tool Section 0–100 M Process Preventive OC
MGPDX Forward Tool Section 0–100 M Process Preventive OC
MGPEX Aircraft Element 0–100 M Process Preventive OC
MGPGX Commodities Element 0–100 M Process Preventive OC
MGPHX Propulsion Element 0–100 M Process Preventive OC
MDWXX Resources Management Division 0–100 M Process Preventive OC
MDWFX Financial Management Branch 0–100 M Process Preventive OC
MDWRX Operations Branch 0–100 M Process Preventive OC
MDWMX Material Management Branch 0–100 M Process Preventive OC
MDWPX Planning And Scheduling Branch 0–100 M Process Preventive OC
MDWSX Contract Support 0–100 M Process Preventive OC
MWGDZ 76 Mxsg Medically Restricted 0–100 M Process Preventive OC
MEXXX 76 Propulsion Maintenance Group 0–100 M Process Preventive OC
MEPXX 544 Propulsion Maintenance Sqdn. (F100) 0–100 M Process Preventive OC
E-17

Table E-1. Depot-Level Corrosion Profile
CC Work center description Corrosion
percentageDepot
process stepMaintenance
action Corrective or preventive ALC
MEPXX 545 Propulsion Maintenance Sqdn. (TF33) 0–100 M Process Preventive OC
MEPXX 546 Propulsion Maintenance Sqdn. (GE) 0–100 M Process Preventive OC
MEPXX 547 Propulsion Maintenance Sqdn. (Engine Rep/Dev)
0–100 M Process Preventive OC
MEPXX 548 Propulsion Maintenance Sqdn. (Spec Srvcs)
0–100 M Process Preventive OC
MEPKX F100 Engine Flight (544) 0–100 M Process Preventive OC
MEKXX F100 Engine Flight (544) 0–100 M Process Preventive OC
MEKDX F100 Engine Section 0–100 M Process Preventive OC
MEPKA F100 Engine Section 0–100 4 Repair Corrective OC
MEKIX F100 Engine Section Overhead Support Cell Element
0–100 M Process Preventive OC
MEKDB F100 Engine Section Direct Support Cell Element
0–100 4 Repair Corrective OC
MEKJX F100 Central Logistics Overhead Cell Element
0–100 M Process Preventive OC
MEKDC F100 Central Logistics Direct Cell Element 0–100 4 Repair Corrective OC
MEKDD F100 Gearbox Cell Element 0–100 4 Repair Corrective OC
MEKDE F100 PLS Cell Element 0–100 4 Repair Corrective OC
MEKDF F100 Repair Cell Element 0–100 4 Repair Corrective OC
MEKDG F100 Assy/Dissy Cell Element 0–100 4 Repair Corrective OC
MEKDH F100 Nozzle #2 Cell Element 0–100 4 Repair Corrective OC
MEKDI F100 Nozzle #1 Cell Element 0–100 4 Repair Corrective OC
MEKBX F100 Core Section 0–100 M Process Preventive OC
MEPKB F100 Core Section (Core Module) 0–100 4 Repair Corrective OC
MEPKC F100 Core Section (Subassembly) (P) 0–100 4 Repair Corrective OC
MEPKE F100 Core Section (Turbine Rotor) (P) 0–100 4 Repair Corrective OC
MEPKF F100 Core Section (Compressor Rotor) (P) 0–100 4 Repair Corrective OC
MEKGX F100 Core Section Overhead Support Cell Element
0–100 M Process Preventive OC
MEKBB F100 Core Section Direct Support Cell Element
0–100 4 Repair Corrective OC
MEKBC F100 Bearing Housings & Seals Cell Element
0–100 4 Repair Corrective OC
MEKBD F100 Compressor Repair Cell Element 0–100 4 Repair Corrective OC
MEKBE F100 Compressor Disks & Airseals Cell Element
0–100 4 Repair Corrective OC
MEKBF F100 Core Assy/Dissy Cell Element 0–100 4 Repair Corrective OC
MEKBG F100 HPT Cell Element 0–100 4 Repair Corrective OC
MEKBH F100 Compressor Cell Element 0–100 4 Repair Corrective OC
MEKBI F100 Intermediate Case Cell Element 0–100 4 Repair Corrective OC
MEKBJ F100 Diffuser Cell Element 0–100 4 Repair Corrective OC
E-18
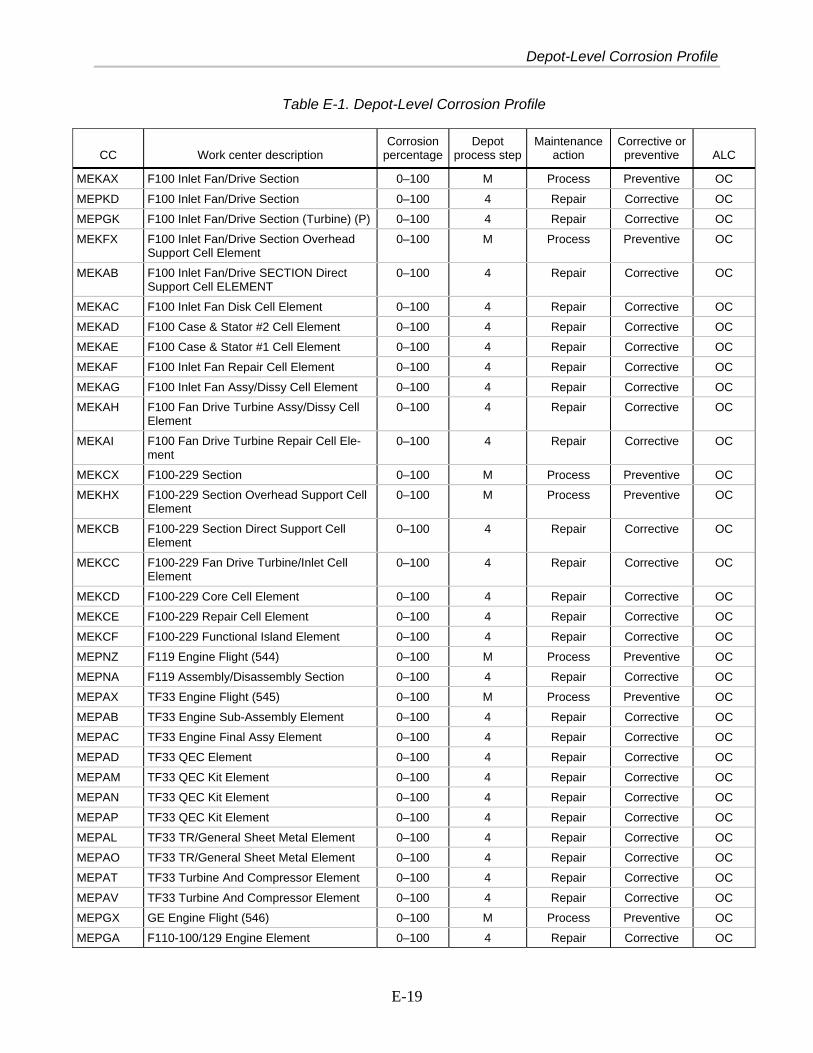
Depot-Level Corrosion Profile
Table E-1. Depot-Level Corrosion Profile
CC Work center description Corrosion
percentageDepot
process stepMaintenance
action Corrective or preventive ALC
MEKAX F100 Inlet Fan/Drive Section 0–100 M Process Preventive OC
MEPKD F100 Inlet Fan/Drive Section 0–100 4 Repair Corrective OC
MEPGK F100 Inlet Fan/Drive Section (Turbine) (P) 0–100 4 Repair Corrective OC
MEKFX F100 Inlet Fan/Drive Section Overhead Support Cell Element
0–100 M Process Preventive OC
MEKAB F100 Inlet Fan/Drive SECTION Direct Support Cell ELEMENT
0–100 4 Repair Corrective OC
MEKAC F100 Inlet Fan Disk Cell Element 0–100 4 Repair Corrective OC
MEKAD F100 Case & Stator #2 Cell Element 0–100 4 Repair Corrective OC
MEKAE F100 Case & Stator #1 Cell Element 0–100 4 Repair Corrective OC
MEKAF F100 Inlet Fan Repair Cell Element 0–100 4 Repair Corrective OC
MEKAG F100 Inlet Fan Assy/Dissy Cell Element 0–100 4 Repair Corrective OC
MEKAH F100 Fan Drive Turbine Assy/Dissy Cell Element
0–100 4 Repair Corrective OC
MEKAI F100 Fan Drive Turbine Repair Cell Ele-ment
0–100 4 Repair Corrective OC
MEKCX F100-229 Section 0–100 M Process Preventive OC
MEKHX F100-229 Section Overhead Support Cell Element
0–100 M Process Preventive OC
MEKCB F100-229 Section Direct Support Cell Element
0–100 4 Repair Corrective OC
MEKCC F100-229 Fan Drive Turbine/Inlet Cell Element
0–100 4 Repair Corrective OC
MEKCD F100-229 Core Cell Element 0–100 4 Repair Corrective OC
MEKCE F100-229 Repair Cell Element 0–100 4 Repair Corrective OC
MEKCF F100-229 Functional Island Element 0–100 4 Repair Corrective OC
MEPNZ F119 Engine Flight (544) 0–100 M Process Preventive OC
MEPNA F119 Assembly/Disassembly Section 0–100 4 Repair Corrective OC
MEPAX TF33 Engine Flight (545) 0–100 M Process Preventive OC
MEPAB TF33 Engine Sub-Assembly Element 0–100 4 Repair Corrective OC
MEPAC TF33 Engine Final Assy Element 0–100 4 Repair Corrective OC
MEPAD TF33 QEC Element 0–100 4 Repair Corrective OC
MEPAM TF33 QEC Kit Element 0–100 4 Repair Corrective OC
MEPAN TF33 QEC Kit Element 0–100 4 Repair Corrective OC
MEPAP TF33 QEC Kit Element 0–100 4 Repair Corrective OC
MEPAL TF33 TR/General Sheet Metal Element 0–100 4 Repair Corrective OC
MEPAO TF33 TR/General Sheet Metal Element 0–100 4 Repair Corrective OC
MEPAT TF33 Turbine And Compressor Element 0–100 4 Repair Corrective OC
MEPAV TF33 Turbine And Compressor Element 0–100 4 Repair Corrective OC
MEPGX GE Engine Flight (546) 0–100 M Process Preventive OC
MEPGA F110-100/129 Engine Element 0–100 4 Repair Corrective OC
E-19

Table E-1. Depot-Level Corrosion Profile
CC Work center description Corrosion
percentageDepot
process stepMaintenance
action Corrective or preventive ALC
MEPGB F101/F118 Engine Element 0–100 4 Repair Corrective OC
MEPGD F101/F118 Engine Element 0–100 4 Repair Corrective OC
MEPGC F108 Element 0–100 4 Repair Corrective OC
MEPGL GE/F100 Augmentor Exhaust Nozzle Element
0–100 4 Repair Corrective OC
MEPGM GE/F100 Augmentor Exhaust Nozzle Element
0–100 4 Repair Corrective OC
MEPGE GE Fan/LPT Element 0–100 4 Repair Corrective OC
MEPGF GE Non-Rotating Element 0–100 4 Repair Corrective OC
MEPGG LPT/HPT Element 0–100 4 Repair Corrective OC
MEPGJ LPT/HPT Element 0–100 4 Repair Corrective OC
MEPGN LPT/HPT Element 0–100 4 Repair Corrective OC
MEERX Production Support Tooling/Prototype Repair Flight (547)
0–100 M Process Preventive OC
MEPGH Production Support Tooling/Prototype Repair Flight (547)
0–100 4 Repair Corrective OC
MEERA Tool Repair/Manufacturing Support Sec. 0–100 4 Repair Corrective OC
MEERA Strategic Support Element 0–100 4 Repair Corrective OC
MEERB Prototype Manufacturing Support Section 0–100 4 Repair Corrective OC
METXX Propulsion Business Flight (547) 0–100 M Process Preventive OC
MEPBX Blade Repair Flight (548) 0–100 M Process Preventive OC
MEPBB Plasma/HT Element 0–100 4 Repair Corrective OC
MEPBJ Plasma/HT Element 0–100 4 Repair Corrective OC
MEPBC Machine/Weld Element 0–100 4 Repair Corrective OC
MEPBA Machine/Weld Element 0–100 4 Repair Corrective OC
MEPBD Paint, Clean, Blast Element 100 6 Process Preventive OC
MEPBH Paint, Clean, Blast Element 100 6 Process Preventive OC
MEPBE Paint, Clean, Blast Element 100 6 Process Preventive OC
MEPBF Inspect/Ndi Element 40–100 1 Process Preventive OC
MEPBF Inspect/Visual Element 40–100 1 Process Preventive OC
MEPBG Rework Element 0–100 4 Repair Corrective OC
MEPTX Engine Test Flight (548) 40–100 7 Process Preventive OC
MEPTD Engine Test Element (A) 40–100 7 Process Preventive OC
MEPTD Engine Test Element (B) 40–100 7 Process Preventive OC
MEPTR Engine Verification Element (P&W) 40–100 7 Process Preventive OC
MEPTR Engine Verification Element (GE) 40–100 7 Process Preventive OC
MEPTT Engine Verification Element (TDR) 40–100 7 Process Preventive OC
MEPTG Engine Verification Element (TDR) 40–100 7 Process Preventive OC
MEPTE Engine Verification Element (TDR) 40–100 7 Process Preventive OC
MEPCX Special Processes Flight (548) 40–100 7 Process Preventive OC
E-20
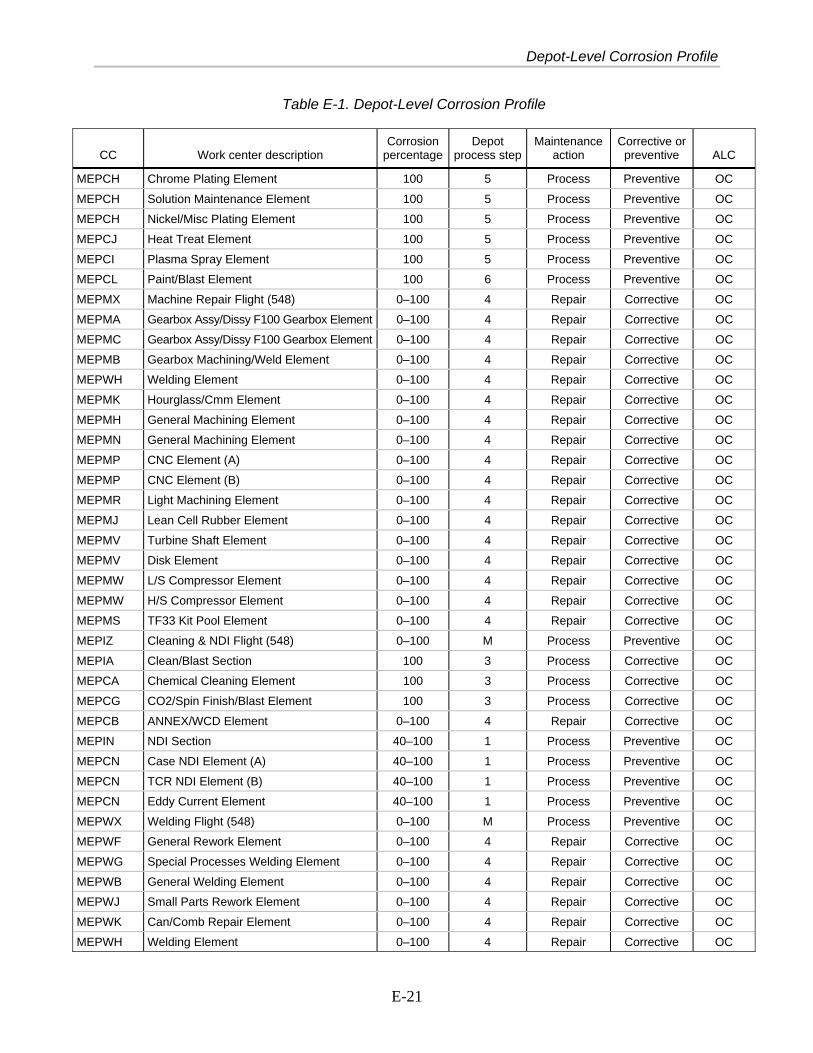
Depot-Level Corrosion Profile
Table E-1. Depot-Level Corrosion Profile
CC Work center description Corrosion
percentageDepot
process stepMaintenance
action Corrective or preventive ALC
MEPCH Chrome Plating Element 100 5 Process Preventive OC
MEPCH Solution Maintenance Element 100 5 Process Preventive OC
MEPCH Nickel/Misc Plating Element 100 5 Process Preventive OC
MEPCJ Heat Treat Element 100 5 Process Preventive OC
MEPCI Plasma Spray Element 100 5 Process Preventive OC
MEPCL Paint/Blast Element 100 6 Process Preventive OC
MEPMX Machine Repair Flight (548) 0–100 4 Repair Corrective OC
MEPMA Gearbox Assy/Dissy F100 Gearbox Element 0–100 4 Repair Corrective OC
MEPMC Gearbox Assy/Dissy F100 Gearbox Element 0–100 4 Repair Corrective OC
MEPMB Gearbox Machining/Weld Element 0–100 4 Repair Corrective OC
MEPWH Welding Element 0–100 4 Repair Corrective OC
MEPMK Hourglass/Cmm Element 0–100 4 Repair Corrective OC
MEPMH General Machining Element 0–100 4 Repair Corrective OC
MEPMN General Machining Element 0–100 4 Repair Corrective OC
MEPMP CNC Element (A) 0–100 4 Repair Corrective OC
MEPMP CNC Element (B) 0–100 4 Repair Corrective OC
MEPMR Light Machining Element 0–100 4 Repair Corrective OC
MEPMJ Lean Cell Rubber Element 0–100 4 Repair Corrective OC
MEPMV Turbine Shaft Element 0–100 4 Repair Corrective OC
MEPMV Disk Element 0–100 4 Repair Corrective OC
MEPMW L/S Compressor Element 0–100 4 Repair Corrective OC
MEPMW H/S Compressor Element 0–100 4 Repair Corrective OC
MEPMS TF33 Kit Pool Element 0–100 4 Repair Corrective OC
MEPIZ Cleaning & NDI Flight (548) 0–100 M Process Preventive OC
MEPIA Clean/Blast Section 100 3 Process Corrective OC
MEPCA Chemical Cleaning Element 100 3 Process Corrective OC
MEPCG CO2/Spin Finish/Blast Element 100 3 Process Corrective OC
MEPCB ANNEX/WCD Element 0–100 4 Repair Corrective OC
MEPIN NDI Section 40–100 1 Process Preventive OC
MEPCN Case NDI Element (A) 40–100 1 Process Preventive OC
MEPCN TCR NDI Element (B) 40–100 1 Process Preventive OC
MEPCN Eddy Current Element 40–100 1 Process Preventive OC
MEPWX Welding Flight (548) 0–100 M Process Preventive OC
MEPWF General Rework Element 0–100 4 Repair Corrective OC
MEPWG Special Processes Welding Element 0–100 4 Repair Corrective OC
MEPWB General Welding Element 0–100 4 Repair Corrective OC
MEPWJ Small Parts Rework Element 0–100 4 Repair Corrective OC
MEPWK Can/Comb Repair Element 0–100 4 Repair Corrective OC
MEPWH Welding Element 0–100 4 Repair Corrective OC
E-21

Table E-1. Depot-Level Corrosion Profile
CC Work center description Corrosion
percentageDepot
process stepMaintenance
action Corrective or preventive ALC
MEPMG Can/Seal Repair Element 0–100 4 Repair Corrective OC
MEPME Seal Shop Element 0–100 4 Repair Corrective OC
MEPWE Augmentor Element 1 0–100 4 Repair Corrective OC
MEPWE Augmentor Element 2 0–100 4 Repair Corrective OC
MEPWE Augmentor Welding Element 0–100 4 Repair Corrective OC
MEEXX Process Control & Improvement Div. 0–100 M Process Preventive OC
MEEBZ Process/Facility Engineering Branch 0–100 M Process Preventive OC
MEEMZ Engineering Material/Test Branch 0–100 M Process Preventive OC
MEEPZ Production Engineering Branch 0–100 M Process Preventive OC
MEAXX Engine Transformation Office 0–100 M Process Preventive OC
MPEQX Engine Quality Assurance Division 0–100 M Process Preventive OC
MPEIX Quality Systems Assurance Branch 0–100 M Process Preventive OC
MPESX Quality Management Support Branch 0–100 M Process Preventive OC
MEWXX Resources Management Division 0–100 M Process Preventive OC
MEWAX Cost & Analysis Branch 0–100 M Process Preventive OC
MEWBX Industrial Support Branch 0–100 M Process Preventive OC
MESXX Scheduling Branch 0–100 M Process Preventive OC
MEWCX Scheduling Branch 0–100 M Process Preventive OC
MEPTF Scheduling Branch 0–100 M Process Preventive OC
MESBZ P & W Section 0–100 M Process Preventive OC
MESCZ GE Section 0–100 M Process Preventive OC
MESDZ F100 Section 0–100 M Process Preventive OC
MESEA Engine Records Section 0–100 M Process Preventive OC
MESER Engine Records Section 0–100 M Process Preventive OC
MEERZ Planning Branch 0–100 M Process Preventive OC
MEECZ GE Repair Development Section 0–100 M Process Preventive OC
MEEDZ F Series Planning Section 0–100 M Process Preventive OC
MEEFZ TF30/TF33 Engine Planning Section 0–100 M Process Preventive OC
MEEGZ PWA Repair Development Section 0–100 M Process Preventive OC
MEEHZ F100 Planning Section 0–100 M Process Preventive OC
MEEIZ F100 Engine Planning Section 0–100 M Process Preventive OC
MWEDZ Propulsion Support Flight 0–100 M Process Preventive OC
MWEAZ TF 33 Engine Support Section 0–100 M Process Preventive OC
MWEAZ TF 33 P7/P100 & QEC (Engine) Support Element
0–100 M Process Preventive OC
MWEAZ TF 33 P102/P103 & Rotor (Engine) Support Element
0–100 M Process Preventive OC
MWEGZ GE & TF 30 Engine Support Section 0–100 M Process Preventive OC
MWEGZ F Series/TF 30 & Blade Support Element 0–100 M Process Preventive OC
E-22
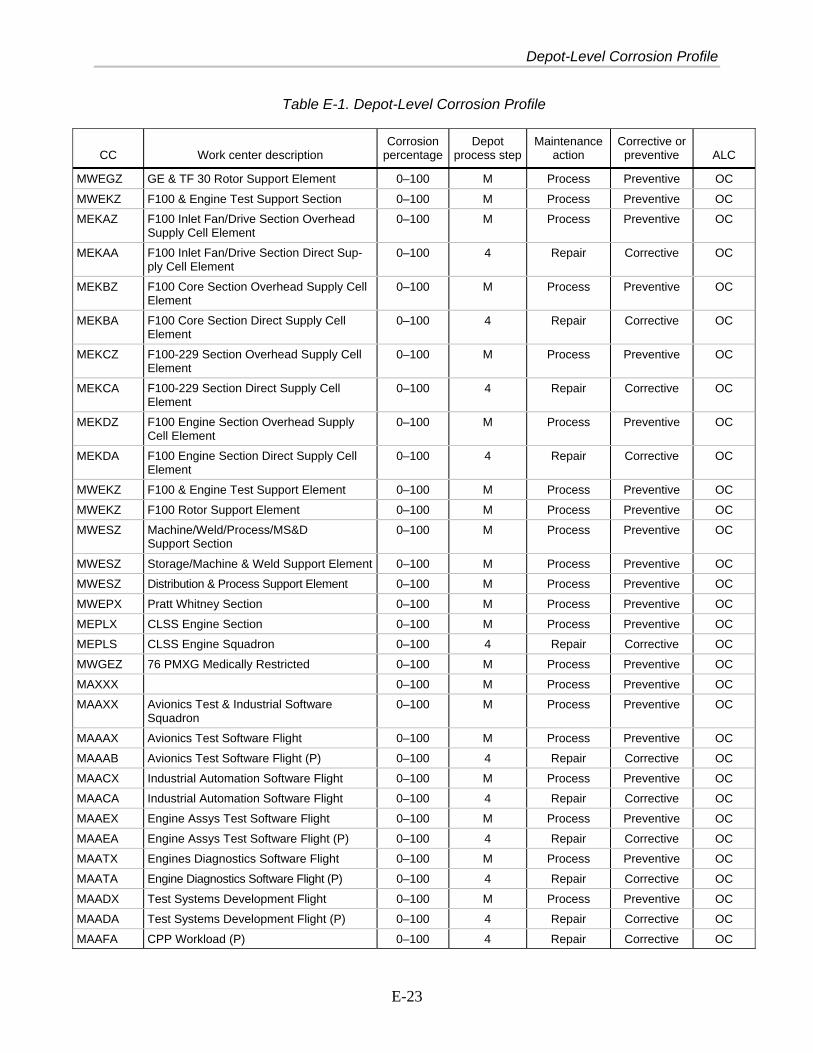
Depot-Level Corrosion Profile
Table E-1. Depot-Level Corrosion Profile
CC Work center description Corrosion
percentageDepot
process stepMaintenance
action Corrective or preventive ALC
MWEGZ GE & TF 30 Rotor Support Element 0–100 M Process Preventive OC
MWEKZ F100 & Engine Test Support Section 0–100 M Process Preventive OC
MEKAZ F100 Inlet Fan/Drive Section Overhead Supply Cell Element
0–100 M Process Preventive OC
MEKAA F100 Inlet Fan/Drive Section Direct Sup-ply Cell Element
0–100 4 Repair Corrective OC
MEKBZ F100 Core Section Overhead Supply Cell Element
0–100 M Process Preventive OC
MEKBA F100 Core Section Direct Supply Cell Element
0–100 4 Repair Corrective OC
MEKCZ F100-229 Section Overhead Supply Cell Element
0–100 M Process Preventive OC
MEKCA F100-229 Section Direct Supply Cell Element
0–100 4 Repair Corrective OC
MEKDZ F100 Engine Section Overhead Supply Cell Element
0–100 M Process Preventive OC
MEKDA F100 Engine Section Direct Supply Cell Element
0–100 4 Repair Corrective OC
MWEKZ F100 & Engine Test Support Element 0–100 M Process Preventive OC
MWEKZ F100 Rotor Support Element 0–100 M Process Preventive OC
MWESZ Machine/Weld/Process/MS&D Support Section
0–100 M Process Preventive OC
MWESZ Storage/Machine & Weld Support Element 0–100 M Process Preventive OC
MWESZ Distribution & Process Support Element 0–100 M Process Preventive OC
MWEPX Pratt Whitney Section 0–100 M Process Preventive OC
MEPLX CLSS Engine Section 0–100 M Process Preventive OC
MEPLS CLSS Engine Squadron 0–100 4 Repair Corrective OC
MWGEZ 76 PMXG Medically Restricted 0–100 M Process Preventive OC
MAXXX 0–100 M Process Preventive OC
MAAXX Avionics Test & Industrial Software Squadron
0–100 M Process Preventive OC
MAAAX Avionics Test Software Flight 0–100 M Process Preventive OC
MAAAB Avionics Test Software Flight (P) 0–100 4 Repair Corrective OC
MAACX Industrial Automation Software Flight 0–100 M Process Preventive OC
MAACA Industrial Automation Software Flight 0–100 4 Repair Corrective OC
MAAEX Engine Assys Test Software Flight 0–100 M Process Preventive OC
MAAEA Engine Assys Test Software Flight (P) 0–100 4 Repair Corrective OC
MAATX Engines Diagnostics Software Flight 0–100 M Process Preventive OC
MAATA Engine Diagnostics Software Flight (P) 0–100 4 Repair Corrective OC
MAADX Test Systems Development Flight 0–100 M Process Preventive OC
MAADA Test Systems Development Flight (P) 0–100 4 Repair Corrective OC
MAAFA CPP Workload (P) 0–100 4 Repair Corrective OC
E-23
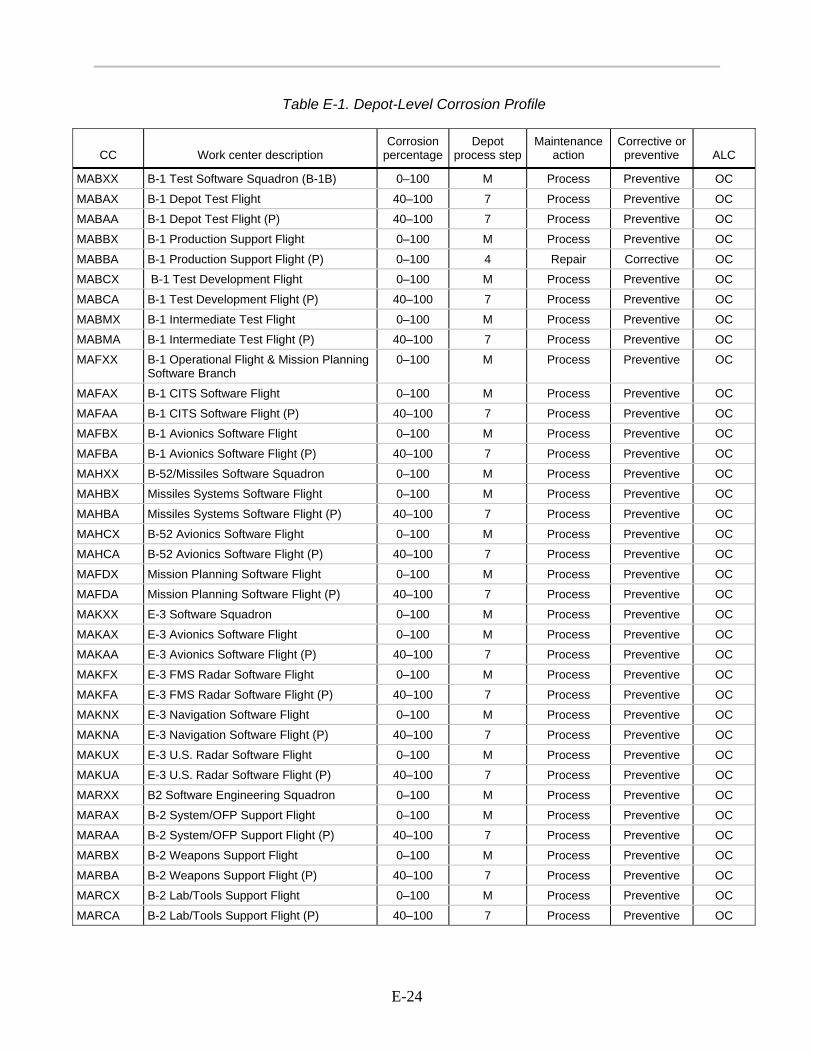
Table E-1. Depot-Level Corrosion Profile
CC Work center description Corrosion
percentageDepot
process stepMaintenance
action Corrective or preventive ALC
MABXX B-1 Test Software Squadron (B-1B) 0–100 M Process Preventive OC
MABAX B-1 Depot Test Flight 40–100 7 Process Preventive OC
MABAA B-1 Depot Test Flight (P) 40–100 7 Process Preventive OC
MABBX B-1 Production Support Flight 0–100 M Process Preventive OC
MABBA B-1 Production Support Flight (P) 0–100 4 Repair Corrective OC
MABCX B-1 Test Development Flight 0–100 M Process Preventive OC
MABCA B-1 Test Development Flight (P) 40–100 7 Process Preventive OC
MABMX B-1 Intermediate Test Flight 0–100 M Process Preventive OC
MABMA B-1 Intermediate Test Flight (P) 40–100 7 Process Preventive OC
MAFXX B-1 Operational Flight & Mission Planning Software Branch
0–100 M Process Preventive OC
MAFAX B-1 CITS Software Flight 0–100 M Process Preventive OC
MAFAA B-1 CITS Software Flight (P) 40–100 7 Process Preventive OC
MAFBX B-1 Avionics Software Flight 0–100 M Process Preventive OC
MAFBA B-1 Avionics Software Flight (P) 40–100 7 Process Preventive OC
MAHXX B-52/Missiles Software Squadron 0–100 M Process Preventive OC
MAHBX Missiles Systems Software Flight 0–100 M Process Preventive OC
MAHBA Missiles Systems Software Flight (P) 40–100 7 Process Preventive OC
MAHCX B-52 Avionics Software Flight 0–100 M Process Preventive OC
MAHCA B-52 Avionics Software Flight (P) 40–100 7 Process Preventive OC
MAFDX Mission Planning Software Flight 0–100 M Process Preventive OC
MAFDA Mission Planning Software Flight (P) 40–100 7 Process Preventive OC
MAKXX E-3 Software Squadron 0–100 M Process Preventive OC
MAKAX E-3 Avionics Software Flight 0–100 M Process Preventive OC
MAKAA E-3 Avionics Software Flight (P) 40–100 7 Process Preventive OC
MAKFX E-3 FMS Radar Software Flight 0–100 M Process Preventive OC
MAKFA E-3 FMS Radar Software Flight (P) 40–100 7 Process Preventive OC
MAKNX E-3 Navigation Software Flight 0–100 M Process Preventive OC
MAKNA E-3 Navigation Software Flight (P) 40–100 7 Process Preventive OC
MAKUX E-3 U.S. Radar Software Flight 0–100 M Process Preventive OC
MAKUA E-3 U.S. Radar Software Flight (P) 40–100 7 Process Preventive OC
MARXX B2 Software Engineering Squadron 0–100 M Process Preventive OC
MARAX B-2 System/OFP Support Flight 0–100 M Process Preventive OC
MARAA B-2 System/OFP Support Flight (P) 40–100 7 Process Preventive OC
MARBX B-2 Weapons Support Flight 0–100 M Process Preventive OC
MARBA B-2 Weapons Support Flight (P) 40–100 7 Process Preventive OC
MARCX B-2 Lab/Tools Support Flight 0–100 M Process Preventive OC
MARCA B-2 Lab/Tools Support Flight (P) 40–100 7 Process Preventive OC
E-24

Depot-Level Corrosion Profile
Table E-1. Depot-Level Corrosion Profile
CC Work center description Corrosion
percentageDepot
process stepMaintenance
action Corrective or preventive ALC
MARLA B-2 Program Management/Process Con-trol Flight (P)
40–100 7 Process Preventive OC
MARDX B-2 Operational Flight Program Support Flight
0–100 M Process Preventive OC
MARDA B-2 Operational Flight Program Support Flight (P)
40–100 7 Process Preventive OC
MALAX B-2 Hybrid Test Program Set (TPS) De-velopment Flight
0–100 M Process Preventive OC
MALAA B-2 Hybrid Test Program Set (TPS) De-velopment Flight
40–100 7 Process Preventive OC
MALBX B-2 Cable Chassis TPS Development Flight
0–100 M Process Preventive OC
MALBA B-2 Cable Chassis TPS Development Flight (P)
40–100 7 Process Preventive OC
MALCX B-2 Analog TPS Development Flight 0–100 M Process Preventive OC
MALCA B-2 Analog TPS Development Flight (P) 40–100 7 Process Preventive OC
MALDA B-2 Digital TPS Development Flight (P) 40–100 7 Process Preventive OC
MALLA B-2 Program Management/Processcontrol Flight (P)
40–100 7 Process Preventive OC
MAWXX Resources Management Division 0–100 M Process Preventive OC
MASXX Resources Management Division ( Proc-ess Improvement) (P)
0–100 M Process Preventive OC
MASAA Resources Management Division (Proc-ess Improvement) (P)
0–100 M Process Preventive OC
MAWCX Software Technology & Control Center Branch
0–100 M Process Preventive OC
MAWCA Software Technology & Control Center Branch
0–100 M Process Preventive OC
MAWMX Management Support Branch 0–100 M Process Preventive OC
MAWMA Management Support Branch 0–100 M Process Preventive OC
MAWTX Technical Support Branch 0–100 M Process Preventive OC
MAWTA Technical Support Branch 0–100 M Process Preventive OC
MCXXX Data Systems Division 0–100 M Process Preventive OC
MCAXX Dmaps Project Office 0–100 M Process Preventive OC
MCDXX Maintenance Branch 0–100 M Process Preventive OC
MCPXX Integration Branch 0–100 M Process Preventive OC
MCIXX Implementation Branch 0–100 M Process Preventive OC
MCTXX Technical Communications Support Branch
0–100 M Process Preventive OC
MFCSX Env Depot Maintenance Support Sec. 0–100 M Process Preventive OC
MWPXX Programs Division (Maintenance Mall) 0–100 M Process Preventive OC
E-25

Table E-1. Depot-Level Corrosion Profile
CC Work center description Corrosion
percentageDepot
process stepMaintenance
action Corrective or preventive ALC
MBAAA PDM / Torque Deck/Crown Skin 0–100 4 Repair Corrective WR
MBAAB Stab Shop 0–100 4 Repair Corrective WR
MBAAE UDLM 0–100 4 Repair Corrective WR
MBAAF Civilian DFT / ISO 0–100 4 Repair Corrective WR
MBAAS E&I / Strip & Buildup 40–100 1 Process Preventive WR
MBAAX Production Flight A Overhead 0–100 M Process Preventive WR
MBAFA 339th Direct 0–100 4 Repair Corrective WR
MBAFX 340th Direct Overhead 0–100 M Process Preventive WR
MBAGA Military (CLSS) On-Base 0–100 4 Repair Corrective WR
MBAGB Military (CLSS) DFT 0–100 4 Repair Corrective WR
MBAIX IPV 0–100 M Process Preventive WR
MBAPB Gear Shop 0–100 4 Repair Corrective WR
MBAPC Functinal Test / Fuel / Avionics 0–100 4 Repair Corrective WR
MBAPE Flight Control 0–100 4 Repair Corrective WR
MBAPS Electricial / Hydraulic 0–100 4 Repair Corrective WR
MBAPT Engine Pylon 0–100 4 Repair Corrective WR
MBAPX Production Support Flight Overhead 0–100 M Process Preventive WR
MBAWC WSSC Direct 0–100 M Process Preventive WR
MBAWX WSSC Overhead 0–100 M Process Preventive WR
MBAXX Squadron Commander Staff 0–100 M Process Preventive WR
MBBAA PDM 0–100 4 Repair Corrective WR
MBBAX Flight Chief/Team Lead 0–100 M Process Preventive WR
MBBBB PDM 0–100 4 Repair Corrective WR
MBBBX Flight Chief/Team Lead 0–100 M Process Preventive WR
MBBCC PDM 0–100 4 Repair Corrective WR
MBBCD PDM 0–100 4 Repair Corrective WR
MBBCX Flight Chief/Team Lead 0–100 M Process Preventive WR
MBBDC PDM 0–100 4 Repair Corrective WR
MBBDD PDM 0–100 4 Repair Corrective WR
MBBDE CLR 0–100 4 Repair Corrective WR
MBBDG UDLM 0–100 4 Repair Corrective WR
MBBDH Civilian DFT 0–100 4 Repair Corrective WR
MBBDX Flight Chief/Team Lead 0–100 M Process Preventive WR
MBBFX Flight Chief/Team Lead 0–100 M Process Preventive WR
MBBGA PDM 0–100 4 Repair Corrective WR
MBBGB Military DFT 0–100 4 Repair Corrective WR
MBBIX Flight Chief/Team Lead 0–100 M Process Preventive WR
MBBPA PDM 0–100 4 Repair Corrective WR
MBBPX Flight Chief/Team Lead 0–100 M Process Preventive WR
E-26

Depot-Level Corrosion Profile
Table E-1. Depot-Level Corrosion Profile
CC Work center description Corrosion
percentageDepot
process stepMaintenance
action Corrective or preventive ALC
MBBWC PDM 0–100 4 Repair Corrective WR
MBBWX WSSC 0–100 M Process Preventive WR
MBBYC PDM 0–100 4 Repair Corrective WR
MBBYX Second WSSC 0–100 M Process Preventive WR
MBEAA Day-Shift and 2nd Shift GRIP 0–100 4 Repair Corrective WR
MBEAB Day-Shift and 2nd Shift GRIP 0–100 4 Repair Corrective WR
MBEAC Day-Shift and 2nd Shift GRIP 0–100 4 Repair Corrective WR
MBEAD Day-Shift and 2nd Shift GRIP 0–100 4 Repair Corrective WR
MBEAE Day-Shift and 2nd Shift GRIP 0–100 4 Repair Corrective WR
MBEAF Day-Shift and 2nd Shift GRIP 0–100 4 Repair Corrective WR
MBEAX Day-Shift Overhead 0–100 M Process Preventive WR
MBEBA AE-Skill 0–100 4 Repair Corrective WR
MBEBB Functional Test 40–100 7 Process Preventive WR
MBEBC TR Shop 0–100 4 Repair Corrective WR
MBEBD AH-Skill 0–100 4 Repair Corrective WR
MBEBF Not in Use 0–100 4 Repair Corrective WR
MBEBG Not in Use 0–100 4 Repair Corrective WR
MBEBX Overhead 0–100 M Process Preventive WR
MBECA LAIRCM 0–100 4 Repair Corrective WR
MBECB ER/ OBIGGS 0–100 4 Repair Corrective WR
MBECC Functional Test 40–100 7 Process Preventive WR
MBECD Not in Use 0–100 4 Repair Corrective WR
MBECE Not in Use 0–100 4 Repair Corrective WR
MBECF Not in Use 0–100 4 Repair Corrective WR
MBECG Not in Use 0–100 4 Repair Corrective WR
MBECX Overhead 0–100 M Process Preventive WR
MBEWC C-17 WSSC/ DFT 0–100 4 Repair Corrective WR
MBEWX C-17 WSSC 0–100 M Process Preventive WR
MBEXX Overhead 0–100 M Process Preventive WR
MBFAA E&I / Aircraft Removal 40–100 1 Process Preventive WR
MBFAX Overhead 0–100 M Process Preventive WR
MBFB 0–100 M Process Preventive WR
MBFBA Production Support 0–100 M Process Preventive WR
MBFBX Overhead 0–100 M Process Preventive WR
MBFCA Civilian Depot Field Team 0–100 4 Repair Corrective WR
MBFCD Crash Damage 0–100 4 Repair Corrective WR
MBFCX Overhead 0–100 M Process Preventive WR
MBFFA 339th Flight Test 40–100 7 Process Preventive WR
MBFFX Overhead 0–100 M Process Preventive WR
E-27
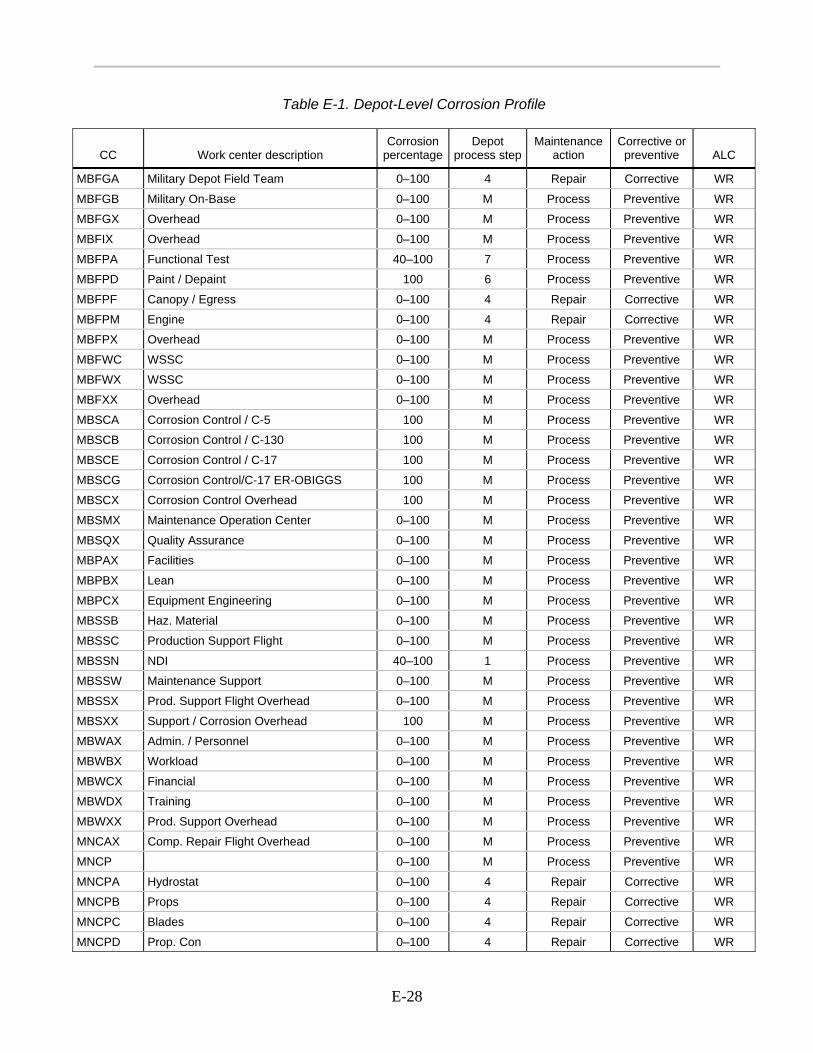
Table E-1. Depot-Level Corrosion Profile
CC Work center description Corrosion
percentageDepot
process stepMaintenance
action Corrective or preventive ALC
MBFGA Military Depot Field Team 0–100 4 Repair Corrective WR
MBFGB Military On-Base 0–100 M Process Preventive WR
MBFGX Overhead 0–100 M Process Preventive WR
MBFIX Overhead 0–100 M Process Preventive WR
MBFPA Functional Test 40–100 7 Process Preventive WR
MBFPD Paint / Depaint 100 6 Process Preventive WR
MBFPF Canopy / Egress 0–100 4 Repair Corrective WR
MBFPM Engine 0–100 4 Repair Corrective WR
MBFPX Overhead 0–100 M Process Preventive WR
MBFWC WSSC 0–100 M Process Preventive WR
MBFWX WSSC 0–100 M Process Preventive WR
MBFXX Overhead 0–100 M Process Preventive WR
MBSCA Corrosion Control / C-5 100 M Process Preventive WR
MBSCB Corrosion Control / C-130 100 M Process Preventive WR
MBSCE Corrosion Control / C-17 100 M Process Preventive WR
MBSCG Corrosion Control/C-17 ER-OBIGGS 100 M Process Preventive WR
MBSCX Corrosion Control Overhead 100 M Process Preventive WR
MBSMX Maintenance Operation Center 0–100 M Process Preventive WR
MBSQX Quality Assurance 0–100 M Process Preventive WR
MBPAX Facilities 0–100 M Process Preventive WR
MBPBX Lean 0–100 M Process Preventive WR
MBPCX Equipment Engineering 0–100 M Process Preventive WR
MBSSB Haz. Material 0–100 M Process Preventive WR
MBSSC Production Support Flight 0–100 M Process Preventive WR
MBSSN NDI 40–100 1 Process Preventive WR
MBSSW Maintenance Support 0–100 M Process Preventive WR
MBSSX Prod. Support Flight Overhead 0–100 M Process Preventive WR
MBSXX Support / Corrosion Overhead 100 M Process Preventive WR
MBWAX Admin. / Personnel 0–100 M Process Preventive WR
MBWBX Workload 0–100 M Process Preventive WR
MBWCX Financial 0–100 M Process Preventive WR
MBWDX Training 0–100 M Process Preventive WR
MBWXX Prod. Support Overhead 0–100 M Process Preventive WR
MNCAX Comp. Repair Flight Overhead 0–100 M Process Preventive WR
MNCP 0–100 M Process Preventive WR
MNCPA Hydrostat 0–100 4 Repair Corrective WR
MNCPB Props 0–100 4 Repair Corrective WR
MNCPC Blades 0–100 4 Repair Corrective WR
MNCPD Prop. Con 0–100 4 Repair Corrective WR
E-28

Depot-Level Corrosion Profile
Table E-1. Depot-Level Corrosion Profile
CC Work center description Corrosion
percentageDepot
process stepMaintenance
action Corrective or preventive ALC
MNCPE Hydrostat 0–100 4 Repair Corrective WR
MNCPF C-17 Hydrostat 0–100 4 Repair Corrective WR
MNCPH C-17 Thrust Reverser 0–100 4 Repair Corrective WR
MNCPI F-15 Canopy 0–100 4 Repair Corrective WR
MNCPJ F-15 Ramps 0–100 4 Repair Corrective WR
MNCPK F-15 Stabs 0–100 4 Repair Corrective WR
MNCPL DLA Halon Workload 0–100 4 Repair Corrective WR
MNCPX Prop. Repair Flight Overhead 0–100 M Process Preventive WR
MNCWA F-15 Wing Robot 0–100 4 Repair Corrective WR
MNCWB F-15 Wing T/D, WP 0–100 4 Repair Corrective WR
MNCWC F-15 Wing L/E Ris 0–100 4 Repair Corrective WR
MNCWD F-15 Wing Buildup 0–100 4 Repair Corrective WR
MNCWE Not Use 0–100 M Process Preventive WR
MNCWX F-15 Wing Repair Flight Overhead 0–100 M Process Preventive WR
MNMAX Com/ Repair / Man. Flight Overhead 0–100 M Process Preventive WR
MNMMA Optical Tooling 0–100 4 Repair Corrective WR
MNMMB Not Use 0–100 M Process Preventive WR
MNMMD NC Mach 0–100 4 Repair Corrective WR
MNMME Gen Mechanic 0–100 4 Repair Corrective WR
MNMMF Engr. Design 0–100 4 Repair Corrective WR
MNMMG Tool & Die 0–100 4 Repair Corrective WR
MNMMH Mach. Shop 0–100 4 Repair Corrective WR
MNMMX Tool / Mach Flight Overhead 0–100 M Process Preventive WR
MNMPA Sand BL / Plat/ NDI 100 3 Process Corrective WR
MNMPB Not Use 0–100 M Process Preventive WR
MNMPC Paint Shop 100 6 Process Preventive WR
MNMPD Water Pik 100 2 Process Preventive WR
MNMPE NDI 40–100 1 Process Preventive WR
MNMPF Flash Jet 100 3 Process Corrective WR
MNMPN NDI, Blas, Plat, Fls 40–100 1 Process Preventive WR
MNMPX Process Flight Overhead 0–100 M Process Preventive WR
MNMSA Wood Shop/ Layout 0–100 4 Repair Corrective WR
MNMSB Tubing 0–100 4 Repair Corrective WR
MNMSC Welding/ heat treat 0–100 4 Repair Corrective WR
MNMSD Foam/ Fabric 0–100 4 Repair Corrective WR
MNMSE Wood Shop/ Layout 0–100 4 Repair Corrective WR
MNMSW Sheet Metal 0–100 4 Repair Corrective WR
MNMSX Sheet Metal Mfg Flight Overhead 0–100 M Process Preventive WR
MNPEX Facility Engineeing 0–100 M Process Preventive WR
E-29

Table E-1. Depot-Level Corrosion Profile
CC Work center description Corrosion
percentageDepot
process stepMaintenance
action Corrective or preventive ALC
MNPFX Prod. Engineering 0–100 M Process Preventive WR
MNPGX GCC – Group Control Center 0–100 M Process Preventive WR
MNPIX Open RCC 0–100 M Process Preventive WR
MNPLX Lean Process 0–100 M Process Preventive WR
MNPRD Sealant Shop 100 5 Process Preventive WR
MNPSX Procedures and Analysis 0–100 M Process Preventive WR
MNPTX Tool and Process Engineering 0–100 M Process Preventive WR
MNPXX Process/ control/Improvement Flight 0–100 M Process Preventive WR
MNQAX Quality Assurance 0–100 M Process Preventive WR
MNQBX Quality Assurance 0–100 M Process Preventive WR
MNQXX Quality Assurance Flight Overhead 0–100 M Process Preventive WR
MNRAX Strut. Repair EPSC Flight Overhead 0–100 M Process Preventive WR
MNRCB Radomes/ Plastics 0–100 4 Repair Corrective WR
MNRCC Metal Bond Etch 0–100 4 Repair Corrective WR
MNRCD C-5 Flaps 0–100 4 Repair Corrective WR
MNRCE F-15 Flight Control 0–100 4 Repair Corrective WR
MNRCF F-15 Tor/ Spoil/ Misc 0–100 4 Repair Corrective WR
MNRCG F-15 Speed/ Wing 0–100 4 Repair Corrective WR
MNRCH Stab Component 0–100 4 Repair Corrective WR
MNRCI C-5 Floor/ Sd Cowls 0–100 4 Repair Corrective WR
MNRCJ Misc Metal Bond 0–100 4 Repair Corrective WR
MNRCK C-5 Pylon 0–100 4 Repair Corrective WR
MNRCL Metal Bond Flight Line 0–100 4 Repair Corrective WR
MNRCM Metal Bond 0–100 4 Repair Corrective WR
MNRCP Plastic Shop 0–100 4 Repair Corrective WR
MNRCX Composite Repair Flight Overhead 0–100 M Process Preventive WR
MNRSA Tanks PDM 0–100 4 Repair Corrective WR
MNRSB F-15 Ram/ Misc 0–100 4 Repair Corrective WR
MNRSC C-5 Side Cowls 0–100 4 Repair Corrective WR
MNRSD C-130 PDM Sheet Metal 0–100 4 Repair Corrective WR
MNRSE F-15 CFT/ Misc Sheet Metal 0–100 4 Repair Corrective WR
MNRSF C-130 Flaps 0–100 4 Repair Corrective WR
MNRSG C-5 Pres Dr/ Misc 0–100 4 Repair Corrective WR
MNRSH C-130 Mistr/ Doors 0–100 4 Repair Corrective WR
MNRSI Not Use 0–100 4 Repair Corrective WR
MNRSK Rad/ Co/Canopy 0–100 4 Repair Corrective WR
MNRSL C-5 Pylon Shop 0–100 4 Repair Corrective WR
MNRSM C-130 SCO/ C-5 Apr 0–100 4 Repair Corrective WR
MNRSN Pyl/Misc 0–100 4 Repair Corrective WR
E-30
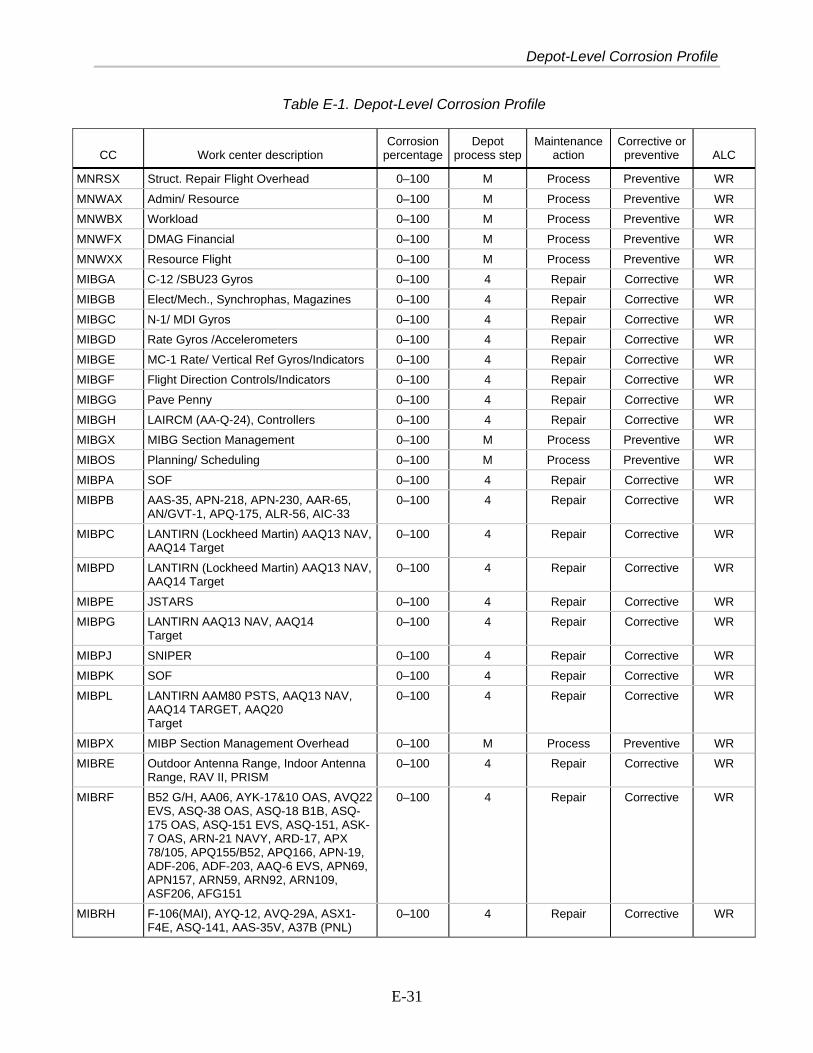
Depot-Level Corrosion Profile
Table E-1. Depot-Level Corrosion Profile
CC Work center description Corrosion
percentageDepot
process stepMaintenance
action Corrective or preventive ALC
MNRSX Struct. Repair Flight Overhead 0–100 M Process Preventive WR
MNWAX Admin/ Resource 0–100 M Process Preventive WR
MNWBX Workload 0–100 M Process Preventive WR
MNWFX DMAG Financial 0–100 M Process Preventive WR
MNWXX Resource Flight 0–100 M Process Preventive WR
MIBGA C-12 /SBU23 Gyros 0–100 4 Repair Corrective WR
MIBGB Elect/Mech., Synchrophas, Magazines 0–100 4 Repair Corrective WR
MIBGC N-1/ MDI Gyros 0–100 4 Repair Corrective WR
MIBGD Rate Gyros /Accelerometers 0–100 4 Repair Corrective WR
MIBGE MC-1 Rate/ Vertical Ref Gyros/Indicators 0–100 4 Repair Corrective WR
MIBGF Flight Direction Controls/Indicators 0–100 4 Repair Corrective WR
MIBGG Pave Penny 0–100 4 Repair Corrective WR
MIBGH LAIRCM (AA-Q-24), Controllers 0–100 4 Repair Corrective WR
MIBGX MIBG Section Management 0–100 M Process Preventive WR
MIBOS Planning/ Scheduling 0–100 M Process Preventive WR
MIBPA SOF 0–100 4 Repair Corrective WR
MIBPB AAS-35, APN-218, APN-230, AAR-65, AN/GVT-1, APQ-175, ALR-56, AIC-33
0–100 4 Repair Corrective WR
MIBPC LANTIRN (Lockheed Martin) AAQ13 NAV, AAQ14 Target
0–100 4 Repair Corrective WR
MIBPD LANTIRN (Lockheed Martin) AAQ13 NAV, AAQ14 Target
0–100 4 Repair Corrective WR
MIBPE JSTARS 0–100 4 Repair Corrective WR
MIBPG LANTIRN AAQ13 NAV, AAQ14 Target
0–100 4 Repair Corrective WR
MIBPJ SNIPER 0–100 4 Repair Corrective WR
MIBPK SOF 0–100 4 Repair Corrective WR
MIBPL LANTIRN AAM80 PSTS, AAQ13 NAV, AAQ14 TARGET, AAQ20 Target
0–100 4 Repair Corrective WR
MIBPX MIBP Section Management Overhead 0–100 M Process Preventive WR
MIBRE Outdoor Antenna Range, Indoor Antenna Range, RAV II, PRISM
0–100 4 Repair Corrective WR
MIBRF B52 G/H, AA06, AYK-17&10 OAS, AVQ22 EVS, ASQ-38 OAS, ASQ-18 B1B, ASQ-175 OAS, ASQ-151 EVS, ASQ-151, ASK-7 OAS, ARN-21 NAVY, ARD-17, APX 78/105, APQ155/B52, APQ166, APN-19, ADF-206, ADF-203, AAQ-6 EVS, APN69, APN157, ARN59, ARN92, ARN109, ASF206, AFG151
0–100 4 Repair Corrective WR
MIBRH F-106(MAI), AYQ-12, AVQ-29A, ASX1-F4E, ASQ-141, AAS-35V, A37B (PNL)
0–100 4 Repair Corrective WR
E-31

Table E-1. Depot-Level Corrosion Profile
CC Work center description Corrosion
percentageDepot
process stepMaintenance
action Corrective or preventive ALC
MIBRI APN-59 0–100 4 Repair Corrective WR
MIBRK APQ-122, APQ-175, APN-224, APN-171, 1660 Controls, APQ-153, APQ-172, APS-133
0–100 4 Repair Corrective WR
MIBRL OQ-204, OD-191, JTIDS, ECS, AYR-2, AYQ-6, AYQ-12, ASQ-153, ARN-21, ARN-109, ARC-207, ARC-204, ARC-169, ARC-167, APY-1/2, APX-103, APN-69, APN-224, APN-167, APN-157, APN-111, AIC-28, ADF-206
0–100 4 Repair Corrective WR
MIBRN AIM9, AIM120, AMRAAM (T#s) 0–100 4 Repair Corrective WR
MIBRP DEMIL Workload 0–100 4 Repair Corrective WR
MIBRX MIBR Section Management 0–100 M Process Preventive WR
MIEC 0–100 M Process Preventive WR
MIECA Repair (APX-164,-101; ARN-118,-147) 0–100 4 Repair Corrective WR
MIECB Repair (MIDS screening and repair) 0–100 4 Repair Corrective WR
MIECC Repair (ARC-164; TRC-187 0–100 4 Repair Corrective WR
MIECD Repair (APX-65,-76;AIC-13,-18,-25;HF-101)
0–100 4 Repair Corrective WR
MIECF Repair (ARA-19; ARC-186,-222,-190,-210,-230; ARN-6, -14, -127)
0–100 4 Repair Corrective WR
MIECH Repair (ARC-171, -166, -169; ARN-151)
0–100 4 Repair Corrective WR
MIECJ Repair (APN -169, -232; AXQ-16) 0–100 4 Repair Corrective WR
MIECX MIEC Section Management Overhead 0–100 M Process Preventive WR
MIEOS Planning/ Scheduling 0–100 M Process Preventive WR
MIES 0–100 M Process Preventive WR
MIESA Future Home of APN-241 Color Weather Radar
0–100 4 Repair Corrective WR
MIESB Repair Support Equipment (F-15 & A10 Aircraft)
0–100 4 Repair Corrective WR
MIESC Repair Support Equipment (F-15 & F16 Aircraft)
0–100 4 Repair Corrective WR
MIESD Repair Support Equipment (C5; B1B) 0–100 4 Repair Corrective WR
MIESE Repair Support Equipment (C5 & F-15 Aircraft, Future B52 Mustang)
0–100 4 Repair Corrective WR
MIESF C17 Partnership 0–100 M Process Preventive WR
MIESX MIES Section Management Overhead 0–100 M Process Preventive WR
MIEWA Repair (ALR-20; ASQ-184; APR-46) 0–100 4 Repair Corrective WR
MIEWB Repair (ALQ-161) 0–100 4 Repair Corrective WR
MIEWC Repair (ALQ-172) 0–100 4 Repair Corrective WR
MIEWD Repair (ALQ-131) 0–100 4 Repair Corrective WR
E-32

Depot-Level Corrosion Profile
Table E-1. Depot-Level Corrosion Profile
CC Work center description Corrosion
percentageDepot
process stepMaintenance
action Corrective or preventive ALC
MIEWE Repair (ALQ-155, -184; ALE-40; ALT-16, -32)
0–100 4 Repair Corrective WR
MIEWF Repair (ALR-46, -69; AAR-44; ALE-20, -24, -27; ALM-191; APM-427)
0–100 4 Repair Corrective WR
MIEWG Screening/Modifying ALQ-213 0–100 4 Repair Corrective WR
MIEWH ALQ-161 Band 8 0–100 4 Repair Corrective WR
MIEWJ New Workload DEMIL 0–100 4 Repair Corrective WR
MIEWX MIEW Section Management 0–100 M Process Preventive WR
MIFIB F-15 Indicator/Control 0–100 4 Repair Corrective WR
MIFIC F-15 Indicator/Control 0–100 4 Repair Corrective WR
MIFID F-15 Indicator/Control 0–100 4 Repair Corrective WR
MIFIG F-15 Indicator/Control (HUD & ANMI) 0–100 4 Repair Corrective WR
MIFIH F-15 Indicator/Control 0–100 4 Repair Corrective WR
MIFIX MIFI Section Management Overhead 0–100 M Process Preventive WR
MIFOS Planning/ Scheduling 0–100 M Process Preventive WR
MIFRA F-15 Radar RF (SRU) 0–100 4 Repair Corrective WR
MIFRE F-15 Radar Antenna 0–100 4 Repair Corrective WR
MIFRF F-15 Radar Computer 0–100 4 Repair Corrective WR
MIFRH Honeywell Digital Map System (DMS) 0–100 4 Repair Corrective WR
MIFRL DEMIL Workload 0–100 4 Repair Corrective WR
MIFRP F-15 Radar-DTS 70, Microwave 0–100 4 Repair Corrective WR
MIFRX MIFT Section Management 0–100 4 Repair Corrective WR
MIFWJ F16 EW (ALE-47) 0–100 4 Repair Corrective WR
MIFWK F-15 EW ALQ-135 (B1/B2) 0–100 4 Repair Corrective WR
MIFWL F-15 EW ALR-56A/C SRU 0–100 4 Repair Corrective WR
MIFWM F16 EW SRU ALR-56M 0–100 4 Repair Corrective WR
MIFWN F-15 EW SRU TEWS (ALQ135 BQ.5/B3) 0–100 4 Repair Corrective WR
MIFWP F-15 LRU TEWS 0–100 4 Repair Corrective WR
MIFWR F-15ALE 40/45, ALQ-128 0–100 4 Repair Corrective WR
MIFWX MIFW Section Management 0–100 M Process Preventive WR
MILMA Bare Board Manufacture/design 0–100 4 Repair Corrective WR
MILMB FACT, large cable/harness, ITA Manu. 0–100 4 Repair Corrective WR
MILMC Mfg. Engineering Design 0–100 4 Repair Corrective WR
MILMD Silkscreen, Decals 0–100 4 Repair Corrective WR
MILME Machine Shop 0–100 4 Repair Corrective WR
MILMF Small/ single cables 0–100 4 Repair Corrective WR
MILMG MISTR, other repair 0–100 4 Repair Corrective WR
MILMH Manufacture of F-Jon ITA’s (Non VDATS) 0–100 4 Repair Corrective WR
MILMI Manufacture of F-Jon ITA’s (VDATS) 0–100 4 Repair Corrective WR
E-33
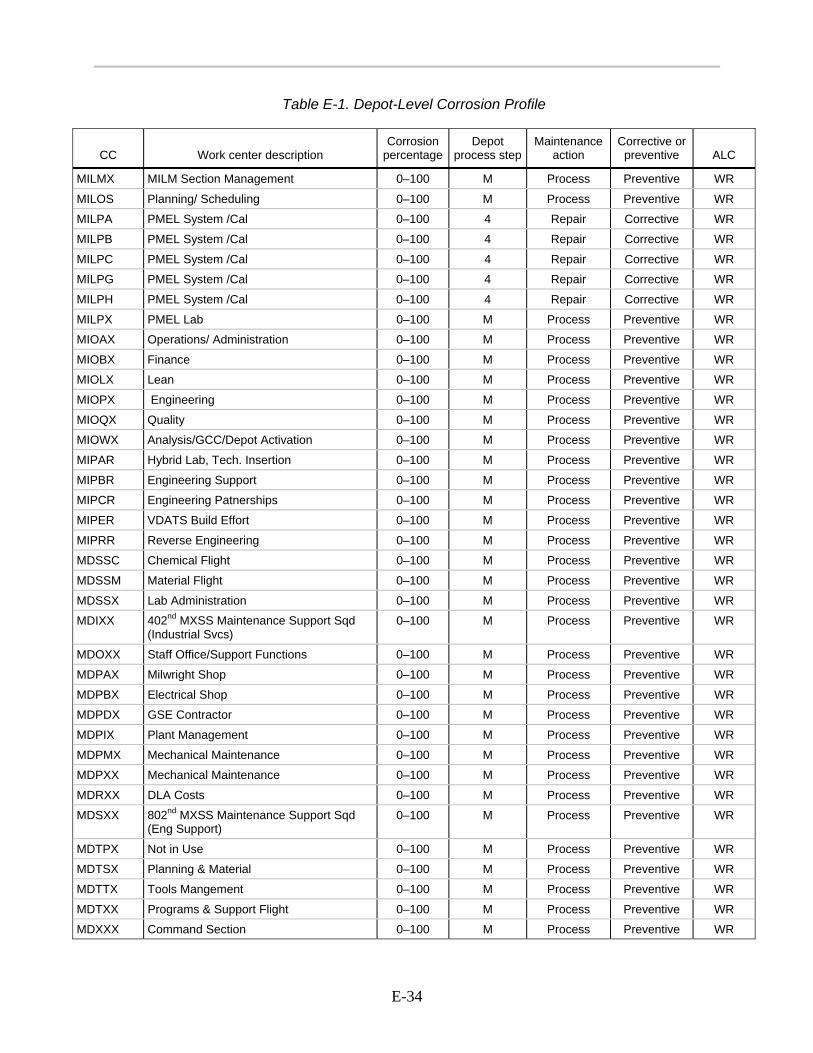
Table E-1. Depot-Level Corrosion Profile
CC Work center description Corrosion
percentageDepot
process stepMaintenance
action Corrective or preventive ALC
MILMX MILM Section Management 0–100 M Process Preventive WR
MILOS Planning/ Scheduling 0–100 M Process Preventive WR
MILPA PMEL System /Cal 0–100 4 Repair Corrective WR
MILPB PMEL System /Cal 0–100 4 Repair Corrective WR
MILPC PMEL System /Cal 0–100 4 Repair Corrective WR
MILPG PMEL System /Cal 0–100 4 Repair Corrective WR
MILPH PMEL System /Cal 0–100 4 Repair Corrective WR
MILPX PMEL Lab 0–100 M Process Preventive WR
MIOAX Operations/ Administration 0–100 M Process Preventive WR
MIOBX Finance 0–100 M Process Preventive WR
MIOLX Lean 0–100 M Process Preventive WR
MIOPX Engineering 0–100 M Process Preventive WR
MIOQX Quality 0–100 M Process Preventive WR
MIOWX Analysis/GCC/Depot Activation 0–100 M Process Preventive WR
MIPAR Hybrid Lab, Tech. Insertion 0–100 M Process Preventive WR
MIPBR Engineering Support 0–100 M Process Preventive WR
MIPCR Engineering Patnerships 0–100 M Process Preventive WR
MIPER VDATS Build Effort 0–100 M Process Preventive WR
MIPRR Reverse Engineering 0–100 M Process Preventive WR
MDSSC Chemical Flight 0–100 M Process Preventive WR
MDSSM Material Flight 0–100 M Process Preventive WR
MDSSX Lab Administration 0–100 M Process Preventive WR
MDIXX 402nd MXSS Maintenance Support Sqd (Industrial Svcs)
0–100 M Process Preventive WR
MDOXX Staff Office/Support Functions 0–100 M Process Preventive WR
MDPAX Milwright Shop 0–100 M Process Preventive WR
MDPBX Electrical Shop 0–100 M Process Preventive WR
MDPDX GSE Contractor 0–100 M Process Preventive WR
MDPIX Plant Management 0–100 M Process Preventive WR
MDPMX Mechanical Maintenance 0–100 M Process Preventive WR
MDPXX Mechanical Maintenance 0–100 M Process Preventive WR
MDRXX DLA Costs 0–100 M Process Preventive WR
MDSXX 802nd MXSS Maintenance Support Sqd (Eng Support)
0–100 M Process Preventive WR
MDTPX Not in Use 0–100 M Process Preventive WR
MDTSX Planning & Material 0–100 M Process Preventive WR
MDTTX Tools Mangement 0–100 M Process Preventive WR
MDTXX Programs & Support Flight 0–100 M Process Preventive WR
MDXXX Command Section 0–100 M Process Preventive WR
E-34

Depot-Level Corrosion Profile
Table E-1. Depot-Level Corrosion Profile
CC Work center description Corrosion
percentageDepot
process stepMaintenance
action Corrective or preventive ALC
MSSAA OFP Software (JMPS) 0–100 M Process Preventive WR
MSSAB OFP Software (JMPS) 0–100 M Process Preventive WR
MSSAC OFP Software (JMPS) 0–100 M Process Preventive WR
MSSAD OFP Software (J STARS) 0–100 M Process Preventive WR
MSSAE OFP Software (J STARS) 0–100 M Process Preventive WR
MSSAF OFP Software (J STARS) 0–100 M Process Preventive WR
MSSAG OFP Software (JMPS) 0–100 M Process Preventive WR
MSSAX OFP Software 0–100 M Process Preventive WR
MSSBA OFP Software 0–100 M Process Preventive WR
MSSBB OFP Software 0–100 M Process Preventive WR
MSSBC OFP Software 0–100 M Process Preventive WR
MSSBD OFP Software 0–100 M Process Preventive WR
MSSBE OFP Software 0–100 M Process Preventive WR
MSSBF OFP Software 0–100 M Process Preventive WR
MSSBG OFP Software 0–100 M Process Preventive WR
MSSBK OFP Software 0–100 M Process Preventive WR
MSSBM OFP Software (C-5) 0–100 M Process Preventive WR
MSSBN OFP Software (C-5) 0–100 M Process Preventive WR
MSSBX OFP Software 0–100 M Process Preventive WR
MSSEA OFP Software 0–100 M Process Preventive WR
MSSEB OFP Software 0–100 M Process Preventive WR
MSSEC OFP Software 0–100 M Process Preventive WR
MSSED OFP Software 0–100 M Process Preventive WR
MSSEE OFP Software 0–100 M Process Preventive WR
MSSEF OFP Software 0–100 M Process Preventive WR
MSSEG OFP Software 0–100 M Process Preventive WR
MSSEH OFP Software 0–100 M Process Preventive WR
MSSEI OFP Software 0–100 M Process Preventive WR
MSSEJ OFP Software 0–100 M Process Preventive WR
MSSEX OFP Software 0–100 M Process Preventive WR
MSSSA OFP Software 0–100 M Process Preventive WR
MSSSB OFP Software 0–100 M Process Preventive WR
MSSSC OFP Software 0–100 M Process Preventive WR
MSSSD OFP Software 0–100 M Process Preventive WR
MSSSE OFP Software 0–100 M Process Preventive WR
MSSSF OFP Software 0–100 M Process Preventive WR
MSSSI OFP Software 0–100 M Process Preventive WR
MSSSX OFP Software 0–100 M Process Preventive WR
MSSTA TPS Software 0–100 M Process Preventive WR
E-35
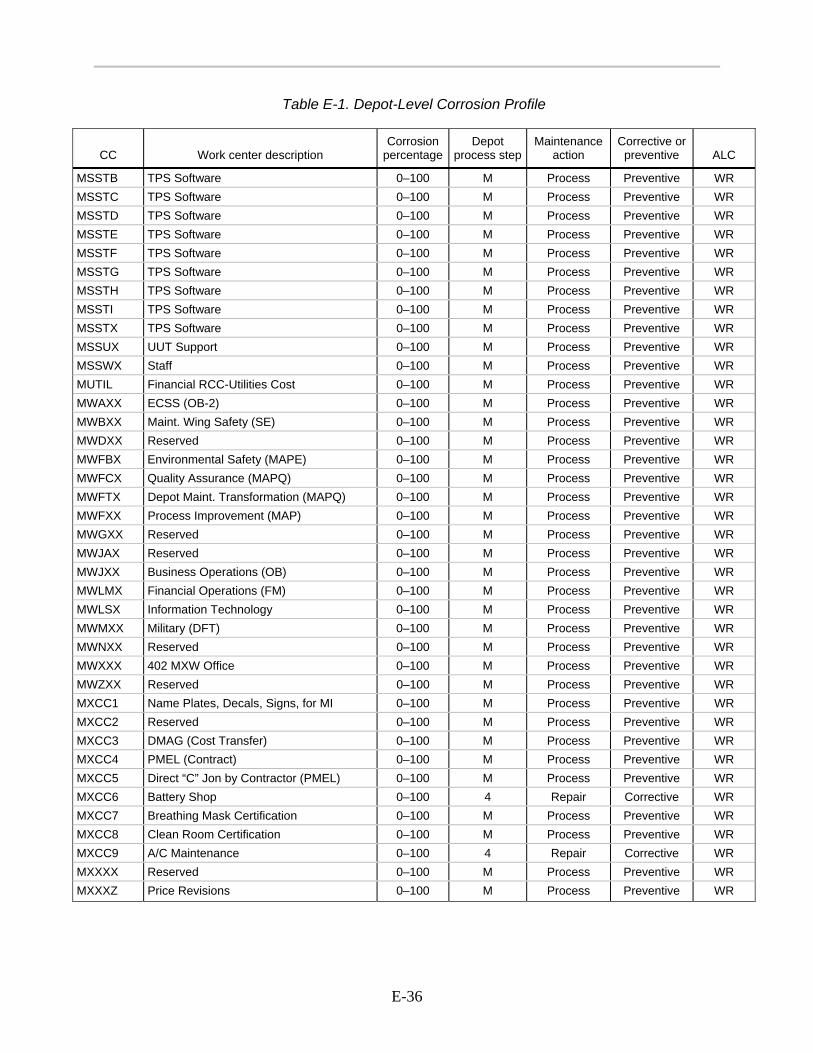
Table E-1. Depot-Level Corrosion Profile
CC Work center description Corrosion
percentageDepot
process stepMaintenance
action Corrective or preventive ALC
MSSTB TPS Software 0–100 M Process Preventive WR MSSTC TPS Software 0–100 M Process Preventive WR MSSTD TPS Software 0–100 M Process Preventive WR MSSTE TPS Software 0–100 M Process Preventive WR MSSTF TPS Software 0–100 M Process Preventive WR MSSTG TPS Software 0–100 M Process Preventive WR MSSTH TPS Software 0–100 M Process Preventive WR MSSTI TPS Software 0–100 M Process Preventive WR MSSTX TPS Software 0–100 M Process Preventive WR MSSUX UUT Support 0–100 M Process Preventive WR MSSWX Staff 0–100 M Process Preventive WR MUTIL Financial RCC-Utilities Cost 0–100 M Process Preventive WR MWAXX ECSS (OB-2) 0–100 M Process Preventive WR MWBXX Maint. Wing Safety (SE) 0–100 M Process Preventive WR MWDXX Reserved 0–100 M Process Preventive WR MWFBX Environmental Safety (MAPE) 0–100 M Process Preventive WR MWFCX Quality Assurance (MAPQ) 0–100 M Process Preventive WR MWFTX Depot Maint. Transformation (MAPQ) 0–100 M Process Preventive WR MWFXX Process Improvement (MAP) 0–100 M Process Preventive WR MWGXX Reserved 0–100 M Process Preventive WR MWJAX Reserved 0–100 M Process Preventive WR MWJXX Business Operations (OB) 0–100 M Process Preventive WR MWLMX Financial Operations (FM) 0–100 M Process Preventive WR MWLSX Information Technology 0–100 M Process Preventive WR MWMXX Military (DFT) 0–100 M Process Preventive WR MWNXX Reserved 0–100 M Process Preventive WR MWXXX 402 MXW Office 0–100 M Process Preventive WR MWZXX Reserved 0–100 M Process Preventive WR MXCC1 Name Plates, Decals, Signs, for MI 0–100 M Process Preventive WR MXCC2 Reserved 0–100 M Process Preventive WR MXCC3 DMAG (Cost Transfer) 0–100 M Process Preventive WR MXCC4 PMEL (Contract) 0–100 M Process Preventive WR MXCC5 Direct “C” Jon by Contractor (PMEL) 0–100 M Process Preventive WR MXCC6 Battery Shop 0–100 4 Repair Corrective WR MXCC7 Breathing Mask Certification 0–100 M Process Preventive WR MXCC8 Clean Room Certification 0–100 M Process Preventive WR MXCC9 A/C Maintenance 0–100 4 Repair Corrective WR MXXXX Reserved 0–100 M Process Preventive WR MXXXZ Price Revisions 0–100 M Process Preventive WR
E-36

Appendix F Key Corrosion Words
We developed the list of keywords through an iterative process using feedback from maintenance managers, discussions during and observations from site visits, and a scan of potential corrosion keywords within the maintenance description activity from each database. Some words are truncated because the search algo-rithm will catch all potential uses of the word including misspellings.
KEY PREVENTIVE WORDS A & E
Abradable
acrylic
Activated silica
aerosol
Alclad
Alkyd
Alkyl benzene sulfonate
alloying
alodine
Alternate-immersion
Aluminiz
Aluminum ion plat
Anneal
Anode
anodic
Anodiz
Anolyte
Anti Pitt
Arc wire spray
Autoclav
Bainite
Black oxide
booth
CAD A
CAD C
CAD P
CAD S
Cadmium ion plat
Cadmium plat
CADMUIM
Calcareous
Carbonitrid
carburiz
Caseharden
CASS
Cathode
cathodic
Cementation coat
check
Chemical conversion coat
Chemical vapor deposition
CHR P
CHROM
Chromad
Chromat
Chromate treatment
CHROME
chromium
F-1

Chromiz
CL/PREP/PT/ FINAL EA
CL/PREP/PT/ FINAL EACH
Clad metal
Cladd
Clean
CLN
Coat
Copper accelerated salt spray
Copper plat
Corrodkote test
dehumidif
deposition
Detonation gun
Dielectric fitt
Dielectric shield
Diffusion coat
Diluent
Drier
E & E
E&E
Earth pigment
eggshell
ELECTRO PLATING
Electrochemical cell
electrod
ELECTROLES
Electroless nickel
Electroplat
Electropolish
Electrostatic spray
Emulsion paint
enamel
epoxy
eval
Exempt solvent
Extender
Feedwater treat
FINAL TEST
FINISH
Flame harden
Flame spray
Flowcoat
Galfan
galv
Gel zeolite
glazing
gloss
Gloss meter
groundb
hardener
hardening
hardfac
hardness
haze
hiding power
high velocity oxy
hot crack
hot isostatic
Huey test
Humidity test
hydration
hydrostatic test
immunity
impregnat
impressed current
incubation period
induction harden
induction heat
inert anode
inhibit
inorganic zinc
INSP
F-2

Key Corrosion Words
insulation
intensiostatic
ion
ion implant
ion nitrid
ioniz
isopropyl
lacquer
langelier ind
lanthanide
lapping
latex
leakage
lithopone
lubrica
luggin
magnetic particle exam
manganese greensand
manganese zeolite
MASK
matte
METAL SPRAY
metallizing
metallurgical bond
Methylene Blue Active
micrograph
mineral spirit
MMA
moisture
Moneypenny-Strauss
mottle
MTL SPR
MTL SPRAY
MTL SPY SURF
naphtha
NDI
NDT
neutraliz
Nirtrocarb
Nitrid
Nitrocarburizing
Noble metal
Noble potential
Open-circuit potential
orange peel
overspray
PAINT
passivator
pearlite
penetrant exam
Permanganate
Permeability
Phophatizing
phosphatizing
Photo-thermal
Physisorption
pigment
PLATING
Polarization
polish
polymer
Polyphosphate
Polyurethane
Polyvinyl chloride
porosity
post-weld
pot life
potentio
powder coat
prechlorinat
Precious metal
PREP
PREP/BRUSH
PREP/CAD
PREP/PROCESS/ PLATE
F-3

Prepare seeds Telegraphing
PRESERV Semipermeable membrane
tempering
prime terne Shrinkage
priming test Shroud
protect thermocouple silica
protection potential thermography siliceous
pull-out thinner silicone
QA tinplate silking
QC Titanium dioxide SILVER
QUALIF TITANIUM ET skinning
QUALITY topcoat Slow strain rate
Quenching TOUCH UP soda ash
Rabbit ears Treat softening
Radiography tribo charging specific conductance
rapid charcoal U-bend specimen Splat
refractory Ultrasonic Splat cooling
regenerant Urethane spray
regeneration UV stabilizers spraying
resin vapor deposit sputtering
retarder varnish standard electrode potential rosin WASH
ROTTED Wetting Agent sulfonate
salinity wrap around Surfacing
salt fog X-ray T.I.
seal zinc T/I
F-4

KEY CORRECTIVE WORDS Abatement
Abrasive
acetone
acid
Age harden
alodining
anti galling
Beach mark
blast
Bleach
Blush
body work
bodywork
Braz
Breakdown potential
Brittle fracture
caulk
Caustic cracking
Caustic dip
Caustic embrittlement
Cavitation
Cold crack
contaminants
corro
crack
cracking
Crateri
Crawling
Crazi
Critical pitting potential
cure
Deactivation
Dealloy
dealloying
DEBURR
decay
Deioniz
Denickelification
detergent
deterio
DETERRIORA
Dewett
Dezincification
Disbond
Electrolysis
Electrolytic cell
embrittl
Environmental crack
erosion
exfoliate
exfoliation
filamentary
filiform
Fish eye
Flake
Fogged metal
Fouling
fracture
fretting
FSW
Galling
Gallionella ferruginea
Grain Drop
graphiti
Green rot
GRIND
GRND
GTAW
hydraulic cement
hydrogen blister
hydrogen damage
F-5
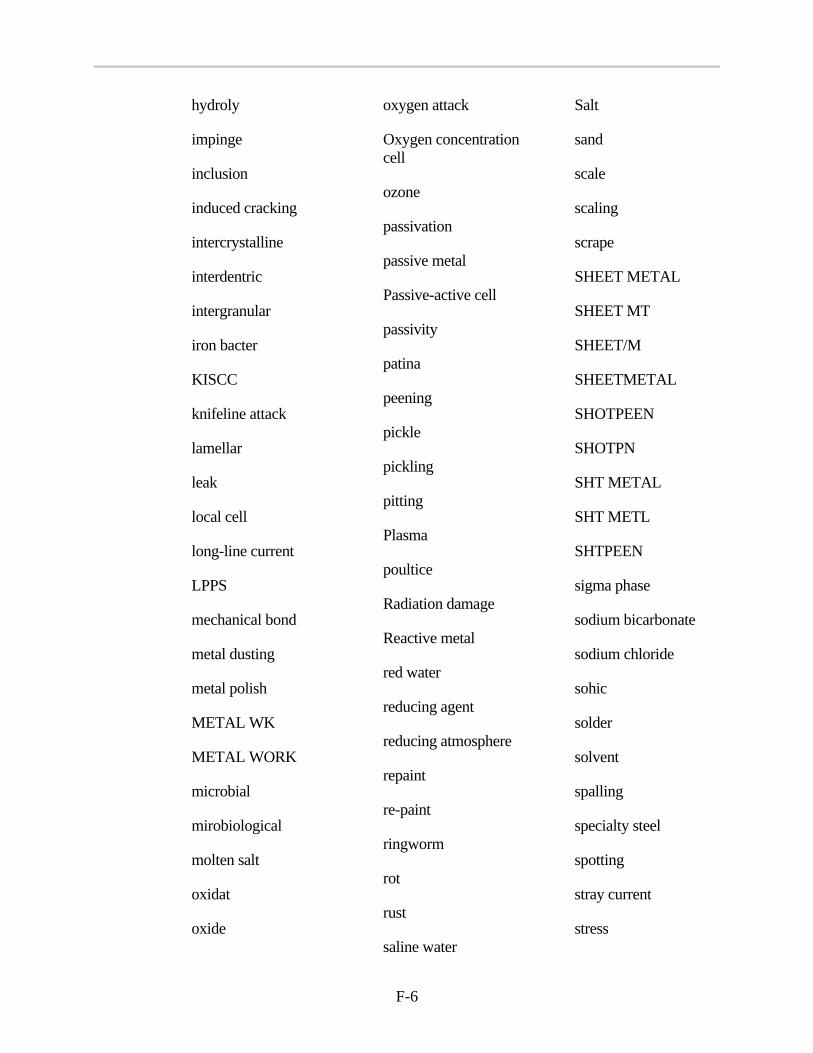
hydroly
impinge
inclusion
induced cracking
intercrystalline
interdentric
intergranular
iron bacter
KISCC
knifeline attack
lamellar
leak
local cell
long-line current
LPPS
mechanical bond
metal dusting
metal polish
METAL WK
METAL WORK
microbial
mirobiological
molten salt
oxidat
oxide
oxygen attack
Oxygen concentration cell
ozone
passivation
passive metal
Passive-active cell
passivity
patina
peening
pickle
pickling
pitting
Plasma
poultice
Radiation damage
Reactive metal
red water
reducing agent
reducing atmosphere
repaint
re-paint
ringworm
rot
rust
saline water
Salt
sand
scale
scaling
scrape
SHEET METAL
SHEET MT
SHEET/M
SHEETMETAL
SHOTPEEN
SHOTPN
SHT METAL
SHT METL
SHTPEEN
sigma phase
sodium bicarbonate
sodium chloride
sohic
solder
solvent
spalling
specialty steel
spotting
stray current
stress
F-6

Key Corrosion Words
strip surface preparation undercutting
substrate surfacer underfilm
Sulfate-reducing bact surfactant weld
sulfidation threshold stress wrinkling
sulfide Tuberculation
surface active agent tungesten arc
F-7

F-8 F-8

Appendix G Mapping Work Unit Codes to Work Breakdown Structure and Parts and Structure
The Air Force’s work unit code (WUC) convention is a more descriptive conven-tion than the DoD Financial Management Regulation work breakdown structure (WBS). Therefore, we used the 2-character WUC, as outlined in Table G-1, and the 5-character WUC, as outlined in Table G-2, to describe Air Force aircraft and missile subsystems that required maintenance. We provided the first two charac-ters of the WUC, which provide the system code, or the entire five characters of the WUC when specifically matched. We then mapped each WUC to a part or structure. By definition, the only WUC recognized as “structure” is WUC: 11, airframe. We further mapped the WUC to the WBS, which is the DoD Financial Management Regulation convention used in many other reports.
Table G-1. Mapping 2-Character WUC to WBS and Parts and Structure Classification
2-char. WUC WUC description
Mapping to 3rd digit of WBS code
Part or structure
11 Airframe 1 Structure
12 Furnishings/compartments 3 Part
13 Alighting/launching system 3 Part
14 Directional flight 4 Part
15 Rotary wings 3 Part
17 Escape systems 3 Part
18 Training equipment flight characteristics/force generating equipment 6 Part
19 Training equipment visual/aural systems 6 Part
21 Reciprocating engine or radial type 2 Part
22 Turboshaft/turboprop engines 2 Part
23 Turbojet engines 2 Part
24 Auxiliary power systems 2 Part
25 Propulsion systems 2 Part
26 Vertical takeoff and landing/short takeoff and landing transmissions/drives
3 Part
27 Turbofan engines 2 Part
29 Power plant installation 2 Part 32 Propellers 3 Part
36 Ducted fans 3 Part
41 Environmental control/pneumatic systems 3 Part
G-1

Table G-1. Mapping 2-Character WUC to WBS and Parts and Structure Classification
2-char. WUC WUC description
Mapping to 3rd digit of WBS code
Part or structure
42 Electrical power supply/distribution/lighting systems 4 Part
44 Electrical Lighting Systems- 4 Part
45 Hydraulic systems 3 Part
46 Fuel systems 3 Part
47 Oxygen systems 3 Part
48 Ice and rain removal/protection systems 3 Part
49 Miscellaneous emergency/utility systems 3 Part
50 Cockpit management systems 4 Part
51 Instrumentation systems 4 Part
52 Autopilot systems 1 Part
53 Drone guidance systems 4 Part
54 Telemetry systems 4 Part
55 Vehicle Management System 4 Part
56 Flight reference systems 4 Part
57 Integrated guidance and flight control systems 4 Part
58 In-flight test/malfunction analysis and recording equipment 4 Part
59 Target scoring and augmentation systems 5 Part
61 HF communications systems 4 Part
62 VHF communications systems 4 Part
63 UHF communications systems 4 Part
64 Interphone systems-Inter-crew 4 Part
65 Identification Friend or Foe (IFF) systems 4 Part
66 Emergency radio systems 4 Part
67 COMM/NAV/IFF (CNI) 4 Part
69 Miscellaneous communications systems 4 Part
71 Radio navigation systems 4 Part
72 Radar navigation systems 4 Part
73 Bombing navigation systems 5 Part
74 Weapons control systems 5 Part
75 Weapon delivery systems 5 Part
76 Countermeasures systems 7 Part
77 Photographic/reconnaissance systems 7 Part
78 Training equipment instrumentation/communication systems 6 Part 79 Training equipment navigation, weapons delivery, ECM, and
reconnaissance systems 6 Part
83 Airborne expendable ordnance 5 Part
85 Airborne weapon containers 5 Part
91 Emergency equipment 3 Part
92 Tow target/towed mine countermeasures systems 6 Part
G-2

Mapping Work Unit Codes to Work Breakdown Structure and Parts and Structure
Table G-1. Mapping 2-Character WUC to WBS and Parts and Structure Classification
2-char. WUC WUC description
Mapping to 3rd digit of WBS code
Part or structure
93 Deceleration/drag chute 3 Part
94 Meteorological equipment systems and equipment 3 Part
95 Integrated Processor System 3 Part
96 Personnel equipment 6 Part
97 Explosive devices 5 Part
99 Training equipment general 6 Part
Table G-2. Mapping 5-Character WUC to WBS and Parts and Structure Classification
5-char. WUC WUC description
Mapping to 3rd digit of WBS code
Part or structure
01000 Ground handling, servicing, and related tasks 7 Part
02000 Equipment and facility cleaning 1 Structure
03000 Scheduled inspection or maintenance 1 Structure
03100 Preflight inspection 1 Structure
03101 End of Runway Check 1 Structure
03102 Inspection, stress component installation 1 Structure
03107 7 day interval 1 Structure
03111 Service inspection 1 Structure
03112 6 month Acceptance 1 Structure
03113 Annual Incoming (entering shop) 1 Structure
03114 14 day 1 Structure
03115 Shipping Final 1 Structure
0311K Armament 5 Part
0311L Shelter Maintenance 6 Part
0311M Ramjet 2 Part
0311N Missile Maintenance F00 Structure
0311P Missile Interface Unit F00 Structure
0311R Fueling 0 Part
0311S Dissassembly 3 Part
0311T SMATE 7 Part
0311U IMSOC 7 Part
03121 21 day 1 Structure
03128 21 day interval 1 Structure
03130 In-storage inspection 1 Structure
03142 42 day 1 Structure
03156 56 day 1 Structure
G-3
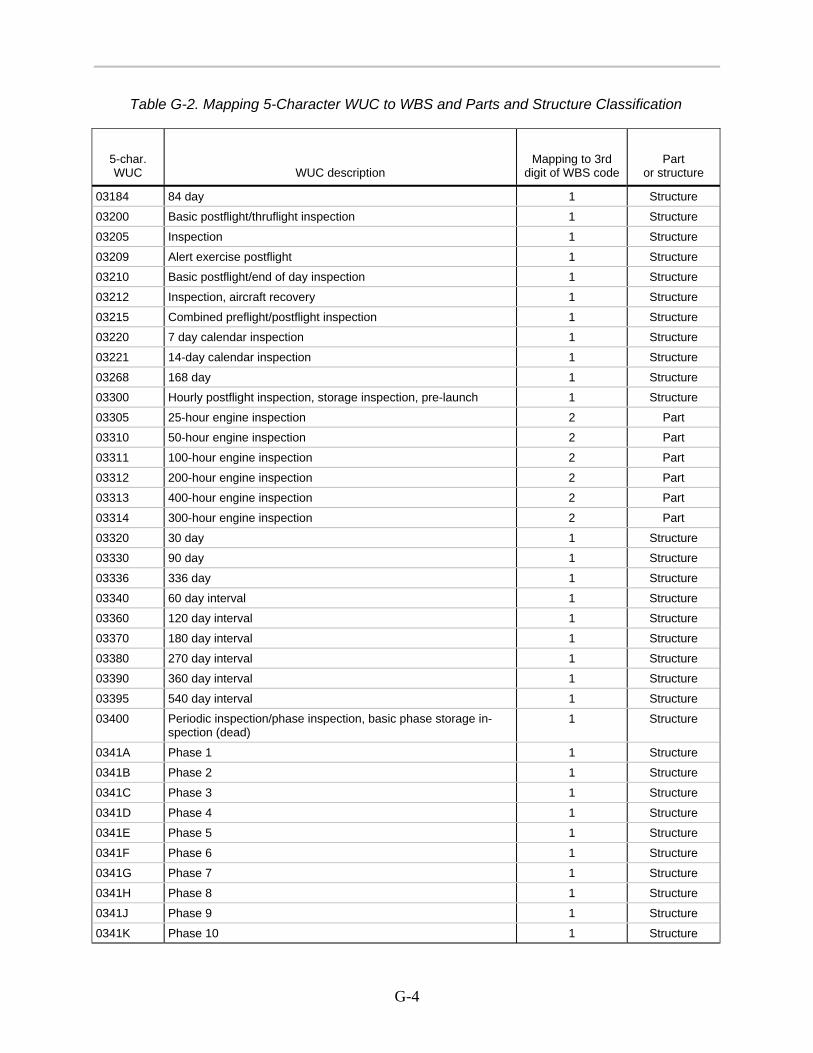
Table G-2. Mapping 5-Character WUC to WBS and Parts and Structure Classification
5-char. WUC WUC description
Mapping to 3rd digit of WBS code
Part or structure
03184 84 day 1 Structure
03200 Basic postflight/thruflight inspection 1 Structure
03205 Inspection 1 Structure
03209 Alert exercise postflight 1 Structure
03210 Basic postflight/end of day inspection 1 Structure
03212 Inspection, aircraft recovery 1 Structure
03215 Combined preflight/postflight inspection 1 Structure
03220 7 day calendar inspection 1 Structure
03221 14-day calendar inspection 1 Structure
03268 168 day 1 Structure
03300 Hourly postflight inspection, storage inspection, pre-launch 1 Structure
03305 25-hour engine inspection 2 Part
03310 50-hour engine inspection 2 Part
03311 100-hour engine inspection 2 Part
03312 200-hour engine inspection 2 Part
03313 400-hour engine inspection 2 Part
03314 300-hour engine inspection 2 Part
03320 30 day 1 Structure
03330 90 day 1 Structure
03336 336 day 1 Structure
03340 60 day interval 1 Structure
03360 120 day interval 1 Structure
03370 180 day interval 1 Structure
03380 270 day interval 1 Structure
03390 360 day interval 1 Structure
03395 540 day interval 1 Structure
03400 Periodic inspection/phase inspection, basic phase storage in-spection (dead)
1 Structure
0341A Phase 1 1 Structure
0341B Phase 2 1 Structure
0341C Phase 3 1 Structure
0341D Phase 4 1 Structure
0341E Phase 5 1 Structure
0341F Phase 6 1 Structure
0341G Phase 7 1 Structure
0341H Phase 8 1 Structure
0341J Phase 9 1 Structure
0341K Phase 10 1 Structure
G-4

Mapping Work Unit Codes to Work Breakdown Structure and Parts and Structure
Table G-2. Mapping 5-Character WUC to WBS and Parts and Structure Classification
5-char. WUC WUC description
Mapping to 3rd digit of WBS code
Part or structure
0341L Phase 11 1 Structure
0341M Phase 12 1 Structure
0341N Phase 13 1 Structure
0341P Phase 14 1 Structure
0341Q Phase 15 1 Structure
0341R Phase 16 1 Structure
0341S Phase 17 1 Structure
0341T Phase 18 1 Structure
0341U Phase 19 1 Structure
0341V Phase 20 1 Structure
0341W Phase 21 1 Structure
0341X Phase 22 1 Structure
0341Y Phase 23 1 Structure
0341Z Phase 24 1 Structure
0342A Phase 25 1 Structure
0342B Phase 26 1 Structure
03510 15 day 1 Structure
03580 Armament test equipment 5 Part
03596 720 day/2 year 1 Structure
03597 900 day 1 Structure
03600 Look phase of programmed depot maintenance (PDM) 1 Structure
03610 Fix phase of isochronal inspection, status reporting only 1 Structure
03700 Storage 1 Structure
03710 Major inspection 1 Structure
03720 Minor inspection 1 Structure
03730 Home station check 1 Structure
03750 Cannibalization Aircraft (Status reporting only) 3 Part
03755 Cannibalization Recovery (Status reporting only) 3 Part
03800 Re-entry vehicle recycle 3 Part
03802 Re-entry vehicle recycle for higher headquarters evaluation 3 Part
03803 Re-entry vehicle recycle for time compliance technical order (TCTO)
3 Part
03804 Re-entry vehicle for limited life component/technical critical item (LLC/TCI) replacement
0 Part
03806 Disassembly for operational test/follow-on operational test (OT/FOT)
3 Part
03900 Scheduled depot maintenance for time or operational limits (no other defects)
0 Part
03999 Scheduled inspections, not otherwise coded 1 Structure
G-5

Table G-2. Mapping 5-Character WUC to WBS and Parts and Structure Classification
5-char. WUC WUC description
Mapping to 3rd digit of WBS code
Part or structure
04000 Special Inspections 1 Structure
04100 Missile and pylon, Special modification inspection 5 Part
04101 Foreign Object (FO) Search 3 Part
04110 Hard landing 3 Part
04111 Special modification inspection 3 Part
04112 Acceptance inspection 3 Part
04113 After fire inspection 3 Part
04114 Excessive “G” load inspection 3 Part
04115 Functional taxi check; After operational use; Special inspection-special event inspection requirements
3 Part
04116 Aircraft accident/incident check; Functional Test 3 Part
04117 Battery capacity/specific gravity check; Lot number 3 Part
04118 Compass swing check; Date of manufacture 3 Part
04119 Oil/fuel tank sumps drained inspection; Corrosion control inspec-tion; Special inspections NOC; Corrosion control inspection (use if accomplished separately from a scheduled inspection)
3 Part
0411A Climatization (includes preparation for Arctic, desert, or tropical operation); Quality Control
3 Part
0411B Nondestructive inspection accomplished separately from sched-uled inspection
3 Part
0411C Hydraulic system contamination check 3 Part
0411D Oil sampling for spectrometric analysis; Receiving Inspection 3 Part
0411E Rough field mission check; Pre-issue inspection 3 Part
0411H Fuel components contamination check 2 Part
0411J Operationally ready inspection (ORI) 3 Part
0411K Ground inspection 1 Structure
04120 Calendar; Damage inspection; Missile/shelter reset 3 Part
04121 Hand landing inspection 3 Part
04122 Landing gear retraction check 3 Part
04123 Wheel/brake inspection 3 Part
04124 Pitot-static purge/check 3 Part
04125 Oxygen system components check 3 Part
04126 Missile pylon/launcher simulator check 5 Part
04127 Missile under the wing/integrated systems check 5 Part
04128 Fire control and AWCS system checks 5 Part
04129 Bombing-navigation-communications system checks 5 Part
0412A Seat/ejection seat or emergency egress system check 3 Part
0412B Auxiliary power plant inspection 2 Part
0412C Integrated electronics system check 4 Part
G-6

Mapping Work Unit Codes to Work Breakdown Structure and Parts and Structure
Table G-2. Mapping 5-Character WUC to WBS and Parts and Structure Classification
5-char. WUC WUC description
Mapping to 3rd digit of WBS code
Part or structure
0412D Armament 25 hour inspection 5 Part
0412E Severe turbulence inspection 3 Part
0412F Calibration of airborne weapon control system (AWCS) 5 Part
0412G Weapon suspension system inspection 5 Part
0412H Remote compass check 3 Part
0412J Aircraft fuselage section inspection 1 Structure
0412L Missile simulated launch check 5 Part
0412M Mal 45 day inspection 3 Part
0412N Mal 90 day inspection 3 Part
0412P Inspection, overweight landing 3 Part
0412Q Inspection, landing GR/DR overspeed 3 Part
04130 Modification; Pressure check, air bottle; Special modification inspection
3 Part
04131 Engine or cylinder change inspection (includes pre-oil) 2 Part
04132 Hot start or overspeeding inspection 2 Part
04133 Valve check 2 Part
04134 Compression check 2 Part
04135 Propeller shaft due check 2 Part
04136 Engine or ignition analyzer check 2 Part
04137 Engine conditioning (scheduled) 2 Part
04138 Minor engine conditioning (unscheduled) 2 Part
04139 Engine trim check 2 Part
0413A Propeller oil control assembly and dome flushing check 2 Part
0413B Engine hot section inspection 2 Part
0413C Engine air inlet inspection; Insp, L/R Inlet bleed & bypass ple-num; Insp, acft engine inlet/exhaust inspection
2 Part
0413E Cylinder borescope inspection/engine compression borescope inspection
2 Part
0413F Engine valve decarbonization inspeciton 2 Part
0413H Retorque of propeller components following engine or propeller change
2 Part
0413J Exhaust gas temperature (Jet Cal) calibration 2 Part
0413K Engine ramp system functional check 2 Part
0413L By pass bellmouth functional check 2 Part
0413M Bleed air system pressure loss test check 2 Part
0413N Engine oil screen inspection/oil strainer inspection 2 Part
0413P Engine stall/flameout check 2 Part
04140 Cabin pressurization/leak test 3 Part
G-7

Table G-2. Mapping 5-Character WUC to WBS and Parts and Structure Classification
5-char. WUC WUC description
Mapping to 3rd digit of WBS code
Part or structure
04141 Corrosion control inspections accomplished separately from scheduled inspections
3 Part
04142 Engine bay inspection-engine removed 3 Part
04143 Air conditioning system check 3 Part
04144 Post maintenance check (PMC) of fuel gages 3 Part
04145 Transformer rectifier (T/R) unit capacitor check for electrolyte leakage/corrosion
3 Part
04147 Penetration aids confidence/self test 3 Part
04149 Integral weight and balance check (C130) 3 Part
04150 Weight and balance (includes weighing); Transfer; Return to storage area
3 Part
04151 Emergency equipment (includes life raft, first aid kits, emergency radio, etc.)
6 Part
04152 Inspection of seat belts and all harnesses 3 Part
0415A Datscal 7 Part
0415B ALE-20 system check prior to flare loading (B-52) 6 Part
0415C AWM-13 stray voltage check 3 Part
04160 Rotor overspeed inspection; Non-tactical instrumentation; Non-tactical instrumentation
2 Part
04161 Powertrain over torque inspection (helicopters) 2 Part
04162 Vibration analysis (helicopters) 3 Part
04163 Transmission interval (oil filter inspection, helicopters) 3 Part
04170 Equipment inventory; Cold weather 1 Structure
04180 Checks requiring special checkout equipment; Combined sys-tems checkout
3 Part
04181 Airborne WSEM rail checkout 3 Part
04182 Harmonization of sights, guns and cameras (fire control, bomb-nav and photo systems)
5 Part
04184 Partial AGM-28 combined systems checkout 5 Part
04185 Squib continuity and corrosion check 1 Structure
04186 Inspection of guns and feeder mechanisms 5 Part
04187 Quantity indicating system(s) calibration 3 Part
04188 Flight director group operational check 3 Part
04189 Maximum effort stop/high energy braking inspection 3 Part
0418A Air data computer and associated pitot and static instruments leak check
3 Part
0418B Overheat and fire warning system inspection 3 Part
0418C Refueling boom-probe-drogue-special inspection 3 Part
0418D SRAM system interface check (B-52) 3 Part
0418E SRAM CAE checkout (B-52) 3 Part
G-8

Mapping Work Unit Codes to Work Breakdown Structure and Parts and Structure
Table G-2. Mapping 5-Character WUC to WBS and Parts and Structure Classification
5-char. WUC WUC description
Mapping to 3rd digit of WBS code
Part or structure
0418F Aero 27 900 hour inspection 2 Part
04190 Sudden stoppage inspection 2 Part
04199 Special inspection, not otherwise coded 3 Part
04200 Unscheduled periodic inspection 3 Part
04210 Functional check flight 3 Part
04221 Corrosion inspection phase I (KC-135 and B-52) 3 Part
04222 Corrosion inspection phase II (KC-135 and B-52) 3 Part
04227 Controlled interval extension (CIE) inspection accomplished separately from scheduled inspections
3 Part
04228 MAU 12 bomb ejector rack inspections 5 Part
04270 Partial combined systems checkout 3 Part
04280 Checks requiring special checkout equipment 3 Part
04310 Receiving inspection 3 Part
04311 Uncrating 1 Structure
04313 Stray voltage check 3 Part
04314 Blown fuse/squib or parameter activated 3 Part
04315 Purging 3 Part
04316 Assembly 3 Part
04317 Disassembly 3 Part
04320 Hangfire 5 Part
04321 Misfire 5 Part
04322 30 day on aircraft 3 Part
04324 Moisture 3 Part
04325 Desiccant container 3 Part
04326 Dust cover plug 3 Part
04327 DPM-14 checkout 3 Part
04330 Extreme temperature 3 Part
04340 Load/unload 3 Part
04341 Whenever sealing sleeve is removed 3 Part
04342 Abort 3 Part
04343 When chassis #5 or frequency converter is replaced 3 Part
04344 Whenever warhead safe arm device or fuse is removed from missile
F00 Structure
04345 Whenever rocket motor is removed from missile F00 Structure
04346 Whenever power plant is removed from missile F00 Structure
04347 Whenever access covers are removed from WSEM or missile F00 Structure
04348 Incident/accident 0 Part
04349 When hydraulic or electrical connections are disconnected 4 Part
G-9
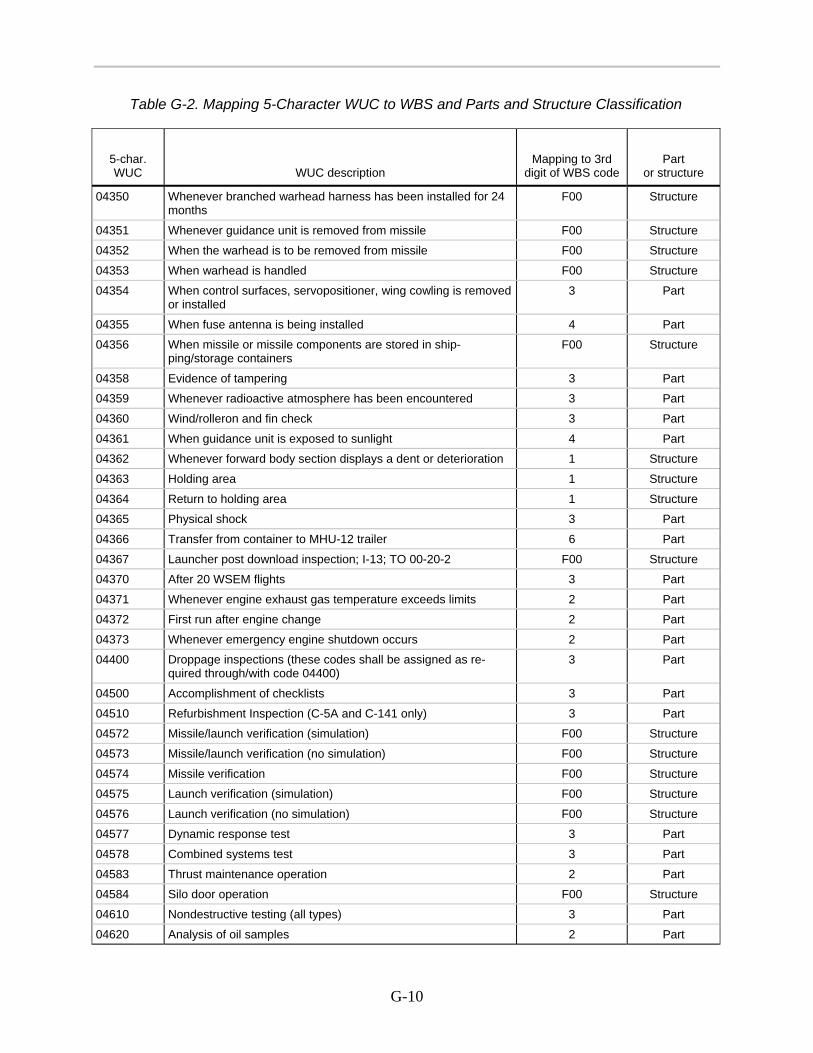
Table G-2. Mapping 5-Character WUC to WBS and Parts and Structure Classification
5-char. WUC WUC description
Mapping to 3rd digit of WBS code
Part or structure
04350 Whenever branched warhead harness has been installed for 24 months
F00 Structure
04351 Whenever guidance unit is removed from missile F00 Structure
04352 When the warhead is to be removed from missile F00 Structure
04353 When warhead is handled F00 Structure
04354 When control surfaces, servopositioner, wing cowling is removed or installed
3 Part
04355 When fuse antenna is being installed 4 Part
04356 When missile or missile components are stored in ship-ping/storage containers
F00 Structure
04358 Evidence of tampering 3 Part
04359 Whenever radioactive atmosphere has been encountered 3 Part
04360 Wind/rolleron and fin check 3 Part
04361 When guidance unit is exposed to sunlight 4 Part
04362 Whenever forward body section displays a dent or deterioration 1 Structure
04363 Holding area 1 Structure
04364 Return to holding area 1 Structure
04365 Physical shock 3 Part
04366 Transfer from container to MHU-12 trailer 6 Part
04367 Launcher post download inspection; I-13; TO 00-20-2 F00 Structure
04370 After 20 WSEM flights 3 Part
04371 Whenever engine exhaust gas temperature exceeds limits 2 Part
04372 First run after engine change 2 Part
04373 Whenever emergency engine shutdown occurs 2 Part
04400 Droppage inspections (these codes shall be assigned as re-quired through/with code 04400)
3 Part
04500 Accomplishment of checklists 3 Part
04510 Refurbishment Inspection (C-5A and C-141 only) 3 Part
04572 Missile/launch verification (simulation) F00 Structure
04573 Missile/launch verification (no simulation) F00 Structure
04574 Missile verification F00 Structure
04575 Launch verification (simulation) F00 Structure
04576 Launch verification (no simulation) F00 Structure
04577 Dynamic response test 3 Part
04578 Combined systems test 3 Part
04583 Thrust maintenance operation 2 Part
04584 Silo door operation F00 Structure
04610 Nondestructive testing (all types) 3 Part
04620 Analysis of oil samples 2 Part
G-10
Mapping Work Unit Codes to Work Breakdown Structure and Parts and Structure
Table G-2. Mapping 5-Character WUC to WBS and Parts and Structure Classification
5-char. WUC WUC description
Mapping to 3rd digit of WBS code
Part or structure
04630 Research and development of new or revised nondestructive inspection techniques
3 Part
04650 Initial build-up-recovery vehicle (RV) 6 Part
04660 Program, re-program, load, re-load, keying, re-keying, of soft-ware or keys.
3 Part
04999 Special inspections not otherwise coded 3 Part
04MD4 Mode 4 transponder functional check 3 Part
05000 Preservation, de-preservation and storage of equipment 3 Part
06000 Ground safety 7 Part
07000 Preparation and maintenance of records 7 Part
08000 Special Purpose 7 Part
09000 Shop support general code; Fabricate; Stenciling/painting; Test-ing and servicing fire extinguishers
6 Part
G-11

G-12

Appendix H Field-Level Corrosion Profile
As part of our analysis, we administered a corrosion survey to mechanics from multiple aviation units. Aviation mechanics from Air Force operational units re-sponded to our survey and estimated the amount of corrosion maintenance they per-form that involves malfunction (MAL) codes from this list. The list of 65 MAL codes was assembled by a team of LMI subject matter experts who worked in aviation maintenance or had similar experience. We received more than 100 responses from aviation mechanics (rotary and fixed wing).
We asked mechanics to estimate the corrosion percentages for each MAL code and WUC based on a simple set of percentages and their corresponding relation-ship to corrosion maintenance: 0 percent (never), 10 percent (rarely), 25 percent (sometimes), 50 (half the time), 75 percent (most of the time), and 100 percent (always). We used the arithmetic mode (highest frequency) to represent the per-centage of maintenance performed due to corrosion for each representative MAL code and WUC.
We used these results to establish our field-level corrosion profile (Table H-1), which is used in both field- and depot-level corrosion analyses, as explained in Chapter 2.
Table H-1. Field-Level Corrosion Profile
Avg. percentage of maint. time spent on system due to
corrosion
Malfunction codes (MAL) MAL description
10 001 Faulty Tube, Transistor, or Integrated Circuit
10 006 Contacts, Connectors or Connective Devices
25 020 Cut, Worn, Chaffed, Frayed, or Torn
10 045 Battery Replaced, No Other Fault
25 070 Broken
25 105 Loose, Damaged, or Missing Hardware (nuts, bolts, screws, clamps, safety-wire, etc.)
10 111 Burst or Ruptured
25 135 Binding, Stuck, or Jammed
10 136 Damaged,/Cracked Fan Stator Case
10 137 Damaged/Cracked Fan Stator Vanes
10 138 Fan Blade Damage
10 139 Cracked or Warped Inlet Guide
0 140 Frozen Fan
0 141 Compressor Case Failure or Excessive Air Leakage
H-1
Table H-1. Field-Level Corrosion Profile
Avg. percentage of maint. time spent on system due to
corrosion
Malfunction codes (MAL) MAL description
0 143 Damaged/Cracked Compressor Case
0 144 Compressor Rotor Change (other than FOD)
10 145 Cracked Diffuser Cases
0 147 Combustion Damage
10 148 Damaged/Cracked Turbine Frame/Case (Burned Through)
0 153 Turbine Damage Due to Material Failure
10 155 Engine to A/C Mount Failure
10 156 Afterburner or Augmentor Problem Repair
0 157 Thrust Reversor System Failure
10 158 Accessory Drive Gear box Failures (include turboprop gearbox) (Worn Splines)
0 159 Internal Reduction Gear Failure
0 160 Bearing and/or Support Failure
0 161 Bearing Failure (causing rotor shift/seizure)
0 162 Scavenger Pump Failure (Includes turboprop gearbox)
0 164 Propeller Brake Failed (Turboprop)
0 165 Power Section Failure (Turboprop)
0 166 Reduction Gear Box Failure (Turboprop)
10 169 Voltage Incorrect
100 170 Corroded Mild/Moderate
0 171 Impeller or Inducer Damage (Recip only)
0 173 Turbo Supercharger Failure (Induction System Contaminated with metal from Turbo) (Recip only)
0 178 Condition Monitoring-Vibration Trend
0 179 Condition Monitoring-Exhaust Pressure Ratio (EPR) Trend
0 180 Condition Monitoring-Adverse Oil Consumption Trend
0 181 Condition Monitoring-Adverse Fuel Flow Trend
0 182 Condition Monitoring- Performance Trend Indicates Compressor Section Deterio-ration or Damage
0 183 Condition Monitoring-Performance Trend Indicates Combustion Section Deterio-ration or Damage
0 184 Condition Monitoring-Performance Trend Indicates Turbine Section Deterioration or Damage
0 185 Condition Monitoring-Performance Trend Indicates Accessory Section Deteriora-tion
0 186 Condition Monitoring-Removed for further test cell diagnostic Check
0 187 Condition Monitoring-Borescope Indicates Compressor Section Deterioration
0 188 Condition Monitoring- Borescope Indicates Combustion Section Deterioration
0 189 Condition Monitoring-Borescope Indicates Turbine Section Deterioration
50 190 Cracked
H-2

Field-Level Corrosion Profile
Table H-1. Field-Level Corrosion Profile
Avg. percentage of maint. time spent on system due to
corrosion
Malfunction codes (MAL) MAL description
10 196 Excessive Oil From Breather, or High Sump Pressure
10 197 Fuel Leakage
0 198 Contaminated Fuel
0 199 High or Low Oil Consumption
10 200 Oil Leakage
0 201 Contaminated Oil
0 202 Low Oil Pressure
0 203 High Oil Pressure
0 208 Augmentor Nozzle Mechanism Deterioration
100 211 Corroded Internal Surfaces
100 212 Corroded External Surfaces
0 217 Oil in Induction System or Compressor Section (Recip Only)
0 219 Internal Failure (Recip Only)
0 221 Will Not Carry Load (APU)
0 223 Control System Component Malfunction
0 225 Bleed Air Malfunction
10 230 Dirty, Contaminated, or Saturated by Foreign Material
0 242 Failed to Operate - Specific Reason Unknown
0 277 Fuel Nozzle/Oil Line Coking
10 279 Spray Pattern Defective
0 290 Fails Diagnostic/Automatic Test
10 305 Equipment or Material Physically Damaged
10 306 Equipment or Material Physically Failed
10 307 Composite Material Defective
10 309 Electrical Measurement Incorrect
10 311 Damaged or Defective Component (Bulb, Transistor, Integrated Circuit, Fuse, etc.)
10 312 Degraded System Performance
10 350 Insulation Breakdown
0 372 Metal in Sump/Screen or on MAG Plug
10 377 Leaking - Class A - Slow Seep (TO 1-1-3)
10 378 Leaking - Class B - Seep (TO 1-1-3)
10 379 Leaking - Class C - Heavy Seep (TO 1-1-3)
10 380 Leaking - Class D - Running Leak (TO 1-1-3)
10 381 Leaking Internal or External
0 383 Lock on Malfunction
10 410 Lack of, or Improper Lubrication
50 425 Pitted, Nicked, Chipped, Scored, Scratched or Crazed
H-3

Table H-1. Field-Level Corrosion Profile
Avg. percentage of maint. time spent on system due to
corrosion
Malfunction codes (MAL) MAL description
0 458 Out of Balance
10 472 Fuse Blown or Defective Circuit Panel/Breaker
0 475 Inability to Start, Ground or Air
0 484 Blade Shingling
0 553 Does not Meet Specifications, Drawing, or Other Conformance Requirements (Use w/ "when Discovered" code Y).
0 561 Unable to Adjust to Limits
10 567 Resistance Incorrect
10 602 Failed or Damaged Due to Malfunction of Associated Equipment
10 615 Shorted
10 622 Wet/Condensation
0 625 Gating Incorrect
0 626 Inductance Incorrect
0 631 Gyro Bias Voltage Incorrect
0 644 Built-in Test (BIT) Indicated Fault
100 667 Corroded Severe
0 669 Potting Material Melting (Reversion Process)
0 672 Built In Test (BIT) False Alarm
0 673 Bit Fault Indicator Failure
0 676 Bit Fault Not Duplicated on Ground, Parameters Do Not Confirm Fault
0 680 Failure Caused by Manufacturer Deficiency
10 689 Conductive Path Defect/Failure
0 691 Video Out of Focus
0 692 Video Faulty
0 693 Audio Faulty
0 694 Weak Video
10 710 Bearing Failure or Faulty
0 718 Improper Response to Mechanical Input
0 721 Improper Response to Electrical Input
10 754 Fairing Compound Missing/Defective
10 755 Gap Filler Missing/Defective
0 756 Blade Seals Missing/Defective
50 757 Outer Mold Line (OML) Paint, Coating Missing/Defective
10 780 Bent, Buckled, Collapsed, Dented, Distorted, or Twisted
0 782 Tire Tread Area Defective
10 783 Tire Sidewall Damaged or Defective
10 784 Tire Bead Area Damaged or Defective
10 785 Tire Inside Surface Damaged or Defective
H-4

Field-Level Corrosion Profile
Table H-1. Field-Level Corrosion Profile
Avg. percentage of maint. time spent on system due to
corrosion
Malfunction codes (MAL) MAL description
0 816 Impedance Incorrect
10 842 Voids, (Composites Structure)
10 843 Unbonded Defects in Bonded Joint (All Sturctures)
10 844 Hole Wear, Out of Round (Composite Structure)
25 846 Delaminated; Separation of Laminated Layers (Composite Structrure)
10 847 Abrasions, Erosion, Pits (Composites)
10 848 Missing and Loose Fibers (Composites)
10 849 Chemical Imbalance (Composites)
75 865 Deteriorated (For Protective Coating/Sealing Defective, Use With Action Code Z)
0 867 Transfer Time Limit (TO2-1-18)
0 868 Removed/Rolled Back for Failed External Engine Component Reinstalled in Same Aircraft
0 870 Removal for Research, Test, or Diagnostic Event
10 872 Removal During Aircraft Programmed Depot Maintenance
10 874 Storage Damage or Deterioration
10 878 Removal to perform scheduled/special inspection (PE,HSI, etc., -TO- directed
10 881 Removal to Perform Minor Inspection (Borescope - TO-directed
10 917 Impending Failure or Latent Defect Indicated by NDI
0 932 Does Not Engage, Lock, or Unlock Correctly
0 956 Computer Equipment Malfunction
0 962 Low Power (Electrical)
10 972 Damaged Probe
0 982 Frozen Tuning Mechanism
0 988 Loss of Vacuum
0 989 Low Coolant Flow Rate
0 995 EMP Protection Material Defective
25 996 Radar Absorption Material Defective
H-5

H-6
Appendix I Air Force Survey Results
We created a short multiple-choice survey to gather the information we needed in our Air Force corrosion cost data. The survey was distributed on the Air Force Knowledge Now website and the Air Force Portal website. We received a total of 797 responses.
We used the following information from this survey:
The number of hours per day that personnel with a non-maintenance oc-cupation specialty spend on aircraft maintenance
The number of hours per day that personnel with a non-maintenance oc-cupation specialty spend on aircraft corrosion maintenance
The percentage of time split between preventive and corrective corrosion maintenance
The pay grade of the non-maintenance specialty aviation operators who are performing maintenance.
Table I-1 summarizes the results of the 797 survey responses from Air Force re-spondents.
I-1

Table I-1. Air Force Survey Results
Q1 Were you in the past, or are you currently, an aircraft operator? 19% Yes 81% No
Q2 I am a: 36% Member of the active duty military 20% Member of the National Guard 9% Member of the Military Reserve 24% Civilian government employee 11% Contractor
Q3 My primary skill specialty (MOS) is a maintenance category: 31% Yes 69% No
Q4 The level of maintenance I perform is: 18% Organizational (maintenance at unit that owns the aviation asset) 9% Intermediate (direct or general support) 5% Depot 68% Not applicable
Q5 My aircraft is flown: 37% 1–2 times per week 22% 3–4 times per week 14% 5–6 times per week 6% 7–8 times per week 21% More than 8 times per week
Q6 My pay grade is: 0% E-1 0% E-2 1% E-3 3% E-4 12% E-5 16% E-6 27% E-7 through E-9 17% Officer 0% Warrant Officer 24% Other
I-2

Air Force Survey Results
Table I-1. Air Force Survey Results
Q7 In my opinion, over the last year I spent the following hours per workday, on average, performing ANY FORM of aircraft maintenance:
62% Zero hours per workday 5% 0–1 hours per workday 3% 1–2 hours per workday 2% 2–3 hours per workday 2% 3–4 hours per workday 3% 4–5 hours per workday 3% 5–6 hours per workday 3% 6–7 hours per workday 5% 7–8 hours per workday 12% More than 8 hours per workday
Q8 In my opinion, over the last year I spent the following hours per workday, on average, performing CORROSION aircraft maintenance:
68% Zero hours per workday 10% 0–1 hours per workday 9% 1–2 hours per workday 3% 2–3 hours per workday 1% 3–4 hours per workday 2% 4–5 hours per workday 1% 5–6 hours per workday 0% 6–7 hours per workday 2% 7–8 hours per workday 4% More than 8 hours per workday
Q9 For the time I spent performing CORROSION maintenance over the last year, I would divide my time between PREVENTIVE corrosion maintenance and CORRECTIVE corrosion maintenance as follows:
3% 0% preventive and 100% corrective 3% 10% preventive and 90% corrective 8% 20% preventive and 80% corrective 5% 30% preventive and 70% corrective 6% 40% preventive and 60% corrective 23% 50% preventive and 50% corrective 4% 60% preventive and 40% corrective 9% 70% preventive and 30% corrective 13% 80% preventive and 20% corrective 17% 90% preventive and 10% corrective 10% 100% preventive and 0% corrective
I-3

Table I-1. Air Force Survey Results
Q10 What percent of PREVENTIVE corrosion work is reported in an organizational maintenance system such as REMIS (Reliability and Maintainability Information System) or equivalent? Note: only asked of those who answered that they per-form organizational maintenance to question #4.
63% 0% to 20% 10% 20% to 40% 10% 40% to 60% 5% 60% to 80% 12% 80% to 100%
Q11 What percent of CORRECTIVE corrosion work is reported in an organizational maintenance system such as REMIS (Reliability and Maintainability Information System) or equivalent? Note: only asked of those who answered that they per-form organizational maintenance to question #4.
56% 0% to 20% 11% 20% to 40% 9% 40% to 60% 7% 60% to 80% 17% 80% to 100%
Q12 What percent of corrosion work (CORRECTIVE or PREVENTIVE) is performed on aircraft structure (Basic Aircraft–Hull and/or Body Frame) as compared to removable parts? Note: only asked of those who answered that they perform organizational maintenance to question #4.
55% 0% to 20% 13% 20% to 40% 16% 40% to 60% 10% 60% to 80% 6% 80% to 100%
I-4

Appendix J Abbreviations
AFCPCO Air Force Corrosion Prevention and Control Office
AFMC Air Force Materiel Command
AFRL Air Force Research Laboratory
ALC air logistic center
CIRF centralized intermediate repair facilities
CPC corrosion prevention compound
CPC IPT Corrosion Prevention and Control Integrated Product Team
DLM depot-level maintenance
DMAPS Defense Maintenance Accounting and Production System
DMCS Depot Maintenance Cost System
DMDC Defense Management Data Center
DMMSS Depot Maintenance Material Support System
FASAB Federal Accounting Standards and Advisory Board
FLM field-level maintenance
GAO Government Accountability Office
HQ USAF Head Quarters U.S. Air Force
ICBM Intercontinental Ballistic Missile
JON job order number
JOPMS Job Order Production Management System
LRU line replaceable units
MAJCOM major command
MAL malfunction code
MCC merchant category code
MDS mission design series
OC-ALC Oklahoma City Air Logistics Center
ONR outside normal reporting
OO-ALC Ogden Air Logistics Center
PDMSS Pro-gram Depot Maintenance Schedule System
J-1

PDS HQ USAF Program Data System
R&D research and development
RCC resource cost center
RDT&E research, development, testing, and evaluation
REMIS Reliability and Maintainability Information System
ROI return on investment
USAF U.S. Air Force
VTOL/STOL vertical takeoff and landing/short takeoff and landing
WBS work breakdown structure
WCC work center code
WR-ALC Warner Robins Air Logistics Center
WUC work unit code
J-2