the antares optical module - cds.cern.chcds.cern.ch/record/571692/files/0112172.pdf · n. de...
TRANSCRIPT

The ANTARES Optical Module
The ANTARES Collaboration
P. Amram p, M. Anghinolfi h, S. Anvar d, F.E. Ardellier-Desages d,E. Aslanides b, J-J. Aubert b, R. Azoulay d, D. Bailey s, S. Basa b,
M. Battaglieri h, R. Bellotti e, Y. Benhammou j, F. Bernard b, R. Berthier d,V. Bertin b, M. Billault b, R. Blaes j, R.W. Bland d, F. Blondeau d,
N. de Botton d,s, J. Boulesteix p, C.B. Brooks s, J. Brunner b, F. Cafagna e,A. Calzas b, A. Capone i, L. Caponetto g, C. Carloganu q, E. Carmona k,J. Carr b, P-H. Carton d, S.L. Cartwright t, F. Cassol b, S. Cecchini f,r,
F. Ciacio e, M. Circella e, C. Compere `, S. Cooper s, P. Coyle b,J. Croquette `, S. Cuneo h, M. Danilov o, R. van Dantzig q, C. De Marzo e,
R. DeVita h, P. Deck d, J-J. Destelle b, G. Dispau d, J.F. Drougou `,F. Druillole d, J. Engelen q, F. Feinstein b, D. Festy `, J. Fopma s,
J-M. Gallone n, G. Giacomelli f , P. Goret d, L. Gosset d, J-F. Gournay d,A. Heijboer q, J.J. Hernandez-Rey k, G. Herrouin `, J. R. Hubbard d,
M. Jaquet b, M. de Jong q, M. Karolak d, P. Kooijman q, A. Kouchner d,V.A. Kudryavtsev t, D. Lachartre d, H. Lafoux d, P. Lamare d,
J-C. Languillat d, L. Laubier a, J-P. Laugier d, Y. Le Guen `, H. Le Provost d,A. Le Van Suu b, L. Lemoine `, L. Lo Nigro g, D. Lo Presti g, S. Loucatos d,
F. Louis d, V. Lyashuk o, P. Magnier d, M. Marcelin p, A. Margiotta f ,A. Massol `, R. Masullo i, F. Mazeas `, B. Mazeau d, A. Mazure p,
J.E. McMillan t, J.L. Michel `, E. Migneco m, C. Millot a, P. Mols d,F. Montanet b, T. Montaruli e, J.P. Morel `, L. Moscoso d, M. Musumeci m,
S. Navas b, E. Nezri b, G.J. Nooren q, J. Oberski q, C. Olivetto b,A. Oppelt-Pohl b, N. Palanque-Delabrouille d, R. Papaleo m, P. Payre b,P. Perrin d, M. Petruccetti i, C. Petta g, P. Piattelli m, J. Poinsignon d,s,
R. Potheau b, Y. Queinec d, C. Racca n, G. Raia m, N. Randazzo g,F. Rethore b, G. Riccobene m, J-S Ricol b, M. Ripani h, V. Roca-Blay k,J.F. Rolin `, A. Rostovstev o, G.V. Russo g, Y. Sacquin d, E. Salusti i,
J-P. Schuller d, W. Schuster s, J-P. Soirat d, O. Souvorova d,j,N.J.C. Spooner t, M. Spurio f , T. Stolarczyk d, D. Stubert j, M. Taiuti h,
C. Tao b, Y. Tayalati d, L.F. Thompson t, S. Tilav s, R. Triay c, V. Valente i,I. Varlamov o, G. Vaudaine k, P. Vernin d, P. de Witt Huberts q, E. de Wolf q,
V. Zakharov o, S. Zavatarelli h, J. de D. Zornoza k, J. Zuniga k
aCOM – Centre d’Oceanologie de Marseille, CNRS/INSU Universite de laMediterranee Aix-Marseille II, Marseille, France
bCPPM – Centre de Physique des Particules de Marseille, CNRS/IN2P3Universite de la Mediterranee Aix-Marseille II, Marseille, FrancecCPT – Centre de Physique Theorique, CNRS, Marseille, France
Preprint submitted to Elsevier Preprint 10 December 2001
dDAPNIA - CEA/DSM, Saclay, FranceeDipartimento Interateneo di Fisica e Sezione INFN, Bari, Italy
fDipartimento di Fisica dell’Universita e Sezione INFN, Bologna, ItalygDipartimento di Fisica ed Astronomia dell’Universita e Sezione INFN, Catania,
ItalyhDipartimento di Fisica dell’Universita e Sezione INFN, Genova, Italy
iDipartimento di Fisica dell’Universita ”La Sapienza” e Sezione INFN, Roma,Italy
jGRPHE – Universite de Haute Alsace, Mulhouse, FrancekIFIC – Instituto de Fısica Corpuscular, CSIC–Universitat de Valencia, Valencia,
Spain`IFREMER, Toulon/La Seyne-sur-Mer and Brest, France
mINFN – Labaratori Nazionali del Sud (LNS), Catania, ItalynIReS – CNRS/IN2P3 Universite Louis Pasteur, Strasbourg, France
oITEP, Moscow, RussiapLAM – Laboratoire d’Astronomie Marseille, CNRS/INSU Universite de Provence
Aix-Marseille I, FranceqNIKHEF, Amsterdam, The Netherlands
rTESRE/CNR, 40129 Bologna, ItalysUniversity of Oxford, Department of Physics, Oxford, United Kingdom
tUniversity of Sheffield, Department of Physics and Astronomy, Sheffield, UnitedKingdom
Abstract
The ANTARES collaboration is building a deep sea neutrino telescope in the Mediter-ranean Sea. This detector will cover a sensitive area of typically 0.1 km2 and will beequipped with about 1000 optical modules. Each of these optical modules consistsof a large area photomultiplier and its associated electronics housed in a pressureresistant glass sphere. The design of the ANTARES optical module, which is a keyelement of the detector, has been finalized following extensive R&D studies and isreviewed here in detail.
Key words: Neutrino Astronomy, Deep Sea DetectorPACS: 95.55.Vj
2
1 Introduction
Neutrinos offer a unique opportunity to explore the Universe in depth over awide energy range [1]. However, since neutrino fluxes at high energy (Eν > TeV)are expected to be very low [2], a very large detector volume is required. A de-tector immersed in the sea provides a cheap and efficient method of observinghigh energy muon neutrinos by detecting the muon produced from a chargedcurrent interaction in the matter surrounding the detector. The muon emitsCerenkov light as it passes through the water, and this light can be detectedby a three-dimensional array of optical sensors called Optical Modules (OM).The measurement of the arrival time of the Cerenkov light at each OM allowsthe reconstruction of the muon direction, and the amount of light collectedcan be used to estimate the muon energy.
The ANTARES collaboration has started the construction of a 0.1 km2 de-tector to be immersed at 2400 m depth in the Mediterranean Sea 40 km offthe French coast (420 50’ N, 60 10’ E). This detector will be equipped withabout 1000 OMs and has been designed to be competitive with other such de-tectors (DUMAND [3], Baikal [4], AMANDA [5] and NESTOR [6]), notablyin terms of angular resolution. To reach this goal, extensive R&D studies havebeen carried out during the past years in order to optimize the design of eachelement of the telescope, particularly its most fundamental component, theoptical module. This optimization work has involved a variety of measure-ments, both in the laboratory and in situ, as well as Monte Carlo simulations.This paper gives the results of these studies and describes in detail the finaldesign of the ANTARES optical module.
In section 2, the constraints inherent to the operation of a deep sea neutrinodetector are reviewed and the specifications for the optical modules are listed.Section 3 describes the main features of the different components of the OMas well as the assembly procedure. The test set-ups and the main results ofthe tests performed by the collaboration during the past years are presentedin section 4. Finally, section 5 deals with mass production and quality controlaspects.
2 Constraints for a deep-sea neutrino telescope
The detection of high energy cosmic neutrinos together with the expectedbackground sources impose particular constraints on the design of a deepundersea detector and on its basic element, the optical module.
3
2.1 Background sources
Atmospheric muons, originating from mesons which are copiously produced bythe interaction of cosmic rays with the Earth’s atmosphere, are the dominantsource of background for a neutrino telescope based on the detection of themuons produced in neutrino interactions. Atmospheric muons are about 10orders of magnitude more numerous at sea level than muons produced byneutrinos. Shielding the telescope against atmospheric muons is thus one ofthe most important considerations of the telescope design.
A straightforward way of reducing the down-going atmospheric muon flux isto immerse the telescope as deep as possible in the sea. At 2400 m, the depthchosen for the ANTARES detector, the atmospheric muon flux is already re-duced by more than 4 orders of magnitude. Though significant, this is stillinsufficient for the measurement of down-going neutrino interactions and amore radical method is to observe only up-going muons, using the Earth itselfas a natural shield. Since the material of the Earth stops all up-going atmo-spheric muons, the telescope is only sensitive to muons produced in neutrinointeractions.
Important sources of background light come from natural radioactivity of seawater (40K decays) and from the presence of bioluminescent organisms. Thisoptical background has both continuous and burst components which havebeen studied in detail at the ANTARES site [7]. Though it has no significantimpact on the OM design itself, it does constrain the trigger scheme as wellas the data acquisition system.
The expected signal fluxes are very low, so the surface area of the detectormust be as large as possible, preferably 1 km2 or more. The 0.1 km2 telescopeforeseen as the first phase of the ANTARES project, despite its limited size,should provide some initial results on high energy neutrino sources.
2.2 The ANTARES project
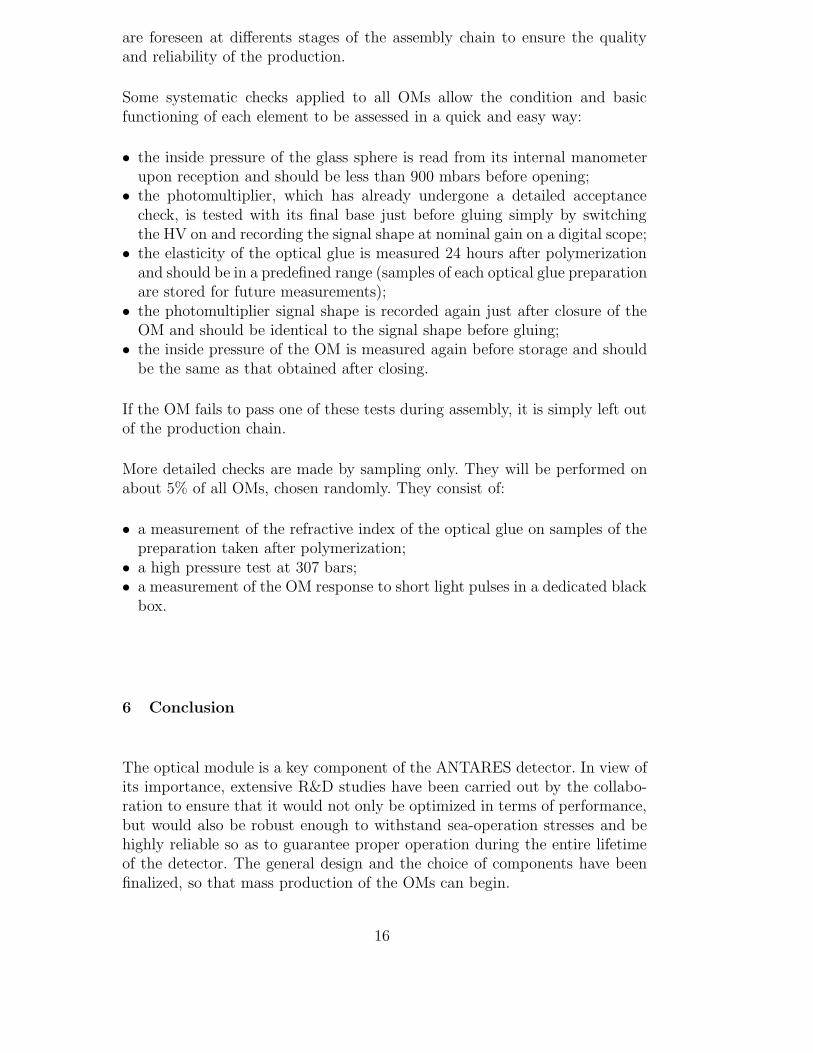
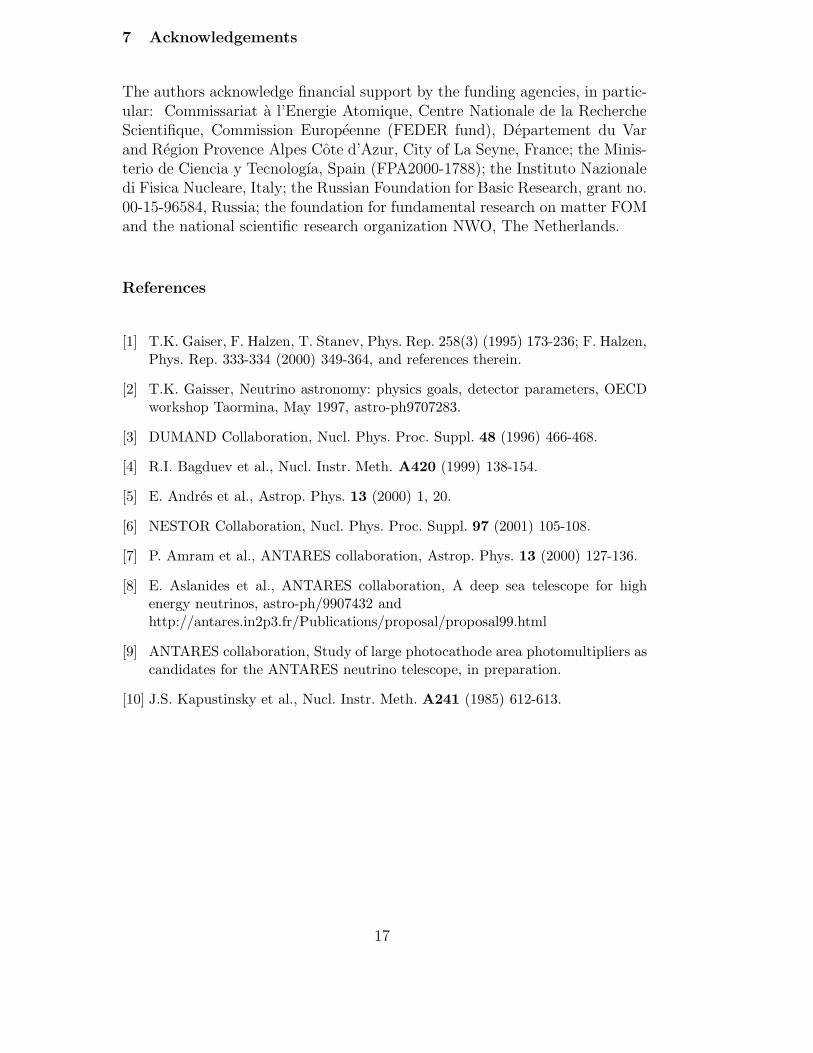
The ANTARES detector, shown in figure 1, consists of a three-dimensionalarray of optical modules supported by flexible vertical strings anchored to thesea bottom [8]. Each OM (figure 2) contains a large area photosensor (photo-multiplier) protected from the outside pressure. The detector is connected tothe shore by an electro-optical cable for data transmission and power supply.
These strings are about 400 m long and separated from each other by at least60 m. Each string is equipped with 90 OMs, grouped together in triplets at 30storeys (figure 3) and connected to a local control module which holds the elec-
4
tronics for the trigger, signal digitization, slow-control and data transmission.The storeys on a given string are spaced 12 m vertically along an intercon-necting elctro-opto-mechanical cable. OMs at each storey are positioned withthe axis of the photomultiplier tubes (PMTs) pointing outwards and inclinedat 45◦ below the horizontal.
The strings must be flexible for deployment. Deep sea currents may modify theshape of the strings, so an accurate positioning system is required to monitortheir deformation during and after deployment and to measure the positionof each element with a precision better than 20 cm. Several additional instru-ments are needed to monitor the environmental conditions and to calibratethe detector in time and in energy.
2.3 Optical module requirements
The scientific goals and the environmental constraints on the ANTARES de-tector described in the previous sections lead to the following global require-ments for the OM:
• Light detection must be optimized. A hemispherical photomultiplier with alarge photocathode surface must be used. For maximum detection efficiency,special care must be taken to ensure the best possible optical coupling be-tween the water and the photocathode, and the influence of the Earth’smagnetic field must be minimized.
• Due to the pressure at a depth of 2400 m, the photomultiplier and itsassociated electronics must be housed in a pressure-resistant glass sphere.The OM must withstand conditions likely to occur during sea operations(shocks, corrosion, vibrations, exposure to sunlight, etc.).
• The OM life-time should be greater than 10 years. Due to the deep-sea envi-ronment, it will be difficult and expensive to repair the detector. Therefore,the reliability of all components should be high.
3 The optical module
The layout of the OM is shown in figure 4. Its main component is a largearea hemispherical photomultiplier (PMT) glued in a pressure resistant glasssphere with optical gel. A µ-metal cage is used to shield the PMT against theEarth’s magnetic field. Electronics inside the OM are reduced to a minimum,namely: the PMT high voltage power supply and a LED system used forinternal calibration. The specifications for all the components are described inthis section as well as the main technical solutions adopted.
5
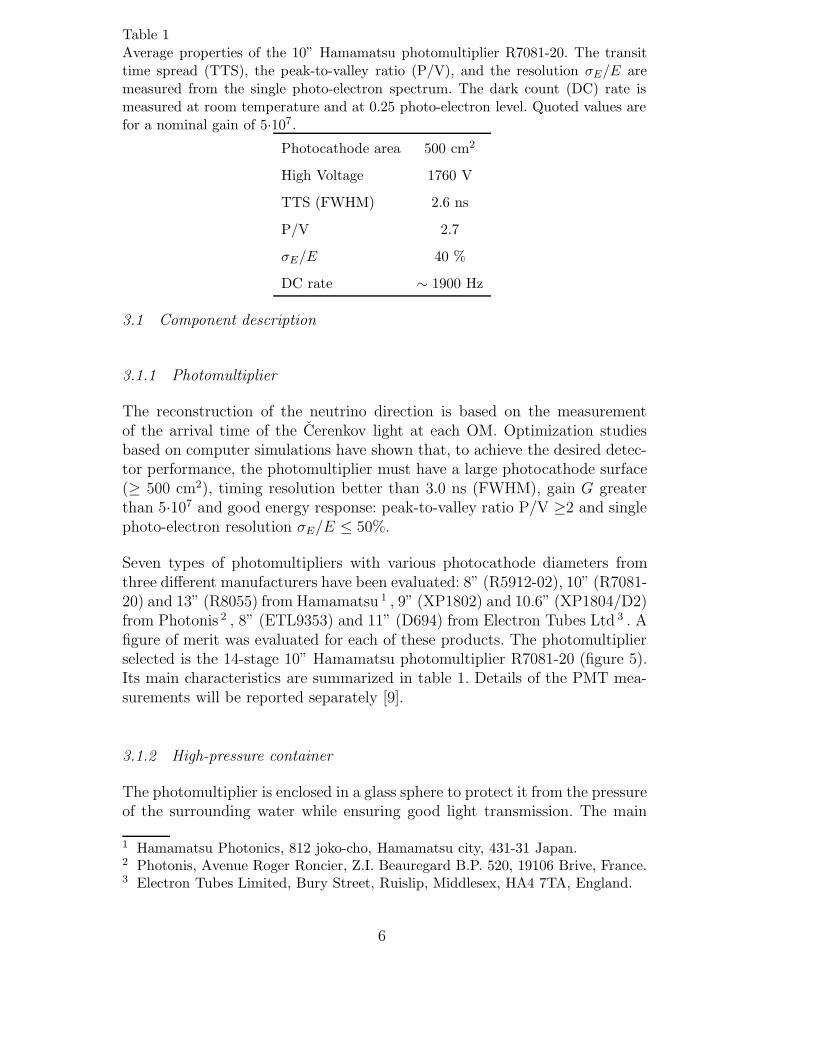
Table 1Average properties of the 10” Hamamatsu photomultiplier R7081-20. The transittime spread (TTS), the peak-to-valley ratio (P/V), and the resolution σE/E aremeasured from the single photo-electron spectrum. The dark count (DC) rate ismeasured at room temperature and at 0.25 photo-electron level. Quoted values arefor a nominal gain of 5·107.
Photocathode area 500 cm2
High Voltage 1760 V
TTS (FWHM) 2.6 ns
P/V 2.7
σE/E 40 %
DC rate ∼ 1900 Hz
3.1 Component description
3.1.1 Photomultiplier
The reconstruction of the neutrino direction is based on the measurementof the arrival time of the Cerenkov light at each OM. Optimization studiesbased on computer simulations have shown that, to achieve the desired detec-tor performance, the photomultiplier must have a large photocathode surface(≥ 500 cm2), timing resolution better than 3.0 ns (FWHM), gain G greaterthan 5·107 and good energy response: peak-to-valley ratio P/V ≥2 and singlephoto-electron resolution σE/E ≤ 50%.
Seven types of photomultipliers with various photocathode diameters fromthree different manufacturers have been evaluated: 8” (R5912-02), 10” (R7081-20) and 13” (R8055) from Hamamatsu 1 , 9” (XP1802) and 10.6” (XP1804/D2)from Photonis 2 , 8” (ETL9353) and 11” (D694) from Electron Tubes Ltd 3 . Afigure of merit was evaluated for each of these products. The photomultiplierselected is the 14-stage 10” Hamamatsu photomultiplier R7081-20 (figure 5).Its main characteristics are summarized in table 1. Details of the PMT mea-surements will be reported separately [9].
3.1.2 High-pressure container
The photomultiplier is enclosed in a glass sphere to protect it from the pressureof the surrounding water while ensuring good light transmission. The main
1 Hamamatsu Photonics, 812 joko-cho, Hamamatsu city, 431-31 Japan.2 Photonis, Avenue Roger Roncier, Z.I. Beauregard B.P. 520, 19106 Brive, France.3 Electron Tubes Limited, Bury Street, Ruislip, Middlesex, HA4 7TA, England.
6
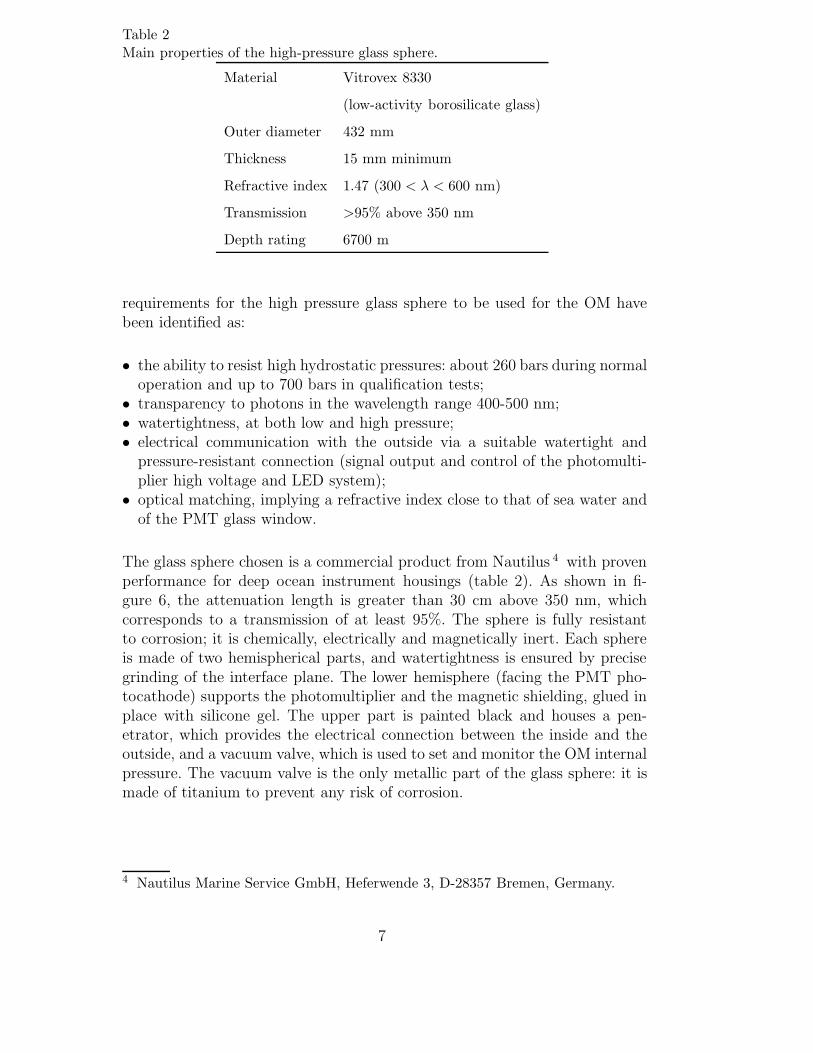
Table 2Main properties of the high-pressure glass sphere.
Material Vitrovex 8330
(low-activity borosilicate glass)
Outer diameter 432 mm
Thickness 15 mm minimum
Refractive index 1.47 (300 < λ < 600 nm)
Transmission >95% above 350 nm
Depth rating 6700 m
requirements for the high pressure glass sphere to be used for the OM havebeen identified as:
• the ability to resist high hydrostatic pressures: about 260 bars during normaloperation and up to 700 bars in qualification tests;
• transparency to photons in the wavelength range 400-500 nm;• watertightness, at both low and high pressure;• electrical communication with the outside via a suitable watertight and
pressure-resistant connection (signal output and control of the photomulti-plier high voltage and LED system);
• optical matching, implying a refractive index close to that of sea water andof the PMT glass window.
The glass sphere chosen is a commercial product from Nautilus 4 with provenperformance for deep ocean instrument housings (table 2). As shown in fi-gure 6, the attenuation length is greater than 30 cm above 350 nm, whichcorresponds to a transmission of at least 95%. The sphere is fully resistantto corrosion; it is chemically, electrically and magnetically inert. Each sphereis made of two hemispherical parts, and watertightness is ensured by precisegrinding of the interface plane. The lower hemisphere (facing the PMT pho-tocathode) supports the photomultiplier and the magnetic shielding, glued inplace with silicone gel. The upper part is painted black and houses a pen-etrator, which provides the electrical connection between the inside and theoutside, and a vacuum valve, which is used to set and monitor the OM internalpressure. The vacuum valve is the only metallic part of the glass sphere: it ismade of titanium to prevent any risk of corrosion.
4 Nautilus Marine Service GmbH, Heferwende 3, D-28357 Bremen, Germany.
7
3.1.3 Magnetic shielding
The Earth’s magnetic field modifies the electron trajectory in the PMT, es-pecially between the photocathode and the first dynode, and degrades theuniformity of the response. At the ANTARES site, the ambient magnetic fieldis expected to be uniform, pointing downward at 23◦ from the vertical with anamplitude of about 44 µT. Laboratory measurements have shown that sucha magnetic field degrades the transit time spread and peak-to-valley ratioof the 10” Hamamatsu PMT operating in nominal conditions by up to 30%(depending on the orientation).
A magnetic shield is thus used to make the PMT response sufficiently homo-geneous over the photocathode surface, while minimizing shadowing effects.For this purpose, a wire cage made of µ-metal, a nickel-iron alloy with veryhigh magnetic permeability (between 50000 and 150000) at low field strengthsfrom Sprint Metal 5 , has been developed and tested.
As shown in figure 7, the cage is composed of 2 parts: a hemispherical partwhich covers the entire photocathode of the PMT, and a flat part consisting ofa disk with a hole in its centre to allow the neck of the PMT to fit through. It ismade out of µ-metal wire (1.1 mm diameter) clamped together at the interfaceof the two parts. Since µ-metal loses its properties when mechanically stressed,the cages are constructed in two steps: first the µ-metal wires are point weldedto obtain the required configuration, then the cages are cleaned and baked at1070◦C for 3 hours to restore the initial properties by annealing.
The pitch of the grid (68 mm × 68 mm) was chosen to minimize the lossdue to its own shadow on the photocathode (less than 4%) while reducingthe ambient magnetic field by more than a factor of 2.5 everywhere insidethe volume of the cage. In addition, the PMT in the detector will be fixedsuch that the dynodes are horizontal. Assuming a vertical direction for theresidual ambiant field, this orientation minimizes the gain change betweenseveral orientations of the storey around the vertical.
3.1.4 Optical glue
The optical glue serves two purposes. It ensures an optical link between theglass sphere and the PMT photocathode, and it fixes the mechanical positionof the different elements (PMT and µ-metal cage) inside the OM.
The main requirements for the selection of the optical glue were the following:
• it should be highly transparent and have a refractive index as close as pos-
5 Sprint Metal, Groupe Usinor, 58160 Imphy, France.
8
sible to that of the glass envelope and the PMT window (to reduce Fresnelreflection);
• it should be firm enough to hold the different components together and, atthe same time, sufficiently elastic to absorb shocks and vibrations duringtransportation and deployment, as well as to absorb the deformation of theglass sphere under pressure (a reduction of 1.2 mm in diameter at a depthof 2400 m);
• its optical and mechanical properties should be sufficiently stable over a10-year period.
The material chosen is a silicone rubber gel (reference SilGel 612 A/B) fromWacker 6 . It is a highly transparent gel which needs 4 hours to polymerizeat 23◦C. It offers pronounced tackiness and very good mechanical dampingproperties. Details of the gluing procedure, important for optimal use of thisgel, are given in subsection 3.2. After polymerization, the gel has a refractiveindex of 1.404, and an attenuation length of about 60 cm above 400 nm,increasing with wavelength (figure 6).
3.1.5 High voltage system
The role of the high voltage system is to provide the PMT with all intermediatevoltages necessary for correct operation. This consists of a constant focussingvoltage between the photocathode and the first dynode and a variable am-plification voltage to be applied between the first dynode, the intermediatedynodes and the anode. Our tests have shown that the optimal PMT res-ponse was obtained with a focusing voltage of 800 V, while the amplificationvoltage should vary between 500 V and 1500 V to allow for gain adjustmentover a reasonable range. The main requirements of the HV system are:
• low power consumption• high stability at constant average light flash rate• acceptable stability and short recovery time for strong light pulses and pe-
riods of high rate• long term reliability• compactness
A modified version of the base integrated HV supply PHQ5912 developedby iSeg 7 has been chosen. The HV and the distribution for the dynodes isgenerated on the base itself, which makes the design compact (figure 8) andrequires only low voltage supply (±5 V) and cabling. The Cockroft-Waltonscheme is used to reduce power consumption to less than 300 mW, a factor
6 Wacker-Chemie GmbH, Hans-Seidel-Platz 4, 81737 Munich, Germany.7 iSeg Technologies Germany GmbH, Munich Airport Center, Terminalstrass Mitte18, 85356 Munich, Germany.
9
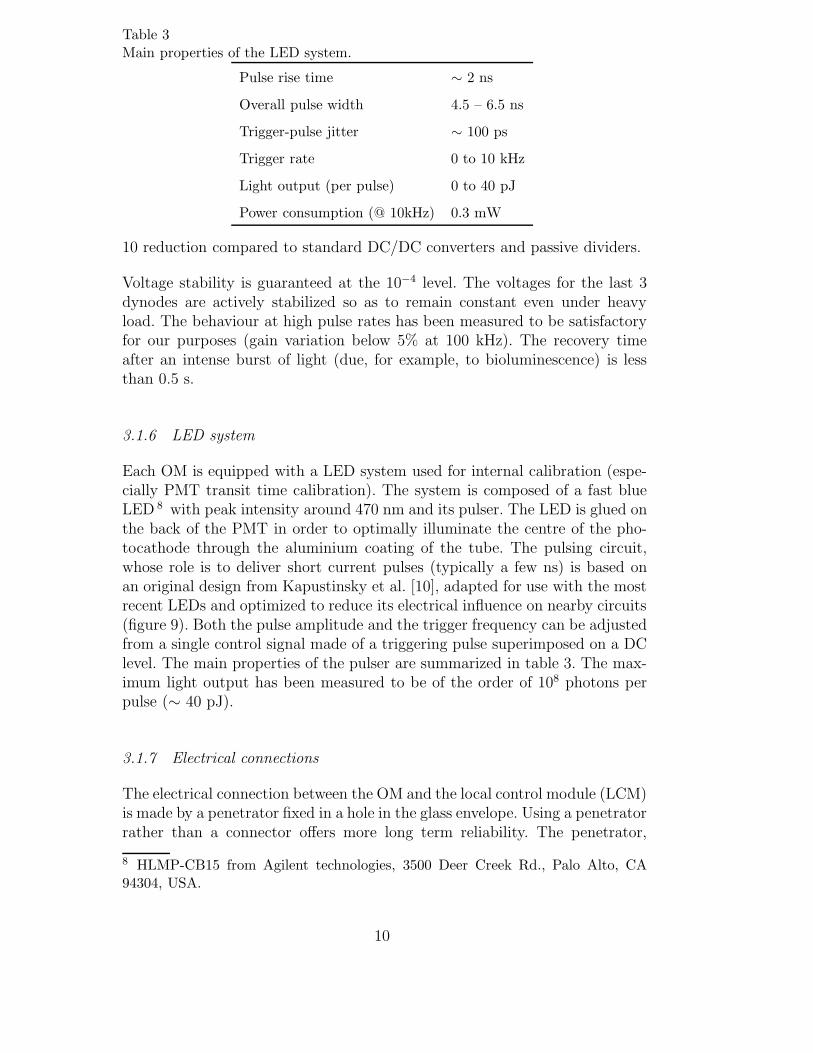
Table 3Main properties of the LED system.
Pulse rise time ∼ 2 ns
Overall pulse width 4.5 – 6.5 ns
Trigger-pulse jitter ∼ 100 ps
Trigger rate 0 to 10 kHz
Light output (per pulse) 0 to 40 pJ
Power consumption (@ 10kHz) 0.3 mW
10 reduction compared to standard DC/DC converters and passive dividers.
Voltage stability is guaranteed at the 10−4 level. The voltages for the last 3dynodes are actively stabilized so as to remain constant even under heavyload. The behaviour at high pulse rates has been measured to be satisfactoryfor our purposes (gain variation below 5% at 100 kHz). The recovery timeafter an intense burst of light (due, for example, to bioluminescence) is lessthan 0.5 s.
3.1.6 LED system
Each OM is equipped with a LED system used for internal calibration (espe-cially PMT transit time calibration). The system is composed of a fast blueLED 8 with peak intensity around 470 nm and its pulser. The LED is glued onthe back of the PMT in order to optimally illuminate the centre of the pho-tocathode through the aluminium coating of the tube. The pulsing circuit,whose role is to deliver short current pulses (typically a few ns) is based onan original design from Kapustinsky et al. [10], adapted for use with the mostrecent LEDs and optimized to reduce its electrical influence on nearby circuits(figure 9). Both the pulse amplitude and the trigger frequency can be adjustedfrom a single control signal made of a triggering pulse superimposed on a DClevel. The main properties of the pulser are summarized in table 3. The max-imum light output has been measured to be of the order of 108 photons perpulse (∼ 40 pJ).
3.1.7 Electrical connections
The electrical connection between the OM and the local control module (LCM)is made by a penetrator fixed in a hole in the glass envelope. Using a penetratorrather than a connector offers more long term reliability. The penetrator,
8 HLMP-CB15 from Agilent technologies, 3500 Deer Creek Rd., Palo Alto, CA94304, USA.
10
provided by Euroceanique 9 , has a diameter of 20 mm. The cable connectingthe OM to the LCM is 1.9 m long and contains 5 shielded twisted pairs of0.4 mm2 allocated as follows:
• One for power transmission (Max. 50 V DC, 0.1 A)• Two for the PMT signals (100 Ohms)• One for high voltage control and monitoring (0 to 4 V)• One for the LED trigger signal (0 to +24 V)
In order to increase the dynamic range, the PMT anode and dynode 12 (D12)signals are both sent to the LCM where they are digitized. Differential trans-mission is used to reduce noise, with one twisted pair connected between theanode and D14, and the other between D12 and ground.
3.2 OM assembly
The assembly of an OM from the components described above takes about 8hours (including tests) and consists of several steps (figure 10):
1) Opening of the high pressure sphereHigh pressure spheres are delivered closed with an absolute internal pressureof 800 mbars. Each sphere is equipped with a small manometer so as to easilymonitor the internal pressure during the assembly process. The upper hemi-sphere is already painted black and equipped with its penetrator. The sphereis opened by allowing air inside through the vacuum valve.
2) Cabling of the PMT baseThe PMT base is connected by soldering to the twisted pairs of the penetratorcontained in the upper part of the glass sphere.
3) Mounting of the PMT and µ-metal cageThe lower glass hemisphere is mounted on a gluing bench specifically deve-loped (figure 11) which allows accurate (better than 1 mm) positioning of thePMT and the magnetic cage inside the glass sphere.
First, each element has to be carefully cleaned to avoid introducing impuritiesthat could generate bubbles in the gel after polymerization. The PMT glasswindow and the inner surface of the sphere are cleaned using methyl alcohol atroom temperature. The µ-metal cage is immersed for 15 min in an ultrasonicbath of methyl alcohol at 40◦C.
The gluing is performed in three phases:
9 Euroceanique, 645 rue Mayor de Montricher, 13854 Aix en Provence, France.
11

• First, 2 kg of silicone gel is poured into the glass hemisphere and outgassed.During this phase, many bubbles form and are evacuated, while the volumeof the gel nearly doubles temporarily.
• Next, the µ-metal cage and the photomultiplier are positioned very slowlyin the gel and the ensemble is outgassed at about 1 mbar absolute to removethe bubbles. The outgassing operation is repeated three times for 3 minutes.The outgassing is limited to 9 minutes to avoid removing too much solvent.
• Finally, the gel is left to polymerize at room temperature and pressure forat least 4 hours.
4) Optical module closureThe PMT base connected to the upper hemisphere is plugged onto the PMTand the 2 hemispheres are aligned and joined. The OM is then sealed byapplying an under-pressure of 200 mbar inside the sphere and by using puttyand tape externally at the joint between the two hemispheres.
4 OM characterization
Many tests were necessary to finalize the choice of individual components ofthe OM and in particular of the photomultiplier [9]. In addition, an evaluationof the overall behaviour of the OM once all components are assembled shouldbe performed, both to verify the assembly procedure and to estimate the figureof merit of a particular design. Several test set-ups have been designed andimplemented for this purpose and are presented in this section.
4.1 Uniformity of the OM response
The aim of one of these measurements is to look for possible non-uniformitiesin the OM response by scanning the entire sensitive area with a point-like lightsource. The measurement is performed in the air, with the OM located in adark box equipped with a mechanical system allowing a focussed blue LED toscan the entire area of the photocathode automatically (figure 12). The LEDalways points to the center of the OM and the light spot diameter is about 1 cmat the photocathode. Non-uniformities may have several origins: asymmetricalPMT photocathode or collection efficiency, influence of the Earth magneticfield, defects (bubbles, dust) in the gel or glass sphere, etc. They might biasthe detection efficiency of the telescope and they are very difficult to correctfor a posteriori.
The OM response (in number of photo-electrons) as a function of the positionof the light spot is presented in figure 13. For central illumination (θ = 0◦)
12
the OM sees on average 13 photo-electrons and the OM response is essentiallyuniform up to ±25◦. At θ = 40◦, the OM response drops quickly when thelight spot reaches the edge of the photocathode. The peaks at ±50◦ are dueto the gel-air dioptre which reflects an important fraction of the light back tothe photocathode at this particular angle.
4.2 Absolute calibration
Absolute calibration and the determination of the overall response of the OMare carried out in the laboratory using a water tank under light conditionssimilar to those found in the deep-sea environment: a completely dark watervolume, occasionally illuminated by flashes of Cerenkov light produced by thepassage of energetic muons. The set-up consists of a light-tight cylindricalsteel tank containing 2.3 m3 of pure water (figure 14). Immersed in the tankabout 1.2 m deep, the OM detects Cerenkov light pulses produced in thewater by nearly vertical cosmic rays. Above and below the steel tank, twopairs of scintillator hodoscopes detect the passage of these particles. A triggeris formed by requiring a time coincidence on the 4 scintillator hodoscopes.Triggers are mainly due to muons with about 1 GeV energy.
The OM signal is sent to an ADC for digitization when an event trigger isreceived. Two pattern units are also read out and stored for each event todetermine which scintillators were hit. This information is used to reconstructthe position of the muon track with respect to the centre of the OM. Thetwo upper hodoscopes determine the entry point of the muon, and the lowerhodoscopes determine the exit point. The horizontal coordinates (x and y) ofthe entry and exit points are determined with a precision of about 6 cm. Thedistance from the muon track to the centre of the OM can be estimated witha precision of 2–3 cm.
A motor allows the OM to be rotated around a horizontal axis passing throughthe centre of the sphere and perpendicular to the tank’s axis. This makes itpossible to measure the optical module response at different angles of incidence(angle between the direction pointed by the PMT in the OM (the OM axis)and the muon track). The zenith angle θOM of the OM axis can vary from 0◦
(OM looking up) to 180◦ (OM looking down).
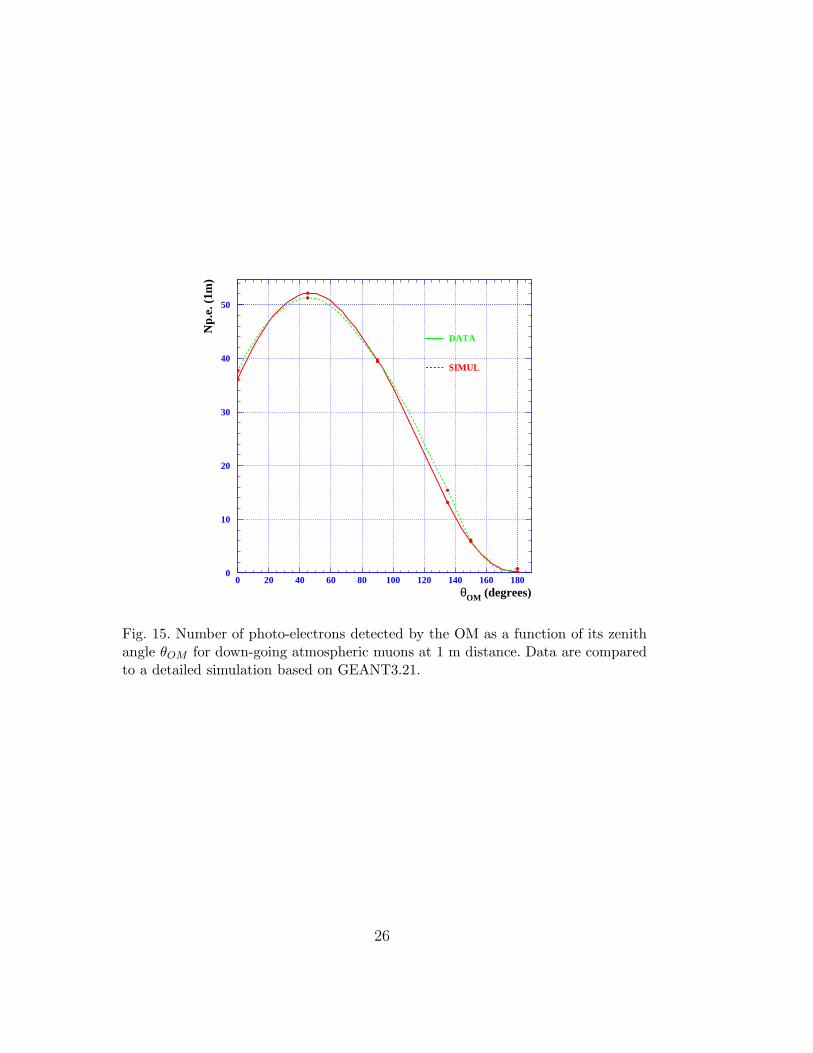
Figure 15 shows the response of an OM equipped with a 10” R7081-20 Hama-matsu PMT operated at a gain of 108 as a function of θOM . As shown in thefigure, for head-on illumination of the OM by the Cerenkov cone (θOM = 42◦),the OM gives an average of 52 photo-electrons for minimum ionizing muonsat 1 m. The effective angular acceptance of the OM, defined as the angularregion where the OM sees more than half of the maximum signal, is 140◦ for
13

this head-on illumination. Figure 15 also shows that the PMT is sensitive toa wide range of incident directions, extending up to about 120◦ from its axis.This 120◦ limit was adopted for the design of the bottom part of the storey(figure 3) to minimize the shadowing.
4.3 Endurance test
Experience has shown that an OM will undergo significant environmentalstresses over its lifetime, including:
• temperature variations during storage and transportation: –10◦C to +45◦C;• mechanical stresses due to ground and sea transportation;• light exposure (a maximum of 1000 W/m2 continuously for 8 hours from
the sun light on the boat deck);• permanent contact with sea water during normal operation;• an external working pressure of 256 bars, and 307 bars for 1 hour during
the acceptance tests.
To check whether the OM can be subjected to all of these conditions withoutsignificant degradation, a test campaign for environmental qualification hasbeen conducted. To ensure reproducibility, 4 identical OMs have been built andhave been subjected to 3 sets of tests: climatic, mechanical, and high pressuretests (table 4). At each step of the qualification procedure, the integrity of theOM is monitored by:
• visual inspection• measurement of the internal pressure• high pressure tests• measurement of the PMT response
All four OMs successfully passed these tests.
4.4 In situ tests and long term behaviour
Since the beginning of the ANTARES project, more than 30 OMs have beenbuilt and used for deep-sea measurements for the site evaluation campaign.These OMs have been immersed for periods ranging from a few hours tomore than one year [7] without a single failure. This indicates that the OMfabrication is under control and is adequate for the intended purpose.
In November 1999, a prototype line connected to the shore via an electro-optical cable was deployed 40 km of the coast of Marseilles at a depth of
14
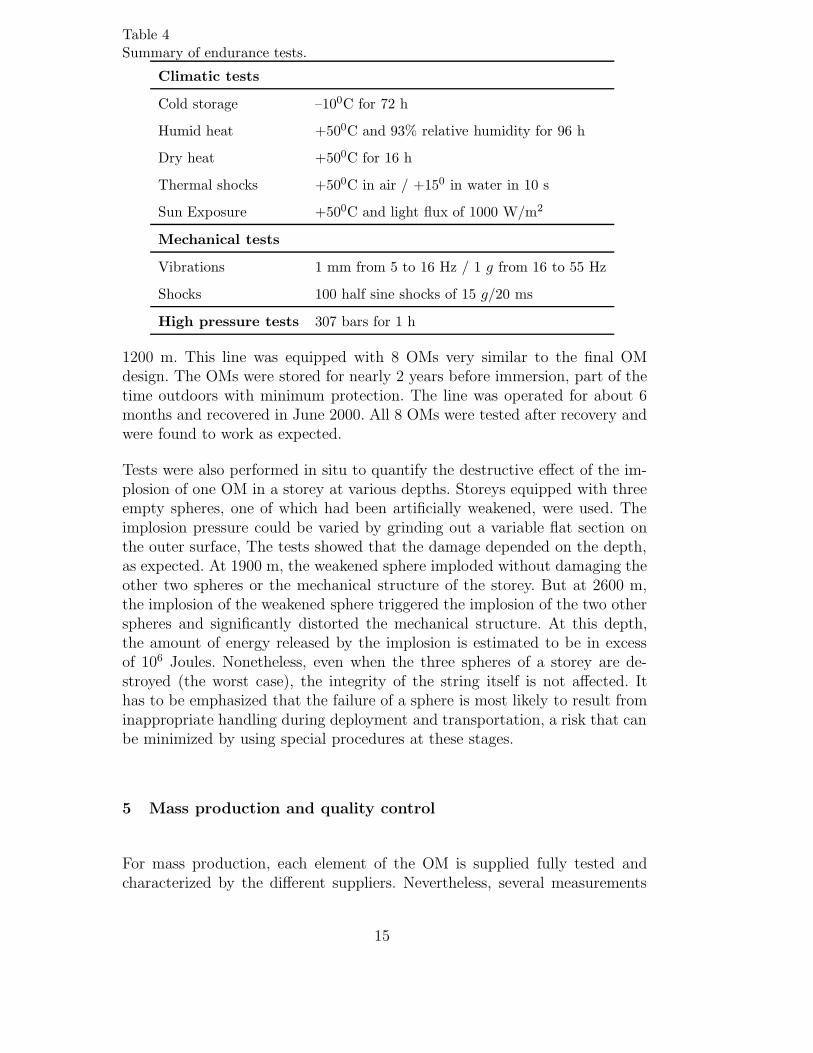
Table 4Summary of endurance tests.
Climatic tests
Cold storage –100C for 72 h
Humid heat +500C and 93% relative humidity for 96 h
Dry heat +500C for 16 h
Thermal shocks +500C in air / +150 in water in 10 s
Sun Exposure +500C and light flux of 1000 W/m2
Mechanical tests
Vibrations 1 mm from 5 to 16 Hz / 1 g from 16 to 55 Hz
Shocks 100 half sine shocks of 15 g/20 ms
High pressure tests 307 bars for 1 h
1200 m. This line was equipped with 8 OMs very similar to the final OMdesign. The OMs were stored for nearly 2 years before immersion, part of thetime outdoors with minimum protection. The line was operated for about 6months and recovered in June 2000. All 8 OMs were tested after recovery andwere found to work as expected.
Tests were also performed in situ to quantify the destructive effect of the im-plosion of one OM in a storey at various depths. Storeys equipped with threeempty spheres, one of which had been artificially weakened, were used. Theimplosion pressure could be varied by grinding out a variable flat section onthe outer surface, The tests showed that the damage depended on the depth,as expected. At 1900 m, the weakened sphere imploded without damaging theother two spheres or the mechanical structure of the storey. But at 2600 m,the implosion of the weakened sphere triggered the implosion of the two otherspheres and significantly distorted the mechanical structure. At this depth,the amount of energy released by the implosion is estimated to be in excessof 106 Joules. Nonetheless, even when the three spheres of a storey are de-stroyed (the worst case), the integrity of the string itself is not affected. Ithas to be emphasized that the failure of a sphere is most likely to result frominappropriate handling during deployment and transportation, a risk that canbe minimized by using special procedures at these stages.
5 Mass production and quality control
For mass production, each element of the OM is supplied fully tested andcharacterized by the different suppliers. Nevertheless, several measurements
15
are foreseen at differents stages of the assembly chain to ensure the qualityand reliability of the production.
Some systematic checks applied to all OMs allow the condition and basicfunctioning of each element to be assessed in a quick and easy way:
• the inside pressure of the glass sphere is read from its internal manometerupon reception and should be less than 900 mbars before opening;
• the photomultiplier, which has already undergone a detailed acceptancecheck, is tested with its final base just before gluing simply by switchingthe HV on and recording the signal shape at nominal gain on a digital scope;
• the elasticity of the optical glue is measured 24 hours after polymerizationand should be in a predefined range (samples of each optical glue preparationare stored for future measurements);
• the photomultiplier signal shape is recorded again just after closure of theOM and should be identical to the signal shape before gluing;
• the inside pressure of the OM is measured again before storage and shouldbe the same as that obtained after closing.
If the OM fails to pass one of these tests during assembly, it is simply left outof the production chain.
More detailed checks are made by sampling only. They will be performed onabout 5% of all OMs, chosen randomly. They consist of:
• a measurement of the refractive index of the optical glue on samples of thepreparation taken after polymerization;
• a high pressure test at 307 bars;• a measurement of the OM response to short light pulses in a dedicated black
box.
6 Conclusion
The optical module is a key component of the ANTARES detector. In view ofits importance, extensive R&D studies have been carried out by the collabo-ration to ensure that it would not only be optimized in terms of performance,but would also be robust enough to withstand sea-operation stresses and behighly reliable so as to guarantee proper operation during the entire lifetimeof the detector. The general design and the choice of components have beenfinalized, so that mass production of the OMs can begin.
16
7 Acknowledgements
The authors acknowledge financial support by the funding agencies, in partic-ular: Commissariat a l’Energie Atomique, Centre Nationale de la RechercheScientifique, Commission Europeenne (FEDER fund), Departement du Varand Region Provence Alpes Cote d’Azur, City of La Seyne, France; the Minis-terio de Ciencia y Tecnologıa, Spain (FPA2000-1788); the Instituto Nazionaledi Fisica Nucleare, Italy; the Russian Foundation for Basic Research, grant no.00-15-96584, Russia; the foundation for fundamental research on matter FOMand the national scientific research organization NWO, The Netherlands.
References
[1] T.K. Gaiser, F. Halzen, T. Stanev, Phys. Rep. 258(3) (1995) 173-236; F. Halzen,Phys. Rep. 333-334 (2000) 349-364, and references therein.
[2] T.K. Gaisser, Neutrino astronomy: physics goals, detector parameters, OECDworkshop Taormina, May 1997, astro-ph9707283.
[3] DUMAND Collaboration, Nucl. Phys. Proc. Suppl. 48 (1996) 466-468.
[4] R.I. Bagduev et al., Nucl. Instr. Meth. A420 (1999) 138-154.
[5] E. Andres et al., Astrop. Phys. 13 (2000) 1, 20.
[6] NESTOR Collaboration, Nucl. Phys. Proc. Suppl. 97 (2001) 105-108.
[7] P. Amram et al., ANTARES collaboration, Astrop. Phys. 13 (2000) 127-136.
[8] E. Aslanides et al., ANTARES collaboration, A deep sea telescope for highenergy neutrinos, astro-ph/9907432 andhttp://antares.in2p3.fr/Publications/proposal/proposal99.html
[9] ANTARES collaboration, Study of large photocathode area photomultipliers ascandidates for the ANTARES neutrino telescope, in preparation.
[10] J.S. Kapustinsky et al., Nucl. Instr. Meth. A241 (1985) 612-613.
17
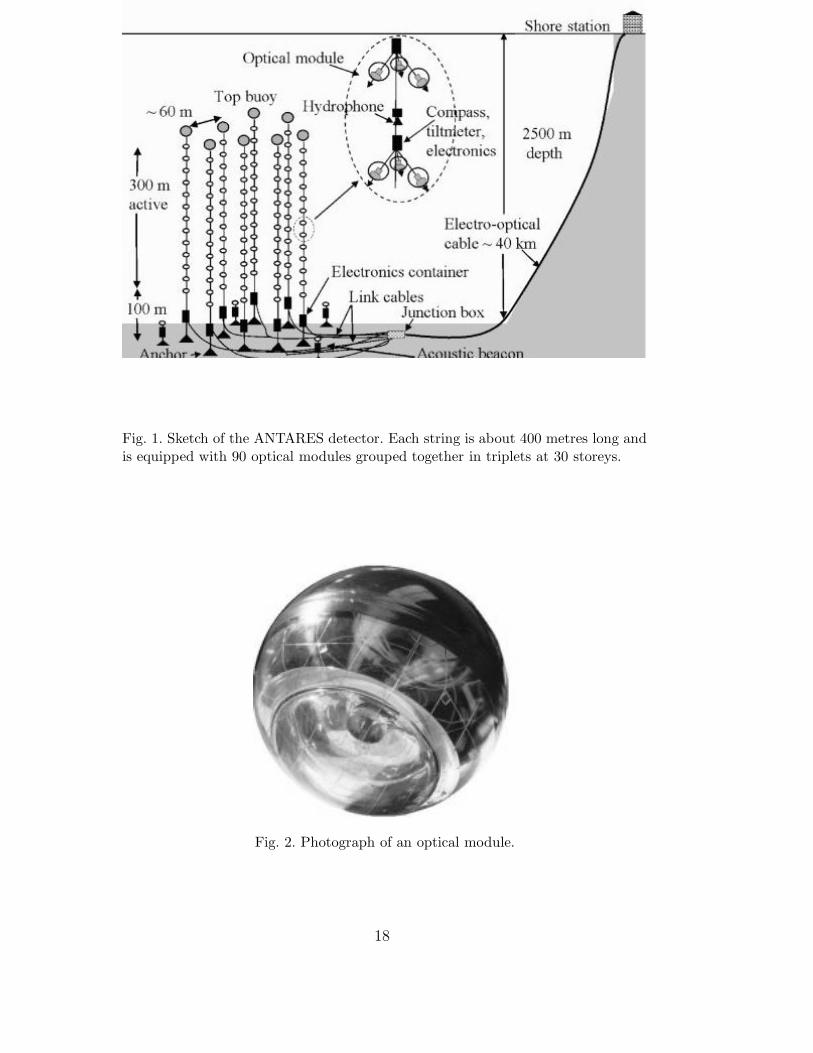
Fig. 1. Sketch of the ANTARES detector. Each string is about 400 metres long andis equipped with 90 optical modules grouped together in triplets at 30 storeys.
Fig. 2. Photograph of an optical module.
18
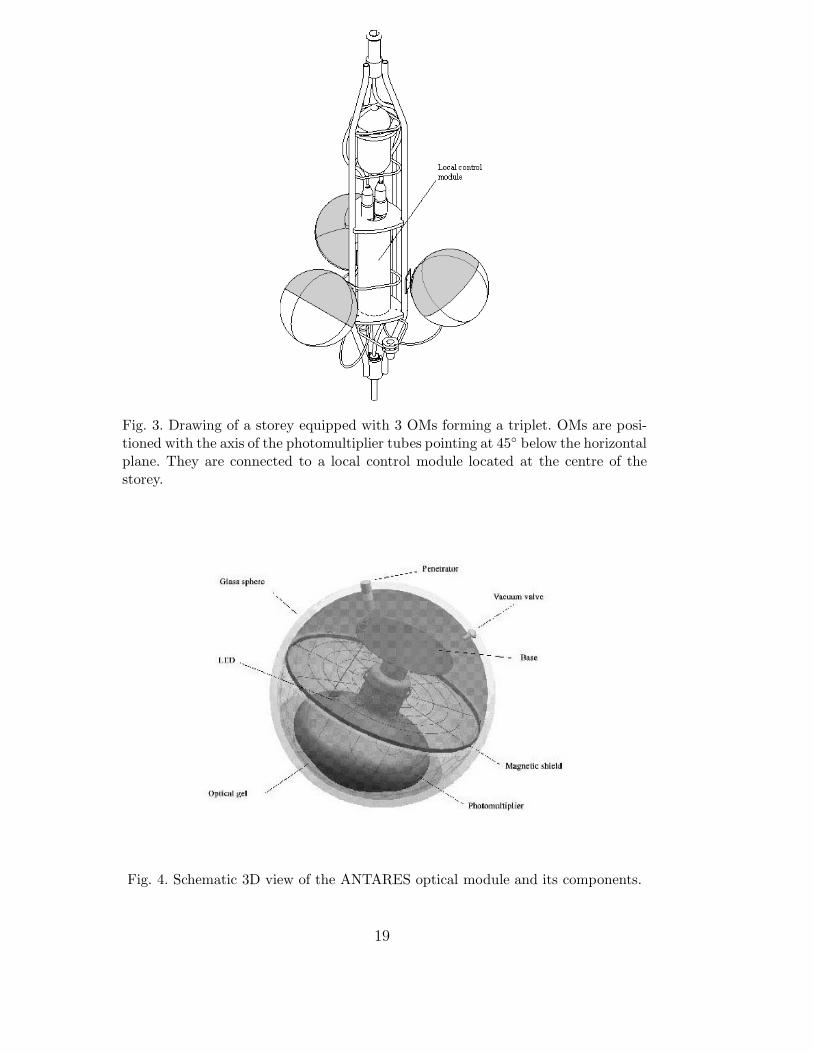
Fig. 3. Drawing of a storey equipped with 3 OMs forming a triplet. OMs are posi-tioned with the axis of the photomultiplier tubes pointing at 45◦ below the horizontalplane. They are connected to a local control module located at the centre of thestorey.
Fig. 4. Schematic 3D view of the ANTARES optical module and its components.
19
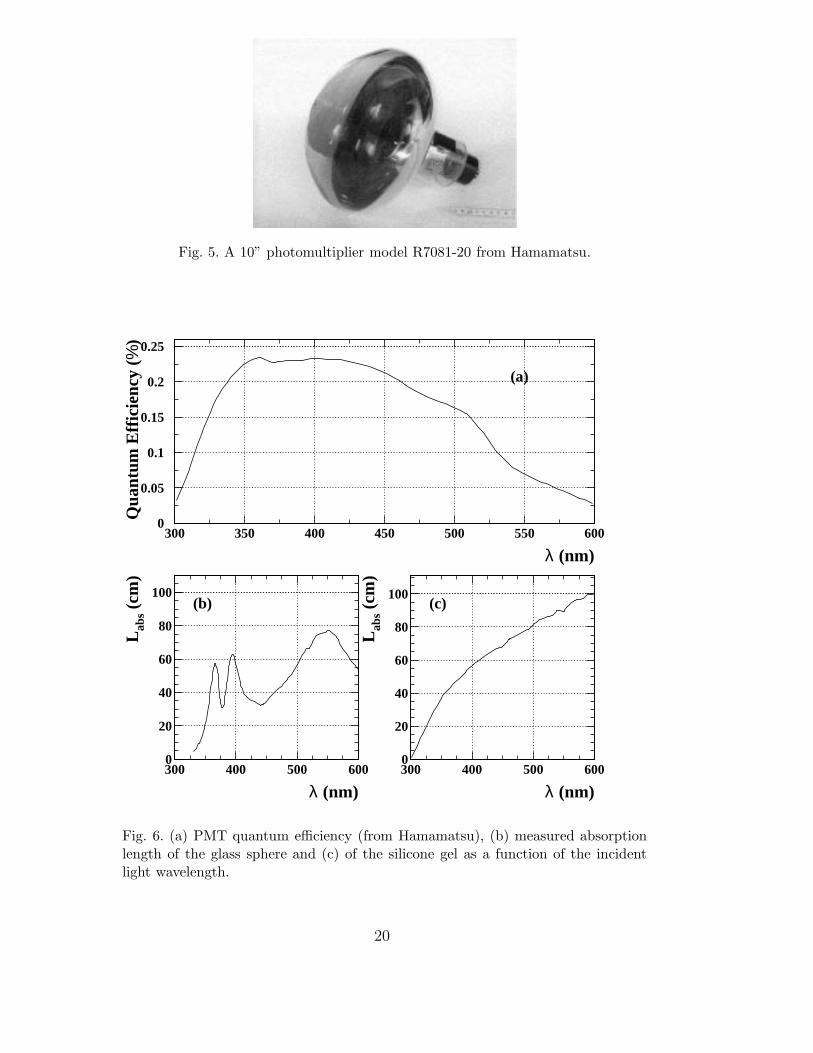
Fig. 5. A 10” photomultiplier model R7081-20 from Hamamatsu.
0
0.05
0.1
0.15
0.2
0.25
300 350 400 450 500 550 600
λ (nm)
Qua
ntum
Effi
cien
cy (%
)
(a)
0
20
40
60
80
100
300 400 500 600
λ (nm)
Lab
s (cm
)
(b)
0
20
40
60
80
100
300 400 500 600
λ (nm)
Lab
s (cm
)
(c)
Fig. 6. (a) PMT quantum efficiency (from Hamamatsu), (b) measured absorptionlength of the glass sphere and (c) of the silicone gel as a function of the incidentlight wavelength.
20

Fig. 7. µ-metal cage for magnetic shielding. The hemispherical part has outer diam-eter Φ=395 mm and height H=199 mm. The flat part has Φ = 399 mm, H=30 mm.The two parts are linked together with four clamps of µ-metal wire.
Fig. 8. PMT base with integrated high voltage power supply.
21
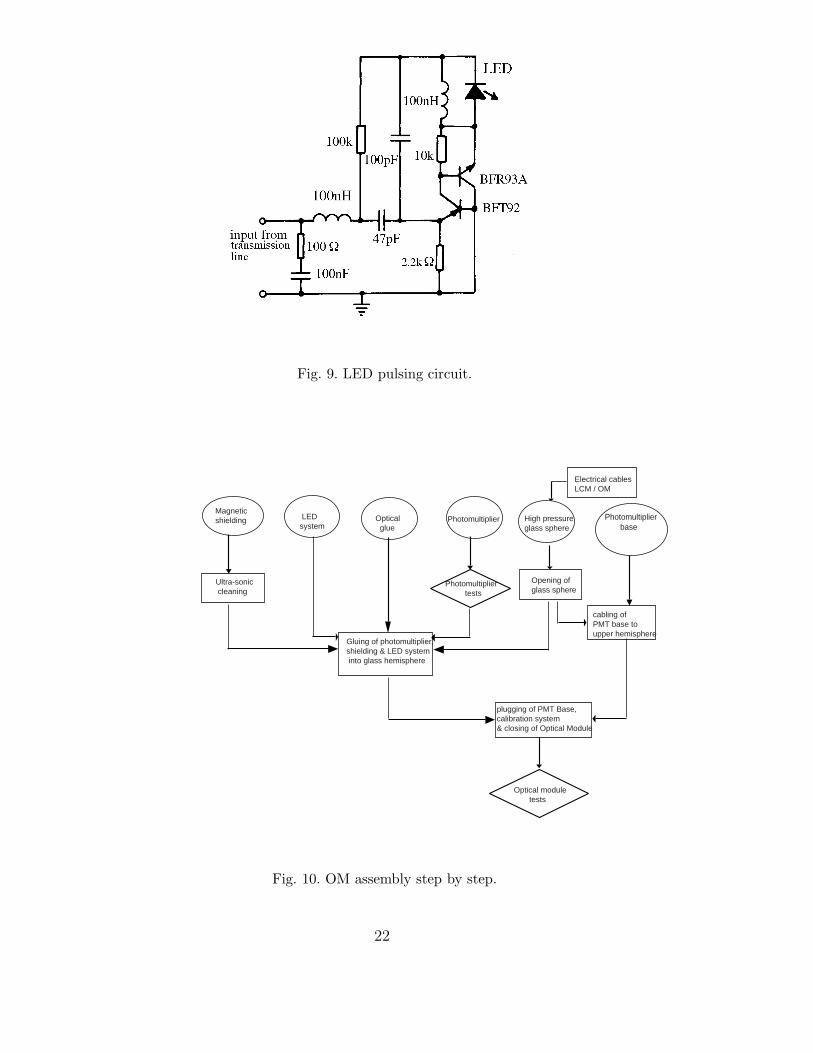
Fig. 9. LED pulsing circuit.
Electrical cablesLCM / OM
Magneticshielding Optical
glueHigh pressure glass sphere
LED system
Photomultiplier base
Photomultiplier
Gluing of photomultiplier, shielding & LED system into glass hemisphere
Opening ofglass sphere
cabling of PMT base to upper hemisphere
Photomultiplier tests
plugging of PMT Base,calibration system & closing of Optical Module
Optical module tests
Ultra-sonic cleaning
Fig. 10. OM assembly step by step.
22

Fig. 11. Schematic 3D view of the gluing bench.
23
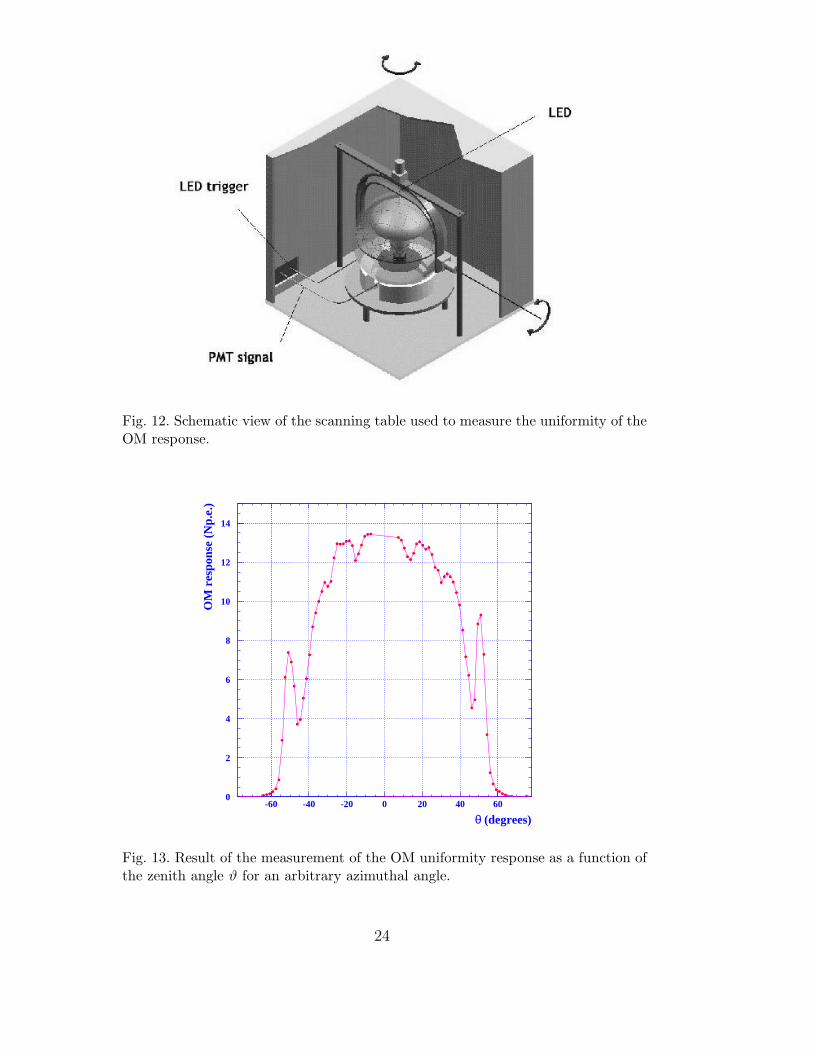
Fig. 12. Schematic view of the scanning table used to measure the uniformity of theOM response.
0
2
4
6
8
10
12
14
-60 -40 -20 0 20 40 60
θ (degrees)
OM
res
pons
e (N
p.e.
)
Fig. 13. Result of the measurement of the OM uniformity response as a function ofthe zenith angle ϑ for an arbitrary azimuthal angle.
24
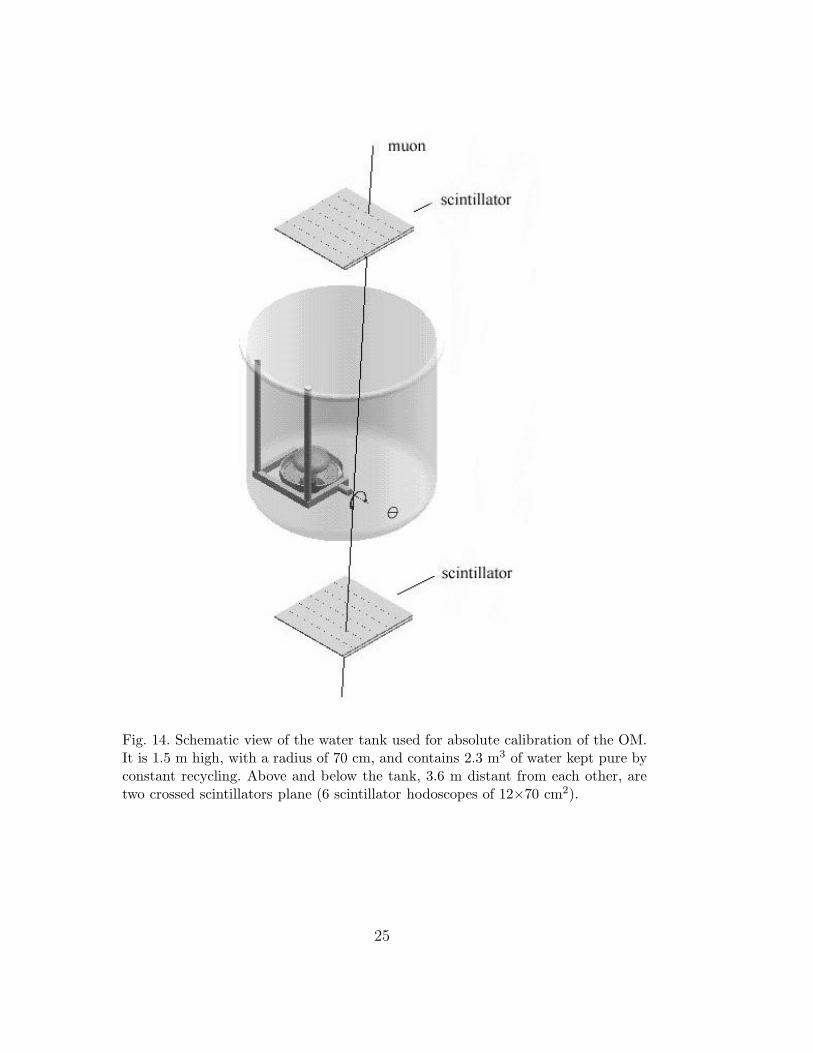
Fig. 14. Schematic view of the water tank used for absolute calibration of the OM.It is 1.5 m high, with a radius of 70 cm, and contains 2.3 m3 of water kept pure byconstant recycling. Above and below the tank, 3.6 m distant from each other, aretwo crossed scintillators plane (6 scintillator hodoscopes of 12×70 cm2).
25
0
10
20
30
40
50
0 20 40 60 80 100 120 140 160 180θOM (degrees)
Np.
e. (
1m)
DATA
SIMUL
Fig. 15. Number of photo-electrons detected by the OM as a function of its zenithangle θOM for down-going atmospheric muons at 1 m distance. Data are comparedto a detailed simulation based on GEANT3.21.
26