the application of gis and remote sensing on icipe’s · the application of gis and remote sensing...
TRANSCRIPT
The application of GIS and
remote sensing on icipe’s
R&D paradigms
Elfatih M. Abdel-Rahman
Gladys Mosomtai
Tobias Landmann
David Makori
icipe-African Insect Science for Food and Health
KENYATTA UNIVERSITY GIS DAY – 18th Nov. 2014
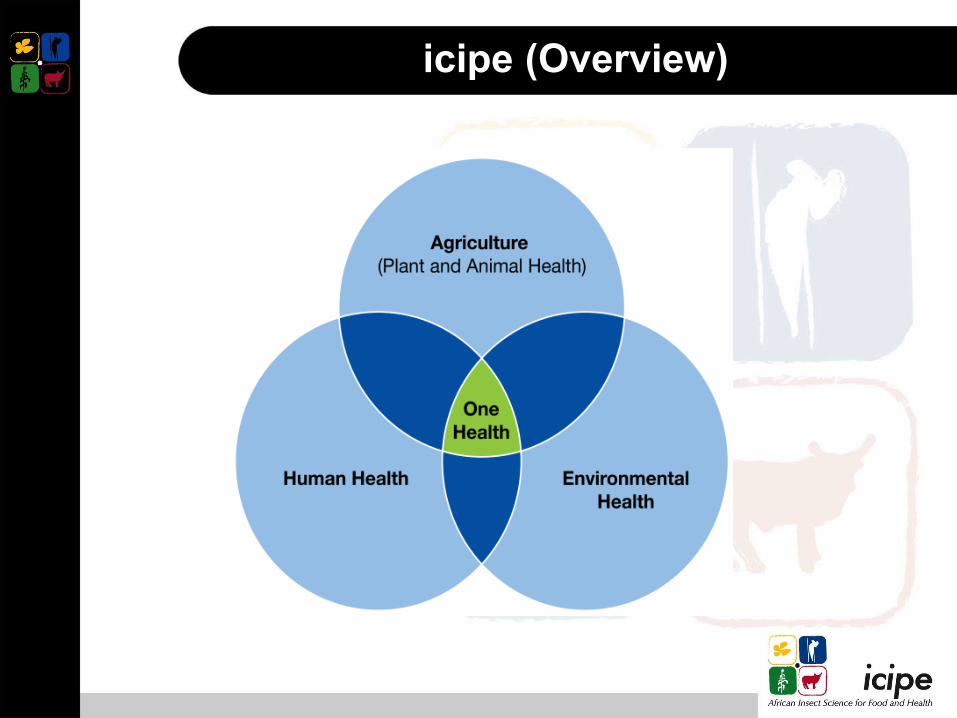
icipe (Overview)
More than 40 years, icipe (International
Centre for Insect Physiology and Ecology) has
been the principal insect and arthropod
research institute for Africa.
„Research and development thrust for icipe’s
4-H paradigm;
- Plant health
- Animal health
- Human health
- Environmental heath
icipe (Overview)

Earth Observation Unit within icipe
It‟s part of the Adaptation to Climate Change
and Ecosystems Services (ACCES) cluster
Works closely with icipe scientists from all 4-H
to provide geospatial services to various
projects
Involved in training students and staff
from icipe as well as collaborating partner
institutions on GIS and remote sensing.

Thematic areas for EOU
Food Security - mapping of crops and
cropping systems.
Biodiversity (BD) indicators - “Incidences of
Ecosystem Failure”, “Habitat dynamics,”
“Degradation.”
Integrated Land Use & Ecosystem
Services - mapping the floral cycle to quantify
pollination effects and understand bee health.

Thematic areas for EOU
Disease mapping - involved in mapping the
vector habitat as a proxy for disease
occurrence (than mapping the disease itself)

Food security
1. As part of risks assessment for agriculture: Predicting the
Impacts of climate change on future pest and disease
outbreaks (e.g., Diamondback moth infestation in Taita)
Current 2013 Future 2055
Methodology
1. Species distribution
modelling tools e.g
MAXENT, GARP
2. Data – worldclim data
Africlim data
RS variables
LST, NDVI
Data source
http://www.worldclim.org/download
https://webfiles.york.ac.uk/KITE/AfriClim/GeoTIFF_30s/baseline_worldclim/

Food security
2. Crop and cropping patterns mapping for pests and
disease prediction (e.g., Stem borers in Maize)
this work is under progress (First field visit 10 – 13
November 2014)

Food security
Multi-sensor time series remotely sensed data (RapidEgye,
Landsat 8, Sentinel-2 and SAR)
- Crop mask
- Crop types (patterns)
- Seasonality (phenology)
- Surrounded areas
- Use of machine-learning classification algorithms (e.g.,
Random forest)

Food security
Developing java-based RF for agricultural land
use classification tool
The tool does
automatic
classification
using random
forest algorithm
Red- set directory
Green- upload
image to classify
Set parameter of
the algorithm

Biodiversity (BD) indicators
Land productivity decline mapping (2001-2012):
Approach
Multi-sensor approach
for human-induced land
productivity mapping
(2001-2012)*
*Landmann & Dubovyk (2014) Spatial analysis of human-induced vegetation
productivity decline over eastern Africa using a decade (2001-2011) of medium
resolution MODIS time-series data. Int. J. Applied Earth Observation and
Geoinformation 33: 76-82 – published paper
Data
MODIS NDVI – MOD 13Q
Product
TRMM - rainfall data
Sources
http://earthexplorer.usgs.gov/
Software used
1. IDRISI
2. ENVI
3. ARCMAP

Biodiversity (BD) indicators
Moderate decline
“severe” decline
Rainfall corrected (normalized) Normalized
Difference Vegetation Index (NDVI) time-series
data, at 250-meter resolution, is used to map
human-induced change between 2000 and 2012

Flower mapping using airborne hyperspectral data
Knowledge about the floral cycle and the abundance and
distribution of flowering of mellipherous plants in the
landscape
Bee hive productivity and bee health studies as well as
pollination
The study site is located in the Mwingi Central Sub County,
Kitui County in Kenya
AisaEAGLE imaging spectrometer (Feb 2013 and Jan. 2014)
Ecosystem services quantification

Reference data collection (Flowering trees, flowers color)
Bee hive productivity and bee health studies as well as
pollination
Flowering, green trees and soil endmembers
Ecosystem services quantification
0
20
40
60
408
.4
443
.2
479
.2
515
.2
551
.4
588
.6
625
.9
663
.3
700
.6
738
.2
776
.1
814
.3
852
.4
890
.5
928
.7
966
.9
Ref
lact
ance
(%
)
Wavelength (nm)
2013 Base Soil Green Trees
Flowering Trees
0
10
20
30
40
408
.4
443
.2
479
.2
515
.2
551
.4
588
.6
625
.9
663
.3
700
.6
738
.2
776
.1
814
.3
852
.4
890
.5
928
.7
966
.9
Ref
lect
ancy
(%
)
Wavelength (nm)
2014 Green Trees Base Soil
Flowering Trees Brown Trees

Spectral linear unmixing
Change vector analysis (CVA)
Ecosystem services quantification

Air- and space-borne imaging
& in situ observations
Ecosystem services quantification
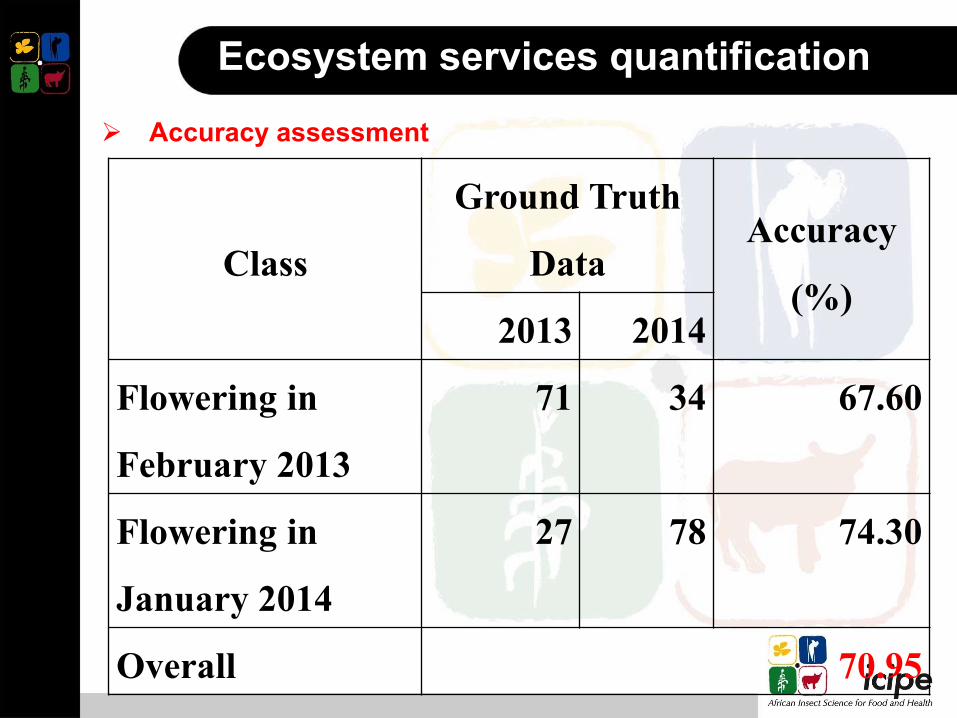
Accuracy assessment
Ecosystem services quantification
Class
Ground Truth
Data Accuracy
(%) 2013 2014
Flowering in
February 2013
71 34 67.60
Flowering in
January 2014
27 78 74.30
Overall 70.95

Disease mapping
Animal tracking to understand their migration routes in order to
understand rift valley fever (RVF) outbreak
Seasonal pattern of livestock, disease vectors and ecological
variables enhanced our understanding of how, where and why
certain diseases occur and spread
At the end something like “Income increase and food
insecurity reduced through support to economic growth”

Disease mapping
Animal tracking to understand their migration routes in order
to understand RVF outbreak

Land dynamics
- Land cover and land use
- Vegetation seasonality
- Population and stocking
density
- Fodder availability and quality
- Flooding patterns
- Water body density and
distribution
Livestock Degradation
Constraints & Challenges: data availability, secondary or primary,
feature behavior
Climate, weather
Factors that determine occurrence, vector trajectories,
animal migration as qualitative and quantitative data linkages
Land form

Land dynamics
Cropland and irrigation expansion
Vegetation production and trends
Vegetation variables: amplitudes, point
of „greening‟
Drought indicators
Flooding regime
Livestock Degradation
Constraints & Challenges: data availability, secondary or primary,
feature behavior
Climate, weather
Factors that determine occurrence, vector trajectories, animal
migration as qualitative and quantitative data linkages
Land form

GPS positions
and movements
of two herds
(orange and red)
overlaid on a
satellite derived
map showing
inundation
patterns for 2012
near to permanently flooded
4-6 months of flooding /year
< 4 months of flooding /year
Current work in NE Kenya
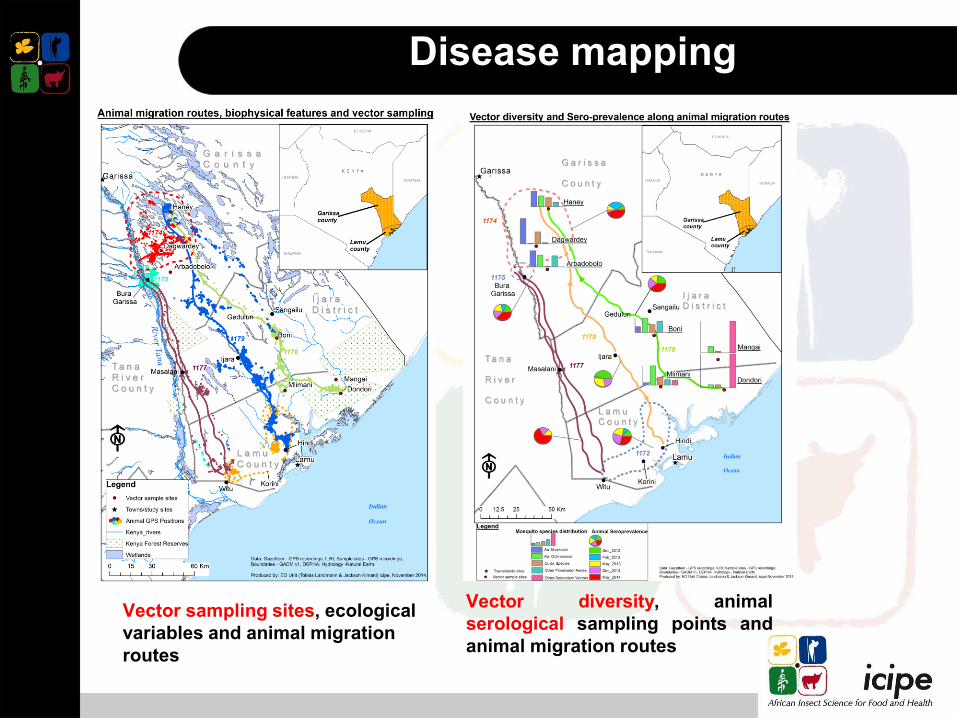
Disease mapping
Vector diversity, animal
serological sampling points and
animal migration routes
Vector sampling sites, ecological
variables and animal migration
routes

Mapping land use dynamics and RVF in Baringo, Isiolo
and Garisa districts
• Understanding dynamic drivers of disease is vital in
understanding how to manage outbreaks, new niches that are
developing and coming up with preventive measures
• According et al. (1992) and Linthicum et al. (2001) RVF occurs
in:
– soil types-solonetz, solanchaks, planosols
– Elevation-less than 1100m asl
– Vector-Aedes,Culicine, and others
– In cycles of 5 to 15 years of heavy rainfall and flooding
especially in arid and semi-arid low lying flat landscape
areas with accumulation of flood water in depressions
known as „dambos‟and has been connected to El
Niño/Southern Oscillation
– Dense vegetation cover persistent for 3 months –NDVI
greater than 0.1

Data used

Spread of RVF outbreak over the years
1912 -1931 1951-1954
1961-1964 2006-2007

Mapping RVF niches using RS
According to Hightower et al.
2012 solonetz, calcisols,
solonchaks and planosols area
associated with RFV because of
its ability to retain water for
long hence providing breeding
ground for mosquitoes
Garisa is largely covered by
solonetz soil type
-Hydro tools was used to
generate the drainage pattern
of the study area using 30m
DEM
-Rivers developed from
200,000m2 drainage area
-Sinks indicate area where
water can collect e.g dambos
-Generated using Hammond
landform formula
-Garisa and Isiolo is largely
flat
-Baringo varies from plains
with high mountains to nearly
flat plains
Case study of Somaliland

Conclusions
Successful applications of GIS/ RS (Spatial
modeling) in addressing icipe‟s R&D themes
The results/ outputs of these projects (e.g.,
land productivity and flower maps) could be
use to assist researchers and policy makers in
taking informed decisions regarding issues of
food security that uplifting livelihood of people

Acknowledgements

Thank you