the application of menu engineering technique in
TRANSCRIPT

Journal of Business and Entrepreneurship, 8(1), May 2020, 18-39
ISSN: 2302-4119 (Print), 2685-6255 (Online)
18
THE APPLICATION OF MENU ENGINEERING TECHNIQUE
IN DETERMINING MARKETING STRATEGY AT THE DEN OF
KALAHA RESTAURANT JAKARTA
Imam Ardiansyah Universitas Bunda Mulia
Original Research
Received 6 February 2020
Revised 9 March 2020
Accepted 12 April 2020
Abstract
This research was conducted to determine the classification of menu at The Den of Kalaha restaurant in Jakarta
and evaluate the marketing strategies to increase the restaurant’s profit using the menu engineering technique.
The research approach is qualitative using descriptive analysis with menu engineering analysis methods. The
object of this study is all food menus at The Den of Kalaha restaurant which were sold in between July and
December 2019. The results of the research were obtained from food menu in all categories. Out of the 74
menu items, 14 falls into the star group (18.92%), 22 in the plowhorse group (29.73%), 22 in the puzzle group
(29.73%), and 16 in the dog group (21.62%). Suggestions for management is to periodically implement the
menu engineering technique, where the benefits are that management to be responsive and able to make the
right decisions if profits having a decline.
Keywords: menu engineering, popularity index, food menu, contribution margin
Abstrak
Tujuan penelitian ini adalah untuk menentukan klasifikasi menu di restoran The Den of Kalaha di Jakarta
dan mengevaluasi strategi pemasaran untuk meningkatkan laba restoran menggunakan teknik menu
engineering. Metode penelitian adalah kualitatif dengan menggunakan analisis deskriptif dengan analisis
rekayasa menu. Objek penelitian ini adalah semua menu makanan di restoran The Den of Kalaha yang
terjual antara bulan Juli dan Desember 2019. Hasil penelitian diperoleh dari menu makanan di semua
kategori. Dari 74 item menu, 14 masuk ke dalam kelompok star (18,92%), 22 dalam kelompok plowhorse
(29,73%), 22 dalam kelompok puzzle (29,73%), dan 16 dalam kelompok dog (21,62%). Saran bagi
manajemen adalah menerapkan teknik menu engineering secara berkala yang manfaatnya menjadikan
manajemen lebih responsif dan mampu membuat keputusan yang tepat jika laba mengalami penurunan.
Kata Kunci: menu engineering, index popularitas, menu makanan, margin kontribusi
Corresponding Author:
Recommended Citation:
Ardiansyah, I. (2020). The Application of Menu Engineering Technique in Determining Marketing Strategy at the
Den of Kalaha Restaurant Jakarta. Journal of Business and Entrepreneurship, 8 (1), 18-39.
This article is available online at:
http://ojs.sampoernauniversity.ac.id

Journal of Business and Entrepreneurship, 8(1), May 2020, 18-39
19
INTRODUCTION
Today’s tourism industry is being promoted by the government besides the natural products which
has an important role in the Indonesian economy. The development paradigms of several countries
are now more oriented towards the development of the service sector and industry, including tourism.
Likewise, in Indonesia, tourism sector activities have been encouraged and responded positively by
the government in the hope that this sector will help increase foreign exchange reserves and
pragmatically will also be able to increase people’s income.
One of the facilities that support tourism activities is the service business that provides food
and drinks or commonly referred to as restaurants. The definition of restaurant according to
Ninemeier and Hayes (2011) is a food service operation that brings profit where the main base
includes selling food and drinks to individuals and guests in small groups. The factor that is the
main strength for businesses in the restaurant sector is the menu, even the menu can also be the
identity of the restaurant. A good menu can be a major source of income for restaurants and can be
a capital for a restaurant to last long enough even for years. Therefore, the ability to provide the menu
will determine the success of the culinary business. According to Ninemeier (2006), there is a belief
in the food service industry that everything starts with the menu. Along with the development of the
culinary world today, restaurants are also experiencing quite rapid development, especially in the
variety of food and beverage menus.
According to Spears and Gregoire (2012), a menu is a list of food items available for selection
by a customer, serves as the primary control of the food service operation and is the core common to
all functions of the system. The menu has an important role in restaurant operations because it is a
benchmark in starting a restaurant business. Restaurant themes, decor, layout and employee
placement all depend on the menu offered. Therefore, the menu is very influential in the success of
a restaurant business, especially when viewed from the function side of it, which is a marketing tool
of food and beverages for selling and promotion (Suyono, 2004).
As an important factor in supporting the success of a restaurant business to sell food and
drinks, a menu must be chosen well, in terms of taste, appearance and price that is attractive to
consumers and provide benefits for restaurants. Aside from being a tool offering a product, in a
restaurant business a menu also needs to be evaluated. This aims to help the management in planning

Journal of Business and Entrepreneurship, 8(1), May 2020, 18-39
20
the next menu. In addition, with the menu evaluation process, management can find out if there are
less popular menus, so that management can immediately take action on the problem.
A good menu can be seen from the level of sales and its ability to provide profits or the level
of popularity and profitability. As stated by Ninemeier and Hayes (2011), there are two factors
measuring how good the menu is: its popularity and its profitability. The statement shows that those
are the two benchmarks of a menu that can be said to be good in terms of popularity and in terms of
profits.
The relationship between the two parameters need to be made a comparison that can provide
conclusions about the position of each type of food in the offered menu mix so it will get a category
about the ability of these food menu items. As expressed by Ninemeier (2006), with these tools from
the menu engineering, a manager can evaluate the profitability of the menu items and classify them
as either a star, plowhorse, puzzle or dog, so with this classification it will facilitate the marketing
strategy related to food menus that will be sold in the restaurant.
Although, at first glance, the menu engineering looks very complex, but it apparently has
been widely used in improving managerial effectiveness in manufacturing price, content, design and
marketing strategy. As with other economic activities, pressure due to inflation is one of the most
troubling obstacles restaurant entrepreneurs, especially the presentation.
To further clarify the point stated previously, the current research shows concerns related to
the menu offered by The Den of Kalaha Restaurant Jakarta. The data in Table 1 displays the food
sales from July to December in 2018 and 2019.
Table 1. Food Menu Sales Proceeds
Category Jul Aug Sep Oct Nov Dec Total
Variance 2018 2019 2018 2019 2018 2019 2018 2019 2018 2019 2018 2019 2018 2019
Appetizer 1009 862 990 846 1064 950 1012 946 1110 941 1043 940 6228 5485 -7.4336
Salad 165 135 220 176 199 170 196 177 189 160 187 187 1156 1005 -1.5087
Main course 2022 1631 2053 1604 1805 1612 1912 1677 1827 1617 1875 1786 11495 9927 -15.6829
Soup 577 465 537 459 461 412 527 443 535 453 574 517 3211 2749 -4.6165
Pasta 631 509 624 533 638 555 620 579 634 556 640 542 3786 3274 -5.1195
Asian 419 338 364 311 373 333 397 371 444 376 470 398 2466 2127 -3.3924
Kids Menu 268 216 233 199 254 235 236 221 296 251 284 241 1572 1363 -2.085

Journal of Business and Entrepreneurship, 8(1), May 2020, 18-39
21
Based on the data from each menu category offered for 6 months, the 2019 period has a
declining trend compared to 2018 with a difference rate of 2% to 7% per year. From the sales data,
the problem lies in the decreasing amount of sales. By this evaluation alone, the management needs
to find creative solutions to survive the restaurant industry.
Based on the objectives of this research, the research problems are: (1) What is the
classification of food menu of The Den of Kalaha using the technique of menu engineering? (2)
What are the suggestions for the marketing strategy at The Den of Kalaha after the menu
engineering analysis?
LITERATURE REVIEW
Menu
The menu is a list of food and drinks accompanied by prices and a brief explanation of the processing
that is served to guests who come to the restaurant. According to Ninemeier (2006), the menu is the
basis for controlling processes in food and beverage operations. As a basis, menu planning controls
the core of the beginning of an activity process. A menu can affect the sales of food items, an
attractive and appropriate menu arrangement can increase sales.
Kotschevar and Withrow (2008) mentioned that the menu is the central management
document around which the whole food service operation revolves. A menu consisting of food and
drinks is a product offered by a restaurant with the primary purpose of being sold. Thus, the menu is
the basis for the establishment of a restaurant or other food service business which can affect the
success or failure of operations.
Menu Engineering
One of the purposes of menu engineering is to measure the ability of the menu to meet the desires of
guests, as well as to determine the contribution of profits obtained by the hotel from the sale of food
and beverages that can help increase sales targets. Based on Drydale and Aldrich’s (2002) study,
menu engineering is an approach to evaluating menu prices, design, and decision making for the
present and future. According to Ninemeier (2006), menu engineering analysis is an approach used

Journal of Business and Entrepreneurship, 8(1), May 2020, 18-39
22
to evaluate a menu item to determine whether items that have high profits have been sold namely
four box analysis. Analysis in the form of four boxes illustrates the category of a menu that has been
analyzed from the group rank found in the Mix Menu.
Menu engineering periodically is able to provide the decision to formulate a strategy based
on the results of menu sales that have occurred within a certain period of time. Hence, to know the
solutions and follow-up that must be done to increase the volume of sales for the next menu.
According to Kasavana and Donald (1982), there are several questions to answer before
starting menu engineering: (1) What is the most favorable price for a menu; (2) What are the potential
costs for the menu being sold; (3) At the level of prices and mixed models that a restaurant can
increase its profits; (4) Which of the current menu materials needs to be rearranged, replaced or
repositioned; and (5) How this change can be evaluated.
Popularity Index
Menu evaluation can be done by analyzing the level of popularity and the level of profits obtained
by the company from each product sold. Item sales are recorded over an establishment period of time
and evaluated on the basis of two major factors: popularity and contribution to sales, to find out how
far a menu is popular, which can be done by recording and analyzing the number of sales from the
menu offered (Scanlon, 2000).
Sales history is a format for recapitulating sales during a period. A sales history is the
systematic recording of all sales achieved during a predetermined time period (Miller et al., 2002).
The above understanding can be interpreted that the sales history is a systematic record of all sales
results obtained within a certain period.
After knowing the number of sales from the sales history, we will calculate the expected
popularity index from each menu. Popularity index can be calculated by dividing the number of
servings sold from one menu type by the total servings sold from all menus (Dittmer, 2003).
Menu Mix
Next is to determine the menu mix percentage of each menu. The definition of a mix percentage
menu according to Coltman and Jagels (2001) is a menu of mixed percentage is converts the number

Journal of Business and Entrepreneurship, 8(1), May 2020, 18-39
23
sold of each menu item into a percentage of all items sold. The quantity sold of each item is divided
by the total of all items sold then multiplied by 100. From this statement, it can be seen that the menu
mix percentage is a percentage of the total sales of each menu, which is obtained by dividing the
number of portions sold from each menu by the total of all menus sold then multiplied by 100.
According to Coltman and Jagel (2001), the categories of the Menu Mix % are to record
either an H (for High) or L (for Low). These definitions are made by comparing each menu item’s
Menu Mix Percentage with the average popularity of all menu items. If the figure Mix % menu is
higher than the average, an H is recorded; and if it is less than average, an L is recorded.
Contribution Margins
Contribution margins are data used to determine the profitability of a menu. In the contribution
margin, there are two determining factors, such as food cost and selling price. According to
Ninemeier (2006), contribution margins are calculated by subtracting food costs from revenue which
can be interpreted as CM which is calculated by subtracting food costs from total income. This is
also supported by Suyono’s (2004) study that the profitability of food is calculated using the
parameters of gross profit (contribution margin) obtained by reducing the cost of ingredients per food
(portion cost per portion) of the selling price. According to Dittmer and Keefe (2009), if contribution
margin for a given menu item is lower than the average contribution margin, the entry for that item
is L for low. If the contribution margin is higher than average, the entry is H for high.
Menu Classification
The menu can be evaluated by analyzing the popularity and ability of each type of food and drink on
a menu to contribute to the benefits (Ninemeier, 2006). The menu items can be evaluated in terms of
both their popularity and profitability. After a menu has known the level of popularity and
profitability, a menu can be entered into a worksheet called a menu engineering worksheet. Each
menu is classified into four categories: Star, Plowhorse, Puzzle, and Dog (Jagles & Ralston, 2007).
These categories are classified based on popularity level and contribution margin level of a menu.
Menus that have a contribution margin that is higher than the average contribution margin
and a level of popularity that is higher than the average popularity are classified into the Star category.

Journal of Business and Entrepreneurship, 8(1), May 2020, 18-39
24
The Plowhorse category is a menu that has a contribution margin lower than the average contribution
margin and a level of popularity that is higher than the average popularity. While the Puzzle category
is a menu that has a contribution margin that is higher than the average contribution margin and a
level of popularity that is lower than the average popularity. The last category is the Dog category,
which is included in that category is a menu that has a level of contribution margin that is lower than
the average contribution margin and a level of popularity that is lower than the average popularity.
Below is an image of the menu engineering classification matrix showing the relationship between
index popularity and contribution margin based on the explanation above.
High MM
Low CM
Low MM High CM
Figure 1. Menu Engineering Classification
Tom and Annaraud (2017) expanded the model into 9 quadrants while applying the fuzzy
set theory to develop a multi-criteria decision-making model (MCDM). With the use of the fuzzy
set theory, this model was able to accept both qualitative and quantitative data to evaluate menu
items’ position on the quadrants. While these methods do not report menu item of performance-
based pure factual and numerical data, it is very practical because it considers a decision maker’s
intuition in evaluating menu item performance. The use of matrixes possesses high flexibility
whereby these approaches are not dependent on the availability of accurate data.
Thinking frameworks are conceptual models of how theories relate to factors that have been
identified as important problems. Hence, the framework of thought is described in Figure 2.
I
Star
II
Plowhorse
IV
Dog
III
Puzzle

Journal of Business and Entrepreneurship, 8(1), May 2020, 18-39
25
Figure 2. Framework Model
RESEARCH METHODOLOGY
Type of research
The type of current research is descriptive qualitative. According to Sugiyono (2013), qualitative
research is a research method used to examine the condition of natural objects, where the researcher
is the key instrument, data collection techniques are carried out by triangulation. Meanwhile,
according to Kusmayadi and Sugiarto (2005), descriptive method is research that seeks to describe
the phenomena studied systematically, factually and accurately. In other words the use of descriptive
research methods, namely the depiction of the actual problems by searching, recording and analyzing
based on the data obtained.
Data Collection Techniques
Collecting data is an important step in research given the importance of the meaning of the data in
the study, so in this study the data collection methods used are as follows:
Menu of The Den of Kalaha
Menu Classification
- Star
- Puzzle
- Plowhorse
- Dog
Popularity
Index Contribution
Margin
Marketing Strategy

Journal of Business and Entrepreneurship, 8(1), May 2020, 18-39
26
a. Documentation
According to Sugiyono (2013), documents are records of events that have already passed,
and they can be in the form of writings, drawings or monumental works of a person.
b. Literature Study
Literature study is a data collection technique that is carried out by searching, gathering,
reading and studying and understanding reference literature sourced from books, journals,
papers and other sources relevant to the problem being studied in order to get clarity of
concepts and theoretical basis related to the discussion.
c. Interview
An interview is a meeting of two people to exchange information and ideas through questions
and answers so that it can be constructed of meaning in a particular topic (Sugiyono, 2013).
The purpose of an interview is to find problems openly, where the parties invited to the
interview are asked for opinions.
Data Analysis Methods
There are several steps in determining the analysis of marketing strategies by applying menu
engineering technique in The Den of Kalaha:
1. Menu Items Analysis
This analysis is carried out to evaluate the entire menu by analyzing all items in the food
menu. The data required is the sale of each menu, contribution margin, food cost, selling price
and menu listing.
2. Menu Mix Analysis
The menu mix analysis functions to classify the menus based on popularity and contribution
margin to the company by calculating the % Menu Mix Share and Average Contribution
Margin. Menu evaluation can be obtained by analyzing the level of popularity and the level
of profits obtained by the company from each product sold. After knowing the number of
sales from the sales history, we will calculate the expected popularity index from each menu.
Popularity index can be calculated by dividing the number of servings sold from one menu
type by the total servings sold from all menus.

Journal of Business and Entrepreneurship, 8(1), May 2020, 18-39
27
3. Menu Engineering Summary
The Menu Engineering Summary is the result of a total summary, average, low price and
highest price of income, food cost, CM, and also the food cost percentage of the entire menu
to be analyzed.
4. Four Box Analysis
After the data has been analyzed, the next step is to group the data into four box analysis.
Each menu that has been analyzed is categorized according to their class. Its function is to
make it easier to read the categories from each menu analyzed.
5. Graphic Menu Engineering
Making graphics in menu engineering menu serves to facilitate viewing the menus that have
been analyzed in graphical form, see the menu in a clearer position and easily see trends from
each menu that has been positioned in the graph.
RESULTS AND DISCUSSION
Calculation of Menu Popularity Index
To get menu evaluation is by analyzing the level of popularity and the level of profits obtained by
the company from each product sold. To find out how far a menu is popular, it can be obtained by
recording and analyzing the number of sales from the menu offered. Sales history is a format for
recapitulating sales during a period. Appendix 1 shows the number of food sales in the period of
July-December 2019.
The Den of Kalaha restaurant has 74 items on the menu consisting of 7 categories: Appetizer,
Salad, Main course, Soup, Pasta, Asian, and Kids Menu. After knowing the number of sales from the
sales history, we can calculate the expected popularity index from each of the menu. Popularity index
can be calculated by dividing the number of servings sold from one menu type by the total servings
sold from all menus (see Figure 3 for the formula). Table 3 shows the menu popularity index into 7
categories. Table 2 shows the menu popularity index into 7 categories.

Journal of Business and Entrepreneurship, 8(1), May 2020, 18-39
28
100% x 70%
Popularity Index =
Number of Menu Items
Figure 3. Popularity Index Calculation
Next is to determine the menu mix percentage of each menu obtained by dividing the number
of portions sold from each menu by the total of all menus sold then multiplied by 100. A menu can
be classified in the High category if the mix % of a menu is greater than the average popularity of
the entire menu, conversely a menu can be classified in the Low category if the mix % of a menu is
lower than the average popularity of the entire menu. Appendix 2 shows the popularity level of each
menu for the period of July-December 2019.
Table 2. Menu Popularity Index (July-December 2019)
Calculation of Contribution Margin
Contribution margins are data used to determine the profitability of a menu. In the contribution
margin there are two determining factors: food cost and selling price. Contribution margins are
calculated by subtracting food costs from total revenue. From this understanding can be formulated
into:
Contribution Margin = Selling Price - Food Cost per portion
Figure 4. Contribution Margin Calculation
No Menu
Category Items
Popularity
Index (%)
1 Appetizer 17 4.12
2 Salad 4 17.5
3 Main Course 26 2.70
4 Soup 9 7.77
5 Pasta 6 11.67
6 Asian 6 11.67
7 Kids Menu 6 11.67

Journal of Business and Entrepreneurship, 8(1), May 2020, 18-39
29
After calculating the contribution margin of each menu, the next step is to calculate the
average contribution margin for each menu category, the average contribution margin obtained by
dividing the total contribution margin by the total menus sold. So, it can be formulated as follows:
Avg. Contribution Margin =
Total Contribution Margin
Total Number of Items Sold
Figure 5. Average Contribution Margin Calculation
The results of the Item Contribution Margin will be compared with the Average Contribution
Margin to see the high or low level of contribution of a menu item. Which can be interpreted, if the
contribution margin of an item is lower than the average margin contribution, then it can be recorded
or marked with L as low conversely if the margin contribution of an item is higher than the average
margin contribution, then it can be indicated by H as high. Appendix 3 shows the contribution
margins of the menu.
Menu Classification
Following the level of popularity and profitability, a menu can be logged into the menu engineering
worksheet. Each menu is classified into four categories, i.e. Star, Plowhorse, Puzzle, and Dog. These
categories are classified based on popularity level and contribution margin level of a menu. Menus
that have a contribution margin that is higher than the average contribution margin and a level of
popularity that is higher than the average popularity are classified into the Star category. The
Plowhorse category is a menu that has a contribution margin lower than the average contribution
margin and a level of popularity that is higher than the average popularity. While the Puzzle category
is a menu that has a contribution margin that is higher than the average contribution margin and a
level of popularity that is lower than the average popularity. The last category is the Dog category,
which is included in that category is a menu that has a level of contribution margin that is lower than
the average contribution margin and a level of popularity that is lower than the average popularity.

Journal of Business and Entrepreneurship, 8(1), May 2020, 18-39
30
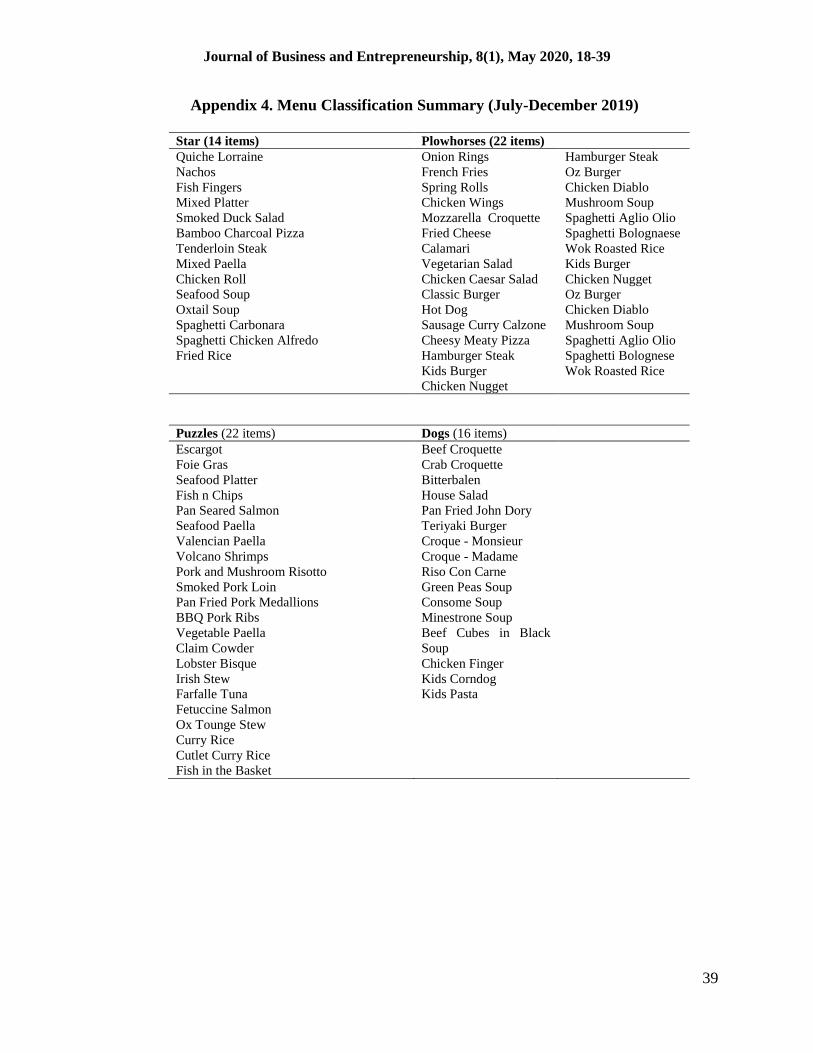
Based on the calculated data analysis, it can be seen of the 74 menu items at The Den of
Kalaha Restaurant Jakarta, 14 items fall into the Star group or 18.91%, 22 items in the Plowhorse
group (29.72%), 22 in the Puzzle group (29.72%), and 16 in the Dog group (21.62%). Appendix 4
shows the summary of menu classification by category.
After evaluating with the engineering menu technique, it can be seen that the 14 items in the
Star menu category (18.91%) boasts high profit level and high popularity level, followed by the 22
popular but less profitable items in the Plowhorse menu (29.72%), 16 unpopular and unprofitable
items in the Dog menu (21.62%), and 22 low popularity yet high profit items in the Puzzle menu
(29.72%).
CONCLUSION AND RECOMMENDATIONS
Conclusion
Based on the results of the analysis of the popularity index of the menu, it can be concluded that out
of the 74 food items, 36 items (48.64%) are in the category that has a high popularity index, while
38 items (51.35%) are in the category that has a low popularity index. Based on the results of the
analysis of the contribution margin of the menu, it can be concluded that out of the 74 food items, 36
items (48.64%) are in the category with high contribution margins, while 38 items (51.35%) fall into
the category of low contribution margins. From the overall category, 14 items are included in the
Star group (18.91%) 22 in the Plowhorse group (29.72%), 22 in the Puzzle group (29.72%), and 16
in the Dog group (21.62%).
Recommendations
The research results provide restaurant managers with significant insights. The management is
suggested to monitor the performance of the existing menus and pay attention to the main
indicators of the relationship with the popularity index and contribution margin to ensure that the
expectations to increase profits can be continuously achieved.
The management may also be well advised to consider evaluating the menus periodically by
implementing menu engineering technique to improve better decision making in the event of

Journal of Business and Entrepreneurship, 8(1), May 2020, 18-39
31
unintended consequences to happen, e.g. a low inventory turnover, decreasing profit margins in the
restaurant.
The marketing strategies for the Star category shows that the management is able to maintain
and improve the quality of the food and the appearance so that it remains accepted by consumers. By
using the highest quality ingredients, the taste of the food will be maintained in accordance with
existing standard recipe. The price of raw materials needs to be reviewed so that if there is an increase
can be gradual without overly burdening consumers. The management is advised to conduct a
comparative study to a competitor’s restaurant to see a comparison of price, appearance and taste to
be able to innovate the menus.
For the Plowhorse category shows that the management may want to evaluate the costs
incurred because this menu is included in the menu which does not provide a maximum contribution
margin for the company. The supervision needs to be extra strict in terms of ordering raw materials,
processing and forms of food serving patterns so that the expected profit results can be realized. The
management is advised to carry out a gradual process in an effort to increase selling prices so that if
this happens there is slowly improvement and there is progress, then these menus will be a star menu
category.
For the Puzzle category, it seems that there is a need for a management review by paying
attention to the selling price by lowering it so that it can be well accepted by consumers. Providing
discounted prices of the menu may increase sales while promoting them on all lines of marketing
media. It is also advised to limit the quantity the menu items by removing or repositioning them to
avoid overloading the restaurant cost.
For the Dog category, the management needs to review whether some of the menu items to
be replaced with fresher and interesting ones. To change the names in the menu is also advised. To
enhance the taste and appearance, the management needs to supervise the menu. The staff needs to
be well educated by providing information for suggestive selling so the popularity level of the menu
will increase. Substitution of food ingredients at lower prices without reducing the taste and
appearance of the food is also advisable.
This research suffers from certain limitations that merit mention. The research did not analyze
the entire restaurant menu, as beverages, desserts and promotions were excluded from the analysis.
It means that it was not possible to evaluate the entire establishment, providing only a partial view
of the restaurant. The suggestion for future research is to apply this menu engineering technique to
Journal of Business and Entrepreneurship, 8(1), May 2020, 18-39
32
other restaurant types located in different geographical areas to validate the approach and evaluate
the efficiency of this techniques over the time.
REFERENCES
Coltman, M. M., & Jagel, M. G. (2001). Hospitality Management. Canada: John Wiley & Sons, Inc.
Dittmer, P. (2003). Principles of Food, Beverage, and Labor Cost Control 7th ed. New York: John Wiley
& Sons.
Dittmer, P., & Keefe, J. (2009). Principle of Food, Beverage, and Labor Cost Control. New Jersey: John
Wiley & Sons.
Drydale, J., & Aldrich, J. (2002). Profitable Menu Planning. New Jersey: Prentice Hall.
Jagels, M. G., & Ralston, C. E. (2007). Hospitality Management Accounting. New Jersey: John Wiley &
Sons.
Kasavana, M., & Donald, I. (1982). Menu Engineering. Miami: Hospitality Publication.
Kotschevar, L., & Withrow, D. (2008). Management by Menu. Hoboken: John Wiley & Sons Inc.
Kusmayadi, & Sugiarto, E. (2005). Metodologi Penelitian dalam Bidang Kepariwisataan. Jakarta:
Gramedia.
Miller, J., Hayes, D., & Dopson, L. (2002). Food and Beverage Cost Control. New York: John Wiley &
Sons.
Ninemeier, J. D. (2006). Management of Food and Beverage Operations. New Jersey: Prentice Hall.
Ninemeier, J. D., & Hayes, D. (2011). Restaurant Operations Management. New Jersey: Prentice Hall.
Scanlon, N. L. (2000). Catering Management. New York: John Wiley & Son.
Spears, & Gregoire. (2012). Food Service Organizations: A Managerial and System Approach. New Jersey:
Prentice Hall.
Sugiyono. (2013). Metode Penelitian Administrasi. Bandung: Alfabeta.
Suyono, J. (2004). Food Service Management. Bandung: Enhaii Press.
Suyono, J. (2004). Food Service Management Dasar-Dasar Mengolah Bisnis Restoran. Bandung: Enhaii
Press.
Journal of Business and Entrepreneurship, 8(1), May 2020, 18-39
33
Tom, M., & Annaraud, K. (2017). A fuzzy multi-criteria decision making model for menu engineering.
IEEE International Conference on Fuzzy Systems.
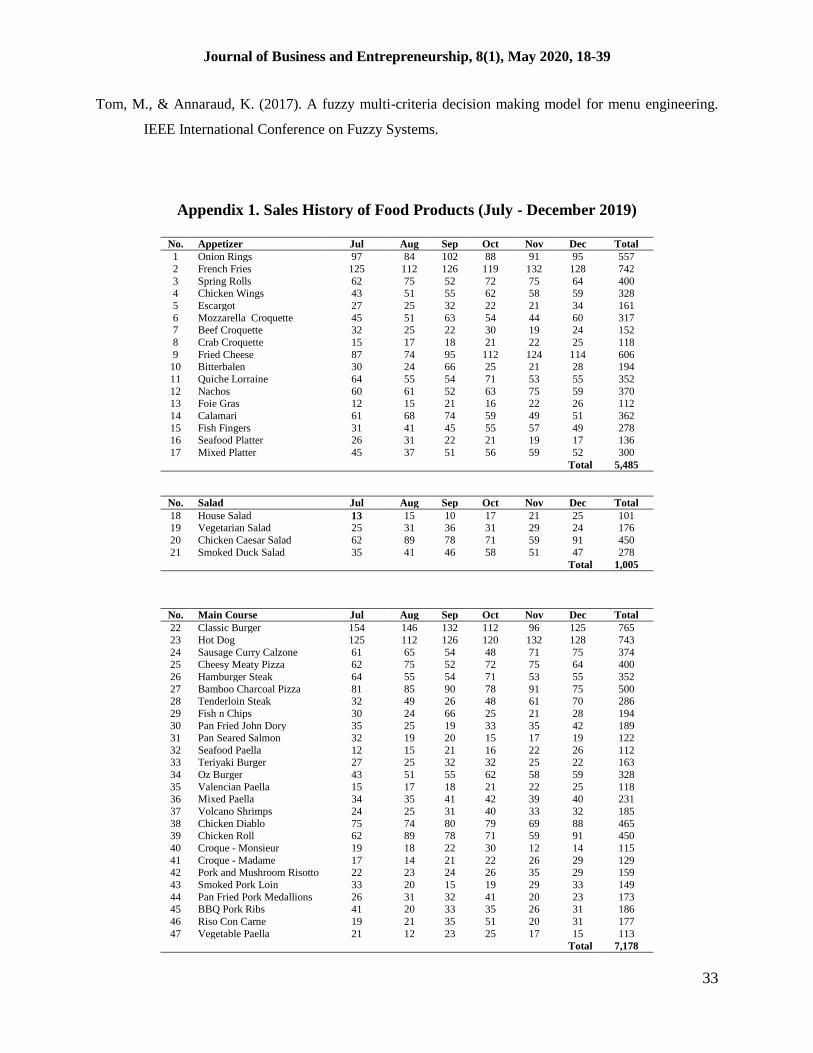
Appendix 1. Sales History of Food Products (July - December 2019)
No. Appetizer Jul Aug Sep Oct Nov Dec Total
1 Onion Rings 97 84 102 88 91 95 557
2 French Fries 125 112 126 119 132 128 742
3 Spring Rolls 62 75 52 72 75 64 400 4 Chicken Wings 43 51 55 62 58 59 328
5 Escargot 27 25 32 22 21 34 161
6 Mozzarella Croquette 45 51 63 54 44 60 317 7 Beef Croquette 32 25 22 30 19 24 152
8 Crab Croquette 15 17 18 21 22 25 118
9 Fried Cheese 87 74 95 112 124 114 606 10 Bitterbalen 30 24 66 25 21 28 194
11 Quiche Lorraine 64 55 54 71 53 55 352
12 Nachos 60 61 52 63 75 59 370 13 Foie Gras 12 15 21 16 22 26 112
14 Calamari 61 68 74 59 49 51 362
15 Fish Fingers 31 41 45 55 57 49 278 16 Seafood Platter 26 31 22 21 19 17 136
17 Mixed Platter 45 37 51 56 59 52 300
Total 5,485
No. Salad Jul Aug Sep Oct Nov Dec Total
18 House Salad 13 15 10 17 21 25 101 19 Vegetarian Salad 25 31 36 31 29 24 176
20 Chicken Caesar Salad 62 89 78 71 59 91 450
21 Smoked Duck Salad 35 41 46 58 51 47 278
Total 1,005
No. Main Course Jul Aug Sep Oct Nov Dec Total
22 Classic Burger 154 146 132 112 96 125 765
23 Hot Dog 125 112 126 120 132 128 743
24 Sausage Curry Calzone 61 65 54 48 71 75 374
25 Cheesy Meaty Pizza 62 75 52 72 75 64 400
26 Hamburger Steak 64 55 54 71 53 55 352
27 Bamboo Charcoal Pizza 81 85 90 78 91 75 500 28 Tenderloin Steak 32 49 26 48 61 70 286
29 Fish n Chips 30 24 66 25 21 28 194
30 Pan Fried John Dory 35 25 19 33 35 42 189 31 Pan Seared Salmon 32 19 20 15 17 19 122
32 Seafood Paella 12 15 21 16 22 26 112 33 Teriyaki Burger 27 25 32 32 25 22 163
34 Oz Burger 43 51 55 62 58 59 328
35 Valencian Paella 15 17 18 21 22 25 118 36 Mixed Paella 34 35 41 42 39 40 231
37 Volcano Shrimps 24 25 31 40 33 32 185
38 Chicken Diablo 75 74 80 79 69 88 465 39 Chicken Roll 62 89 78 71 59 91 450
40 Croque - Monsieur 19 18 22 30 12 14 115
41 Croque - Madame 17 14 21 22 26 29 129 42 Pork and Mushroom Risotto 22 23 24 26 35 29 159
43 Smoked Pork Loin 33 20 15 19 29 33 149
44 Pan Fried Pork Medallions 26 31 32 41 20 23 173 45 BBQ Pork Ribs 41 20 33 35 26 31 186
46 Riso Con Carne 19 21 35 51 20 31 177
47 Vegetable Paella 21 12 23 25 17 15 113
Total 7,178

Journal of Business and Entrepreneurship, 8(1), May 2020, 18-39
34
No. Soup Jul Aug Sep Oct Nov Dec Total
48 Green Peas Soup 17 14 21 22 26 29 129
49 Consome Soup 33 20 15 19 29 33 149 50 Minestrone Soup 12 15 21 16 22 26 112
51 Claim Cowder 15 17 18 21 22 25 118
52 Mushroom Soup 120 119 105 139 130 125 738 53 Seafood Soup 80 79 65 71 76 89 460
54 Lobster Bisque 26 18 17 11 22 14 108
55 Oxtail Soup 131 145 132 121 110 151 790 56 Irish Stew 31 32 18 23 16 25 145
Total 2,749
No. Pasta Jul Aug Sep Oct Nov Dec Total
57 Spaghetti Aglio Olio 142 134 122 158 162 144 862
58 Spaghetti Bolognaese 122 131 145 149 112 135 794
59 Spaghetti Carbonara 80 110 115 109 95 97 606 60 Spaghetti Chicken Alfredo 81 84 89 80 94 79 507
61 Farfalle Tuna 62 53 64 55 61 58 353
62 Fetuccine Salmon 22 21 20 28 32 29 152
Total 3274
No. Asian Jul Aug Sep Oct Nov Dec Total
63 Wok Roasted Rice 120 119 105 120 132 128 724
64 Beef Cubes in Black Soup 17 14 21 22 26 29 129
65 Ox Tounge Stew 24 25 31 40 33 32 185 66 Fried Rice 125 112 126 119 136 145 763
67 Curry Rice 33 20 15 19 29 33 149
68 Cutlet Curry Rice 19 21 35 51 20 31 177
Total 2,127
No. Kid’s Menu Jul Aug Sep Oct Nov Dec Total
69 Chicken Finger 26 31 22 21 22 29 151
70 Kids Burger 60 47 55 63 75 59 359 71 Kids Corndog 17 14 21 22 26 17 117
72 Chicken Nugget 74 65 84 77 82 76 458
73 Kids Pasta 27 25 32 22 21 34 161 74 Fish in the Basket 12 17 21 16 25 26 117
Total 1,363
Grand Total 23,181

Journal of Business and Entrepreneurship, 8(1), May 2020, 18-39
35
Appendix 2. The Menu Mix Category (July-December 2019)
No Appetizer Unit Sold Menu Mix (%) MM Category
1 Onion Rings 557 10.15 High 2 French Fries 742 13.53 High
3 Spring Rolls 400 7.29 High
4 Chicken Wings 328 5.98 High 5 Escargot 161 2.94 Low
6 Mozzarella Croquette 317 5.78 High
7 Beef Croquette 152 2.77 Low 8 Crab Croquette 118 2.15 Low
9 Fried Cheese 606 11.05 High
10 Bitterbalen 194 3.54 Low 11 Quiche Lorraine 352 6.42 High
12 Nachos 370 6.75 High
13 Foie Gras 112 2.04 Low 14 Calamari 362 6.60 High
15 Fish Fingers 278 5.07 High
16 Seafood Platter 136 2.48 Low 17 Mixed Platter 300 5.47 High
Total 5485 Popularity Index 4.12
No Salad Unit Sold Menu Mix (%) MM Category
1 House Salad 101 10.05 Low
2 Vegetarian Salad 176 17.51 High 3 Chicken Caesar Salad 450 44.78 High
4 Smoked Duck Salad 278 27.66 High
Total 1005 Popularity Index 17.50
No Main Course Unit Sold Menu Mix (%) MM Category
1 Classic Burger 765 10.66 High
2 Hot Dog 743 10.35 High
3 Sausage Curry Calzone 374 5.21 High 4 Cheesy Meaty Pizza 400 5.57 High
5 Hamburger Steak 352 4.90 High
6 Bamboo Charcoal Pizza 500 6.97 High 7 Tenderloin Steak 286 3.98 High
8 Fish n Chips 194 2.70 Low
9 Pan Fried John Dory 189 2.63 Low 10 Pan Seared Salmon 122 1.70 Low
11 Seafood Paella 112 1.56 Low 12 Teriyaki Burger 163 2.27 Low
13 Oz Burger 328 4.57 High 14 Valencian Paella 118 1.64 Low
15 Mixed Paella 231 3.22 High
16 Volcano Shrimps 185 2.58 Low 17 Chicken Diablo 465 6.48 High
18 Chicken Roll 450 6.27 High
19 Croque - Monsieur 115 1.60 Low 20 Croque - Madame 129 1.80 Low
21 Pork and Mushroom Risotto 159 2.22 Low
22 Smoked Pork Loin 149 2.08 Low 23 Pan Fried Pork Medallions 173 2.41 Low
24 BBQ Pork Ribs 186 2.59 Low
25 Riso Con Carne 177 2.47 Low
26 Vegetable Paella 113 1.57 Low Total 7178 Popularity Index 2.70

Journal of Business and Entrepreneurship, 8(1), May 2020, 18-39
36
No Soup Unit Sold Menu Mix (%) MM Category
1 Green Peas Soup 129 4.69 Low 2 Consome Soup 149 5.42 Low
3 Minestrone Soup 112 4.07 Low
4 Claim Cowder 118 4.29 Low 5 Mushroom Soup 738 26.85 High
6 Seafood Soup 460 16.73 High
7 Lobster Bisque 108 3.93 Low 8 Oxtail Soup 790 28.74 High
9 Irish Stew 145 5.27 Low
Total 2749 Popularity Index 7.77
No Pasta Unit Sold Menu Mix (%) MM Category
1 Spaghetti Aglio Olio 862 26.33 High 2 Spaghetti Bolognaese 794 24.25 High
3 Spaghetti Carbonara 606 18.51 High
4 Spaghetti Chicken Alfredo 507 15.49 High 5 Farfalle Tuna 353 10.78 Low
6 Fetuccine Salmon 152 4.64 Low Total 3274 Popularity Index 11.67
No. Asian Unit Sold Menu Mix (%) MM Category
1 Wok Roasted Rice 724 34.04 High
2 Beef Cubes in Black Soup 129 6.06 Low
3 Ox Tounge Stew 185 8.70 Low
4 Fried Rice 763 35.87 High
5 Curry Rice 149 7.01 Low
6 Cutlet Curry Rice 177 8.32 Low
Total 2127 Popularit Index 11.67
No. Kids Menu Unit Sold Menu Mix (%) MM Category
1 Chicken Finger 151 11.08 Low 2 Kids Burger 359 26.34 High
3 Kids Corndog 117 8.58 Low
4 Chicken Nugget 458 33.60 High 5 Kids Pasta 161 11.81 Low
6 Fish in the Basket 117 8.58 Low Total 1363 Popularity Index 11.67

Journal of Business and Entrepreneurship, 8(1), May 2020, 18-39
37
Appendix 3. Contribution Margins (July-December 2019)
No. Appetizer Unit Sold
(MM)
Item Cost
(IDR)
Selling Price
(IDR)
Item
CM
(IDR)
Menu Cost
(IDR)
Revenue
(IDR)
Menu CM
(IDR)
CM
Category
1 Onion Rings 557 16,800 42,000 25,200 9,357,600 23,394,000 14,036,400 Low 2 French Fries 742 22,800 57,000 34,200 16,917,600 42,294,000 25,376,400 Low
3 Spring Rolls 400 20,800 52,000 31,200 8,320,000 20,800,000 12,480,000 Low
4 Chicken Wings 328 25,200 63,000 37,800 8,265,600 20,664,000 12,398,400 Low 5 Escargot 161 37,600 94,000 56,400 6,053,600 15,134,000 9,080,400 Hi
6 Mozzarella Croquette 317 22,800 57,000 34,200 7,227,600 18,069,000 10,841,400 Low
7 Beef Croquette 152 25,200 63,000 37,800 3,830,400 9,576,000 5,745,600 Low 8 Crab Croquette 118 25,200 63,000 37,800 2,973,600 7,434,000 4,460,400 Low
9 Fried Cheese 606 16,800 42,000 25,200 10,180,800 25,452,000 15,271,200 Low
10 Bitterbalen 194 25,200 63,000 37,800 4,888,800 12,222,000 7,333,200 Low 11 Quiche Lorraine 352 27,200 68,000 40,800 9,574,400 23,936,000 14,361,600 High
12 Nachos 370 29,200 73,000 43,800 10,804,000 27,010,000 16,206,000 High
13 Foie Gras 112 104,800 262,000 157,200 11,737,600 29,344,000 17,606,400 High 14 Calamari 362 25,200 63,000 37,800 9,122,400 22,806,000 13,683,600 Low
15 Fish Fingers 278 27,200 68,000 40,800 7,561,600 18,904,000 11,342,400 High
16 Seafood Platter 136 75,600 189,000 113,400 10,281,600 25,704,000 15,422,400 High 17 Mixed Platter 300 35,600 89,000 53,400 10,680,000 26,700,000 16,020,000 High
Total 5,485 147,777,200 369,443,000 221,665,800
Average CM 40,413
No. Salad Unit Sold
(MM)
Item Cost
(IDR)
Selling Price
(IDR)
Item
CM
(IDR)
Menu Cost
(IDR)
Revenue
(IDR)
Menu CM
(IDR)
CM
Category
18 House Salad 101 16,800 42,000 25,200 1,696,800 4,242,000 2,545,200 Low
19 Vegetarian Salad 176 18,800 47,000 28,200 3,308,800 8,272,000 4,963,200 Low 20 Chicken Caesar Salad 450 22,800 57,000 34,200 10,260,000 25,650,000 15,390,000 Low
21 Smoked Duck Salad 278 31,200 78,000 46,800 8,673,600 21,684,000 13,010,400 High
Total 1,005 23,939,200 59,848,000 35,908,800
Average CM 35,730
No. Main Course Unit Sold
(MM)
Item Cost
(IDR)
Selling Price
(IDR)
Item
CM
(IDR)
Menu Cost
(IDR)
Revenue
(IDR)
Menu CM
(IDR)
CM
Category
22 Classic Burger 765 27,200 68,000 40,800 20,808,000 52,020,000 31,212,000 Low
23 Hot Dog 743 27,200 68,000 40,800 20,209,600 50,524,000 30,314,400 Low
24 Sausage Curry
Calzone 374 29,200 73,000 43,800 10,920,800 27,302,000 16,381,200 Low
25 Cheesy Meaty Pizza 400 35,600 89,000 53,400 14,240,000 35,600,000 21,360,000 Low 26 Hamburger Steak 352 35,600 89,000 53,400 12,531,200 31,328,000 18,796,800 Low
27 Bamboo Charcoal
Pizza 500 42,000 105,000 63,000 21,000,000 52,500,000 31,500,000 High
28 Tenderloin Steak 286 67,200 168,000 100,800 19,219,200 48,048,000 28,828,800 High
29 Fish n Chips 194 39,600 99,000 59,400 7,682,400 19,206,000 11,523,600 High 30 Pan Fried John Dory 189 33,600 84,000 50,400 6,350,400 15,876,000 9,525,600 Low
31 Pan Seared Salmon 122 48,000 120,000 72,000 5,856,000 14,640,000 8,784,000 High
32 Seafood Paella 112 62,800 157,000 94,200 7,033,600 17,584,000 10,550,400 High 33 Teriyaki Burger 163 27,200 68,000 40,800 4,433,600 11,084,000 6,650,400 Low
34 Oz Burger 328 37,600 94,000 56,400 12,332,800 30,832,000 18,499,200 Low
35 Valencian Paella 118 54,400 136,000 81,600 6,419,200 16,048,000 9,628,800 High 36 Mixed Paella 231 62,800 157,000 94,200 14,506,800 36,267,000 21,760,200 High
37 Volcano Shrimps 185 46,000 115,000 69,000 8,510,000 21,275,000 12,765,000 High
38 Chicken Diablo 465 31,200 78,000 46,800 14,508,000 36,270,000 21,762,000 Low 39 Chicken Roll 450 35,600 89,000 53,400 16,020,000 40,050,000 24,030,000 High
40 Croque - Monsieur 115 29,200 73,000 43,800 3,358,000 8,395,000 5,037,000 Low
41 Croque - Madame 129 31,200 78,000 46,800 4,024,800 10,062,000 6,037,200 Low
42 Pork and Mushroom
Risotto 159 33,600 84,000 50,400 5,342,400 13,356,000 8,013,600 High
43 Smoked Pork Loin 149 54,400 136,000 81,600 8,105,600 20,264,000 12,158,400 High
44 Pan Fried Pork
Medallions 173 60,800 152,000 91,200 10,518,400 26,296,000 15,777,600 High
45 BBQ Pork Ribs 186 67,200 168,000 100,800 12,499,200 31,248,000 18,748,800 High 46 Riso Con Carne 177 27,200 68,000 40,800 4,814,400 12,036,000 7,221,600 Low

Journal of Business and Entrepreneurship, 8(1), May 2020, 18-39
38
47 Vegetable Paella 113 46,000 115,000 69,000 5,198,000 12,995,000 7,797,000 High Total 7,178 276,442,400 691,106,000 414,663,600
Average CM 57,769
No. Soup Unit Sold
(MM)
Item Cost
(IDR)
Selling Price
(IDR)
Item
CM
(IDR)
Menu Cost
(IDR)
Revenue
(IDR)
Menu CM
(IDR)
CM
Category
48 Green Peas Soup 129 16,800 42,000 25,200 2,167,200 5,418,000 3,250,800 Low
49 Consome Soup 149 18,800 47,000 28,200 2,801,200 7,003,000 4,201,800 Low
50 Minestrone Soup 112 18,800 47,000 28,200 2,105,600 5,264,000 3,158,400 Low 51 Claim Cowder 118 46,000 115,000 69,000 5,428,000 13,570,000 8,142,000 High
52 Mushroom Soup 738 20,800 52,000 31,200 15,350,400 38,376,000 23,025,600 Low
53 Seafood Soup 460 33,600 84,000 50,400 15,456,000 38,640,000 23,184,000 High 54 Lobster Bisque 108 39,600 99,000 59,400 4,276,800 10,692,000 6,415,200 High
55 Oxtail Soup 790 46,000 115,000 69,000 36,340,000 90,850,000 54,510,000 High
56 Irish Stew 145 40,000 100,000 60,000 5,800,000 14,500,000 8,700,000 High Total 2,749 89,725,200 224,313,000 134,587,800
Average CM 48,959
No. Pasta Unit Sold
(MM)
Item Cost
(IDR)
Selling Price
(IDR)
Item
CM
(IDR)
Menu Cost
(IDR)
Revenue
(IDR)
Menu CM
(IDR)
CM
Category
57 Spaghetti Aglio Olio 862 25,200 63,000 37,800 21,722,400 54,306,000 32,583,600 Low
58 Spaghetti Bolognaese 794 25,200 63,000 37,800 20,008,800 50,022,000 30,013,200 Low
59 Spaghetti Carbonara 606 29,200 73,000 43,800 17,695,200 44,238,000 26,542,800 High
60 Spaghetti Chicken
Alfredo 507 29,200 73,000 43,800 14,804,400 37,011,000 22,206,600 High
61 Farfalle Tuna 353 29,200 73,000 43,800 10,307,600 25,769,000 15,461,400 High 62 Fetuccine Salmon 152 31,200 78,000 46,800 4,742,400 11,856,000 7,113,600 High
Total 3,274 89,280,800 223,202,000 133,921,200
Average CM 40,904
No. Asian Unit Sold
(MM)
Item Cost
(IDR)
Selling Price
(IDR)
Item
CM
(IDR)
Menu Cost
(IDR)
Revenue
(IDR)
Menu CM
(IDR)
CM
Category
63 Wok Roasted Rice 724 18,800 47,000 28,200 13,611,200 34,028,000 20,416,800 Low
64 Beef Cubes in Black Soup
129 22,800 57,000 34,200 2,941,200 7,353,000 4,411,800 Low
65 Ox Tounge Stew 185 31,200 78,000 46,800 5,772,000 14,430,000 8,658,000 High
66 Fried Rice 763 27,200 68,000 40,800 20,753,600 51,884,000 31,130,400 High 67 Curry Rice 149 29,200 73,000 43,800 4,350,800 10,877,000 6,526,200 High
68 Cutlet Curry Rice 177 29,200 73,000 43,800 5,168,400 12,921,000 7,752,600 High
Total 2,127 52,597,200 131,493,000 78,895,800
Average CM 37,093
No. Kid’s Menu Unit Sold
(MM)
Item Cost
(IDR)
Selling Price
(IDR)
Item
CM
(IDR)
Menu Cost
(IDR)
Revenue
(IDR)
Menu CM
(IDR)
CM
Category
69 Chicken Finger 151 16,800 42,000 25,200 2,536,800 6,342,000 3,805,200 Low 70 Kids Burger 359 16,800 42,000 25,200 6,031,200 15,078,000 9,046,800 Low
71 Kids Corndog 117 16,800 42,000 25,200 1,965,600 4,914,000 2,948,400 Low
72 Chicken Nugget 458 16,800 42,000 25,200 7,694,400 19,236,000 11,541,600 Low 73 Kids Pasta 161 16,800 42,000 25,200 2,704,800 6,762,000 4,057,200 Low
74 Fish in the Basket 117 18,800 47,000 28,200 2,199,600 5,499,000 3,299,400 High
Total 1,363 23,132,400 57,831,000 34,698,600
Average CM 25,458
Journal of Business and Entrepreneurship, 8(1), May 2020, 18-39
39
Appendix 4. Menu Classification Summary (July-December 2019)
Star (14 items) Plowhorses (22 items)
Quiche Lorraine
Nachos
Fish Fingers
Mixed Platter
Smoked Duck Salad
Bamboo Charcoal Pizza
Tenderloin Steak
Mixed Paella
Chicken Roll
Seafood Soup
Oxtail Soup
Spaghetti Carbonara
Spaghetti Chicken Alfredo
Fried Rice
Onion Rings
French Fries
Spring Rolls
Chicken Wings
Mozzarella Croquette
Fried Cheese
Calamari
Vegetarian Salad
Chicken Caesar Salad
Classic Burger
Hot Dog
Sausage Curry Calzone
Cheesy Meaty Pizza
Hamburger Steak
Kids Burger
Chicken Nugget
Hamburger Steak
Oz Burger
Chicken Diablo
Mushroom Soup
Spaghetti Aglio Olio
Spaghetti Bolognaese
Wok Roasted Rice
Kids Burger
Chicken Nugget
Oz Burger
Chicken Diablo
Mushroom Soup
Spaghetti Aglio Olio
Spaghetti Bolognese
Wok Roasted Rice
Puzzles (22 items) Dogs (16 items)
Escargot
Foie Gras
Seafood Platter
Fish n Chips
Pan Seared Salmon
Seafood Paella
Valencian Paella
Volcano Shrimps
Pork and Mushroom Risotto
Smoked Pork Loin
Pan Fried Pork Medallions
BBQ Pork Ribs
Vegetable Paella
Claim Cowder
Lobster Bisque
Irish Stew
Farfalle Tuna
Fetuccine Salmon
Ox Tounge Stew
Curry Rice
Cutlet Curry Rice
Fish in the Basket
Beef Croquette
Crab Croquette
Bitterbalen
House Salad
Pan Fried John Dory
Teriyaki Burger
Croque - Monsieur
Croque - Madame
Riso Con Carne
Green Peas Soup
Consome Soup
Minestrone Soup
Beef Cubes in Black
Soup
Chicken Finger
Kids Corndog
Kids Pasta