the application of zircon (u-th)/he thermochronology to
TRANSCRIPT

UNLV Theses, Dissertations, Professional Papers, and Capstones
5-1-2014
The Application of Zircon (U-Th)/He Thermochronology to The Application of Zircon (U-Th)/He Thermochronology to
Determine the Timing and Slip Rate on the Willard Thrust, Sevier Determine the Timing and Slip Rate on the Willard Thrust, Sevier
Fold and Thrust Belt, Northern Utah Fold and Thrust Belt, Northern Utah
Bryan Eleogram University of Nevada, Las Vegas
Follow this and additional works at: https://digitalscholarship.unlv.edu/thesesdissertations
Part of the Geology Commons
Repository Citation Repository Citation Eleogram, Bryan, "The Application of Zircon (U-Th)/He Thermochronology to Determine the Timing and Slip Rate on the Willard Thrust, Sevier Fold and Thrust Belt, Northern Utah" (2014). UNLV Theses, Dissertations, Professional Papers, and Capstones. 2078. http://dx.doi.org/10.34917/5836097
This Thesis is protected by copyright and/or related rights. It has been brought to you by Digital Scholarship@UNLV with permission from the rights-holder(s). You are free to use this Thesis in any way that is permitted by the copyright and related rights legislation that applies to your use. For other uses you need to obtain permission from the rights-holder(s) directly, unless additional rights are indicated by a Creative Commons license in the record and/or on the work itself. This Thesis has been accepted for inclusion in UNLV Theses, Dissertations, Professional Papers, and Capstones by an authorized administrator of Digital Scholarship@UNLV. For more information, please contact [email protected].

THE APPLICATION OF ZIRCON (U-TH)/HE THERMOCHRONOLOGY TO
DETERMINE THE TIMING AND SLIP RATE ON THE WILLARD THRUST,
SEVIER FOLD AND THRUST BELT, NORTHERN UTAH
By
Bryan Ruston Eleogram
Bachelor of Science -- Geology
University of Nevada, Las Vegas
December 2011
A Thesis to be submitted in partial fulfillment
of the requirement for the
Masters of Science – Geology
Department of Geoscience
College of Sciences
The Graduate College
University of Nevada, Las Vegas
May 2014

Copyright by Bryan R. Eleogram, 2014
All Rights Reserved

ii
THE GRADUATE COLLEGE
We recommend the thesis prepared under our supervision by
Bryan Ruston Eleogram
entitled
The Application of Zircon (U-Th)/He Thermochronology to Determine
the Timing and Slip Rate on the Willard Thrust, Sevier Fold and Thrust
Belt, Northern Utah
is approved in partial fulfillment of the requirements for the degree of
Master of Science - Geoscience
Department of Geoscience
Michael Wells, Ph.D., Committee Chair
Adolph Yonkee, Ph.D., Committee Member
Andrew Hanson, Ph.D., Committee Member
Paul Forster, Ph.D., Graduate College Representative
Kathryn Hausbeck Korgan, Ph.D., Interim Dean of the Graduate College
May 2014

iii
Abstract
Although the Sevier fold-thrust belt is one of the best-studied foreland systems
in the world, timing of motion on the dominant western thrust sheets that carry thick
Neoproterozoic to Paleozoic strata remains incompletely understood. Zircon (U-Th)/He
thermochrometry (ZHe) studies of the hanging wall of the Willard thrust sheet (WTS) in
northern Utah are used to constrain the timing and rate of thrust slip. Previous
interpretations of the age of initial slip on the Willard thrust vary widely from 150 to 115
Ma, reflecting ambiguous relations with foreland basin strata and limited
geochronologic data. The large displacement on the Willard thrust (~60 km net slip), the
wide range of exposed levels (>8 km vertical structural relief), and the wide aerial extent
(>60 km horizontal length) provide an ideal setting for application of ZHe to evaluate
thrust timing. Samples were collected and analyzed for 40 sites along three pseudo-
vertical transects that spanned the eastern, east-central, and central parts of the WTS
(with sample spacing of ~0.5 to 1 km structural depth) and along three stratigraphic-
parallel (pseudo-horizontal) traverses at intermediate levels across the sheet. Due to
relatively slow cooling rates and multi-kinetic zircon populations, grains were
prescreened based on similar U-Pb ages and U/Th contents, with 6 grains selected for
ZHe analysis at each sample site. Vertical transects captured an Early Cretaceous partial
retention zone (PRZ) with slow cooling starting at ~130 Ma. Cooling ages are
systematically younger downward in the east-central and central vertical transects,
yielding an average exhumation rate of 0.12 mm/yr (assuming steady state geothermal
conditions) from ~125 to 90 Ma; only part of the PRZ is preserved along the eastern

iv
leading edge of the sheet. Cooling ages are systematically younger westward along a
horizontal traverse near the base of the Geertsen Canyon Formation, yielding an
average slip rate of 1.7 mm/yr from ~125 to 90 Ma. The estimated exhumation rate is
consistent with uplift and erosion above a moderately (average ~10°) dipping,
composite thrust ramp, and the estimated slip rate and duration are roughly consistent
with a net slip of ~60 km. The WTS was subsequently passively uplifted and exhumed
during Late Cretaceous development of the Wasatch anticlinorium, recorded by cooling
ages at deeper levels.

v
TABLE OF CONTENTS
Abstract ______________________________________________________________ iii
Table of Contents ______________________________________________________ V
List of Figures ________________________________________________________ Vii
Introduction ___________________________________________________________ 1
Regional Geology ______________________________________________________ 3
Geology of the Willard Thrust Sheet _____________________________________________ 7
Stratigraphy and Targeted Formations ___________________________________________ 10
Sampling and Analytical Methods _______________________________________ 11
Sample Collection __________________________________________________________ 11
Mineral Separation and Preparation Techniques ___________________________________ 13
Zircon (U-Th)/He Thermochronology ___________________________________________ 13
Thermal Modeling __________________________________________________________ 18
Zircon (U-Th)/He Results _______________________________________________ 19
Monte Cristo Transect _______________________________________________________ 20
Bear River to Browns Hole Transect ____________________________________________ 20
Wellsville Transect __________________________________________________________ 22
Worm Creek Traverse _______________________________________________________ 23
Geertsen Canyon Traverse ____________________________________________________ 23
Perry Canyon Traverse _______________________________________________________ 23
Footwall __________________________________________________________________ 24
Inverse Modeling of Arrays of Zircon (U-Th)/He Data Using HeMP
and Interpretation of Age Versus Depth Data Arrays _______________________ 24
Bear River to Browns Hole ___________________________________________________ 24
Wellsville _________________________________________________________________ 25
Interpretation and Discussion ___________________________________________ 25
Early Cretaceous Cooling of the Willard Thrust Sheet ______________________________ 25
Age of Inception of the Willard Thrust __________________________________________ 28
Slip Rate of the Willard Thrust ________________________________________________ 29
Timing Relations of the Wyoming Salient ________________________________________ 31
Correlations Between Western Thrust Systems of the Sevier FTB _____________________ 33
Hinterland Relationships _____________________________________________________ 35
vi
Conclusions __________________________________________________________ 36
Figure Captions _______________________________________________________ 38
Figures ______________________________________________________________ 40
Appendix A __________________________________________________________ 61
Appendix B __________________________________________________________ 62
Appendix C __________________________________________________________ 73
References __________________________________________________________ 119
Vita ________________________________________________________________ 127

vii
List of Figures
Figure 1 Simplified Tectonic Map of the Western North American
Cordilleran ______________________________________________ 40
Figure 2 Geologic Map of the Wyoming Salient ________________________ 41
Figure 3 Geologic Map and Cross Section of the Willard Thrust Sheet
Including Vertical Transects _______________________________ 42
Figure 4 Model for the Development of the Wasatch Anticlinorium _______ 43
Figure 5 Willard Strat Column with U/Pb Diagrams A __________________ 44
Figure 6 Willard Strat Column with U/Pb Diagrams B __________________ 45
Figure 7 Thermochronologic Sampling Stategy ________________________ 46
Figure 8 Plot of He Concentration vs. Effective Alpha Damage ___________ 47
Figure 9 Restored Willard Cross-Section with Zhe Ages_________________ 48
Figure 10 Monte Cristo Age vs. Depth Diagram _________________________ 49
Figure 11 Bear River to Browns Hole Age vs. Depth Diagram ____________ 50
Figure 12 Wellsville Age vs. Depth Diagram ____________________________ 51
Figure 13 Worm Creek Age vs. Distance Diagram _______________________ 52
Figure 14 Geertsen Canyon Age vs. Distance Diagram ___________________ 53
Figure 15 Perry Canyon Age vs. Distance Diagram ______________________ 54
Figure 16 Bear River to Browns Hole t-T Diagram ______________________ 55
Figure 17 Wellsville t-T Diagram _____________________________________ 56
Figure 18 Monte Cristo Virticle Transect Age Probability Diagram ________ 57
Figure 19 Sevier Orogeny Timing Relations Diagram ____________________ 58
Figure 20 Wellsville and Footwall Vertical Transects Diagram ____________ 59
Figure 21 Map Showing Dominant Western Thrusts in the Sevier FTB _____ 60

1
Introduction
Determining the ages and the rates of shortening in continental retroarc fold-
thrust belts is critical towards addressing a number of fundamental questions in
continental tectonics, including: (1) what is the relationship between plate boundary-
forearc tectonic processes and retroarc deformation; (2) how is the deformation history
of the metamorphic hinterland related to that of the external fold-thrust belt; and (3)
what is the role of large displacement, dominant thrusts in the evolution of retroarc
thrust wedges? The retroarc Cordilleran thrust belt and foreland basin of North America
extends greater than 3000 km from Mexico to Canada and accumulated substantial
crustal shortening in the Mesozoic (Dickinson, 2004; DeCelles, 2004). Shortening in the
retroarc Cordilleran orogen of the western U.S. can be seen in multiple contractional
belts from Early Jurassic to Paleogene time. These belts, which include the Luning-
Fencemaker belt, Central Nevada thrust belt, Sevier fold-thrust belt, and the Laramide
foreland province display an overall eastward propagation of deformation (Taylor et al.,
2000; DeCelles, 2004; Dickinson, 2004; DeCelles and Coogan, 2006). Major thrusts have
slip on the order of 10’s of km and were active over time scales on the order of 10’s of
m.y. By conducting thermochronologic analysis of these structures geologists can
reconstruct thermal histories, interpret deformation histories, and evaluate thermal
maturation of hydrocarbons.
Although multiple techniques exist for dating rocks, determining the timing and
rates of crustal shortening remains a challenge. Provenance studies, subsidence
analysis, depositional environments of syn-thrusting strata preserved in foreland basins,

2
and cross cutting to onlapping relationships between proximal strata and structures may
widely bracket ages of fault slip (DeCelles and Giles, 1996; Braun et al., 2006).
Thermochronology, the interpretation of the thermal history of rocks based on
accumulation of daughter isotopes and temperature dependent diffusion, partly reflects
deformation histories accompanied by exhumation and changes in temperature (Braun
et al., 2006). In rare cases, minerals that grew below their closure temperature and in
specific structural settings can be isotopically dated to directly constrain deformation
timing. Variations in cooling ages of different isotopic systems in footwalls of normal
faults have been previously interpreted to record uplift and exhumation, and used to
estimate the timing and rates of fault slip (Farley, 2002). Variations in cooling ages in
hanging walls above thrust ramps are less well studied, but can potentially be used to
estimate the timing and rates of fault slip. In this work, thermochronology is applied to
the Willard thrust sheet (WTS), northern Utah, a dominant thrust sheet in the
Cretaceous to mid Paleogene Sevier fold-thrust belt (FTB). The timing of displacement
along the Willard thrust is incompletely understood and estimates for timing of thrust
initiation vary widely from ~150 to 115 Ma (Heller et al., 1986; Burtner and Nigrini,
1994; DeCelles et al., 1995; Yonkee et al., 1989, 1997; Sears, 2001; Stockli et al., 2001;
Currie, 2002; DeCelles, 2004).
Upper crustal shortening in the thin-skin Sevier FTB is related to middle to lower
crustal thickening in the hinterland, and to synorogenic deposition in the Sevier foreland
basin (DeCelles, 2004). Direct measurements of the timing of thrust motion are
important in developing coupled models of thrust sheet exhumation and foreland basin

3
sedimentation. Although timing relations of sedimentation of the Sevier foreland basin
strata are reasonably well understood (DeCelles, 1994; DeCelles and Currie 1996; Liu et
al, 2005), few direct measurements are available on the timing of in situ exhumation of
the thrust sheets. This study presents new (U-Th)/He zircon (ZHe) thermochronologic
data from the WTS, which constrains timing of thrust initiation, rate of exhumation, and
fault slip rate. The ZHe system was chosen because zircon-bearing strata are widely
exposed within the WTS and the closure temperature (~160-200 °C) for this system is
appropriate for determining exhumation timing in the upper crust (depths~ 5-8 km)
(Reiners, 2005).
The WTS is well exposed in northern Utah where younger uplift and erosion have
exposed a wide range of structural levels across the thrust sheet, providing an
exceptional opportunity to apply modern thermochronologic methods to determine a
poorly understood deformation history for an important part of the Sevier FTB. Results
from this study, along with existing age constraints of the WTS, help to provide an
improved understanding of: (1) the age of inception, rate, and duration of fault slip
along the dominant Willard thrust sheet; (2) the timing relations between thrust faults
of the Wyoming salient; (3) temporal correlations between other “dominant” western
thrust systems of the Sevier FTB and on a broader scale; (4) the relationship between
thrusting in the FTB and crustal shortening/extension in the metamorphic hinterland.
Regional Geology

4
Neoproterozoic to Cambrian rifting of the supercontinent Rodinia, and
subsequent deposition of a westward-thickening sedimentary wedge along the passive
margin of western Laurentia, established the tectonic and stratigraphic framework for
subsequent development of the Cordilleran orogen of the western United States
(Stewart, 1972; Dickinson, 2004). By the end of the middle Paleozoic, subduction
initiated and volcanic arc systems emerged near the continental margin (Dickinson,
2004). During the Antler and Sonoma orogenies, oceanic allochthons were thrust
eastward over the passive margin strata and accreted to the continent (Speed and
Sleep, 1982; Burchfiel and Royden, 1991; Dickinson, 2004). In Triassic to Middle Jurassic
time the fringing arcs and interarc basins developed along and were eventually accreted
onto the western margin of the Cordillera. In Late Jurassic and through Paleogene time,
convergence of the Farallon and Kula oceanic plates with the North American plate
controlled the tectonic evolution of western North America (DeCelles, 2004). The
convergent margin developed the classic elements of an Andean-style orogen including
the Franciscan accretionary wedge, Great Valley forearc basin, Sierra Nevada magmatic
arc, metamorphic hinterland, Sevier retroarc fold-thrust belt, and a foreland basin
system (Figure 1) (Ernst, 1970; Constenius, 2000; Saleeby and Busby-Spera, 1992;
Dickinson, 2004, DeCelles, 2004).
The Sevier orogeny was a continent-scale mountain building event that extended
more than 3,000 km, from Canada in the north to Mexico in the south, with thin-skin
folding and overall top-to-east thrusting of the sedimentary wedge above Precambrian
basement (Figure 1) (DeCelles and Coogan, 2006). Sedimentary rocks were shortened by

5
~150-300 km across the Sevier belt, resulting in upper crustal thickening, thrust loading,
and isostatic flexural subsidence in the foreland basin (Yonkee, 1992; DeCelles, 2004;
Yonkee, 2005). An increase in convergence rates (likely exceeding the rate of trench
retreat) between the Farallon and North American plates, influenced by the opening of
the Atlantic ocean in mid Jurassic time and the subduction of young lithosphere, may
have led to the intraplate shortening (Royden, 1993). Although the age of thrusting is
roughly bracketed from the Late Jurassic to early Paleogene, most shortening in
occurred during the Cretaceous (Camilleri et al., 1997; DeCelles, 2004; Heller et al.,
1986). The Sevier orogenic system can be divided into four parts: a hinterland, western
thrust system, eastern thrust system, and foreland basin.
The hinterland has a metamorphic core wherein crustal thickening occurred
during the Late Jurassic to middle Cretaceous (Smith et al., 1993; Hoisch et al., 2014),
leading to substantial tectonic burial of supracrustal rocks (e.g., McGrew et al., 1992;
Harris et al., 2007). Although the hinterland experienced significant crustal thickening
during much of the Cretaceous (e.g., McGrew et al., 1992; Harris et al., 2007), by the
Late Cretaceous metamorphic cores experienced alternating periods of extension and
shortening (tectonic mode switches) (Wells et al., 1990; Wells, 1997; Wells and Hoisch,
2008). The timing of tectonic mode switches of the hinterland partly overlap with the
timing of crustal shortening of the Sevier FTB to the east. Final alternation between
contraction and extension and out-of-sequence thrusting in the hinterland occurred at
53-51 MA, synchronous with final thrusting in the Sevier belt and uplift of basement
arches in the Laramide belt (Camilleri and Chamberlain, 1997; Wells et al., 2012; Lacy et

6
al., 2013; Wells et al., 2013). The hinterland subsequently underwent extension and
cooling during the Paleogene (McGrew et al., 2000; Wells et al., 2000; Rahl et al., 2002;
Sullivan and Snoke, 2007).
The western thrust fault system carries thick Neoproterozoic to Paleozoic passive
margin strata, includes the “dominant” Paris, Willard, Canyon Range, Wah Wah, and
Wheeler Pass thrusts, and was mostly active during the Early Cretaceous (Yonkee and
Weil, 2011). These thrusts have ramp-flat geometries, large fault-bend and fault-
propagation folds, and exhibit a thin-skinned structural style (DeCelles and Coogan,
2006). These thrusts have variable, large displacements (~60 km of net slip on the WTS),
significant stratigraphic throw across ramps, and play a key role in the total shortening
budget of the orogenic wedge. The eastern thrust system carried a thinner sequence of
Paleozoic strata, includes the Crawford, Absaroka, Hogsback, and Charleston thrusts,
and was dominantly active during the Late Cretaceous to Early Eocene. Thrusts faults in
western and eastern systems, along with their associated foredeep basins, propagated
eastward over time.
Synorogenic sediments were deposited in the foreland basin that lay east of the
Sevier FTB (DeCelles and Currie, 1996; DeCelles, 2004). The foreland basin extended
laterally more than 3000 km from Canada southward toward Mexico, and eastward up
to 1000 km from the orogenic front (DeCelles, 2004). The system included foredeep,
forebulge and backbulge depozones, which migrated to the east as thrust systems of the
Sevier belt propagated eastward (DeCelles and Giles, 1996; DeCelles, 2004). The basin
was flooded by the Western Interior Seaway in the Late Cretaceous to early Paleogene
7
(Kauffman, 1977). The Sevier foreland was broken into smaller basins within parts of
Wyoming to New Mexico by Laramide foreland uplifts and basins from Campanian to
Paleogene time (~80 Ma to 55 Ma) (Dickinson et al., 1988).
Geology of the Willard Thrust Sheet
The Sevier FTB contains systematically curved sections, including the Wyoming
salient that is bound by the Gros Ventre uplift to the north and the Uinta uplift to the
south (Yonkee and Weil, 2010). Major thrusts in the Wyoming salient include: the
related Willard, Paris, and Meade thrust faults that form a western system, the
Crawford, Absaroka, Hogsback-Darby-Prospect thrust faults that form an eastern
system, and the Precambrian basement cored Wasatch anticlinorium marking the
transition between the two (Figure 2) (Royse, 1993a; DeCelles, 2004; Yonkee and Weil,
2011). The western system has a decollement in Neoproterozoic strata and the eastern
system has a decollement in middle Cambrian shale. Large-scale fault-propagation and
fault-bend folds are associated with thrust faults. Total shortening from large-scale
thrust faulting and folding is about 150 km in the center of the Wyoming salient and
decreases toward the ends of the salient.
The Willard thrust sheet is prominently exposed in northern Utah due to uplift
and tilting about the Wasatch anticlinorium and in footwalls of Cenozoic normal faults
(Figure 2). The sheet carries 10-15 km of passive margin strata that can be separated
into three structural levels with different lithologies and structural styles. The lower
level is comprised of micaceous Neoproterozoic strata, the middle level includes strong
quartzite-rich upper Neoproterozoic to lower Cambrian strata, and the upper level is

8
dominantly comprised of Paleozoic carbonate-rich strata. The main thrust has western
flat in Neoproterozoic micaceous strata, a ramp through quartzite-rich strata, a central
flat in middle Cambrian strata, a ramp in upper Cambrian to lower Jurassic strata, and
an eastern flat in middle Jurassic strata (Figure 3) (Yonkee 2005). The ramps generally
cross cut competent stratigraphic layers, whereas flats are in incompetent layers.
The Willard thrust has about 50 km of top-to-the-east-southeast slip in northern
Utah, with another 10 km of shortening from associated folds and imbricate faults
(Yonkee, 2005). In the central part of the salient the Willard splays into the Paris and
Meade thrusting respectively with ~20 km and ~40 km of top-to-east slip (DeCelles et
al., 1993). The large displacement on the WTS, the wide range of exposed levels (>8 km
vertical structural relief), the widely exposed aerial extent (>60 km E-W horizontal
length), and the presence of zircon-bearing siliciclastic strata provide an ideal setting for
application of zircon (U-Th)/He thermochronology (ZHe) to evaluate thrust timing. Late
Cretaceous to Paleogene strata unconformably overly the southeastern part of the
Willard sheet and were deposited after major slip transferred to the eastern system
(Figure 2) (Yonkee and Weil, 2011). The WTS was tilted around the northern margin of
the Wasatch anticlinorium, leading to variable regional dip directions ranging from
overall west-northwest to northeast. The WTS was also cut by Cenozoic normal faults,
which imparted additional eastward tilt in the footwall of the Wasatch normal fault.
Growth of the anticlinorium during the Late Cretaceous to Paleogene was related to slip
and duplexing along the Ogden and basal thrusts (Yonkee, 1992; DeCelles, 1994).
Apatite fission track data of basement rocks in the Wasatch anticlinorium reported by

9
Naeser and others (1983) include clusters at 90-85 Ma, 85-75 Ma, and 65-50 Ma,
interpreted to record pulses of uplift in the anticlinorium that were linked to slip along
the Crawford, Absaroka, and Hogsback thrusts to the east (Figure 4) (DeCelles, 1994).
Previous interpretations for the age of initiation of slip in the Sevier FTB vary
widely from ~150 to 115 Ma, reflecting ambiguous relations with foreland basin strata
and limited geochronologic and thermochronologic data (Heller et al., 1986; Burtner and
Nigrini, 1994; DeCelles et al., 1995; Yonkee et al., 1989, 1997; Sears, 2001; Stockli et al.,
2001; Currie, 2002; DeCelles, 2004). The Upper Jurassic Morrison Formation
accumulated in the retroarc region of Colorado to Montana (Currie, 1998). Regionally,
the top of the Morrison has a major unconformity recording up to a ~25 m.y. hiatus
(DeCelles 2004). Multiple models have been proposed for the tectonic setting of the
Morrison Formation. Paleocurrent and detrital zircon data support derivation from a
western source and deposition in a foreland setting (DeCelles, 2004). Heller and others
(1986) argued that the Morrison Formation does not thicken westward as expected for
a flexural foreland basin and was instead deposited during regional tectonothermal
subsidence. The Morrison Formation may have been deposited in a backbulge depozone
with an Late Jurassic “phantom foredeep” to the west associated with thickening in the
Sevier hinterland (Royse, 1993b; DeCelles and Currie, 1996; Currie, 1997).
A thick sequence of Jurassic strata, including the Twin Creek, Sundance, and
Morrison formations, were deposited in the Utah-Idaho trough. Using stratigraphic and
subsidence analysis, Bjerrum and Dorsey (1995) interpreted the Utah-Idaho trough as a
retroarc foreland basin for a Middle Jurassic thrust belt to the west. Episodic thrusting in

10
this belt may have caused unconformities and stratigraphic geometries seen in the
Utah-Idaho trough (Bjerrum and Dorsey, 1995). Their results are interpreted to record a
~163 to ~157 Ma thrust front in western Utah followed by a slowing in the rate of
subsidence; this stands as the establishment of a period of quiescence until the
initiation of the Sevier FTB.
Previous studies have variously interpreted initial slip the WTS from 140 to 115
Ma, based on limited geochronologic and thermochronologic isotopic data and relations
of foreland basin deposits. Deposits include the Early Cretaceous Gannet Group that
likely record early slip of the Willard-Paris-Meade thrusts (DeCelles et al., 1993), and the
overlying Bear River to Frontier Formations that record continued erosion of the thrust
sheet (Schmitt, 1992; Liu et al., 2005). Recently, Gentry et al. (2013) reported detrital
zircon data from Aptian to Turonian (~125-90 Ma) synorogenic strata, interpreted to
record protracted exhumation of upper levels of the WTS. Isotopic data include several
apatite fission track ages from the Paris and Mead thrust sheets (Burtner and Nigrini,
1994) and 40Ar/39Ar fusion ages of muscovite from veins in the hanging wall of the
Willard thrust (Yonkee et al., 1989). Recently, Giallorenzo (2013) reported 40Ar/39Ar UV
laser ablation ages of ~145-130 Ma for mica in the western, basal part of the WTS,
interpreted to record early alteration and internal deformation that preceded large-
scale thrust slip.
Stratigraphy and Targeted Formations
The WTS carries a thick package of sedimentary rocks that include: (1)
Neoproterozoic to Early Cambrian micaceous to quartz-rich strata; (2) Early Paleozoic
11
carbonate-rich strata; (3) Late Paleozoic mixed carbonate and siliciclastic strata (Figure 5
and 6). Neoproterozoic to lower Cambrian strata are separated into an up to 3 km thick
sequence of upper Neoproterozoic glaciomarine sedimentary rocks with local volcanic
rocks and a ~2-4 km sequence of upper Neoproterozoic to lower Cambrian siliciclastic
and rare volcanic rocks (DeCelles, 2004; Dickinson, 2004). Neoproterozoic strata include
the Perry Canyon Formation, Maple Canyon Formation, and the Kelley Canyon
Formation, which display lateral changes in thickness related to rifting (Christie-Blick,
1982; Crittenden et al., 1972). The upper Neoproterozoic to lower Cambrian strata
thicken westward and include the Caddy Canyon Formation, Mutual Formation, Browns
Hole Formation, and Geertsen Canyon Quartzite (Yonkee and Weil, 2011). Lower
Paleozoic strata are up to 6 km thick and consist mostly of shallow water carbonate
rocks with thinner intervals of siliciclastic rocks deposits during episodic regressions,
including the Cambrian Worm Creek Member of the St. Charles Formation, Ordovician
Swan Peak Formation, and parts of the Devonian Water Canyon and Beirdneau
formations (Poole et al., 1992). The Pennsylvanian to Permian Oquirrh Group is up to 6
km thick and was deposited in the subsiding Oquirrh basin in northwest Utah in time
(Dickinson and Gehrels, 2003; Yonkee and Weil, 2011). Triassic and Jurassic strata have
mostly been eroded from the WTS (Yonkee and Weil, 2011).
Sampling and Analytical Methods
Sample Collection

12
Approximately 40 samples of quartzose sedimentary rocks were collected from
the hanging wall of the Willard thrust in northeastern Utah for zircon (U-Th)/He analysis
(Appendix A). Samples were collected along both down-plunge structural (pseudo-
vertical) transects through the thrust sheet, and along stratigraphic-parallel (pseudo-
horizontal) traverses from west to east. The three vertical transects will be referred to
as Monte Cristo for the eastern part, Browns Hole to Bear River for the east-central part,
and Wellsville for the central part of the WTS (Figure 3). Samples collected along these
transects were from Neoproterozoic to Devonian siliciclastic strata of the Perry Canyon,
Maple Canyon, Kelley Canyon, Caddy Canyon, Mutual, Browns Hole, Geertsen Canyon,
Worm Creek Member of the St. Charles Formation, Swan Peak, Water Canyon, and
Beirdneau formations. For the three stratigraphic-parallel traverses, samples were
collected from the Perry Canyon Formation, Browns Hole to basal Geertsen Canyon
formation, and the Worm Creek Member. Additional samples were collected in the
footwall of the Willard thrust from the Cambrian Tintic Quartzite and Paleoproterozoic
Farmington Canyon Complex to better assess the tectonic significance of cooling ages
across the Willard thrust. Samples on vertical transects were collected at 0.5 to 1 km
intervals in structural depth. Samples collected for this study were augmented by zircon
separates of previously collected samples from Carol Dehler (Utah State University) and
Paul Link (Idaho State University). Additional work is underway to increase sample
density along horizontal traverses and add another vertical transect in the western part
of the WTS. Sampling locations for the pseudo-vertical and stratigraphic-parallel
transects are shown in Figure 7.

13
Mineral Separation and Preparation Techniques
Samples were crushed using a BICO rock crusher and disk pulverizer and then
sieved to separate the 345µm to 53µm size fraction. Sieved material was then passed
over a water table to obtain concentrates of denser mineral grains, followed by density
separation using methylene iodide (MI) (specific gravity =3.32). Franz isodynamic
magnetic separation was used to further concentrate zircon grains, which were then
hand-picked to obtain zircon grains free of visible fractures, zonation under polarized
light, inclusions, and metamictization.
Zircon (U-Th)/He Thermochronology
The zircon (U-Th)/He (ZHe) thermochronologic system was used to constrain the
cooling history of the Willard thrust sheet. The cooling history is assumed to be mostly
related to erosional exhumation resulting from rock uplift due to displacement of the
thrust sheet up a ramp. The (U-Th)/He system determines cooling ages of rocks by
looking at production and trapping of 4He from the decay of 238U, 235U and 232Th. 4He is
also produced at negligible amounts by the decay of 147Sm and 143Nd (Reiners et al.,
2002). The thermochronologic age of a rock or mineral is an apparent age that
represents the time that a daughter isotope becomes immobile or locked into a crystal
lattice (Dodson, 1973). The daughter isotope becomes immobile at a temperature
interval known as the closure temperature (Tc). The closure temperature is dependent
on the thermochronologic system, that is the radiogenic isotopic decay process and
mineral where the daughter isotope resides, and to a lesser extent on the grain size and
cooling rate (Farley, 2002). At temperatures above the Tc, radiogenic daughter products

14
diffuse out of the mineral lattice as quickly as they are produced, and therefore they do
not accumulate. When the mineral cools below Tc the daughter particles escape at a
negligible level, allowing accumulation (Dodson, 1973; Farley, 2002). This study uses
zircon (U-Th)/He thermochronometry, which for typical zircon, has a Tc of 180˚ to 200˚C
contingent on the cooling rate, grain size, and radiation damage. For typical geothermal
gradients, rocks exceed the Tc for ZHe when deeper than 8-10 km (Farley, 2002; Reiners,
2005). When the rocks are exhumed above 8-10 km, the zircon will cool below the Tc
and 4He will begin to accumulate. This system is therefore sensitive to cooling at low
temperatures and is useful to date events that influence the thermal structure of the
upper crust, such as erosion.
The change from readily diffusing 4He from a mineral grain to being locked into
the crystal lattice does not occur at a specific temperature; rather, it changes over a
distinct temperature interval called the partial retention zone (PRZ) (Reiners, 2005). The
Tc lies within the PRZ (near its base), so rocks above the PRZ have already cooled
through the Tc and record an earlier tectonic event. When there is rapid uplift and
exhumation from thrust faulting, the PRZ may be preserved as a “fossil” PRZ (Braun et
al., 2006). This can be seen on age vs. depth profiles where age decreases rapidly with
depth. The breaks in slope serve as the top and bottom of the PRZ and indicate changes
in cooling rate which may translate to the timing of important tectonic transitions, such
as the initiation of thrusting (Figure 7) (Braun et al., 2006).
A study by Reiners (2005) showed that radiation damage does not effectively
change 4He diffusivity until radiation dosages are higher than 2-4 x 10¹⁸ α/g. At high

15
dosages radiation damage enhances e loss from zircon crystals. ased on a study by
amon and ulp (1 ) radiation damage only occurs when zircon has cooled
below 2 0˚C. Zircons that have cooled below this temperature for less than a few
hundred million years are assumed to not have substantial radiation damage.
ZHe analysis was conducted at the (U-Th)/He Geo- and Thermochronology Lab
in the Jackson School of Geosciences at the University of Texas, Austin. Zircon separates
were hand-picked to obtain grains with euhedral tetragonal shapes, grain widths
between 70-150 µm, clarity, and lack of visible zonation, inclusions, and
metamictization (Farley, 2002; Reiners, 2005; see (U-Th)/He Geo- and
Thermochronology Lab at UT Austin webpage). In almost all cases zircon with widths
<60 µm are not dated because of the large alpha ejection corrections that these crystals
require. Large alpha ejection corrections can potentially produce large errors in the ZHe
age if U/Th concentrations in the crystals are zoned. Alternatively, grains >200 µm are
not used because of the greater difficulty of He diffusion over larger lengths leading to a
potential need for multiple gas extractions (Reiners, 2005).
To lessen the potential variability of Tc among the multi-kinetic detrital zircon
populations within and between samples, zircons were prescreened prior to He analysis.
Thirty hand-picked grains per sample were prescreened prior to ZHe analysis using the
U/Th-Pb system to assess crystallization ages, uranium and thorium contents, and
potential zonation (Figure 5 and 6; Appendix B). Grains were mounted onto adhesive
pucks and analyzed using Laser Ablation Inductively Coupled Plasma Mass Spectrometry
(LA-ICPMS), with a beam size of 30 µm and profile depths of 18 µm. After analysis,

16
zircon grains with greater than 300 ppm U and U-Pb ages older than ~1.8 Ga were
rejected. U/Th zonation in grains was evaluated using Iolite software for reduction of
data obtained by LA-ICPMS (www.iolite.org.au). Zoned zircon grains were rejected from
further analysis.
Subsequent to (U-Th)/He investigation, alpha damage calculations were made
for each aliquot to further test the integrity of the helium age. Radiation damage can
compromise the kinetics of helium diffusivity reducing the reliability of ZHe dating.
When U and Th decay to He, alpha particles (4He) are naturally formed. Alpha-parent
recoil produces linear defects (radiation damage) that are accountable for
metamictization of the mineral (Nasdala et al., 2004). Radiation damage can also occur
from spontaneous fission, which produces fission tracks, and the alpha particles
themselves (Guenthner et al., 2013). Radiation damage can alter the rate of diffusion of
4He depending on track density, connectivity, and time (Reiners et al., 2002). Radiation
damage is annealed at elevated temperature and over time (Nasdala et al., 2004). The
extent of single grain radiation damage can be roughly calculated by time-integrated
self-irradiation doses (Alpha Doses) (Nasdala et al., 2004; Reiners, 2005; Guenther et al.,
2013). Reproducibility of ZHe cooling ages declines at an effective radiation damage
greater than 2.00 x 10¹⁸ α/g - 4.00 x 10¹⁸ α/g (Reiners, 200 ; Guenthner et al., 2013).
This implies that an upper dosage boundary for reproducible ZHe ages is 2.00 x 10¹⁸ α/g.
Effective radiation damage was calculated for all Willard hanging wall aliquots that were
run for ZHe. For the 202 analyzed aliquots, effective radiation damage ranges from 2.46
x 1016 to 2.86 x 10¹⁸ α/g (Figure 8). From these prescreened grains only two rose above

17
the upper dosage boundary of 2.00 x 10¹⁸ α/g (Figure 8, red diamonds). Ninety nine
percent of all ZHe ages in this study do not surpass the reproducible boundary, but may
still have complications and variations greater than expected for analytical
uncertainties.
Six prescreened grains per sample, with ages of ~1.0 - 1.8 Ga and Uranium
contents below 300 ppm, were selected for ZHe analysis. Previous studies, including
Dickinson and Gehrels (2003) have used He-Pb double dating to supplement
thermochronologic research, and in our case were used to prescreen the samples to
minimize alpha damage variability, grain inhomogeneity, and zonation. It has been
calculated that for U-Th zoned zircons ZHe ages may increase in error by up to ~30% if
not accurately accounted for in alpha ejection corrections (Hourigan et al., 2005).
Selected grains were photographed and measured on two perpendicular planes that are
parallel to the a1 and a2 axes. Following methods by Farley (2002) and Reiners (2005),
alpha ejection corrections, based on the dimensions of each individual grain, were
assigned to account for 4He lost from the crystal by stopping distances of alpha particles.
Stopping distances are calculated to be ~19.3 µm (238U), ~19.6 µm (235U), and ~19.3 µm
(232Th) (Farley et al., 1996; Hourigan et al., 2005; Reiners, 2005).
U and Th amounts can vary widely between crystals so measurements of parent
and daughter nuclides are calculated on the same aliquot. Once the desired grains have
been chosen they are packed into Pt foil tubes, loaded into a Cu planchette, and
degassed. The 4He is extracted using an ultra-high vacuum noble gas extraction and
purification line by heating of the Pt tubes with a focused 10µm laser beam to 1100-

18
12 0 ˚C for 1 minute extraction intervals. Aliquots are subject to multiple 4He
extractions. U-Th concentrations, thermal history, and radiation damage are not
obviously related to 4He retentivity during degassing (Reiners, 2005). After laser
degassing, He is spiked and analyzed using a computer-automated ultra-high vacuum He
extraction line that is equipped with precise volume aliquot systems, a cryogenic gas
purification system, and a Blazers Prisma QMS-200 quadrupole mass spectrometer to
determine 4He/3He ratios. After degassing, the grain is unpacked then dissolved with a
mixture of HF-HNO3 at high temperatures and pressures. The aliquots are unpacked
from the Pt tubes due to Pt dissolution and subsequent contamination of the ICP-MS.
The aliquots are spiked with an isotopically distinctive known concentration U-Th spike.
Aliquot solutions are then analyzed for U, Th, and Sm using the Thermo Element2 HR-
ICP-MS, fitted with a CETAC micro-concentric nebulizer and ESI auto sampler (see (U-
Th)/He Geo- and Thermochronology Lab at UT Austin webpage).
Thermal Modeling
Inverse time-temperature (t-T) modeling of measured ZHe thermochronologic
data was conducted using the Helium modeling program (HeMP) (R2010beta; Hager and
Stockli, 2009; Lee et al., 2011) for the Bear River to Browns Hole and the Wellsville
vertical transects. HeMP derives a series of t-T paths that are user constrained and
assume a constant geothermal gradient. The measured ZHe ages, sample depths,
together with user defined geothermal gradients produce model ages and model t-T
paths. The model ages are compared to measured ages in evaluating the suitability of
the model t-T paths for the measured ZHe data. Generally, more than one thermal

19
history is consistent with the given conditions, so an inverse model contains large sets of
acceptable thermal histories that fit with the measured data. It is important to note that
the inverse models are only as good as the analytical data and geologic interpretations
behind them (e.g., Ketcham, 2005).
Zircon (U-Th)/He Results
Samples from the WTS were strategically collected along three pseudo-vertical
transects that spanned the eastern (Monte Cristo), east-central (Browns Hole-Bear
River), and central (Wellsville) parts of the WTS, and along three different stratigraphic-
parallel traverses along the Worm Creek Member of the St. Charles, Brows Hole to basal
Geertsen Canyon, and Perry Canyon formations across the sheet (Figure 3 and 7). The
WTS developed with westward-thickening passive margin strata, and thus formation
thicknesses and depths increase westward. Paleodepths of samples were estimated
from regional stratigraphic thickness patterns, and pre-thrusting positions were
palinspastically restored by removing effects of thrusting (Figure 9). Horizontal distances
for samples were measured with respect to the palinspastically restored west end of the
section (Promontory Point). Individual grain ages were assigned a 1σ measurement
uncertainty (error) of ± 8% the estimated age (i.e. ± 8 Ma for a 100 Ma grain), based on
age variance of standard samples at the University of Texas U/Th-He Geo- and
Thermochronometry Lab (http://www.jsg.utexas.edu/he-lab/procedures/). Site mean
ZHe ages were estimated from individual grain ages, and 95% confidence intervals
approximated using a t test (which assumes normally distributed sample measurement

20
errors). Outlier grains, defined as those grains that give >2 sigma from the mean age,
were not included in calculations of mean ages. Mean ages were not calculated for sites
with more than two outlier grains. Supplementary samples were collected from the
footwall of the sheet. The following results can be seen in Appendix B.
Monte Cristo Transect
The Monte Cristo pseudo-vertical transect lies at the eastern part of the WTS
and spans a paleodepth interval from 5.3 to 7.5 km, with samples from the Worm Creek
Member, the upper and middle Geertsen Canyon, Browns Hole, and Caddy Canyon
formations (Figure 10). A sample from the Worm Creek Member had an estimated at 5.3
km paleodepth and mean ZHe age of 159.3 ± 8.2 Ma (n/N = 4/5, where N is total
number of grains analyzed and n is number of grains used to estimate the site mean
age). A sample from the upper part of the Geertsen Canyon Quartzite had an estimated
6 km depth and a mean ZHe age of 159.6 ± 15.2 Ma (n/N = 4/6), along with one older
grain and one anomalously young grain with very low [U]e (effective uranium). A sample
from the middle part of the Geertsen Canyon Quartzite contained mostly older grains
with ages of 174 to 247 Ma. A sample from the Browns Hole Formation, located at a
paleodepth of 7.1 km, had a mean ZHe age of 159.7 ± 10.3 Ma (n/N = 4/6), along with
two older grains. Two samples from the Caddy Canyon Quartzite located at 7.3 and 7.4
km paleodepths had average ZHe ages respectively of 166.2 ± 10.9 Ma (n/N =6/6) and
174.2 ± 37.9 Ma (n/N =4/6). The presence of older grains in most samples is interpreted
to reflect a location within the PRZ for ZHe.
Bear River to Browns Hole Transect

21
The Bear River- Browns Hole transect lies on the east central part of the WTS and
spans a paleodepth interval from 5.6 to 10.8 km, with samples from the Beirdneau
Formation, Worm Creek Member of the St Charles, upper and middle Geertsen Canyon,
Browns Hole, Mutual, Caddy Canyon, and Maple Canyon formations (Figure 11). Two
samples from Devonian strata had different age patterns. A southern sample had an
estimated paleodepth of 5.6 km and contained mostly older grains (four grains had ages
of 140 to 200 Ma), indicating it was located within the PRZ. A northern sample at slightly
greater estimated depth of 5.8 km had a mean age of 108.8 ± 9.2 Ma (n/N =4/6) along
with two older grains. This younger age for this sample is anomalous compared to ages
other samples from Devonian strata, and may reflect presence of unusually non-
retentive zircon grains, or local heating of the sample, possibly from hydrothermal
fluids. Mean ages for other samples display systematic variations with depth. A sample
from the Worm Creek Member, paleodepth of 6.5 km, had an age of 126.8 ± 4.7 Ma
(n/N =4/5), along with one older grain. Samples from the upper Geertsen Canyon
Quartzite, depth of 7.7 km, and the underlying Browns Hole Formation, depth of 9.0 km,
had mean ZHe ages of 112.4 ± 7.6 Ma (n/N =5/6) and 105.6 ± 2.9 Ma (n/N =6/6)
respectively. Samples from the Mutual Formation, depth of 9.5 km, and Caddy Canyon
Quartzite, depth of 10 km, had mean ZHe ages of 96.2 ± 8.9 (n/N =5/6), and 100.1 ± 12.4
Ma (n/N =5/6) respectively (Figure 11). A sample from the middle Geertsen Canyon
Quartzite was not used due to anonymously large dispersion in grain ages and high [U]e
for some grains. A sample from the Maple Canyon Formation at the base of the
transect, depth of 10.8 km, only yielded a single ZHe age due to loss of other grains

22
during analysis; this formation has been resampled for future analysis. Two samples
from the Swan Peak Quartzite did not yield usable zircon grains.
Wellsville Transect
The Wellsville transect lies in the central part of the WTS and spans paleodepths
from 6.3 to 13.5 km with samples from the Beirdneau, Swan Peak, upper and middle
Geertsen Canyon, Browns Hole, Mutual, Caddy Canyon, Perry Canyon, and Facer
formations. The upper part of the transect includes samples from the Beirdneau
Formation (depth of 6.3 km) and the Swan Peak Quartzite (depth of 7.0 km) with ZHe
mean ages of 128.8 ±14.5 Ma (n/N =5/6) and 129.5 ± 11.1 Ma (n/N =6/6). Samples from
the Upper Geertsen Canyon Quartzite (depth of 9.1 km) and underlying Browns Hole
Formation (depth of 10.2 km) yielded mean ZHe ages of 109.5 ± 9.4 Ma (n/N =4/6) along
with one older and one younger grain, and 97 ± 5.8 Ma (n/N =6/6) respectively. Samples
from the Mutual Formation (depth of 10.8 km) and Caddy Canyon Quartzite (depth of
11.4 km) had mean ages of 86.9 ± 9.1 Ma (n/N =5/6) and 94.5 ± 10.2 Ma (n/N =4/6)
respectively (Figure 12). A gneiss sample from the Facer Formation at a 13.5 km
paleodepth had a bimodal distribution with grain age groups of 95.2 ± 5.5 Ma (n=3) and
62.8 ± 3.9 Ma (n=3). The younger age group is interpreted to record less retentive
zircons for a new PRZ that developed after Willard thrusting and prior to ~60-65 Ma
uplift of the Wasatch anticlinorium during younger Absaroka thrusting. The deepest
structural level on the transect lies in a repeated section of the Perry Canyon Formation
below an imbricate thrust at the base of Facer Formation. A sample from this lower
panel of Perry Canyon Formation at the base of the WTS yielded a mean age of 24.0

23
±6.4 Ma (n/N =6/6). A sample from the middle Geertsen Canyon Quartzite (9.6 km)
yielded a wide range of ages and was not used for thermal modeling.
Worm Creek Traverse
The pseudo-horizontal traverse along the Worm Creek Member includes 4
samples and covers a distance from 22 to 57 km relative to prominatory point on a
palinspastically restored section. Mean ZHe ages are 111.3 ± 8.9 Ma (WT12-40, 22 km),
149.4 ± 17.5 Ma (WT12-41, 26 km), 126.8 ± 4.7 Ma (WT12-3, 36 km), and 166.23 ± 17.6
Ma (NCAT-9, 57 km). Too few sample sites were collected along the Worm Creek
traverse to estimate slip rate (Figure 13).
Geertsen Canyon Traverse
The horizontal traverse along the basal Geertsen Canyon Quartzite to underlying
Browns Hole Formation includes 6 samples and covers horizontal distances from -3 km
to 63 km on a palinspastically restored section. Sample WT12-19 along the eastern edge
of the WT (distance 63 km) yielded an age of 179.5 ± 30.2 Ma (n=4/6) and is interpreted
to be within the PRZ. Samples that span a traverse distance from 41 km to 3 km yield
mean ZHe ages that range correspondingly from 119.4 ± 8.9 Ma to 87.5 ± 8.8 Ma.
Assuming a constant geothermal gradient, the traverse yields an average slip rate of
~1.7 mm/yr. from ~ 125 to 90 Ma (Figure 14). Sample CAT-15 only had two usable grains
and will need additional sampling.
Perry Canyon Traverse
The stratigraphic traverse along the Perry Canyon Formation includes 5 samples.
Four of the samples, EAB10-18 and EAB10-11 (-1 km), WT12-49 (7 km), and WT12-43

24
(33 km) have ZHe ages that range from 66.7 ± 5.3 Ma to 67.8 ± 5.4 Ma. The samples
along this level did not cool through the PRZ until the latest Cretaceous, likely during
subsequent uplift above the Wasatch anticlinorium (Figure 15). Sample WT12-47 (24
km), which is located in the footwall of an imbricate thrust and thus at a deeper
structural level, has a younger ZHe age of 24.0 ± 1.9 Ma and did not cool through the
PRZ until Neogene extension.
Footwall
Samples were collected from the Tintic Quartzite and underlying basement of
the Farmington Canyon Complex in the footwall of the Willard thrust along the
Wellsville transect to better assess the tectonic significance of the ages of exhumation.
The intent was to distinguish whether the exhumation signature of the samples
collected from the lower hanging wall to footwall recorded slip along the Willard thrust,
uplift of the basement-cored Wasatch anticlinorium, or Neogene extension. Footwall
samples have mean ZHe ages ranging from 14.0 ± 0.4 Ma 4.7 ± 0.4 Ma to, recording
cooling related to exhumation along the Wasatch normal fault (Figure 20). All samples
collected from the footwall remained too deep for He closure during the Cretaceous or
were reset in the Neogene.
Inverse Modeling of Arrays of Zircon (U-Th)/He Data Using HeMP and
Interpretation of Age Versus Depth Data Arrays
Bear River to Browns Hole
25
Inverse models run in HeMP were assigned initial t-T constraints of 170 °C to 220
°C from 150 Ma to 200 Ma for the structurally highest sample below the PRZ. HeMP
models yielded acceptable fits for geothermal gradients ranging mostly between 10 and
25 °C/km. Modeling suggests slow cooling (~2 °C/m.y. to ~10°C/m.y.) initiated by ~127
Ma, and continued until 90 Ma with an average exhumation rate of ~0.12 mm/yr.
(Figures 11 and 16).
Wellsville
Inverse models run in HeMP were assigned initial t-T constraints of 170 °C to 220
°C from 150 Ma to 200 Ma for the structurally highest sample below the PRZ. HeMP
models yielded acceptable fits for geothermal gradients ranging mostly from 14 - 25
°C/km. Modeling suggests that the central Wellsville transect underwent slow cooling
(~2 °C/m.y. to ~10°C/m.y.) from ~134 – 90 Ma with an average exhumation rate of ~0.11
mm/yr. (Figures 12 and 17). Thermal gradients with the largest number of fits for the
Bear River to Browns Hole and Wellsville transects are slightly lower than the range of
20-30°C/km initial thermal gradients modeled by Yonkee et al. (1989).
Interpretation and Discussion
Early Cretaceous Cooling of the Willard Thrust Sheet
Mechanisms for upper crustal cooling signatures from ZHe data include top-
down cooling, and bottom-up cooling. Bottom-up cooling mechanisms include
refrigeration due to flat-slab subduction, post-magmatic thermal relaxation following
magmatic intrusion, and thermal relaxation following prior heating from lithosphere

26
delamination. Top-down cooling mechanisms include enhanced erosion leading to
exhumation or the ingress of meteoric fluids. Upper crustal cooling mechanisms are
described below.
Cooling of the crust may occur by refrigeration due to flat slab subduction.
Evidence of refrigeration from thermochronologic data has been presented from the
North American Cordillera during the Laramide orogeny and is interpreted to be caused
by the shallowing of the subducting Farallon plate under North America (Dumitru et al.,
1991). Thermal gradients are high in magmatic arcs due to heat transfer from underlying
asthenosphere (Dumitru et al., 1991). When the angle of the subducting Farallon slab
decreased (at ~80 Ma) it displaced hot asthenosphere from under part of the plate
margin and replaced it with cold subducting slab (Dumitru et al., 1991). Although
refrigeration may have occurred during the Laramide orogeny this event does not
overlap in timing with cooling of the WTS. There is no evidence for shallowing of the
Farallon slab during the Early Cretaceous.
Delamination or the convective removal of part of the lower lithosphere can
occur in convergent belts from thickening of the continental lithosphere (Wells and
Hoisch, 2008). Following removal of the lithospheric root there can be an associated
increase in the geothermal gradient and in igneous and metamorphic events (Platt and
England, 1993). Thermal relaxation and cooling will occur when the lithosphere
readjusts back to equilibrium thickness by basal accretion. Although Wells and Hoisch
(2008) have suggested that there was removal of a lithospheric root beneath the North
American Cordillera immediately prior to the shallowing of the Farallon slab at the start

27
of the Laramide orogeny, there are no delamination features such as extensional
structures and magmatic and metamorphic rocks of appropriate ages within this study
area to explain the Early Cretaceous cooling evident in the Willard thrust sheet.
Geothermal gradients can increase due to magmatic intrusions. Subsequent
post-magmatic thermal relaxation can potentially modify isotopic cooling signatures. A
zircon and apatite FT thermochronology study by Adriasola et al. (2006) in the Andean
Cordillera showed different time-temperature cooling histories due to post-magmatic
cooling and is directly related to relative distance from the intrusion. Although the
magmatic arc was active during calculated cooling events of the Willard, the eastern
extent of Late Jurassic to Early Cretaceous magmatism lay sufficiently far to the west
that significant thermal perturbations related to these plutons are unlikely (Barton,
1990; Wright and Wooden, 1991).
Top down cooling mechanisms include enhanced erosion leading to exhumation,
such as uplift along a thrust ramp causing cooling due to exhumation and erosion or
uplift of footwalls during normal faulting. The slow cooling event signatures of the
Willard thrust sheet are interpreted to be a result of erosion and exhumation due to
translation up ramps in the Willard thrust.
First-order thermal models used in this study use constant thermal gradients.
During rapid fault slip heat may be transferred advectivley with change to thermal
gradients. With subsequent thermal relaxation as heat flows conductively from the
hanging wall to the footwall thermal gradients equilibrate. However, if thrust slip rate is
relatively slow, conductive heat transfer keeps pace with thrusting, resulting in

28
approximate thermal equilibrium and constant geothermal gradients. A simplified
approximation of ratio of advective to conductive heat transfer is given by
,
where Pe is the Peclet number, h is thrust sheet thickness, v is the vertical component of
slip rate along a thrust ramp, and α is thermal diffusivity (Turcotte and Schubert, 2002).
An approximate Pe of .25 for the WTS is estimated for typical α ~30 km2/m.y., h ~15 km,
v ~0.5 km/m.y., corresponding to an average slip rate of 1.7 km/m.y. and ramp angle of
about 15 degrees. This calculation indicates conductive heat transport was most
important, and an assumption of a constant geothermal gradient is a reasonable first
order approximation.
Age of Inception of the Willard Thrust
The Bear River to Browns Hole ZHe ages capture a Late Jurassic to Early
Cretaceous PRZ, with slow cooling (~2 °C/m.y. to ~10°C/m.y.) starting at ~127 Ma
(Figure 11). Cooling ages systematically increase upward in the stratigraphy of the thrust
sheet, yielding an average exhumation rate of 0.12 mm/yr. assuming steady state
geothermal conditions (Figure 16). An inflection in the age vs. depth profile shows a ~97
Ma event that may record onset of additional uplift of the Wasatch anticlinorium
induced by footwall imbrication and increase in rate of Willard fault slip.
The Wellsville ZHe ages record initiation of slow cooling (~2 °C/m.y. to
~10°C/m.y.) by ~134 Ma (Figure 12). Cooling ages systematically increase upward in the
thrust sheet, yielding an average exhumation rate of 0.11 mm/yr. assuming steady state
geothermal conditions (Figure 17). An inflection in the age vs. depth profile of the
Wellsville transect at ~97 Ma may record initial uplift of the Wasatch anticlinorium or
29
increase in slip rate on the Willard thrust. The ZHe ages from the Wellsville and Bear
River to Browns Hole vertical transects indicate thrusting in the Sevier FTB in northern
Utah initiated by ~130 Ma.
Samples from the Monte Cristo transect appear to be within the PRZ based on
the relatively wide dispersion of grain ZHe ages within individual samples that are also
older than 130 Ma. The Monte Cristo transect is therefore interpreted as being too
shallow to record cooling due to slip on the Willard thrust and data were not modeled
with HeMP (Figure 10). However, many grains had ZHe ages between 140 and 180 Ma
(Figure 18), which may record a period of enhanced but incomplete He loss during
either: (1) burial beneath Jurassic strata that are up to 1.5 km Crawford thrust sheet,
followed by cooling during erosion and development of a regional Early Cretaceous
unconformity (DeCelles, 2004); or (2) influx of warmer fluids possibly related to
shortening in the Sevier hinterland in the Jurassic, followed by influx of cooler meteoric
waters. More retentive zircon grains retained significant He and have older ages.
Slip Rate of the Willard Thrust
The slip rate along the Willard thrust was estimated using three horizontal
traverses at different levels of the thrust sheet. Ideally samples should have been
initially located beneath the PRZ and then cooled sufficiently during thrust slip and
erosion to move through the syn-thrusting PRZ. Slip rate could not be estimated for the
stratigraphically highest traverse along the Worm Creek Member due to poor zircon
yields and eastern samples being within the PRZ (Figure 13). Slip could also not be
determined for the stratigraphically lowest traverse in the Perry Canyon Formation, as

30
most samples along this traverse did not cool through the PRZ until the latest
Cretaceous, after cessation of slip along the Willard thrust. Late Cretaceous cooling is
interpreted to record renewed exhumation of the WTS during growth of the Wasatch
anticlinorium and passive uplift of the WTS, synchronous with slip along the Absaroka
thrust (Figure 15). The stratigraphically-intermediate traverse along the basal Geertsen
Canyon Quartzite to Browns Hole Formation beneath the pre-thrust PRZ and above the
post-Willard PRZ and thus could be used to estimate slip rate. The distance vs. age
profile for this level yields an average slip rate of 1.7 mm/yr. from ~125 to 90 Ma
(assuming steady state geothermal conditions), which is consistent with the estimated
net slip of ~60 km (Figure 14). An identical average shortening rate of 1.7 mm/yr. was
calculated by Allmendinger (1992) for the entire Wyoming Salient using an age vs.
cumulative displacement plot. Structurally restored sections of major thrust faults of the
Wyoming Salient conducted by Royse (1993a) estimate total shortening to be ~160 km,
yielding an average shortening rate of ~2 mm/yr.
Total shortening across the entire Sevier FTB has been calculated by other
authors to better assess links between the FTB and the processes along the Cordilleran
margin. Shortening estimates range from ~150 to 300 km (Royse, 1993a; Yonkee et al.,
1997; DeCelles and Coogan, 2006). DeCelles and Coogan (2006) calculated total
shortening along a transect at the latitude of the Canyon Range. Their total estimation
of shortening in the Sevier FTB is 220 km at an average rate of ~3 mm/yr. and is
comparable to Currie’s (2002) estimate of a minimum of ~230 km of displacement in
central Utah using a similar reconstruction strategy.

31
Timing Relations of the Wyoming Salient
ZHe data from this study constrain the timing of fault initiation, rate of thrust
slip, and exhumation history of the WTS. These data help to inform our overall
understanding of the tectonic evolution of the Sevier fold-and-thrust belt. Regional
timing relations of the thrust belt discussed below are shown on Figure 19. Data
presented here indicate the WTS had a protracted deformation history with thrust
motion initiating ~130 Ma and continuing until ~90 Ma with an average slip rate of ~1.7
mm/year. During this time, rocks along the central and east-central parts of the sheet
experienced slow cooling due to rock exhumation and erosion that averaged ~0.12
mm/yr. 40Ar/39Ar UV laser ablation ages of muscovite and biotite in the western basal
part of the WTS are ~145-125 Ma, recording mica growth during early low-grade
metamorphism, fluid flow, and internal deformation that mostly preceded large-scale
thrust slip (Giallorenzo, 2013). 40Ar/39Ar ages are consistent with ZHe data from this
study that indicate onset of cooling at ~130 Ma. The timing of Willard thrusting predates
development of the basement cored Wasatch anticlinorium and the eastern thrust
system of the salient. The ZHe ages generated by this study record continuous cooling
from ~130-90 Ma.
Exhumation of the thrust sheet is also recorded by synorogenic deposits of the
Gannett Group, Bear River Formation, Aspen Formation, and Frontier Formation.
Detrital zircon analysis of these deposits have yielded, 110 to 90 Ma reworked volcanic
grains that give maximum depositional ages, young stratigraphically upward, and closely
date deposition, except for the basal part of the Gannett Group that lacked volcanic

32
grains (Gentry et al., 2013). Zircon fission track ages from the lower parts of the WTS,
yielding 120-95 Ma cooling ages, also support erosional exhumation of the WTS at this
time (Shari Kelley, personal communication, 2013).
The WTS was uplifted and rotated by the basement cored Wasatch
anticlinorium. The anticlinorium is interpreted to have experienced multiple pulses of
growth from ~90 to 60 Ma, recorded by apatite fission track ages from basement rocks,
structural relations and characteristics of wedge top to fordeep basins (Naeser et al.,
1983; Yonkee, 1992; DeCelles, 1994; DeCelles et al., 1995; Yonkee and Weil, 2010).
Pulses of uplift are linked to episodes of slip along the Crawford, Absaroka, and
Hogsback thrusts (DeCelles, 1994). ZHe ages from the structurally deeper footwall of the
WTS from this study record cooling events at ~5 Ma related to exhumation in the
footwall of the Wasatch normal fault (Figure 20).
The eastern system has a well-established record of progressive deformation
due to preserved structures in synorogenic strata and clear relationships between
synorogenic strata and thrust motion (DeCelles, 1994; Royse, 1993a; Wiltscko and Door,
1983). Structural relationships with the Mead thrust indicate that the Crawford is
younger than the Willard-Paris-Mead thrusts (Coogan, 1992). Slip along the Crawford is
recorded in growth structures of the synorogenic Weber Canyon Conglomerate at 90-85
Ma (DeCelles, 1994). Slip along the WTS had largely stopped by 90 Ma, but parts
continued to be exhumed during uplift above the Wasatch anticlinorium (DeCelles,
1994; Yonkee et al., 1997; Yonkee and Weil, 2010), as recorded by the Evanston
Formation, which lies unconformably on the WTS (DeCelles, 1994). Continued

33
exhumation of the WTS is also interpreted to occur from further development of the
eastern thrust system. Evidence for this can be seen in ZHe data presented in this study
from the Perry Canyon Formation, which records a ~65 Ma event interpreted as a phase
of slip along the Absaroka thrust. As deformation progressed eastward, the Absaroka
thrust had two phases of slip at 85-75 Ma and 70-65 Ma; both events are recorded by
deposition of synorogenic conglomerates (Royse et al., 1975; DeCelles, 1994). The
Hogsback-Darby-Prospect thrusts are the eastern leading thrust faults in the Wyoming
Salient and slip along them likely continued into the Eocene (Wiltchko and Dorr, 1983;
Solum and van der Pluijm, 2007; Yonkee and Weil, 2011).
Correlations Between Western Thrust Systems of the Sevier FTB
Correlations between western thrust systems of the Sevier FTB have been
proposed based on similarities in stratigraphic relationships, structural positions within
the FTB, inferred timing, and displacement estimates. With a better understanding of
fault timing of the WTS, a better assessment can be made regarding thrust correlation
and whether displacement along these thrusts was synchronous or diachronous.
Extensive dominant thrusts in the Sevier FTB displaced Neoproterozoic to Paleozoic
sedimentary rocks ca. 50-100 km eastward during the Early Cretaceous and/or the Late
Jurassic (DeCelles, 2004). These include the Hawley Creek thrust in southwestern
Montana, the Willard thrust of the Wyoming salient, the Sheeprock thrust in the Nebo-
Charleston salient, the Canyon Range thrust in central Utah, the Wah Wah thrust in
southern Utah, and the Wheeler Pass thrust in the Spring Mountains in southern
Nevada (Figure 21) (DeCelles, 2004).

34
Located in central Utah, the Canyon Range, Pavant, Paxton, and Gunnison thrust
system makes up the type area for the Sevier FTB. The Canyon Range thrust carries up
to an estimated 12 km thick sequence of Neoproterozoic to Jurassic sedimentary rocks.
Although the age of thrusting is not well constrained, the Canyon Range thrust is
thought to have been active in the Early Cretaceous (DeCelles and Coogan, 2006). The
synorogenic Canyon Range conglomerate records thrust slip along the Canyon Range
thrust at ~96 Ma and apatite fission track modeling suggests possible thrust initiation at
~145 Ma (Ketcham, 1996; Stockli et al., 2001). A correlation between the Canyon Range
thrust and the Wah Wah thrust to the south is commonly accepted (DeCelles et al.,
1995; Currie, 2002; Friedrich and Bartley, 2003). Similarly, a correlation has been
proposed for the Canyon Range thrust and the Willard thrust to the north, supported by
similarities in thrust sheet stratigraphy and synorogenic deposits (Allmendinger, 1992;
Burtner and Nigrini, 1994; DeCelles et al., 1995; Yonkee et al., 1997; Currie, 2002;
Friedrich and Bartley, 2003; DeCelles, 2004; DeCelles and Coogan, 2006).
Thermochronologic evidence of the WTS presented here support this prior correlation.
Slip along the Wheeler Pass thrust sheet (WPS) from ca. 160 Ma to 150 Ma is
suggested by recent thermochronologic studies (Giallorenzo et al., 2013; Giallorenzo,
2013). According to this study, slip along the WPS was initiated up to 30 m.y. prior to
motion on other dominant western thrust faults in the Sevier FTB, calling into question
the correlation between the WPS in southern Nevada and the WTS in northern Utah, as
coeval thrust sheets. Based upon stratigraphic relationships and structural position
within the thrust belt, the Wheeler Pass and Gass Peak thrusts have been proposed as

35
correlative across the Las Vegas valley shear zone (Armstrong, 1968). It is debatable
whether the Wheeler Pass/Gass Peak thrust follows the trend of the Sevier FTB into
Utah or continues into southern Nevada (Royse, 1993a; Taylor et al., 2000).
Hinterland Relationships
Supracrustal rocks in the hinterland show evidence for only minor Late Jurassic
to Early Cretaceous shortening. Miller and Hoisch (1995) summarize Jurassic tectonism
within areas of the northeastern Great Basin. Thrust faults and folds predated or were
coeval with Jurassic plutonism in the Pilot Range, Knoll Mountain, Gold Hill, and the
Ruby, Silver Island, Newfoundland, Oquirrh, and Dolly Varden mountains (Miller and
Hoisch, 1995). A minor episode of crustal shortening in the hinterland of the Sevier FTB
in the Late Jurassic is also interpreted in studies by Smith et al. (1993) and Miller et al.
(1988). Shortening, metamorphism, and plutonism have been recorded at ~153 Ma in
the Ruby Mountains by Hudec (1992).
Metamorphic rocks in the core complexes of the Sevier hinterland record burial
of supracrustal rocks to mid-crustal depths by stacking of thrust sheets and/or fold
nappes within the Sevier orogenic wedge (McGrew et al., 2000; Harris et al., 2007;
Cooper et al., 2010; Hoisch et al., 2014). This causes metamorphism and garnet growth
that can be evaluated to determine P-T paths and dated by Lu-Hf to determine timing of
thrust burial metamorphism (e.g., Wells et al., 2012; Hoisch et al., 2014). In the Albion
Mountains-Raft River Mountains-Grouse Creek Mountains, Snake Range, and Ruby
Mountains-East Humboldt Range, contractional deformation is thought to have initially
occurred in Late Jurassic time (Sullivan and Snoke, 2007). Lu–Hf isochron ages from

36
multiple garnet fractions and whole-rock analyses from both the hanging wall and the
footwall of the Basin-Elba fault in southern Idaho and northwestern Utah record
episodic contraction and exhumation at ~138-132 Ma (Kelly et al., 2013; Cruz-Uribe et
al., in review). Burial ages as old as 149.9 ± 1.2 Ma and 158.2 ±2.6 Ma have been
determined from the Raft River Mountains in northwestern Utah and in the Funeral
Mountains in eastern California, respectively (Hoisch et al., 2014; Wells et al., 2013).
Renewed crustal shortening has been recorded in the hinterland from burial ages of
85.5 ± 1.9 Ma in the Grouse Creek Mountains in northeastern Utah and 82.8 ± 1.1 Ma in
the Wood Hills in eastern Nevada (Hoisch et al., 2013; Wells et al., 2012; 2013). The
metamorphic rocks of the core complexes provide clear evidence for Late Jurassic to
Early Cretaceous crustal shortening and metamorphism. Thrust timing of the WTS
determined from this study and age relationships discussed in the above section are
consistent with an in-sequence eastward propagation of initial shortening within the
Sevier orogen (Figure 19).
Conclusions
ZHe analysis on approximately 240 grains from three transport-parallel traverses
and three vertical transects across the Willard thrust sheet in northern Utah record the
timing of cooling interpreted to result from erosion and exhumation due to rock uplift
above thrust ramps. Vertical transects capture an Early Cretaceous PRZ with thrust slip
occurring ca. 130 to 90 Ma. Cooling ages increase systematically upward in the east-
central and central transects, yielding an average exhumation rate of 0.12 mm/yr.

37
assuming steady state geothermal conditions; all samples from the eastern leading edge
of the sheet are within the PRZ. Ages across a transport parallel traverse yield an
average slip rate of 1.7 mm/yr. from ~125 to 90 Ma, and assuming that cooling kept
pace with displacement. The WTS was subsequently passively uplifted and partially
exhumed during Late Cretaceous development of the Wasatch anticlinorium. Age
relationships with the hinterland are consistent with in-sequence thrust propagation
during development of the orogenic wedge. The thermochronologic methodology
presented in this study effectively allows for quantification of timing, rate, and
magnitude of hanging-wall exhumation due to thrust faulting, and may adequately be
used as a case study for similar thermochronologic studies on thrust systems around the
world.
38
Figure Captions
Figure 1. Simplified map of the North American Cordillera during the early Cretaceous showing the location of the Wyoming Salient and major elements of the western Cordillera. Modified from Yonkee and Weil (2011). Figure 2. Regional geologic map of the Wyoming Salient in northern Utah showing geographic locations of the Willard, Crawford, Absaroka and Hogsback thrusts and the Wasatch anticlinorium. Modified from Yonkee and Weil (2010). Figure 3. (A) Geologic map of the Willard thrust sheet and the Wasatch anticlinorium in northern Utah. (B) Generalized geologic cross-section of the Willard thrust from W to E. The Willard has large folds, imbricate faults, and displays a ramp-flat geometry. Vertical transects are indicated in green. Modified from Adolph Yonkee personal communication. Figure 4. Tectonic model for development of the Wasatch anticlinorium and the eastern thrust system in the Wyoming salient. Modified from Yonkee and Weil (2011) Figure 5. Probability density plots of single-grain detrital zircon U/Pb ages for early Neoproterozoic through Devonian strata from the Willard thrust sheet. Only concordant ages (< 15% discordance) are plotted. Relevant stratigraphic units are Facer Formation, Farmington Canyon, Tintic Quartzite, formation of Perry Canyon, Kelley Canyon Formation, Caddy Canyon Quartzite, Mutual Formation, Browns Hole Formation, Geertsen Canyon Quartzite, Worm Creek, Swan Peak Quartzite, and Beirdneau Formation. Separated into two figures for space. Colors indicate phases of sedimentation. Simplified stratigraphic column from Yonkee and Weil (2011). Figure 6. Probability density plots of single-grain detrital zircon U/Pb ages for early Neoproterozoic through Devonian strata from the Willard thrust sheet. Only concordant ages (< 15% discordance) are plotted. Relevant stratigraphic units are Facer Formation, Farmington Canyon, Tintic Quartzite, formation of Perry Canyon, Kelley Canyon Formation, Caddy Canyon Quartzite, Mutual Formation, Browns Hole Formation, Geertsen Canyon Quartzite, Worm Creek, Swan Peak Quartzite, and Beirdneau Formation. Separated into two figures for space. Colors indicate phases of sedimentation. Simplified stratigraphic column from Yonkee and Weil (2011). Figure 7. Thermochronology sampling strategy with idealized output. (A) Conceptual diagrams showing 3 sequential periods of evolution (t0, t1, t2) for a large-displacement, single-thrust ramp with erosion. Proposed sampling strategies for thermochronometry indicated in A, with idealized output shown in B-D. Age-temperature (B), age-depth (C), and age-distance (D) plots to be used to estimate timing of initiation of thrusting (inflections in D, E, and F), cooling rate (B), exhumation rate (C), and slip rate (D). PRZ = Partial Retention Zone for zircon He. Modified from Michael Wells, personal communication. Figure 8. Plot of He concentration vs. effective alpha damage for all grains that were U-Pb prescreened prior to ZHe analysis. Blue diamonds represent zircon grains whose calculated alpha damage is below the ~2 ×10¹⁸ α/g threshold (Reiners, 200 ) and red
39
diamonds represent zircon grains which exceed the threshold. Zircon grains that exceed Reiners’ threshold have accumulated enough lattice defects to disturb the ZHe age. Figure 9. Restored section of the western part of the Willard sheet. Restored positions of vertical transect samples and ZHe ages are indicated. Modified from Adolph Yonkee personal communication. Figure 10. ZHe age vs. relative paleodepth plot from samples collected along the Monte Cristo transect of the WTS hanging wall (Figure 3). Large red circles represent sample average ZHe age and small circles represent ZHe ages for individual grains. Figure 11. ZHe age vs. relative paleodepth plot from samples collected along the Bear River to Browns Hole transect of the WTS (Figure 3). Large red circles represent sample average ZHe ages and small circles represent ZHe ages for individual grains. Grey lines represent exhumation curves that were generated from HeMP modeling software using sample average ZHe ages. Results from modeling shows tectonic exhumation was initiated ~126 ± 4.69 Ma that was preceded by a Cretaceous PRZ. Figure 12. ZHe age vs. relative paleodepth plot from samples collected along the Wellsville transect of the WTS hanging wall (Figure 3). Large red circles represent sample average ZHe ages and small red circles represent ZHe ages for individual grains. Grey lines represent exhumation curves that were generated from HeMP modeling software using sample average ZHe ages. Results from modeling shows tectonic exhumation was initiated ~134.2 ± 7.98 Ma. Figure 13. Age vs. Distance plot for the Worm Creek traverse. Large circles represent sample average ZHe ages and small circles represent ZHe ages for individual grains. Figure 14. Age vs. Distance plot for the Geertsen Canyon traverse. Large circles represent sample average ZHe ages and small circles represent ZHe ages for individual grains. Solid black line represents a best fit line for the traverse. Results indicate an average slip rate of 1.7 mm/yr. Figure 15. Age vs. Distance plot for the Perry Canyon traverse. Large circles represent sample average ZHe ages and small circles represent ZHe ages for individual grains. Figure 16. Time-Temperature plot (t-T) showing grey HeMP cooling curves for the Bear River to Browns Hole transect of the WTS hanging wall (Figure 3). Chosen initial t-T constraints are represented by a black box. Warmer colors represent higher geothermal gradients. Figure 17. Time-Temperature plot (t-T) showing HeMP cooling curves for the Wellsville transect of the WTS hanging wall (Figure 3). Chosen initial t-T constraints are represented by a black box. Warmer colors represent higher geothermal gradients. Figure 18. ZHe age probability diagram for the vertical Monte Cristo Transect. Figure 19. Diagram showing regional timing relationships between the Sevier hinterland, fold-thrust belt, and the foreland. Modified from DeCelles, 1994; Yonkee et al., 1997; Wells et al., 2013; Druschke et al., 2009; Giallorenzo, 2013; Hoisch et al., 2014. Figure 20. (A) Age probability plot for the samples collected from the footwall of the WTS. (B) Age vs. Paleodepth plot for the Wellsville transect including the samples collected from the footwall of the WTS. Figure 21. Map showing dominant western thrusts in the Sevier FTB. Modified from DeCelles (2004)

40
Figures
Figure 1. Simplified Tectonic Map of the Western North American Cordilleran

41
Figure 2. Geologic Map of the Wyoming Salient

42
Figure 3. Geologic Map and Cross Section of the Willard Thrust Sheet Including
Vertical Transects

43
Figure 4. Model for the Development of the Wasatch Anticlinorium

44
Figure 5. Willard Strat Column with U/Pb Diagrams A

45
Figure 6. Willard Strat Column with U/Pb Diagrams B
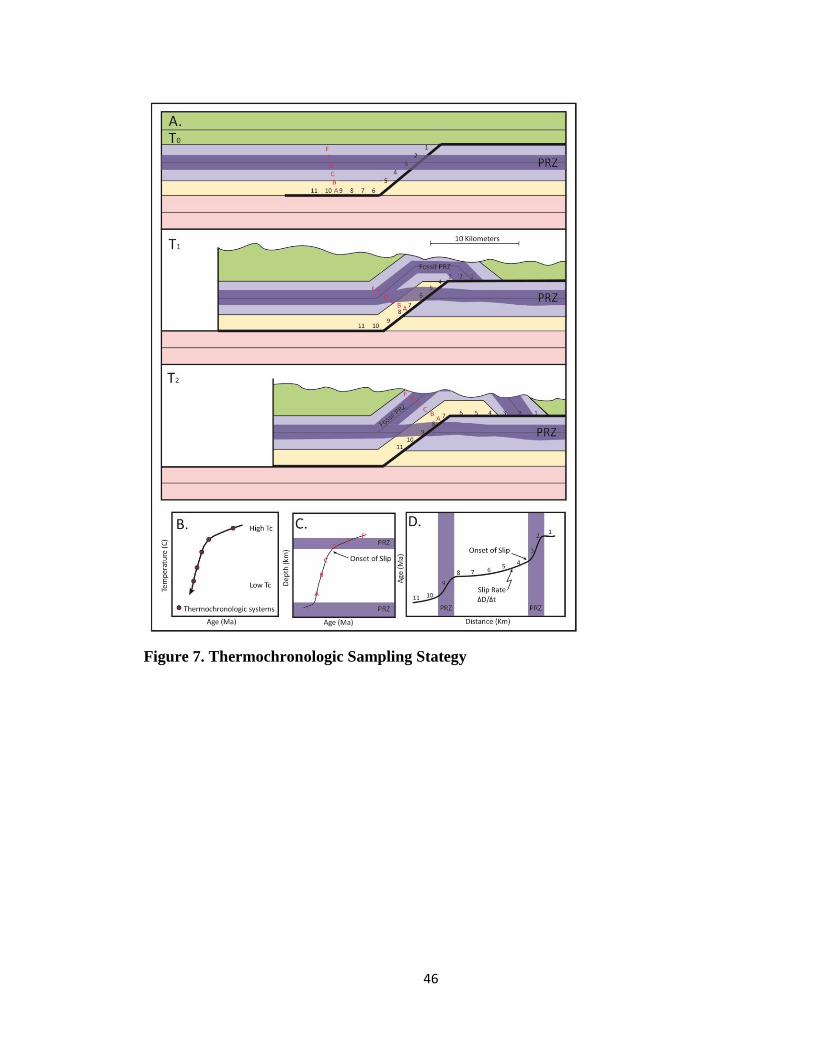
46
Figure 7. Thermochronologic Sampling Stategy

47
Figure 8. Plot of He Concentration vs. Effective Alpha Damage

48
Figure 9. Restored Willard Cross-Section with Zhe Ages

49
Figure 10. Monte Cristo Age vs. Depth Diagram

50
Figure 11. Bear River to Browns Hole Age vs. Depth Diagram

51
Figure 12. Wellsville Age vs. Depth Diagram

52
Figure 13. Worm Creek Age vs. Distance Diagram
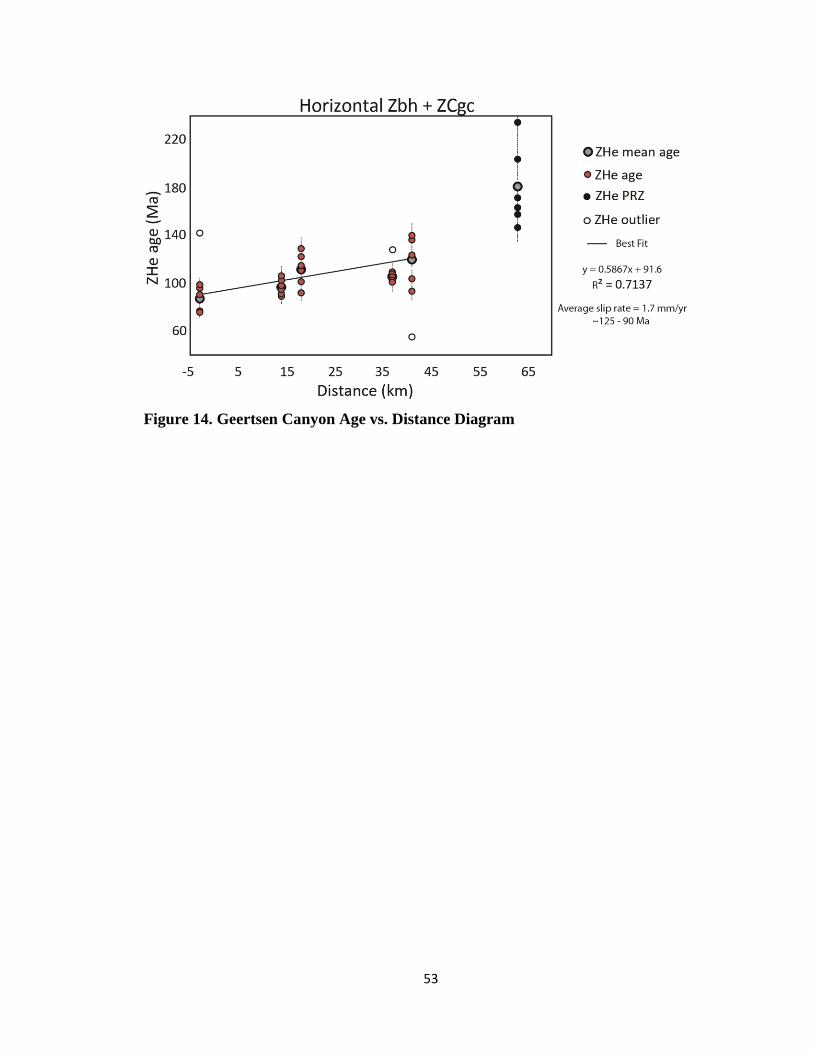
53
Figure 14. Geertsen Canyon Age vs. Distance Diagram

54
Figure 15. Perry Canyon Age vs. Distance Diagram
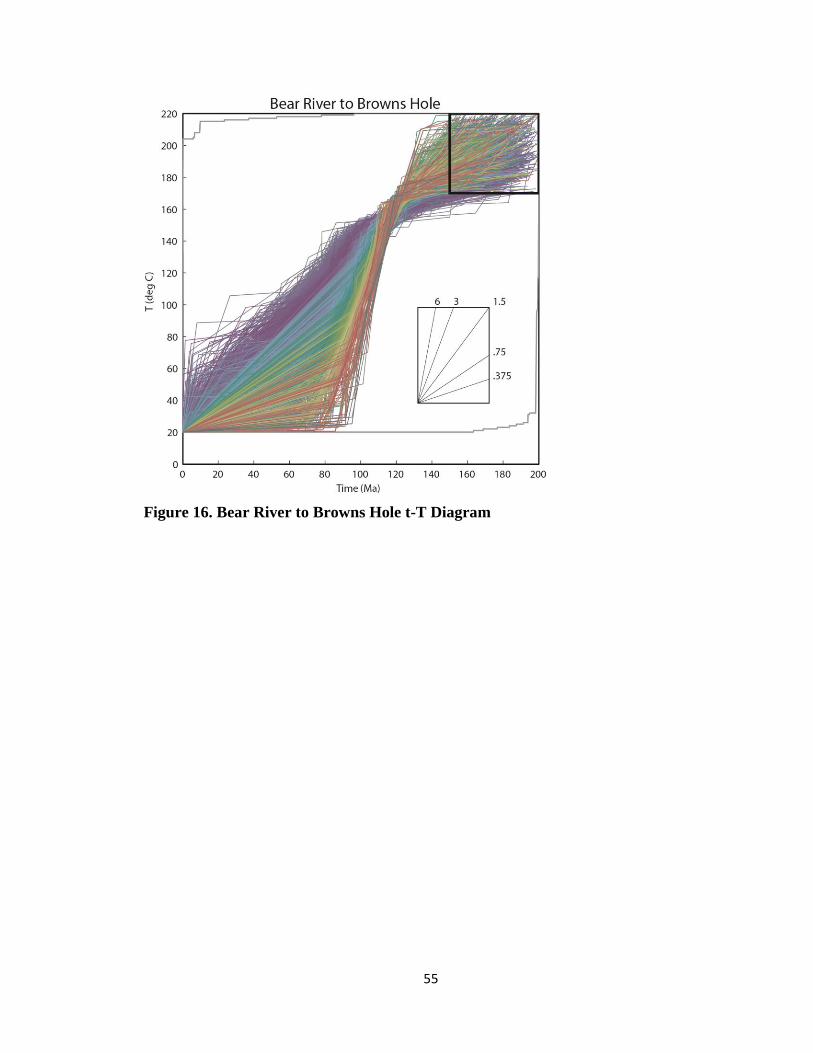
55
Figure 16. Bear River to Browns Hole t-T Diagram

56
Figure 17. Wellsville t-T Diagram
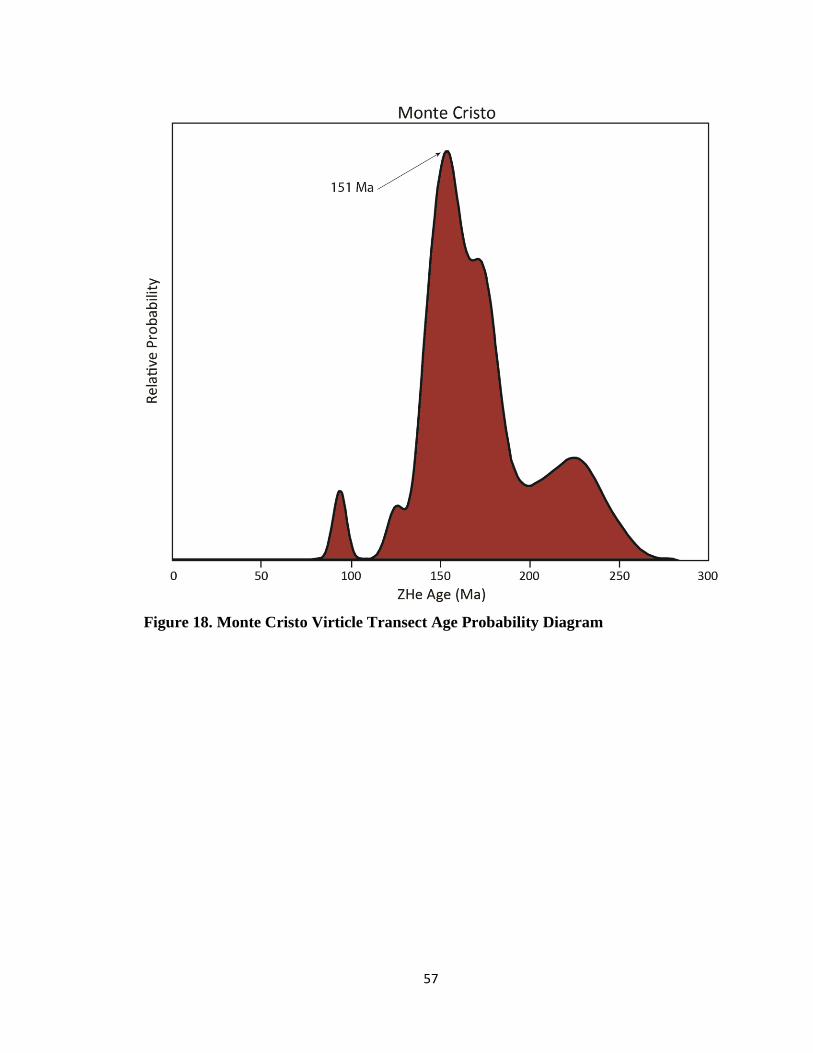
57
Figure 18. Monte Cristo Virticle Transect Age Probability Diagram

58
Figure 19. Sevier Orogeny Timing Relations Diagram

59
Figure 20. Wellsville and Footwall Vertical Transects Diagram

60
Figure 21. Map Showing Dominant Western Thrusts in the Sevier FTB

Appendix A: Sample Locations
61
Sample Unit/Formation Latitude Longitude Elevation (m)
WT12-3 Worm Creek 41.67238 -111.443498 5669 WT12-5 Water Canyon 41.62509 -111.734843 5258 WT12-6 Beirdneau 41.52421 -111741347 5517 WT12-8 Basal Tintic 41.41573 -112.014235 5184 WT12-9 Farmington Canyon 41.39934 -112.021863 4925
WT12-10 Farmington Canyon 41.40644 -112.021197 4941 WT12-11 Farmington Canyon 41.38015 -112.019446 4901 WT12-12 Farmington Canyon 41.39004 -112.022100 4963 WT12-14 lower Geertsen Canyon 41.49713 -111.958272 5094 WT12-15 middle Geertsen Canyon 41.49947 -111.952807 5247 WT12-16 upper Geertsen Canyon 41.50203 -111.948280 5344 WT12-17 Caddy Canyon 41.48320 -111.377796 7503 WT12-18 Perry Canyon 41.48301 -111.376776 7462 WT12-19 Mutual equivalent 41.48039 -111.387038 7518 WT12-20 middle Geertsen Canyon 41.48447 -111.401125 7655 WT12-21 upper Geertsen Canyon 41.48329 -111.414701 7756 WT12-24 Terra Cotta member 41.32881 -111.735794 7789 WT12-25 middle Geertsen Canyon 41.33653 -111.732164 8367 WT12-26 upper Geertsen Canyon 41.51197 -111.673629 5894 WT12-28 Mutual Formation 41.32562 -111.731647 7271 WT12-29 lower Caddy Canyon 41.32023 -111.731886 6687 WT12-30 Terra Cotta 41.45941 -111.980347 8122 WT12-31 Mutual 41.45909 -111.978247 8049 WT12-32 lower Caddy Canyon 41.45961 -111.989198 7469 WT12-35 middle Water Canyon 41.65046 -112.045769 6000 WT12-37 Facer Gneiss 41.44115 -111.987314 5342 WT12-38 Swan Peak 41.54483 -111.956099 5836 WT12-40 Worm Creek 41.46410 -111.879316 7212 WT12-41 Worm Creek 41.46385 -111.831570 5725 WT12-43 Perry Canyon 41.25964 -111.830848 5008 WT12-45 Kelly Canyon 41.37237 -111.871479 5601 WT12-46 Lower Geertsen Canyon 41.39788 -111.919119 6535 WT12-47 Perry Canyon 41.42076 -112.013319 6511 WT12-49 Perry Canyon 41.24489 -112.244833 4272 EAB10-11 Perry Canyon 41.153867 -112.328107 1421
CAT-23 Geertsen Canyon 41.299 -112.483 1415 CD10-59 Geertsen Canyon 41.333 -111.692 2027 CD10-55 Maple Canyon 41.308384 -111.73021 1721
CAT-9 Worm Creek 41.454984 -111.457240 2453 CAT-15 Geertsen Canyon 41.347 -111.805 2082
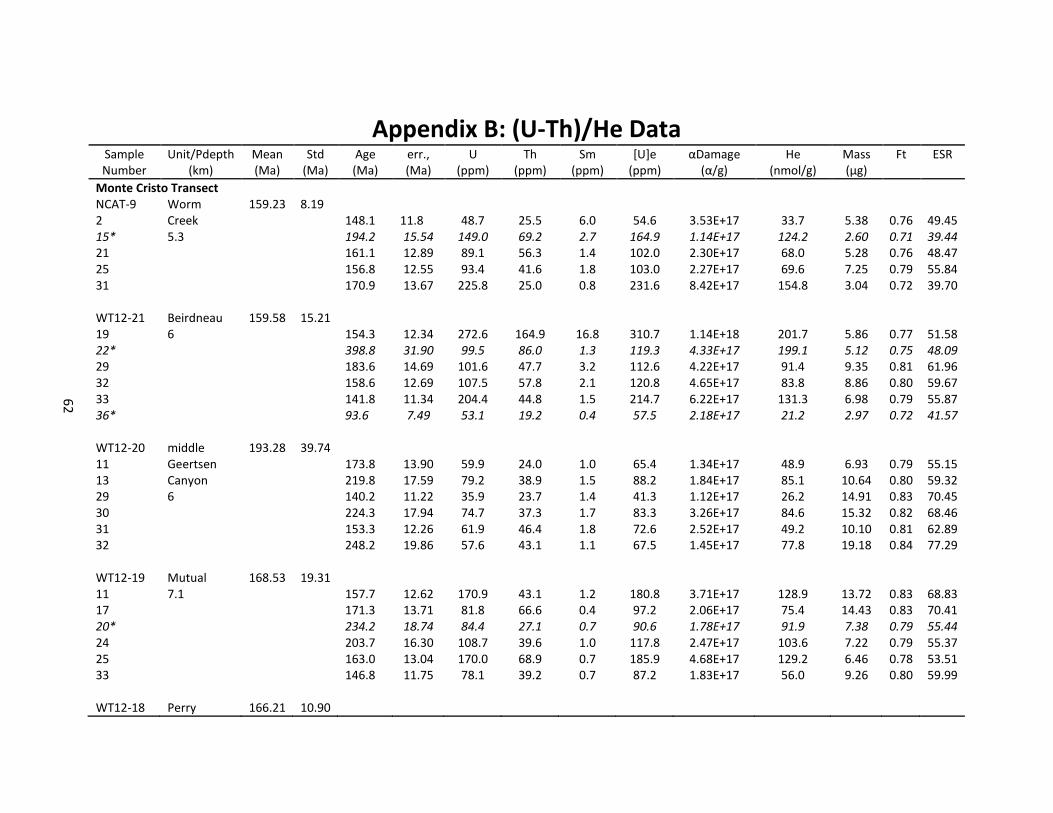
Appendix B: (U-Th)/He Data
62
Sample Number
Unit/Pdepth (km)
Mean (Ma)
Std (Ma)
Age (Ma)
err., (Ma)
U (ppm)
Th (ppm)
Sm (ppm)
[U]e (ppm)
α amage (α/g)
He (nmol/g)
Mass (µg)
Ft ESR
Monte Cristo Transect NCAT-9 Worm 159.23 8.19 2 Creek 148.1 11.8 48.7 25.5 6.0 54.6 3.53E+17 33.7 5.38 0.76 49.45 15* 5.3 194.2 15.54 149.0 69.2 2.7 164.9 1.14E+17 124.2 2.60 0.71 39.44 21 161.1 12.89 89.1 56.3 1.4 102.0 2.30E+17 68.0 5.28 0.76 48.47 25 156.8 12.55 93.4 41.6 1.8 103.0 2.27E+17 69.6 7.25 0.79 55.84 31 170.9 13.67 225.8 25.0 0.8 231.6 8.42E+17 154.8 3.04 0.72 39.70 WT12-21 Beirdneau 159.58 15.21 19 6 154.3 12.34 272.6 164.9 16.8 310.7 1.14E+18 201.7 5.86 0.77 51.58 22* 398.8 31.90 99.5 86.0 1.3 119.3 4.33E+17 199.1 5.12 0.75 48.09 29 183.6 14.69 101.6 47.7 3.2 112.6 4.22E+17 91.4 9.35 0.81 61.96 32 158.6 12.69 107.5 57.8 2.1 120.8 4.65E+17 83.8 8.86 0.80 59.67 33 141.8 11.34 204.4 44.8 1.5 214.7 6.22E+17 131.3 6.98 0.79 55.87 36* 93.6 7.49 53.1 19.2 0.4 57.5 2.18E+17 21.2 2.97 0.72 41.57 WT12-20 middle 193.28 39.74 11 Geertsen 173.8 13.90 59.9 24.0 1.0 65.4 1.34E+17 48.9 6.93 0.79 55.15 13 Canyon 219.8 17.59 79.2 38.9 1.5 88.2 1.84E+17 85.1 10.64 0.80 59.32 29 6 140.2 11.22 35.9 23.7 1.4 41.3 1.12E+17 26.2 14.91 0.83 70.45 30 224.3 17.94 74.7 37.3 1.7 83.3 3.26E+17 84.6 15.32 0.82 68.46 31 153.3 12.26 61.9 46.4 1.8 72.6 2.52E+17 49.2 10.10 0.81 62.89 32 248.2 19.86 57.6 43.1 1.1 67.5 1.45E+17 77.8 19.18 0.84 77.29 WT12-19 Mutual 168.53 19.31 11 7.1 157.7 12.62 170.9 43.1 1.2 180.8 3.71E+17 128.9 13.72 0.83 68.83 17 171.3 13.71 81.8 66.6 0.4 97.2 2.06E+17 75.4 14.43 0.83 70.41 20* 234.2 18.74 84.4 27.1 0.7 90.6 1.78E+17 91.9 7.38 0.79 55.44 24 203.7 16.30 108.7 39.6 1.0 117.8 2.47E+17 103.6 7.22 0.79 55.37 25 163.0 13.04 170.0 68.9 0.7 185.9 4.68E+17 129.2 6.46 0.78 53.51 33 146.8 11.75 78.1 39.2 0.7 87.2 1.83E+17 56.0 9.26 0.80 59.99 WT12-18 Perry 166.21 10.90

Appendix B: (U-Th)/He Data
63
Sample Number
Unit/Pdepth (km)
Mean (Ma)
Std (Ma)
Age (Ma)
err., (Ma)
U (ppm)
Th (ppm)
Sm (ppm)
[U]e (ppm)
α amage (α/g)
He (nmol/g)
Mass (µg)
Ft ESR
13 Canyon 176.6 14.13 59.4 34.2 1.3 67.2 1.51E+17 50.0 5.38 0.77 51.35 17 7.35 176.4 14.11 33.8 26.6 2.4 39.9 8.84E+16 30.2 7.05 0.78 55.11 20 149.7 11.98 92.0 34.1 0.9 99.8 2.09E+17 66.1 9.68 0.81 62.45 27 168.3 13.47 137.2 56.8 1.1 150.2 3.29E+17 111.9 9.48 0.81 62.24 35 173.2 13.85 97.4 48.4 1.3 108.6 2.34E+17 82.8 9.36 0.81 61.10 38 153.0 12.24 88.0 120.6 2.7 115.8 2.60E+17 75.0 6.41 0.77 53.39 WT12-17 Caddy 174.29 37.90 17 Canyon 211.6 16.93 43.7 40.0 1.3 52.9 1.05E+17 45.5 4.78 0.74 45.67 22 7.45 181.8 14.54 22.2 21.6 1.5 27.1 5.32E+16 20.3 5.05 0.75 47.45 23 125.1 10.01 19.3 15.6 0.5 22.9 5.24E+16 11.7 4.21 0.75 47.15 28 143.3 11.47 71.9 29.8 1.4 78.8 1.72E+17 45.4 3.70 0.74 44.20 31 231.8 18.54 72.2 35.4 1.3 80.4 1.90E+17 79.0 5.43 0.77 51.66 33 152.2 12.17 26.5 25.5 0.8 32.4 7.53E+16 20.1 4.21 0.75 46.77 Bear River to Browns Hole Transect WT12-5 Water 121.03 25.45 5 Canyon 112.9 9.03 43.5 47.2 0.9 54.4 2.13E+17 25.7 5.49 0.77 51.12 18 5 102.2 8.17 37.0 14.1 0.5 40.2 9.23E+16 17.1 5.64 0.77 49.99 20* 482.3 38.59 28.7 22.2 0.6 33.8 1.33E+17 67.3 4.09 0.74 45.03 24 119.8 9.59 28.3 17.6 0.7 32.4 1.33E+17 16.1 5.11 0.76 49.53 28 169.9 13.59 49.2 22.8 0.5 54.5 2.06E+17 40.3 8.03 0.80 58.39 33 100.3 8.03 25.1 17.7 0.5 29.1 1.17E+17 11.9 4.41 0.75 47.27 WT12-6 Beirdneau 171.67 25.40 6* 5.8 493.7 39.49 88.0 68.5 0.8 103.8 4.13E+17 211.1 4.13 0.74 44.67 8 192.7 15.42 104.6 115.3 2.7 131.1 5.31E+17 98.3 3.27 0.71 40.57 22 153.7 12.30 155.3 78.7 1.1 173.4 6.96E+17 101.6 2.35 0.70 38.03 28 140.0 11.20 94.4 56.6 1.7 107.5 4.23E+17 61.8 4.40 0.75 47.50 34* 307.0 24.56 102.4 87.4 2.9 122.6 5.07E+17 143.3 2.45 0.69 37.50 37 200.2 16.02 121.6 67.2 2.3 137.1 5.37E+17 105.3 2.36 0.70 38.44 WT12-3 Worm 126.83 4.69

Appendix B: (U-Th)/He Data
64
Sample Number
Unit/Pdepth (km)
Mean (Ma)
Std (Ma)
Age (Ma)
err., (Ma)
U (ppm)
Th (ppm)
Sm (ppm)
[U]e (ppm)
α amage (α/g)
He (nmol/g)
Mass (µg)
Ft ESR
3 Creek 133.8 10.71 46.8 52.1 0.7 58.8 5.28E+16 31.2 3.70 0.73 43.25 6 6.5 125.3 10.02 42.0 28.1 1.1 48.4 4.17E+16 25.8 7.19 0.78 54.00 9 128.4 10.19 34.4 19.0 0.6 38.8 3.46E+16 20.6 5.41 0.77 50.12 10* 207.6 16.61 126.1 109.9 1.9 151.4 4.28E+17 118.2 2.26 0.69 36.91 13 120.8 9.67 95.2 85.2 1.3 114.8 3.11E+17 53.6 2.82 0.71 40.00 WT12-26 Upper 112.44 7.58 7 Geertsen 119.9 9.59 47.9 36.2 1.8 56.3 1.47E+17 29.0 7.62 0.79 56.83 9 Canyon 122.5 9.80 65.6 42.8 1.8 75.4 2.85E+17 37.9 4.87 0.75 47.65 13* 7.7 150.4 12.03 119.3 77.6 1.9 137.2 3.79E+17 89.4 7.68 0.79 57.90 22 107.0 8.56 57.1 41.7 3.3 66.7 1.73E+17 29.9 6.75 0.77 51.15 25 110.0 8.80 48.6 27.3 1.3 54.9 2.04E+17 24.2 3.48 0.74 44.07 36 102.7 8.22 156.6 65.9 4.9 171.8 6.26E+17 70.7 3.46 0.74 44.03 WT12-25 middle 150.76 73.82 2 Geertsen 125.2 10.02 146.5 146.0 3.8 180.1 6.78E+17 101.1 12.40 0.82 68.09 12 Canyon 179.1 14.33 212.8 77.9 1.9 230.8 8.98E+17 183.9 10.10 0.81 63.67 18 8.4 250.2 20.02 99.7 78.9 1.7 117.8 4.47E+17 140.5 35.69 0.86 90.77 25* 575.9 46.07 21.9 13.9 0.2 25.1 9.45E+16 71.4 35.80 0.87 94.71 28 48.5 3.88 255.2 97.5 1.9 277.7 1.03E+18 60.4 13.65 0.83 69.04 33* 1422.1 113.77 22.7 15.2 0.5 26.2 9.82E+16 201.4 27.14 0.86 85.10 WT12-24 Brownshole 105.62 2.88 2 Member 108.1 8.65 140.2 103.0 2.0 163.9 3.40E+17 71.4 5.36 0.74 45.13 3 9 106.6 8.52 78.3 55.5 0.8 91.0 1.87E+17 42.9 11.46 0.81 64.05 4 108.9 10.28 146.3 85.8 1.0 166.0 3.46E+17 95.1 11.83 0.82 65.81 5* 128.5 8.71 63.1 79.6 1.5 81.4 1.09E+17 39.5 13.43 0.82 66.68 6 101.6 8.12 139.6 52.4 0.6 151.7 3.17E+17 69.7 15.44 0.83 70.98 10 103.0 8.24 132.1 75.2 1.2 149.4 2.97E+17 65.7 7.30 0.78 55.09 WT12-28 Mutual 96.24 8.91 1* Formation 34.3 2.74 321.5 283.9 4.7 386.9 8.11E+17 56.7 8.53 0.79 56.63 6 9.5 93.6 7.49 63.2 23.6 0.6 68.6 1.42E+17 28.4 11.90 0.81 64.05

Appendix B: (U-Th)/He Data
65
Sample Number
Unit/Pdepth (km)
Mean (Ma)
Std (Ma)
Age (Ma)
err., (Ma)
U (ppm)
Th (ppm)
Sm (ppm)
[U]e (ppm)
α amage (α/g)
He (nmol/g)
Mass (µg)
Ft ESR
18 90.3 7.22 31.9 20.9 1.6 36.8 7.94E+16 14.7 11.94 0.82 65.32 29 109.6 8.77 33.3 15.9 0.7 37.0 7.72E+16 18.6 18.34 0.84 75.23 30 102.9 8.23 248.7 144.0 1.0 281.8 6.59E+17 119.7 6.58 0.76 48.81 31 84.8 6.78 57.6 55.6 1.3 70.5 1.38E+17 27.4 20.85 0.84 78.45 WT12-29 Lower 94.77 3.37 3 Caddy 92.0 7.36 101.3 30.1 1.1 108.2 2.20E+17 40.9 4.39 0.76 47.43 11 Canyon 97.8 7.82 55.1 34.3 1.4 63.0 1.33E+17 26.1 7.03 0.78 53.78 26 10 98.4 7.87 66.5 25.1 1.1 72.3 1.65E+17 29.9 5.61 0.77 51.66 29* 1094.8 87.58 75.2 23.5 1.2 80.6 1.66E+17 391.2 3.79 0.75 45.86 32 90.9 7.27 36.7 26.5 2.7 42.8 8.89E+16 16.5 6.56 0.78 54.29 35* 121.3 9.71 99.9 57.7 2.2 113.2 2.48E+17 53.4 2.84 0.71 40.39 CD10-55 Maple
Canyon 70.90 0
5 5 70.9 5.67 210.8 166.2 2.3 249.1 1.62E+18 76.1 7.38 0.79 57.72 Wellsville Transect WT12-35 Beirdneau 134.24 7.98 1* 6.3 107.2 8.58 186.5 120.1 1.0 214.2 4.59E+17 96.9 6.09 0.78 52.78 15 122.6 9.81 33.4 46.7 0.6 44.2 1.64E+17 22.4 4.80 0.76 49.35 16 135.5 10.84 60.2 49.1 0.5 71.5 4.42E+17 41.3 6.57 0.78 54.78 26* 173.5 13.88 59.9 37.1 0.4 68.5 2.73E+17 48.2 3.70 0.74 45.24 30 145.0 11.60 59.2 43.0 0.6 69.1 4.30E+17 41.9 5.16 0.77 50.87 36 133.8 10.70 60.7 51.9 0.9 72.6 4.64E+17 36.6 2.32 0.69 37.36 WT12-38 Swan Peak 133.58 4.92 6 7 128/.1 10.25 21.8 24.4 1.2 27.4 1.04E+17 13.2 2.21 0.69 37.81 13 132.2 10.57 59.9 20.8 0.3 64.7 2.49E+17 30.7 1.38 0.66 32.96 16* 109.2 8.73 73.2 74.0 1.1 90.2 3.32E+17 35.2 1.55 0.66 33.41 19 135.9 10.87 82.9 14.5 0.4 86.2 3.46E+17 45.8 2.69 0.72 40.20 25 141.9 11.35 111.0 64.3 1.4 125.8 3.83E+17 72.9 4.02 0.75 46.54 27 129.8 10.39 142.5 68.7 0.8 158.3 6.26E+17 72.8 1.42 0.65 32.16

Appendix B: (U-Th)/He Data
66
Sample Number
Unit/Pdepth (km)
Mean (Ma)
Std (Ma)
Age (Ma)
err., (Ma)
U (ppm)
Th (ppm)
Sm (ppm)
[U]e (ppm)
α amage (α/g)
He (nmol/g)
Mass (µg)
Ft ESR
WT12-16 Upper 109.46 9.40 9 Geertsen 98.4 7.87 63.2 54.7 5.1 75.8 1.58E+17 31.4 7.16 0.77 52.94 10* Canyon 155.0 12.40 69.9 81.1 1.2 88.6 2.33E+17 55.9 4.40 0.74 46.64 14 9.1 121.5 9.72 88.9 489.2 5.2 201.5 4.18E+17 108.3 11.86 0.80 63.83 22 102.5 8.20 106.8 156.1 3.5 142.7 2.98E+17 64.6 11.14 0.81 64.05 33 115.4 9.24 42.4 52.2 1.1 54.4 9.97E+16 25.9 4.85 0.75 48.76 34* 83.0 6.64 75.1 61.1 0.5 89.2 2.22E+17 29.7 4.00 0.74 45.00 WT12-15 Middle 115.05 37.51 5 Geertsen 110.5 8.84 189.3 67.9 18.8 205.0 4.37E+17 93.2 5.47 0.76 47.60 12 Canyon 76.1 6.09 139.0 182.5 22.6 181.2 1.77E+17 55.2 3.94 0.73 44.94 15 9.6 176.4 14.11 41.9 20.4 1.3 46.6 9.69E+16 34.3 5.18 0.76 49.56 24 97.1 7.77 116.2 79.4 3.9 134.5 2.93E+17 58.0 10.87 0.82 65.19 WT12-30 Terra 97.03 5.78 6 Cotta 89.9 7.19 29.8 17.8 0.4 33.9 9.75E+16 13.1 8.15 0.79 56.73 8 10 106.1 8.49 195.6 114.6 1.0 222.0 6.64E+17 101.2 7.14 0.79 56.28 11 91.4 7.31 225.4 83.0 1.0 244.5 9.30E+17 97.0 8.40 0.80 58.79 26 102.2 8.17 55.9 47.3 0.8 66.8 1.60E+17 30.2 11.21 0.81 64.53 27 98.0 7.84 82.1 69.5 2.2 98.1 1.32E+17 43.9 17.14 0.84 75.51 30 94.6 7.57 78.8 62.0 1.1 93.1 2.60E+17 36.9 5.44 0.77 51.76 WT12-31 Mutual 86.98 9.11 12 Formation 89.9 7.19 86.7 55.3 1.7 99.4 2.07E+17 36.1 4.40 0.74 45.62 13 10.6 103.2 8.26 130.4 178.9 38.2 171.8 3.68E+17 70.7 3.88 0.73 44.23 21* 151.7 12.13 60.0 27.1 1.0 66.3 1.46E+17 42.5 6.68 0.78 52.36 25 79.0 6.24 85.0 63.9 1.0 99.7 2.02E+17 30.8 3.29 0.73 42.98 32 89.5 6.68 212.4 86.1 2.6 232.2 4.80E+17 78.9 4.61 0.75 46.47 37 79.9 6.39 62.1 57.4 1.3 75.4 1.78E+17 24.2 3.80 0.74 45.30 WT12-32 Lower 94.49 10.16 5* Caddy 8.4 0.68 374.0 467.4 1.8 481.6 9.39E+17 15.8 3.10 0.72 41.83

Appendix B: (U-Th)/He Data
67
Sample Number
Unit/Pdepth (km)
Mean (Ma)
Std (Ma)
Age (Ma)
err., (Ma)
U (ppm)
Th (ppm)
Sm (ppm)
[U]e (ppm)
α amage (α/g)
He (nmol/g)
Mass (µg)
Ft ESR
6 Canyon 84.2 6.73 49.6 34.3 0.9 57.5 1.26E+17 19.6 4.32 0.75 46.19 14 11.4 96.2 7.70 60.9 57.3 2.2 74.1 2.18E+17 26.4 2.66 0.68 36.11 27 110.3 8.83 138.9 65.8 2.6 154.1 3.27E+17 66.4 3.40 0.72 40.93 28* 63.0 5.04 86.7 45.4 1.5 97.2 2.46E+17 24.2 3.22 0.73 42.77 41 87.2 6.98 82.1 35.4 1.0 90.2 2.45E+17 31.3 3.88 0.73 43.43 WT12-37 Facer 62.84 3.15 Gneiss 95.16 4.50 2 13.5 60.3 4.82 163.6 51.1 2.2 175.4 9.08E+17 41.9 3.25 0.73 42.74 8 67.3 5.38 315.2 155.8 3.0 351.1 1.94E+18 98.1 6.45 0.77 49.97 9 91.7 7.34 153.2 78.7 6.1 171.4 6.66E+17 62.3 3.48 0.73 42.89 13 61.0 4.88 243.9 88.6 1.6 264.3 1.46E+18 62.6 2.85 0.72 40.43 41 92.3 7.38 161.2 45.7 1.1 171.7 9.65E+17 60.0 2.39 0.70 37.34 42 101.5 8.12 107.3 44.5 1.1 117.5 6.44E+17 46.8 2.81 0.72 41.40 Perry Canyon Traverse EAB10-11 Perry 67.81 4.57 3 Canyon 72.0 5.76 43.4 25.8 0.8 49.3 6.79E+17 14.1 3.50 0.73 43.85 9 -1 75.4 6.03 55.6 53.0 2.0 67.8 3.04E+17 21.4 7.51 0.77 52.23 14 62.4 4.99 114.2 29.5 1.0 121.0 8.05E+16 31.5 5.28 0.77 50.66 17 65.9 5.27 64.4 48.9 2.5 75.7 3.41E+17 20.9 6.57 0.77 51.71 25 67.6 5.41 38.2 17.0 0.4 42.2 7.33E+16 12.2 7.44 0.79 55.70 30 63.6 5.09 110.3 64.0 1.4 125.0 2.56E+17 30.1 2.64 0.70 37.81 WT12-49 Perry 67.19 4.31 7 Canyon 74.8 5.99 98.6 37.1 1.8 107.2 1.01E+17 33.8 5.88 0.78 52.50 16 7 66.7 5.33 103.8 30.7 0.6 110.8 1.45E+17 32.2 9.18 0.80 59.65 17 64.2 5.13 84.9 26.0 1.0 90.9 2.85E+17 24.9 7.63 0.79 55.25 30 63.2 5.05 100.8 17.1 0.7 104.7 1.77E+17 26.6 4.17 0.74 44.16 24 70.9 5.67 79.0 68.5 1.0 94.8 9.74E+16 28.9 8.05 0.79 57.43 34 63.4 5.07 62.2 27.3 1.0 68.5 2.75E+17 17.7 4.50 0.75 46.83 WT12-47 Perry 24.00 5.87

Appendix B: (U-Th)/He Data
68
Sample Number
Unit/Pdepth (km)
Mean (Ma)
Std (Ma)
Age (Ma)
err., (Ma)
U (ppm)
Th (ppm)
Sm (ppm)
[U]e (ppm)
α amage (α/g)
He (nmol/g)
Mass (µg)
Ft ESR
4 Canyon 22.5 1.80 223.1 66.7 0.8 238.4 4.91E+17 23.1 7.50 0.80 57.31 5 24 17.7 1.42 79.5 29.7 1.0 86.4 1.82E+17 6.7 10.20 0.81 63.00 8 22.5 1.80 65.2 26.3 0.6 71.3 1.42E+17 7.0 10.30 0.81 60.95 10 17.7 1.41 118.6 26.8 0.5 124.8 2.03E+17 9.4 7.36 0.79 56.02 14 31.5 2.52 66.7 49.1 2.1 78.0 1.47E+17 10.5 8.37 0.79 56.64 16 32.1 2.57 60.3 31.4 1.2 67.6 1.65E+17 9.3 9.92 0.80 58.01 WT12-43 Perry 66.15 16.97 5 Canyon 82.2 6.58 393.3 335.8 4.1 470.6 2.86E+18 146.7 2.63 0.70 38.39 15 33 76.6 5.89 77.3 78.0 1.3 95.3 5.36E+17 26.3 2.38 0.69 37.63 26 42.7 3.41 273.1 302.3 6.4 342.7 2.06E+18 56.0 2.56 0.70 39.81 Geertsen Canyon Traverse CAT-23 Geertsen 87.47 8.88 6 Canyon 95.7 7.66 90.0 45.0 0.9 100.4 3.94E+17 42.3 9.98 0.81 62.85 7* -3 142.1 11.37 66.7 24.7 1.3 72.4 2.21E+17 38.9 2.53 0.70 37.26 8 97.3 7.79 349.6 163.8 2.2 387.4 1.43E+18 154.4 4.46 0.75 47.37 16 77.0 6.16 154.1 93.4 1.0 175.6 7.32E+17 56.1 5.55 0.76 50.06 17 90.4 7.23 240.7 88.1 0.6 260.9 1.60E+18 91.6 2.74 0.72 40.23 22 76.9 6.15 205.3 132.0 1.2 235.7 9.51E+17 77.8 7.79 0.79 56.82 WT12-30 Terra 97.03 5.78 6 Cotta 89.9 7.19 29.8 17.8 0.4 33.9 9.75E+16 13.1 8.15 0.79 56.73 8 14 106.1 8.49 195.6 114.6 1.0 222.0 6.64E+17 101.2 7.14 0.79 56.28 11 91.4 7.31 225.4 83.0 1.0 244.5 9.30E+17 97.0 8.40 0.80 58.79 26 102.2 8.17 55.9 47.3 0.8 66.8 1.60E+17 30.2 11.21 0.81 64.53 27 98.0 7.84 82.1 69.5 2.2 98.1 1.32E+17 43.9 17.14 0.84 75.51 30 94.6 7.57 78.8 62.0 1.1 93.1 2.60E+17 36.9 5.44 0.77 51.76 WT12-46 Lower 111.72 12.25 2 Geertsen 101.4 8.11 230.8 139.5 2.6 263.0 9.92E+17 111.2 6.14 0.77 50.51 5 Canyon 129.0 10.32 163.2 110.0 5.5 188.6 7.02E+17 103.4 7.07 0.78 53.89 6 18 122.5 9.80 103.4 141.1 8.5 136.0 5.15E+17 67.4 4.66 0.74 46.19

Appendix B: (U-Th)/He Data
69
Sample Number
Unit/Pdepth (km)
Mean (Ma)
Std (Ma)
Age (Ma)
err., (Ma)
U (ppm)
Th (ppm)
Sm (ppm)
[U]e (ppm)
α amage (α/g)
He (nmol/g)
Mass (µg)
Ft ESR
10 111.4 8.91 284.7 85.7 1.5 304.4 1.18E+18 140.1 5.14 0.76 48.31 21 92.3 7.39 243.0 165.1 4.3 281.1 1.07E+18 112.6 9.08 0.80 59.06 29 113.8 9.10 249.7 101.5 1.3 273.0 5.41E+17 135.6 8.96 0.80 59.74 CAT-15 Geertsen 120.72 2.73 13 Canyon 122.6 9.81 44.3 21.4 0.97 49.3 6.04E+17 26.8 12.94 0.8 64.3 31 27 118.8 9.50 43.1 38.3 0.79 51.9 6.73E+17 27.5 12.51 0.8 66.8 WT12-24 37 105.62 8.92 2 108.1 8.65 140.2 103.0 2.0 163.9 3.40E+17 71.4 5.36 0.74 45.13 3 106.6 8.52 78.3 55.5 0.8 91.0 1.87E+17 42.9 11.46 0.81 64.05 4 108.9 10.28 146.3 85.8 1.0 166.0 3.46E+17 95.1 11.83 0.82 65.81 5* 128.5 8.71 63.1 79.6 1.5 81.4 1.09E+17 39.5 13.43 0.82 66.68 6 101.6 8.12 139.6 52.4 0.6 151.7 3.17E+17 69.7 15.44 0.83 70.98 10 103.0 8.24 132.1 75.2 1.2 149.4 2.97E+17 65.7 7.30 0.78 55.09 CD10-59 Brownshole 119.43 18.13 3 Member 123.3 9.87 96.0 60.6 1.2 109.9 2.59E+17 59.9 10.18 0.81 63.46 5 41 136.7 10.93 45.5 45.6 0.4 56.0 1.55E+17 34.9 16.92 0.83 74.19 7 93.5 7.48 38.2 25.2 0.6 44.0 1.26E+17 17.2 5.77 0.77 51.24 11* 54.9 4.40 108.5 75.1 1.2 125.8 3.21E+17 29.5 7.20 0.79 55.59 17 139.8 11.19 59.0 41.5 0.6 68.6 1.33E+17 41.7 8.34 0.80 58.98 24 103.9 8.31 53.9 48.9 1.2 65.1 1.40E+17 28.9 8.89 0.78 55.66 WT12-19 Geertsen 179.47 30.17 11 Canyon 157.7 12.62 170.9 43.1 1.2 180.8 3.71E+17 128.9 13.72 0.83 68.83 17 63 171.3 13.71 81.8 66.6 0.4 97.2 2.06E+17 75.4 14.43 0.83 70.41 20* 234.2 18.74 84.4 27.1 0.7 90.6 1.78E+17 91.9 7.38 0.79 55.44 24* 203.7 16.30 108.7 39.6 1.0 117.8 2.47E+17 103.6 7.22 0.79 55.37 25 163.0 13.04 170.0 68.9 0.7 185.9 4.68E+17 129.2 6.46 0.78 53.51 33 146.8 11.75 78.1 39.2 0.7 87.2 1.83E+17 56.0 9.26 0.80 59.99 Swan Peak Traverse

Appendix B: (U-Th)/He Data
70
Sample Number
Unit/Pdepth (km)
Mean (Ma)
Std (Ma)
Age (Ma)
err., (Ma)
U (ppm)
Th (ppm)
Sm (ppm)
[U]e (ppm)
α amage (α/g)
He (nmol/g)
Mass (µg)
Ft ESR
WT12-40 Swan Peak 111.27 13.69 4 22 121.3 9.70 37.4 60.8 1.0 51.4 4.58E+16 25.2 4.40 0.74 46.01 6 99.2 7.94 23.3 14.6 0.4 26.6 2.46E+16 11.4 7.49 0.79 57.59 9 100.4 8.04 30.2 36.3 0.7 38.6 3.53E+16 15.9 4.86 0.75 47.93 11 101.2 8.10 25.1 18.9 0.5 29.4 2.65E+16 12.2 4.44 0.75 47.99 14 136.8 10.95 36.1 21.4 0.8 41.1 3.72E+16 24.1 7.67 0.79 55.54 15 108.6 8.69 34.2 39.5 0.6 43.3 3.73E+16 19.2 4.60 0.75 47.65 WT12-41 Swan Peak 149.41 17.52 1 26 167.5 13.40 44.9 32.5 0.6 52.4 4.54E+16 36.4 4.65 0.76 49.06 2* 82.9 6.64 153.9 54.6 0.7 166.5 1.47E+17 53.4 2.84 0.71 39.76 6 137.8 11.02 46.1 57.8 2.7 59.5 5.20E+16 32.5 3.56 0.73 43.39 12 165.5 13.24 60.6 48.1 1.3 71.6 6.36E+16 47.5 3.97 0.73 44.17 14 129.9 10.15 33.4 27.9 0.8 39.8 3.74E+16 19.4 2.72 0.70 39.20 WT12-3 Swan Peak 126.83 4.69 3 36 133.8 10.71 46.8 52.1 0.7 58.8 6.14E+16 31.2 3.70 0.73 43.25 6 125.3 10.02 42.0 28.1 1.1 48.4 5.85E+16 25.8 7.19 0.78 54.00 9 127.4 10.19 34.4 19.0 0.6 38.8 6.75E+16 20.6 5.41 0.77 50.12 10* 207.6 16.61 126.1 109.9 1.9 151.4 2.80E+17 118.2 2.26 0.69 36.91 13 120.8 9.67 95.2 85.2 1.3 114.8 5.78E+17 53.6 2.82 0.71 40.00 NCat-9 Swan Peak 166.23 15.79 2 57 148.1 11.85 48.7 25.5 6.0 54.6 3.53E+17 33.7 5.38 0.76 49.45 15 194.2 15.54 149.0 69.2 2.7 164.9 1.14E+17 124.2 2.60 0.71 39.44 21 161.1 12.89 89.1 56.3 1.4 102.0 2.30E+17 68.0 5.28 0.76 48.47 25 156.8 12.55 93.4 41.6 1.8 103.0 2.27E+17 69.6 7.25 0.79 55.84 31 170.9 13.67 225.8 25.0 0.8 231.6 8.42E+17 154.8 3.04 0.72 39.70 Footwall WT12-8 Tintic 14.68 8.14 5 14.4 8.3 0.66 291.8 210.7 4.5 340.3 1.28E+18 11.9 6.64 0.78 54.66 15 7.0 0.56 404.3 355.4 4.8 486.2 1.78E+18 14.0 5.02 0.76 48.62

Appendix B: (U-Th)/He Data
71
Sample Number
Unit/Pdepth (km)
Mean (Ma)
Std (Ma)
Age (Ma)
err., (Ma)
U (ppm)
Th (ppm)
Sm (ppm)
[U]e (ppm)
α amage (α/g)
He (nmol/g)
Mass (µg)
Ft ESR
17 6.9 0.55 402.3 468.0 18.6 510.2 1.91E+18 14.5 5.51 0.76 49.50 23 16.0 1.28 161.3 224.5 3.2 213.0 8.11E+17 14.6 8.11 0.79 57.72 28 21.4 1.71 215.8 264.0 6.6 276.6 1.04E+18 24.4 5.28 0.76 50.44 32 28.5 2.28 187.1 201.3 5.2 233.4 8.70E+17 28.6 8.75 0.79 58.32 WT12-10 Farmington 6.36 1.68 1 Canyon 5.4 0.43 441.4 176.5 1.9 482.0 N/A 11.3 7.76 0.80 58.65 2 14.8 5.7 0.45 13.6 2.7 15.2 14.3 N/A 0.3 4.87 0.77 49.40 3 5.3 0.43 7.9 2.3 9.3 8.5 N/A 0.2 4.77 0.77 49.93 4 9.7 0.78 6.2 1.7 9.2 6.6 N/A 0.3 3.30 0.74 43.41 5 5.7 0.45 6.5 1.5 10.2 6.9 N/A 0.2 9.86 0.81 61.99 6* 107.5 8.60 254.3 112.6 6.8 280.2 N/A 113.8 2.12 0.70 37.42 WT12-9 Farmington 4.68 1.03 1 Canyon 5.5 0.44 5.7 1.3 10.8 6.1 N/A 0.1 4.07 0.75 46.87 2 15 5.4 0.43 395.1 35.5 0.5 403.3 N/A 7.9 1.92 0.68 34.17 3 2.7 0.22 10.1 2.7 9.7 10.7 N/A 0.1 5.98 0.77 51.63 4 5.2 0.42 279.1 18.1 1.3 283.2 N/A 6.1 4.30 0.76 47.39 5 3.9 0.31 370.5 17.5 0.5 374.6 N/A 5.5 2.23 0.70 37.30 6 5.4 0.43 20.5 1.4 7.8 20.8 N/A 0.5 3.59 0.74 43.69 WT12-11 Farmington 5.53 2.23 1 Canyon 7.0 0.56 85.8 26.5 75.4 92.3 3.09E+17 2.8 6.90 0.79 55.48 14 15.2 3.6 0.29 8.8 2.2 15.1 9.4 3.89E+16 0.1 5.84 0.78 52.80 19 4.6 0.36 370.3 103.8 1.1 394.2 1.63E+18 6.8 2.24 0.70 37.25 25 3.4 0.27 7.6 1.7 10.1 8.1 2.92E+16 0.1 5.50 0.78 52.51 26 9.2 0.73 61.7 23.7 61.1 67.5 2.68E+17 2.8 12.71 0.83 69.09 WT12-12 Farmington 4.88 0.26 1 Canyon 5.0 0.40 499.0 17.5 1.4 503.0 N/A 9.0 1.47 0.66 32.10 2 15.4 4.5 0.36 340.7 11.3 1.0 343.3 N/A 6.0 2.69 0.73 40.73 3 5.0 0.40 387.1 76.2 0.8 404.7 N/A 7.8 2.90 0.72 39.96 4 4.6 0.37 401.5 10.6 0.8 403.9 N/A 7.1 2.11 0.70 36.91

Appendix B: (U-Th)/He Data
72
Sample Number
Unit/Pdepth (km)
Mean (Ma)
Std (Ma)
Age (Ma)
err., (Ma)
U (ppm)
Th (ppm)
Sm (ppm)
[U]e (ppm)
α amage (α/g)
He (nmol/g)
Mass (µg)
Ft ESR
5 4.9 0.39 1061.3 11.2 0.4 1063.9 N/A 18.7 1.71 0.67 32.82 6 5.3 0.42 513.7 14.2 0.3 517.0 N/A 10.3 1.97 0.69 36.10
*Analysis from grains excluded Note: Latitude and Longitude for samples are listed in Appendix A

Appendix C: U/Pb Data
73
Sample 206/207 (Ma) 2σ (Ma) 207/235 (Ma) 2σ (Ma) 208/232 (Ma) 2σ (Ma) U (ppm) Th (ppm) 207/206 (Ma) 2σ (Ma) Disc. (%)
WT12-3-1 1603 13 1647.8 6.8 1589 24 106.6 93.9 1702.6 8.7 3.09
WT12-3-2 1619 16 1661.9 7.9 1640 13 174.6 126 1713.5 8.9 3.2
WT12-3-3 482 6.9 487 6.5 509 13 59.4 38.5 519 24 3.81
WT12-3-4 1646 14 1673.5 6.3 1624 10 288 105.6 1711.6 5.9 2.5
WT12-3-5 1603 24 1651 13 2017 48 214 43.2 1710 13 4.4
WT12-3-6 462.5 5.5 473.3 5.8 487 10 56.9 48.2 509 22 2.76
WT12-3-7 1668 17 1688.4 8.6 1658 25 198 42.4 1712.9 9.1 2.25
WT12-3-8 478.5 6.3 477.6 5.8 475.9 9.1 64.2 50.1 493 25 3.16
WT12-3-9 1391 13 1404.6 7.6 1381 13 64.6 156 1427.9 9.9 2
WT12-3-10 1696 13 1684.5 5.4 1671 31 99.6 32 1679 7.3 2.09
WT12-3-11 1675 12 1697.5 5.2 1642 17 276 57.4 1725.3 5.3 2
WT12-3-12 1340 11 1349.4 7.3 1338 10 147 300 1367 10 1.94
WT12-3-13 453.1 6.5 470 10 484 13 24.6 27.9 564 31 5.14
WT12-3-14 1646 20 1657 10 1693 21 71.5 64.6 1671.7 9.1 2.83
WT12-3-15 1684 17 1689.8 8.4 1714 18 135 90.4 1692.3 7 2.37
WT12-3-16 1722 13 1704.7 7.2 1703 18 172 100 1696.4 7.8 2.37
WT12-3-17 1018 19 1034.9 9.9 980 13 140 100.5 1063 21 4.06
WT12-3-18 1403 27 1436 15 1378 19 80.3 61.3 1482 23 4.89
WT12-3-19 993 11 1005.7 7.3 980 11 246 119 1041 8.9 2.07
WT12-3-20 1722 27 1733 13 1641 14 116.5 92.6 1756 18 4.15
WT12-3-21 1032.9 8.5 1040.7 6.3 1013 13 92 74 1068 12 2.16
WT12-3-22 1099 9.1 1091.7 6.4 1034 13 131.3 102.6 1085.2 8.6 1.78
WT12-3-23 1009.2 7 1016.3 5 986 15 139.9 55.6 1041.6 7.1 1.55
WT12-3-24 1070.2 8.8 1064.9 5.7 1054.2 9.8 294 192.3 1065.4 6.8 1.49
WT12-3-25 2418 34 2612 15 2273 82 97.7 129 2780 17 11
WT12-3-26 1747 12 1753.1 4.8 1669 14 249 269.1 1764.2 4.3 1.9
WT12-3-27 1372 18 1373 11 1327 18 217 159 1379 12 2.49
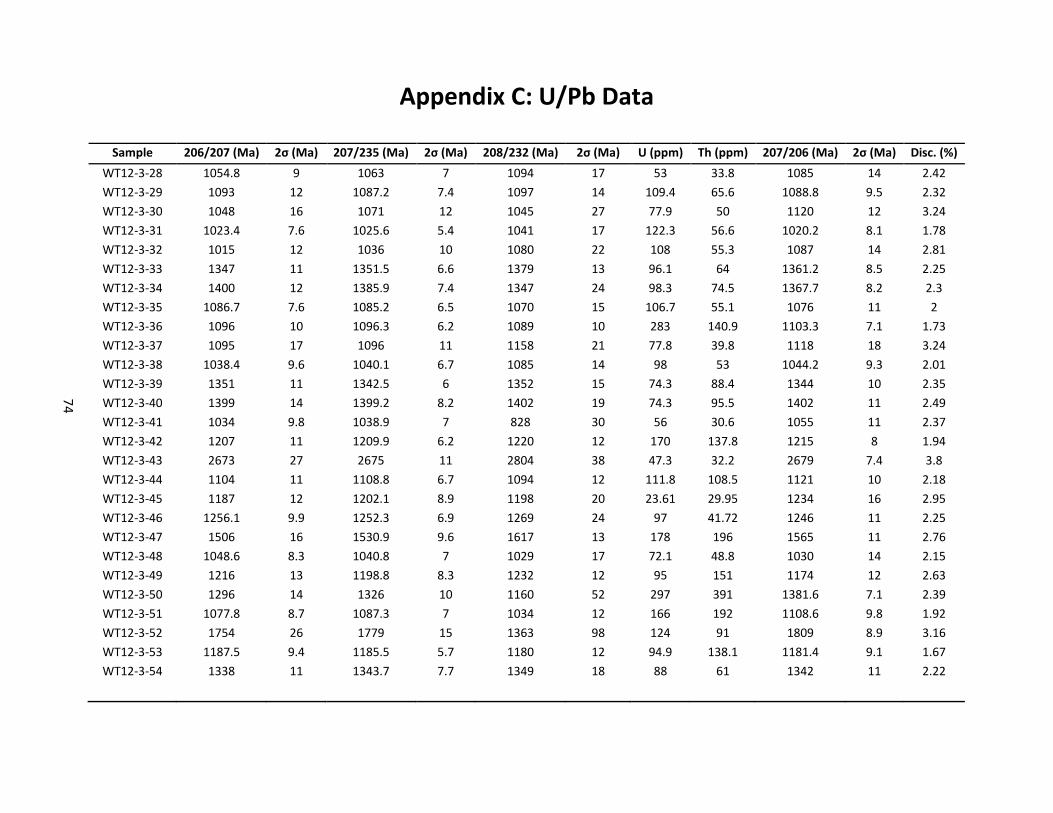
Appendix C: U/Pb Data
74
Sample 206/207 (Ma) 2σ (Ma) 207/235 (Ma) 2σ (Ma) 208/232 (Ma) 2σ (Ma) U (ppm) Th (ppm) 207/206 (Ma) 2σ (Ma) Disc. (%)
WT12-3-28 1054.8 9 1063 7 1094 17 53 33.8 1085 14 2.42
WT12-3-29 1093 12 1087.2 7.4 1097 14 109.4 65.6 1088.8 9.5 2.32
WT12-3-30 1048 16 1071 12 1045 27 77.9 50 1120 12 3.24
WT12-3-31 1023.4 7.6 1025.6 5.4 1041 17 122.3 56.6 1020.2 8.1 1.78
WT12-3-32 1015 12 1036 10 1080 22 108 55.3 1087 14 2.81
WT12-3-33 1347 11 1351.5 6.6 1379 13 96.1 64 1361.2 8.5 2.25
WT12-3-34 1400 12 1385.9 7.4 1347 24 98.3 74.5 1367.7 8.2 2.3
WT12-3-35 1086.7 7.6 1085.2 6.5 1070 15 106.7 55.1 1076 11 2
WT12-3-36 1096 10 1096.3 6.2 1089 10 283 140.9 1103.3 7.1 1.73
WT12-3-37 1095 17 1096 11 1158 21 77.8 39.8 1118 18 3.24
WT12-3-38 1038.4 9.6 1040.1 6.7 1085 14 98 53 1044.2 9.3 2.01
WT12-3-39 1351 11 1342.5 6 1352 15 74.3 88.4 1344 10 2.35
WT12-3-40 1399 14 1399.2 8.2 1402 19 74.3 95.5 1402 11 2.49
WT12-3-41 1034 9.8 1038.9 7 828 30 56 30.6 1055 11 2.37
WT12-3-42 1207 11 1209.9 6.2 1220 12 170 137.8 1215 8 1.94
WT12-3-43 2673 27 2675 11 2804 38 47.3 32.2 2679 7.4 3.8
WT12-3-44 1104 11 1108.8 6.7 1094 12 111.8 108.5 1121 10 2.18
WT12-3-45 1187 12 1202.1 8.9 1198 20 23.61 29.95 1234 16 2.95
WT12-3-46 1256.1 9.9 1252.3 6.9 1269 24 97 41.72 1246 11 2.25
WT12-3-47 1506 16 1530.9 9.6 1617 13 178 196 1565 11 2.76
WT12-3-48 1048.6 8.3 1040.8 7 1029 17 72.1 48.8 1030 14 2.15
WT12-3-49 1216 13 1198.8 8.3 1232 12 95 151 1174 12 2.63
WT12-3-50 1296 14 1326 10 1160 52 297 391 1381.6 7.1 2.39
WT12-3-51 1077.8 8.7 1087.3 7 1034 12 166 192 1108.6 9.8 1.92
WT12-3-52 1754 26 1779 15 1363 98 124 91 1809 8.9 3.16
WT12-3-53 1187.5 9.4 1185.5 5.7 1180 12 94.9 138.1 1181.4 9.1 1.67
WT12-3-54 1338 11 1343.7 7.7 1349 18 88 61 1342 11 2.22

Appendix C: U/Pb Data
75
Sample 206/207 (Ma) 2σ (Ma) 207/235 (Ma) 2σ (Ma) 208/232 (Ma) 2σ (Ma) U (ppm) Th (ppm) 207/206 (Ma) 2σ (Ma) Disc. (%)
WT12-5-1 1511 13 1469 7.7 1446 27 55.4 28 1417 11 2.68
WT12-5-2 2714 34 2779 15 2622 39 110.2 88.3 2824.4 6.6 4.42
WT12-5-3 1959 12 1940 5.8 1911 19 113.4 83.7 1918.2 7.2 2.35
WT12-5-4 1167 10 1179 10 1220 22 62.5 37.1 1212 16 2.44
WT12-5-5 1842 16 1842.4 9.5 1835 28 46.8 76.8 1830.3 9.4 2.6
WT12-5-6 1553 28 1668 15 1513 23 52.5 57.4 1815 10 7.2
WT12-5-7 1772 18 1806 11 1768 21 64.9 54.2 1837 11 3.07
WT12-5-8 1821 16 1849.4 6.9 1877 21 79.4 57.8 1872.8 8 2.38
WT12-5-9 1940 15 1934.8 8.4 1933 17 46.4 152 1926.2 9.3 2.93
WT12-5-10 1855 18 1853.1 8.9 1840 27 28.65 63.8 1852 11 2.58
WT12-5-11 1399 15 1395 11 1369 30 45.9 39.9 1384 13 2.95
WT12-5-12 1838 22 1860 15 1884 40 21.5 19.3 1895 14 3.93
WT12-5-13 1762 14 1734.9 8.1 1728 23 157 97 1697.4 6.1 2.29
WT12-5-14 1973 15 1954.4 6.6 1951 18 66.7 64.5 1931.3 8 2.75
WT12-5-15 2098 20 2103 11 2073 35 20.49 23.56 2108 11 3.22
WT12-5-16 1882 16 1846.1 8.7 1860 22 43.2 54.6 1820.3 9.7 2.35
WT12-5-17 1851 12 1841 7.4 1838 22 75.6 63.5 1824 7.3 2.29
WT12-5-18 1150 14 1152 11 1160 33 25.3 8.93 1162 19 3.73
WT12-5-19 2898 25 2855 11 2954 39 31.25 65.39 2821.7 8 4.3
WT12-5-20 1835 20 1833 11 1873 30 31.3 36.2 1820 12 3.21
WT12-5-21 2476 31 2565 12 2486 45 37.6 31.7 2639.1 8 5.6
WT12-5-22 1975 14 1979.1 7.7 2066 56 133.7 15.1 1977.8 8.2 2.06
WT12-5-23 1436.2 8.7 1442 6 1379 33 109.5 26.2 1443.3 8.7 1.91
WT12-5-24 1899 17 1899 10 1921 30 16.52 22.22 1901 12 3.55
WT12-5-25 1893 14 1873.3 8.4 1869 20 34.2 78.6 1844.7 9.2 2.49
WT12-5-26 2688 23 2674 8.5 2683 25 46.5 90.9 2659.6 4.8 3.39
WT12-5-27 1824 33 1817 16 1905 21 181 75 1815 10 3.85
WT12-5-28 1772 15 1775.2 6.9 1642 36 62.9 45.3 1775.4 7.6 2.4
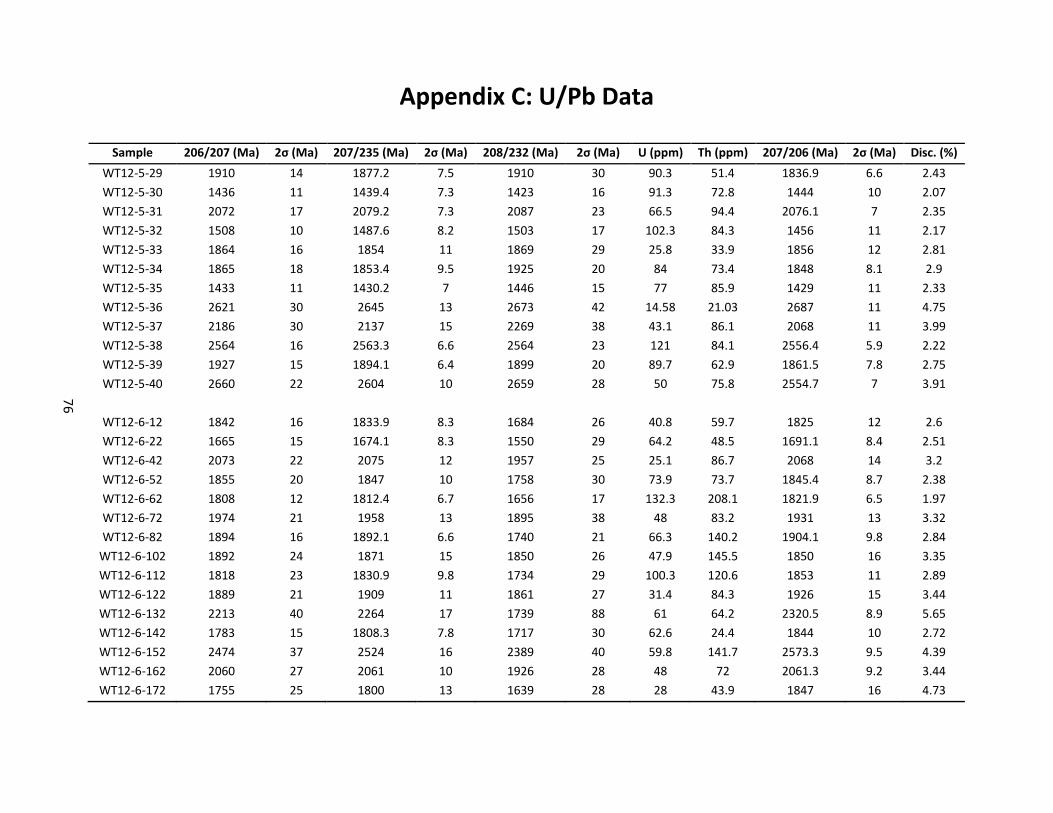
Appendix C: U/Pb Data
76
Sample 206/207 (Ma) 2σ (Ma) 207/235 (Ma) 2σ (Ma) 208/232 (Ma) 2σ (Ma) U (ppm) Th (ppm) 207/206 (Ma) 2σ (Ma) Disc. (%)
WT12-5-29 1910 14 1877.2 7.5 1910 30 90.3 51.4 1836.9 6.6 2.43
WT12-5-30 1436 11 1439.4 7.3 1423 16 91.3 72.8 1444 10 2.07
WT12-5-31 2072 17 2079.2 7.3 2087 23 66.5 94.4 2076.1 7 2.35
WT12-5-32 1508 10 1487.6 8.2 1503 17 102.3 84.3 1456 11 2.17
WT12-5-33 1864 16 1854 11 1869 29 25.8 33.9 1856 12 2.81
WT12-5-34 1865 18 1853.4 9.5 1925 20 84 73.4 1848 8.1 2.9
WT12-5-35 1433 11 1430.2 7 1446 15 77 85.9 1429 11 2.33
WT12-5-36 2621 30 2645 13 2673 42 14.58 21.03 2687 11 4.75
WT12-5-37 2186 30 2137 15 2269 38 43.1 86.1 2068 11 3.99
WT12-5-38 2564 16 2563.3 6.6 2564 23 121 84.1 2556.4 5.9 2.22
WT12-5-39 1927 15 1894.1 6.4 1899 20 89.7 62.9 1861.5 7.8 2.75
WT12-5-40 2660 22 2604 10 2659 28 50 75.8 2554.7 7 3.91
WT12-6-12 1842 16 1833.9 8.3 1684 26 40.8 59.7 1825 12 2.6
WT12-6-22 1665 15 1674.1 8.3 1550 29 64.2 48.5 1691.1 8.4 2.51
WT12-6-42 2073 22 2075 12 1957 25 25.1 86.7 2068 14 3.2
WT12-6-52 1855 20 1847 10 1758 30 73.9 73.7 1845.4 8.7 2.38
WT12-6-62 1808 12 1812.4 6.7 1656 17 132.3 208.1 1821.9 6.5 1.97
WT12-6-72 1974 21 1958 13 1895 38 48 83.2 1931 13 3.32
WT12-6-82 1894 16 1892.1 6.6 1740 21 66.3 140.2 1904.1 9.8 2.84
WT12-6-102 1892 24 1871 15 1850 26 47.9 145.5 1850 16 3.35
WT12-6-112 1818 23 1830.9 9.8 1734 29 100.3 120.6 1853 11 2.89
WT12-6-122 1889 21 1909 11 1861 27 31.4 84.3 1926 15 3.44
WT12-6-132 2213 40 2264 17 1739 88 61 64.2 2320.5 8.9 5.65
WT12-6-142 1783 15 1808.3 7.8 1717 30 62.6 24.4 1844 10 2.72
WT12-6-152 2474 37 2524 16 2389 40 59.8 141.7 2573.3 9.5 4.39
WT12-6-162 2060 27 2061 10 1926 28 48 72 2061.3 9.2 3.44
WT12-6-172 1755 25 1800 13 1639 28 28 43.9 1847 16 4.73

Appendix C: U/Pb Data
77
Sample 206/207 (Ma) 2σ (Ma) 207/235 (Ma) 2σ (Ma) 208/232 (Ma) 2σ (Ma) U (ppm) Th (ppm) 207/206 (Ma) 2σ (Ma) Disc. (%)
WT12-6-182 2035 18 2042 8.1 1960 24 105.4 236.5 2051.3 7.1 2.55
WT12-6-212 2047 17 2067.2 7.9 1911 28 75.6 76.3 2083.9 8 2.29
WT12-6-222 1861 14 1850.8 6.3 1875 21 163.1 108 1840.6 7.3 2.53
WT12-6-202 1802 19 1816.7 7.6 1752 27 79.7 114 1841 11 3.63
WT12-6-232 1845 13 1851 7.3 1757 21 111 143.1 1850.2 8.5 2.27
WT12-6-242 1906 19 1872.7 7.9 1818 30 158 212 1843.8 7.6 3.44
WT12-6-252 1348 22 1393 12 1357 20 109.2 193 1455 12 3.83
WT12-6-262 1744 14 1785.6 7 1709 21 85.8 66.3 1831.4 7.6 3.2
WT12-6-272 2325 20 2314.5 9.2 2315 28 120.3 91.1 2310.6 6.9 2.61
WT12-6-282 1834 17 1834.7 8.6 1771 28 130 76.2 1846.4 8.7 2.51
WT12-6-292 1719 19 1764 10 1699 18 61.9 140.2 1822 12 3.38
WT12-6-302 1844 20 1844.9 8.9 1899 22 63.8 96 1849 13 3.14
WT12-6-312 1814 13 1833.3 6 1792 14 153.6 236 1849.8 7.4 2.56
WT12-6-322 1864 35 1848 13 1857 32 90.5 73.5 1820 15 3.95
WT12-6-332 1798 26 1780 13 1732 37 45.2 61.7 1770.8 9.1 3.7
WT12-6-342 1921 15 1919.4 8.2 1858 24 76.9 96.7 1910 10 2.44
WT12-6-352 1892 14 1889.7 6.4 1813 23 128.8 114.7 1893.6 6.4 2.38
WT12-6-362 1796 21 1812 12 1789 35 32.8 42.2 1829 11 3.32
WT12-6-372 1825 15 1830.3 6.3 1801 21 79.9 72.7 1836.9 9.8 2.71
WT12-6-382 1747 20 1795.2 9.4 1772 22 39.6 92 1853 12 4.04
WT12-6-392 1997 25 1950 11 1982 32 108 97.5 1895.5 8.2 3.96
WT12-6-402 1808 16 1823.3 7.2 1794 19 139 169 1837.3 9.6 2.73
WT12-6-412 2527 28 2530 13 2543 46 81 40.3 2535.9 6.9 3.66
WT12-6-422 1793 17 1817.5 9.6 1801 22 58.9 74.9 1840.5 9.1 2.89
WT12-8-1 864 24 1203 21 318 10 790 957 1891 5.7 28.18
WT12-8-2 1134 16 1240 13 1199 31 29.2 19.23 1429 21 7.2
WT12-8-3 1383 16 1503.8 9.8 1598 18 82.9 112.8 1693.7 8.4 8

Appendix C: U/Pb Data
78
Sample 206/207 (Ma) 2σ (Ma) 207/235 (Ma) 2σ (Ma) 208/232 (Ma) 2σ (Ma) U (ppm) Th (ppm) 207/206 (Ma) 2σ (Ma) Disc. (%)
WT12-8-4 1855 14 1848.9 8.2 1774 26 93.1 70.6 1844.3 6.5 2.21
WT12-8-5 1767 24 1768 12 1556 48 218.8 188 1777.7 6.6 2.44
WT12-8-6 1757 13 1770.4 6.4 1673 15 333.6 358 1786.5 4.8 1.85
WT12-8-7 1020 11 1042.6 9.2 1059 12 38.8 73.3 1106 14 3.2
WT12-8-8 1486 18 1619.4 9.9 1610 22 744 225.4 1796.6 5.2 8.76
WT12-8-9 1735 15 1757.1 5.8 1725 16 247 105.3 1783.1 6 2.77
WT12-8-10 1736 15 1751.4 9.2 1455 48 233 124 1771.6 5.4 1.79
WT12-8-11 1346 27 1521 20 534 39 414 346 1779.2 7.4 11.69
WT12-8-12 1776 12 1785.3 5.6 1713 31 301 179 1794.9 5.1 1.68
WT12-8-13 1460 29 1594 18 1454 37 248 105.1 1774.2 7.1 8.5
WT12-8-14 1521 16 1651.3 9.9 1170 67 397 373 1822.4 5.7 8.12
WT12-8-15 1539 26 1657 18 527 25 494 135.4 1790 13 7.06
WT12-8-16 2574 19 2631.9 7.1 2553 50 36.7 24.17 2683.9 7.6 3.95
WT12-8-17 1718 17 1740.4 8 1805 21 54.6 59.8 1763 10 2.74
WT12-8-18 1808 18 1797.7 8.6 1780 34 219 362 1780.9 5.4 2.37
WT12-8-19 1767 25 1795 15 1251 95 150 53.5 1834 11 2.4
WT12-8-20 1508 17 1480.4 8.8 1512 34 52.6 56.3 1449.5 9.9 2.64
WT12-8-21 1783 12 1790.6 8.1 1709 41 168.5 93.8 1802.5 9.8 1.88
WT12-8-22 428 11 688 15 61.4 1.3 1256 3.27E+04 1659 11 31.55
WT12-8-23 1454 39 1589 25 775 65 413 182 1779.6 6.8 8.8
WT12-8-24 1431 38 1786 32 459 66 329 1160 2257 25 24.7
WT12-8-25 1767 11 1773.7 6.5 1764 14 156.9 165.7 1786.7 5.2 1.87
WT12-8-26 1584 47 1663 27 1367 80 540 110 1774.3 6.1 5.8
WT12-8-27 1802 11 1796.8 5 1803 21 365 124 1785.9 4.3 1.61
WT12-8-28 1600 19 1699 11 1261 17 239 185 1823 12 6.57
WT12-8-29 1031 11 1053.9 7 998 21 387 311 1094.9 9.6 2.01
WT12-8-30 2660 14 2684.7 5.6 2620 24 79 100.2 2701 4.3 2.39
WT12-8-31 1626 28 1695 16 1914 58 426 58.5 1789.6 7.3 4.58

Appendix C: U/Pb Data
79
Sample 206/207 (Ma) 2σ (Ma) 207/235 (Ma) 2σ (Ma) 208/232 (Ma) 2σ (Ma) U (ppm) Th (ppm) 207/206 (Ma) 2σ (Ma) Disc. (%)
WT12-11-1 1601 11 1699.7 5.9 2192 37 144.6 75.3 1830.1 9.2 6.17
WT12-11-2 1997 28 2912 17 10760 260 12.24 6.75 3648 18 63.2
WT12-11-3 1396 13 1509.4 7.6 1991 95 803 24.28 1676.2 9.7 7.46
WT12-11-4 876.1 9 1130 10 5640 230 734 13.28 1641 11 20.43
WT12-11-5 731 12 1101 23 3540 290 509 49.6 1938 43 33.8
WT12-11-6 1980 33 2949 27 13260 390 10.82 4.78 3709 27 67.5
WT12-11-7 799 13 1040 12 2284 54 766 21.53 1599 13 21.08
WT12-11-8 1700 110 1861 92 3060 130 303 37 2084 67 10.4
WT12-11-9 2228 37 3134 27 11990 300 9.95 6.25 3790 26 59.9
WT12-11-10 1909 31 2823 20 12300 330 9.78 4.05 3562 24 62.8
WT12-11-11 1392 13 1582 11 2549 48 394 33.26 1835 13 12.18
WT12-11-12 937.9 9.5 1227.3 8 2563 73 377 28.2 1787 13 23.08
WT12-11-13 1911 19 2719.3 9.4 11320 190 13.74 5.72 3392 14 54.5
WT12-11-14 1574 31 2486 30 8540 300 10.61 6.01 3356 31 65.7
WT12-11-15 1532 23 1623.3 9.7 2890 150 246 6.85 1755 15 5.9
WT12-11-16 3636 88 4310 31 2.02E+04 1.10E+03 1.128 1.3 4664 21 40
WT12-11-17 1707 26 1993 21 1524 57 288 417 2312 11 18.51
WT12-11-18 1897 67 2145 36 2391 92 66 53 2395 11 15
WT12-11-19 2359 68 3423 67 1.77E+04 1.30E+03 5.61 2.8 4121 62 71.3
WT12-11-20 1778 15 2008 13 2287 30 260 178.7 2259 12 14.43
WT12-11-21 1868 43 2837 46 12680 710 10.52 4.4 3627 40 67.3
WT12-11-22 2880 54 3754 30 21670 520 4.15 2.21 4258 25 55.5
WT12-11-23 2569 19 2579 12 3168 87 244 332 2586 16 2.95
WT12-11-24 1707 20 2503 11 10460 220 15 5.35 3247.2 9 55.2
WT12-11-25 1485 10 1645.2 6.6 2034 31 107.9 61.1 1858.9 5.6 10.26
WT12-11-26 1078 41 1304 40 1895 87 555 51.7 1712 35 17.5
WT12-11-27 2343 32 2404 13 2407 31 247.9 344.4 2445.5 5.5 3.75

Appendix C: U/Pb Data
80
Sample 206/207 (Ma) 2σ (Ma) 207/235 (Ma) 2σ (Ma) 208/232 (Ma) 2σ (Ma) U (ppm) Th (ppm) 207/206 (Ma) 2σ (Ma) Disc. (%)
WT12-11-28 2340 25 2363 14 2511 37 52.1 49 2371 13 2.37
WT12-11-29 1516 18 1595 14 1574 80 392 20.6 1703 17 5.25
WT12-11-30 1527 24 1885 18 1702 51 253 248 2318 16 23
WT12-11-31 2096 30 2982 17 11710 270 8.81 4.87 3669 13 60.5
WT12-11-32 1896 24 2885 25 12260 300 6.18 2.91 3666 30 68.9
WT12-11-33 1525 12 1682.9 6.9 2080 38 111.4 80.7 1893 11 10.21
WT12-11-35 1782 49 2021 29 1944 81 281 257 2271.5 7.2 14.7
WT12-11-36 993 73 1317 85 2954 80 714 51.3 1887 68 24.17
WT12-15-1 1396.2 8 1428 13 1479 17 187 404 1486 29 3.39
WT12-15-2 1035 19 1048 20 1129 49 6.39 4.09 1084 48 6.9
WT12-15-3 1122.9 7.7 1121.4 5.8 1140 11 127 163.8 1122 10 1.89
WT12-15-4 996 26 1288 21 73.4 5.3 427 4330 1822.5 9.9 22.51
WT12-15-5 1077 10 1085.7 7.7 1102 16 90.2 69.5 1096.9 9.1 2.47
WT12-15-6 1793 18 1783.7 9.3 1844 33 193.5 101.1 1780 8.1 2.3
WT12-15-7 1103.8 8.3 1097.2 6.4 1123 14 104.4 226.4 1076 12 2.21
WT12-15-8 254.2 3.6 381.8 3.9 265.2 4 1090 968 1252.6 9.8 23.33
WT12-15-9 1129 10 1109.8 8.1 1106 19 108.4 76.4 1083 10 2.22
WT12-15-10 521.3 7.3 522 10 529 16 40.5 40.7 545 27 3.47
WT12-15-11 1081.5 7.1 1081.8 5 1074 13 209 78.2 1090.4 6.7 1.67
WT12-15-12 524.7 5.5 531.8 6.7 529 10 47 42.3 574 20 3.47
WT12-15-13 1747 10 1759.2 5 1713 29 261 74.5 1778.5 5.8 1.78
WT12-15-14 2681 21 2674.5 7.7 2656 54 69.4 40.3 2669.8 5.6 2.91
WT12-15-15 1055.4 8.6 1065.1 8.5 1042 20 39 31.1 1090 17 2.88
WT12-15-16 1555 30 1610 18 1763 24 95.4 119 1674 13 3.88
WT12-15-17 1143.7 9.4 1129.6 6.1 1111 22 76.7 32.3 1129 12 2.53
WT12-15-18 1343 11 1354.5 8.4 1364 17 64.6 100.8 1365 9 1.84
WT12-15-19 1436 12 1427.8 6.7 1418 12 108.5 214 1422.3 7.7 1.89
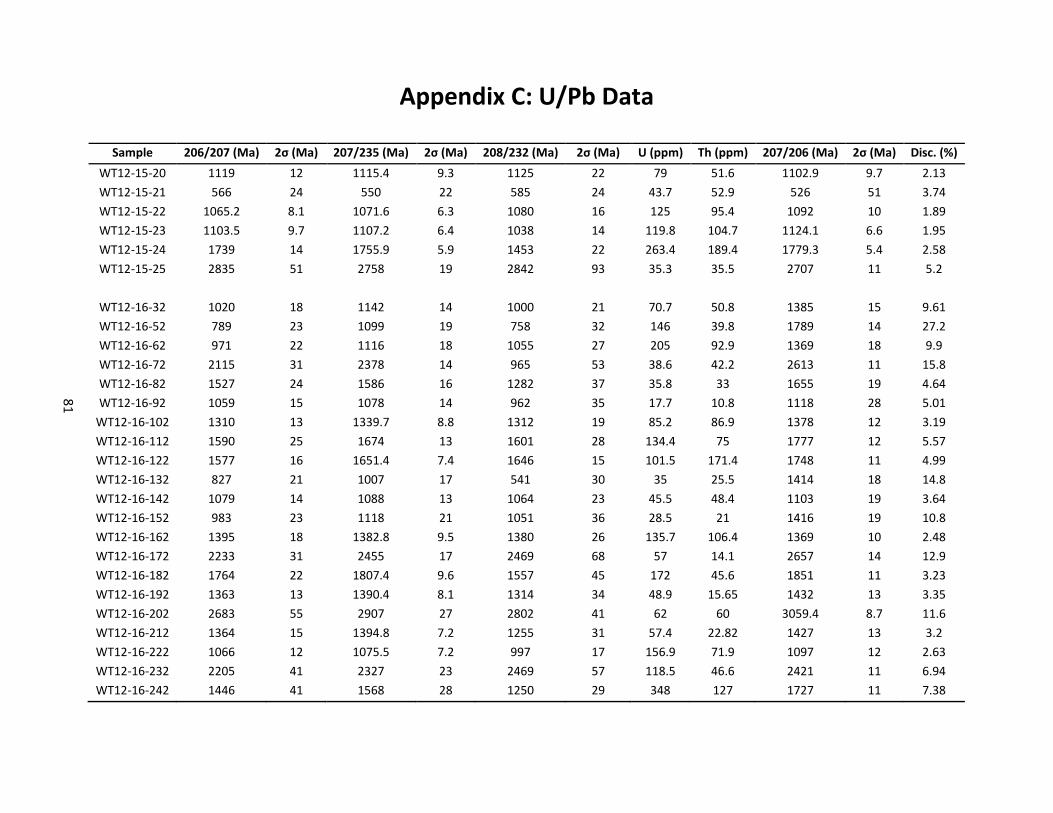
Appendix C: U/Pb Data
81
Sample 206/207 (Ma) 2σ (Ma) 207/235 (Ma) 2σ (Ma) 208/232 (Ma) 2σ (Ma) U (ppm) Th (ppm) 207/206 (Ma) 2σ (Ma) Disc. (%)
WT12-15-20 1119 12 1115.4 9.3 1125 22 79 51.6 1102.9 9.7 2.13
WT12-15-21 566 24 550 22 585 24 43.7 52.9 526 51 3.74
WT12-15-22 1065.2 8.1 1071.6 6.3 1080 16 125 95.4 1092 10 1.89
WT12-15-23 1103.5 9.7 1107.2 6.4 1038 14 119.8 104.7 1124.1 6.6 1.95
WT12-15-24 1739 14 1755.9 5.9 1453 22 263.4 189.4 1779.3 5.4 2.58
WT12-15-25 2835 51 2758 19 2842 93 35.3 35.5 2707 11 5.2
WT12-16-32 1020 18 1142 14 1000 21 70.7 50.8 1385 15 9.61
WT12-16-52 789 23 1099 19 758 32 146 39.8 1789 14 27.2
WT12-16-62 971 22 1116 18 1055 27 205 92.9 1369 18 9.9
WT12-16-72 2115 31 2378 14 965 53 38.6 42.2 2613 11 15.8
WT12-16-82 1527 24 1586 16 1282 37 35.8 33 1655 19 4.64
WT12-16-92 1059 15 1078 14 962 35 17.7 10.8 1118 28 5.01
WT12-16-102 1310 13 1339.7 8.8 1312 19 85.2 86.9 1378 12 3.19
WT12-16-112 1590 25 1674 13 1601 28 134.4 75 1777 12 5.57
WT12-16-122 1577 16 1651.4 7.4 1646 15 101.5 171.4 1748 11 4.99
WT12-16-132 827 21 1007 17 541 30 35 25.5 1414 18 14.8
WT12-16-142 1079 14 1088 13 1064 23 45.5 48.4 1103 19 3.64
WT12-16-152 983 23 1118 21 1051 36 28.5 21 1416 19 10.8
WT12-16-162 1395 18 1382.8 9.5 1380 26 135.7 106.4 1369 10 2.48
WT12-16-172 2233 31 2455 17 2469 68 57 14.1 2657 14 12.9
WT12-16-182 1764 22 1807.4 9.6 1557 45 172 45.6 1851 11 3.23
WT12-16-192 1363 13 1390.4 8.1 1314 34 48.9 15.65 1432 13 3.35
WT12-16-202 2683 55 2907 27 2802 41 62 60 3059.4 8.7 11.6
WT12-16-212 1364 15 1394.8 7.2 1255 31 57.4 22.82 1427 13 3.2
WT12-16-222 1066 12 1075.5 7.2 997 17 156.9 71.9 1097 12 2.63
WT12-16-232 2205 41 2327 23 2469 57 118.5 46.6 2421 11 6.94
WT12-16-242 1446 41 1568 28 1250 29 348 127 1727 11 7.38
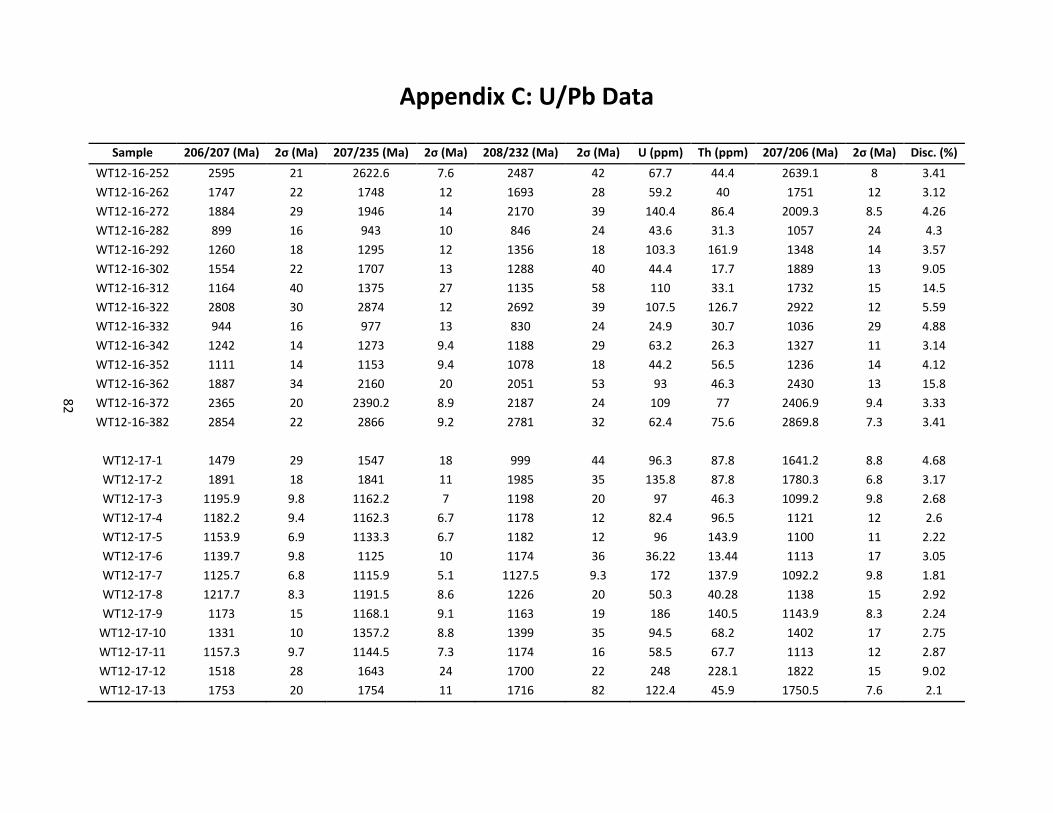
Appendix C: U/Pb Data
82
Sample 206/207 (Ma) 2σ (Ma) 207/235 (Ma) 2σ (Ma) 208/232 (Ma) 2σ (Ma) U (ppm) Th (ppm) 207/206 (Ma) 2σ (Ma) Disc. (%)
WT12-16-252 2595 21 2622.6 7.6 2487 42 67.7 44.4 2639.1 8 3.41
WT12-16-262 1747 22 1748 12 1693 28 59.2 40 1751 12 3.12
WT12-16-272 1884 29 1946 14 2170 39 140.4 86.4 2009.3 8.5 4.26
WT12-16-282 899 16 943 10 846 24 43.6 31.3 1057 24 4.3
WT12-16-292 1260 18 1295 12 1356 18 103.3 161.9 1348 14 3.57
WT12-16-302 1554 22 1707 13 1288 40 44.4 17.7 1889 13 9.05
WT12-16-312 1164 40 1375 27 1135 58 110 33.1 1732 15 14.5
WT12-16-322 2808 30 2874 12 2692 39 107.5 126.7 2922 12 5.59
WT12-16-332 944 16 977 13 830 24 24.9 30.7 1036 29 4.88
WT12-16-342 1242 14 1273 9.4 1188 29 63.2 26.3 1327 11 3.14
WT12-16-352 1111 14 1153 9.4 1078 18 44.2 56.5 1236 14 4.12
WT12-16-362 1887 34 2160 20 2051 53 93 46.3 2430 13 15.8
WT12-16-372 2365 20 2390.2 8.9 2187 24 109 77 2406.9 9.4 3.33
WT12-16-382 2854 22 2866 9.2 2781 32 62.4 75.6 2869.8 7.3 3.41
WT12-17-1 1479 29 1547 18 999 44 96.3 87.8 1641.2 8.8 4.68
WT12-17-2 1891 18 1841 11 1985 35 135.8 87.8 1780.3 6.8 3.17
WT12-17-3 1195.9 9.8 1162.2 7 1198 20 97 46.3 1099.2 9.8 2.68
WT12-17-4 1182.2 9.4 1162.3 6.7 1178 12 82.4 96.5 1121 12 2.6
WT12-17-5 1153.9 6.9 1133.3 6.7 1182 12 96 143.9 1100 11 2.22
WT12-17-6 1139.7 9.8 1125 10 1174 36 36.22 13.44 1113 17 3.05
WT12-17-7 1125.7 6.8 1115.9 5.1 1127.5 9.3 172 137.9 1092.2 9.8 1.81
WT12-17-8 1217.7 8.3 1191.5 8.6 1226 20 50.3 40.28 1138 15 2.92
WT12-17-9 1173 15 1168.1 9.1 1163 19 186 140.5 1143.9 8.3 2.24
WT12-17-10 1331 10 1357.2 8.8 1399 35 94.5 68.2 1402 17 2.75
WT12-17-11 1157.3 9.7 1144.5 7.3 1174 16 58.5 67.7 1113 12 2.87
WT12-17-12 1518 28 1643 24 1700 22 248 228.1 1822 15 9.02
WT12-17-13 1753 20 1754 11 1716 82 122.4 45.9 1750.5 7.6 2.1

Appendix C: U/Pb Data
83
Sample 206/207 (Ma) 2σ (Ma) 207/235 (Ma) 2σ (Ma) 208/232 (Ma) 2σ (Ma) U (ppm) Th (ppm) 207/206 (Ma) 2σ (Ma) Disc. (%)
WT12-17-14 1034 9.2 1050.6 8.8 1061 15 57 69.4 1081 13 2.52
WT12-17-15 1469 13 1458.7 7.3 1528 18 45.1 76.5 1447.1 9.6 2.46
WT12-17-16 1015.3 8.6 1010.7 8.7 1052 15 43.8 57.1 1012 18 3.14
WT12-17-17 1125.7 7.6 1135.4 5.5 1102 30 182.7 20.18 1154.5 7.1 1.68
WT12-17-18 1133 12 1113.7 8.2 1096 14 60.3 61.6 1075 13 2.96
WT12-17-19 1463 10 1435 7.2 1426 14 59.7 105.8 1397.3 9.5 2.94
WT12-17-20 1004 10 1004.2 9 994 13 33.5 42.3 1001 18 2.95
WT12-17-21 1155 14 1152 13 1101 32 19.77 15.35 1151 18 3.86
WT12-17-22 1033 20 1679 19 487 33 265.5 523 2608.3 9.6 49.9
WT12-17-23 1670 11 1664.7 6.3 1711 21 155.3 169.3 1651.7 6.7 1.75
WT12-17-24 1593 17 1584.2 8.4 1597 13 78.8 142.3 1584 12 3.05
WT12-17-25 1113 10 1087.8 5.6 1109 15 217 96 1041.7 9.9 2.47
WT12-17-26 1100.1 8.7 1096.4 6.7 1082 17 93.9 48.5 1093 14 2.28
WT12-17-27 1054.1 8.4 1037.4 6.7 1036 18 123 57.2 1014 11 2.17
WT12-17-28 1301 14 1268 15 1257 23 26 37 1221 28 5.1
WT12-17-29 1180.6 9.1 1172.7 5.6 1141 16 110.9 67.6 1172.7 9 2.07
WT12-17-30 1272 16 1291.7 9.8 1163 22 38 49.4 1324 13 3.27
WT12-17-31 1172 17 1157 10 1160 21 31.2 40.9 1160 18 3.95
WT12-17-32 2011 17 1934 13 2029 34 46 67.6 1852 15 4.52
WT12-17-33 2767 28 2716 13 2751 83 8.96 4.62 2676 14 4.78
WT12-17-34 1564 16 1606 11 1486 16 127.5 147.5 1661 11 3.28
WT12-17-35 2008 27 1984 12 1939 25 67.3 55.8 1951.7 9.4 4.06
WT12-17-36 1220 19 1202 12 1209 24 45.1 31.6 1159 18 3.84
WT12-17-37 1450 17 1466 12 1487 19 30.9 85.3 1478 14 3.11
WT12-18-1 2541 26 2600.4 7.4 2432 18 83.6 162.8 2643.9 8.7 4.38
WT12-18-2 1403 17 1428 10 1367 15 67.5 63.6 1466.9 9.6 2.46
WT12-18-3 1434 17 1446.8 9.1 1446 21 55.8 26.9 1469 10 2.53

Appendix C: U/Pb Data
84
Sample 206/207 (Ma) 2σ (Ma) 207/235 (Ma) 2σ (Ma) 208/232 (Ma) 2σ (Ma) U (ppm) Th (ppm) 207/206 (Ma) 2σ (Ma) Disc. (%)
WT12-18-4 1221 25 1309 14 1344 33 24.2 24.1 1447 22 6.5
WT12-18-5 1173 15 1217.4 9 1180 25 23.7 15.15 1299 16 4.26
WT12-18-6 1404 12 1420.2 8.3 1346.7 9.2 94.5 196.5 1446.6 9 2.23
WT12-18-7 1062 15 1073.8 9.5 1112 14 152 59.9 1087 11 2.09
WT12-18-8 2705 24 2726 12 2583 22 30.1 67.4 2741.8 8.4 3.75
WT12-18-9 904 23 947 16 692 39 192 194 1055 10 3.76
WT12-18-10 1228 14 1232 11 1168 18 38.4 33.8 1248 13 2.95
WT12-18-11 1233 12 1245.4 7.4 1156 14 127.9 65 1261.2 8.9 2.02
WT12-18-12 1083 15 1108 13 1116 28 16.91 13.53 1155 23 3.7
WT12-18-13 1134 12 1135.7 5.2 1088 14 67.7 64.5 1150 10 2.36
WT12-18-14 1128.2 9.9 1156.1 8.5 1151 19 82.4 49.1 1210 14 2.55
WT12-18-15 1114 11 1112.8 7.6 1051 14 49.3 51.5 1116 15 3.06
WT12-18-16 1327 13 1337.1 7.8 1336 13 68.6 181 1353.9 9.9 2.29
WT12-18-17 1119 18 1114 12 1116 27 30.8 33.5 1110 16 3.07
WT12-18-18 1079 11 1091.1 6.9 1062 16 65.1 57.2 1118 12 2.71
WT12-18-19 1096 13 1090.1 7.8 1040 17 73.8 63.1 1094 11 2.61
WT12-18-20 1057.6 9.5 1060.7 6.2 1056 14 98 56.3 1071 11 2.09
WT12-18-21 1649 11 1707.3 8.2 1682 22 68 51.1 1780.8 5.6 3.65
WT12-18-22 1415 17 1431.5 8.8 1443 17 128 121 1462 11 2.86
WT12-18-23 1028 10 1042.6 6.9 998 11 89.4 71.7 1080 13 2.46
WT12-18-24 1252 11 1245.6 7.7 1238 18 66.2 61.7 1237 13 2.34
WT12-18-25 1835 18 1852 8.3 1852 21 68.5 111 1878 11 2.95
WT12-18-26 1015.8 9.2 1026 5.8 1002 12 138.3 79.5 1032 11 2.15
WT12-18-27 1103 13 1100.3 6.8 1032 10 197 115 1099.8 8 2.22
WT12-18-28 1081.6 8.8 1087.9 5 1051.8 9.5 277 172.7 1093.5 6.9 1.89
WT12-18-29 2508 29 2606.9 9.4 2520 52 22 9.21 2688.3 8.2 6.2
WT12-18-30 2465 30 2548 12 2539 31 60.1 69.1 2617.3 9.3 5.76
WT12-18-31 1111 20 1127 12 1133 17 25.56 36.26 1179 22 4.53
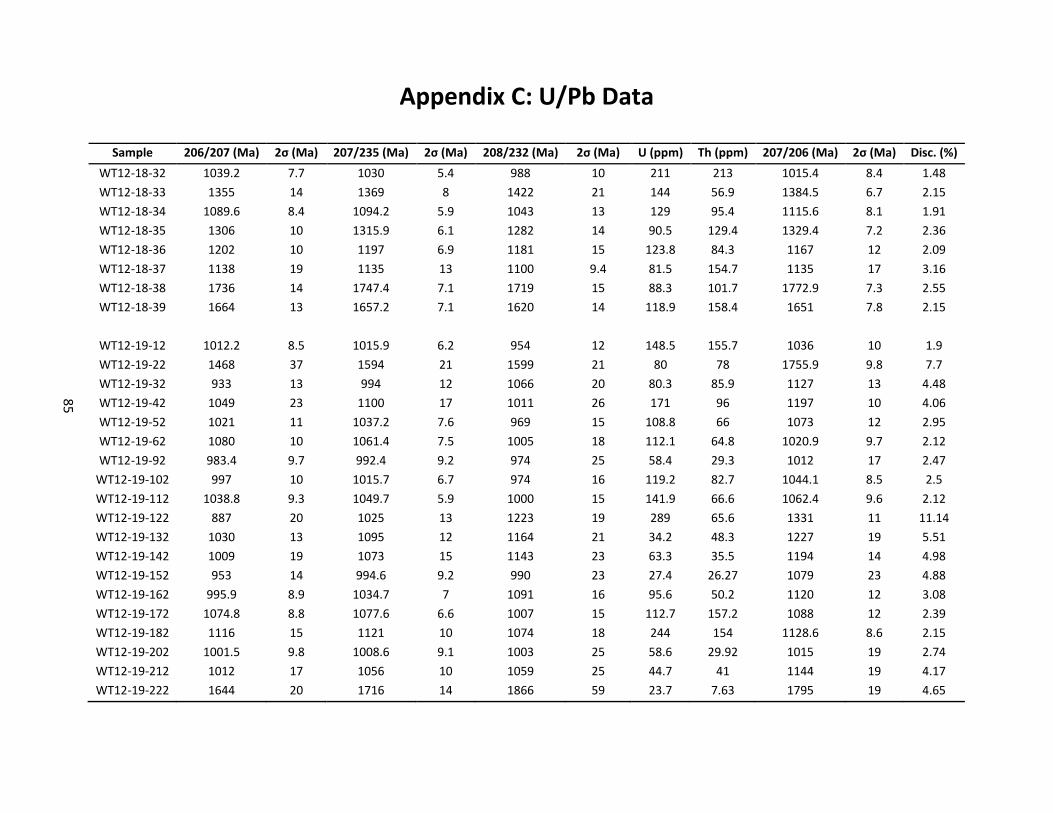
Appendix C: U/Pb Data
85
Sample 206/207 (Ma) 2σ (Ma) 207/235 (Ma) 2σ (Ma) 208/232 (Ma) 2σ (Ma) U (ppm) Th (ppm) 207/206 (Ma) 2σ (Ma) Disc. (%)
WT12-18-32 1039.2 7.7 1030 5.4 988 10 211 213 1015.4 8.4 1.48
WT12-18-33 1355 14 1369 8 1422 21 144 56.9 1384.5 6.7 2.15
WT12-18-34 1089.6 8.4 1094.2 5.9 1043 13 129 95.4 1115.6 8.1 1.91
WT12-18-35 1306 10 1315.9 6.1 1282 14 90.5 129.4 1329.4 7.2 2.36
WT12-18-36 1202 10 1197 6.9 1181 15 123.8 84.3 1167 12 2.09
WT12-18-37 1138 19 1135 13 1100 9.4 81.5 154.7 1135 17 3.16
WT12-18-38 1736 14 1747.4 7.1 1719 15 88.3 101.7 1772.9 7.3 2.55
WT12-18-39 1664 13 1657.2 7.1 1620 14 118.9 158.4 1651 7.8 2.15
WT12-19-12 1012.2 8.5 1015.9 6.2 954 12 148.5 155.7 1036 10 1.9
WT12-19-22 1468 37 1594 21 1599 21 80 78 1755.9 9.8 7.7
WT12-19-32 933 13 994 12 1066 20 80.3 85.9 1127 13 4.48
WT12-19-42 1049 23 1100 17 1011 26 171 96 1197 10 4.06
WT12-19-52 1021 11 1037.2 7.6 969 15 108.8 66 1073 12 2.95
WT12-19-62 1080 10 1061.4 7.5 1005 18 112.1 64.8 1020.9 9.7 2.12
WT12-19-92 983.4 9.7 992.4 9.2 974 25 58.4 29.3 1012 17 2.47
WT12-19-102 997 10 1015.7 6.7 974 16 119.2 82.7 1044.1 8.5 2.5
WT12-19-112 1038.8 9.3 1049.7 5.9 1000 15 141.9 66.6 1062.4 9.6 2.12
WT12-19-122 887 20 1025 13 1223 19 289 65.6 1331 11 11.14
WT12-19-132 1030 13 1095 12 1164 21 34.2 48.3 1227 19 5.51
WT12-19-142 1009 19 1073 15 1143 23 63.3 35.5 1194 14 4.98
WT12-19-152 953 14 994.6 9.2 990 23 27.4 26.27 1079 23 4.88
WT12-19-162 995.9 8.9 1034.7 7 1091 16 95.6 50.2 1120 12 3.08
WT12-19-172 1074.8 8.8 1077.6 6.6 1007 15 112.7 157.2 1088 12 2.39
WT12-19-182 1116 15 1121 10 1074 18 244 154 1128.6 8.6 2.15
WT12-19-202 1001.5 9.8 1008.6 9.1 1003 25 58.6 29.92 1015 19 2.74
WT12-19-212 1012 17 1056 10 1059 25 44.7 41 1144 19 4.17
WT12-19-222 1644 20 1716 14 1866 59 23.7 7.63 1795 19 4.65

Appendix C: U/Pb Data
86
Sample 206/207 (Ma) 2σ (Ma) 207/235 (Ma) 2σ (Ma) 208/232 (Ma) 2σ (Ma) U (ppm) Th (ppm) 207/206 (Ma) 2σ (Ma) Disc. (%)
WT12-19-232 1013 20 1029 13 1017 18 99 53.7 1045 16 3.23
WT12-19-242 1061 10 1069 11 1066 20 26.1 23.82 1073 21 3.5
WT12-19-252 1250 13 1253 8.1 1174 16 95.2 65.3 1255 12 2.64
WT12-19-262 1099.6 9.4 1098 5.8 1039 12 222 284 1088 10 2.17
WT12-19-272 996 10 1034.7 7.8 1098 15 166.9 131.1 1107 14 3.09
WT12-19-282 940 23 969 15 1032 18 121 65 1042 15 3.71
WT12-19-292 997 15 1006.2 9.9 1028 17 52.1 90.5 1030 17 2.88
WT12-19-302 1683 20 1723.6 9.8 1796 34 48 35.1 1761 11 3.72
WT12-19-312 856 15 952 12 1071 31 24.4 11.46 1187 22 8.5
WT12-19-322 1340 12 1357.1 7.2 1316 14 125.7 125.4 1386.2 8.7 2.54
WT12-19-332 1061 14 1071.4 8.7 1057 16 49.4 55.8 1090 19 3.4
WT12-19-342 948 12 970 13 967 29 18.3 15.81 1034 21 4.04
WT12-19-352 1219 16 1206 12 1171 29 36.6 27.5 1196 16 3.32
WT12-19-362 1145 11 1152.3 6.9 1117 17 134 67.9 1172 10 2.49
WT12-19-372 1123 12 1113.1 6.4 1138 25 114 37.7 1089 13 2.84
WT12-19-382 1278 16 1304 10 1435 30 213.4 157.4 1340 10 2.66
WT12-19-392 1280 13 1326.6 8.2 1382 18 77.7 84.9 1406 12 3.95
WT12-19-402 986 12 1037.5 8.2 1069 15 82.8 89.1 1162 16 4.82
WT12-20-1 1823 23 1808 10 1975 25 240 143.3 1786.7 8.8 2.68
WT12-20-2 1750 13 1764 7 1823 25 116.8 77.4 1778 5.7 1.99
WT12-20-3 1114 12 1107 13 1152 28 19.7 15.74 1091 24 3.96
WT12-20-4 1036 10 1050.4 9.1 1145 17 46.8 49.8 1077 17 2.68
WT12-20-5 1452 19 1447 11 1474 31 27.3 45.6 1456 18 3.15
WT12-20-6 1811 13 1800.5 5.9 1851 29 274 41.3 1793.8 7.9 2.14
WT12-20-7 1116 12 1114.9 7 1095 20 153.1 89.5 1107 12 2.57
WT12-20-8 1828 12 1825.8 6.1 1794 23 146.9 131.3 1824.4 5.5 1.83
WT12-20-9 1852 14 1844.2 7.2 1850 25 69.5 36.4 1832.7 8 2.22
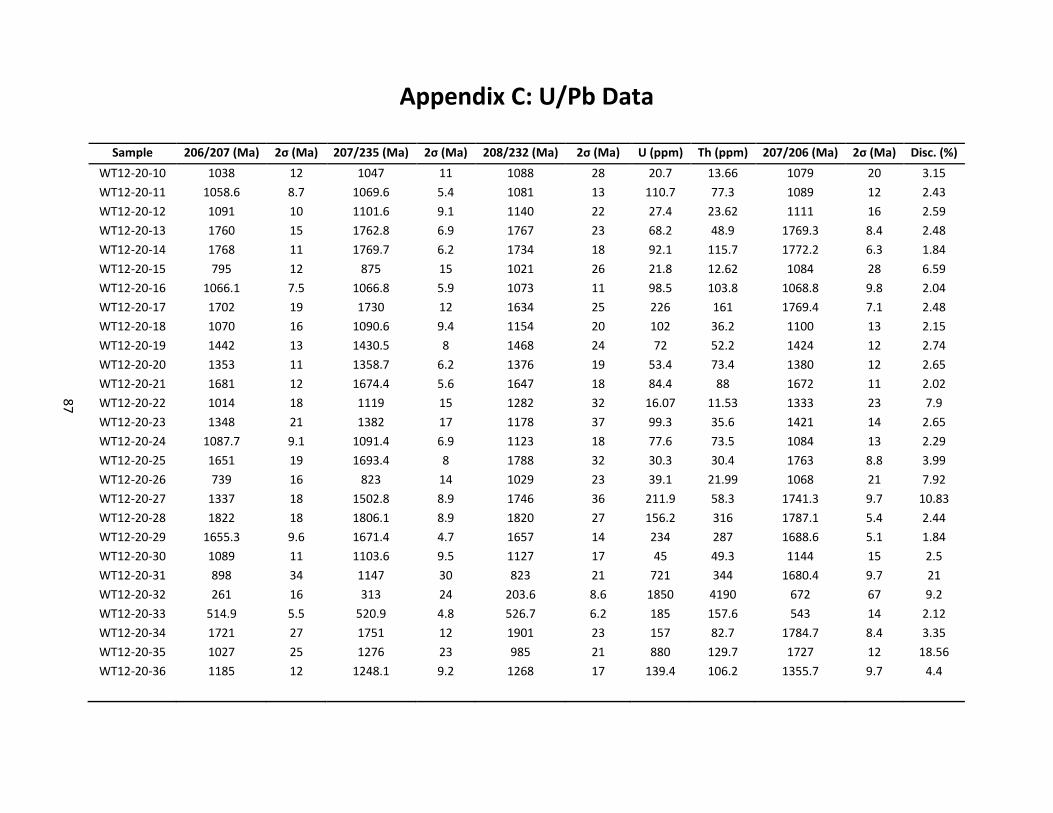
Appendix C: U/Pb Data
87
Sample 206/207 (Ma) 2σ (Ma) 207/235 (Ma) 2σ (Ma) 208/232 (Ma) 2σ (Ma) U (ppm) Th (ppm) 207/206 (Ma) 2σ (Ma) Disc. (%)
WT12-20-10 1038 12 1047 11 1088 28 20.7 13.66 1079 20 3.15
WT12-20-11 1058.6 8.7 1069.6 5.4 1081 13 110.7 77.3 1089 12 2.43
WT12-20-12 1091 10 1101.6 9.1 1140 22 27.4 23.62 1111 16 2.59
WT12-20-13 1760 15 1762.8 6.9 1767 23 68.2 48.9 1769.3 8.4 2.48
WT12-20-14 1768 11 1769.7 6.2 1734 18 92.1 115.7 1772.2 6.3 1.84
WT12-20-15 795 12 875 15 1021 26 21.8 12.62 1084 28 6.59
WT12-20-16 1066.1 7.5 1066.8 5.9 1073 11 98.5 103.8 1068.8 9.8 2.04
WT12-20-17 1702 19 1730 12 1634 25 226 161 1769.4 7.1 2.48
WT12-20-18 1070 16 1090.6 9.4 1154 20 102 36.2 1100 13 2.15
WT12-20-19 1442 13 1430.5 8 1468 24 72 52.2 1424 12 2.74
WT12-20-20 1353 11 1358.7 6.2 1376 19 53.4 73.4 1380 12 2.65
WT12-20-21 1681 12 1674.4 5.6 1647 18 84.4 88 1672 11 2.02
WT12-20-22 1014 18 1119 15 1282 32 16.07 11.53 1333 23 7.9
WT12-20-23 1348 21 1382 17 1178 37 99.3 35.6 1421 14 2.65
WT12-20-24 1087.7 9.1 1091.4 6.9 1123 18 77.6 73.5 1084 13 2.29
WT12-20-25 1651 19 1693.4 8 1788 32 30.3 30.4 1763 8.8 3.99
WT12-20-26 739 16 823 14 1029 23 39.1 21.99 1068 21 7.92
WT12-20-27 1337 18 1502.8 8.9 1746 36 211.9 58.3 1741.3 9.7 10.83
WT12-20-28 1822 18 1806.1 8.9 1820 27 156.2 316 1787.1 5.4 2.44
WT12-20-29 1655.3 9.6 1671.4 4.7 1657 14 234 287 1688.6 5.1 1.84
WT12-20-30 1089 11 1103.6 9.5 1127 17 45 49.3 1144 15 2.5
WT12-20-31 898 34 1147 30 823 21 721 344 1680.4 9.7 21
WT12-20-32 261 16 313 24 203.6 8.6 1850 4190 672 67 9.2
WT12-20-33 514.9 5.5 520.9 4.8 526.7 6.2 185 157.6 543 14 2.12
WT12-20-34 1721 27 1751 12 1901 23 157 82.7 1784.7 8.4 3.35
WT12-20-35 1027 25 1276 23 985 21 880 129.7 1727 12 18.56
WT12-20-36 1185 12 1248.1 9.2 1268 17 139.4 106.2 1355.7 9.7 4.4
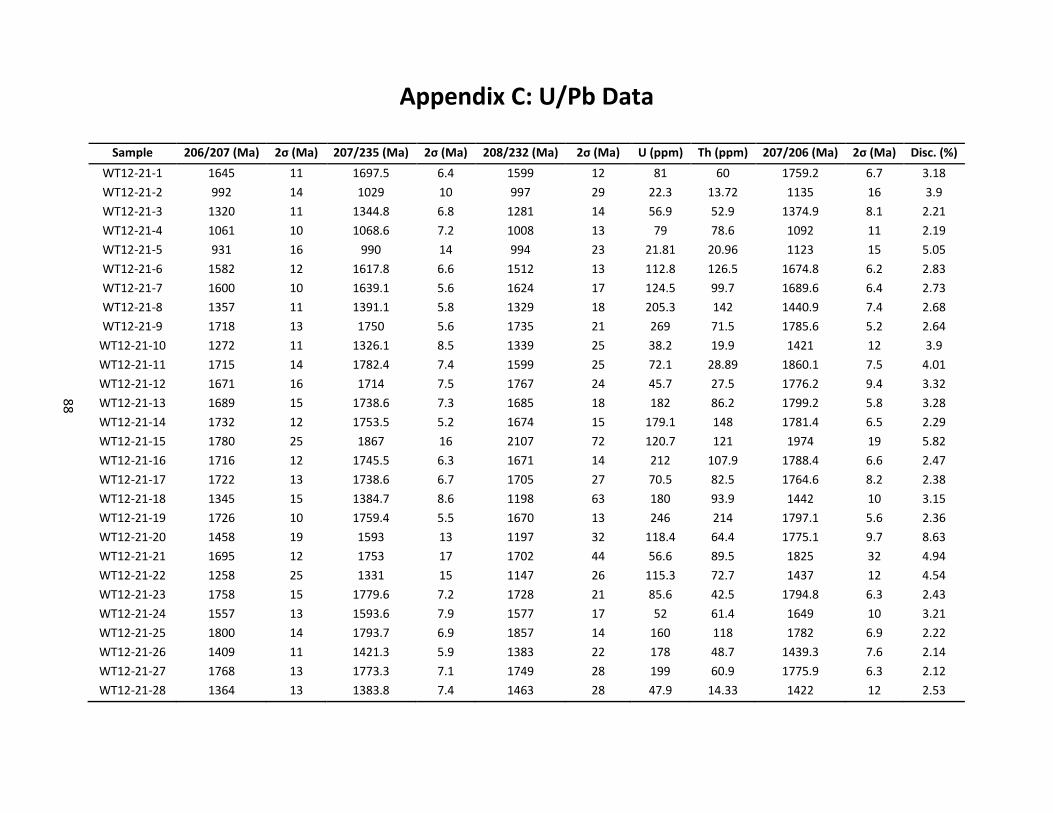
Appendix C: U/Pb Data
88
Sample 206/207 (Ma) 2σ (Ma) 207/235 (Ma) 2σ (Ma) 208/232 (Ma) 2σ (Ma) U (ppm) Th (ppm) 207/206 (Ma) 2σ (Ma) Disc. (%)
WT12-21-1 1645 11 1697.5 6.4 1599 12 81 60 1759.2 6.7 3.18
WT12-21-2 992 14 1029 10 997 29 22.3 13.72 1135 16 3.9
WT12-21-3 1320 11 1344.8 6.8 1281 14 56.9 52.9 1374.9 8.1 2.21
WT12-21-4 1061 10 1068.6 7.2 1008 13 79 78.6 1092 11 2.19
WT12-21-5 931 16 990 14 994 23 21.81 20.96 1123 15 5.05
WT12-21-6 1582 12 1617.8 6.6 1512 13 112.8 126.5 1674.8 6.2 2.83
WT12-21-7 1600 10 1639.1 5.6 1624 17 124.5 99.7 1689.6 6.4 2.73
WT12-21-8 1357 11 1391.1 5.8 1329 18 205.3 142 1440.9 7.4 2.68
WT12-21-9 1718 13 1750 5.6 1735 21 269 71.5 1785.6 5.2 2.64
WT12-21-10 1272 11 1326.1 8.5 1339 25 38.2 19.9 1421 12 3.9
WT12-21-11 1715 14 1782.4 7.4 1599 25 72.1 28.89 1860.1 7.5 4.01
WT12-21-12 1671 16 1714 7.5 1767 24 45.7 27.5 1776.2 9.4 3.32
WT12-21-13 1689 15 1738.6 7.3 1685 18 182 86.2 1799.2 5.8 3.28
WT12-21-14 1732 12 1753.5 5.2 1674 15 179.1 148 1781.4 6.5 2.29
WT12-21-15 1780 25 1867 16 2107 72 120.7 121 1974 19 5.82
WT12-21-16 1716 12 1745.5 6.3 1671 14 212 107.9 1788.4 6.6 2.47
WT12-21-17 1722 13 1738.6 6.7 1705 27 70.5 82.5 1764.6 8.2 2.38
WT12-21-18 1345 15 1384.7 8.6 1198 63 180 93.9 1442 10 3.15
WT12-21-19 1726 10 1759.4 5.5 1670 13 246 214 1797.1 5.6 2.36
WT12-21-20 1458 19 1593 13 1197 32 118.4 64.4 1775.1 9.7 8.63
WT12-21-21 1695 12 1753 17 1702 44 56.6 89.5 1825 32 4.94
WT12-21-22 1258 25 1331 15 1147 26 115.3 72.7 1437 12 4.54
WT12-21-23 1758 15 1779.6 7.2 1728 21 85.6 42.5 1794.8 6.3 2.43
WT12-21-24 1557 13 1593.6 7.9 1577 17 52 61.4 1649 10 3.21
WT12-21-25 1800 14 1793.7 6.9 1857 14 160 118 1782 6.9 2.22
WT12-21-26 1409 11 1421.3 5.9 1383 22 178 48.7 1439.3 7.6 2.14
WT12-21-27 1768 13 1773.3 7.1 1749 28 199 60.9 1775.9 6.3 2.12
WT12-21-28 1364 13 1383.8 7.4 1463 28 47.9 14.33 1422 12 2.53
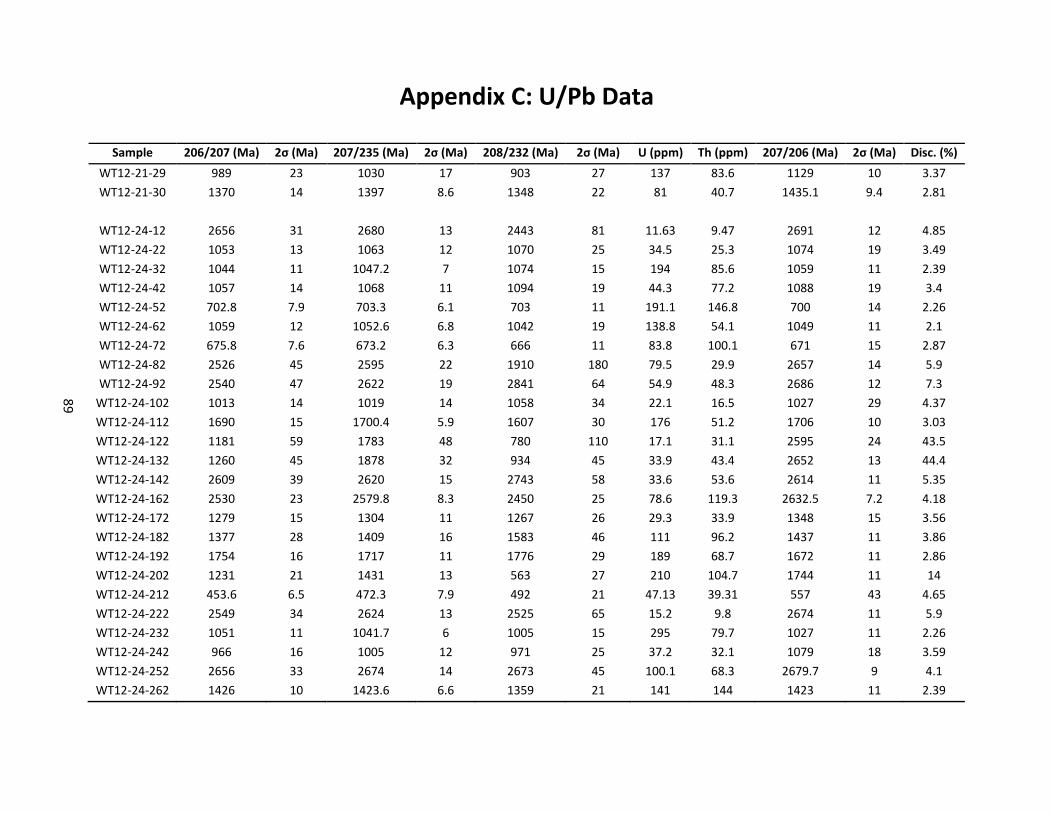
Appendix C: U/Pb Data
89
Sample 206/207 (Ma) 2σ (Ma) 207/235 (Ma) 2σ (Ma) 208/232 (Ma) 2σ (Ma) U (ppm) Th (ppm) 207/206 (Ma) 2σ (Ma) Disc. (%)
WT12-21-29 989 23 1030 17 903 27 137 83.6 1129 10 3.37
WT12-21-30 1370 14 1397 8.6 1348 22 81 40.7 1435.1 9.4 2.81
WT12-24-12 2656 31 2680 13 2443 81 11.63 9.47 2691 12 4.85
WT12-24-22 1053 13 1063 12 1070 25 34.5 25.3 1074 19 3.49
WT12-24-32 1044 11 1047.2 7 1074 15 194 85.6 1059 11 2.39
WT12-24-42 1057 14 1068 11 1094 19 44.3 77.2 1088 19 3.4
WT12-24-52 702.8 7.9 703.3 6.1 703 11 191.1 146.8 700 14 2.26
WT12-24-62 1059 12 1052.6 6.8 1042 19 138.8 54.1 1049 11 2.1
WT12-24-72 675.8 7.6 673.2 6.3 666 11 83.8 100.1 671 15 2.87
WT12-24-82 2526 45 2595 22 1910 180 79.5 29.9 2657 14 5.9
WT12-24-92 2540 47 2622 19 2841 64 54.9 48.3 2686 12 7.3
WT12-24-102 1013 14 1019 14 1058 34 22.1 16.5 1027 29 4.37
WT12-24-112 1690 15 1700.4 5.9 1607 30 176 51.2 1706 10 3.03
WT12-24-122 1181 59 1783 48 780 110 17.1 31.1 2595 24 43.5
WT12-24-132 1260 45 1878 32 934 45 33.9 43.4 2652 13 44.4
WT12-24-142 2609 39 2620 15 2743 58 33.6 53.6 2614 11 5.35
WT12-24-162 2530 23 2579.8 8.3 2450 25 78.6 119.3 2632.5 7.2 4.18
WT12-24-172 1279 15 1304 11 1267 26 29.3 33.9 1348 15 3.56
WT12-24-182 1377 28 1409 16 1583 46 111 96.2 1437 11 3.86
WT12-24-192 1754 16 1717 11 1776 29 189 68.7 1672 11 2.86
WT12-24-202 1231 21 1431 13 563 27 210 104.7 1744 11 14
WT12-24-212 453.6 6.5 472.3 7.9 492 21 47.13 39.31 557 43 4.65
WT12-24-222 2549 34 2624 13 2525 65 15.2 9.8 2674 11 5.9
WT12-24-232 1051 11 1041.7 6 1005 15 295 79.7 1027 11 2.26
WT12-24-242 966 16 1005 12 971 25 37.2 32.1 1079 18 3.59
WT12-24-252 2656 33 2674 14 2673 45 100.1 68.3 2679.7 9 4.1
WT12-24-262 1426 10 1423.6 6.6 1359 21 141 144 1423 11 2.39
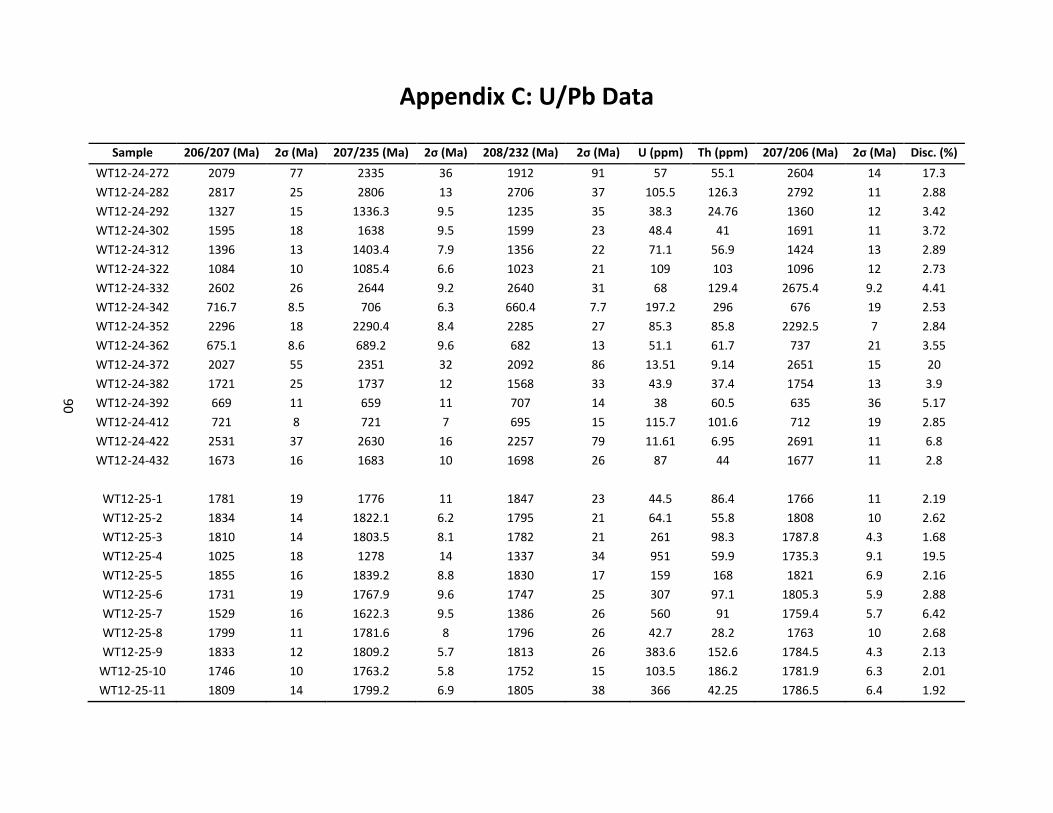
Appendix C: U/Pb Data
90
Sample 206/207 (Ma) 2σ (Ma) 207/235 (Ma) 2σ (Ma) 208/232 (Ma) 2σ (Ma) U (ppm) Th (ppm) 207/206 (Ma) 2σ (Ma) Disc. (%)
WT12-24-272 2079 77 2335 36 1912 91 57 55.1 2604 14 17.3
WT12-24-282 2817 25 2806 13 2706 37 105.5 126.3 2792 11 2.88
WT12-24-292 1327 15 1336.3 9.5 1235 35 38.3 24.76 1360 12 3.42
WT12-24-302 1595 18 1638 9.5 1599 23 48.4 41 1691 11 3.72
WT12-24-312 1396 13 1403.4 7.9 1356 22 71.1 56.9 1424 13 2.89
WT12-24-322 1084 10 1085.4 6.6 1023 21 109 103 1096 12 2.73
WT12-24-332 2602 26 2644 9.2 2640 31 68 129.4 2675.4 9.2 4.41
WT12-24-342 716.7 8.5 706 6.3 660.4 7.7 197.2 296 676 19 2.53
WT12-24-352 2296 18 2290.4 8.4 2285 27 85.3 85.8 2292.5 7 2.84
WT12-24-362 675.1 8.6 689.2 9.6 682 13 51.1 61.7 737 21 3.55
WT12-24-372 2027 55 2351 32 2092 86 13.51 9.14 2651 15 20
WT12-24-382 1721 25 1737 12 1568 33 43.9 37.4 1754 13 3.9
WT12-24-392 669 11 659 11 707 14 38 60.5 635 36 5.17
WT12-24-412 721 8 721 7 695 15 115.7 101.6 712 19 2.85
WT12-24-422 2531 37 2630 16 2257 79 11.61 6.95 2691 11 6.8
WT12-24-432 1673 16 1683 10 1698 26 87 44 1677 11 2.8
WT12-25-1 1781 19 1776 11 1847 23 44.5 86.4 1766 11 2.19
WT12-25-2 1834 14 1822.1 6.2 1795 21 64.1 55.8 1808 10 2.62
WT12-25-3 1810 14 1803.5 8.1 1782 21 261 98.3 1787.8 4.3 1.68
WT12-25-4 1025 18 1278 14 1337 34 951 59.9 1735.3 9.1 19.5
WT12-25-5 1855 16 1839.2 8.8 1830 17 159 168 1821 6.9 2.16
WT12-25-6 1731 19 1767.9 9.6 1747 25 307 97.1 1805.3 5.9 2.88
WT12-25-7 1529 16 1622.3 9.5 1386 26 560 91 1759.4 5.7 6.42
WT12-25-8 1799 11 1781.6 8 1796 26 42.7 28.2 1763 10 2.68
WT12-25-9 1833 12 1809.2 5.7 1813 26 383.6 152.6 1784.5 4.3 2.13
WT12-25-10 1746 10 1763.2 5.8 1752 15 103.5 186.2 1781.9 6.3 2.01
WT12-25-11 1809 14 1799.2 6.9 1805 38 366 42.25 1786.5 6.4 1.92

Appendix C: U/Pb Data
91
Sample 206/207 (Ma) 2σ (Ma) 207/235 (Ma) 2σ (Ma) 208/232 (Ma) 2σ (Ma) U (ppm) Th (ppm) 207/206 (Ma) 2σ (Ma) Disc. (%)
WT12-25-12 1061.8 6.7 1056.6 4.9 1049 15 225 121.7 1044 9.8 1.62
WT12-25-13 1463 10 1452 5.9 1464.5 9.8 162.8 324 1444.7 6.1 1.84
WT12-25-14 1747 10 1763.3 5.4 1774 21 274.6 120.4 1782.4 4.3 1.68
WT12-25-15 1067.7 8.8 1087.4 6.9 1101 14 82.2 79.3 1124 8.8 1.99
WT12-25-16 1786 10 1777.9 5.9 1765 18 160.1 204.2 1774.9 6 1.79
WT12-25-17 1623 15 1739.5 9.7 1742 21 239 276 1888.9 9.3 7.27
WT12-25-18 1655 15 1703.1 9.2 1747 24 61.9 55 1761 10 3.45
WT12-25-19 1427 38 1573 23 1709 35 781 169 1774.8 6.1 9.3
WT12-25-20 1530 23 1631 15 1513 33 498 119.3 1770.5 8.6 5.96
WT12-25-21 1719 12 1747.3 6.3 1701 17 281 322 1785.8 6 2.3
WT12-25-22 1610 11 1649.4 7 1688 18 68.5 47.5 1698.9 8.3 2.62
WT12-25-23 1771 11 1769.1 5.5 1735 16 76.2 162.5 1773.4 7.9 2.09
WT12-25-24 1135 29 1328 21 1475 35 392 376 1662.7 9.6 14.33
WT12-25-25 1844 15 1819 10 1845 35 41.3 61.3 1781 13 2.97
WT12-25-26 1741 17 1747.1 7 1701 28 43.5 44.8 1757 10 3.25
WT12-25-27 1676 12 1720.9 7.8 1704 18 69.9 72.5 1774.8 7.3 3.14
WT12-25-28 1789 13 1785.6 6.3 1767 15 94.6 207 1776 7.8 2.51
WT12-25-29 1839 14 1815.1 8.5 1830 25 352 74.6 1784.3 6.3 1.73
WT12-25-30 1763 14 1768.7 5.6 1684 21 137.1 75.5 1774.2 6.2 2.14
WT12-26-12 1263 16 1359 12 892 21 109 198 1500 17 5.79
WT12-26-22 1273 42 1352 28 1418 66 110.8 93.7 1469 20 6.5
WT12-26-52 1786 19 1807.5 8.4 1791 28 238 41.2 1822.2 9.3 2.97
WT12-26-62 2480 40 2598 18 2546 49 32.92 31.4 2679.1 7.8 6.7
WT12-26-72 1297 16 1346 11 1334 23 101 115 1425 14 3.54
WT12-26-92 1774 20 1779.4 9.9 1775 28 90.8 55.6 1771 12 2.8
WT12-26-102 818 21 893 17 902 32 38.2 29.5 1083 22 6.72
WT12-26-122 944 18 1021 20 1135 36 26.4 37.1 1166 36 6.4

Appendix C: U/Pb Data
92
Sample 206/207 (Ma) 2σ (Ma) 207/235 (Ma) 2σ (Ma) 208/232 (Ma) 2σ (Ma) U (ppm) Th (ppm) 207/206 (Ma) 2σ (Ma) Disc. (%)
WT12-26-132 1360 15 1384 10 1429 32 44 40.1 1418 14 2.8
WT12-26-152 925 22 1241 20 1367 46 16.8 15.72 1824 27 25.2
WT12-26-162 1359 21 1567 16 1586 30 24.8 23.8 1867 15 14.5
WT12-26-172 2349 25 2528 13 2414 36 37.2 36.3 2671 11 9.8
WT12-26-182 488.1 8.8 508 11 525 18 37.1 33.02 611 38 5.34
WT12-26-192 1625 25 1727 16 1722 50 96 44.1 1854.7 9.6 6.5
WT12-26-202 1669 25 1732 13 1789 37 33.8 33.7 1787 21 4.94
WT12-26-212 1638 15 1654.6 8.4 1562 22 142 93.1 1666.4 8.6 2.47
WT12-26-222 1284 19 1276 12 1267 24 33.2 46.2 1260 16 3.8
WT12-26-232 1837 62 2358 35 1007 69 71.5 90.5 2858 14 33.6
WT12-26-242 2212 28 2465 14 2396 39 32 41.2 2672 11 14
WT12-26-252 1746 22 1785 13 1798 34 35.3 23.9 1826 14 4.04
WT12-26-262 2667 33 2664 14 2754 70 94 51.1 2655 11 4.4
WT12-26-282 1156 16 1266.2 9 1310 19 52.3 50.4 1470 13 7.59
WT12-26-292 2013 82 2479 41 840 31 85.2 86.5 2902 15 29.1
WT12-26-312 2356 29 2542 11 2700 40 62.3 86.5 2696.2 9.1 10.2
WT12-26-322 804 16 912 16 1016 37 31.6 28.2 1191 25 9.9
WT12-26-332 1337 39 1369 23 1343 49 110 105 1371 13 4.13
WT12-26-342 1820 22 1798 10 1754 29 82.3 46.5 1765 11 3.2
WT12-26-352 1174 44 1816 35 1360 130 39.2 24.5 2627 15 45.9
WT12-26-362 1715 26 1730 14 1659 57 86.5 30 1747 11 2.88
WT12-26-372 1106 29 1321 23 539 21 34 47.1 1673 19 14.7
WT12-26-382 1057 18 1183 15 1113 40 36 23.92 1416 17 9.1
WT12-26-392 1433 26 1574 15 1752 30 127 120 1758 13 8.56
WT12-28-1 1066 15 1064.5 9.1 1073 15 63.3 53.9 1050 20 3.66
WT12-28-2 1424 18 1437.7 8.9 1384 12 141.9 152.8 1460 11 2.66
WT12-28-3 1012 13 1015.5 8.7 996 13 111 91.7 1042 13 2.45

Appendix C: U/Pb Data
93
Sample 206/207 (Ma) 2σ (Ma) 207/235 (Ma) 2σ (Ma) 208/232 (Ma) 2σ (Ma) U (ppm) Th (ppm) 207/206 (Ma) 2σ (Ma) Disc. (%)
WT12-28-4 1128.1 8.6 1138.1 5.1 1101.9 9.6 121.8 153.6 1163.4 8 1.88
WT12-28-5 1017 17 1032 11 1046 14 118.1 73.9 1061 15 2.95
WT12-28-6 1052 16 1053 11 1029 17 50.2 50 1062 22 3.62
WT12-28-7 1078 7 1078.4 5.8 1066 14 90.2 63.9 1083 11 1.96
WT12-28-8 1091.9 8.1 1092.2 6.8 1062 13 75.3 57.4 1104 11 2.09
WT12-28-9 1044.1 9.2 1055.8 5.7 1049 11 135.2 113.1 1079.6 9.1 1.99
WT12-28-10 1306 9.7 1308.2 7.1 1293 14 79.3 73.9 1325.6 8 1.93
WT12-28-11 1092.5 6.2 1087.8 5.3 1053 18 142 77.6 1088.6 7.6 1.47
WT12-28-12 1086 12 1083.9 8.3 1139 20 176 40.6 1089 11 2.21
WT12-28-13 1034.5 7.7 1033.1 5.7 1000.9 9.8 137.4 110.9 1044.6 8.2 1.81
WT12-28-14 1109.8 9.6 1110.6 6.1 1094 16 87.8 73.4 1127 11 2.2
WT12-28-15 1002 11 1005.6 6.4 1040 10 269 119 1022.1 7.7 1.98
WT12-28-16 1111 10 1102.1 6.4 1092 16 95.2 101 1094 13 2.69
WT12-28-17 1082.7 8.5 1078.2 8 1102 12 78.9 83.3 1074 11 1.95
WT12-28-18 1092 12 1096.9 8.4 1146 23 28.9 22.23 1128 17 3.32
WT12-28-19 1351 14 1356.2 8.7 1411 15 77 115 1370 11 2.44
WT12-28-20 1020.3 9.2 1022.8 7 1002 22 41 27.9 1021 16 2.9
WT12-28-21 2490 21 2504 8.1 2492 20 90.8 105.1 2523.5 7.5 3.27
WT12-28-22 1078 14 1073 10 1094 20 43.3 41.6 1075 16 3.05
WT12-28-23 1656 18 1663 11 1757 30 94.8 67.4 1667.4 9.2 2.16
WT12-28-24 1243 11 1274.3 7.6 1324 26 54.1 33.03 1329 11 2.8
WT12-28-25 1057 13 1068 14 1062 21 14.28 16.72 1087 28 4.7
WT12-28-26 1642 15 1653.6 7 1620 19 86 58.6 1675.7 9.6 2.64
WT12-28-27 1448 14 1453 10 1471 19 50 52.5 1459 13 2.39
WT12-28-28 992 16 1084 12 703 15 57.2 50 1280 14 6.59
WT12-28-29 1057 11 1065 7.4 1068 20 47 31.64 1089 13 2.55
WT12-28-30 1171.9 9.3 1175.4 5.4 1158 10 178 179.8 1192.1 6.4 1.72
WT12-28-31 1003 10 1002.4 7.1 1015.5 9.8 85.3 145.5 1008 14 2.78

Appendix C: U/Pb Data
94
Sample 206/207 (Ma) 2σ (Ma) 207/235 (Ma) 2σ (Ma) 208/232 (Ma) 2σ (Ma) U (ppm) Th (ppm) 207/206 (Ma) 2σ (Ma) Disc. (%)
WT12-28-32 1071 13 1069.4 7.7 1100 15 113 75.9 1088 11 2.43
WT12-28-33 947 27 1129 23 1336 30 82.8 113.4 1495 56 14.5
WT12-28-34 1354 14 1360 7.7 1378 14 167 153 1369.3 8.5 2.39
WT12-28-35 1346.3 9.3 1343.9 6.2 1360 29 112 74 1347.6 9.3 2.3
WT12-28-36 1087 10 1082.8 6.5 1086 16 98.9 60.7 1086 13 2.42
WT12-28-37 1503 11 1489.6 6.2 1492 13 250 272 1475.4 6 1.67
WT12-28-38 1228.8 9.4 1224.3 6.8 1267 22 78.7 31.9 1216.7 9.5 2.11
WT12-28-39 1215 12 1227.8 7.7 1209 24 93.3 53.6 1271 11 2.43
WT12-28-40 1190 13 1197.9 9.8 1194 15 296 161 1229 11 2.28
WT12-28-41 1008 10 1012.7 5.9 1003 14 186 98 1028.2 9.5 2.06
WT12-29-12 1429 14 1441.3 7.2 1287 19 124.7 181.2 1455.7 8.3 2.37
WT12-29-22 1319 11 1313.8 7 1196 21 88.9 127 1308 10 2.32
WT12-29-32 1029.8 7.9 1027 5.2 953 17 111.8 36.42 1030 11 1.94
WT12-29-42 1361 35 1354 23 1247 65 29 55.1 1327 16 4.42
WT12-29-52 1149 11 1155.5 7.4 1115 19 62.8 43.3 1179 11 2.51
WT12-29-62 1018 8.9 1019.3 5 960.4 9.6 177 228 1029.3 9.8 1.9
WT12-29-72 1347 13 1367.4 8.1 1244 16 77.6 76.9 1401 13 3.05
WT12-29-82 1353 24 1354 15 1249 25 119 100 1360 13 3.35
WT12-29-92 972.1 7.9 1030.2 7.8 1026 14 125.6 136 1114 12 4.46
WT12-29-102 1379 12 1371.9 6.4 1299 14 152 166 1364.5 8.6 2.51
WT12-29-112 1067 12 1061 10 1006 18 59.8 61.6 1049 22 2.65
WT12-29-122 1729 15 1694.9 8.3 1651 21 202 278 1657.6 8.7 2.66
WT12-29-132 1371 12 1373.4 7.3 1290 16 97.9 107.9 1375.3 9.7 2.32
WT12-29-142 1448 12 1471.8 6 1387 19 134 123.9 1496.9 9.2 2.53
WT12-29-152 1667 13 1659.5 5.6 1530 16 271 487 1649.1 8.1 2.09
WT12-29-162 1753 10 1761.2 6.7 1656 22 111.1 91 1780 7.8 2
WT12-29-172 938.4 9.8 944.6 8.9 968 19 126.2 64.6 971 17 2.7

Appendix C: U/Pb Data
95
Sample 206/207 (Ma) 2σ (Ma) 207/235 (Ma) 2σ (Ma) 208/232 (Ma) 2σ (Ma) U (ppm) Th (ppm) 207/206 (Ma) 2σ (Ma) Disc. (%)
WT12-29-182 1445 15 1457.4 8.5 1419 22 96.8 70.2 1474.5 9.8 2.52
WT12-29-202 1071 7.7 1077.1 5.1 1001 13 154 168 1085 10 1.87
WT12-29-212 1155 10 1156 7.1 1107 15 95.9 59.2 1163 14 2.36
WT12-29-222 1095.8 9.4 1088.8 7.4 1080 19 179.5 124.1 1069 10 2.02
WT12-29-232 1485 13 1475.8 9 1418 22 147.9 107.6 1474.3 8.5 1.8
WT12-29-242 962 18 999 19 947 22 15.78 27.7 1074 33 5.44
WT12-29-252 1155.6 8.6 1159.1 4.6 1122 13 165 116.5 1162.2 8.3 1.86
WT12-29-262 1147.8 8.7 1152 6 1075 17 87.9 43.4 1155 10 2.14
WT12-29-272 1035 31 1291 26 785 36 204.6 140.3 1767 12 19.71
WT12-29-282 1349 14 1347.8 7.5 1289 23 46.8 53.9 1357 12 3.19
WT12-29-292 1041 11 1041.3 7.8 1003 21 48.3 35.8 1040 18 3.05
WT12-29-302 2541 33 2624 13 2349 49 51.8 48 2684.5 5.9 5.12
WT12-29-322 1056.2 7.9 1067.2 6.9 1016 14 62.8 68.2 1104 14 2.61
WT12-29-342 1349.7 9.4 1351.3 5.3 1265 14 151.9 177.2 1354.1 9.9 2.06
WT12-29-352 1107 13 1097.5 7.4 1052 17 85.5 78.6 1091 11 2.59
WT12-29-362 1274.6 9.6 1275.6 5.7 1165 13 203 152.7 1273.8 7.2 1.81
WT12-29-372 1175 14 1174.7 7.8 1129 16 109.9 94 1171 12 2.35
WT12-29-382 1066 10 1083.7 8.4 1065 18 75.3 57.7 1126 15 2.64
WT12-29-392 2533 20 2538.2 9 2509 27 69.3 125.3 2543.8 6.7 2.71
WT12-29-402 1458 12 1466.5 6.5 1373 21 114 96 1482.4 8.7 2.3
WT12-30-12 1669 19 1711 11 1682 20 92 70.5 1769 11 3.56
WT12-30-22 1606 24 1687 14 1661 45 208 93.2 1789 7.4 4.96
WT12-30-32 1655 21 1712 11 1434 31 177 61.6 1787.9 7.2 3.98
WT12-30-42 2547 32 2626 16 2383 59 97.8 62.5 2702.1 5.7 5.11
WT12-30-52 1036.7 8.3 1033.6 5.4 1006 14 235 110.1 1034 11 1.92
WT12-30-62 1406 14 1413.5 8.7 1341 34 33.6 16.91 1432 15 3.08
WT12-30-72 1722 25 1765 12 975 58 290 179.9 1817.6 8.9 3.72

Appendix C: U/Pb Data
96
Sample 206/207 (Ma) 2σ (Ma) 207/235 (Ma) 2σ (Ma) 208/232 (Ma) 2σ (Ma) U (ppm) Th (ppm) 207/206 (Ma) 2σ (Ma) Disc. (%)
WT12-30-82 1455 14 1465 7.9 1471 18 195 200 1483 7.2 2.24
WT12-30-92 1270 19 1446 13 1155 22 529 48.8 1715.6 9 12.23
WT12-30-102 1720 14 1749.6 7.4 1612 23 103.1 54 1793.9 9.5 2.89
WT12-30-112 1776 13 1782.4 6.2 1675 27 275.1 63.6 1794.2 6.3 2.18
WT12-30-132 1454 12 1457.7 7.2 1346 23 130.5 103.3 1466.8 9 2.31
WT12-30-142 1800 32 1803 16 895 63 370 52 1815 12 3.68
WT12-30-152 1015 16 1021.6 9.6 1210 110 257 5.8 1048 17 2.34
WT12-30-152 1214 16 1214.4 8 1127 23 76.5 51.1 1209 14 2.53
WT12-30-162 2621 19 2642.2 7.6 2377 38 252 500 2658.3 6 2.29
WT12-30-172 1799 28 1795 12 1754 31 373 186.2 1795.2 7.6 3.33
WT12-30-182 1369 30 1545 19 1249 61 59.8 74 1790 11 11.4
WT12-30-192 2535 19 2580 10 2343 24 178.3 206.2 2614.9 7 3.18
WT12-30-202 1769 27 1791 15 1587 42 228 150 1815.4 9.4 2.94
WT12-30-212 1728 23 1742 12 1538 44 364 145.2 1761 6.3 2.41
WT12-30-222 1685 36 1773 19 1461 76 138.4 73.4 1865 12 5
WT12-30-232 1160 28 1151 17 855 80 113.6 101.7 1144 21 3.24
WT12-30-242 1500 11 1470.3 7.6 1381 19 157.7 142.9 1432.7 7.6 2.3
WT12-30-252 1812 28 1805 11 1749 44 114.7 84.3 1801 16 2.83
WT12-30-262 1202 15 1190 12 1107 21 30.5 48.9 1193 16 3.62
WT12-30-272 707.4 9.5 704.2 6.6 656 11 63.2 98.7 699 23 3.16
WT12-30-282 2358 38 2554 18 2492 38 44.6 60.6 2704.6 7.6 10.6
WT12-30-302 1373 12 1368.3 7.6 1299 13 142.4 224.1 1364.4 8.7 2.08
WT12-30-312 2225 36 2485 20 2470 100 304 187.6 2710 14 15.2
WT12-30-322 1561 36 1679 15 749 54 585 217 1818 11 7.2
WT12-30-322 1785 38 2058 16 1201 37 223.9 174 2357 14 18.1
WT12-30-332 1764 22 1772 13 1624 36 257 144 1780.5 7.8 2.73
WT12-31-1 1018 19 1034.9 9.9 980 13 140 100.5 1063 21 4.06

Appendix C: U/Pb Data
97
Sample 206/207 (Ma) 2σ (Ma) 207/235 (Ma) 2σ (Ma) 208/232 (Ma) 2σ (Ma) U (ppm) Th (ppm) 207/206 (Ma) 2σ (Ma) Disc. (%)
WT12-31-2 1403 27 1436 15 1378 19 80.3 61.3 1482 23 4.89
WT12-31-3 993 11 1005.7 7.3 980 11 246 119 1041 8.9 2.07
WT12-31-4 1722 27 1733 13 1641 14 116.5 92.6 1756 18 4.15
WT12-31-5 1032.9 8.5 1040.7 6.3 1013 13 92 74 1068 12 2.16
WT12-31-6 1092.2 8.5 1089.6 5.9 1044 14 129.6 103.4 1088.8 9.7 1.61
WT12-31-7 1009.2 7 1016.3 5 986 15 139.9 55.6 1041.6 7.1 1.55
WT12-31-8 1070.2 8.8 1064.9 5.7 1054.2 9.8 294 192.3 1065.4 6.8 1.49
WT12-31-9 2418 34 2612 15 2273 82 97.7 129 2780 17 11
WT12-31-10 1747 12 1753.1 4.8 1669 14 249 269.1 1764.2 4.3 1.9
WT12-31-11 1393 15 1384 10 1336 17 176 150 1381 13 2.24
WT12-31-12 1054.8 9 1063 7 1094 17 53 33.8 1085 14 2.42
WT12-31-13 1093 12 1087.2 7.4 1097 14 109.4 65.6 1088.8 9.5 2.32
WT12-31-14 1072 16 1086 11 1080 26 67.2 44.3 1125 13 3.22
WT12-31-15 1023.4 7.6 1025.6 5.4 1041 17 122.3 56.6 1020.2 8.1 1.78
WT12-31-16 1014 12 1036.5 9.4 1098 26 85.1 52 1094 16 2.77
WT12-31-17 1347 11 1351.5 6.6 1379 13 96.1 64 1361.2 8.5 2.25
WT12-31-18 1400 12 1385.9 7.4 1347 24 98.3 74.5 1367.7 8.2 2.3
WT12-31-19 1086.7 7.6 1085.2 6.5 1070 15 106.7 55.1 1076 11 2
WT12-31-20 1096 10 1096.3 6.2 1089 10 283 140.9 1103.3 7.1 1.73
WT12-31-21 1107 14 1108.1 9.6 1155 23 61.2 37.42 1111 17 2.68
WT12-31-22 1038.4 9.6 1040.1 6.7 1085 14 98 53 1044.2 9.3 2.01
WT12-31-23 1351 11 1342.5 6 1352 15 74.3 88.4 1344 10 2.35
WT12-31-24 1399 14 1399.2 8.2 1402 19 74.3 95.5 1402 11 2.49
WT12-31-25 1034 9.8 1038.9 7 828 30 56 30.6 1055 11 2.37
WT12-31-26 1207 11 1209.9 6.2 1220 12 170 137.8 1215 8 1.94
WT12-31-27 2676 27 2676 11 2817 40 44.6 31.3 2678 7.6 3.8
WT12-31-28 1104 11 1108.8 6.7 1094 12 111.8 108.5 1121 10 2.18
WT12-31-29 1187 12 1202.1 8.9 1198 20 23.61 29.95 1234 16 2.95

Appendix C: U/Pb Data
98
Sample 206/207 (Ma) 2σ (Ma) 207/235 (Ma) 2σ (Ma) 208/232 (Ma) 2σ (Ma) U (ppm) Th (ppm) 207/206 (Ma) 2σ (Ma) Disc. (%)
WT12-31-30 1256.1 9.9 1252.3 6.9 1269 24 97 41.72 1246 11 2.25
WT12-31-31 1503 14 1530.2 9 1617 14 172.1 193.2 1563.2 9.9 2.59
WT12-31-32 1048.6 8.3 1040.8 7 1029 17 72.1 48.8 1030 14 2.15
WT12-31-33 1216 13 1198.8 8.3 1232 12 95 151 1174 12 2.63
WT12-31-34 1296 14 1326 10 1160 52 297 391 1381.6 7.1 2.39
WT12-31-35 1077.8 8.7 1087.3 7 1034 12 166 192 1108.6 9.8 1.92
WT12-31-36 1769 23 1791 11 1454 84 110.5 75 1815.2 8 2.79
WT12-31-37 1190.4 9.1 1183.5 4.8 1182 10 97.1 143.5 1178.3 9.8 1.66
WT12-31-38 1338 11 1343.7 7.7 1349 18 88 61 1342 11 2.22
WT12-32-1 1074 12 1071.3 9.4 1069 28 73 43.9 1055 13 3.02
WT12-32-2 1514 12 1492.3 5.9 1466 18 112.6 102.4 1468 10 2.55
WT12-32-3 1028 11 1023.6 8.3 1020 22 38.9 25.98 1001 17 3.17
WT12-32-4 1097.3 6.7 1099 4.2 1070 10 287 174.3 1093.4 7.4 1.56
WT12-32-5 1000 13 991 13 987 26 23.2 16.9 993 22 4.07
WT12-32-6 1105 11 1111 10 1121 21 44.8 53.9 1092 16 2.98
WT12-32-7 1400 16 1373.4 7.2 1399 30 49.27 27.32 1327 13 3.58
WT12-32-8 1349.7 9.3 1340.9 5.4 1359 12 198.4 253.4 1326 7.4 1.66
WT12-32-9 1137 12 1147.1 9.9 1167 24 29.5 34.66 1169 16 3.27
WT12-32-10 1129 14 1118.9 8.3 1086 24 114.3 63.7 1082 15 2.01
WT12-32-11 1393 12 1383.5 5.5 1376 12 150.3 182.7 1366.3 7.8 2.15
WT12-32-12 1323 17 1335 11 1067 35 102 110.1 1361 11 2.66
WT12-32-13 1041 14 1075 15 1009 26 19.7 17 1133 28 4.46
WT12-32-14 1444 15 1448.7 9.1 1426 21 25.2 46.8 1444 15 3.36
WT12-32-15 1360 12 1402.4 7.6 1241 17 88.3 90.2 1462 10 3.27
WT12-32-16 1087.8 7.3 1092.4 5.7 1087 14 148 106 1101 10 1.79
WT12-32-17 1100.1 9.3 1094 10 1096 19 33.6 29.68 1078 20 3.16
WT12-32-18 2605 32 2651 13 2382 49 51.2 55.4 2678.2 9.3 4.8

Appendix C: U/Pb Data
99
Sample 206/207 (Ma) 2σ (Ma) 207/235 (Ma) 2σ (Ma) 208/232 (Ma) 2σ (Ma) U (ppm) Th (ppm) 207/206 (Ma) 2σ (Ma) Disc. (%)
WT12-32-19 1456 13 1455.2 8.8 1435 25 52.2 53.3 1461 11 2.5
WT12-32-20 1438 11 1450.9 7 1423 18 72.2 56.3 1468 11 2.6
WT12-32-21 1075.9 8.9 1085.5 8.8 1082 19 67.3 29.4 1113 13 2.71
WT12-32-22 1038 18 1056 12 1001 17 118 90.4 1092 12 2.64
WT12-32-23 1433 15 1453 11 1457 24 32.7 28.8 1470 19 3.8
WT12-32-24 1471.8 9.9 1475.6 6.7 1458 20 67.7 84.5 1465 12 2.4
WT12-32-25 1094 11 1069.5 7.2 1034 16 137.4 76.6 1025 10 2.43
WT12-32-26 2701 21 2686.9 8 2665 36 49.3 64.7 2665.3 6.6 3.22
WT12-32-27 1072.5 9.9 1072.7 9.9 1049 21 43.7 42.5 1067 18 2.98
WT12-32-28 1258 12 1256.7 8.4 1220 16 49.2 44.5 1259 13 2.78
WT12-32-29 992 10 987.3 6.2 984 14 79.7 60.3 981 13 2.5
WT12-32-30 1096 14 1075 11 1077 23 34.5 20.98 1030 16 3.57
WT12-32-31 1067.2 9.6 1072.4 6.5 1038 13 84.2 71.4 1068 13 2.51
WT12-32-32 1059 9.6 1061.6 7.6 1037.5 9.5 66 116.4 1062 13 2.55
WT12-32-33 1093.1 8.5 1103.8 9.1 1089 17 54.9 52.7 1118 15 2.93
WT12-32-34 1170.1 9 1165.7 7 1146 21 58.8 39.6 1142 13 2.62
WT12-32-35 1344.1 9.2 1332.2 6.8 1330 18 61.8 79 1318 12 2.18
WT12-32-36 1059.9 7.3 1046.4 4.5 1058 11 250 153.5 1020.9 9.5 1.83
WT12-32-37 1321.2 8.7 1315.8 6.6 1306 13 66.4 73.6 1307.1 9.8 1.98
WT12-32-38 1443 11 1455.9 6 1376 17 96.2 120.2 1469 7.6 2.11
WT12-32-39 1186 11 1180 7.3 1130 15 62 55.9 1164 11 2.53
WT12-32-40 1143.3 7.2 1138.4 4.8 1102.9 9.2 221 292 1128.4 6.4 1.37
WT12-32-41 1335 12 1318.4 9.7 1332 21 52.4 47 1295 12 2.78
WT12-35-12 1085 11 1097.9 8.6 1067 12 147.3 151.6 1115 13 2.14
WT12-35-22 2426 28 2575 12 2695 33 32.1 67 2694 12 8.1
WT12-35-32 2586 28 2648 13 2415 47 49.4 69 2700.9 8.3 4.68
WT12-35-42 1490 17 1599 11 1562 36 128.4 121.9 1755 11 6.96

Appendix C: U/Pb Data
10
0
Sample 206/207 (Ma) 2σ (Ma) 207/235 (Ma) 2σ (Ma) 208/232 (Ma) 2σ (Ma) U (ppm) Th (ppm) 207/206 (Ma) 2σ (Ma) Disc. (%)
WT12-35-52 2694 27 2777 11 2779 49 29.1 25.9 2842.6 9.6 5.81
WT12-35-62 2673 25 2778 12 2821 49 31.9 18.81 2844.9 8.7 6
WT12-35-72 2545 32 2647 12 2437 60 18.6 15.9 2710 11 5.86
WT12-35-82 2606 23 2673 11 2414 50 43.7 21.4 2729 11 4.91
WT12-35-92 2145 25 2415 12 2588 33 40.3 62.6 2655 10 15.8
WT12-35-102 2433 36 2588 12 2758 53 55.9 35.9 2710 11 9
WT12-35-112 2532 24 2626.4 9.6 2680 50 110.4 28.14 2691.4 9.4 5.4
WT12-35-122 2198 97 2589 46 2920 230 29.4 26.4 2925 16 23.5
WT12-35-132 2088 40 2402 15 2352 32 39.8 130.1 2685 14 19.1
WT12-35-142 2576 35 2660 14 2642 34 30.8 57.4 2721.3 9.1 5.3
WT12-35-152 1766 23 1794 11 1855 30 44.1 123.4 1829 14 4.29
WT12-35-162 2616 25 2664 11 2809 31 59.4 81.1 2698 11 4.95
WT12-35-172 1544 33 1671 16 1682 43 30.6 15.77 1839 16 8.3
WT12-35-182 1781 22 1803 12 1757 26 74.1 71.2 1835 11 3.02
WT12-35-192 2642 26 2683.7 9.7 2681 27 76.8 165 2718 8.6 4.33
WT12-35-202 2627 23 2812.5 9.4 2673 37 68.9 38.6 2952.3 6.7 10.8
WT12-35-212 1637 44 2165 27 1240 51 131 205 2675 14 34.3
WT12-35-222 2391 22 2561.8 9.8 2545 30 51.1 88.6 2698.2 6.1 9.5
WT12-35-232 2788 23 2815.8 9.1 2904 42 107 38.3 2835 8 3.55
WT12-35-242 2443 32 2592 14 2476 47 34.8 44.6 2724 12 8.8
WT12-35-262 1856 21 1866.8 9.4 1673 40 73.5 66.1 1885 12 3.53
WT12-35-272 2654 28 2702 12 2760 50 69.4 95.4 2732.6 7.7 4.04
WT12-35-282 1600 22 1664 12 1696 41 20.29 15.64 1756 18 5.7
WT12-35-292 2514 39 2627 15 2446 61 21.9 16.41 2711 12 7.2
WT12-35-302 2621 23 2626.1 8.7 2622 29 121.4 81.9 2633.7 7.8 3.54
WT12-35-312 2722 20 2707 8.4 2744 29 78.1 153.3 2688 9.3 3.24
WT12-35-322 2519 27 2623 12 2763 36 82.5 121.8 2699 9.8 6.39
WT12-35-332 2697 37 2689 15 2784 46 55.6 170 2690.3 7.8 4.75

Appendix C: U/Pb Data
10
1
Sample 206/207 (Ma) 2σ (Ma) 207/235 (Ma) 2σ (Ma) 208/232 (Ma) 2σ (Ma) U (ppm) Th (ppm) 207/206 (Ma) 2σ (Ma) Disc. (%)
WT12-35-342 3334 34 3358 19 3290 110 40.7 17.77 3374 17 4.35
WT12-35-352 2699 33 2721 11 1790 140 28.7 64.8 2728 11 5.25
WT12-35-362 2680 23 2687 7.9 2718 26 100.4 123.8 2700.9 5.5 3.24
WT12-35-372 2533 34 2632 15 2746 44 66.2 65.3 2715.9 9.2 6.5
WT12-37-22 1717 36 1718 22 1270 100 567 24.4 1726 10 1.58
WT12-37-22 2263 48 2333 26 2481 48 107 119 2410 10 5.2
WT12-37-32 1309 17 1463.4 8.9 2590 120 294 12.81 1692 12 10.29
WT12-37-42 2368 26 2388.8 8.5 2323 30 127.1 156.6 2413.9 6.9 3.45
WT12-37-52 1879 37 2077 21 1973 55 63.1 47.1 2284 13 11.6
WT12-37-72 1103 30 1455 24 2136 89 88.4 28.6 2036 19 26.9
WT12-37-82 2390 21 2422.3 7.7 2335 25 257 358 2455.1 6.7 3.13
WT12-37-92 1812 35 1821 16 2482 83 346 35 1814 29 3.33
WT12-37-92 2186 26 2281 11 2396 41 89 76.3 2369 15 5.47
WT12-37-102 2163 40 2256 19 2537 68 51.3 39.4 2323 14 5.7
WT12-37-112 1862 47 2071 27 2259 43 146.9 127.2 2299 14 12.2
WT12-37-122 2434 33 2431 13 2576 49 83.2 109.3 2433 13 4.28
WT12-37-132 2382 28 2403.8 9.8 2338 23 132.1 200.4 2428 10 4.22
WT12-37-142 1953 29 2156 16 2021 29 86.7 95.8 2349.8 8 11.6
WT12-37-152 1448 44 1806 29 2027 72 34.6 26.1 2301 18 24.5
WT12-37-162 1878 51 2113 34 2448 47 107.7 93 2348 20 13
WT12-37-172 2240 22 2325 11 2311 29 57.9 62 2406 12 5.13
WT12-37-182 1599 31 1659 11 2030 110 587 23.9 1773 41 4.7
WT12-37-182 2388 25 2415 10 2399 40 91 114 2447.2 8.9 3.17
WT12-37-192 1580 28 1624 14 1790 110 444 24 1699 11 3.73
WT12-37-202 2361 25 2396.4 9.6 2036 40 73.6 81.2 2426.7 7.1 3.67
WT12-37-212 1828 32 2077 17 2139 58 81.2 49 2328 16 15.3
WT12-37-232 2364 24 2409.8 9.4 2362 25 232 288 2449 12 3.64
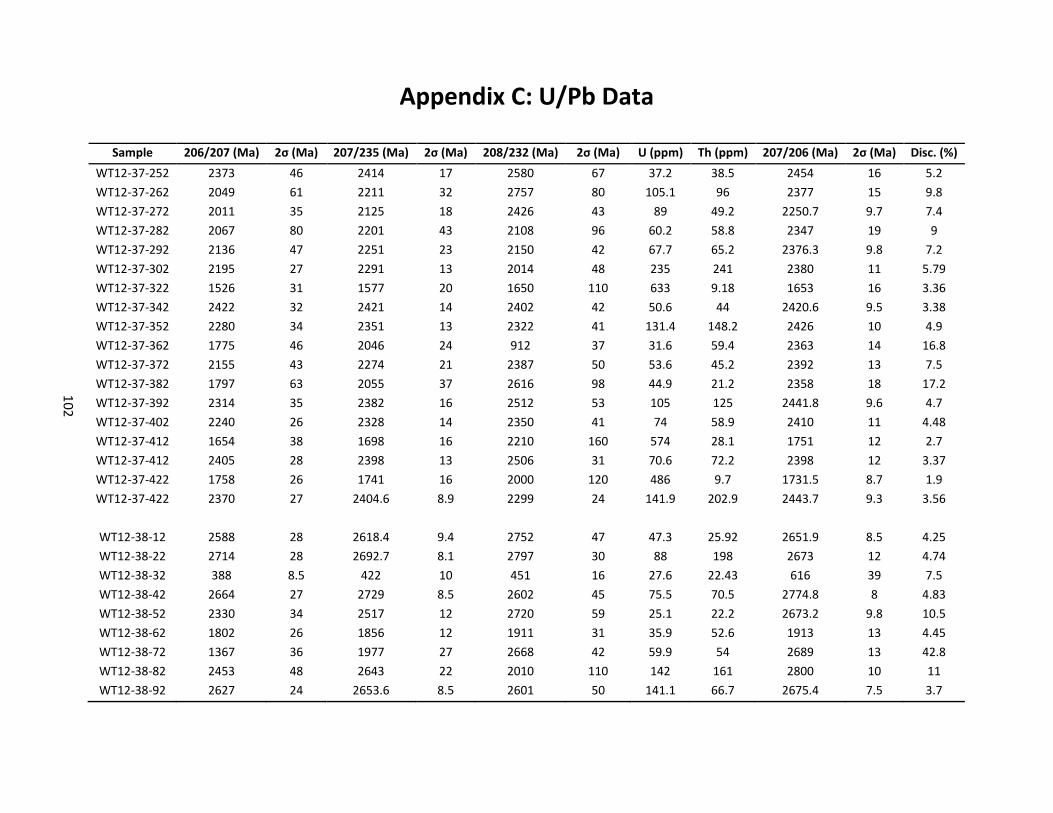
Appendix C: U/Pb Data
10
2
Sample 206/207 (Ma) 2σ (Ma) 207/235 (Ma) 2σ (Ma) 208/232 (Ma) 2σ (Ma) U (ppm) Th (ppm) 207/206 (Ma) 2σ (Ma) Disc. (%)
WT12-37-252 2373 46 2414 17 2580 67 37.2 38.5 2454 16 5.2
WT12-37-262 2049 61 2211 32 2757 80 105.1 96 2377 15 9.8
WT12-37-272 2011 35 2125 18 2426 43 89 49.2 2250.7 9.7 7.4
WT12-37-282 2067 80 2201 43 2108 96 60.2 58.8 2347 19 9
WT12-37-292 2136 47 2251 23 2150 42 67.7 65.2 2376.3 9.8 7.2
WT12-37-302 2195 27 2291 13 2014 48 235 241 2380 11 5.79
WT12-37-322 1526 31 1577 20 1650 110 633 9.18 1653 16 3.36
WT12-37-342 2422 32 2421 14 2402 42 50.6 44 2420.6 9.5 3.38
WT12-37-352 2280 34 2351 13 2322 41 131.4 148.2 2426 10 4.9
WT12-37-362 1775 46 2046 24 912 37 31.6 59.4 2363 14 16.8
WT12-37-372 2155 43 2274 21 2387 50 53.6 45.2 2392 13 7.5
WT12-37-382 1797 63 2055 37 2616 98 44.9 21.2 2358 18 17.2
WT12-37-392 2314 35 2382 16 2512 53 105 125 2441.8 9.6 4.7
WT12-37-402 2240 26 2328 14 2350 41 74 58.9 2410 11 4.48
WT12-37-412 1654 38 1698 16 2210 160 574 28.1 1751 12 2.7
WT12-37-412 2405 28 2398 13 2506 31 70.6 72.2 2398 12 3.37
WT12-37-422 1758 26 1741 16 2000 120 486 9.7 1731.5 8.7 1.9
WT12-37-422 2370 27 2404.6 8.9 2299 24 141.9 202.9 2443.7 9.3 3.56
WT12-38-12 2588 28 2618.4 9.4 2752 47 47.3 25.92 2651.9 8.5 4.25
WT12-38-22 2714 28 2692.7 8.1 2797 30 88 198 2673 12 4.74
WT12-38-32 388 8.5 422 10 451 16 27.6 22.43 616 39 7.5
WT12-38-42 2664 27 2729 8.5 2602 45 75.5 70.5 2774.8 8 4.83
WT12-38-52 2330 34 2517 12 2720 59 25.1 22.2 2673.2 9.8 10.5
WT12-38-62 1802 26 1856 12 1911 31 35.9 52.6 1913 13 4.45
WT12-38-72 1367 36 1977 27 2668 42 59.9 54 2689 13 42.8
WT12-38-82 2453 48 2643 22 2010 110 142 161 2800 10 11
WT12-38-92 2627 24 2653.6 8.5 2601 50 141.1 66.7 2675.4 7.5 3.7

Appendix C: U/Pb Data
10
3
Sample 206/207 (Ma) 2σ (Ma) 207/235 (Ma) 2σ (Ma) 208/232 (Ma) 2σ (Ma) U (ppm) Th (ppm) 207/206 (Ma) 2σ (Ma) Disc. (%)
WT12-38-102 2619 24 2720 11 2618 40 71.3 84.1 2804.5 8.4 6.16
WT12-38-112 2735 33 2722 10 3039 62 40.3 53 2717 12 4.58
WT12-38-122 2717 47 2711 15 2976 63 40.4 34.5 2703 14 7.2
WT12-38-132 1794 22 1813.3 9.6 2001 41 45.7 21.3 1833 13 3.79
WT12-38-142 2640 31 2684 10 2543 45 79.2 43.5 2717 9.9 5.25
WT12-38-152 2586 26 2649.6 8 2643 28 59.4 111.8 2701.1 8 5.21
WT12-38-162 1747 21 1787 11 1840 35 58.5 50.8 1829 14 4.17
WT12-38-172 2572 32 2654 12 2851 37 31.8 34.2 2713 12 6.1
WT12-38-182 2707 57 2737 23 2812 58 59.8 31 2764 11 6.4
WT12-38-192 1849 31 1831 12 1984 44 111.3 25.6 1827 15 3.93
WT12-38-202 2710 37 2703 14 2996 58 29.4 35.9 2710 9.4 5.14
WT12-38-212 2312 29 2529 13 2645 37 73.5 132.1 2720.3 8.6 12.8
WT12-38-222 2530 33 2588 11 2718 46 56.9 88.3 2647 10 5.6
WT12-38-232 2520 34 2626 11 2785 40 40.7 99.6 2700.9 9.9 6.2
WT12-38-242 2583 31 2656 11 2718 37 27.4 35.2 2718 15 6
WT12-38-252 1478 16 1474.6 8.7 1561 22 80.4 48.4 1476 12 3.07
WT12-38-262 2584 23 2673.8 9.5 2595 35 53.4 38.8 2744 9.9 5.38
WT12-38-272 1838 26 1838 13 1866 35 203 150 1850 12 3.48
WT12-38-282 2695 26 2708.7 9.9 2826 36 57.7 45.1 2728 11 4.48
WT12-38-292 2665 27 2664.5 9.6 2756 26 73.1 155.1 2658.6 8.7 4.42
WT12-38-302 2684 27 2690.8 9.4 2817 31 75.3 155 2699.6 8.1 3.98
WT12-38-312 2641 32 2678 12 2795 44 84.1 81.5 2706 11 5.37
WT12-38-322 2697 25 2710.4 8.9 2779 37 74.6 110.6 2729.7 8 3.97
WT12-40-1 1649 15 1674.5 7.1 1605 20 66.4 56.7 1704.8 9.8 2.92
WT12-40-2 1612 16 1638.7 9.9 1654 19 44.9 70.3 1679 12 3.07
WT12-40-3 1690 16 1701 8.8 1700 21 136 53.4 1720 8.8 2.57
WT12-40-4 478.7 6.2 491 11 494.8 7.8 34.41 89.41 581 36 4.62

Appendix C: U/Pb Data
10
4
Sample 206/207 (Ma) 2σ (Ma) 207/235 (Ma) 2σ (Ma) 208/232 (Ma) 2σ (Ma) U (ppm) Th (ppm) 207/206 (Ma) 2σ (Ma) Disc. (%)
WT12-40-5 1683 23 1707 12 1656 73 13.96 5.13 1748 16 4.66
WT12-40-6 494.3 6.1 500.1 5.6 507.4 5 85.5 172.5 540 18 2.55
WT12-40-7 1681 15 1664.6 7.3 1686 20 83 77 1670.1 8.9 2.65
WT12-40-8 1688 16 1693.7 7.5 1697 23 67.7 82.7 1701 10 2.52
WT12-40-9 490.4 5.6 495.5 5.4 492.5 9 61.1 61.9 543 18 2.8
WT12-40-10 1711 20 1703 10 1781 19 320 74.5 1709 7.2 2.77
WT12-40-11 483.8 7.4 493 10 548 18 22.3 17 583 42 5.17
WT12-40-12 1163 15 1336 8 1384 23 988 229 1625.8 6.7 12.14
WT12-40-13 490.5 6.5 495.8 6.3 515.8 7.8 81.1 181 498 25 3.32
WT12-40-14 485.4 6.6 495.4 8.5 526 11 52.2 38.5 533 26 3.33
WT12-40-15 463.2 7.8 471.9 8.8 529 15 32 27.1 496 32 4.16
WT12-40-16 507.1 6.6 502.4 5.6 511.2 5.6 77.7 205 505 21 2.73
WT12-40-17 1733 17 1718.4 8.2 1783 19 159.8 104.4 1710.1 7.7 2.6
WT12-41-12 465.1 8.1 479 11 492 13 44.2 34.21 536 32 5.05
WT12-41-22 472.4 5.8 491.6 6.8 453 12 97 78.9 582 32 4.31
WT12-41-32 459.6 8.1 488 11 500 15 43.9 78.7 624 36 6.5
WT12-41-42 473.2 6.3 495.6 7.8 505 10 78 67.7 587 23 4.39
WT12-41-52 1417 12 1418.2 7.3 1431 17 177 163 1421 12 2.45
WT12-41-62 469.8 6.2 479.5 9.3 473.3 7.4 47.1 91.2 521 40 4.67
WT12-41-72 1683 26 1696 14 1754 34 82 42.8 1708.4 9.5 3.79
WT12-41-82 492.7 7.6 517.2 8.2 522.1 7.2 116.2 330 625 22 4.34
WT12-41-92 517.5 5.6 520.3 4.3 486.9 7.5 299 248 535 22 2.55
WT12-41-102 477.6 6.2 483.9 6 468 9.3 108.4 155.6 497 22 2.61
WT12-41-112 2673 25 2701.1 9 2664 47 97 33.5 2724.9 8.2 3.86
WT12-41-122 476.5 9 496 12 487 18 35.8 38.1 558 35 4.84
WT12-41-132 1715 15 1703.4 9.3 1597 30 44.1 36.72 1678 12 3.22
WT12-41-142 503 11 518 14 527 22 27.2 24.3 592 33 4.78

Appendix C: U/Pb Data
10
5
Sample 206/207 (Ma) 2σ (Ma) 207/235 (Ma) 2σ (Ma) 208/232 (Ma) 2σ (Ma) U (ppm) Th (ppm) 207/206 (Ma) 2σ (Ma) Disc. (%)
WT12-41-152 1663 17 1686 11 1606 17 90 152 1710.8 9.1 3.05
WT12-41-162 1698 16 1714.7 9.2 1605 21 94.4 119.9 1727 11 2.84
WT12-41-172 1391 11 1418 7.4 1343 22 65.8 43.6 1459 11 3.15
WT12-41-182 1366 15 1393.1 8.5 1339 15 144 197 1423.3 9.7 2.96
WT12-41-192 1642 14 1659.5 7.5 1586 20 154 180 1678.8 9.6 2.41
WT12-41-202 1644 21 1665 11 1278 39 73.9 21.65 1688 12 3.28
WT12-41-212 481.4 7.8 493.6 9.2 462 10 71.5 67.3 563 35 3.81
WT12-41-222 486.7 9.1 497 7.7 473 12 87.3 71.9 549 30 3.83
WT12-41-232 1662 22 1673 13 1630 23 82.7 74.9 1698 15 3.35
WT12-41-242 458.7 9.7 457 16 466 18 39 43.3 474 42 5.6
WT12-41-252 1536 26 1617 14 840 51 66.8 56.8 1718 13 5.72
WT12-41-262 496 19 522 11 477 20 108.4 111 603 39 3.2
WT12-41-272 467.9 9.7 475.3 8.7 491 13 50.5 51.1 549 34 4.48
WT12-41-282 472.6 8.3 481.3 8.8 487 11 141 136 544 32 4.31
WT12-41-292 485 7.1 507 10 470 10 64.5 94 614 30 4.57
WT12-41-302 493 12 504 11 460 11 130 152 540 19 3.02
WT12-41-312 1695 28 1697 13 1639 33 92.7 82.6 1709 16 4.14
WT12-41-332 463.6 8.6 464.8 7.3 454.2 9.6 62.8 100.9 469 27 3.19
WT12-41-342 509 11 508 11 486 14 76.7 68.2 481 24 3.86
WT12-41-352 480.8 6 479.9 7.2 456.9 7.8 76.3 136.1 495 27 3.25
WT12-41-362 1444 16 1550.9 9.5 1592 26 80.9 69.3 1709 11 6.82
WT12-41-372 535 11 532.4 9.2 519.4 8.8 215 179 525 20 2.52
WT12-41-382 495.2 6.1 503.1 6.6 487.4 7.2 96.9 163.1 547 25 3.14
WT12-41-392 1704 26 1702 14 1755 21 215 82.3 1705.3 8.3 3.38
WT12-43-1 2336 35 2395 15 2279 40 213 185 2444.4 6.2 4.74
WT12-43-2 2311 22 2389.7 8.4 1784 35 111 153 2452.2 7.1 4.54
WT12-43-3 1199 23 1787 18 1184 31 170 419 2571.2 9.3 43.4

Appendix C: U/Pb Data
10
6
Sample 206/207 (Ma) 2σ (Ma) 207/235 (Ma) 2σ (Ma) 208/232 (Ma) 2σ (Ma) U (ppm) Th (ppm) 207/206 (Ma) 2σ (Ma) Disc. (%)
WT12-43-4 2586 18 2611.9 7.5 2518 25 287 669 2631.1 4 2.74
WT12-43-5 2364 27 2496 10 2180 100 173 260 2600.5 8.4 7.3
WT12-43-6 2396 19 2515.2 8.3 2257 24 207.5 438 2609.3 5.3 6.23
WT12-43-7 1910 29 2242 19 1675 51 414 254.4 2561.1 8.1 20.01
WT12-43-8 2580 25 2651 11 2398 29 368 299 2695.6 6.2 4.15
WT12-43-9 1631 25 2084 15 1534 31 522 904 2554 14 28.9
WT12-43-10 1342 21 1817 14 1217 38 483 1069 2399.6 6.4 32.94
WT12-43-11 858 14 1073 11 211 13 1001 1004 1553 12 18.25
WT12-43-12 2398 19 2418 10 2362 20 98.5 131.4 2435.7 8.6 2.61
WT12-43-13 2567 27 2580 11 2332 66 225 129.8 2605.5 6.8 3.15
WT12-43-14 2451 16 2450.3 6.1 2319 21 68.6 88.6 2455.7 5.2 2.48
WT12-43-15 2566 18 2595.7 7.1 1505 57 318 207.3 2616.3 5.3 2.49
WT12-43-16 2607 14 2610.3 6.2 2547 36 219.1 357 2610.8 3.8 2.05
WT12-43-17 2383 24 2495 11 2445 34 200 363 2582.7 8.5 5.91
WT12-43-18 2578 23 2592.9 8.3 2495 25 114.4 291 2606.8 4.5 3.21
WT12-43-19 2518 22 2512.6 9.4 2272 74 80.5 114.7 2504.7 8.1 2.74
WT12-43-20 1925 33 2172 20 1888 23 361 890 2406.9 9 15.11
WT12-43-21 1283 20 1432 12 1014 34 557 49.1 1663 11 10.56
WT12-45-1 1126 22 1233 37 1450 100 30.9 19.4 1479 64 10.4
WT12-45-2 1095 14 1103.1 7.2 1072.3 9.9 137 180 1118.7 8.7 2.68
WT12-45-3 1051 11 1049.8 7.7 1030 14 48.2 51.5 1059 12 2.6
WT12-45-4 1156 11 1180.2 7.5 977 20 100.7 71.8 1222.7 8.2 2.36
WT12-45-5 1375 12 1396.7 5.7 1410 11 126.6 145.3 1433.1 8.1 2.43
WT12-45-6 1428 15 1444.9 8.2 1367 15 83.9 69.7 1461 8.9 2.35
WT12-45-7 1290 12 1312.3 7.6 1258 13 73.6 60.8 1345 10 2.78
WT12-45-8 1041.3 9.5 1057 7.6 1089 19 56.8 27.4 1096 16 2.49
WT12-45-9 1187 21 1272 14 758 64 138.4 269 1421.4 9.1 6.12

Appendix C: U/Pb Data
10
7
Sample 206/207 (Ma) 2σ (Ma) 207/235 (Ma) 2σ (Ma) 208/232 (Ma) 2σ (Ma) U (ppm) Th (ppm) 207/206 (Ma) 2σ (Ma) Disc. (%)
WT12-45-10 992 27 1024 21 943 36 254 129 1101 10 3.5
WT12-45-11 1010.5 8.7 1028.7 6.3 927 41 275 149 1073 14 2.1
WT12-45-12 1334 13 1392.3 8 1330 16 67.2 70.6 1481 10 3.83
WT12-45-13 1367 16 1415.4 8.3 1386 18 34.5 35.91 1491 13 3.86
WT12-45-14 1384 10 1387.1 7.2 1344 17 65.2 73.5 1400 11 2.28
WT12-45-15 1730 23 1748 13 1696 15 108.3 87.8 1770 9.6 3.41
WT12-45-16 1051.3 7.2 1061.2 5.3 1018 11 168 138 1083.5 9.6 1.83
WT12-45-17 956.7 6.4 976.3 7.1 962 13 117 81.6 1022 16 2.43
WT12-45-18 1365 11 1367.5 5.7 1337 10 85.7 211 1375 11 2.37
WT12-45-19 1386 12 1424.5 9.1 1408 15 65.2 71.7 1486 12 3.48
WT12-45-20 1597 15 1664.9 7.3 1494 31 121.5 109.9 1749.4 9.3 4.24
WT12-45-21 1288 13 1347 7.4 1096 35 263 369 1453.6 6.2 3.97
WT12-45-22 1059 8 1098.1 6.5 1157 18 74.8 34.3 1177.3 8.3 3.01
WT12-45-23 1080 11 1087.2 6.5 1136 14 134.1 88.4 1107 10 2.18
WT12-45-24 1089 11 1088.7 8.1 1071 18 49 43.1 1079 15 2.69
WT12-45-25 1068.7 9.5 1094.3 7 1083 16 67.3 38.3 1138 12 2.37
WT12-45-26 996.5 9.6 1012.2 6 1015 12 65.2 59.2 1039 10 2.7
WT12-45-27 1639 14 1724.6 8.1 1717 32 69.8 19.59 1821.8 8.4 4.88
WT12-45-28 1479 12 1481.5 6.8 1528 19 339 59.6 1483.1 8 2.21
WT12-45-29 1001.8 8.4 1014.6 4.2 970.3 9.5 228 92.7 1046.3 9.2 2.01
WT12-45-30 1036 11 1054.4 6.1 1084 10 119 91 1092.2 8.6 2.2
WT12-45-31 1061 10 1084.3 7.1 1080 18 81.1 33.1 1127 10 2.75
WT12-45-32 1223 14 1287.4 9.6 924 32 298 424 1390.1 9.6 4.32
WT12-45-33 1164 15 1144.6 7.2 1214 20 166 74 1100 11 3.3
WT12-45-34 1375 23 1415 10 1459 22 109 74.7 1483 12 4.41
WT12-45-35 1408.4 9.3 1433.5 6.5 1424 15 75.7 48.4 1466.5 9.8 1.87
WT12-45-36 1225 11 1259.3 6.9 1282 16 43.2 30.83 1318 11 2.86
WT12-45-37 1533 19 1586 11 1607 30 201 152 1673 12 3.96

Appendix C: U/Pb Data
10
8
Sample 206/207 (Ma) 2σ (Ma) 207/235 (Ma) 2σ (Ma) 208/232 (Ma) 2σ (Ma) U (ppm) Th (ppm) 207/206 (Ma) 2σ (Ma) Disc. (%)
WT12-45-38 1138 10 1137.6 6.2 1135 20 77.6 37.9 1132 12 2.34
WT12-46-1 1743 13 1761.8 5 1826 18 166 159 1787.7 6.8 2.28
WT12-46-2 1772 12 1782.4 5.9 1833 17 283 87.9 1786.3 6.2 1.98
WT12-46-3 2481 29 2563 14 1924 96 180 130.1 2634 4.7 5.33
WT12-46-4 2647 18 2629.4 6.9 2717 41 221.9 314 2610.6 5.1 2.81
WT12-46-5 1754 12 1763.6 6 1798 17 111.5 111 1769.5 8.3 2.38
WT12-46-6 1798 13 1781.6 7.1 1810 27 60.6 67.4 1763.7 7.5 2.65
WT12-46-7 1718 17 1740.9 8.6 1935 24 69.7 77.6 1764.6 9.1 2.86
WT12-46-8 1832 14 1810.2 8 1897 18 102.3 76.9 1784.3 5.5 2.19
WT12-46-9 1801 20 1794 10 1930 24 266 198 1781 11 2.56
WT12-46-10 1731 13 1752.4 9 1652 37 77.3 53.3 1771.9 7.8 2.39
WT12-46-11 1646.6 9.6 1710.9 5.4 870 33 305.5 342.8 1786.3 6.5 3.9
WT12-46-12 2698 24 2764 12 1800 230 252 250 2808 11 4.54
WT12-46-13 1058 26 1383 23 727 35 930 419 1906 31 23.6
WT12-46-14 1533 23 1638 13 823 27 137.9 185.5 1779.8 8.6 6.67
WT12-46-15 1598 19 1672 11 808 33 424 138.2 1767 11 4.57
WT12-46-16 1943 18 1969.7 7 1746 35 195.3 127.8 1997 10 2.73
WT12-46-17 1897 20 1855.7 8.2 1982 42 287 147.6 1806.4 8.8 3.41
WT12-46-18 1787 16 1782.5 8 1287 49 249.3 58.3 1785.4 5 1.9
WT12-46-19 2790 20 2873 10 2676 41 303 91 2929.1 7.7 4.2
WT12-46-20 1727 13 1756.6 6.1 1623 18 328 118.4 1781.3 4.8 2.31
WT12-46-21 1759 12 1773.5 6.4 1768 37 402 18.95 1787.1 6.9 1.85
WT12-46-22 1718 13 1743 7.5 1842 20 61.4 95.4 1767.8 5.9 2.15
WT12-46-23 1719 12 1751.4 6.4 1787 15 202 249 1783 7.5 2.48
WT12-46-24 2599 22 2626.9 9.3 2505 54 206 177 2647.9 4.4 3
WT12-46-25 1009 13 1022 11 1080 18 35.8 57.2 1040 15 2.49
WT12-46-26 1804 13 1793 6.2 1478 28 346 102 1788.9 6.4 1.86

Appendix C: U/Pb Data
10
9
Sample 206/207 (Ma) 2σ (Ma) 207/235 (Ma) 2σ (Ma) 208/232 (Ma) 2σ (Ma) U (ppm) Th (ppm) 207/206 (Ma) 2σ (Ma) Disc. (%)
WT12-47-1 1297 14 1317 11 1227 28 20.8 21 1348 15 2.77
WT12-47-2 1026 14 1026.3 9.9 994 18 341 116 1039 12 2.27
WT12-47-3 1725 20 1771 12 1737 26 112.7 99.6 1837.6 6.3 3.46
WT12-47-4 1043 6.8 1044.6 4.8 1009.9 8.9 305 131.9 1054.3 5.5 1.21
WT12-47-5 1067.2 9.5 1069.3 7.4 1006 18 111.8 30.9 1067.6 8.5 2.08
WT12-47-6 1295 18 1319 12 1243 28 27.1 15.4 1361 15 3.72
WT12-47-7 1090.7 9.4 1076.9 6 1057 19 167 94.2 1049.4 8.3 1.9
WT12-47-8 1013.3 9.3 1017.2 7.1 1003 13 61.1 51 1034 11 2.22
WT12-47-9 1002.6 9.8 1012.1 7.4 1007.4 7.2 159.1 293 1030 10 1.85
WT12-47-10 1018.3 7.8 1019.7 5.9 990 14 94 42.1 1030.3 7.8 1.72
WT12-47-11 840 11 854 12 864 20 34.5 25.1 922 21 3.43
WT12-47-12 1419 14 1431.8 8.9 1486 16 119.1 96 1446.8 9.5 2.2
WT12-47-13 1032.8 8 1046.8 5.4 1007.4 9.5 325 162 1081.2 7.7 2.03
WT12-47-14 965 11 973 16 959 17 39.5 78.7 989 21 3.27
WT12-47-15 978 12 998.5 9.5 1019 17 51.4 33.4 1046 17 2.68
WT12-47-16 1216.9 9.9 1226.4 8.5 1195 18 55.2 52.3 1253 10 2.23
WT12-47-17 1323 13 1328.8 8.4 1259 21 59 37.65 1337 12 2.38
WT12-47-18 1434 18 1439.4 8.8 1390 21 78.5 46.8 1450.7 9.1 2.77
WT12-47-19 1628 21 1669 10 1615 34 45.2 32.2 1714 11 3.58
WT12-47-20 2583 25 2660 11 2605 32 33.1 28.8 2720.2 9.6 4.61
WT12-47-21 1565 13 1598.6 8.4 1552 19 94.2 116.6 1646.9 8.4 2.68
WT12-47-22 880 14 891 9.8 979 13 242 101 930 11 2.32
WT12-47-23 1049 15 1047 12 1053 18 30.1 27.3 1050 16 3.1
WT12-47-24 1048 10 1058.4 7.5 1010 11 125.7 100.6 1074 15 2.31
WT12-47-25 1686 16 1726.1 8.2 1723 17 203 271 1766.7 7.3 2.77
WT12-47-26 1144 13 1127.9 9.1 1137 21 56.8 27.5 1100 14 3.18
WT12-47-27 1017 13 1039.2 9.3 1019 19 103 33 1081 14 3.1

Appendix C: U/Pb Data
11
0
Sample 206/207 (Ma) 2σ (Ma) 207/235 (Ma) 2σ (Ma) 208/232 (Ma) 2σ (Ma) U (ppm) Th (ppm) 207/206 (Ma) 2σ (Ma) Disc. (%)
WT12-47-28 1130 10 1153.7 6.7 1167.4 9.3 389 262 1194 6.4 2.17
WT12-47-29 1369 20 1405 12 1463 20 125 70.5 1458.3 9.1 2.98
WT12-47-30 1014 10 1035 11 1112 21 46.6 35.6 1071 15 3.05
WT12-47-31 1025 11 1038.5 5.8 1092 41 176 21.3 1073 11 2.39
WT12-47-32 1095 11 1124.4 7.7 1165 16 40.6 62.7 1186 14 3.53
WT12-47-33 975.6 7.3 987.3 5.2 982 12 183 63.3 1008 11 1.86
WT12-47-34 997.4 9.2 1008.3 6.5 976 12 205 95.8 1018.6 8.1 1.96
WT12-47-35 1148 10 1160.2 5 1139 13 237 96.6 1180.5 9.3 2.33
WT12-47-36 999 13 1005.4 8.4 1000 17 91 56.1 1015 13 2.68
WT12-47-37 1349 15 1353.5 8.4 1283 18 253 78 1358.4 7.7 2.1
WT12-47-38 1181 11 1189.3 8.6 1169 17 55.8 54.6 1220 15 2.99
WT12-47-39 1041 15 1045 11 1037 14 67.8 50.8 1045 17 3.47
WT12-49-1 836 31 891 25 1036 26 63 20.6 1015 13 4.67
WT12-49-2 987 6.7 994.9 4.5 923 10 201 160.4 1009.3 9 1.86
WT12-49-3 1152 11 1165.7 7.1 1140 16 179 94.4 1202 13 2.38
WT12-49-4 1139 12 1143.6 9.5 1075 16 26.9 50.8 1169 18 3.2
WT12-49-5 1155.5 9.9 1155.6 6.5 1088 16 59.3 42.4 1156 12 2.52
WT12-49-6 1122.9 9.4 1132.3 7.3 1083 16 74.2 40.8 1156 10 2.24
WT12-49-7 1445 10 1451.8 7 1374 15 91.6 78.7 1463.6 5.8 1.71
WT12-49-8 1461 10 1460.9 6.1 1387 18 133.5 130.9 1458.4 6.1 1.67
WT12-49-9 935.8 7.7 947.9 5.4 907.2 8.9 336 187.1 968.4 7.9 1.76
WT12-49-10 1135 10 1148.5 6.8 1072 13 50.1 77.6 1168 11 2.58
WT12-49-11 1011.2 8 1029.2 6.9 1142 64 244 20.3 1073 12 1.93
WT12-49-12 1123.7 9.6 1124.5 8.2 1088 12 49.1 49.7 1135 15 2.54
WT12-49-13 1064 18 1079 10 1210 160 241 2.9 1115 11 2.13
WT12-49-14 1339 16 1339.8 9.1 1317 25 121 140 1352 14 2.14
WT12-49-15 1386 12 1407.6 6.6 1351 11 189.5 184 1426.7 9.7 2.43

Appendix C: U/Pb Data
11
1
Sample 206/207 (Ma) 2σ (Ma) 207/235 (Ma) 2σ (Ma) 208/232 (Ma) 2σ (Ma) U (ppm) Th (ppm) 207/206 (Ma) 2σ (Ma) Disc. (%)
WT12-49-16 1400 15 1406 11 1314 18 125.2 66.1 1404 11 1.77
WT12-49-17 1149 11 1158.2 6.3 1096 18 63.9 43.5 1182.7 9.2 2.5
WT12-49-18 1419 13 1435.2 7.6 1348 14 123.9 85.6 1452 11 2.35
WT12-49-19 1357.2 9.9 1345.7 6 1288 17 229 121.1 1336.8 7.4 1.87
WT12-49-20 1013 8.1 1009 5.5 953 34 136.1 6.5 995.6 9.9 1.8
WT12-49-21 1047 11 1048.3 6.6 977 10 145.9 110.3 1040.4 8.9 2
WT12-49-22 1447 12 1448.6 6.9 1396 12 204 132.9 1453.1 6.3 1.7
WT12-49-23 1011.1 8.9 1015.1 5.4 971 8.6 108.4 227.7 1021 11 2.08
WT12-49-24 1300 12 1315.5 6.2 1329 13 209.2 136.9 1336.2 7.4 1.97
WT12-49-25 1222 17 1226 14 1235 32 16.12 11.79 1261 23 4.03
WT12-49-26 1033 16 1062 13 1040 19 13.33 26.87 1128 22 4.61
WT12-49-27 994.7 8.7 1003 6.3 1007 11 286 87.6 1026.3 8.1 1.84
WT12-49-28 1136 11 1148.9 8.2 1131 11 76.1 70.4 1161 13 2.51
WT12-49-29 1408 23 1421 13 1487 20 129 93.2 1436.5 9.8 3.21
WT12-49-30 1041 12 1057 11 1035 14 103 124.8 1090 18 3.1
WT12-49-31 1883 17 1914.5 7.8 1898 26 99.9 123.1 1947.4 7.5 2.91
WT12-49-32 1068 11 1071.7 6.6 1048 16 94.1 68.2 1087 13 2.3
WT12-49-33 1007 14 1051 12 1105 18 71.4 54.5 1126 25 4.2
WT12-49-34 1171 16 1201 13 1735 81 111 17.8 1249 16 2.65
WT12-49-35 1060 12 1091.8 8.2 1129 18 61.7 42.9 1161 14 3.09
WT12-49-36 1261 12 1295.6 9.5 1259 13 190 113.9 1346 10 2.55
WT12-49-37 1282 13 1285.7 9.4 1325 21 70.3 54.6 1295 16 2.59
EAB10-11-1 1087 10 1083.9 7.5 982 13 89 119.2 1073 10 2.28
EAB10-11-2 1058 10 1065.8 7.9 996 13 75.8 64.3 1086 13 2.42
EAB10-11-3 1042 12 1043.9 8.7 986 18 52.2 50 1041 19 3.08
EAB10-11-4 1394 19 1460 13 1228 44 111.8 42 1560 12 4.19
EAB10-11-5 1024 8.5 1020 5.4 946 11 263 154 1018.1 9.3 1.85

Appendix C: U/Pb Data
11
2
Sample 206/207 (Ma) 2σ (Ma) 207/235 (Ma) 2σ (Ma) 208/232 (Ma) 2σ (Ma) U (ppm) Th (ppm) 207/206 (Ma) 2σ (Ma) Disc. (%)
EAB10-11-6 1029.1 9.3 1017.9 6.3 938 11 136.4 136.8 1002 11 2.12
EAB10-11-7 1115.4 8.1 1115.4 4.5 1068 24 311 32.1 1110.7 8.2 1.8
EAB10-11-8 948 13 953 11 896 21 72.6 41.2 954 16 2.69
EAB10-11-9 1087 15 1086 12 1021 21 30.08 43.65 1079 22 3.98
EAB10-11-10 1071 16 1046 13 1006 24 36.9 29.8 1024 16 3.46
EAB10-11-11 1377 15 1347 9.1 1272 16 93.6 112.1 1315.4 8.6 2.71
EAB10-11-12 1782 21 1754 10 1778 23 97.5 98.3 1736 10 3.13
EAB10-11-13 1447 12 1451.1 7.2 1413 16 81.3 94.5 1462.7 7.8 2.25
EAB10-11-14 1175 9.4 1170.9 7.5 1130 13 97.8 53.5 1168.6 9.8 2.39
EAB10-11-15 1323 14 1349 11 1279 21 120.9 72.3 1399 12 2.25
EAB10-11-16 1137 11 1137.6 7.8 1090 19 74 57.6 1148 12 2.54
EAB10-11-17 1175 12 1167 10 1153 23 26 29.01 1162 17 4.03
EAB10-11-18 1431 11 1442 6.4 1400 17 225.7 91.1 1457.9 7.1 1.85
EAB10-11-19 1072.4 8.7 1069.4 6.9 1047 15 94 79.3 1070 12 2.53
EAB10-11-20 1153 12 1178 13 1148 22 30.4 41.4 1234 24 3.76
EAB10-11-22 1058 11 1058.3 7.4 1010 14 140 76.3 1059.9 8.7 1.94
EAB10-11-23 1224 11 1335 25 1690 100 77.7 45.8 1494 53 7.4
EAB10-11-24 1158 12 1155.6 7.4 1193 23 58.2 41.7 1155 13 2.73
EAB10-11-25 1083 11 1119 12 1048 21 85.3 68.5 1190 22 3.39
EAB10-11-26 991 11 1021.5 9.1 949 23 92 40.3 1091 15 3.41
EAB10-11-27 1157 10 1185.4 6 1142 20 132.5 109.8 1236 12 2.25
EAB10-11-28 1313 11 1314.2 8.9 1339 22 45.4 55.4 1318 13 3.16
EAB10-11-29 1109 14 1115 12 1016 37 49.2 49.3 1116 21 3.11
EAB10-11-30 948 19 992 15 613 38 83.4 165 1094 15 4.07
EAB10-11-31 1425.7 9.8 1437.9 7 1445 18 82.4 49 1457.6 9.6 2.49
EAB10-11-32 2597 18 2636.1 6.9 2743 36 66.2 58.8 2670.4 6.2 3.03
EAB10-11-33 1109 12 1120 8.5 804 46 68.3 42.1 1150 22 3.42
EAB10-11-34 1134 19 1110 14 1011 98 99.7 61 1060 17 3.04

Appendix C: U/Pb Data
11
3
Sample 206/207 (Ma) 2σ (Ma) 207/235 (Ma) 2σ (Ma) 208/232 (Ma) 2σ (Ma) U (ppm) Th (ppm) 207/206 (Ma) 2σ (Ma) Disc. (%)
EAB10-11-35 1154 34 2210 130 2140 140 21.1 71 3390 190 87.5
EAB10-11-36 1155.3 7.7 1152.1 5 1161 19 253 55.8 1158 11 1.93
EAB10-11-37 1019 13 1158 19 1128 39 32.9 36.4 1450 57 10.8
CAT-23-1 2055 23 2365 11 2070 48 263 296 2628.1 7.8 18.1
CAT-23-2 1756 21 1801 10 1475 43 361 162.9 1871 11 3.96
CAT-23-3 3035 48 3137 47 6180 440 15.14 15.76 3198 48 6.62
CAT-23-4 1806 50 2676 25 3290 230 177.8 227 3403 30 61
CAT-23-5 1326 20 1723 26 773 36 180.8 486 2226 35 26.5
CAT-23-6 1826 19 1837.9 8.9 1800 24 52.1 30.2 1846.7 9.9 3.32
CAT-23-7 1475 15 1479.4 9.8 1424 19 118.8 106.6 1478 15 2.98
CAT-23-8 1737 16 1777 10 1769 35 72.8 78.9 1829 17 3.7
CAT-23-9 2514 40 2776 33 4220 330 174 230 2973 33 13.9
CAT-23-10 1793 35 1836 20 2125 51 200 244 1885.1 9.8 3.88
CAT-23-11 1991 32 2331 16 2258 84 182 179 2649.9 5.6 20.3
CAT-23-16 1922 19 1930 17 2860 170 119.5 35.7 1931 28 3.67
CAT-23-17 2570 30 2616 11 2695 24 138.7 212 2642.8 5.8 3.5
CAT-23-14 1796 23 2026 52 3210 270 86.9 50.2 2231 84 12.9
CAT-23-15 476 15 993 23 317 18 978 1013 2427 19 55.66
CAT-23-16 741 24 1405 27 827 22 594 1191 2586 30 56
CAT-23-18 2622 20 2645.5 8.8 2591 27 61.7 91.8 2670.5 8.1 2.81
CAT-23-19 2319 20 2480.7 8.9 2480 20 105 227 2621.3 6.4 9.26
CAT-23-20 1934 42 1970 51 2640 320 244.7 201.3 2006 59 4.7
CAT-23-21 1930 64 2182 61 3370 190 172.7 155.7 2469 61 18.1
CAT-23-22 1873 30 1860 16 2255 55 170 49.9 1851.1 8.7 3.32
CAT-23-23 3010 51 2974 46 8070 940 84 27.9 2949 45 3.44
CAT-23-24 964 30 2241 32 2130 150 567 920 3822 30 114.5
CAT-23-25 2001 23 2465 16 1038 26 102 196 2875 14 29

Appendix C: U/Pb Data
11
4
Sample 206/207 (Ma) 2σ (Ma) 207/235 (Ma) 2σ (Ma) 208/232 (Ma) 2σ (Ma) U (ppm) Th (ppm) 207/206 (Ma) 2σ (Ma) Disc. (%)
CAT-23-26 2528 46 2617 21 1785 99 175.1 129 2691.1 7.5 6.2
CAT-15-1 1111 15 1253 16 1341 28 33.7 32.2 1525 32 10.8
CAT-15-2 2856 34 2806 15 3360 110 18.1 10.72 2768 15 5.38
CAT-15-3 1190 19 1305 19 1619 73 37.57 19.43 1513 40 8
CAT-15-4 1824 18 1800.8 8.7 1839 22 236 80.4 1785.4 8.7 2.63
CAT-15-5 1810 15 1803.5 6.5 1768 20 82.4 79 1797.2 8.6 2.51
CAT-15-6 2263 50 2575 22 2300 49 161 66.5 2834 13 17.9
CAT-15-7 2111 57 2533 73 7440 670 62.9 35.79 2893 79 25.1
CAT-15-8 2709 37 2789 23 3190 120 53.3 57.4 2841 16 5.19
CAT-15-9 1746 24 1789 16 1750 37 22.8 26.4 1842 23 4.87
CAT-15-10 1757 16 1777.1 8.5 1690 20 243 317 1813 10 2.34
CAT-15-11 1779 27 1767 14 1726 24 64.4 59.3 1766.8 9.9 3.7
CAT-15-12 1735 17 1745.6 9.3 1602 27 87 43.2 1765 11 2.94
CAT-15-13 1853 17 1863.5 8.2 1621 55 198 103.3 1885 10 2.92
CAT-15-14 1677 23 1988 20 259 23 210 1552 2311 37 19.6
CAT-15-15 1803 23 1800 11 1731 24 47.7 40.5 1804 14 3.55
CAT-15-16 1955 23 1926 11 1968 39 56.8 44.6 1883 15 3.93
CAT-15-17 2764 34 2753 11 3149 62 27.7 18.84 2743 11 5.05
CAT-15-18 1481 27 1655 20 745 71 262 364 1880 21 11.1
CAT-15-19 1198 13 1230 16 1297 55 123 62.3 1294 32 3.82
CAT-15-20 1826 16 1853 12 1816 31 63.9 108.3 1882 21 3.72
CAT-15-21 1812 18 1833 18 1885 57 69 73.5 1871 33 4.46
CAT-15-22 1469 14 1467 13 1436 43 44.7 31.3 1472 18 3.06
CAT-15-23 1247 15 1287 16 1333 49 23.2 11.9 1347 32 5.2
CAT-15-24 10490 190 6154 35 4.97E+04 1.40E+03 44 49.1 no value NAN 88.35
CAT-15-25 1837 19 1841 12 1971 64 65 32.7 1840 15 3.65
CAT-15-26 2813 29 2728 15 2899 83 29.9 45.1 2666 11 5.15

Appendix C: U/Pb Data
11
5
Sample 206/207 (Ma) 2σ (Ma) 207/235 (Ma) 2σ (Ma) 208/232 (Ma) 2σ (Ma) U (ppm) Th (ppm) 207/206 (Ma) 2σ (Ma) Disc. (%)
CAT-15-27 2810 22 2737 7.8 2868 50 153 106.9 2681.7 6 4.36
CAT-15-28 1768 18 1832 20 2021 56 36.4 40.5 1920 53 6.8
CAT-15-29 1824 13 1812.4 9 1775 27 54.1 58.2 1802.9 8.8 2.63
CAT-15-30 2473 31 2764 25 1690 250 134.1 730 2982 28 16
CAT-15-31 1928 15 1924 15 2112 85 187.8 120.2 1935 28 3.25
CAT-15-32 1547 49 1708 48 1770 330 349 150 1928 37 11.5
CAT-15-33 1820 11 1904 17 2066 70 92.7 85.6 1991 30 4.82
CAT-15-34 1850 16 1819.4 8 1730 20 93.6 128.8 1785.9 6.8 2.72
CAT-9-1 49.58 0.65 51.7 1.4 51.3 1.5 455 319 260 52 5.51
CAT-9-2 40.61 0.79 48.4 3.1 51.6 3.3 225 297 472 91 11.4
CAT-9-3 49.2 1.2 52.6 2.6 48.5 2.5 103.1 88.5 346 49 8.5
CAT-9-4 1192 11 1185.4 8 1123 15 121 80.2 1173 13 2.27
CAT-9-5 51.53 0.74 61.7 2.5 56.6 2.1 263.2 211.9 560 77 10
CAT-9-6 48.99 0.53 48.9 1 48.4 1.2 538 240.7 121 24 4.06
CAT-9-7 51.95 0.78 52.5 1.2 53.7 1.3 476 351 163 39 4.46
CAT-9-8 49.04 0.76 51.9 1.8 50.6 2 231.5 185.6 290 52 7
CAT-9-9 50.4 1.3 51.4 2.6 51.6 3.7 91.8 53.7 320 56 9.9
CAT-9-10 61.1 1.3 62.6 1.3 63.3 5.8 1527 54 115 18 2.25
CAT-9-11 48.36 0.68 48.5 2 48 2.5 157.1 120.4 257 62 7.6
CAT-9-12 1022 13 1027 12 1048 25 20.2 13.9 1025 22 3.84
CAT-9-13 48.21 0.51 48.87 0.81 48.87 0.98 773 495 124 19 3.23
CAT-9-14 49.62 0.72 55.3 3 50.3 1.9 197 234.6 504 93 11.1
CAT-9-15 1105.6 8.6 1099.7 6.2 1075 17 63.6 47.7 1085 13 2.39
CAT-9-16 1725 12 1748.6 6.2 1682 18 251 163.6 1774.2 6.2 2.11
CAT-9-17 1773 13 1776.7 4.7 1741 24 469 55.7 1779.4 5.3 2.04
CAT-9-18 1948 27 2335 22 9420 360 11.56 2.46 2678 33 23.3
CAT-9-19 49.1 1.2 61.7 3 65.6 4.4 107 73.3 617 64 13.7

Appendix C: U/Pb Data
11
6
Sample 206/207 (Ma) 2σ (Ma) 207/235 (Ma) 2σ (Ma) 208/232 (Ma) 2σ (Ma) U (ppm) Th (ppm) 207/206 (Ma) 2σ (Ma) Disc. (%)
CAT-9-20 1173 10 1185.3 7 1171 18 53.6 33.9 1224 12 2.71
CAT-9-21 1201.3 7.4 1188.8 4.9 1187.6 9.7 436 318 1167.8 4.9 1.24
CAT-9-22 49.67 0.65 56 1.6 53 1.8 260 208 368 43 7.2
CAT-9-23 1672 12 1665.9 6.4 1649 21 112.3 73.2 1661 10 1.93
CAT-9-24 433 10 452.7 7.1 503 6.6 113.1 142.6 574 37 5.1
CAT-9-25 1243 11 1248 9.3 1292 24 24.72 25.2 1265 17 3.21
CAT-9-26 1112.2 9.1 1104.9 7.4 1112 20 55.6 43.9 1094 11 2.78
CAT-9-27 1417 21 1402 13 1541 83 63 6.09 1406 19 2.97
CAT-9-28 47.6 1.2 51.6 2.7 50.4 2.5 101.7 87.2 290 46 9.6
CAT-9-29 1095 10 1098.8 7.8 1118 13 71.8 90.1 1124 12 2.49
CAT-9-30 1805 13 1789.9 8.4 1784 32 44.5 39.98 1776 12 2.41
CAT-9-31 1191 15 1202 10 1197 38 27.99 14.66 1223 21 3.81
CAT-9-32 1109 14 1122 14 1195 28 67 47.6 1125 22 2.73
CAT-9-33 1336 11 1339.4 9.5 1394 27 32.17 19.96 1360 15 3.12
CAT-9-34 454.1 4.4 461.2 5.2 494 10 271 74.4 495 19 2.06
CAT-9-35 2001 13 2001.3 5.8 1996 16 269 195 2000.7 6.1 1.88
CAT-9-36 50.33 0.84 58.4 3 55.8 2.6 226.4 195.6 496 98 8.6
CAT-9-37 1078 11 1067 7.6 1068 16 45.8 50.9 1051 18 2.75
CD10-55-1 1363 18 1359 10 1321 26 42.6 35.1 1350 20 4.15
CD10-55-2 1072 13 1069 10 1060 27 37.5 18.3 1086 19 3.6
CD10-55-3 1179.9 9 1179.1 6.6 1225 13 122.2 89.2 1181 10 1.89
CD10-55-4 1339 11 1340.2 5.9 1337 21 156.5 60 1349 11 2.33
CD10-55-5 1371 12 1366.4 7.6 1341 17 50.4 72.3 1364 14 3.06
CD10-55-6 1827 13 1849.1 6.7 1853 24 79.9 60.2 1866 12 2.78
CD10-55-7 1407 13 1423.8 8.5 1087 24 48.4 45.1 1461 13 2.87
CD10-55-8 1078 12 1068.7 7.1 1079 15 195.2 64 1045 13 2.86
CD10-55-9 2695 30 2685 11 2368 38 154.9 71.6 2679 10 4.29

Appendix C: U/Pb Data
11
7
Sample 206/207 (Ma) 2σ (Ma) 207/235 (Ma) 2σ (Ma) 208/232 (Ma) 2σ (Ma) U (ppm) Th (ppm) 207/206 (Ma) 2σ (Ma) Disc. (%)
CD10-55-10 2667 24 2677.9 7.9 2730 30 37 62.8 2687.2 8.5 3.87
CD10-55-11 1269 14 1268.4 9 1286 16 68.2 50.6 1287.2 9.6 2.73
CD10-55-12 1423 28 1437 16 1407 24 65.4 62.3 1458 17 4.8
CD10-55-13 1078 27 1116 24 1198 42 10.4 10.3 1188 42 8.7
CD10-55-14 1236 21 1231 12 1241 20 49 45.5 1231 14 4.24
CD10-55-15 1063 15 1077 10 1098 21 55.8 29.23 1105 16 3.11
CD10-55-16 2692 24 2700.7 8.8 2734 38 59 40.6 2705.4 5.7 3.85
CD10-55-17 989 11 992.6 7.2 983 15 103.3 64.8 1005 11 2.21
CD10-55-18 1323 18 1385 22 1515 58 18.2 13.05 1482 40 6.6
CD10-55-19 1807 14 1825.3 9 1843 20 57.3 96.1 1858.2 9.3 2.64
CD10-55-20 2426 32 2624 13 1981 39 29.2 30.6 2788 11 11
CD10-55-21 2357 23 2539.7 9.5 1152 25 49.1 111.2 2692.2 7.9 10.2
CD10-55-22 3316 23 3341.6 8.4 3321 28 124.8 139.7 3352.3 7.8 3.8
CD10-55-23 1202 10 1195.8 7.9 1195 16 85.6 49.9 1193 11 2.23
CD10-55-24 1092 13 1090.9 9 1125 23 36.9 28.01 1099 16 3.33
CD10-55-25 1609 12 1626.1 5.8 1567 16 126.8 171.6 1649.2 9.9 2.56
CD10-55-26 1372 13 1370.6 8.2 1362 18 86.6 75.6 1383 12 2.53
CD10-55-27 1340 12 1330 6.9 1295 15 86.3 69.8 1324 14 2.84
CD10-55-28 922 19 950 16 939 28 8.66 12.39 962 30 6.01
CD10-55-29 1202 15 1206 13 1209 26 22.36 22.6 1212 21 3.69
CD10-55-30 1247 10 1246.9 7.5 1246.8 9.2 279 432 1250.4 7.4 1.99
CD10-55-31 1423 23 1435 13 1136 32 113.9 126.6 1457 12 2.99
CD10-55-32 1449 17 1444.1 7.5 1460 17 263 313.8 1451 11 2.49
CD10-55-33 2727 29 2725 13 2842 74 14.66 9.14 2732 12 5.1
CD10-55-34 1112 17 1121 11 1089 42 55.8 59 1140 18 4.11
CD10-55-35 1905 17 1852.7 7.2 1922 22 196.3 34.3 1790.3 9.8 3.81
CD10-55-36 1461 17 1425 10 1523 20 91.1 64 1370.5 9.5 3.26
CD10-55-37 1370 15 1373.7 8.7 1406 20 121.5 75 1375 14 2.86
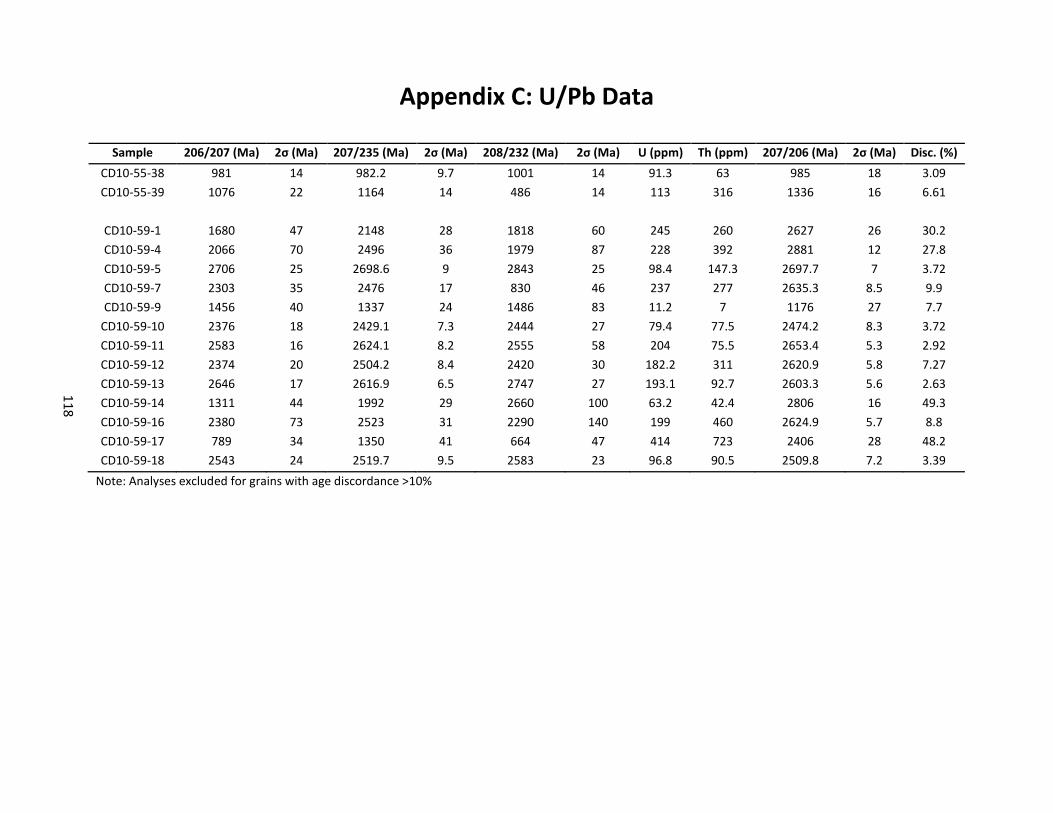
Appendix C: U/Pb Data
11
8
Sample 206/207 (Ma) 2σ (Ma) 207/235 (Ma) 2σ (Ma) 208/232 (Ma) 2σ (Ma) U (ppm) Th (ppm) 207/206 (Ma) 2σ (Ma) Disc. (%)
CD10-55-38 981 14 982.2 9.7 1001 14 91.3 63 985 18 3.09
CD10-55-39 1076 22 1164 14 486 14 113 316 1336 16 6.61
CD10-59-1 1680 47 2148 28 1818 60 245 260 2627 26 30.2
CD10-59-4 2066 70 2496 36 1979 87 228 392 2881 12 27.8
CD10-59-5 2706 25 2698.6 9 2843 25 98.4 147.3 2697.7 7 3.72
CD10-59-7 2303 35 2476 17 830 46 237 277 2635.3 8.5 9.9
CD10-59-9 1456 40 1337 24 1486 83 11.2 7 1176 27 7.7
CD10-59-10 2376 18 2429.1 7.3 2444 27 79.4 77.5 2474.2 8.3 3.72
CD10-59-11 2583 16 2624.1 8.2 2555 58 204 75.5 2653.4 5.3 2.92
CD10-59-12 2374 20 2504.2 8.4 2420 30 182.2 311 2620.9 5.8 7.27
CD10-59-13 2646 17 2616.9 6.5 2747 27 193.1 92.7 2603.3 5.6 2.63
CD10-59-14 1311 44 1992 29 2660 100 63.2 42.4 2806 16 49.3
CD10-59-16 2380 73 2523 31 2290 140 199 460 2624.9 5.7 8.8
CD10-59-17 789 34 1350 41 664 47 414 723 2406 28 48.2
CD10-59-18 2543 24 2519.7 9.5 2583 23 96.8 90.5 2509.8 7.2 3.39
Note: Analyses excluded for grains with age discordance >10%

119
References Adriasola, A. C., Thomson, S., Brix, M., Herve, F., and Stockhert, B., 2006, Postmagmatic cooling
and late Cenozoic denudation of the North Patagonian Batholith in the Los Largos region of Chile: International Journal of Earth Science, v. 95, p. 504-528.
Allmendinger, R.W., 1992, Fold and thrust tectonics of the western United States exclusive of
the accreted terranes: The Geology of North America, v. G-3, p. 583-607. Armstrong, R. 1968, Sevier orogenic belt in Nevada and Utah: Geological Society of America
Bulletin, v. 79, p. 429-458. Barton, M. D., 1990, Cretaceous magmatism, metamorphism, and metallogeny in the east-
central Great Basin, in The Nature and Origin of Cordilleran Magmatism, edited by J. L. Anderson, Geological Society of America Memoir 174, p. 283-302.
Bjerrum, C., and Dorsey, R., 1995, Tectonic controls on deposition of Middle Jurassic strata in a
retroarc foreland basin, Utah-Idaho trough, western interior, United States: Tectonics, v. 14, p. 962-978.
Braun, J., Beek, P., Batt, G., 2006. Quantitative thermochronology: numerical methods for the
interpretation of thermochronological data. Cambridge: Cambridge University Press. Burchfiel, B., and Royden, L., 1991, Antler orogeny: A Mediterranean-type orogeny: Geology, v.
19, p. 66-69. Burtner, R., and Nigrini, A., 1994, Thermochronology of the Idaho-Wyoming Thrust Belt During
the Sevier Orogeny: A New, Calibrated Multiprocess Thermal Model: American Association of Petroleum Geologists Bulletin, v. 78, p. 1586-1612.
Cashman, P.L., 1992, Structural Geology of the North-eastern Stansbury Mountains, in Wilson,
J.R., editor, Field guide to geologic excursions in Utah and adjacent areas: Utah Geological Survey Miscellaneous Publication 92-3, p. 171-178.
Camilleri, P., and Chamberlain, K., 1997, Mesozoic tectonics and metamorphism in the Pequop
Mountains and Wood Hills region, northeast Nevada: Implications for the architecture and evolution of the Sevier orogen: Geological Society of America Bulletin, v. 109, p. 74-94.
Camilleri, P., Yonkee, A., Coogan, J., DeCelles, P., McGrew, A., and Wells, M., 1997, Hinterland to
foreland transect through the Sevier Orogen, Northwest Nevada to North central Utah: structural style, metamorphism, and kinematic history of a large contractional orogenic wedge: Brigham Young University Geological Studies, v. 42, p. 297-309.
Christie-Blick, N., 1982, Upper Proterozoic and Lower Cambrian rocks of the Sheeprock
Mountains, Utah: regional correlation and significance: Geological Society of America Bulletin, v. 93, p. 735–750.

120
Coogan, J.C., 1992, Structural evolution of piggyback basins in the Wyoming-Idaho-Utah thrust
belt: Geological Society of America Memoir 179, p. 55-81. Crittenden Jr., M. C., 1972, Willard Thrust and the Cache Allochthon, Utah: Geological Society of
America Bulletin, v. 83, p. 2871-2880. Cruz-Uribe, A.M., Hoisch, T.D., Vervoort, J.D., Wells, M.L., Mazdab, F.K., 2014, Linking
thermodynamic modeling, Lu-Hf geochronology, and trace elements in garnet: New P-T-t paths from the Sevier hinterland: submitted.
Currie, B., 1997, Sequence stratigraphy of nonmarine Jurassic and Cretaceous rocks, central
Cordilleran foreland-basin system: Geological Society of America Bulletin, v. 109, p. 1206-1222.
Currie, B., 1998, Upper Jurassic-Lower Cretaceous Morrison and Cedar Mountain Formations, NE
Utah-NW Colorado: Relationships Between Nonmarine Deposition and Early Cordilleran Foreland-Basin Development: Journal of Sedimentary Research, v. 68, p. 632-652.
Currie, B., 2002, Structural configuration of the Early Cretaceous Cordilleran Foreland-Basin
System and Sevier Thrust Belt, Utah and Colorado: The Journal of Geology, v. 110, p. 697-718.
Damon, P., and Kulp, J., 1957, Alpha-helium ages of pegmatite zircons: Transactions - American
Geophysical Union, v. 38, p. 390. DeCelles, P., Pile, H. T., and Coogan, J. C., 1993, Kinematic history of the Meade thrust based on
provenance of the Bechler Conglomerate at Red Mountain, Idaho, Sevier thrust belt: Tectonics, v. 12, p. 1436–1450.
DeCelles, P., 1994, Late Cretaceous-Paleocene synorogenic sedimentation and kinematic history
of the Sevier thrust belt, northwest Utah and southwest Wyoming: Geological Society of America Bulletin, v. 106, p. 32-56.
DeCelles, P., Lawton, T., and Mitra, G., 1995, Thrust timing, growth of structural culminations,
and synorogenic sedimentation in the type Sevier orogenic belt, western United States: Geology, v. 23, p. 699-702.
DeCelles, P., and Currie, B., 1996, Long-term sediment accumulation in the Middle Jurassic to
early Eocene Cordilleran retroarc foreland-basin system: Geology, v. 247, p. 591-594. DeCelles, P., and Giles, K., 1996, Foreland basin systems: Basin Research, v. 8.2, p. 102-123. DeCelles, P., 2004, Late Jurassic to Eocene evolution of the Cordilleran thrust belt and foreland
basin system, Western U.S.A.: American Journal of Science, v. 504, p. 105-168. DeCelles, P., and Coogan, J., 2006, Regional structure and kinematic history of the Sevier fold-
and-thrust belt, central Utah: Geological Society of America Bulletin, v. 1187/8, p. 841-

121
864. Dickinson, W., Klute, M., and Bilodeau, W., 1988, Tectonic setting and sedimentological features
of upper Mesozoic strata in southeastern Arizona: Special Paper - State of Arizona, Bureau of Geology and Mineral Technology, v. 5, p. 266-279.
Dickinson, W., and Gehrels, G., 2003, U/Pb ages of detrital zircons from Permian and Jurassic
eolian sandstones of the Colorado Plateau, USA: paleogeographic implications: Sedimentary Geology, v. 163, p. 29-66.
Dickinson, W., 2004, Evolution of the North American Cordillera: Annual Review of Earth and
Planetary Sciences, v. 32, p. 13-45. Dodson, M., 1973, Closure temperature in cooling geochronological and petrological systems:
Contributions to Mineralogy and Petrology, v. 40, p. 259-274. Dumitru, T., Gans, P.B., Foster, D., and Miller, E., 1991, Refrigeration of the western Cordilleran
lithosphere during Laramide shallow-angle subduction: Geology, v. 19, p. 1145-1148. Farley, K., 2002, U-Th/He dating: Techniques, calibrations, and applications: Reviews in
Mineralogy and Geochemistry, v. 47, p. 819-844. Farley K.A., Wolf R.A., Silver L.T., 1996, The effects of long alpha-stopping distances on (U-Th)/He ages: Geochim Cosmochim Acta, v. 60, p. 4223-4229. Friedrich, A. M., and Bartley, J. M., 2003, Three-dimensional structural reconstruction of a thrust
system overprinted by postorogenic extension, Wah Wah thrust zone, southwestern Utah: Geological Society of America Bulletin, v. 115, p. 1473-1491.
Gentry, A., Yonkee, A., Wells, M., and Eleogram, B., 2013, Patterns of Synorogenic
Sedimentation and Unroofing History of the Willard-Paris-Mead Thrust Sheet, Sevier Fold-Thrust Belt: Geological Society of America- Abstracts with Programs, v. 45, p. 5.
Giallorenzo, M. A., Wells, M., Stockli, D., 2013, Two exhumation events of the Wheeler Pass
thrust sheet in the southern Sevier fold-thrust belt from U-Th/He thermochronology: Abstracts with Programs – 2013 Cordilleran Section Meeting, v. 64.
Giallorenzo, M. A., 2013, Application of (U-Th)/He and 40Ar/39Ar Thermochronology to the age of
thrust faulting in the Sevier orogenic belt: University of Nevada, Las Vegas, Ph.D. Dissertation, 270 p.
Guenthner, W., Reiners, P., Ketcham, R., Nasdala, L., and Giester, G., 2013, Helium Diffusion in
Natural Zircon: Radiation Damage, Anisotropy, and the Interpretation of Zircon U-Th/He Thermochronology: American Journal of Science, v. 313, p. 1-54.
Hager, C., and Stockli, D., 2009, A New Matlab©-Based Helium Modeling Package (HeMP) for
Thermal History Recovery from Single and Multi-Thermochronometer U-Th/He Data and

122
Data Arrays: Geological Society of America- Abstracts with Programs, v. 487, p. 186-8. Heller, P., Bowdler, S., Chambers, H., Coogan, J., Hagen, E., Shuster, M., et al., 1986, Time of
initial thrusting in the Sevier orogenic belt, Idaho-Wyoming and Utah: Geology, v. 14, p. 288-291.
Hoisch, T., Wells, M., Beyene, M., Styger, S., and Vervoort, J., 2014, Jurassic thrust burial in the
Cordilleran retroarc: Linking pressure-temperature paths and Lu-Hf garnet geochronology in the Funeral Mountains, California: Geology, in press.
Hoisch, T., Wella, M., Beyene, M., Kelly, E., and Wills, M., 2013. Unraveling the history of crustal
thickening in the Sevier orogenic belt with Lu-Hf garnet geochronology and pressure-temperature paths from metamorphic rocks: Geological Society of America Abstracts with Programs, v. 125, p. 211.
Hourigan, J.K., Reiners, P.W., and Brandon, M.T., 2005, U-Th zonation-dependent alpha ejection
in (U-Th)/He chronometry: Geochimica et Cosmochimica Acta, v. 69, p. 3349-3365. Hudec, M.R., 1992, Mesozoic structural and metamorphic history of the central Ruby Mountains
metamorphic core complex, Nevada: Geological Society of America Bulletin, v. 104, p. 1086–1100.
Jordan, T., 1981, Thrust loads and foreland basin evolution, Cretaceous, western United States:
American Association of Petroleum Geologists Bulletin, v. 65, p. 12. Kelly, E., Hoisch, T., Wells, M., and Vervoort, J., 2013, Early Cretaceous Valanginian Crustal
Thickening in the Sevier Hinterland from Garnet P-T Paths and Lu-Hf Garnet Geochronology: Geological Society of America Abstracts with Programs, v. 125, p. 211.
Ketcham, R. A., 1996, Distribution of heat-producing elements in the upper and middle crust of
southern and west central Arizona: Evidence from the core complexes: Journal of Geophysical Research, v. 101, p. 611-632.
Ketcham, R.A., 2005, Forward and Inverse Modeling of Low-Temperature Thermochronology
Data: Reviews in Minerology and Geochemistry, v. 58, p. 275-314. Lacey, A., Wells, M., Hoisch, T., and Vervoort, J., 2013, Early Eocene Metamorphism in the Sevier
Hinterland Constrained by Lu-Hf Garnet Geochronology: Geological Survey of America: Abstracts with Programs, v.45, no. 6, p. 71.
Lawton, T., and Trexler, J.H., 1991, Piggyback basin in the Sevier orogenic belt, Utah:
Implications for development of the thrust wedge: Geology, v. 19, p. 827-830. Lee, J., Hager, C., Wallis, S., Stockli, D., Whitehouse, M., Aoya, M., et al., 2011, Middle to late
Miocene extremely rapid exhumation and thermal reequilibration in the Kung Co rift, southern Tibet: Tectonics, v. 30, p. TC002745.
McGrew, A. J., 1992, Tectonic evolution of the northern East Humboldt Range, Elko County,

123
Nevada [Ph.D. dissert]: Laramie, University of Wyoming, 191 p. McGrew, A., Peters, M., and ,Wright, J., 2000, Thermobarometric constraints on the
tectonothermal evolution of the East Humboldt Range metamorphic core complex, Nevada: Geological Society of America Bulletin, v. 112, p. 45-60.
Miller, D., and Hoisch, T., 1995, Jurassic Tectonics of Northern Nevada and Northwestern Utah
from the Perspective of Barametric Studies: Geological Society of America Special Paper, v. 299, p. 267-294.
Miller, E., Gans, P., and Wright, J., 1988, Metamorphic History of the East-Central Basin and
Range Province; Tectonic Setting and Relationship to Magmatism: Rubey, v. 7, p. 649-682. Naeser, C. W., Bryant, B., and Crittenden, M. D., 1983, Fission-track ages of apatite in the
Wasatch Mountains, Utah: An uplift study: Geological Society of America Memoir 157, p. 29-36.
Nasdala, L., Reiners, P., Garver, J., Kennedy, A., Stern, R., and Balan, E., 2004, Incomplete
Retention of Radiation Damage in Zircon from Sri Lanka: The American Minerologist, v. 89, p. 219-231.
Platt, J. P., and England, P., 1993, Convective removal of lithosphere beneath mountain belts:
Thermal and mechanical consequences: American Journal of Science, v. 293, p. 307-336. Poole, F. G., Steward, J. H., Palmer, A. R., Sandberg, C. A., Madrid, R. J., Ross, R. J., Jr., Hintze, L.
F., Miller, M. M., and Wrucke, C. T., 1992, Latest Precambrian to latest Devonian time; development of a continental margin, in Burchfiel, B. C., Lipman, P. W., and Zoback, M. L., editors, The Cordilleran Orogen: Conterminous U.S.: Geological Society of America, The Geology of North America, v. G-3, p. 9–56.
Rahl, J. M., McGrew, A. J., and Foland K. A., 2002, Transition from contraction to extension in the
northeastern Basin and Range: New evidence from the Copper Mountains, Nevada: Journal of Geology, v. 110, p. 179–194.
Reiners P.W., Farley K.A., and Hickes H.J., 2002, He diffusion and (U-Th)/He thermochronometry
of zircon: Initial results from Fish Canyon Tuff and Gold Butte: Tectonophysics, v. 349, p. 247-308.
Reiners, P., 2005, Zircon (U-Th)/He Thermochronometry: Reviews in Mineralogy and
Geochemistry, v. 58, p. 151-179. Royden, L., 1993, The tectonic expression of slab pull at continental convergent boundaries:
Tectonics, v. 2, p. 303-325. Royse Jr., F., 1993a, An overview of the geologic structure of the thrust belt in Wyoming,
northern Utah, and eastern Idaho: Geological Survey of Wyoming, v. 5, p. 272-311. Royse Jr., F., 1993b, Case of the phantom foredeep: Early Cretaceous in west-central Utah:

124
Geology, v. 21, p. 133-136. Royse Jr., F., Warner, M., and Reese, D., 1975, Thrust belt structural geometry and related
stratigraphic problems Wyoming-Idaho-northern Utah: Deep drilling frontiers of the central Rocky Mountains: Denver, Rocky Mountain Association of Geologists, p. 41-54.
Saleeby, J. B., and Busby-Spera, C., 1992, Early Mesozoic tectonic evolution of the western U.S.
Cordillera,in Burchfiel, B. C., Lipman, P. W., and Zoback, M. L., editors, The Cordilleran Orogen: Conterminous U. S.: Geological Society of America, The Geology of North America, v. G-3, p. 107–168.
Sears, J., 2001, Emplacement and denudation history of the Lewis-Eldorado-Hoadley thrust slab
in the northern Montana Cordillera, USA; implications for steady-state orogenic processes: American Journal of Science, v. 301, p. 359-373.
Smith, D., Miller, E., Wyld, S., and Wright, J., 1993, Progression and Timing of Mesozoic Crustal
Shortening in the Northern Great Basin, Western U.S.: Mesozoic Paleography of the Western United States, v. 71, p. 389-405.
Solum, J., and der Pluijm, B. v., 2007, Reconstructing the Snake River-Hoback River Canyon
section of the Wyoming thrust belt through direct dating of clay-rich fault rocks: Geological Society of America- Special Paper, v. 433, p. 183-196.
Speed, R. C., and Sleep, N. H., 1982, Antler orogeny and foreland basin: A model: Geological
Society of America Bulletin, v. 93, p. 815-828. Stewart, J., 1972, Initial Deposits in the Cordilleran Geosyncline: Evidence of a Late Precambrian
<850 m.y. Continental Separation: Geological Society of America Bulletin, v. 83, p. 1345-1360.
Stockli, D. F., Linn, J. K., Walker, J. D., and Dumitru, T. A., 2001, Miocene unroofing of the Canyon
Range during extension along the Sevier Desert Detachment, west-central Utah: Tectonics, v. 20, p. 289-307.
Sullivan, W. A., and Snoke, A. W., 2007, Comparative anatomy of core-complex development in
the northeastern Great Basin, USA: Rocky Mountain Geology, v. 42(1), p. 1-29. Taylor, W., Bartley, J., Martin, M., Geissman, J., Walker, J., Armstrong, P., 2000, Relations
between hinterland and foreland shortening: Sevier orogeny, central North American Cordillera: Tectonics, v. 196, p. 1124-1143.
Turcotte, D. L., and Schubert, G., 2002, Geodynamics, 2nd edition: New York, New York,
Cambridge University Press, p. 456.
Wells, M., Dallmeyer, R., and Allmendinger, R., 1990, Later Cretaceous extension in the
hinterland of the Sevier thrust belt, northwestern Utah and southern Idaho: Geology, v. 18, p. 929-933.

125
Wells, M., 1997, Alternating contraction and extension in the hinterlands of orogenic belts: An
example from the Raft River Mountains, Utah: Geological Society of America Bulletin, v. 109, p. 107-126.
Wells, M., Snee, L.W., and Blythe, A.E., 2000, Dating of major normal fault systems using
thermochronology: An example from the Raft River detachment, Basin and Range, western United States: Journal of Geophysical Research, v. 105, p. 16,303–16,327.
Wells, M., and Hoisch, T., 2008, The role of mantle delamination in widespread Late Cretaceous
extension and magmatism in the Cordilleran orogen, western United States: Geological Society of America Bulletin, v. 120, p. 515-530.
Wells, M., Hoisch, T., Cruz-Uribe, A., and Vervoort, J., 2012, Geodynamics of Synvergent
extension and tectonic mode switching: Constraints from the Sevier-Laramide orogen: Tectonics, v. 31, p. 1002.
Wells, M., Vervoort, J., Lacy, A., Cruz-Uribe, A., Beyene, M., and Kelly, E., 2013, The Sevier-
Laramide Hinterland: Initial Late Jurassic-Early Cretaceous Shortening, Renewed Early Late Cretaceous Shortening and the Influence of a Delamination Cycle on Wedge Mechanics: Geological Society of America- Abstracts with Programs, v. 125, p. 208.
Wenickie, B., Axen, G., and Snow, J., 1988, Basin and Range extensional tectonics at the latitude
of Las Vegas, Nevada: Geological Society of America Bulletin, v. 100, p. 1738-1757. Wiltschko, D.V., and Dorr Jr, J.A., 1983, Timing of Deformation in overthrust belt and foreland of
Idaho, Wyoming, and Utah: American Association of Petroleum Geologists Bulletin, v. 67, p. 1304-1322.
Wright, J. E., and J. L. Wooden, 1991, New Sr, Nd, and Pb isotopic data from plutons in the
northern Great Basin: Implications for crustal structure and granite petrogenesis in the hinterland of the Sevier thrust belt, Geology, v. 19, p. 457-460.
Yonkee, A., Parry, W., Bruhn, R., and Cashman, P., 1989, Thermal Models of Thrusting:
Contraints from fluid-inclusion observations, Willard thrust sheet, Idaho-Utah-Wyoming thrust belt: Geological Society of America Bulletin, v. 101, p. 304-313.
Yonkee, A., 1992, Basement-cover Relations, Sevier Orogenic Belt, Northern Utah: Geological
Society of America Bulletin, v. 104, p. 280-302. Yonkee, W., DeCelles, P., and Coogan, J., 1997, Kinematics and Synorogenic Sedimentation of
the Eastern Frontal Part of the Sevier Orogenic Wedge, Northern Utah: Brigham Young University Geology Studies, v. 42, p. 355-375.
Yonkee, A., 2005, Strain patterns within part of the Willard thrust sheet, Idaho-Utah-Wyoming
thrust belt: Journal of Structural Geology, v. 27, p. 1315-1343.

126
Yonkee, A., and Weil, A., 2011, Evolution of the Wyoming Salient of the Sevier Fold-Thrust Belt, Northern Utah to Western Wyoming: Utah Geological Association Publication, v. 40, p. 1-56.

127
Vita
Bryan R. Eleogram
M.Sc. Geologist (702)556-5501
I am graduate student from the University of Nevada, Las Vegas currently on track to graduate in April 2014 with an MSc in geology. I am perusing a career as a Professional Geologist in the Petroleum Exploration sector. My experience includes working on an underground mapping project at Sterling Gold Mine in southern Nevada and participating in the Imperial Barrel Award program. I have been a student athlete and understand the importance of team work and a commitment to health and safety. I believe my set of skills, along with a strong desire to learn are valued assets that will benefit a company in attaining its goals.
Skills: General
2D and 3D seismic interpretation Excellent work within individual and team environments
Overriding commitment to organizational and leadership skills
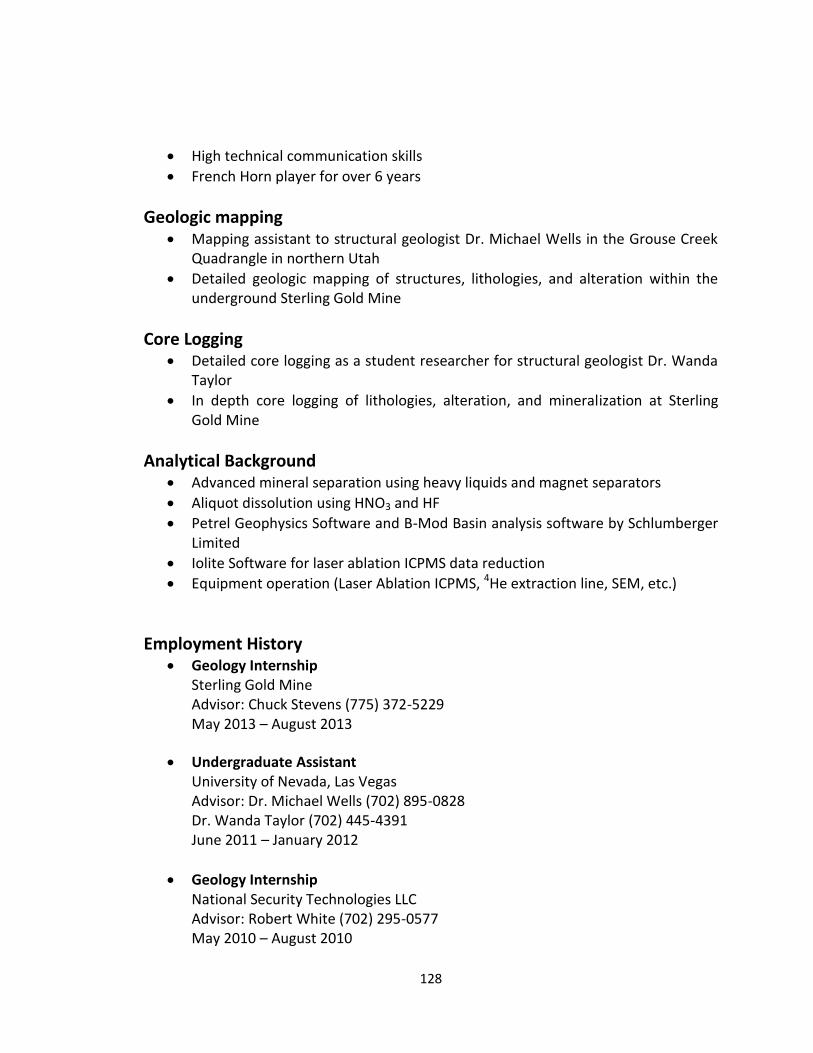
128
High technical communication skills
French Horn player for over 6 years
Geologic mapping Mapping assistant to structural geologist Dr. Michael Wells in the Grouse Creek
Quadrangle in northern Utah
Detailed geologic mapping of structures, lithologies, and alteration within the underground Sterling Gold Mine
Core Logging Detailed core logging as a student researcher for structural geologist Dr. Wanda
Taylor
In depth core logging of lithologies, alteration, and mineralization at Sterling Gold Mine
Analytical Background Advanced mineral separation using heavy liquids and magnet separators
Aliquot dissolution using HNO3 and HF
Petrel Geophysics Software and B-Mod Basin analysis software by Schlumberger Limited
Iolite Software for laser ablation ICPMS data reduction
Equipment operation (Laser Ablation ICPMS, 4He extraction line, SEM, etc.)
Employment History Geology Internship
Sterling Gold Mine Advisor: Chuck Stevens (775) 372-5229 May 2013 – August 2013
Undergraduate Assistant University of Nevada, Las Vegas Advisor: Dr. Michael Wells (702) 895-0828 Dr. Wanda Taylor (702) 445-4391 June 2011 – January 2012
Geology Internship National Security Technologies LLC Advisor: Robert White (702) 295-0577 May 2010 – August 2010

129
Civil Engineering & Design Internship National Security Technologies LLC Advisor: Steven Gould (702) 295-6252
June 2009 – May 2010
Honors
2012/2013 Imperial Barrel Awards Participant
American Association of Petroleum Geologists Member (Student)
Geological Society of America Member (Student)
Millennium Scholarship Recipient
University of Nevada, Las Vegas Geo-club Member
Education
Master of Science in Geology GPA: 3.7/4.0 Structural Geology, Advisor: Dr. Michael Wells University of Nevada, Las Vegas Spring 2012 – Fall 2013
Bachelor of Science in Geology Geology GPA: 3.0/4.0 University of Nevada, Las Vegas Fall 2006 – Fall 2011
Research
THE APPLICATION OF ZIRCON (U-TH)/HE THERMOCHRONOLOGY TO DETERMINE THE
TIMING AND SLIP RATE ON THE WILLARD THRUST, SEVIER FOLD AND THRUST BELT,
NORTHERN UTAH
ELEOGRAM, Bryan1, YONKEE, Adolph2, WELLS, Michael L.1, STOCKLI, Daniel F.3, GENTRY,
Amanda2, and GIALLORENZO, Michael A.1, (1) Department of Geosciences, University of
Nevada Las Vegas, 4505 South Maryland Parkway, Las Vegas, NV 89154-4010,
[email protected], (2) Department of Geosciences, Weber State University,

130
2507 University Circle, Ogden, UT 84408, (3) Department of Geological Sciences,
University of Texas at Austin, Austin, TX 78712
Although the Sevier belt is one of the best studied fold-thrust systems in the world,
timing of motion on dominant western thrust sheets that carry thick Neoproterozoic to
Paleozoic strata, including the Willard thrust sheet (WTS) of northern Utah, remains
incompletely understood. Interpretations for the age of initial slip on the WTS vary
widely from 140 to 115 Ma, reflecting ambiguous relations with foreland basin strata
and limited geochronologic data. Large displacement on the WTS (~60 km net slip), wide
range of exposed levels (>8 km vertical structural relief), and wide aerial extent (>60 km
horizontal length) provided an ideal setting for application of zircon (U-Th)/He
thermochronology (ZHe) to evaluate thrust timing. Samples were collected along three
pseudo-vertical transects that spanned the eastern leading, east-central, and central
parts of the WTS (with ~0.5 to 1 km sample spacing) and along a stratigraphic-parallel
(pseudo-horizontal) traverse at an intermediate level across the sheet. Due to relatively
slow cooling rates and multi-kinetic zircon populations, grains were prescreened based
on similar U-Pb ages and U/Th contents, with 6 grains selected for ZHe analysis at each
sample site. Vertical transects capture an Early Cretaceous partial retention zone (PRZ)
with slow cooling starting at ~130 Ma. Cooling ages increase systematically upward in
the east-central and central transects, yielding an average exhumation rate of 0.12
mm/yr.; only part of the PRZ is preserved along the eastern leading edge of the sheet.
Detrital zircon analysis of Aptian to Turonian (~125-90 Ma) synorogenic strata also
record protracted, slow exhumation of upper levels of the WTS. The horizontal traverse
yields an average slip rate of 1.7 mm/yr. from ~125 to 90 Ma (assuming a constant
geothermal gradient), consistent with estimated net slip. 40Ar/39Ar UV laser ablation
ages of mica in the western, basal part of the WTS are ~145-130 Ma, recording early
alteration and internal deformation that preceded large-scale thrust slip. The WTS was
subsequently passively uplifted and exhumed during Late Cretaceous development of
the Wasatch anticlinorium. Additional work is underway to increase sample density and
conduct thermo-kinetic modeling to evaluate potential temporal variations in
exhumation and slip rates.
References
Dr. W. Adolph Yonkee Weber State University Structural Geology

131
(801)-626-7419 [email protected] Dr. Andrew Hanson University of Nevada, Las Vegas Sedimentology (702)895-2263 [email protected] Dr. Patrick McAndles Vice President Exploration Imperial Metals Corporation (604)488-2665 [email protected] Dr. Wanda Taylor University of Nevada, Las Vegas Structural Geology (702)895-4615 [email protected] Dr. Stephen M. Rowland University of Nevada, Las Vegas Paleontology (702)895-3625 [email protected]