the arc of excellence - ntu...at a glance 04 chairman’s message 06 in conversation university with...
TRANSCRIPT

THE ARC OFEXCELLENCEANNUAL REPORT 2018
01NTU ANNUAL REPORT 2018
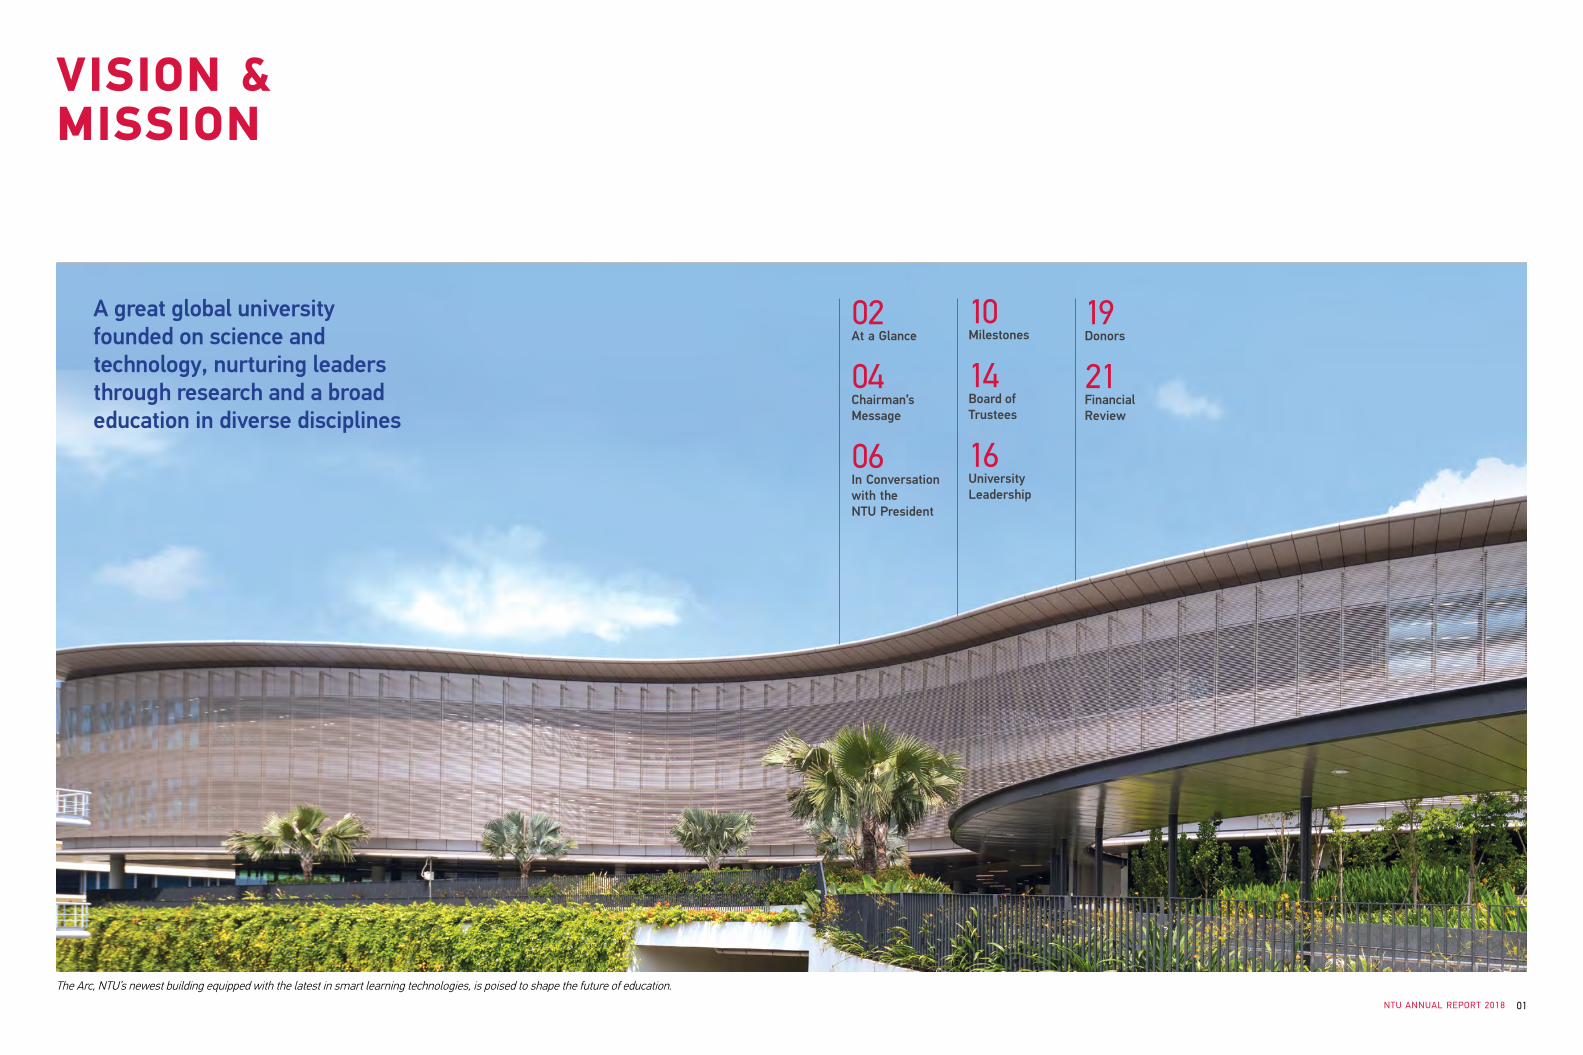
A great global university founded on science and technology, nurturing leaders through research and a broad education in diverse disciplines
VISION & MISSION
02 At a Glance
04Chairman’s Message
06 In Conversation with the NTU President
10Milestones
14Board of Trustees
16University Leadership
19Donors
21Financial Review
The Arc, NTU’s newest building equipped with the latest in smart learning technologies, is poised to shape the future of education.

THE ARC OF EXCELLENCE02 03NTU ANNUAL REPORT 2018
GLOBAL
PEOPLE
RESEARCH
CAMPUSHONOURS
108nationalities on campus
540university partners in
academia and research
7 in 10undergraduates have
an overseas opportunity during their studies
40joint entities set up with leading multinationals
on campus
27joint/dual PhD
degree programmes with overseas universities
330partner universities in close to 40 countries
offer student attachment programmes
23,800undergraduates
8,100graduate students
230,300alumni representing
156 nationalities
5,300faculty and researchers
from 81 countries
9 in 10of the Class of 2017
received a job offer within four months of graduation
1stin Asia for normalised
research impact (Thomson Reuters, Elsevier and
CWTS Leiden Ranking)
114patents granted in FY2017/18
S$578min competitive
research grants won in FY2017/18
2,735technology disclosures received since FY2007
TOP 10best green university
(DesignCurial)
3Singapore campuses
758units of
faculty housing
26halls of residence housing more than
12,800 students
2alumni houses
(in one-north and Marina Square)
52ndin Times HigherEducation World
University Rankings 2018
3rdin Times Higher
Education Young University Rankings
2018
1stin QS ranking of
the world’s young universities for 5th consecutive year
12thin QS World
University Rankings 2018/19
5thin Engineering and
Technology in QS World University Rankings by
Subject 2018
3rdin Materials
Science in QS World University Rankings by
Subject 2018
5thin Times HigherEducation Asia
University Rankings 2018
34thin Nature Index 2018 Global &
1st in Singapore
TOP 10most photogenic university in the
world (QS)
AT A GLANCE
THE ARC OF EXCELLENCE02 03NTU ANNUAL REPORT 2018

THE ARC OF EXCELLENCE04 05NTU ANNUAL REPORT 2018
CHAIRMAN’S MESSAGE
their students. Throughout my career, I have always been inspired by Stanford professor Frederick Terman, the father of Silicon Valley. Under his wings, countless tech CEOs were born, impacting lives with their game-changing innovations. Bill Hewlett and David Packard, who went on to found the Hewlett-Packard Company, were just two of the many he fostered.
In this new era, we foresee that students will need to have the strength and imagination to reinvent themselves perhaps three or four times during their career. The “right answer” will keep changing for them.
So their university education needs to help them acquire the skill of lifelong learning and to “learn how to learn”. A one-size-fits-all approach to teaching won’t work. But if we are smart about using technology to incorporate real-time feedback and analytics, we can give them an education that is personalised, takes into account their strengths and weaknesses, and helps everyone reach their highest potential, throughout their life.
NTU is thus at an inflection point but it will continue resolutely on its arc of excellence. On behalf of the University, I recognise the support and encouragement of the Singapore Government, our academic and industry partners and our philanthropic benefactors in upholding our excellence.
The NTU Board of Trustees also appreciates the outstanding and dedicated service of Prof Bertil Andersson, its third President, whose term concluded during this past year. He has done a stellar job of steering
the University’s growth, revamping its academic, research and administrative systems and programmes, establishing new talent recruitment schemes and building a reputation for NTU as one of the world’s most beautiful and sustainable campuses. We are delighted that he continues his association as President Emeritus.
Alongside Prof Andersson, we also thank Mr Ernest Wong and Sir Keith O’Nions, who have stepped down from the NTU Board after years of valuable service, and warmly welcome to the Board Prof Suresh, Dr Lee Shiang Long, Prof Gene Block and Prof Sir Leszek Borysiewicz.
We are indebted to former President of Singapore, Dr Tony Tan, who was NTU Chancellor from 2011 until 2017. A staunch supporter of education, he played a vital role in shaping NTU and Singapore’s higher education landscape.
As the University’s new Chancellor, Singapore President Halimah Yacob will continue to be an advocate for NTU, and we look forward to her stewardship.
At just half the age of our country, NTU must be proud of what it has already contributed to Singapore’s success and the betterment of society. Excellence and an aversion to complacency should guide us at all times as we establish our place in society as a university for the world.
‘‘ The world is moving rapidly into a new era of disruption that we now label Industry 4.0. This is already changing the way students learn, and the way we teach, do research, and carry out
our administrative work.”
MR KOH BOON HWEEChairman, Board of TrusteesNanyang Technological University, Singapore
THE ARC OF EXCELLENCE
After its recent years of rapid growth, NTU Singapore is at an inflection point. To many observers and by many objective measures it has now taken its place among the world’s most renowned universities. But it would be misplaced to think we have arrived, and worse, if we succumbed to hubris in acclaiming this.
On 1 January 2018, Prof Subra Suresh took over the helm as NTU President from Prof Bertil Andersson. Both leaders share the view that notwithstanding our achievements, there is much more to do.
The world is moving rapidly into a new era of disruption that we now label Industry 4.0. This is already changing the way students learn, and the way we teach, do research, and carry out our administrative work.
Prof Suresh has articulated his vision and outlined the “moonshot” projects that will meet the challenges of this new era and drive NTU’s next phase of development.
He has announced the NTU Smart Campus vision where the power of digital technology and tech-enabled solutions are harnessed to support better learning and living experiences, the discovery of new knowledge, and the sustainability of resources.
Through the NTU Smart Campus, the University will support Singapore’s SMART Nation ambitions. NTU has earned a reputation for the quality of its research but our discoveries and innovations should also achieve impact in benefitting society and contributing to the economic wellbeing of Singapore.
Our professors may not all see themselves as entrepreneurs, and they shouldn’t all try to be – that would be a narrow view of how a university’s work is translated into impact.
However, they play an undeniably instrumental role in motivating and guiding
MR KOH BOON HWEEChairman, Board of TrusteesNanyang Technological University, Singapore

THE ARC OF EXCELLENCE06 07NTU ANNUAL REPORT 2018
IN CONVERSATION WITH THE NTU PRESIDENT
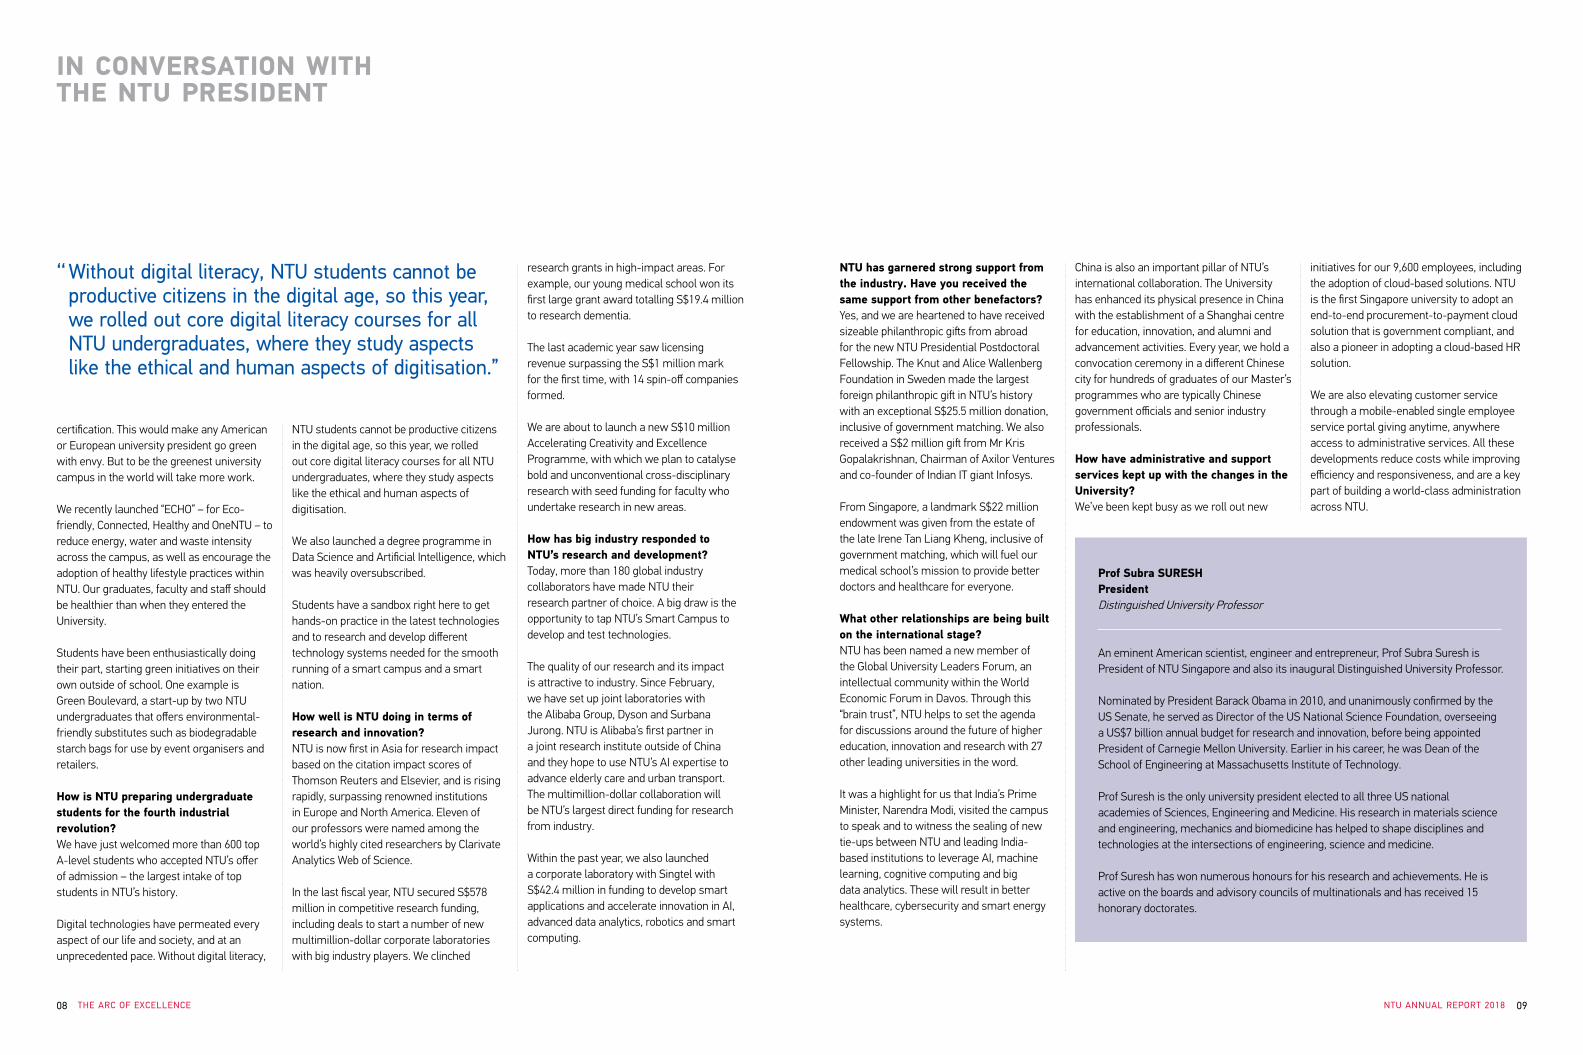
PROF SUBRA SURESHPresidentNanyang Technological University,Singapore
‘‘ As pioneers and early adopters of tomorrow’s technologies, the NTU community is serving as a model for other communities in Singapore and around the globe by demonstrating how advanced tech-enabled solutions and sound policies for
their implementation could help improve everyday life sustainably.”
A FORAY INTO NEW FRONTIERS
How will you continue to develop the talent needed to drive NTU’s next phase of major growth as a leading research university?The recruitment and retention of top talent among faculty, staff, postdocs and students remains one of our priorities in our quest to further elevate NTU as one of the greatest global universities.
We have new talent recruitment schemes, starting with the creation of 350 two-year “postdoc” positions to attract the best and the brightest young researchers worldwide.
Through expected transitions and demographic projections, we also plan to recruit 300 faculty members over the next five years. We also plan to create up to 100 new named professorships, with funding commitments for several new “Faculty Chairs” already secured. This effort will increase named professorships available at NTU many-fold in five years, providing a critically-needed mechanism to attract, nurture and retain top faculty.
After the launch of the Presidential Postdoctoral Fellowship in February to attract up-and-coming scientists and scholars to begin their academic careers at NTU, we received more than 500 applications from outstanding researchers worldwide competing for 12 fellowships.
NTU also continues to be the university of choice for exceptional young academics, with more than 400 of these top minds from around the world aspiring to be a Nanyang Assistant Professor.
What is your vision of the “NTU Smart Campus”? NTU, being a microcosm of Singapore with its lush grounds and with a university community of 40,000, is an ideal test bed for innovations that can be deployed to Singapore and the world. We’re really serious about walking the talk and testing what we’ve discovered and developed in our labs, on our own doorstep. For example, there are campus trials of Singapore’s first flash-charging electric shuttle and Singapore’s first electric bicycle-sharing service. We recently announced an ambitious plan to double the amount of electricity harnessed from solar energy by next year, compared to current levels, and to reduce net energy and water use by 35 per cent before the end of 2021, compared to the levels of 2011.
How can the NTU Smart Campus support Singapore’s Smart Nation drive?The fourth industrial revolution is transforming economies, jobs and even society itself. Many areas shaping the fourth industrial revolution are NTU’s strength areas.
NTU is already a research pioneer in environmental sciences, artificial intelligence,
and energy, water and waste research. As pioneers and early adopters of tomorrow’s technologies, the NTU community is serving as a model for other communities in Singapore and around the globe by demonstrating how advanced tech-enabled solutions and sound policies for their implementation could help improve everyday life sustainably.
A key component of this effort is not only to develop, test and adopt new technologies, but also to focus on the human, policy and societal implications of such technologies. In order to tap into the fullest strength of NTU to address societal challenges, we launched in February a university-wide initiative through the newly-created NTU Institute of Science and Technology for Humanity (NISTH). Over the next few years, NISTH will focus on three theme areas: Responsible Innovation; Governance and Leadership in the Age of Industry 4.0; and New Urban Asia.
How else is NTU walking the talk when it comes to its commitment to sustainability?Over 95 per cent of NTU’s buildings, including the halls of residence, are certified Green Mark Platinum, the equivalent of LEED
THE ARC OF EXCELLENCE08 09NTU ANNUAL REPORT 2018
IN CONVERSATION WITH THE NTU PRESIDENT
Prof Subra SURESHPresident Distinguished University Professor
An eminent American scientist, engineer and entrepreneur, Prof Subra Suresh is President of NTU Singapore and also its inaugural Distinguished University Professor.
Nominated by President Barack Obama in 2010, and unanimously confirmed by the US Senate, he served as Director of the US National Science Foundation, overseeing a US$7 billion annual budget for research and innovation, before being appointed President of Carnegie Mellon University. Earlier in his career, he was Dean of the School of Engineering at Massachusetts Institute of Technology.
Prof Suresh is the only university president elected to all three US national academies of Sciences, Engineering and Medicine. His research in materials science and engineering, mechanics and biomedicine has helped to shape disciplines and technologies at the intersections of engineering, science and medicine.
Prof Suresh has won numerous honours for his research and achievements. He is active on the boards and advisory councils of multinationals and has received 15 honorary doctorates.
‘‘ Without digital literacy, NTU students cannot be productive citizens in the digital age, so this year, we rolled out core digital literacy courses for all NTU undergraduates, where they study aspects like the ethical and human aspects of digitisation.”
certification. This would make any American or European university president go green with envy. But to be the greenest university campus in the world will take more work.
We recently launched “ECHO” – for Eco-friendly, Connected, Healthy and OneNTU – to reduce energy, water and waste intensity across the campus, as well as encourage the adoption of healthy lifestyle practices within NTU. Our graduates, faculty and staff should be healthier than when they entered the University.
Students have been enthusiastically doing their part, starting green initiatives on their own outside of school. One example is Green Boulevard, a start-up by two NTU undergraduates that offers environmental-friendly substitutes such as biodegradable starch bags for use by event organisers and retailers.
How is NTU preparing undergraduate students for the fourth industrial revolution?We have just welcomed more than 600 top A-level students who accepted NTU’s offer of admission – the largest intake of top students in NTU’s history.
Digital technologies have permeated every aspect of our life and society, and at an unprecedented pace. Without digital literacy,
NTU students cannot be productive citizens in the digital age, so this year, we rolled out core digital literacy courses for all NTU undergraduates, where they study aspects like the ethical and human aspects of digitisation.
We also launched a degree programme in Data Science and Artificial Intelligence, which was heavily oversubscribed.
Students have a sandbox right here to get hands-on practice in the latest technologies and to research and develop different technology systems needed for the smooth running of a smart campus and a smart nation.
How well is NTU doing in terms of research and innovation?NTU is now first in Asia for research impact based on the citation impact scores of Thomson Reuters and Elsevier, and is rising rapidly, surpassing renowned institutions in Europe and North America. Eleven of our professors were named among the world’s highly cited researchers by Clarivate Analytics Web of Science.
In the last fiscal year, NTU secured S$578 million in competitive research funding, including deals to start a number of new multimillion-dollar corporate laboratories with big industry players. We clinched
research grants in high-impact areas. For example, our young medical school won its first large grant award totalling S$19.4 million to research dementia.
The last academic year saw licensing revenue surpassing the S$1 million mark for the first time, with 14 spin-off companies formed.
We are about to launch a new S$10 million Accelerating Creativity and Excellence Programme, with which we plan to catalyse bold and unconventional cross-disciplinary research with seed funding for faculty who undertake research in new areas.
How has big industry responded to NTU’s research and development?Today, more than 180 global industry collaborators have made NTU their research partner of choice. A big draw is the opportunity to tap NTU’s Smart Campus to develop and test technologies.
The quality of our research and its impact is attractive to industry. Since February, we have set up joint laboratories with the Alibaba Group, Dyson and Surbana Jurong. NTU is Alibaba’s first partner in a joint research institute outside of China and they hope to use NTU’s AI expertise to advance elderly care and urban transport. The multimillion-dollar collaboration will be NTU’s largest direct funding for research from industry.
Within the past year, we also launched a corporate laboratory with Singtel with S$42.4 million in funding to develop smart applications and accelerate innovation in AI, advanced data analytics, robotics and smart computing.
NTU has garnered strong support from the industry. Have you received the same support from other benefactors?Yes, and we are heartened to have received sizeable philanthropic gifts from abroad for the new NTU Presidential Postdoctoral Fellowship. The Knut and Alice Wallenberg Foundation in Sweden made the largest foreign philanthropic gift in NTU’s history with an exceptional S$25.5 million donation, inclusive of government matching. We also received a S$2 million gift from Mr Kris Gopalakrishnan, Chairman of Axilor Ventures and co-founder of Indian IT giant Infosys.
From Singapore, a landmark S$22 million endowment was given from the estate of the late Irene Tan Liang Kheng, inclusive of government matching, which will fuel our medical school’s mission to provide better doctors and healthcare for everyone.
What other relationships are being built on the international stage?NTU has been named a new member of the Global University Leaders Forum, an intellectual community within the World Economic Forum in Davos. Through this “brain trust”, NTU helps to set the agenda for discussions around the future of higher education, innovation and research with 27 other leading universities in the word.
It was a highlight for us that India’s Prime Minister, Narendra Modi, visited the campus to speak and to witness the sealing of new tie-ups between NTU and leading India-based institutions to leverage AI, machine learning, cognitive computing and big data analytics. These will result in better healthcare, cybersecurity and smart energy systems.
China is also an important pillar of NTU’s international collaboration. The University has enhanced its physical presence in China with the establishment of a Shanghai centre for education, innovation, and alumni and advancement activities. Every year, we hold a convocation ceremony in a different Chinese city for hundreds of graduates of our Master’s programmes who are typically Chinese government officials and senior industry professionals.
How have administrative and support services kept up with the changes in the University?We’ve been kept busy as we roll out new
initiatives for our 9,600 employees, including the adoption of cloud-based solutions. NTU is the first Singapore university to adopt an end-to-end procurement-to-payment cloud solution that is government compliant, and also a pioneer in adopting a cloud-based HR solution.
We are also elevating customer service through a mobile-enabled single employee service portal giving anytime, anywhere access to administrative services. All these developments reduce costs while improving efficiency and responsiveness, and are a key part of building a world-class administration across NTU.

THE ARC OF EXCELLENCE10 11NTU ANNUAL REPORT 2018
• Official opening of The Wave, a mega sports hall that is the first large-scale development in Southeast Asia built using an innovative timber construction technology
• NTU maintains place among the world’s top three young universities in
Times Higher Education ranking
• Launch of research centre for big data analytics and artificial intelligence to pioneer new technologies for the Singapore economy
JULY 2017MAY 2017 AUGUST 2017JUNE 2017APRIL 2017 SEPTEMBER 2017
• NTU-NIE team’s Mount Everest expedition a success as trainee teacher
Nur Yusrina Ya’akob, 30, becomes the first Malay-Muslim woman from Singapore to reach the summit
• Collaboration with Danish consortium Smart City World Labs to develop technologies to improve the sustainability and liveability of cities
• 9,600 NTU students receive their degrees at 19 Convocation ceremonies; honorary degrees are conferred on photosynthesis pioneer Prof James Barber and social scientist Prof Helga Nowotny
• American scientist, engineer and entrepreneur Prof Subra Suresh is announced as the 4th President of NTU Singapore from 1 January 2018
• NTU tops QS’ list of the world’s top young universities for the fourth straight year
• Plans unveiled for more community-based activities, education-related programmes and social initiatives to benefit residents in neighbourhoods near NTU, such as the South West District
MILESTONESApril 2017 - March 2018
• Top NTU engineering programme ties up with Canada’s University of British Columbia as its fourth overseas partner
• Research partnership with ST Aerospace and Evonik on 3D printing technologies, including new methods of printing
human tissue
• NTU teams up with Fraunhofer-Gesellschaft on a new research institute to develop digital technologies to help companies move into the digital era
• NTU places 11th in QS World University Rankings, the highest position ever by a Singapore or Asian university
• Innovation centre established in Haifa to nurture innovative thinking and entrepreneurship, and to stimulate broader collaboration with Israel’s industrial players, venture capitalists and angel investors
• Collaboration with Thai petrochemical giant PTTGC to advance 3D printing materials for the automotive industry
• Research pact with Australia’s Commonwealth Scientific and Industrial Research Organisation in advanced manufacturing, health and biosecurity
• New institute launched as a centre of excellence for wealth management education in the region and beyond
• The Distinguished University Professorship is launched as the highest academic appointment in the University to recognise NTU’s most accomplished faculty who have distinguished themselves internationally, with President-Designate Prof Subra Suresh
as the inaugural recipient
• Official opening of Lee Kong Chian School of Medicine, housed in a dual campus with bespoke learning facilities
• Incoming NTU President Prof Subra Suresh unveils senior leadership team
• NTU’s Techbridge Ventures and PC Partner start a joint venture to groom Asia’s promising cleantech start-ups
• The university community and public flock to the campus for NTU Fest, featuring a carnival, walkathon, concert and showcase of NTU innovations
• Partnership with National Neuroscience Institute to develop new technologies to diagnose and treat patients with neurological conditions
THE ARC OF EXCELLENCE12 13NTU ANNUAL REPORT 2018
MILESTONES
• NTU and ENGIE deploy the nation’s first long-span wind turbine at Semakau Landfill as a sustainable energy solution
• NTU rises to Asia’s No 1 in QS Asia University Rankings
• Collaboration with IBM to develop an AI-based virtual tutor to offer
personalised learning
• Saab teams up with NTU on a joint research centre on campus to advance high-end digital technology for air traffic management and underwater robotics
• Lifelong learning scheme started for NTU alumni, where each alumnus receives S$1,600 worth of course credits for further studies at the University
OCTOBER 2017 JANUARY 2018NOVEMBER 2017 FEBRUARY 2018DECEMBER 2017 MARCH 2018
• NTU, the Land Transport Authority and JTC unveil Singapore’s first test centre for
self-driving vehicles
• Research partnership with Geriatric Education and Research Institute to enhance well-being of the elderly
• Singapore Maritime Institute and NTU launch S$15 million research centre to
find innovative and sustainable solutions for the maritime industry
• NTU and Singtel set up S$42.4 million corporate lab for artificial intelligence and data science to support Singapore’s transformation into a digital economy
• NTU’s Wealth Management Institute selected as lead training provider to design and develop programmes to equip wealth managers for new global demands
• Formally inaugurated as the fourth President of NTU Singapore, Prof Suresh sets out his vision for NTU’s future and reaffirms its values as a great global research university
• NTU Institute of Science and Technology for Humanity announced as a key initiative to study the impact of technological advancement on society
• Launch of Presidential Postdoctoral Fellowship to recruit the best early-career scientists around the world
• NTU retains position among Asia’s top 5 universities in Times Higher Education Asia University Rankings
• NTU’s second learning hub, The Arc, a sustainable building with 56 smart classrooms, officially opens
• Partnership with DBS to groom wealth management talent through a new Applied Wealth Management track for undergraduates
• Annual graduate employment survey finds fresh NTU graduates earning higher starting salaries than the 2016 cohort; nine in 10 NTU graduates found a job within six months of their final examinations
• Plans unveiled to make NTU a Smart Campus that uses digital technology and tech-enabled solutions to support better learning and living experiences, the discovery of new knowledge, and the sustainability of resources
• For third straight year, NTU rises in Financial Times’ global MBA ranking, placing 22nd; 98 per cent of Nanyang MBA graduates employed within three months of graduation, the highest among the world’s top 25 business schools
• Partnership with Volvo to jointly develop and test autonomous electric buses in Singapore
• Partnership with Changi General Hospital on new Graduate Diploma in Sports Medicine programme to train medical practitioners in ageing and sports-related injuries
• Collaboration with Desay SV to develop cyber security solutions to mitigate threats faced by the automotive industry
• NTU launches nationwide research initiative to promote lung health, spearheaded by the Lee Kong Chian School of Medicine
• Wee Kim Wee School of Communication & Information celebrates silver anniversary
• Singapore’s first robot masseuse, EMMA, created by an NTU startup, begins work at a traditional Chinese medicine clinic
• NTU joins hands with National Healthcare Group and Dover Park Hospice to boost palliative care research and education through a new joint centre
• In partnership with M1, NTU embarks on Singapore’s first comprehensive research study on the use of 4.5G HetNet for secure drone operations
• Tie-up with BlueSG to launch Singapore’s first ultra-fast-charging electric shuttle with on-campus trials
• Launch of Master of Arts in Museum Studies and Curatorial Practices to support arts and heritage sector
• Alibaba Group and NTU unveil multimillion-dollar research institute on artificial intelligence, Alibaba’s first joint research lab outside China
• Record number of employers offer 4,000 jobs and internship opportunities at NTU Career Fair 2018, where a new mentorship programme is launched
• Extension of a multimillion-dollar partnership in air traffic management research with Civil Aviation Authority of Singapore to develop next-generation air traffic management solutions
April 2017 - March 2018
THE ARC OF EXCELLENCE14 15NTU ANNUAL REPORT 2018
BOARD OF TRUSTEES
Mr KOH Boon Hwee (Chairman)
ChairmanCredence Partners Pte LtdAppointed on 28 March 2006
Prof Gene D BLOCK
Chancellor University of California, Los Angeles Appointed on 1 January 2018
Ms CHAN Lai Fung
Permanent Secretary (Education)Ministry of Education Appointed on 1 April 2012
Mr LIM Chow Kiat
Chief Executive OfficerGIC Pte LtdAppointed on 1 April 2015
Ms LIEN Siaou-Sze
Senior Executive Coach Mobley Group Pacific (An Associate of RHR International)Appointed on 28 March 2006
Mr LIM Chuan Poh
Chairman Agency for Science, Technology and Research Appointed on 28 March 2006
Mr LOW Check Kian
Director Cluny Park Capital Pte Ltd Appointed on 1 April 2014
Mr Inderjit SINGH Dhaliwal
Chief Executive Officer Solstar International Pte Ltd Appointed on 28 March 2006
Mr TAN Chin Hwee
Chief Executive Officer, Asia Pacific Trafigura Pte LtdAppointed on 1 April 2015
Mr WONG Yew Meng
Board Member People’s Association Appointed on 1 August 2010
Mr ZAINUL ABIDIN Rasheed
Non-Resident Ambassador to KuwaitMinistry of Foreign AffairsAppointed on 1 April 2017
Prof Alexander JB ZEHNDER
Chairman Triple Z Ltd Appointed on 25 August 2009
Prof Sir Leszek BORYSIEWICZ
Chairman Cancer Research UK Appointed on 1 February 2018
Prof Subra SURESH
President Nanyang Technological University, Singapore Appointed on 1 January 2018
Mr GOH Sin Teck
EditorLianhe Zaobao & Lianhe Wanbao Appointed on 1 June 2012
Dr LEE Shiang Long
President Singapore Technologies Kinetics LtdAppointed on 15 September 2017
Mrs LEE Suet Fern
PartnerMorgan Lewis Stamford LLC Chair, International Leadership Team Morgan, Lewis & Bockius LLPAppointed on 15 July 2006
As at 31 July 2018

THE ARC OF EXCELLENCE16 17NTU ANNUAL REPORT 2018
UNIVERSITY LEADERSHIP
Prof LAM Khin YongVice President(Research) Appointed on 1 May 2014• Acting Provost (1 October – 31 December 2017 & 27 October – 5 December 2014)• ChiefofStaff (1 July 2011 – 31 December 2017)• ChiefofStaff-Designate (1 April – 30 June 2011)• Associate Provost (Graduate Education & Special Projects) (1 April 2008 – 30 June 2011)• Chair, School of Mechanical & Aerospace Engineering (1 August 2006 – 30 April 2008)
As at 31 July 2018
Ms TAN Aik NaVice President(Administration)Appointed on 1 January 2018• ChiefAdministrationOfficer (1 April – 31 December 2017)• ChiefFinancialOfficer (1 January – 31 December 2017)• ChiefFinancialOfficer-Designate (3 August – 31 December 2016)
Prof Alan CHANVice President(Alumni & Advancement)Appointed on 1 January 2018• Dean, College of Humanities, Arts, & Social Sciences (1 October 2009 – 30 June 2018)
PRESIDENT’S COUNCIL
Prof LING San Provost and Vice President(Academic) Appointed on 1 January 2018• Dean, College of Science (1 August 2011 – 31 December 2017)• Chair, School of Physical & Mathematical
Sciences (1 April 2008 – 31 December 2010)• Head, Division of Mathematical Sciences,
School of Physical & Mathematical Sciences
(1 July 2005 – 31 March 2008)
Prof Subra SURESHPresidentAppointed on 1 January 2018
UNIVERSITY LEADERSHIP COUNCIL
The University Leadership Council comprises the President’s Council and the following members in alphabetical order:
ACADEMIC APPOINTMENTS
Prof James BESTDean, Lee Kong Chian School of MedicineAppointed on 29 July 2014
Prof CHEE Yeow MengInterim Dean, College of ScienceAppointed on 1 January 2018• Chair, School of Physical & Mathematical Sciences (1 July 2011 – 31 December 2017)• Acting Chair, School of Physical & Mathematical Sciences (1 January – 30 June 2011)• Co-Director, Fraunhofer IDM@NTU (1 June 2010 – 31 May 2015)• Head, Division of Mathematical Sciences,
School of Physical & Mathematical Sciences (1 April 2008 – 31 December 2010)
Prof Christine GOHDirector, National Institute of EducationAppointed on 1 July 2018• Dean,OfficeofGraduateStudies&
Professional Learning, National Institute of Education (1 July 2014 – 30 June 2018)• AssociateDean,OfficeofGraduate
Studies & Professional Learning, National Institute of Education (1 July 2010 – 30 June 2014)• Associate Dean, Graduate Programmes &ResearchOffice, National Institute of Education (1 January 2009 – 30 June 2010)• Associate Dean-Designate, GraduateProgrammes&ResearchOffice, National Institute of Education (1 September – 31 December 2008)• Deputy Head, English Language & Literature Academic Group, National Institute of Education (1 January – 31 December 2008)
Prof Robert KENNEDY Dean, College of Business(Nanyang Business School)Appointed on 1 January 2018
Prof Joseph LIOW Dean, College of Humanities, Arts, & Social Sciences, and Dean, S Rajaratnam School of International StudiesAppointed on 1 July 2018 and 3 November 2014 respectively• Associate Dean, S Rajaratnam School of International Studies (1 July 2008 – 2 November 2014)
Prof Louis PHEEDean, College of EngineeringAppointed on 1 June 2018• Interim Dean, College of Engineering (16 September 2017 – 31 May 2018)• Chair, School of Mechanical & Aerospace Engineering (1 July 2014 – 15 September 2017)• Head, Division of Mechatronics & Design,
School of Mechanical & Aerospace Engineering (1 July 2013 – 30 June 2014)
Prof TING Seng KiongDean, College of Professional & Continuing EducationAppointed on 3 May 2016
ADMINISTRATIVE APPOINTMENTS
Mr CHAN Kwong LokChief Planning Officer/RegistrarAppointed on 1 July 2010
Mr Gregory CHEWChief Legal Officer, Legal & Secretarial Office Appointed on 2 July 2018
Dr Vivien CHIONGChief Communication OfficerAppointed on 1 July 2014• Director, Corporate CommunicationsOffice (4 May 2010 – 30 June 2014)
Dr LIM JuiChief Executive Officer, NTUitiveAppointed on 1 February 2018• ChiefExecutiveOfficer (NTUInnovation),President’sOffice (1 February 2013 – 31 January 2018)
Mr Alvin ONG Chief Information OfficerAppointed on 23 October 2017
Mr ONG Eng HockChief Financial OfficerAppointed on 1 January 2018• Head, NTU Shared Services (22 March – 31 December 2017)
HEADS OF AUTONOMOUS INSTITUTES
Prof James BESTDean, Lee Kong ChianSchool of MedicineAppointment details as above
Ms FOO Mee HarChief Executive Officer, Wealth Management Institute Appointed on 1 July 2017
Prof Christine GOHDirector, National Institute of EducationAppointment details as above
Prof Staffan KJELLEBERGDirector, Singapore Centre for Environmental Life Sciences EngineeringAppointed on 1 January 2011
Ambassador ONG Keng YongExecutive Deputy Chairman, S Rajaratnam School of International StudiesAppointed on 3 November 2014• Director, Institute of Defence & Strategic Studies (from 3 November 2014)
Prof Kerry SIEHDirector, Earth Observatory of SingaporeAppointed on 1 July 2008
THE ARC OF EXCELLENCE18 19NTU ANNUAL REPORT 2018
UNIVERSITY LEADERSHIP
DONORS
GiftstotheUniversitycontinuetoimpactthe future. In FY2017 and beyond, NTU drew strong philanthropic support, with donorssharingitsvisiontouplifteducation,research and the larger society through the University’s programmes. This support was also aligned with NTU’s thrusts in healthcare, sustainability, security, innovation as well as arts, culture and heritage.
The gifts include:• Over S$12.2 million from Aranda
Investments Pte Ltd for NTU’s Wealth ManagementInstitute.Thegiftsupports the Institute’s objectives to develop mastery of wealth and asset management in Singapore and the rest of Asia, and to deepen the skills
and expertise of professionals in the fieldthroughcontinuingprofessionaleducation, research, forums and consulting services.
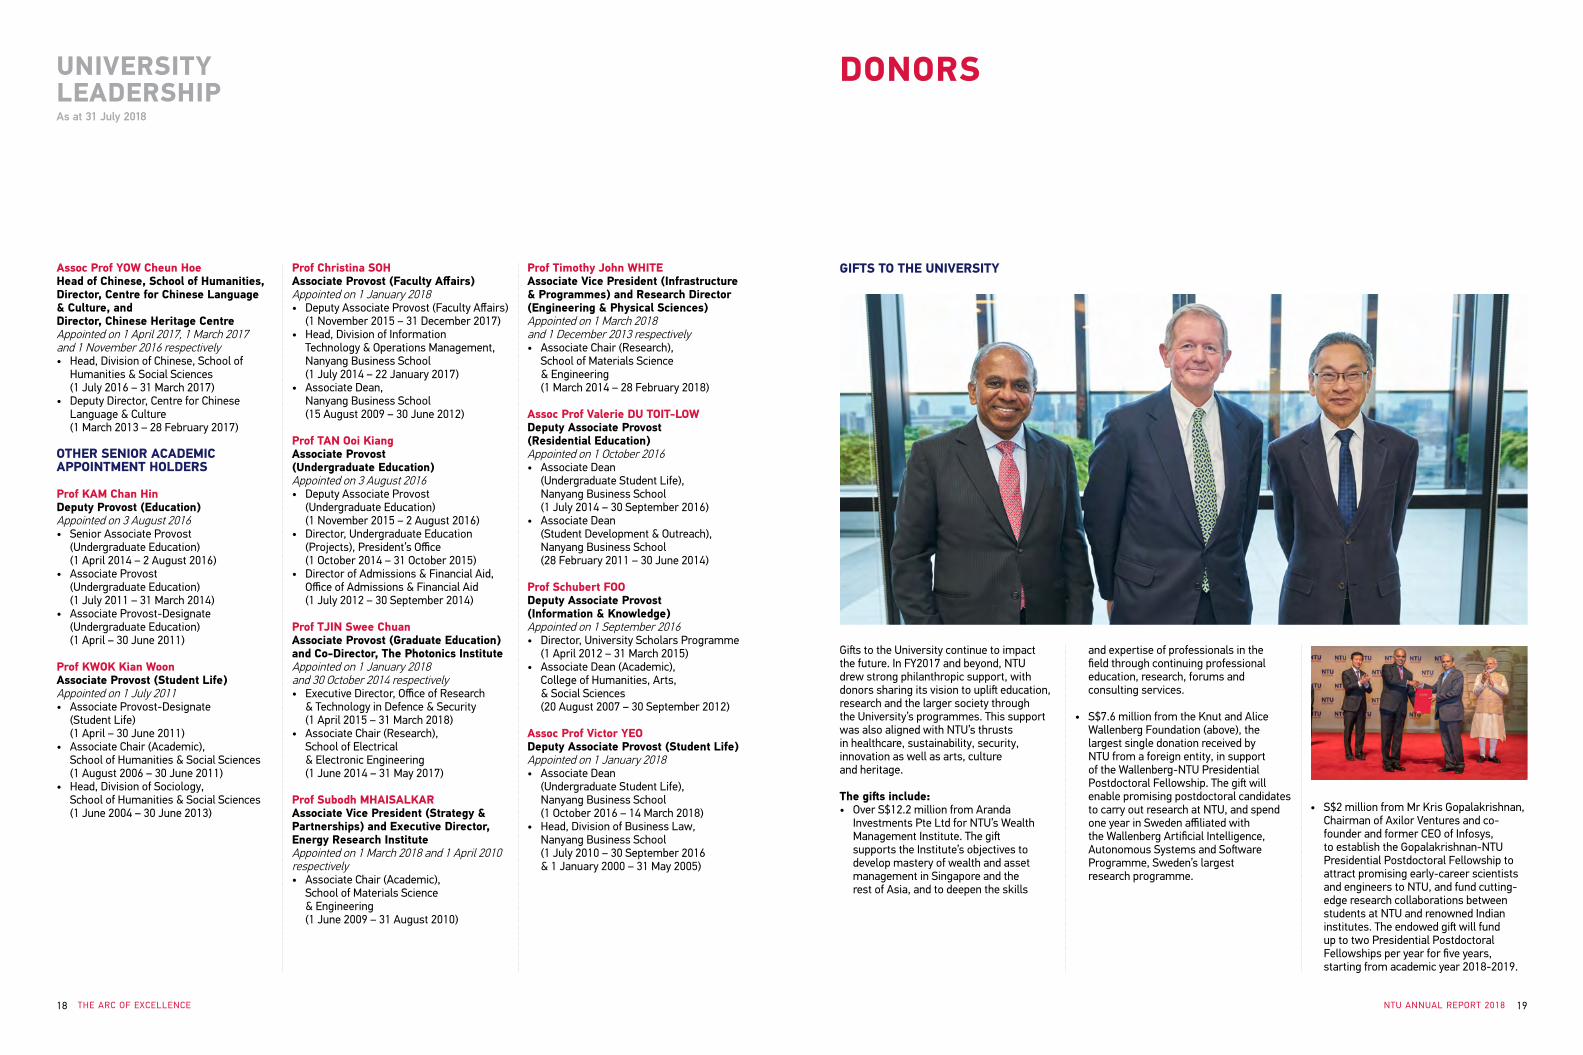
• S$7.6 million from the Knut and Alice Wallenberg Foundation (above), the largest single donation received by NTU from a foreign entity, in support of the Wallenberg-NTU Presidential PostdoctoralFellowship.Thegiftwillenable promising postdoctoral candidates to carry out research at NTU, and spend oneyearinSwedenaffiliatedwiththeWallenbergArtificialIntelligence,AutonomousSystemsandSoftwareProgramme, Sweden’s largest
research programme.
• S$2 million from Mr Kris Gopalakrishnan, Chairman of Axilor Ventures and co-founder and former CEO of Infosys, to establish the Gopalakrishnan-NTU Presidential Postdoctoral Fellowship to attract promising early-career scientists and engineers to NTU, and fund cutting-edge research collaborations between students at NTU and renowned Indian institutes.Theendowedgiftwillfundup to two Presidential Postdoctoral Fellowshipsperyearforfiveyears,starting from academic year 2018-2019.
As at 31 July 2018
GIFTS TO THE UNIVERSITYAssoc Prof YOW Cheun HoeHead of Chinese, School of Humanities,Director, Centre for Chinese Language & Culture, andDirector, Chinese Heritage CentreAppointed on 1 April 2017, 1 March 2017and 1 November 2016 respectively• Head, Division of Chinese, School of
Humanities & Social Sciences (1 July 2016 – 31 March 2017)• Deputy Director, Centre for Chinese
Language & Culture (1 March 2013 – 28 February 2017)
OTHER SENIOR ACADEMIC APPOINTMENT HOLDERS
Prof KAM Chan HinDeputy Provost (Education)Appointed on 3 August 2016• Senior Associate Provost (Undergraduate Education) (1 April 2014 – 2 August 2016)• Associate Provost (Undergraduate Education) (1 July 2011 – 31 March 2014)• Associate Provost-Designate
(Undergraduate Education) (1 April – 30 June 2011)
Prof KWOK Kian WoonAssociate Provost (Student Life)Appointed on 1 July 2011• Associate Provost-Designate (Student Life) (1 April – 30 June 2011)• Associate Chair (Academic), School of Humanities & Social Sciences (1 August 2006 – 30 June 2011)• Head, Division of Sociology, School of Humanities & Social Sciences (1 June 2004 – 30 June 2013)
Prof Christina SOHAssociate Provost (Faculty Affairs)Appointed on 1 January 2018• DeputyAssociateProvost(FacultyAffairs) (1 November 2015 – 31 December 2017)• Head, Division of Information Technology & Operations Management,
Nanyang Business School (1 July 2014 – 22 January 2017)• Associate Dean, Nanyang Business School (15 August 2009 – 30 June 2012)
Prof TAN Ooi Kiang Associate Provost (Undergraduate Education)Appointed on 3 August 2016• Deputy Associate Provost (Undergraduate Education) (1 November 2015 – 2 August 2016)• Director, Undergraduate Education (Projects),President’sOffice
(1 October 2014 – 31 October 2015)• Director of Admissions & Financial Aid, OfficeofAdmissions&FinancialAid
(1 July 2012 – 30 September 2014)
Prof TJIN Swee ChuanAssociate Provost (Graduate Education) and Co-Director, The Photonics InstituteAppointed on 1 January 2018 and 30 October 2014 respectively• ExecutiveDirector,OfficeofResearch & Technology in Defence & Security (1 April 2015 – 31 March 2018)• Associate Chair (Research), School of Electrical & Electronic Engineering (1 June 2014 – 31 May 2017)
Prof Subodh MHAISALKAR Associate Vice President (Strategy & Partnerships) and Executive Director, Energy Research InstituteAppointed on 1 March 2018 and 1 April 2010 respectively• Associate Chair (Academic), School of Materials Science & Engineering (1 June 2009 – 31 August 2010)
Prof Timothy John WHITEAssociate Vice President (Infrastructure & Programmes) and Research Director (Engineering & Physical Sciences)Appointed on 1 March 2018 and 1 December 2013 respectively• Associate Chair (Research), School of Materials Science & Engineering (1 March 2014 – 28 February 2018)
Assoc Prof Valerie DU TOIT-LOWDeputy Associate Provost (Residential Education)Appointed on 1 October 2016• Associate Dean (Undergraduate Student Life), Nanyang Business School (1 July 2014 – 30 September 2016)• Associate Dean (Student Development & Outreach),
Nanyang Business School (28 February 2011 – 30 June 2014)
Prof Schubert FOODeputy Associate Provost (Information & Knowledge)Appointed on 1 September 2016• Director, University Scholars Programme (1 April 2012 – 31 March 2015)• Associate Dean (Academic), College of Humanities, Arts, & Social Sciences (20 August 2007 – 30 September 2012)
Assoc Prof Victor YEODeputy Associate Provost (Student Life)Appointed on 1 January 2018• Associate Dean (Undergraduate Student Life), Nanyang Business School (1 October 2016 – 14 March 2018)• Head, Division of Business Law, Nanyang Business School (1 July 2010 – 30 September 2016 & 1 January 2000 – 31 May 2005)
THE ARC OF EXCELLENCE20
DONORS
• S$1 million from Peng Da International Pte Ltd to support a research project, “Intravenous Infusion for Blocking Heroin or Morphine Addiction for Patients”.Thefive-yearprojectwillestablish metabolomics and proteomics profilingofdrug-cellinteractionstoidentifybiomarkersfordrugefficacy,andinvestigate drug metabolism in the liver cell culture system.
• More than S$1.3 million from Temasek Foundation Connects CLG Limited to support the Temasek Regional Regulators Scholarship Programme, which will award scholarships to Asian centralbankersandfinancialregulatorswho want to participate in NTU’s Wealth ManagementProgramme.Thegiftwilldevelop the capabilities of industry professionalsandpromisingofficers
fromregionalbanksandfinancialregulatory institutions.
• S$750,000 from Zhong Feng International Development Pte Ltd to support a research project, “P²biotics for Healthy Living”, conducted by the NTU Food Science and Technology Programme
to make the production of probiotics drinks more sustainable through fermentation technology.
• S$502,000 from Lubritrade Trading Pte Ltd, a sales and distribution company for fast-moving consumer goods, to launch the Lubritrade Scholarship, which will support up to three undergraduates
per academic year with a S$10,000 award each.
• S$500,000 from Dyson Operations Pte Ltd to establish the Dyson-NTU Studio, Dyson’sfirston-campusengineeringstudio in Asia. The studio at NTU aims to encourage creativity and an interest in engineering and innovation, as well as support internships and graduate hires in the science, technology, engineering and mathematics professions.
BENEFACTORS(1 April 2017 to 31 March 2018) S$1 MILLION AND ABOVE• Aranda Investments Pte Ltd• Peng Da International Pte Ltd• SCORReinsuranceAsia-PacificPteLtd• Temasek Foundation Connects CLG Limited
S$500,000 AND ABOVE• Dyson Operations Pte Ltd• Lubritrade Trading Pte Ltd• NIE International Pte Ltd• Temasek Foundation International CLG Limited• Zhong Feng International Development Pte Ltd
S$250,000 AND ABOVE• AonBenfieldAsiaPteLtd• MSIG Insurance (Singapore) Pte Ltd• RGE Pte Ltd• Risk Management Solutions Inc• SWTS Pte Ltd
S$100,000 AND ABOVE• Bayer AG• Bengawan Solo Pte Ltd• Chue Wai Seen & Chan Mee Yee• CJ International Asia Pte Ltd• Delta Wilmar CIS LLC• Dole Asia Holdings Pte Ltd• Dong Liyuan• Emilia Said• ExxonMobilAsiaPacificPteLtd• Genk Capital Pte Ltd• Glencore Agriculture Pte Ltd• Kam Boon Hee, Kenneth• Lee Foundation Singapore• Lembaga Biasiswa Kenangan Maulud• Leow Joo Teng & Chang Choon Har• Mitsui&Co(AsiaPacific)PteLtd• MM2 Asia Ltd
• Nanyang International Club• Ng Foundation Limited• Prosperity Steel United Singapore Pte Ltd• QAF Limited• Sim Bee Lim• Singapore Leong Khay Huay Kuan• SummitAsiaPacificPteLtd• Teh Kiu Cheong• The Great Eastern Life Assurance
Company Limited• Toptip Holding Pte Ltd• Trustees of the Estate of Mdm Chong Siew Neo
S$50,000 AND ABOVE• Bertil Andersson• Ho Bee Foundation• Malayan Banking Berhad• Max Lewis Scholarship Fund• MM2 Entertainment Pte Ltd• SCOR UK Company Ltd• Sudhir Gupta• The International Institute for
Environment & Development• Theodore Charles Swartz
S$25,000 AND ABOVE• Asia Culture Communications Pte Ltd• Info-communications Media Development Authority• Jenny Toh Bee Teng• Lee Say Seng• Lee Soo Hiang, Madeleine• Lien Lian Sze• Nexia TS Pte Ltd• Professional Engineers Board Singapore• Singapore Sogetsu Association• Singapore Totalisator Board• Tan Chin Hwee• Tan Joo Kee Scholarship Fund• Teo Soon Chye, Anthony• Terence Foo Jie Yew• Thomas Foo Jie Wen
22 Corporate Governance
25Trustees’ Statement
27 Independent Auditor’s Report
FINANCIAL REVIEW
30Statements of Financial Position
32Consolidated Statement of Profit or Loss and other Comprehensive Income
34Statements of Changes in Funds and Reserves
36Consolidated Statement of Cash Flows
38Notes to Financial Statements

THE ARC OF EXCELLENCE22 23NTU ANNUAL REPORT 2018
CORPORATEGOVERNANCE
INTRODUCTION
In April 2006 under the Nanyang Technological University (Corporatisation) Act (Cap. 192A) (“NTU Act”), NTU was corporatised from a statutory board to a not-for-profit company limited by guarantee (Reg. No. 200604393R) formed under the Companies Act (Cap. 50) of Singapore. The governance of the University takes place within the NTU Act and the University’s Constitution.
NTU is committed to high standards of corporate governance, professionalism, integrity, transparency and commitment at all levels, underpinned by strong internal controls and risk management systems.
GOVERNANCE EVALUATION CHECKLIST
In addition to the application of good governance practices as a company and registered charity (Reg. No 01955), we have, as an institution of public character (“IPC”), adopted best practices in key areas of governance that are closely aligned to the principles and guidelines in the Code of Governance for Charities and Institutions of a Public Character (the “Code”). In line with the disclosure requirement by the Charity Council that all IPCs are required to disclose the extent of their compliance with the Code, NTU’s Governance Evaluation Checklist can be found at the Charity Portal website (www.charities.gov.sg).
BOARD OF TRUSTEES
The NTU Board of Trustees is the highest governing organ within the University’s governance framework. The Board comprises 17 members appointed by the Minister for Education, and is chaired by Mr Koh Boon Hwee. Our Board of Trustees includes eminent business leaders, academics, alumni, entrepreneurs and professionals from the public service and private sectors. Each member is appointed on the strength of his/her calibre, experience, stature and ability to contribute to NTU, and brings with him/her independent judgment on issues of strategy, performance, resource allocation and risk and compliance, as well as valuable relationships and networks that are essential for the growth of NTU.
The Board of Trustees is responsible for ensuring that the University acts in the furtherance of its objectives in education and research, and properly accounts for and safeguards the funds and assets of the University. The Board of Trustees works closely with the Management and stakeholders of the University to shape the vision, chart the major directions, and develop programmes and initiatives to produce a strong and enduring impact for the University, and for Singapore and beyond. The Board also approves the annual budget, the use of the University’s operating reserves and the annual audited financial statements of NTU, among other responsibilities.
The NTU Board of Trustees has in place a framework with systems and processes for an effective Board based on the following governance principles and practices:
1. Effective recruitment and induction of Trustees. The Nominating Committee is delegated the responsibility of recommending suitable candidates and has in place an induction programme comprising interactive briefing sessions. In addition, a Board Manual is available.
2. Board Committees are structured to assist the Board to fulfil its governance role, tapping each Trustee’s competencies, skills and experience.
3. The Board works with Management to set the vision, mission and strategy of NTU.
4. The Board has an executive succession plan tailored to reflect NTU’s current strategy and organisation.
5. The Board has a system for effective consultation and decision-making with executive sessions and board meetings scheduled in advance, professional expertise advice available, internal guidelines and procedures for conduct of board meetings and obtaining board approvals via circulation, and a Trustees’ portal as a secured web-based resource centre for information relevant to the Board.
CORPORATEGOVERNANCE
6. The Board evaluates and reviews its own performance and has appointed an independent third party to collate and analyse the returns of the Trustees.
7. The Board delineates roles and responsibilities between Board and Management. All members of the Board, including the Chairman, are non-executive with the exception of the President of NTU. This ensures Board independence from Management.
8. The Board has a rotation plan for continuous self-renewal, with staggering of Trustees’ terms to ensure continuity. There are policies and procedures for nomination and retirement of Trustees to ensure a formal board nomination and election.
BOARD COMMITTEES
Seven Board Committees and one Advisory Committee have been established to support the Board. These are the Academic Affairs Committee, Alumni and Development Committee, Audit and Risk Committee, Finance Committee, Investment Committee, Nominating Committee, Remuneration Committee and Campus Planning Advisory Committee.
The roles of the Board and Advisory Committees are briefly described below:
• The Academic Affairs Committee provides oversight and policy guidance for and directly supports the academic concerns of the University as well as the management of faculty and related matters.
• The Alumni and Development Committee provides oversight of issues relating to the advancement of the University as a great university founded on science and technology and its relationship with its students, alumni and external communities.
• The Audit and Risk Committee oversees the University’s internal controls, financial reporting and enterprise risk management.
• The Finance Committee provides oversight of the financial management of the University.
• The Investment Committee oversees the management and investment of the funds of the University.
• The Nominating Committee nominates suitable persons to serve on the Board and committees.
• The Remuneration Committee provides oversight and policy guidance in employee compensation matters.
• The Campus Planning Advisory Committee provides oversight and advice on the implementation of the campus master plan.
The Committees operate based on the principle of delegated authority from the Board and are required to observe their respective Terms of Reference as set by the Board. The Terms of Reference of each of these Committees set out the role, powers and rules applicable to these Committees. Where necessary, non-Board members who have expertise in their respective fields are also co-opted to enhance the deliberations and decision-making process of some of the Board Committees.

THE ARC OF EXCELLENCE24 25NTU ANNUAL REPORT 2018
CORPORATEGOVERNANCE
UNIVERSITY LEADERSHIP
The President is the University’s Chief Executive Officer. He is accountable to the Board for the conduct, coordination and quality of all of NTU’s programmes and for its future development. He has the authority to perform all acts that are necessary to give effect to the policies and statutes of the Board.
Forming the core leadership team of the University together with the President are four vice presidents. The Provost and Vice President (Academic) is the Chief Academic Officer and is responsible for the University’s academic endeavours and development. This includes graduate and undergraduate education, faculty development, student life and external academic liaison. The Vice President (Research) guides NTU’s university-wide research agenda and its implementation. His responsibilities include research planning and policy development, research funding strategies and research infrastructure development. The Vice President (Administration) leads the staff functions that enable the seamless delivery of the University’s academic and research priorities, including key initiatives around customer journeys that improve employee engagement, organisation capabilities and operational effectiveness. The Vice President (Alumni and Advancement) leads the University’s alumni engagement and advancement efforts, and develops NTU’s global presence.
POLICIES TO MANAGE CONFLICT OF INTEREST
Members of the Board of Trustees and staff are required in their respective capacities to act at all times in the best interest of the University. Clear policies and procedures are designed to prevent and address potential conflict-of-interest situations while promoting ethical business conduct of faculty and staff.
Trustees have a fiduciary duty not to allow themselves to get into a position where there is a conflict between what they ought to do for NTU and what they might do for themselves. The NTU Board of Trustees subscribes to a code of conduct to uphold a high standard of integrity and commitment in serving the University and in the event of a conflict of interest, members of the Board shall recuse themselves from decisions where such a conflict exists.
In addition, NTU’s Constitution contains provisions for the management and avoidance of conflicts of interest by members of its Board of Trustees. Such provisions include (a) permitting a Board member to be interested in any transaction with NTU provided that the member has declared the nature of the interest to the Board of Trustees and abstains from participating in the Board’s decision in respect of the transaction concerned, (b) permitting a Board member, or a firm associated with the member, to act in any professional capacity for the University and to be remunerated for professional services as if the Board member was not a Trustee, and (c) permitting a Board member to be reimbursed for out-of-pocket expenses, travelling and other expenses properly incurred by the Board member in attending and returning from meetings of the Board of Trustees, any of its committees, or any general meeting of the University or otherwise in connection with the affairs of the University. NTU’s Constitution expressly stipulates that Board members shall not receive any remuneration for services rendered by them as members of the Board of Trustees.
Under the University Code of Conduct, faculty and staff owe their primary professional allegiance to the University. To protect the University and its mission, all faculty and staff must comply with policies on conflict of interest as laid down from time to time. The current Policy requires faculty and staff to ensure that their private activities and interests do not conflict with their professional obligations to the University. They should take care to avoid conflict between their own personal interests and the interests of the University and should avoid or withdraw from situations where there may be a perception of such conflict. Where there is potential violation of the Policy, the faculty or staff shall fully and frankly disclose the nature and extent of their interest to the University as soon as possible.
TRUSTEES’ STATEMENT
The Board of Trustees present their statement to the members together with the audited consolidated financial statements of Nanyang Technological University (the “University Company”) and its subsidiaries (collectively the “Group”) and statement of financial position and statement of changes in funds and reserves of the University Company for the financial year ended 31 March 2018.
In the opinion of the Trustees:
(a) the consolidated financial statements of the Group and the statement of financial position and statement of changes in funds and reserves of the University Company as set out on pages 30 to 87 are drawn up so as to give a true and fair view of the financial position of the Group and of the University Company as at 31 March 2018, and the financial performance, changes in funds and reserves and cash flows of the Group and the changes in funds and reserves of the University Company for the financial year then ended; and
(b) at the date of this statement, there are reasonable grounds to believe that the University Company will be able to pay its debts when they fall due.
TRUSTEES
The Trustees of the University Company in office at the date of this report are:
Mr Koh Boon Hwee (Chairman)Mrs Lee Suet FernMs Lien Siaou-SzeMr Lim Chuan PohMr Inderjit SinghProf Alexander J.B. ZehnderMr Wong Yew MengMs Chan Lai FungMr Goh Sin TeckMr Low Check KianMr Tan Chin HweeMr Lim Chow KiatMr Zainul Abidin Bin M RasheedDr Lee Shiang Long (Appointed on 15 September 2017)Prof Gene D. Block (Appointed on 1 January 2018)Prof Subra Suresh (Appointed on 1 January 2018)Prof Sir Leszek Borysiewicz (Appointed on 1 February 2018)
Prof Bertil Andersson retired as Trustee of the University Company on 31 December 2017.Mr Ernest Wong and Sir Keith O’Nions retired as Trustees of the University Company on 31 March 2018.
TRUSTEES’STATEMENT

THE ARC OF EXCELLENCE26 27NTU ANNUAL REPORT 2018
ARRANGEMENTS TO ENABLE TRUSTEES TO ACQUIRE SHARES AND DEBENTURES
Neither at the end of the financial year nor at any time during the financial year did there subsist any arrangement whose object is to enable the Trustees of the University Company to acquire benefits by means of the acquisition of shares or debentures in the University Company or any other body corporate.
TRUSTEES’ INTERESTS IN SHARES AND DEBENTURES
The Trustees of the University Company at the end of the financial year have no financial interest in the share capital (including any share options) and debentures of the University Company’s related corporations as recorded in the register of the directors’ shareholdings kept by the University Company’s related corporations under Section 164 of the Singapore Companies Act.
As the University Company is limited by guarantee and not having a share capital, there are no matters to be disclosed under Section 201(6)(g), Section 201(6A)(h), Section 201(11) and Section 201(12) of the Singapore Companies Act, Chapter 50.
AUDITORS
The auditors, Deloitte & Touche LLP, have expressed their willingness to accept re-appointment.
ON BEHALF OF THE BOARD OF TRUSTEES
Mr Koh Boon HweeChairman of the Board of TrusteesTrustee
Prof Subra SureshPresident of Nanyang Technological UniversityTrustee
16 August 2018
TRUSTEES’STATEMENT
REPORT ON THE AUDIT OF THE FINANCIAL STATEMENTS
OPINION
We have audited the accompanying financial statements of Nanyang Technological University (the “University Company”) and its subsidiaries (“the Group”) which comprise the consolidated statement of financial position of the Group and the statement of financial position of the University Company as at 31 March 2018, and the consolidated statement of profit or loss and other comprehensive income, statement of changes in funds and reserves and statement of cash flows of the Group and the statement of changes in funds and reserves of the University Company for the financial year then ended, and a summary of significant accounting policies and other explanatory information, as set out on pages 30 to 87.
In our opinion, the accompanying consolidated financial statements of the Group and the statement of financial position and statement of changes in funds and reserves of the University Company are properly drawn up in accordance with the provisions of the Companies Act, Chapter 50 (the “Act”), the Singapore Charities Act, Chapter 37 and other relevant regulations (the “Charities Act and Regulations”) and Financial Reporting Standards in Singapore (“FRSs”) so as to give a true and fair view of the consolidated financial position of the Group and the financial position of the University Company as at 31 March 2018 and of the consolidated financial performance, consolidated changes in funds and reserves and consolidated cash flows of the Group and of the changes in funds and reserves of the University Company for the year ended on that date.
BASIS FOR OPINION
We conducted our audit in accordance with Singapore Standards on Auditing (“SSAs”). Our responsibilities under those standards are further described in the Auditor’s Responsibilities for the Audit of the Financial Statements section of our report. We are independent of the Group in accordance with the Accounting and Corporate Regulatory Authority (“ACRA”) Code of Professional Conduct and Ethics for Public Accountants and Accounting Entities (“ACRA Code”) together with the ethical requirements that are relevant to our audit of the financial statements in Singapore, and we have fulfilled our other ethical responsibilities in accordance with these requirements and the ACRA Code. We believe that the audit evidence we have obtained is sufficient and appropriate to provide a basis for our opinion.
INFORMATION OTHER THAN THE FINANCIAL STATEMENTS AND AUDITOR’S REPORT THEREON
Management is responsible for the other information. The other information obtained at the date of this auditor’s report is the Trustees’ Statement but does not include the financial statements and our auditor’s report thereon. Our opinion on the financial statements does not cover the other information and we do not express any form of assurance conclusion thereon.
In connection with our audit of the financial statements, our responsibility is to read the other information and, in doing so, consider whether the other information is materially inconsistent with the financial statements or our knowledge obtained in the audit, or otherwise appears to be materially misstated.
If, based on the work we have performed on the other information obtained prior to the date of this auditor’s report, we conclude that there is a material misstatement of this other information, we are required to report that fact. We have nothing to report in this regard.
INDEPENDENTAUDITOR’S REPORTTO THE BOARD OF TRUSTEES OF NANYANG TECHNOLOGICAL UNIVERSITY

THE ARC OF EXCELLENCE28 29NTU ANNUAL REPORT 2018
RESPONSIBILITIES OF MANAGEMENT AND TRUSTEES FOR THE FINANCIAL STATEMENTS
Management is responsible for the preparation of financial statements that give a true and fair view in accordance with the provisions of the Act, the Charities Act and FRSs, and for devising and maintaining a system of internal accounting controls sufficient to provide a reasonable assurance that assets are safeguarded against loss from unauthorised use or disposition; and transactions are properly authorised and that they are recorded as necessary to permit the preparation of true and fair financial statements and to maintain accountability of assets.
In preparing the financial statements, management is responsible for assessing the Group’s ability to continue as a going concern, disclosing, as applicable, matters related to going concern and using the going concern basis of accounting unless management either intends to liquidate the Group or to cease operations, or has no realistic alternative but to do so.
The trustees’ responsibilities include overseeing the Group’s financial reporting process.
AUDITOR’S RESPONSIBILITIES FOR THE AUDIT OF THE FINANCIAL STATEMENTS
Our objectives are to obtain reasonable assurance about whether the financial statements as a whole are free from material misstatement, whether due to fraud or error, and to issue an auditor’s report that includes our opinion. Reasonable assurance is a high level of assurance, but is not a guarantee that an audit conducted in accordance with SSAs will always detect a material misstatement when it exists. Misstatements can arise from fraud or error and are considered material if, individually or in the aggregate, they could reasonably be expected to influence the economic decisions of users taken on the basis of these financial statements.
As part of an audit in accordance with SSAs, we exercise professional judgement and maintain professional skepticism throughout the audit. We also:
(a) Identify and assess the risks of material misstatement of the financial statements, whether due to fraud or error, design and perform audit procedures responsive to those risks, and obtain audit evidence that is sufficient and appropriate to provide a basis for our opinion. The risk of not detecting a material misstatement resulting from fraud is higher than for one resulting from error, as fraud may involve collusion, forgery, intentional omissions, misrepresentations, or the override of internal control.
(b) Obtain an understanding of internal control relevant to the audit in order to design audit procedures that are appropriate in the circumstances, but not for the purpose of expressing an opinion on the effectiveness of the Group’s internal control.
(c) Evaluate the appropriateness of accounting policies used and the reasonableness of accounting estimates and related disclosures made by management.
INDEPENDENTAUDITOR’S REPORTTO THE BOARD OF TRUSTEES OF NANYANG TECHNOLOGICAL UNIVERSITY
(d) Conclude on the appropriateness of management’s use of the going concern basis of accounting and, based on the audit evidence obtained, whether a material uncertainty exists related to events or conditions that may cast significant doubt on the Group’s ability to continue as a going concern. If we conclude that a material uncertainty exists, we are required to draw attention in our auditor’s report to the related disclosures in the financial statements or, if such disclosures are inadequate, to modify our opinion. Our conclusions are based on the audit evidence obtained up to the date of our auditor’s report. However, future events or conditions may cause the Group to cease to continue as a going concern.
(e) Evaluate the overall presentation, structure and content of the financial statements, including the disclosures, and whether the financial statements represent the underlying transactions and events in a manner that achieves fair presentation.
(f) Obtain sufficient appropriate audit evidence regarding the financial information of the entities or business activities within the Group to express an opinion on the consolidated financial statements. We are responsible for the direction, supervision and performance of the Group audit. We remain solely responsible for our audit opinion.
We communicate with the trustees regarding, among other matters, the planned scope and timing of the audit and significant audit findings, including any significant deficiencies in internal control that we identify during our audit.
REPORT ON OTHER LEGAL AND REGULATORY REQUIREMENTS
In our opinion, the accounting and other records required by the Act to be kept by the University Company and by those subsidiary corporations incorporated in Singapore of which we are the auditors have been properly kept in accordance with the provisions of the Companies Act, and the Charities Act and Regulations.
During the course of our audit, nothing has come to our attention that causes us to believe that during the year:
(a) the University Company has not used the donation moneys in accordance with its objectives as required under Regulation 11 of the Charities (Institutions of a Public Character) Regulations; and
(b) The University Company has not complied with the requirements of Regulation 15 of the Charities (Institutions of a Public Character) Regulations.
Public Accountants andChartered AccountantsSingapore
16 August 2018
INDEPENDENTAUDITOR’S REPORTTO THE BOARD OF TRUSTEES OF NANYANG TECHNOLOGICAL UNIVERSITY

THE ARC OF EXCELLENCE30 31NTU ANNUAL REPORT 2018
Group University Company Note 2018 2017 2018 2017
$’000 $’000 $’000 $’000
ASSETS
Non-current assetsProperty, plant and equipment 3 2,110,704 2,048,249 2,108,453 2,047,583Intangible assets 4 9,049 6,535 9,049 6,535Prepaid lease 5 38,760 40,443 38,760 40,443Subsidiaries 6 - - 2,203 791Associate and joint venture 7 639 741 3 -Available-for-sale financial assets 8 3,698 1,397 - -Student loans 9 2,721 2,658 2,721 2,658Total non-current assets 2,165,571 2,100,023 2,161,189 2,098,010
Current assetsDerivative financial instruments 10 5,213 11,739 5,213 11,739Student loans 9 1,465 1,445 1,465 1,445Trade and other receivables 11 289,721 226,750 278,915 220,488Financial assets at fair value through profit or loss 12 2,642,963 2,401,006 2,642,963 2,401,006Cash and cash equivalents 13 1,078,675 1,307,546 1,050,006 1,276,311Total current assets 4,018,037 3,948,486 3,978,562 3,910,989
Total assets 6,183,608 6,048,509 6,139,751 6,008,999
LIABILITIES
Non-current liabilitiesDeferred capital grants 14 1,433,891 1,327,236 1,433,789 1,327,189Other non-current liabilities 3,108 3,588 3,108 3,588Sinking fund received in advance 15 251,075 256,186 251,075 256,186Total non-current liabilities 1,688,074 1,587,010 1,687,972 1,586,963
STATEMENTS OFFINANCIAL POSITION31 MARCH 2018
Group University Company Note 2018 2017 2018 2017
$’000 $’000 $’000 $’000
Current liabilitiesDerivative financial instruments 10 6 11 6 11Other payables and accruals 210,094 187,017 204,748 182,396Provisions 16 67,470 107,901 67,030 107,583Grant received in advance - Operating grants 17 7,097 6,406 - -Grant received in advance - Information technology and furniture and equipment (“IT and F&E”) 15 40,937 44,793 40,937 44,793Sinking fund received in advance 15 48,304 35,788 48,304 35,788Short-term borrowings 18 245,200 350,200 245,200 350,200Deferred tuition and other fees 91,888 92,467 91,841 92,466Research grants received in advance 19 97,292 98,636 92,724 91,836Income tax payable 306 213 - -Total current liabilities 808,594 923,432 790,790 905,073
Total liabilities 2,496,668 2,510,442 2,478,762 2,492,036
Net assets 3,686,940 3,538,067 3,660,989 3,516,963
FUNDS AND RESERVES
Capital account 20 200,858 200,858 200,858 200,858Endowment fund 21 1,948,290 1,872,452 1,948,793 1,872,455Accumulated surplus - General fund 955,584 869,547 922,992 842,708 - Other restricted fund 21 579,557 593,813 588,346 600,942Investment revaluation reserves 2,651 1,397 - -
Funds and reserves 3,686,940 3,538,067 3,660,989 3,516,963
See Note 22 for funds managed on behalf of the Government Ministry.
The accompanying notes form an integral part of these financial statements.
STATEMENTS OFFINANCIAL POSITION31 MARCH 2018

THE ARC OF EXCELLENCE32 33NTU ANNUAL REPORT 2018
General fund Endowment fund Other restricted fund TotalNote 2018 2017 2018 2017 2018 2017 2018 2017
$’000 $’000 $’000 $’000 $’000 $’000 $’000 $’000
Group
IncomeTuition and other fees 286,902 287,443 - - 63,017 57,407 349,919 344,850Rental income 3,292 819 - - 65,361 57,748 68,653 58,567Research grants (non-ministry) 19 100,951 87,920 - - - - 100,951 87,920Interest income 23 3,794 4,329 428 1,078 1,058 944 5,280 6,351Donations and sponsorships 1,349 1,671 - - 40,814 29,634 42,163 31,305Other grants 694 2,625 - - 1,127 2,057 1,821 4,682Sundry income 72,611 70,503 - - 8,588 13,348 81,199 83,851Deferred capital grants amortised (non-ministry) 14 16,371 15,293 - - 14,510 12,869 30,881 28,162Total income before profit on investments and share of associate and joint venture’s results 485,964 470,603 428 1,078 194,475 174,007 680,867 645,688Profit on investments 24 43,357 67,076 105,445 157,051 150 226 148,952 224,353Share of associate and joint venture’s
results 7 (55) (87) - - - - (55) (87)Total income after profit on investments and share of associate and joint venture’s results 529,266 537,592 105,873 158,129 194,625 174,233 829,764 869,954
ExpenditureExpenditure on manpower 761,015 720,167 1,319 1,274 158,570 138,772 920,904 860,213Teaching/research 166,763 161,748 - - 61,192 58,068 227,955 219,816Administration 93,729 84,143 - - 60,824 58,662 154,553 142,805Scholarship expenses 93,087 97,956 - - 63,947 62,453 157,034 160,409Maintenance 54,428 55,351 - - 27,955 25,458 82,383 80,809Library books and periodicals 6,571 4,867 - - 47 51 6,618 4,918Depreciation of property, plant and equipment 3 211,862 168,819 - - 27,092 27,391 238,954 196,210Amortisation of intangible assets 4 1,050 774 - - 1,003 - 2,053 774Amortisation of prepaid lease 5 1,683 1,683 - - - - 1,683 1,683Amount carried forward 1,390,188 1,295,508 1,319 1,274 400,630 370,855 1,792,137 1,667,637
CONSOLIDATED STATEMENT OFPROFIT OR LOSS AND OTHER COMPREHENSIVE INCOMEYEAR ENDED 31 MARCH 2018
General fund Endowment fund Other restricted fund TotalNote 2018 2017 2018 2017 2018 2017 2018 2017
$’000 $’000 $’000 $’000 $’000 $’000 $’000 $’000
Group (cont’d)
Amount brought forward 1,390,188 1,295,508 1,319 1,274 400,630 370,855 1,792,137 1,667,637Capital expenditure not capitalised 17,965 18,860 - - 1,553 1,870 19,518 20,730Loss/(Gain) on disposal of property, plant and equipment 2,142 871 - - (27) 24 2,115 895Other expenses 11,214 3,421 2,094 2,365 34,266 37,164 47,574 42,950
Total expenses 1,421,509 1,318,660 3,413 3,639 436,422 409,913 1,861,344 1,732,212(Deficit)/Surplus before grants from ministries 25 (892,243) (781,068) 102,460 154,490 (241,797) (235,680) (1,031,580) (862,258) Grants from ministriesDevelopment grants 15 22,858 16,798 - - - - 22,858 16,798Operating grants 26 539,755 471,415 - - - - 539,755 471,415Research grants 19 282,932 286,728 - - - - 282,932 286,728Other grants 4,067 4,256 - - 124,722 120,261 128,789 124,517Deferred capital grants amortised 14 174,472 138,904 - - 3,265 5,052 177,737 143,956Total grants from ministries 1,024,084 918,101 - - 127,987 125,313 1,152,071 1,043,414Surplus/(Deficit) after grants from ministries 131,841 137,033 102,460 154,490 (113,810) (110,367) 120,491 181,156Taxation 27 (259) (306) - - - - (259) (306)Surplus/(Deficit) for the year 131,582 136,727 102,460 154,490 (113,810) (110,367) 120,232 180,850
Other comprehensive incomeItems that may be reclassified subsequently to profit or lossAvailable-for-sale financial assets 1,254 1,397 - - - - 1,254 1,397
Other comprehensive income for the year, net of tax 1,254 1,397 - - - - 1,254 1,397
Total comprehensive income/(loss) for the year 132,836 138,124 102,460 154,490 (113,810) (110,367) 121,486 182,247
CONSOLIDATED STATEMENT OFPROFIT OR LOSS AND OTHER COMPREHENSIVE INCOMEYEAR ENDED 31 MARCH 2018
The accompanying notes form an integral part of these financial statements.
THE ARC OF EXCELLENCE34 35NTU ANNUAL REPORT 2018
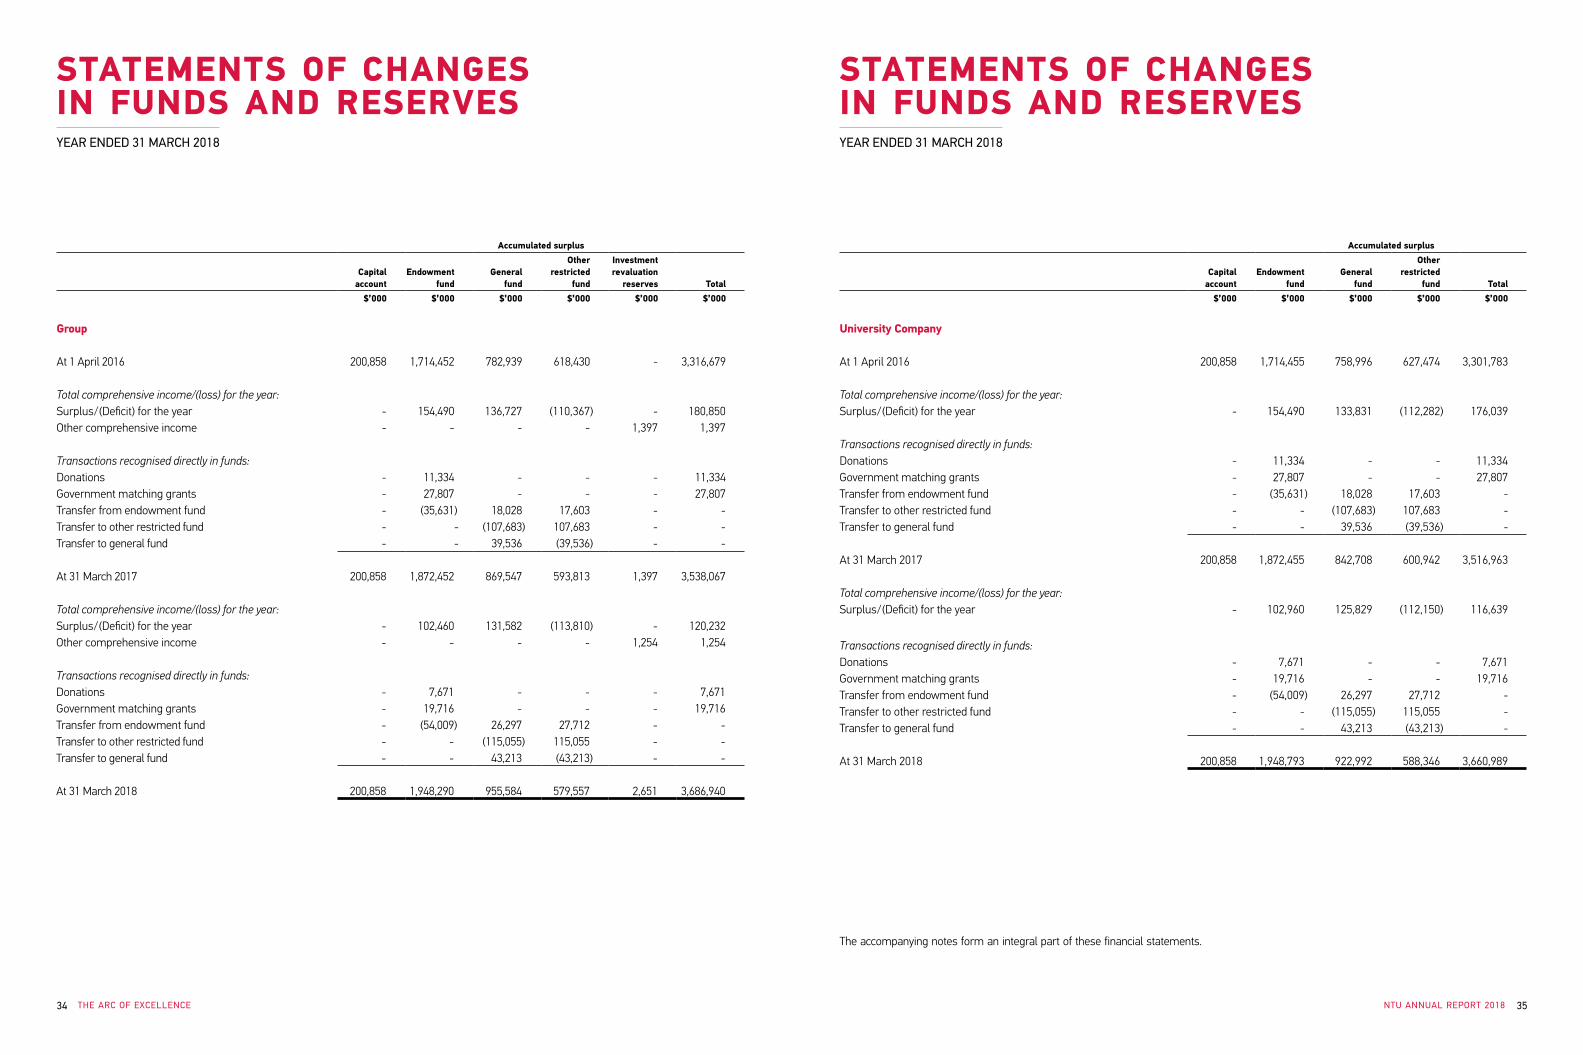
Accumulated surplus
Capital account
Endowment fund
General fund
Other restricted fund
Investment revaluation reserves Total
$’000 $’000 $’000 $’000 $’000 $’000
Group
At 1 April 2016 200,858 1,714,452 782,939 618,430 - 3,316,679
Total comprehensive income/(loss) for the year:Surplus/(Deficit) for the year - 154,490 136,727 (110,367) - 180,850Other comprehensive income - - - - 1,397 1,397
Transactions recognised directly in funds:Donations - 11,334 - - - 11,334Government matching grants - 27,807 - - - 27,807Transfer from endowment fund - (35,631) 18,028 17,603 - -Transfer to other restricted fund - - (107,683) 107,683 - -Transfer to general fund - - 39,536 (39,536) - -
At 31 March 2017 200,858 1,872,452 869,547 593,813 1,397 3,538,067
Total comprehensive income/(loss) for the year:Surplus/(Deficit) for the year - 102,460 131,582 (113,810) - 120,232Other comprehensive income - - - - 1,254 1,254
Transactions recognised directly in funds:Donations - 7,671 - - - 7,671Government matching grants - 19,716 - - - 19,716Transfer from endowment fund - (54,009) 26,297 27,712 - -Transfer to other restricted fund - - (115,055) 115,055 - -Transfer to general fund - - 43,213 (43,213) - -
At 31 March 2018 200,858 1,948,290 955,584 579,557 2,651 3,686,940
STATEMENTS OF CHANGES IN FUNDS AND RESERVESYEAR ENDED 31 MARCH 2018
Accumulated surplus
Capital account
Endowment fund
General fund
Other restricted fund Total
$’000 $’000 $’000 $’000 $’000
University Company
At 1 April 2016 200,858 1,714,455 758,996 627,474 3,301,783
Total comprehensive income/(loss) for the year:Surplus/(Deficit) for the year - 154,490 133,831 (112,282) 176,039
Transactions recognised directly in funds:Donations - 11,334 - - 11,334Government matching grants - 27,807 - - 27,807Transfer from endowment fund - (35,631) 18,028 17,603 -Transfer to other restricted fund - - (107,683) 107,683 -Transfer to general fund - - 39,536 (39,536) -
At 31 March 2017 200,858 1,872,455 842,708 600,942 3,516,963
Total comprehensive income/(loss) for the year:Surplus/(Deficit) for the year - 102,960 125,829 (112,150) 116,639
Transactions recognised directly in funds:Donations - 7,671 - - 7,671Government matching grants - 19,716 - - 19,716Transfer from endowment fund - (54,009) 26,297 27,712 -Transfer to other restricted fund - - (115,055) 115,055 -Transfer to general fund - - 43,213 (43,213) -
At 31 March 2018 200,858 1,948,793 922,992 588,346 3,660,989
STATEMENTS OF CHANGES IN FUNDS AND RESERVESYEAR ENDED 31 MARCH 2018
The accompanying notes form an integral part of these financial statements.

THE ARC OF EXCELLENCE36 37NTU ANNUAL REPORT 2018
Note 2018 2017 $’000 $’000
Group
Operating activities Deficit before grants from ministries (1,031,580) (862,258) Adjustments for: Research grant income (100,951) (87,920) Depreciation of property, plant and equipment 238,954 196,210 Amortisation of intangible assets 2,053 774 Amortisation of prepaid lease 1,683 1,683 Loss on disposal of property, plant and equipment 2,115 895 Profit on investments (148,952) (224,353) Gain on acquisition/disposal of subsidiary - (173) Impairment of available-for-sale financial assets - 1,000 Deferred capital grants amortised (non-ministry) (30,881) (28,162) Interest income (5,280) (6,351) Share of associate and joint venture’s results 55 87 Impairment loss of an associate 116 -
(1,072,668) (1,008,568) Changes in working capital: Other payables 61,849 (14,839) Trade and other receivables (29,752) 69,174 Deferred tuition and other fees (579) 2,680 Loans (extended to)/repaid by students (83) 350 Cash used in operations (1,041,233) (951,203) Donations received for Endowment Fund 7,671 11,334 Income taxes paid (166) (232)Cash flows used in operating activities (1,033,728) (940,101)
CONSOLIDATED STATEMENTOF CASH FLOWSYEAR ENDED 31 MARCH 2018
Note 2018 2017 $’000 $’000
Investing activities Acquisition of property, plant and equipment (303,762) (471,979) Acquisition of intangible assets (4,912) (5,630) Purchase of financial assets (276,981) (250,490) Proceeds from disposal of property, plant and equipment 583 - Proceeds from sale of financial assets 129,461 323,020 Acquisition of subsidiary - 309 Disposal of subsidiary - (511) Investment in associate/joint venture Loan to associate
(50)(19)
(300)(507)
Increase/(Decrease) in money market funds and cash held by custodian banks 13 59,989 (60,051) Interest received 5,590 8,963Cash flows used in investing activities (390,101) (457,176)
Financing activities Sinking fund received, net of refund 31,832 31,212 IT and F&E grant received 30,574 34,508 Research grants received, net of refund 386,740 426,286 Operating grants received, net of payment of goods and service tax expense on tuition fees and tuition grants 505,985 494,210 Development grants and related income received 196,322 177,344 Government ministry grants received 148,505 152,324 Proceeds from borrowings 97,300 314,500 Repayments of borrowings (202,300) (70,800)Cash flows from financing activities 1,194,958 1,559,584
Net (decrease)/increase in cash and cash equivalents (228,871) 162,307Cash and cash equivalents at beginning of the year 1,307,546 1,145,239Cash and cash equivalents at end of the year 13 1,078,675 1,307,546
CONSOLIDATED STATEMENTOF CASH FLOWSYEAR ENDED 31 MARCH 2018
The accompanying notes form an integral part of these financial statements.
THE ARC OF EXCELLENCE38 39NTU ANNUAL REPORT 2018
1 GENERAL
Nanyang Technological University (“NTU” or the “University Company”) is incorporated and domiciled in Singapore as a Company limited by guarantee under the Singapore Companies Act, Chapter 50. The University Company’s registered office and place of business is located at 50 Nanyang Avenue Singapore 639798. The financial statements are expressed in Singapore dollars.
The University Company is principally engaged in the advancement and dissemination of knowledge, the promotion of research and scholarships and the conferring and awarding of degrees, diplomas and certificates.
The principal activities of the subsidiaries are set out in Note 6.
As the operations of the University Company is substantially funded by the Ministry of Education (“MOE” or the “Government Ministry”) through government grants, with MOE having the power to appoint and remove members to the Board of Trustees of the University Company, MOE is regarded as the parent entity.
The consolidated financial statements relate to the University Company and its subsidiaries (referred to as the “Group”). The consolidated financial statements of the Group and statement of financial position and statement of changes in funds and reserves of the University Company for the year ended 31 March 2018 were authorised for issue by the Board of Trustees on 16 August 2018.
2 SUMMARY OF SIGNIFICANT ACCOUNTING POLICIES
2.1 Basis of preparation
(a) Basis of measurement
The financial statements have been prepared in accordance with the historical cost basis except otherwise disclosed below, and are drawn up in accordance with the provisions of the Singapore Companies Act, the Charities Act and Financial Reporting Standards in Singapore (“FRS”).
Historical cost is generally based on the fair value of the consideration given in exchange for goods and services.
Fair value is the price that would be received to sell an asset or paid to transfer a liability in an orderly transaction between market participants at the measurement date, regardless of whether that price is directly observable or estimated using another valuation technique. In estimating the fair value of an asset or a liability, the Group takes into account the characteristics of the asset or liability which market participants would take into account when pricing the asset or liability at the measurement date. Fair value for measurement and/or disclosure purposes in these consolidated financial statements is determined on such a basis, except for leasing transactions that are within the scope of FRS 17 Leases, and measurements that have some similarities to fair value but are not fair value, such as value in use in FRS 36 Impairment of Assets.
In addition, for financial reporting purposes, fair value measurements are categorised into Level 1, 2 or 3 based on the degree to which the inputs to the fair value measurements are observable and the significance of the inputs to the fair value measurement in its entirety, which are described as follows:
• Level 1: quoted prices (unadjusted) in active markets for identical assets or liabilities
• Level 2: inputs other than quoted prices included within Level 1 that are observable for the asset or liability, either directly (i.e., as prices) or indirectly (i.e., derived from prices)
• Level 3: inputs for the asset or liability that are not based on observable market data (unobservable inputs)
NOTES TOFINANCIAL STATEMENTS31 MARCH 2018
2 SUMMARY OF SIGNIFICANT ACCOUNTING POLICIES (CONT’D)
2.1 Basis of preparation (cont’d)
(b) Functional and presentation currency
The individual financial statements of each group entity are measured and presented in the currency of the primary economic environment in which the entity operates (its functional currency). The consolidated financial statements of the Group and the statement of financial position of the University Company are presented in Singapore dollars, which is the functional currency of the University Company and the presentation currency for the consolidated financial statements.
All financial information presented in Singapore dollars has been rounded to the nearest thousand, unless otherwise stated.
(c) Use of estimates and judgements
The preparation of financial statements in conformity with FRS requires management to make judgements, estimates and assumptions that affect the application of accounting policies and the reported amounts of assets, liabilities, income and expenditure. Actual results may differ from these estimates.
Estimates and underlying assumptions are reviewed on an ongoing basis. Revisions to accounting estimates are recognised in the period in which the estimates are revised and in any future periods affected.
Management is of the opinion that any instances of application of judgements are not expected to have a significant effect on the amounts recognised in the financial statements.
Key sources of estimation uncertainty
The key assumptions concerning the future, and other key sources of estimation uncertainty at the end of the reporting period, that have a significant risk of causing a material adjustment to the carrying amount of assets and liabilities within the next financial year, are discussed below.
• Notes 2.9, 10 and 12 - valuation of financial instruments
Fair value measurements and valuation processes
In estimating the fair value of an asset or a liability, the Group obtains valuations from third party fund managers/fund administrators/custodian banks. The valuations are determined using market-observable data to the extent it is available. Where Level 1 inputs are not available, the fund managers/fund administrators/custodian banks establish the fair value of the investments using the net asset value at the end of the reporting period.
Derivative financial instruments
The fair value of derivatives (foreign currency forwards) is estimated by discounting the difference between the contractual forward price and the current forward price for the residual period to maturity of the contract.
NOTES TOFINANCIAL STATEMENTS31 MARCH 2018

THE ARC OF EXCELLENCE40 41NTU ANNUAL REPORT 2018
2 SUMMARY OF SIGNIFICANT ACCOUNTING POLICIES (CONT’D)
2.1 Basis of preparation (cont’d)
(c) Use of estimates and judgements (cont’d)
Financial assets at fair value through profit or loss
The fair values of financial instruments traded in active markets are based on quoted market prices at the end of the reporting period. The Group and University Company also holds unquoted investments, of which the valuation methodologies are set out in Note 12.
• Notes 2.11, 16 (b) - measurement of provisions
Provision for undergraduate funding
Provision for undergraduate funding relates to the adjustment to the undergraduate output funding from MOE in the event the University Company achieves fewer undergraduates than MOE’s output target. The provision is based on the University Company’s actual and projected number of undergraduates. Due to a change in MOE’s undergraduate funding model from output-based to enrolment-based with effect from 2019 for both new and existing cohorts, the provision previously set aside was no longer required and had been written back.
(d) Adoption of new and revised standards
On 1 April 2017, the Group has adopted all the new and revised FRSs and Interpretations of FRS (“INT FRS”) that are effective from that date and are relevant to its operations. The adoption of these new/revised FRSs does not result in changes to the Group’s and University Company’s accounting policies and has no material effect on the amounts reported for the current or prior years.
2.2 Consolidation
Basis of consolidation
The consolidated financial statements incorporate the financial statements of the University Company and entities controlled by the University Company and its subsidiaries. Control is achieved when the University Company:
(i) Has power over the investee; (ii) Is exposed, or has rights, to variable returns from its involvement with the investee; and (iii) Has the ability to use its power to affect its returns.
The University Company reassesses whether or not it controls an investee if facts and circumstances indicate that there are changes to one or more of the three elements of control listed above.
Consolidation of a subsidiary begins when the University Company obtains control over the subsidiary and ceases when the University Company loses control of the subsidiary. Specifically, income and expenses of a subsidiary acquired or disposed of during the year are included in the consolidated statement of profit or loss and other comprehensive income from the date the University Company gains control until the date when the University Company ceases to control the subsidiary.
The accounting policies of subsidiaries have been changed where necessary to align them with the policies adopted by the Group.
NOTES TOFINANCIAL STATEMENTS31 MARCH 2018
2 SUMMARY OF SIGNIFICANT ACCOUNTING POLICIES (CONT’D)
2.2 Consolidation (cont’d)
Basis of consolidation (cont’d)
Intra-group balances and transactions, and any unrealised income or expenses arising from intra-group transactions, are eliminated in preparing the consolidated financial statements.
Investments in subsidiaries are carried at cost less any impairment in net recoverable value that has been recognised in profit or loss.
Business combinations
Business combinations are accounted for using the acquisition method as at the acquisition date, which is the date on which control is transferred to the Group. The consideration for each acquisition is measured at the aggregate of the acquisition date fair values of assets given, liabilities incurred by the Group to the former owners of the acquiree, and equity interests issued by the Group in exchange for control of the acquiree.
The consideration transferred does not include amounts related to the settlement of pre-existing relationships. Such amounts are generally recognised in profit or loss.
Costs related to the acquisition, other than those associated with the issue of debt or equity securities, that the Group incurs in connection with a business combination are expensed as incurred.
Any contingent consideration payable is recognised at fair value at the acquisition date. If the contingent consideration is classified as funds and reserves, it is not remeasured and settlement is accounted for within funds and reserves. Otherwise, subsequent changes to the fair value of the contingent consideration are recognised in the statement of profit or loss and other comprehensive income.
Associate and Joint venture
An associate is an entity over which the group has significant influence. Significant influence is the power to participate in the financial and operating policy decisions of the investee but is not control or joint control over those policies.
A joint venture is a joint arrangement whereby the parties that have joint control of the arrangement have rights to the net assets of the joint arrangement. Joint control is the contractually agreed sharing of control of an arrangement, which exists only when decisions about the relevant activities require unanimous consent of the parties sharing control.
The results and assets and liabilities of joint ventures and associate are incorporated in these consolidated financial statements using the equity method of accounting. Under the equity method, an investment in joint venture or an associate is initially recognised in the consolidated statement of financial position at cost and adjusted thereafter to recognise the Group’s share of the profit or loss and other comprehensive income of the joint venture or associate. When the Group’s share of losses of a joint venture or associate exceeds the Group’s interest in that joint venture, the Group discontinues recognising its share of further losses. Additional losses are recognised only to the extent that the Group has incurred legal or constructive obligations or made payments on behalf of the joint venture or associate.
An investment in a joint venture or an associate is accounted for using the equity method from the date on which the investee becomes a joint venture or an associate. On acquisition of the investment in a joint venture or an associate, any excess of the cost of investment over the Group’s share of the net fair value of the identifiable assets and liabilities of the investee is recognised as goodwill, which is included within the carrying amount of the investment. Any excess of the Group’s share of the net fair value of the identifiable assets and liabilities over the cost of investment, after reassessment, is recognised immediately in profit or loss in the period in which the investment is acquired.
NOTES TOFINANCIAL STATEMENTS31 MARCH 2018
THE ARC OF EXCELLENCE42 43NTU ANNUAL REPORT 2018
2 SUMMARY OF SIGNIFICANT ACCOUNTING POLICIES (CONT’D)
2.2 Consolidation (cont’d)
Associate and Joint venture (cont’d)
When a Group entity transacts with a joint venture or an associate of the Group, profits and losses resulting from the transactions with the joint venture or associate are recognised in the Group’s consolidated financial statements only to the extent of interests in the joint venture or associate that are not related to the Group.
2.3 Foreign currencies
Foreign currency transactions
Transactions in foreign currencies are translated to the respective functional currencies of Group entities at the exchange rate prevailing on the date of the transaction. At the end of each reporting period, monetary items denominated in foreign currencies are retranslated to the functional currency at the rates prevailing at the end of the reporting period. Non-monetary items carried at fair value that are denominated in foreign currencies are retranslated to the functional currency at the rates prevailing on the date that the fair value is determined. Non-monetary items that are measured in terms of historical cost in foreign currency are not retranslated.
Foreign currency differences arising on retranslation are recognised in profit or loss.
Foreign operations
The assets and liabilities of foreign operations are translated to the functional currency of the University Company and the presentation currency for the consolidated financial statements at exchange rates prevailing at the reporting date. The income and expenses of foreign operations are translated to Singapore dollars at exchange rates ruling at the dates of the transactions.
Foreign currency differences are recognised in other comprehensive income and accumulated in a separate component of equity under the header of foreign currency translation reserve. When a foreign operation is disposed of, in part or in full, the relevant amount in the foreign exchange translation reserves is transferred to profit or loss as part of the gain or loss on disposal.
2.4 Funds
Assets and liabilities of all funds are pooled in the statements of financial position.
General and other restricted funds
Income and expenditure are generally accounted for under the “General Fund” in the statement of profit or loss and other comprehensive income. The use of these reserves is subject to the approval of the Board of Trustees.
The income and expenditure relating to funds that are set up for specific purposes are accounted for under “Other Restricted Fund” in the statement of profit or loss and other comprehensive income.
NOTES TOFINANCIAL STATEMENTS31 MARCH 2018
2 SUMMARY OF SIGNIFICANT ACCOUNTING POLICIES (CONT’D)
2.4 Funds (cont’d)
General and other restricted funds (cont’d)
The following funds termed as “Other Restricted Fund” are set up and disclosed separately from the University Company’s general fund:
(i) funds created from donations from external bodies for special purposes;
(ii) funds created from grants received for carrying out activities under special arrangements; and
(iii) funds maintained separately and are ring-fenced to support centres and autonomous institutes towards specific and defined objectives.
The use of these funds are governed by the terms and conditions set out by the respective funds.
The income and expenditure of General Fund and Other Restricted Fund are included in the consolidated statement of profit or loss and other comprehensive income.
Endowment fund
Donations received and Government matching grants received/receivable during the year are taken directly to the statement of changes in funds and reserves. Income and expenditure arising from the management of the Endowment Fund are taken to the statement of profit or loss and other comprehensive income of the Endowment Fund.
2.5 Grants and sinking fund
Grants and sinking fund from the Government Ministry, other ministries and statutory boards and contributions received/receivable from other organisations for the purchase of depreciable assets or to finance research or capital projects are taken to the grants received in advance account in the first instance. They are taken to the deferred capital grants account upon the utilisation of the grants for purchase of assets, which are capitalised, or to profit or loss for purchase of assets which are written off in the year of purchase.
Deferred capital grants are recognised in the profit or loss over the periods necessary to match the depreciation, write off and/or impairment loss of the assets purchased with the related grants. Upon the disposal of property, plant and equipment, the balance of the related deferred capital grants is recognised in profit or loss to match the net book value of the property, plant and equipment written off.
Development grant is recognised when there is reasonable assurance that the University Company will comply with the conditions attach to them and that the grants will be received.
Information Technology and Furniture and Equipment (“IT and F&E”) grants received from the Government Ministry are for the purchase of information technology appliances and furniture and equipment to support teaching and administrative function of the University Company. These grants are taken to the grants received in advance account in the first instance. They are taken to deferred capital grants account upon the utilisation of the grants for purchase of assets, which are capitalised, or to the profit or loss for purchase of assets which are written off in the year of purchase.
NOTES TOFINANCIAL STATEMENTS31 MARCH 2018

THE ARC OF EXCELLENCE44 45NTU ANNUAL REPORT 2018
2 SUMMARY OF SIGNIFICANT ACCOUNTING POLICIES (CONT’D)
2.5 Grants and sinking fund (cont’d)
Grants from the Government Ministry and other ministries to meet the current year’s operating expenses are recognised as income in the same year these operating expenses were incurred.
All grants and contributions are accounted for on the accrual basis.
Wage Credit scheme, Special Employment Credit scheme and Temporary Employment Credit scheme
Cash grants received from the government in relation to the Wage Credit scheme, Special Employment Credit scheme and Temporary Employment Credit scheme are recognised upon receipt. Such grants are provided to defray the wage costs incurred and are offset against manpower costs in the financial statements.
2.6 Property, plant and equipment
Recognition and measurement
Property, plant and equipment are stated at cost less accumulated depreciation and impairment losses except for land alienated to the Group and University Company which are stated at values provided by the Government. Donated assets are stated at valuation at initial recognition.
The freehold land of the Group and the University Company were stated at valuation carried out in December 1987 based on values in a valuation report from the Commissioner of Lands. The revaluation was done on a one-off basis and accordingly, the transitional provision in FRS 16 - Property, Plant and Equipment was adopted to continue with its existing policy of stating the freehold land at deemed cost. This revaluation surplus was credited directly to the Capital Account. Upon disposal, any related revaluation surplus is transferred from the Capital Account to accumulated surplus and is not taken into account in arriving at the gain or loss on disposal.
Cost includes expenditures that are directly attributable to the acquisition of the asset. The cost of self-constructed assets includes the cost of materials and direct labour, any other costs directly attributable to bringing the asset to a working condition for its intended use, and the costs of dismantling and removing the items and restoring the site on which they are located. Purchased software that is integral to the functionality of the related equipment is capitalised as part of that equipment.
When parts of an item of property, plant and equipment have different useful lives, they are accounted for as separate items (major components) of property, plant and equipment.
Property, plant and equipment costing less than $2,000 each, renovation costing $100,000 and below and library books are generally charged to profit or loss in the year of purchase.
The gain or loss on disposal of an item of property, plant and equipment recognised in profit or loss is derived from the proceeds from disposal and the carrying amount of property, plant and equipment.
NOTES TOFINANCIAL STATEMENTS31 MARCH 2018
2 SUMMARY OF SIGNIFICANT ACCOUNTING POLICIES (CONT’D)
2.6 Property, plant and equipment (cont’d)
Subsequent cost
The cost of replacing part of an item of property, plant and equipment is recognised in the carrying amount of the item if it is probable that the future economic benefits embodied within the part will flow to the Group and its cost can be measured reliably. The costs of the day-to-day servicing of property, plant and equipment are recognised in the profit or loss as incurred.
Depreciation
Depreciation is based on the cost of an asset less its residual value. Significant components of individual assets are assessed and if a component has a useful life that is different from the remainder of that asset, that component is depreciated separately.
Depreciation is recognised in the profit or loss on a straight-line basis over the estimated useful lives of each component of an item of property, plant and equipment.
Except for freehold land and buildings under construction which are not depreciated, depreciation on other property, plant and equipment is recognised in the statement of profit or loss and other comprehensive income on a straight-line basis over the estimated useful lives (or lease term, if shorter) of each part of an item of property, plant and equipment.
The estimated useful lives are as follows:
Buildings and infrastructure 3 to 30 years Improvement works 5 years Machinery, laboratory and workshop equipment 6 years Furniture and office equipment 3 to 5 years Transportation equipment 8 years Others 8 years
The estimated useful lives, residual values and depreciation method are reviewed at each year end, with the effect of any changes in estimate accounted for on a prospective basis.
Buildings under construction are stated at cost, less any recognised impairment loss, if any. Expenditure relating to the construction of projects are capitalised when incurred. No depreciation is charged on building under construction until the building under construction is completed and the related property, plant and equipment are transferred to the respective property, plant and equipment categories and depreciated accordingly.
Assets held under finance leases are depreciated over their expected useful lives on the same basis as owned assets or, if there is no certainty that the lessee will obtain ownership by the end of the lease term, the assets shall be fully depreciated over the shorter of the lease term and their useful lives.
NOTES TOFINANCIAL STATEMENTS31 MARCH 2018

THE ARC OF EXCELLENCE46 47NTU ANNUAL REPORT 2018
2 SUMMARY OF SIGNIFICANT ACCOUNTING POLICIES (CONT’D)
2.7 Intangible assets
Intangible assets acquired separately are reported at cost less accumulated amortisation (where they have finite useful lives) and accumulated impairment losses. Intangible assets with finite useful lives are amortised on a straight-line basis over their estimated useful lives, on the following base:
Application Software - 3 years
The estimated useful life and amortisation method are reviewed at the end of each annual reporting period, with the effect of any changes in estimate being accounted for on a prospective basis. Intangible assets with indefinite useful lives are not amortised. Each period, the useful lives of such assets are reviewed to determine whether events and circumstances continue to support an indefinite useful life assessment for the asset. Such assets are tested for impairment annually and whenever there is an indication that the asset may be impaired.
2.8 Impairment - non-financial assets
The carrying amounts of the Group’s non-financial assets are reviewed at each reporting date to determine whether there is any indication of impairment. If any such indication exists, the asset’s recoverable amounts are estimated. Where it is not possible to estimate the recoverable amount of an individual asset, the Group estimates the recoverable amount of the cash-generating unit to which the asset belongs. Where a reasonable and consistent basis of allocation can be identified, corporate assets are also allocated to individual cash-generating units, or otherwise they are allocated to the smallest group of cash-generating units for which a reasonable and consistent allocation basis can be identified.
An impairment loss is recognised if the carrying amount of an asset or its cash-generating unit exceeds its recoverable amount. A cash-generating unit is the smallest identifiable asset group that generates cash flows that largely are independent from other assets and groups. Impairment losses are recognised in the statement of profit or loss and other comprehensive income unless it reverses a previous revaluation, credited to equity, in which case it is charged to equity. Impairment losses recognised in respect of cash-generating units are allocated first to reduce the carrying amount of any goodwill allocated to the units and then to reduce the carrying amount of the other assets in the unit (group of units) on a pro rata basis.
The recoverable amount of an asset or cash-generating unit is the greater of its value in use and its fair value less costs to sell. In assessing value in use, the estimated future cash flows are discounted to their present value using a pre-tax discount rate that reflects current market assessments of the time value of money and the risks specific to the asset or cash-generating unit. For the purpose of impairment testing, assets that cannot be tested individually are grouped together into the smallest group of assets that generates cash inflows from continuing use that are largely independent of the cash inflows of other assets or cash generating unit.
Impairment losses recognised in prior periods are assessed at each reporting date for any indications that the loss has decreased or no longer exists. An impairment loss is reversed if there has been a change in the estimates used to determine the recoverable amount. An impairment loss is reversed only to the extent that the asset’s carrying amount does not exceed the carrying amount that would have been determined, net of depreciation or amortisation, if no impairment loss had been recognised.
NOTES TOFINANCIAL STATEMENTS31 MARCH 2018
2 SUMMARY OF SIGNIFICANT ACCOUNTING POLICIES (CONT’D)
2.9 Financial instruments
Non-derivative financial assets
The Group initially recognises loans and receivables and deposits on the date that they originated. All other financial assets (including assets designated at fair value through profit or loss) are recognised initially on the trade date, which is the date that the Group becomes a party to the contractual provisions of the instrument.
The Group derecognises a financial asset when the contractual rights to the cash flows from the asset expire, or it transfers the rights to receive the contractual cash flows on the financial asset in a transaction in which substantially all the risks and rewards of ownership of the financial assets are transferred. Any interest in transferred financial assets that is created or retained by the Group is recognised as a separate asset or liability.
Financial assets and financial liabilities are offset and the net amount presented in the statement of financial position when the company and the group has a legally enforceable right to set off the recognised amounts; and intends either to settle on a net basis, or to realise the asset and settle the liability simultaneously.
The Group classifies non-derivative assets into the following categories: financial assets at fair value through profit or loss, available-for-sale financial assets and loans and receivables.
Financial assets at fair value through profit or loss
An instrument is classified at fair value through profit or loss if it is acquired principally for the purpose of selling in the short term or is designated as such upon initial recognition. Financial instruments are designated at fair value through profit or loss if the Group manages such investments and makes purchase and sale decisions based on their fair value in accordance with the Group’s documented risk management and investment strategies. Upon initial recognition, attributable transaction costs are recognised in the profit or loss when incurred. Financial instruments at fair value through profit or loss are measured at fair value, and changes therein are recognised in the profit or loss.
Financial assets designated at fair value through profit or loss comprise fixed income, quoted equity, unquoted investments and other investments.
Available-for-sale financial assets
Certain shares held by the Group are classified as being available for sale and are stated at fair value. Gains and losses arising from changes in fair value are recognised in other comprehensive income with the exception of impairment losses, interest calculated using the effective interest method and foreign exchange gains and losses on monetary assets which are recognised directly in profit or loss. Where the investment is disposed of or is determined to be impaired, the cumulative gain or loss previously recognised in other comprehensive income and accumulated in revaluation reserve is reclassified to profit or loss. Dividends on available-for-sale equity instruments are recognised in profit or loss when the Group’s right to receive payments is established.
Available-for-sale financial assets comprise quoted equity investments and unquoted investments.
NOTES TOFINANCIAL STATEMENTS31 MARCH 2018

THE ARC OF EXCELLENCE48 49NTU ANNUAL REPORT 2018
2 SUMMARY OF SIGNIFICANT ACCOUNTING POLICIES (CONT’D)
2.9 Financial instruments (cont’d)
Loans and receivables
Loans and receivables are financial assets with fixed or determinable payments that are not quoted in an active market. Such assets are recognised initially at fair value plus any directly attributable transaction costs. Subsequent to initial recognition, loans and receivables are measured at amortised cost using the effective interest method, less any impairment losses.
Loans and receivables comprise trade and other receivables, student loans, grant receivables and cash and cash equivalents.
Cash and cash equivalents comprise cash balances and bank deposits.
Impairment of financial assets
A financial asset is assessed at each reporting date to determine whether there is any objective evidence that it is impaired. A financial asset is considered to be impaired if objective evidence indicates that one or more events have had a negative effect on the estimated future cash flows of that asset.
An impairment loss in respect of a financial asset measured at amortised cost is calculated as the difference between its carrying amount, and the present value of the estimated future cash flows discounted at the original effective interest rate.
Individually significant financial assets are tested for impairment on an individual basis. The remaining financial assets are assessed collectively in groups that share similar credit risk characteristics. All impairment losses are recognised in the profit or loss.
For available-for-sale financial assets, a significant or prolonged decline in the fair value of the investment below its cost is considered to be objective evidence of impairment. When an available-for-sale financial asset is considered to be impaired, cumulative gains or losses previously recognised in other comprehensive income are reclassified to profit or loss. Any subsequent increase in fair value after an impairment loss is recognised in other comprehensive income and accumulated under the heading of investment revaluation reserves.
Non-derivative financial liabilities
The Group recognises financial liabilities when the Group becomes a party to the contractual provisions of the instrument.
The Group derecognises a financial liability when its contractual obligations are discharged or cancelled or expired.
Financial assets and liabilities are offset and the net amount presented in the statement of financial position when, and only when, the Group has a legal right to offset the amounts and intends either to settle on a net basis or to realise the asset and settle the liability simultaneously.
NOTES TOFINANCIAL STATEMENTS31 MARCH 2018
2 SUMMARY OF SIGNIFICANT ACCOUNTING POLICIES (CONT’D)
2.9 Financial instruments (cont’d)
Non-derivative financial liabilities (cont’d)
The Group classifies non-derivative financial liabilities into the other financial liabilities category. Such financial liabilities are recognised initially at fair value plus any directly attributable transaction costs. Subsequent to initial recognition, these financial liabilities are measured at amortised cost using the effective interest method.
Non-derivative financial liabilities comprise loans and borrowings and other payables and accruals.
Derivative financial instruments and hedging instruments
The Group holds derivative financial instruments, through its external fund managers, to hedge its foreign currency exposure. Further details of derivative financial instruments are disclosed in Note 10 to the financial statements.
Embedded derivatives are separated from the host contract and accounted for separately if the economic characteristics and risks of the host contract and the embedded derivative are not closely related, a separate instrument with the same terms as the embedded derivative would meet the definition of a derivative, and the combined instrument is not measured at fair value through profit or loss.
Derivatives are recognised initially at fair value; any attributable transaction costs are recognised in the profit or loss when incurred. Subsequent to initial recognition, derivatives are measured at fair value, and changes therein accounted for in the profit or loss.
Investment revaluation reserves
The investment revaluation reserves arises on the revaluation of quoted equity investments classified as available-for-sale financial assets. Where a revalued financial asset is sold, the portion of the reserve that relates to that financial asset, and is effectively realised, is recognised in profit or loss. Where a revalued financial asset is impaired, the portion of the reserve that relates to that financial asset is recognised in profit or loss.
2.10 Employee benefits
Defined contribution plans
A defined contribution plan is a post-employment benefit plan under which an entity pays fixed contributions to a separate entity and will have no legal or constructive obligation to pay further amounts. Obligations for contributions to defined contribution plans are recognised as an employee benefit expense in the profit or loss in the periods during which services are rendered by employees.
Short-term employee benefits
Short-term employee benefit obligations, including accumulated compensated absences, are measured on an undiscounted basis and are expensed as the related services are provided.
NOTES TOFINANCIAL STATEMENTS31 MARCH 2018

THE ARC OF EXCELLENCE50 51NTU ANNUAL REPORT 2018
2 SUMMARY OF SIGNIFICANT ACCOUNTING POLICIES (CONT’D)
2.11 Provisions
Provisions are recognised when the Group has a present obligation (legal or constructive) as a result of a past event, it is probable that the Group will be required to settle the obligation, and a reliable estimate can be made of the amount of the obligation.
The amount recognised as a provision is the best estimate of the consideration required to settle the present obligation at the end of the reporting period, taking into account the risks and uncertainties surrounding the obligation. Where a provision is measured using the cash flows estimated to settle the present obligation, its carrying amount is the present value of those cash flows.
When some or all of the economic benefits required to settle a provision are expected to be recovered from a third party, the receivable is recognised as an asset if it is virtually certain that reimbursement will be received and the amount of the receivable can be measured reliably.
2.12 Income tax
Income tax expense comprises current and deferred tax. Income tax expense is recognised in the profit or loss except to the extent that it relates to items recognised directly in equity or in other comprehensive income, in which case it is recognised in equity or in other comprehensive income.
Current tax is the expected tax payable on the taxable income for the year, using tax rates enacted or substantively enacted at the reporting date, and any adjustment to tax payable in respect of previous years.
Deferred tax is recognised in respect of temporary differences between the carrying amounts of assets and liabilities for financial reporting purposes and the amounts used for taxation purposes. Deferred tax is not recognised for temporary differences on the initial recognition of assets or liabilities in a transaction that is not a business combination and that affects neither accounting nor taxable income and expenditure; temporary differences related to investments in subsidiaries and jointly controlled entities to the extent that it is probable that they will not reverse in the foreseeable future; and taxable temporary differences arising on the initial recognition of goodwill.
Deferred tax is measured at the tax rates that are expected to be applied to the temporary differences when they reverse, based on the laws that have been enacted or substantively enacted by the reporting date.
Deferred tax assets and liabilities are offset if there is a legally enforceable right to offset current tax liabilities and assets, and they relate to income taxes levied by the same tax authority on the same taxable entity, or on different tax entities, but they intend to settle current tax liabilities and assets on a net basis or their tax assets and liabilities will be realised simultaneously.
A deferred tax asset is recognised for unused tax losses, tax credits and deductible temporary differences, to the extent that it is probable that future taxable profits will be available against which they can be utilised. Deferred tax assets are reviewed at each reporting date and are reduced to the extent that it is no longer probable that the related tax benefit will be realised.
NOTES TOFINANCIAL STATEMENTS31 MARCH 2018
2 SUMMARY OF SIGNIFICANT ACCOUNTING POLICIES (CONT’D)
2.13 Income recognition
Student fees
Income from tuition and other fees are recognised in the period in which the services are rendered.
Management fees
Management fees are recognised upon services rendered.
Donations and sponsorships
Unconditional donations and sponsorships are recognised upon receipt.
Licence fees
Licence fees are recognised in accordance with terms of licensing agreement.
Royalties
Royalties are recognised on sale, by licensor, of products using the technology granted.
Dividends
Dividends are recognised in the financial year in which the right to receive payment is established.
Rental income
Rental income receivable under operating leases is recognised in the profit or loss on a straight-line basis over the term of the lease.
2.14 Finance income and finance costs
Finance income comprises interest income generated from fixed deposits, bank deposits and finance leases. Interest income is recognised as it accrues in the profit or loss, using the effective interest method. Interest income on the finance lease is recognised in the profit or loss over the period of the lease so as to earn an approximately constant periodic rate of return on the remaining balance of the finance lease receivables for each reporting period.
Finance costs comprise interest expense on borrowings. Borrowing costs that are not directly attributable to the acquisition, construction or production of a qualifying asset are recognised in the profit or loss using the effective interest method.
NOTES TOFINANCIAL STATEMENTS31 MARCH 2018
THE ARC OF EXCELLENCE52 53NTU ANNUAL REPORT 2018
2 SUMMARY OF SIGNIFICANT ACCOUNTING POLICIES (CONT’D)
2.15 Lease payments
Payments made under operating leases are recognised in the profit or loss on a straight-line basis over the term of the lease. Lease incentives received are recognised as an integral part of the total lease expense, over the term of the lease.
Determining whether an arrangement contains a lease
At inception of an arrangement, the Group determines whether such an arrangement is or contains a lease. A specific asset is the subject of a lease if fulfilment of the arrangement is dependent on the use of that specified asset. An arrangement conveys the right to use the asset if the arrangement conveys to the Group the right to control the use of the underlying asset.
At inception or upon reassessment of the arrangement, the Group separates payments and other consideration required by such an arrangement into those for the lease and those for other elements on the basis of their relative fair values. If the Group concludes for a finance lease that it is impracticable to separate the payments reliably, then an asset and a liability are recognised at an amount equal to the fair value of the underlying asset. Subsequently, the liability is reduced as payments are made and an imputed finance charge on the liability is recognised using the Group’s incremental borrowing rate.
2.16 Prepaid lease
Prepaid lease is recognised in the statement of financial position and amortised to profit or loss on a straight-line basis over the term of the lease.
2.17 Key management personnel
Key management personnel of the Group are those persons having the authority and responsibility for planning, directing and controlling the activities of the entity. The Board of Trustees and senior management team are considered as key management personnel of the Group.
NOTES TOFINANCIAL STATEMENTS31 MARCH 2018
2 SUMMARY OF SIGNIFICANT ACCOUNTING POLICIES (CONT’D)
2.18 New standards and on interpretations not yet adopted
At the date of authorisation of these financial statements, the following FRSs that are relevant to the Group and the University Company were issued but not effective:
• FRS 109 Financial Instruments 1
• FRS 115 Revenue from Contracts with Customers (with clarifications issued) 1
• FRS 116 Leases 2
1 Applies to annual periods beginning on or after 1 January 2018, with early application permitted. 2 Applies to annual periods beginning on or after 1 January 2019, with early application permitted.
Management is currently assessing the impact that FRS 109, FRS 115 and FRS 116 will have on the financial statements.
FRS 109 Financial Instruments
FRS 109 was issued in December 2014 and will replace FRS 39 Financial Instruments: Recognition and Measurement. It introduces new requirements for (i) the classification and measurement of financial assets and financial liabilities and (ii) impairment requirements for financial assets.
Key requirements of FRS 109:
In respect of classification and measurement of financial assets and liabilities, all recognised financial assets that are within the scope of FRS 39 are now required to be subsequently measured at amortised cost or fair value. Available-for-sale financial assets are measured at fair value through profit or loss (FVTPL) at the end of subsequent accounting periods. Management may make an irrevocable election to measure these financial assets (that is not held for trading) at fair value through other comprehensive income (FVTOCI), with only dividend income generally recognised in profit or loss. Any subsequent fair value changes are recognised in other comprehensive income and will not be reclassified to the income statement even upon divestment.
In relation to the impairment of financial assets, FRS 109 requires an expected credit loss model, as opposed to an incurred credit loss
model under FRS 39. The expected credit loss model requires an entity to account for expected credit losses and changes in those expected credit losses at each reporting date to reflect changes in credit risk since initial recognition. It is no longer necessary for a credit event to have occurred before credit losses are recognised.
Management anticipates that the initial application of FRS 109 will result in changes to the accounting policy relating to the recognition and measurement of available-for-sale financial assets as well as the impairment of financial assets. Additional disclosures with respect to certain financial assets may be required, including any significant judgement and estimation made. Management does not plan to early adopt the new FRS 109.
NOTES TOFINANCIAL STATEMENTS31 MARCH 2018

THE ARC OF EXCELLENCE54 55NTU ANNUAL REPORT 2018
2 SUMMARY OF SIGNIFICANT ACCOUNTING POLICIES (CONT’D)
2.18 New standards and on interpretations not yet adopted (cont’d)
FRS 115 Revenue from Contracts with Customers
In November 2014, FRS 115 was issued which establishes a single comprehensive model for entities to use in accounting for revenue arising from contracts with customers. FRS 115 will supersede the current revenue recognition guidance including FRS 18 Revenue, FRS 11 Construction Contracts and the related Interpretations when it becomes effective. Further clarifications to FRS 115 were also issued in June 2016.
The core principle of FRS 115 is that an entity should recognise revenue to depict the transfer of promised goods or services to customers in an amount that reflects the consideration to which the entity expects to be entitled in exchange for those goods or services. Specifically, the Standard introduces a 5-step approach to revenue recognition:
• Step 1: Identify the contract(s) with a customer. • Step 2: Identify the performance obligations in the contract. • Step 3: Determine transaction price. • Step 4: Allocate the transaction price to the performance obligations in the contract. • Step 5: Recognise revenue when (or as) the entity satisfies a performance obligation.
Under FRS 115, an entity recognises revenue when (or as) a performance obligation is satisfied, i.e. when “control” of the goods or services underlying the particular performance obligation is transferred to the customer.
Management anticipates that the initial application of FRS 115 may result in changes to the accounting policies relating to tuition fees income. Additional disclosures with respect to revenue may be required, including any significant judgement and estimation made. Management does not plan to early adopt the new FRS 115.
FRS 116 Leases
FRS 116 was issued in June 2016 and will supersede FRS 17 Leases and its associated interpretative guidance.
The standard provides a comprehensive model for the identification of lease arrangements and their treatment in the financial statements of both lessees and lessors. The identification of leases, distinguishing between leases and service contracts, are determined on the basis of whether there is an identified asset controlled by the customer.
Significant changes to lessee accounting are introduced, with the distinction between operating and finance leases removed and assets and liabilities recognised in respect of all leases (subject to limited exceptions for short-term leases and leases of low value assets). The standard maintains substantially the lessor accounting approach under the predecessor FRS 17.
Management anticipates that the initial application of the new FRS 116 may result in operating leases to be recognised as right-of-use assets with corresponding lease liabilities, unless they qualify for low value or short-term leases. The new requirement to recognise a right-of-use asset and a related lease liability is expected to have an impact to the amounts recognised in the Group’s financial statements and management is currently assessing its potential impact including the transition options and practical expedients. Management does not plan to early adopt FRS 116.
NOTES TOFINANCIAL STATEMENTS31 MARCH 2018
3 PROPERTY, PLANT AND EQUIPMENT
Freehold land
Buildings andinfrastructure
Buildings under construction
Improvement works
Machinery, laboratory and workshop equipment
Furniture and office equipment
Transportation equipment Others Total
$’000 $’000 $’000 $’000 $’000 $’000 $’000 $’000 $’000
Group
Cost or valuation At 1 April 2016 200,858 2,086,593 463,196 200,568 1,025,961 250,835 7,272 7,132 4,242,415
Additions - 17,843 344,032 4,589 77,289 25,952 1,497 777 471,979
Disposals - (3,953) - (1,092) (24,881) (16,277) (252) (64) (46,519)
Reclassifications - 346,410 (589,601) 34,750 200,451 7,535 239 216 -
At 31 March 2017 200,858 2,446,893 217,627 238,815 1,278,820 268,045 8,756 8,061 4,667,875
Additions - 34,103 163,451 7,176 72,555 25,098 296 1,083 303,762
Disposals - (21,196) - (2,871) (29,759) (13,680) (856) (170) (68,532)
Reclassifications - 167,988 (298,885) 20,319 88,470 21,475 415 218 -
At 31 March 2018 200,858 2,627,788 82,193 263,439 1,410,086 300,938 8,611 9,192 4,903,105
Comprising31 March 2017
At cost - 2,446,893 217,627 238,815 1,278,820 268,045 8,756 8,061 4,467,017
At valuation 200,858 - - - - - - - 200,858
200,858 2,446,893 217,627 238,815 1,278,820 268,045 8,756 8,061 4,667,875
31 March 2018
At cost - 2,627,788 82,193 263,439 1,410,086 300,938 8,611 9,192 4,702,247
At valuation 200,858 - - - - - - - 200,858
200,858 2,627,788 82,193 263,439 1,410,086 300,938 8,611 9,192 4,903,105
Accumulated depreciation At 1 April 2016 - 1,379,744 - 143,679 733,230 203,304 5,887 3,117 2,468,961
Depreciation for the year - 45,976 - 27,364 101,764 20,407 383 316 196,210
Disposals - (3,833) - (1,092) (24,148) (16,174) (235) (63) (45,545)
At 31 March 2017 - 1,421,887 - 169,951 810,846 207,537 6,035 3,370 2,619,626
Depreciation for the year - 54,274 - 27,779 130,999 24,992 474 436 238,954
Disposals - (19,955) - (2,704) (28,706) (13,673) (831) (310) (66,179)
At 31 March 2018 - 1,456,206 - 195,026 913,139 218,856 5,678 3,496 2,792,401
Carrying amount At 31 March 2017 200,858 1,025,006 217,627 68,864 467,974 60,508 2,721 4,691 2,048,249
At 31 March 2018 200,858 1,171,582 82,193 68,413 496,947 82,082 2,933 5,696 2,110,704
NOTES TOFINANCIAL STATEMENTS31 MARCH 2018
THE ARC OF EXCELLENCE56 57NTU ANNUAL REPORT 2018
3 PROPERTY, PLANT AND EQUIPMENT (CONT’D)
Freehold land
Buildings andinfrastructure
Buildings under construction
Improvement works
Machinery, laboratory and workshop equipment
Furniture and office equipment
Transportation equipment Others Total
$’000 $’000 $’000 $’000 $’000 $’000 $’000 $’000 $’000
University Company
Cost or valuation At 1 April 2016 200,858 2,086,593 463,196 199,161 1,025,611 248,492 7,272 7,132 4,238,315
Additions - 17,843 344,032 4,358 77,114 25,796 1,497 777 471,417
Disposals - (3,953) - (1,192) (24,795) (15,247) (252) (64) (45,503)
Reclassifications - 346,410 (589,601) 34,750 200,451 7,535 239 216 -
At 31 March 2017 200,858 2,446,893 217,627 237,077 1,278,381 266,576 8,756 8,061 4,664,229
Additions - 34,103 163,451 6,938 71,126 24,795 296 1,083 301,792
Disposals - (21,196) - (2,871) (29,759) (13,667) (856) (170) (68,519)
Reclassifications - 167,988 (298,885) 20,355 88,470 21,439 415 218 -
At 31 March 2018 200,858 2,627,788 82,193 261,499 1,408,218 299,143 8,611 9,192 4,897,502
Comprising 31 March 2017
At cost - 2,446,893 217,627 237,077 1,278,381 266,576 8,756 8,061 4,463,371
At valuation 200,858 - - - - - - - 200,858
200,858 2,446,893 217,627 237,077 1,278,381 266,576 8,756 8,061 4,664,229
31 March 2018
At cost - 2,627,788 82,193 261,499 1,408,218 299,143 8,611 9,192 4,696,644
At valuation 200,858 - - - - - - - 200,858
200,858 2,627,788 82,193 261,499 1,408,218 299,143 8,611 9,192 4,897,502
Accumulated depreciation At 1 April 2016 - 1,379,744 - 142,327 732,914 201,389 5,887 3,117 2,465,378
Depreciation for the year - 45,976 - 27,364 101,727 20,114 383 316 195,880
Disposals - (3,833) - (1,192) (24,065) (15,224) (235) (63) (44,612)
At 31 March 2017 - 1,421,887 - 168,499 810,576 206,279 6,035 3,370 2,616,646
Depreciation for the year - 54,274 - 27,687 130,778 24,920 474 436 238,569
Disposals - (19,955) - (2,704) (28,706) (13,660) (831) (310) (66,166)
At 31 March 2018 - 1,456,206 - 193,482 912,648 217,539 5,678 3,496 2,789,049
Carrying amount At 31 March 2017 200,858 1,025,006 217,627 68,578 467,805 60,297 2,721 4,691 2,047,583
At 31 March 2018 200,858 1,171,582 82,193 68,017 495,570 81,604 2,933 5,696 2,108,453
The freehold land of the Group and the University Company were stated at valuation carried out in December 1987 based on values in a valuation report from the Commissioner of Lands. The revaluation was done on a one-off basis and accordingly, the transitional provision in FRS 16 - Property, Plant and Equipment was adopted to continue with its existing policy of stating the freehold land at deemed cost.
NOTES TOFINANCIAL STATEMENTS31 MARCH 2018
4 INTANGIBLE ASSETS
Group and University Company
2018 2017 $’000 $’000
Cost At 1 April 7,580 1,950 Additions 4,912 5,630 Disposals (669) - At 31 March 11,823 7,580
Accumulated amortisation At 1 April 1,045 271 Amortisation charge for the year 2,053 774 Disposals (324) - At 31 March 2,774 1,045
Carrying amount At 31 March 9,049 6,535
5 PREPAID LEASE
Group and University Company
2018 2017 $’000 $’000
Cost At 1 April 47,660 47,660 Additions - - At 31 March 47,660 47,660
Accumulated amortisation At 1 April 7,217 5,534 Amortisation charge for the year 1,683 1,683 At 31 March 8,900 7,217
Carrying amount At 31 March 38,760 40,443
The prepaid lease relates to the lease of land from JTC and Singapore Land Authority at One-North and at Mandalay Road (for Novena Campus) respectively. The prepaid lease is capitalised and amortised over the tenure period of the land lease of 30 years.
NOTES TOFINANCIAL STATEMENTS31 MARCH 2018

THE ARC OF EXCELLENCE58 59NTU ANNUAL REPORT 2018
6 SUBSIDIARIES
University Company 2018 2017 $’000 $’000
Equity investments at cost 1,912 500 Loans to subsidiaries 291 291
2,203 791
The loans to subsidiaries are unsecured and interest-free. The settlements of the amounts are neither planned nor likely to occur in the foreseeable future. As the amounts are, in substance, a part of the University Company’s net investment in the subsidiaries, they are stated at cost less impairment losses.
Details of subsidiaries are as follows:
Ownershipinterest Principal activitiesName of subsidiary
Country ofincorporation
2018 2017
% %
Held by the University Company
@ Nanyang Technological Singapore 100 100 Innovation and University - NTUitive Pte Ltd enterprise company of
NTU
@ NTU Holdings Pte Ltd Singapore 100 100 Investment holding
@ Singapore Centre for Chinese Singapore 100 100 Provision of training/ Language Limited professional development
courses for Chineselanguage teachers andconduct of educationalresearch and activities
@ NIE International Singapore 100 100 Provision of training Private Limited programs and consultancy
in teacher education and school leadership
@ Wealth Management Institute Singapore 100 - Provision of education Pte Ltd (i) and training services for
professional andmanagement development
NOTES TOFINANCIAL STATEMENTS31 MARCH 2018
NOTES TOFINANCIAL STATEMENTS31 MARCH 2018
6 SUBSIDIARIES (CONT’D)
Details of subsidiaries are as follows (cont’d):
Ownershipinterest Principal activitiesName of subsidiary
Country ofincorporation
2018 2017
% %
@ National Institute of Early Singapore 100 - Provide early childhood Childhood Development training and related Limited (ii) services for pre-service
professionals
# Friends of NTU(iii) United States 40 100 Promote the advancement of NTUin United States
Held by Nanyang Technological University - NTUitive Pte Ltd
@ Code Farm Pte Ltd Singapore 100 100 Research and (formerly known as TechBiz development of other Xccelerator Pte Ltd) software and programming
activities
@ TechXcel Pte Ltd Singapore 100 100 Research andexperimentaldevelopment on natural sciences
@ Systemed Pte Ltd Singapore 100 100 Development andcommercialisationin medical technology
@ Techbridge Ventures Pte Ltd Singapore 100 100 Engineering activities, research and experimental development on engineering

THE ARC OF EXCELLENCE60 61NTU ANNUAL REPORT 2018
6 SUBSIDIARIES (CONT’D)
Details of subsidiaries are as follows (cont’d):
Name of subsidiaryCountry ofincorporation
Ownershipinterest Principal activities
2018 2017
% %
Held by NTU Holdings Pte Ltd
* Nanyang Venture Consulting China 100 100 Consultant for enterprise (Shanghai) Co., Ltd management,
technology andeducation
@ Confucius Institute, Singapore 100 100 Promotion of Chinese NTU Pte Ltd language, culture and
support of local Chinese
teaching
# NTU (London) Limited United Kingdom 100 100 Promote the advancement of NTU in United Kingdom
Held by Nanyang Venture Consulting (Shanghai) Co., Ltd
* Nanyang Venture Consulting (Beijing) Co., Ltd
China 100 100 Consultant for enterprise management, technology and education
* Audited by overseas practices of Deloitte Touche Tohmatsu Limited.@ Audited by Deloitte & Touche LLP, Singapore.# Not required to be audited in the country of incorporation.(i) The subsidiary was acquired on 19 July 2017.(ii) The subsidiary was incorporated on 2 March 2018.(iii) Due to change in board composition during the year, the Group reclassified the entity from subsidiary to associate due to an effective
loss of control (Note 7).
NOTES TOFINANCIAL STATEMENTS31 MARCH 2018
NOTES TOFINANCIAL STATEMENTS31 MARCH 2018
7 ASSOCIATE AND JOINT VENTURE
Group University Company
2018 2017 2018 2017
$’000 $’000 $’000 $’000
Cost of investment 350 512 - -
Loan to associate 417 507 - -
Share of post-acquisition loss (128) (278) 3 -
639 741 3 -
The convertible loan to associate bears interest at 4% per annum, unsecured and matures in 2019.
Details of the associates are as follows:
Name of associateCountry ofincorporation
Group’s proportion ofownership interest/ voting power held Principal activities
2018 2017% %
Kuprion Inc (i) United States 53.7 48.28 Development and commercialisation in NanoCopper technology
InnoPartner Pte Ltd (ii) Singapore 20 - Engineering activities, research and experimental development on engineering

THE ARC OF EXCELLENCE62 63NTU ANNUAL REPORT 2018
7 ASSOCIATE AND JOINT VENTURE (CONT’D)
Details of the associates are as follows (cont’d):
Name of associateCountry ofincorporation
Group’s proportion ofownership interest/ voting power held Principal activities
2018 2017% %
Friends of NTU United States 40 - Promote the advancement of NTU in United States
GenomeAsia 100k Ltd Singapore 33.3 - Data processing and related activities
Details of the joint ventures are as follows:
Name of joint venturerCountry ofincorporation
Group’s proportion ofownership interest/ voting power held Principal activities
2018 2017% %
Lushang (Nanyang) Pte Ltd (iii)
Singapore 30 30 Other information technology and computerservice activities
(i) During the year, there is a restructuring exercise that resulted in a change in the Group’s proportion of ownership interest/voting power held in Kuprion Inc. However, the Group does not have effective control of Kuprion Inc.
(ii) The Group via its wholly-owned subsidiary acquired a 20% equity interests in InnoPartner Pte Ltd during the year.
(iii) The Group has joint control over Lushang (Nanyang) Pte Ltd by virtue that all significant matters requiring unanimous approval by all the directors and shareholders.
8 AVAILABLE-FOR-SALE FINANCIAL ASSETS
Group 2018 2017 $’000 $’000
Quoted equity investments, at fair value 900 949Unquoted equity investments, at fair value 2,798 448
3,698 1,397
NOTES TOFINANCIAL STATEMENTS31 MARCH 2018
9 STUDENT LOANS
Group and University Company
2018 2017
$’000 $’000
Student loans 4,186 4,103
Represented by:
Amount repayable within 12 months 1,465 1,445
Amount repayable after 12 months 2,721 2,658
4,186 4,103
The student loans are unsecured, interest-free and repayable over a period of 2 to 5 years.
10 DERIVATIVE FINANCIAL INSTRUMENTS
The table below sets out the notional principal amounts and the positive and negative fair values of the Group’s and University Company’s outstanding derivative financial instruments at the end of the reporting period (comprising foreign currency forwards). Positive and negative fair values represent the mark-to-market values of the derivative contracts and are termed as derivative assets and derivative liabilities respectively. Notional principal amounts are the amount of principal underlying the contract at the end of reporting date.
Contractual maturity Fair value Within Derivative Derivative 1 year Total assets liabilities $’000 $’000 $’000 $’000
Group and University Company
2018
Foreign currency forwards 696,432 696,432 5,213 6
2017
Foreign currency forwards 694,679 694,679 11,739 11
Changes in the fair value of the foreign currency forwards are included as part of the fair value gain/(loss) on derivative financial instruments in Note 24.
NOTES TOFINANCIAL STATEMENTS31 MARCH 2018
THE ARC OF EXCELLENCE64 65NTU ANNUAL REPORT 2018
11 TRADE AND OTHER RECEIVABLES
Group University Company Note 2018 2017 2018 2017
$’000 $’000 $’000 $’000
Trade receivables 37,083 37,305 31,761 35,718Interest receivables 1,701 2,011 1,689 2,002Operating grant receivables 11,383 1,378 11,034 466Research grant receivables 121,444 84,113 121,444 84,113Endowment matching grant receivables - - - -Grants receivables 15 11,055 12,624 11,055 12,624
Other receivables 85,071 68,228 79,407 64,661Allowance for doubtful receivables (3,357) (1,236) (3,357) (1,206)
81,714 66,992 76,050 63,455
Amounts due from subsidiaries (trade) - - 690 426Allowance for doubtful receivables - - (168) (147)
- - 522 279
Amounts due from subsidiaries (non-trade) - - 1,570 1,015Allowance for doubtful receivables - - (1,015) (1,015)
- - 555 -Amounts due from joint venture - - - -Loans and receivables 264,380 204,423 254,110 198,657Prepayments 25,341 22,327 24,805 21,831
289,721 226,750 278,915 220,488
The amounts due from subsidiaries are unsecured, interest-free and repayable on demand.
Concentration of credit risk relating to trade receivables is limited due to statutory boards, ministries and companies who provided funding for research activities. The Group’s historical experience in the collection of accounts receivables falls within the recorded allowances. Due to these factors, management believes that no additional credit risk beyond amounts provided for collection losses is inherent in the Group’s trade receivables.
Credit risk for other grant receivables is limited as these relate mainly to receivables from the Government Ministry.
NOTES TOFINANCIAL STATEMENTS31 MARCH 2018
12 FINANCIAL ASSETS AT FAIR VALUE THROUGH PROFIT OR LOSS
Group and University Company
2018 2017 $’000 $’000
Quoted fixed income investments 455,012 427,599Quoted equity investments 898,377 675,486Unquoted investments 1,056,842 1,060,858Other investments 232,732 237,063
2,642,963 2,401,006
The Group’s and University Company’s investments are managed by external fund managers. The fair values of the financial instruments traded in active markets are based on quoted market prices at the end of the reporting period. Quoted fixed income investments include investments in fixed income instruments via segregated accounts and pooled vehicles. Quoted equity investments represent investments in quoted equities via segregated accounts and pooled vehicles. The unquoted investments represent investments in private equity funds, hedge funds and limited partnerships. The fair values of these unquoted investments are based on net asset values provided by fund managers, fund administrators and external valuations.
The Group’s and University Company’s investments comprise financial instruments (quoted fixed income, quoted equity, unquoted investments and other investments) managed by external fund managers and cash balances and bank deposits as follows:
Group and University Company
Note 2018 2017 $’000 $’000
Financial assets at fair value through profit or loss 2,642,963 2,401,006Cash balances and bank deposits 13 141,186 268,968
2,784,149 2,669,974
The cash balances and bank deposits are included as a component in the cash and cash equivalents in Note 13 for the purpose of disclosure.
NOTES TOFINANCIAL STATEMENTS31 MARCH 2018

THE ARC OF EXCELLENCE66 67NTU ANNUAL REPORT 2018
12 FINANCIAL ASSETS AT FAIR VALUE THROUGH PROFIT OR LOSS (CONT’D)
The weighted average interest rates of fixed income securities at the end of the reporting period and the periods in which they mature are as follows:
Fixed interest rate securities maturing
Effective interest rate per annum
Less than 1 year
In 1 to 5 years
After 5 years Total
% $’000 $’000 $’000 $’000
Group and University Company
2018 1.8 to 3.6 - 167,629 186,138 353,767
2017 1.1 to 3.7 - 156,238 174,228 330,466
13 CASH AND CASH EQUIVALENTS Group University Company
Note 2018 2017 2018 2017 $’000 $’000 $’000 $’000
OperatingCash at bank and in hand 177,421 129,811 156,497 102,318Deposit with financial institutions 760,068 908,767 752,323 905,025
937,489 1,038,578 908,820 1,007,343InvestmentsCash at bank and in hand 10,553 122,324 10,553 122,324Deposit with financial institutions 46,000 122,000 46,000 122,000
56,553 244,324 56,553 244,324Money market funds and cash held by custodian banks 84,633 24,644 84,633 24,644
12 141,186 268,968 141,186 268,968
Cash and cash equivalents 1,078,675 1,307,546 1,050,006 1,276,311
The University Company administers 2 bank accounts on behalf of the NTU Students’ Union. As at end of the reporting period, the total bank balance of $6,507,000 (2017: $6,065,000) has not been included in the cash and cash equivalents of the University Company.
NOTES TOFINANCIAL STATEMENTS31 MARCH 2018
14 DEFERRED CAPITAL GRANTS
Government ministries Statutory boards Others Total
2018 2017 2018 2017 2018 2017 2018 2017 $’000 $’000 $’000 $’000 $’000 $’000 $’000 $’000
Group
At 1 April 1,215,883 1,106,036 81,111 88,645 30,242 22,904 1,327,236 1,217,585Add:Grants received for capital expenditure and development project transferred from - Operating grants (Note 26) 17,896 18,172 - - - - 17,896 18,172 - Research grants (Note 19) 28,411 32,969 10,966 7,065 2,155 2,407 41,532 42,441 - Development grants (Note 15) 230,752 201,044 - 1,198 - - 230,752 202,242 - Other grants 2,174 1,618 9,531 6,329 13,046 10,681 24,751 18,628Assets donated by various organisations - - 33 - 309 362 342 362
279,233 253,803 20,530 14,592 15,510 13,450 315,273 281,845Less:Grants taken to profit or lossAmortisation charge for the year 176,022 143,425 22,205 21,983 7,781 5,822 206,008 171,230On disposal of fixed assets 1,715 531 887 143 8 290 2,610 964
177,737 143,956 23,092 22,126 7,789 6,112 208,618 172,194At 31 March 1,317,379 1,215,883 78,549 81,111 37,963 30,242 1,433,891 1,327,236
NOTES TOFINANCIAL STATEMENTS31 MARCH 2018

THE ARC OF EXCELLENCE68 69NTU ANNUAL REPORT 2018
14 DEFERRED CAPITAL GRANTS (CONT’D)
Government ministries Statutory boards Others Total
2018 2017 2018 2017 2018 2017 2018 2017 $’000 $’000 $’000 $’000 $’000 $’000 $’000 $’000
University Company
At 1 April 1,215,836 1,105,985 81,111 88,451 30,242 22,904 1,327,189 1,217,340Add:Grants received for capital expenditure and development project transferred from - Operating grants 17,821 18,155 - - - - 17,821 18,155 - Research grants (Note 19) 28,411 32,969 10,966 7,065 2,155 2,407 41,532 42,441 - Development grants (Note 15) 230,752 201,044 - 1,198 - - 230,752 202,242 - Other grants 2,174 1,618 9,531 6,254 13,046 10,681 24,751 18,553Assets donated by various organisations - - 33 - 309 362 342 362
279,158 253,786 20,530 14,517 15,510 13,450 315,198 281,753Less:Grants taken to profit or lossAmortisation charge for the year 176,002 143,404 22,205 21,790 7,781 5,822 205,988 171,016On disposal of fixed assets 1,715 531 887 67 8 290 2,610 888
177,717 143,935 23,092 21,857 7,789 6,112 208,598 171,904At 31 March 1,317,277 1,215,836 78,549 81,111 37,963 30,242 1,433,789 1,327,189
NOTES TOFINANCIAL STATEMENTS31 MARCH 2018
15 GRANTS RECEIVABLE/IT AND F&E GRANTS/SINKING FUND RECEIVED IN ADVANCE
Group and University Company
Note 2018 2017 $’000 $’000
Grants receivable within 12 months- Development grant 2,109 10,937- Sinking fund 8,946 1,687Subtotal 11 11,055 12,624
Grants received in advance- IT and F&E (a) (40,937) (44,793)- Sinking fund (b) (299,379) (291,974)Subtotal (340,316) (336,767)
Total (329,261) (324,143)
Grants received in advance represented as:Current portion- IT and F&E (40,937) (44,793)- Sinking fund (48,304) (35,788)
(89,241) (80,581)Non-current portion- Sinking fund (251,075) (256,186)
(340,316) (336,767)
Movements in grants (received in advance)/receivable: Group and
University Company Note 2018 2017
$’000 $’000
At 1 April (324,143) (300,119)Grants received during the year (258,728) (247,701)
(582,871) (547,820)Less:Amounts transferred to deferred capital grants 14 230,752 202,242Amount refunded to the Government Ministry - 4,637Amounts taken to profit or loss 22,858 16,798At 31 March (329,261) (324,143)
NOTES TOFINANCIAL STATEMENTS31 MARCH 2018

THE ARC OF EXCELLENCE70 71NTU ANNUAL REPORT 2018
15 GRANTS RECEIVABLE/IT AND F&E GRANTS/SINKING FUND RECEIVED IN ADVANCE (CONT’D)
These are grants from the Government Ministry and statutory boards for financing development projects.
(a) This amount relates to grants received in advance for the purchase of IT and F&E items to support teaching and administrative functions.
(b) This amount relates to sinking fund received in advance from the Government Ministry for the purpose of maintenance and replacement of property, plant and equipment.
16 PROVISIONS
Group University Company Note 2018 2017 2018 2017
$’000 $’000 $’000 $’000
Provision for unutilised compensated leave (a) 59,470 57,549 59,030 57,231Provision for undergraduate funding (b) - 27,252 - 27,252Provision for MOE budget adjustment (c) 8,000 23,100 8,000 23,100
67,470 107,901 67,030 107,583
(a) The movement in the provision for unutilised compensated leave is as follows:
Group University Company 2018 2017 2018 2017 $’000 $’000 $’000 $’000
At 1 April 57,549 53,136 57,231 52,829Provision made during the year 1,921 4,413 1,799 4,402At 31 March 59,470 57,549 59,030 57,231
(b) The movement in the provision for undergraduate funding is as follows:
Group University Company 2018 2017 2018 2017 $’000 $’000 $’000 $’000
At 1 April 27,252 47,085 27,252 47,085Provision (reversed)/made during the year (18,412) 2,911 (18,412) 2,911Amount paid (8,840) (22,744) (8,840) (22,744)At 31 March - 27,252 - 27,252
NOTES TOFINANCIAL STATEMENTS31 MARCH 2018
16 PROVISIONS (CONT’D)
Provision for undergraduate funding relates to the adjustment to the undergraduate output funding from MOE in the event the University Company achieves fewer undergraduates than MOE’s output target. The provision is based on the University Company’s actual and projected number of undergraduates. Due to a change in MOE’s undergraduate funding model from output-based to enrolment-based with effect from 2019 for both new and existing cohorts, the provision previously set aside was no longer required and had been written back.
(c) The movement in the provision for MOE budget adjustment is as follows:
Group University Company 2018 2017 2018 2017 $’000 $’000 $’000 $’000
At 1 April 23,100 - 23,100 -Provision (reversed)/made during the year (15,100) 23,100 (15,100) 23,100At 31 March 8,000 23,100 8,000 23,100
Provision for MOE budget adjustment relates to the utilisation of budget allocation from MOE. The University Company, as an MOE-funded institution, is subject to the budget utilisation framework. Under this framework, on a yearly basis, NTU is required to submit its projections for grants from MOE for the operations of the University. MOE will allocate the required grants to NTU based on the projections submitted and should the projections fall below the 95% rate of the original and/or revised grant allocation, NTU is subjected to an utilisation adjustment by MOE.
17 GRANT RECEIVED IN ADVANCE - OPERATING GRANTS Group
2018 2017 $’000 $’000
At 1 April 6,406 4,970Grants received during the year 4,290 4,248
10,696 9,218Less:Amounts taken to profit or loss 3,524 2,795Amounts transferred to deferred capital grants 75 17At 31 March 7,097 6,406
This relates to grants received from the Government Ministry to finance the subsidiary’s operations. The balance in this account represents grant received but not utilised at the end of the financial year.
18 SHORT-TERM BORROWINGS
The borrowings are unsecured, bear interest at 1.54% (2017: 1.21%) per annum and are repayable within the next twelve months from the financial year end.
NOTES TOFINANCIAL STATEMENTS31 MARCH 2018
THE ARC OF EXCELLENCE72 73NTU ANNUAL REPORT 2018
19 RESEARCH GRANTS RECEIVED IN ADVANCE
Group University Company Note 2018 2017 2018 2017
$’000 $’000 $’000 $’000
At 1 April 98,636 102,802 91,836 99,887Grants received during the year 386,740 426,286 384,502 419,786
485,376 529,088 476,338 519,673Less:Amounts transferred to deferred capital grants 14 (41,532) (42,441) (41,532) (42,441)Amounts taken to profit or loss (383,883) (374,648) (379,413) (372,033)Amounts transferred to/(from) grant receivables 37,331 (13,363) 37,331 (13,363)At 31 March 97,292 98,636 92,724 91,836
These are grants received from the Government Ministry, other ministries, statutory boards and other sources for research activities. The balance in this account represents grants received but not utilised at the end of the financial year.
Research grants awarded from the Government Ministry, other ministries, statutory boards and other sources in 2018 amounted to $578,004,000 (2017: $578,617,000).
Research grants awarded from the Government Ministry, other ministries, statutory boards and other sources but not yet disbursed as at end of the financial year amounted to $1,003,285,000 (2017: $990,494,000).
20 CAPITAL ACCOUNT
The capital account represents the revaluation of the freehold land alienated to Nanyang Technological University (details are set out in Note 3).
21 ENDOWMENT FUND AND OTHER RESTRICTED FUND
The Endowment Fund comprises donations, grants, gifts, testamentary disposition and proceeds from gifts of movable or immovable properties. The objectives of this fund comprise the provision of facilities for teaching, training and research, the advancement and dissemination of knowledge and the promotion of research.
NOTES TOFINANCIAL STATEMENTS31 MARCH 2018
21 ENDOWMENT FUND AND OTHER RESTRICTED FUND (CONT’D)
Other Restricted Fund comprises the following funds that are ring-fenced to support their respective operations:
(i) Academic Centres - These are mainly teaching centres conducting courses and dedicated teaching programmes as well as research centres.
(ii) Non-Academic Centres - These are set-up to provide separate monitoring and management of facilities, for example halls of residence for students, housing for faculty and staff, Nanyang Executive Centre etc.
(iii) Autonomous Institutes - These comprise National Institute of Education, Lee Kong Chian School of Medicine, Earth Observatory of Singapore, Singapore Centre on Environmental Life Sciences Engineering, S. Rajaratnam School of International Studies, Wealth Management Institute @NTU and Chinese Heritage Centre.
(iv) Scholarship Fund - These comprise funds for the award of scholarships and bursaries.
22 FUNDS MANAGED ON BEHALF OF THE GOVERNMENT MINISTRY
Pursuant to the Tuition Fee Loan (TFL), Study Loan (SL) and Overseas Student Program Loan - 50% funded by MOE (OSP) schemes, the University Company acts as agent for these loans schemes and the Government Ministry as the financier providing the funds.
Group and University Company
2018 2017 $’000 $’000
Cash from the Government Ministry:At 1 April 207,488 207,494Cash received 56,535 57,306Interest income received on behalf of Government Ministry 3,507 3,713Repayments (58,654) (57,278)Bad debts incurred (59) (34)Interest income transferred to Government Ministry (3,507) (3,713)
205,310 207,488
Represented by:Net assets - TFL, SL and OSP 206,570 208,909Less: Amount receivable from Government Ministry (1,260) (1,421)
205,310 207,488
NOTES TOFINANCIAL STATEMENTS31 MARCH 2018

THE ARC OF EXCELLENCE74 75NTU ANNUAL REPORT 2018
22 FUNDS MANAGED ON BEHALF OF THE GOVERNMENT MINISTRY (CONT’D)
Cash and bank balances of $1,260,000 (2017: $1,421,000) are paid on behalf and receivable from the Government Ministry for the purpose of extending study loans to students.
Students on TFL, SL and OSP are to commence repayment upon graduation. Students are given an option to repay by monthly instalments of minimum amount of $100 over a period of up to 20 years (for TFL and SL) and 5 years (for OSP) after the borrowers’ graduation. Interest is charged at the average prime rates of three local banks prevailing on the first day of each quarter, or such other rates as may be determined from time to time. Interest charged in 2018 is 4.75% (2017: 4.75%) per annum.
The interest on the TFL, SL and OSP is remitted in full to the Government Ministry on a monthly basis.
23 INTEREST INCOME
Group 2018 2017 $’000 $’000
Interest received/receivable:- fixed deposits (placed with financial institutions) 5,143 6,253- bank balances 137 98
5,280 6,351
24 PROFIT ON INVESTMENTS
Group 2018 2017 $’000 $’000
Interest income 7,205 6,758Dividend income 2,978 3,183Fair value gain on financial assets through profit or loss 98,043 238,411Fair value gain/(loss) on derivative financial instruments 40,726 (23,999)
148,952 224,353
The fair value gains/(losses) on financial assets through profit or loss and on derivative financial instruments comprise net realised and unrealised gains/(losses).
NOTES TOFINANCIAL STATEMENTS31 MARCH 2018
25 DEFICIT BEFORE GRANTS FROM MINISTRIES
The following items have been included in arriving at deficit before grants from ministries:
Group 2018 2017 $’000 $’000
Allowance for doubtful receivables 2,121 221Exchange loss 132 77Operating lease expense 9,586 8,331Contribution to defined contribution plans included in expenditure on manpower 70,781 65,570Government grants - Special Employment Credit, Wage Credit and Temporary Employment Credit offset against manpower costs (5,302) (5,622)
26 OPERATING GRANTS FROM GOVERNMENT MINISTRY Group
Note 2018 2017 $’000 $’000
Operating grants received and receivable during the year 578,159 570,987Payment for goods and services tax on tuition fees and tuition grants (53,329) (53,953)Amounts transferred to- deferred capital grants 14 (17,896) (18,172)- grant received in advance 17 (691) (1,436)Provision reversed/(made) for undergraduate funding 16(b) 18,412 (2,911)Provision reversed/(made) for MOE budget adjustment 16(c) 15,100 (23,100)Operating grants taken to profit or loss 539,755 471,415
27 TAXATION
The University Company is registered as a charitable institution by virtue of Section 13 of the Income Tax Act, Chapter 134.
The subsidiaries of the Group have unabsorbed tax losses and unutilised capital allowances of approximately $2,545,000 (2017: $1,330,000) and $Nil (2017: $6,000) respectively which are available for offset against future taxable income. Deferred tax assets have not been recognised in respect of these items because it is not probable that future taxable profit will be available against which the subsidiaries can utilise the benefit.
NOTES TOFINANCIAL STATEMENTS31 MARCH 2018

THE ARC OF EXCELLENCE76 77NTU ANNUAL REPORT 2018
27 TAXATION (CONT’D)
The unabsorbed tax losses and unutilised capital allowances of the subsidiaries are subject to agreement by the tax authorities and compliance with the tax regulations in the respective countries in which certain subsidiaries operate. These temporary differences do not expire under current tax legislation.
Group 2018 2017 $’000 $’000
Current tax expenseCurrent year 259 306
Reconciliation of effective tax
Surplus before income tax 120,491 181,156
Income tax using Singapore tax rates of 17% 20,483 30,797Income not subject to tax (20,224) (30,491)Expenses not deductible for tax purposes - -
259 306
28 COMMITMENTS
Operating lease commitments
The future lease payments contracted at the reporting date but not recognised as liabilities are analysed as follows:
Group 2018 2017 $’000 $’000
Not later than one year 6,668 9,931Later than one year but not later than five years 6,578 10,495
The Group and the University Company leases office properties, personal computers, printers and servers under operating leases. The leases typically run for a period of 1 to 5 years.
NOTES TOFINANCIAL STATEMENTS31 MARCH 2018
28 COMMITMENTS (CONT’D)
Capital commitments Group
2018 2017 $’000 $’000
Contracted but not provided for 148,777 176,718Authorised but not contracted for 518,606 434,982
The capital commitments are funded from grants from the Government Ministries, subject to satisfying certain terms and conditions.
Group 2018 2017 $’000 $’000
Uncalled capital commitments to unquoted investments- contracted but not provided for 280,993 175,844
Collaboration with Imperial College of Science, Technology and Medicine
On 27 August 2010, NTU and Imperial College of Science, Technology and Medicine entered into an agreement in relation to a collaboration for the establishment and operation of a medical school in Singapore. As at 31 March 2018, NTU’s outstanding commitment under the collaboration is estimated at £10.7 million ($19.9 million) (2017: £15.6 million ($27.3 million)) till the expiry of the agreement on 31 July 2028.
29 SIGNIFICANT RELATED PARTY INFORMATION
Related party transactions
The Government of Singapore has control over the Group as the operations of the University Company is substantially funded through Government grants, with MOE having the power to appoint and remove members to the Board of Trustees of the University Company. Consequently, the Group has invoked the exemption from disclosure requirements of FRS 24 in relation to related party transactions and outstanding balances (including commitments) with the Government of Singapore.
The Group has significant transactions with the Government of Singapore in the form of purchase of goods and services and rendering of services. Such purchases and sales are made to various Government agencies in Singapore and collectively approximate $19.9 million (2017: $19.8 million) and $25.6 million (2017: $29.9 million).
NOTES TOFINANCIAL STATEMENTS31 MARCH 2018

THE ARC OF EXCELLENCE78 79NTU ANNUAL REPORT 2018
29 SIGNIFICANT RELATED PARTY INFORMATION (CONT’D)
Other than disclosed elsewhere in the financial statements, the Group had the following significant transactions with related parties during the year on terms agreed between the parties as follows:
Group 2018 2017 $’000 $’000
(a) Key management personnel compensationShort-term employee benefits (includes the remuneration of an executive trustee) 4,342 5,313
(b) Services renderedConsultancy fees paid to a Trustee 200 224
30 FINANCIAL INSTRUMENTS, FINANCIAL RISKS AND CAPITAL RISKS MANAGEMENT
Categories of financial instruments
The following table sets out the financial instruments as at the end of the reporting period:
Group University Company 2018 2017 2018 2017 $’000 $’000 $’000 $’000
Financial Assets
Loans and receivables (including cash and cash equivalents) 1,347,241 1,516,072 1,308,302 1,479,071Available-for-sale financial assets 3,698 1,397 - -Fair value through profit or loss 2,642,963 2,401,006 2,642,963 2,401,006Derivative financial instruments 5,213 11,739 5,213 11,739
3,999,115 3,930,214 3,956,478 3,891,816
Financial Liabilities
Amortised cost 458,402 540,805 453,056 536,184Derivative financial instruments 6 11 6 11
458,408 540,816 453,062 536,195
NOTES TOFINANCIAL STATEMENTS31 MARCH 2018
30 FINANCIAL INSTRUMENTS, FINANCIAL RISKS AND CAPITAL RISKS MANAGEMENT (CONT’D)
Overview
The Group has exposure to the following risks from its use of financial instruments:
• credit risk • liquidity risk • interest risk • price risk • foreign currency risk • capital risk
This note presents information about the Group’s exposure to each of the above risks, the Group’s objectives, policies and processes for measuring and managing risk, and the Group’s management of capital. Further quantitative disclosures are included throughout these financial statements.
Credit risk management
Cash and investments in financial assets
Cash and deposits are placed with reputable financial institutions. Investment portfolios are managed by external fund managers.
The maximum exposure to credit risk in the event that the counterparties fail to perform their obligations in relation to each class of recognised financial asset is the carrying amount of those assets as stated in the statements of financial position.
The credit risk is diversified over a range of institutions.
Trade and other receivables
Credit risk is the potential loss resulting from the failure of a customer or a counterparty to settle its financial and contractual obligations to the Group, as and when they fall due.
NOTES TOFINANCIAL STATEMENTS31 MARCH 2018

THE ARC OF EXCELLENCE80 81NTU ANNUAL REPORT 2018
30 FINANCIAL INSTRUMENTS, FINANCIAL RISKS AND CAPITAL RISKS MANAGEMENT (CONT’D)
Credit risk management (cont’d)
The carrying amount of financial assets, grossed up for any provision, represents the maximum credit exposure. At the end of the reporting period, the credit risk is mainly due from customers in Singapore but there is no significant concentration of credit risk arising receivables due from any individual other than grant receivables from the Government Ministry.
The Group manages its credit risk with regular monitoring and following up actions for the debts outstanding from debtors. Additional information is set out in Note 11.
The aging of loans and receivables at the reporting date is:
2018 2017
Gross
Allowance for doubtful receivables Gross
Allowance for doubtful receivables
$’000 $’000 $’000 $’000
GroupNot past due 238,051 - 180,349 -Past due 1 to 30 days 13,810 - 10,919 -Past due 31 to 150 days 8,554 - 6,250 -More than 151 days 7,322 3,357 8,141 1,236
267,737 3,357 205,659 1,236
University CompanyNot past due 231,172 - 175,322 -Past due 1 to 30 days 13,606 - 10,845 -Past due 31 to 150 days 5,526 - 5,646 -More than 151 days 8,346 4,540 9,212 2,368
258,650 4,540 201,025 2,368
The movement in the allowance for doubtful receivables in respect of loans and receivables during the year is as follows:
Group University Company 2018 2017 2018 2017 $’000 $’000 $’000 $’000
At 1 April 1,236 1,015 2,368 2,177Allowance charged 2,121 221 2,172 191At 31 March 3,357 1,236 4,540 2,368
NOTES TOFINANCIAL STATEMENTS31 MARCH 2018
30 FINANCIAL INSTRUMENTS, FINANCIAL RISKS AND CAPITAL RISKS MANAGEMENT (CONT’D)
Liquidity risk management
Liquidity risk is the risk that the Group will encounter difficulty in meeting the obligations associated with its financial liabilities that are settled by delivering cash or another financial asset. The contracted undiscounted cash outflows on financial liabilities approximate their carrying amounts and are generally settled within one year. The Group’s approach to managing liquidity is to ensure, as far as possible, that it will always have sufficient liquidity to meet its liabilities when due, under both normal and stressed conditions, without incurring unacceptable losses or risking damage to the Group’s reputation.
The Group monitors its liquidity risk and maintains a level of cash and cash equivalents deemed adequate to finance the Group’s operations and to mitigate the effects of fluctuations in cash flow. Typically the Group ensures that it has sufficient cash on demand to meet expected operational expenses including the servicing of financial obligations; this excludes the potential impact of extreme circumstances that cannot be reasonably predicted.
In addition, the Group maintains the following lines of credit:
• $11 million bankers’ guarantee facility that is unsecured. • $540 million that can be drawn down to meet short-term financing needs.
Interest risk management
Surplus funds from the Group’s operations are invested in bank deposits and with fund managers. The Group has no material exposure to interest rate risk from fixed deposits and borrowings as the interest rates are on fixed rate basis. The Group’s investments in fixed income securities that are managed by fund managers (classified as financial assets at fair value through profit or loss) are exposed to interest rate risk.
Sensitivity analysis for interest risk
If movements in interest rates result in a 3% (2017: 3%) appreciation/depreciation in the value of the fixed income investments, all other variables being held constant, the Group’s surplus would have been higher/lower by $13,650,000 (2017: $12,828,000).
NOTES TOFINANCIAL STATEMENTS31 MARCH 2018

THE ARC OF EXCELLENCE82 83NTU ANNUAL REPORT 2018
30 FINANCIAL INSTRUMENTS, FINANCIAL RISKS AND CAPITAL RISKS MANAGEMENT (CONT’D)
Market risk - Price risk management
The Group is exposed to equity securities price risk from investments classified as financial assets at fair value through profit or loss. The market values of these investments are affected by, amongst others, changes in market prices as a result of changes in the global economic conditions, macro and micro economic factors affecting the country where the investments are quoted, and factors specific to the investee corporations.
To manage the price risk arising from investment in equity securities, the Group diversifies its portfolio across different markets and industries as appropriate.
Sensitivity analysis for price risk
If movements in financial markets result in a 5% (2017: 5%) appreciation/depreciation in the value of the quoted equity and other investments, all other variables being held constant, the Group’s surplus would have been higher/lower by $56,473,000 (2017: $45,483,000).
If movements in financial markets result in a 5% (2017: 5%) appreciation/depreciation in the value of the unquoted investments, all other variables being held constant, the Group’s surplus would have been higher/lower by $52,842,000 (2017: $53,043,000).
Foreign currency risk management
The Group’s investments which are managed by fund managers may be in instruments denominated in foreign currencies. Currency exposure arising from such investments is managed by fund managers. Additional information is set out in Note 10.
The main foreign currency exposure of investments (net of foreign currency forwards) based on information provided to management is as follows:
Japanese Pound US Dollar Euro Yen Sterling Others $’000 $’000 $’000 $’000 $’000
2018 833,154 68,117 37,476 45,103 380,980
2017 750,180 50,801 24,178 28,123 306,984
NOTES TOFINANCIAL STATEMENTS31 MARCH 2018
30 FINANCIAL INSTRUMENTS, FINANCIAL RISKS AND CAPITAL RISKS MANAGEMENT (CONT’D)
Foreign currency risk management (cont’d)
Sensitivity analysis for currency risk
If the relevant foreign currency changes against the Singapore dollar by 5% (2017: 5%), all other variables being held constant, the effects will be as follows:
Profit or Loss 2018 2017 $’000 $’000
Increase/(Decrease)
US Dollar against Singapore DollarStrengthened 41,658 37,509Weakened (41,658) (37,509)
Euro against Singapore DollarStrengthened 3,406 2,540Weakened (3,406) (2,540)
Japanese Yen against Singapore DollarStrengthened 1,874 1,209Weakened (1,874) (1,209)
Pound Sterling against Singapore DollarStrengthened 2,255 1,406Weakened (2,255) (1,406)
Estimating the fair values
Financial assets at fair value through profit or loss
The fair values of financial assets traded in active markets are based on quoted market prices at the end of the reporting period.
The fair values of unquoted investments are based on net asset values provided by fund managers, fund administrators and external valuations.
Available-for-sale financial assets
Quoted and unquoted equity investments are stated at fair value. The fair value of quoted equity investments are determined based on market prices at the end of the reporting period. The fair value of unquoted equity investments are estimated based on recent transactions and reference to other similar investments.
NOTES TOFINANCIAL STATEMENTS31 MARCH 2018

THE ARC OF EXCELLENCE84 85NTU ANNUAL REPORT 2018
30 FINANCIAL INSTRUMENTS, FINANCIAL RISKS AND CAPITAL RISKS MANAGEMENT (CONT’D)
Estimating the fair values (cont’d)
Non-derivative financial liabilities
Fair value, which is determined for disclosure purposes, is calculated based on the present value of future principal and interest cash flows, discounted at the market rate of interest at reporting date.
Other financial assets and liabilities
The carrying amounts of financial assets and liabilities with a maturity of less than one year (including trade and other receivables, cash and cash equivalents, other payables and accruals, and short-term borrowings) are assumed to approximate their fair values. The fair values of other classes of financial assets and liabilities are disclosed in the respective notes to financial statements.
Fair value hierarchy
The table below analyses financial instruments carried at fair value, by valuation method. The different levels have been defined as follows:
• Level 1: quoted prices (unadjusted) in active markets for identical assets or liabilities
• Level 2: inputs other than quoted prices included within Level 1 that are observable for the asset or liability, either directly (i.e., as prices) or indirectly (i.e., derived from prices)
• Level 3: inputs for the asset or liability that are not based on observable market data (unobservable inputs)
NOTES TOFINANCIAL STATEMENTS31 MARCH 2018
30 FINANCIAL INSTRUMENTS, FINANCIAL RISKS AND CAPITAL RISKS MANAGEMENT (CONT’D)
Fair value hierarchy (cont’d)
Level 1 Level 2 Level 3 Total $’000 $’000 $’000 $’000
Group
31 March 2018Available-for-sale financial assets 900 - 2,798 3,698Financial assets at fair value through profit or loss 1,586,121 607,057 449,785 2,642,963Derivative financial assets - 5,213 - 5,213
1,587,021 612,270 452,583 2,651,874
Derivative financial liabilities - 6 - 6
31 March 2017Available-for-sale financial assets 949 - 448 1,397Financial assets at fair value through profit or loss 1,340,148 620,206 440,652 2,401,006Derivative financial assets - 11,739 - 11,739
1,341,097 631,945 441,100 2,414,142
Derivative financial liabilities - 11 - 11
University Company
31 March 2018Financial assets at fair value through profit or loss 1,586,121 607,057 449,785 2,642,963Derivative financial assets - 5,213 - 5,213
1,586,121 612,270 449,785 2,648,176
Derivative financial liabilities - 6 - 6
31 March 2017Financial assets at fair value through profit or loss 1,340,148 620,206 440,652 2,401,006Derivative financial assets - 11,739 - 11,739
1,340,148 631,945 440,652 2,412,745
Derivative financial liabilities - 11 - 11
NOTES TOFINANCIAL STATEMENTS31 MARCH 2018
THE ARC OF EXCELLENCE86 87NTU ANNUAL REPORT 2018
30 FINANCIAL INSTRUMENTS, FINANCIAL RISKS AND CAPITAL RISKS MANAGEMENT (CONT’D)
Fair value hierarchy (cont’d)
There were no transfers between Level 1, 2 and 3 of the fair value hierarchy in 2017 and 2018.
Assets measured at fair value based on Level 3:
Financial assets designated at
fair value through
profit or loss
Unquoted investments
Available-for-sale financial assets
Unquoted investments
Total
Unquoted investments
2018 2017 2018 2017 2018 2017 $’000 $’000 $’000 $’000 $’000 $’000
Group
At 1 April 440,652 450,395 448 - 441,100 450,395Gains/(Losses) in total comprehensive income 33,263 42,953 1,803 (552) 35,066 42,401Subscriptions/Contributions 68,736 56,573 547 1,000 69,283 57,573Redemptions/Distributions (92,866) (109,269) - - (92,866) (109,269)At 31 March 449,785 440,652 2,798 448 452,583 441,100
Gains/(Losses) included in totalcomprehensive income forthe period (above) arepresented as follows:
Gains/(Losses) included in total comprehensive income for the period 33,263 42,953 1,803 (552) 35,066 42,401
Gains/(Losses) for the period included in total comprehensive income for assets held at the end of the reporting period 33,263 42,953 1,803 (552) 35,066 42,401
NOTES TOFINANCIAL STATEMENTS31 MARCH 2018
30 FINANCIAL INSTRUMENTS, FINANCIAL RISKS AND CAPITAL RISKS MANAGEMENT (CONT’D)
Fair value hierarchy (cont’d)
Assets measured at fair value based on Level 3: Financial assets designated at
fair value through profit or loss
Unquoted investments
2018 2017 $’000 $’000
University Company
At 1 April 440,652 449,895Gains in profit or loss 33,263 42,953Subscriptions/Contributions 68,736 57,073Redemptions/Distributions (92,866) (109,269)At 31 March 449,785 440,652
Gains included in profit or loss for the period (above) are presented as follows:
Gains included in profit or loss for the period 33,263 42,953
Gains for the period included in profit or loss for assets held at the end of the reporting period 33,263 42,953
Capital risk management policies and objectives
The capital structure of the Group consists of funds and accumulated surplus. Risk management is integral to the activities of the Group. The Group has controls in place to create an acceptable balance between the cost of risks occurring and the cost of managing the risks. Management continually monitors its risk management processes to ensure that an appropriate balance between risk and control is achieved. Risk management processes are reviewed regularly to reflect changes in the Group’s activities. The Group’s overall strategy remains unchanged from 2017.
31 CHARITY ACT AND REGULATIONS
As required for disclosure under Section 17(1) of the Charities (Institutions of a Public Character) Regulations, the University Company has received total tax deductible donations of $25,864,000 (2017: $16,004,000) in the current financial year.
NOTES TOFINANCIAL STATEMENTS31 MARCH 2018

NANYANG TECHNOLOGICAL UNIVERSITY, SINGAPORE
Reg No: 200604393R
50 Nanyang AvenueSingapore 639798Tel: (65) 6791 1744Fax: (65) 6791 1604
www.ntu.edu.sg