the arts and achievement in at-risk youth: findings … · the arts and achievement in at-risk...
TRANSCRIPT
National Endowment for the Arts
The Arts and Achievement in At-Risk Youth: Findings from
Four Longitudinal Studies
James S. Catterall, University of California Los Angeles
with Susan A. Dumais,
Louisiana State University and
Gillian Hampden-Thompson, University of York, U.K.

National Endowment for the Arts
The Arts and Achievement in At-Risk Youth: Findings from
Four Longitudinal StudiesResearch Report #55
James S. Catterall, University of California Los Angeles with Susan A. Dumais, Louisiana State University and Gillian Hampden-Thompson, University of York, U.K.
Research Report #55
March 2012
National Endowment for the Arts 1100 Pennsylvania Avenue, NW Washington, DC 20506-0001Telephone: 202-682-5400 arts.gov
Prepared for the Office of Research & Analysis by James S. Catterall, University of California Los Angeles, with Susan A. Dumais, Louisiana State University, and Gillian Hampden-Thompson, University of York, U.K.
Produced by the Office of Research & Analysis Sunil Iyengar, Director Ellen Grantham, Program Analyst
Other staff contributors: Nona Milstead, Bonnie Nichols, Steven Shewfelt, and Patricia Moore Shaffer
Designed by Roman/Thayer Design Inc.
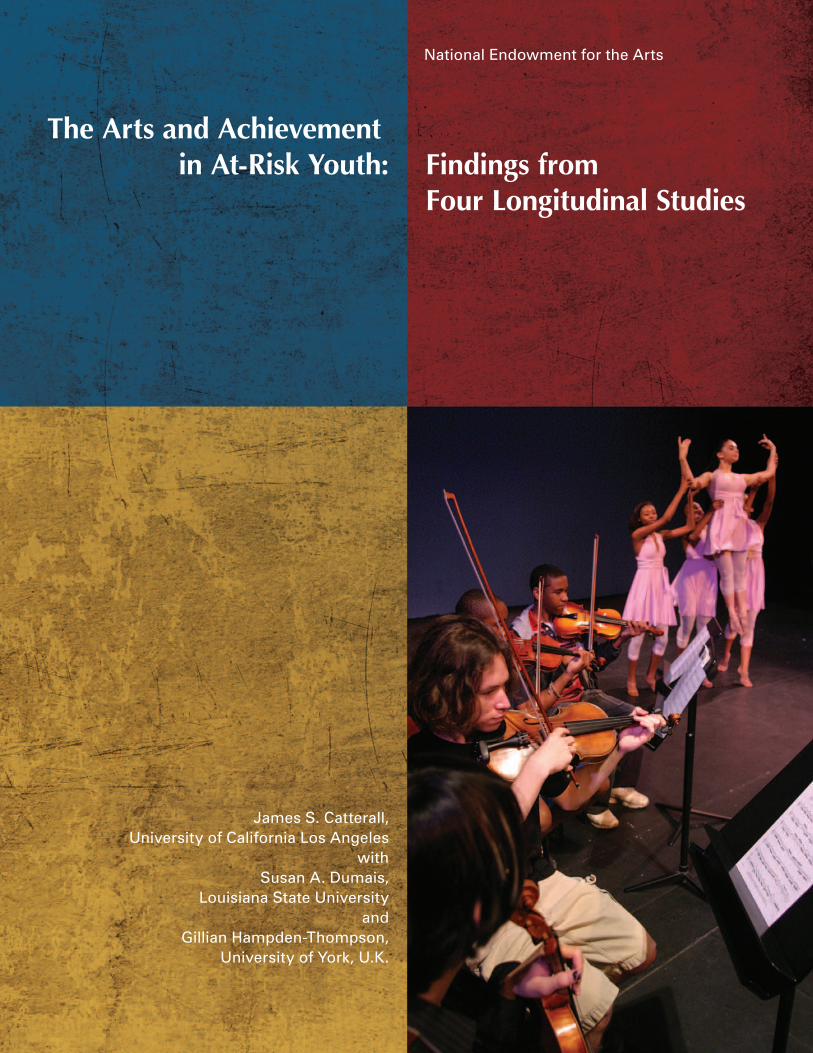
Front Cover Photo: The Lusher Charter School in New Orleans, Louisiana, is an arts-integrated public school that offers a curriculum in a range of creative disciplines and integrates the arts into academic classrooms as a mode of conceptual engagement and critical thinking. Photo courtesy of Lusher Charter School
Printed in the United States of America
Library of Congress Cataloging-in-Publication Data
Catterall, James S. The arts and achievement in at-risk youth : findings from four longitudinal studies / James S. Catterall, University of California Los Angeles with Susan A. Dumais, Louisiana State University and Gillian Hampden-Thompson, University of York, U.K. pages cm -- (Research report ; #55) 1. Problem youth--Services for--United States--Longitudinal studies. 2. Arts and youth--United States--Longitudinal studies. I. Dumais, Susan A., 1971- II. Hampden-Thompson, Gillian. III. Title. HV1431.C38 2012 362.74’8--dc23 2012006524
202-682-5496 Voice/TTY(a device for individuals who are deaf or hearing-impaired)
Individuals who do not use conventional print materials may contact the Arts Endowment’s Office for Accessibility at 202-682-5532 to obtain this publication in an alternate format.
This publication is available free of charge in print or PDF format at arts.gov, the website of the National Endowment
for the Arts.

Chairman’s Note
Phot
o by
Mic
hael
Eas
tman
“Art works.” I have been saying that ever since I was sworn in as chairman of the National Endowment for
the Arts, and it remains an absolute truth. Over these past three years, I have been fascinated to engage with
our Office of Research & Analysis staff as they dig into the questions of “on whom” and “in what ways.”
Having the arts in young people’s lives is essential; we
know that intuitively. Parents sing to their babies,
dance with their toddlers, and occupy children with
crayons and paper. And there was a time in this
country when schools did their parts: bands, choruses,
theatricals, and art studios used to fill the days along-
side the 3 Rs, gym, social studies, science, and the rest.
But over the past four decades, budget pressures and
an increasing focus on just reading and math have
crowded the arts out of too many school days. What’s
lost? The chance for a child to express himself. The
chance for the idiosyncratic child who has not yet
succeeded elsewhere to shine. A sense of play, of fun,
of discovery.
James Catterall and his fellow authors have shown
that something else is lost, too: potential. Students
who have arts-rich experiences in school do better
across-the-board academically, and they also
become more active and engaged citizens, voting,
volunteering, and generally participating at higher
rates than their peers.
This report is quick to caution that it does not make
the case for a causal relationship between the arts
and these outcomes, but as a non-researcher, I have
no hesitation about drawing my own conclusions.
I firmly believe that when a school delivers the
complete education to which every child is entitled—
an education that very much includes the arts—the
whole child blossoms.
I believe that the only outcomes we should need to
measure for a music class is whether the child had the
chance to create, enjoy, and understand music. But
as the arts are forced to compete for scarce resources,
there is no harm in pointing out once again that an
investment in the arts will pay extensive dividends.
Art works. Let’s make sure it works for our country’s
students.
Rocco Landesman
Chairman
National Endowment for the Arts
Table of Contents
Introduction .......................................................................................................................................8
Background ..................................................................................................................................8
Sources .........................................................................................................................................8
Methods ........................................................................................................................................9
How was arts engagement defined? .........................................................................................9
How was socioeconomic status (SES) determined? ................................................................ 10
Presentation of Findings ........................................................................................................... 11
Cause versus correlation: a cautionary note ............................................................................. 11
Key Findings .................................................................................................................................... 12
Academic Achievement ............................................................................................................12
Extracurricular activities in high school and college .................................................................. 17
Civic Engagement ......................................................................................................................18
Reading books and visiting libraries .......................................................................................... 19
Labor market outcomes ...........................................................................................................22
Conclusions ..................................................................................................................................... 24
Appendix: Meet the Databases ................................................................................................. 25
National Education Longitudinal Study of 1988 (NELS:88) ...........................................................25
Early Childhood Longitudinal Study, Kindergarten Class of 1998 –1999 (ECLS-K) .......................25
Education Longitudinal Study of 2002 (ELS:2002) .......................................................................26
National Longitudinal Survey of Youth 1997 (NLSY97) .................................................................26
Notes ................................................................................................................................................ 27

8 National Endowment for the Arts
Introduction
BackgroundThis report examines the academic and civic behavior outcomes of teenagers and young adults who have engaged deeply with the arts in or out of school.
In several small-group studies, children and teenagers who participated in arts education programs have shown more positive academic and social outcomes in comparison to students who did not participate in those programs. Such studies have proved essential to the current research literature on the types of instru-mental benefits associated with an arts education.i
A standard weakness of the literature, however, has been a dearth of large-scale, longitudinal studies following the same populations over time, tracking the outcomes of students who received intensive arts exposure or arts learning compared with students who did not. The Arts and Achievement in At-Risk Youth is a partial attempt to fill this knowledge gap. The report’s authors, James Catterall et al., use four large national databases to analyze the relationship between arts involvement and academic and social achievements.
SourcesThree of the databases featured in this report are sponsored by the U.S. Department of Education. They are the National Education Longitudinal Study of 1988 (NELS:88), the Early Childhood Longitudinal Study, Kindergarten Class of 1998-1999 (ECLS-K), and the Education Longitudinal Study of 2002 (ELS:2002).
The fourth database, the National Longitudinal Survey of Youth of 1997 (NLSY97), is sponsored by the U.S. Department of Labor.
An unrivaled aspect of these large, longitudinal datasets is that they permit researchers to track a nationally representative sample of children and/or teenagers over time. Each survey has multiple waves, spanning different years and age groups. For example, NELS:88 began in 1987–1988, when participants were in the 8th grade. The study concluded in 2000, after five waves of data collection, when participants had reached age 26.
In contrast, ECLS-K began with kindergarteners in 1998–1999 and followed them through 2007, when they were in the 8th grade. With ELS:2002, a 10th-grade population was the initial study group; the most recent wave of data collection occurred in 2006, when respondents were about 20 years old, and another wave is planned for 2012.
NLSY97, too, is an ongoing study: having begun in 1997 with a sample of 12- to 16-year-olds, it continues to gather data (through interviews) on an annual basis. The most recent data available for NLSY97 come from 2008–2009, when respondents were in their mid-20s.
The following chart illustrates the multiple and sometimes overlapping years and age ranges covered in this report. (For details of each longitudinal study, including information about sample sizes and data-collection methods, see “Appendix: Meet the Databases,” pp. 25–26.)
Time Spans and Age Ranges Covered by the Databases
1988 1990 1992 1994 1996 1998 2000 2002 2004 2006 2008 2010
ECLS-K
ELS:2002
NLSY97
NELS:88 14 26
12–16 23–27
16 20
5 13

9
Just as each of the four studies involves different timeframes, study populations, and data collection methods, so does each resulting database contain different variables related to arts involvement and academic and social outcomes.
Data about arts involvement stem from a combination of survey and interview questions and administrative records (e.g., transcripts). Depending on the database, arts variables include course-taking in music, dance, theater, and the visual arts; out-of-school arts lessons; and membership, participation, or leadership in arts organizations and activities (e.g., band or theater). The Appendix on pp. 25–26 lists arts variables for each of the four databases.
MethodsTo understand the relationship between early arts involvement and positive outcomes later in life, researchers applied two criteria to analyze populations in each database.
First, researchers wanted to know what would be the potential effects of intensive arts involvement on each study population, and how would outcomes differ among students who had engaged in little or no art in childhood or adolescence.
To make such comparisons, it was necessary to construct a scale of arts engagement, ranging from high to low, by using the arts-related variables in each database. Each scale relies on a scoring method, with appropriate weighting given to factors such as leadership in arts associations and frequency of arts participation.
Second, the researchers decided to focus their analysis on teenagers and young adults who came from lower socioeconomic status (SES) backgrounds. The rationale was that higher-income, higher-educated families will, on average, provide their youth with more opportunities to experience the arts through extra classes, lessons, or opportunities for attendance, perhaps through more affluent schools with extensive arts programs. Thus, if the research failed to control for the effects of SES on the general population studied, then a comparison of high- and low-arts groups would reveal far greater levels of academic and civic achieve-ment in the high-arts group than might be linked to arts involvement alone.
How was arts engagement defined?
For each population studied in a given database,
researchers awarded one point for each occurrence
of arts activity (whether in-class or extracurricular)
and extra points for recurring exposure to a specific
arts activity, for service in an arts leadership position,
or for advanced placement coursework in the arts.
Among all the datasets, only the NLSY97 data on arts
participation were restricted to in-class activity, deriving
from high school transcripts. For this cohort alone,
high-arts students were determined by taking the top
quartile of students by total number of arts credits.
For each of the three remaining databases, students
who ranked in the top 12.5 percent of arts-engagement
scores were deemed high-arts students. Throughout
this report, high-arts students are also characterized as
students who have had arts-rich backgrounds, or who
have had intensive arts involvement as elementary,
middle school, and/or high school students.
Introduction

10 National Endowment for the Arts
How was socioeconomic status (SES) determined?
Three of the four databases relied on standardized
indicators of SES, constructed from family income,
parental education level, and parental job status. Those
databases are NELS:88; ELS:2002; and ECLS-K. For
the fourth database (NLSY97), researchers used family
income as a proxy measure of SES.
Students who ranked in the bottom quarter of SES
levels for a given database were deemed “low-SES”
students. Throughout this report, as in its title,
the phrase “at risk” is used with reference to these
groups of students.
Together, the combination of SES and ranking on the arts-engagement scale for each database yields a “study subject selection map” (see below). It high-lights the sub-populations that will appear throughout this report: the top and bottom one-fourth of the study sample, based on socioeconomic status; and, within those groups, the students who score either in the top or bottom 12.5 percent of the arts-engagement scales, and who are designated respectively as high-arts and low-arts students.ii
For the most part, however, this report focuses on the bottom SES quartile, at both the high and low ends of arts engagement. In addition, data for the entire sample (all SES and arts engagement levels) are used to benchmark the outcomes shown by high-arts and low-arts students.
A sample comparison of outcomes—in low-SES students at the high and low ends of arts engage-ment—is displayed on page 11. The table represents college attainment rates, by attendance, by types of degrees earned, and even by college grades. According to the data, 71 percent of low-SES students with arts-rich experiences attended some sort of college after high school. Only 48 percent of the low-arts, low-SES group attended any sort of college. And more than twice as many high-arts students from the low-SES group, compared with low-arts students in that group, attended a four-year college (39 percent versus 17 percent).
Study Subject Selection Map
Arts Engagement ScoreLow High
Top SES Quartile
Low 12.5% arts engagement
Students in the four corner boxes comprise the groups studied
Bottom SES Quartile
High 12.5% arts engagement
Family Socioeconomic
Status (SES)
Low
High

11
The preceding table comes from James Catterall’s 2009 book Doing Well and Doing Good by Doing Art: A 12-Year Study of Arts Education. For that study, Catterall mined the National Education Longitudinal Survey (NELS:88) database to identify academic and social outcomes associated with 26-year-olds who had had deep arts involvement from 8th through 12th grade.
Presentation of FindingsLike the present study, Doing Well and Doing Good by Doing Art focused on American youth of low socioeco-nomic status, but it also reported results for the high-SES group and for the entire study sample. The Arts and Achievement in At-Risk Youth extends Catterall’s analysis to three other databases, and it distinguishes between two categories of positive findings about arts-involved students: academic and civic behavior outcomes. In limited cases, as available, data are also provided about other extracurricular activity participation, career expectations, and sector employment patterns.
Unless otherwise noted, all differences between high- and low-arts groups are statistically significant.iii For many outcome areas, statistically significant differences favoring arts involvement were found exclusively in low-SES groups. Where significant differences between high- and low-arts groups emerged in high-SES populations, the researchers have displayed those results as well.
It is worth stating that in almost no cases were more favorable results observed for the low-arts groups, either at the high- or low-SES levels, when compared with the high-arts groups. In other words, at a minimum the high-arts groups regularly rated at least equal to the achievement levels of the low-arts groups, often surpassing those levels.iv
Cause versus correlation: a cautionary note
This report presents comparisons of outcomes among
children, teenagers, and young adults with either
minimal or intensive arts involvement. The comparisons
are typically reported as relative percentages of
low-arts or high-arts youth groups.
In example after example throughout this report, a
greater percentage of high-arts students demonstrate
a particular outcome (e.g., graduating from high school
or doing volunteer work) than do low-arts students.
Yet such results do not support a cause-and-effect
relationship between arts involvement, on the one
hand, and academic or civic achievements on the other.
To understand the mechanisms by which learning
and participating in arts activities might directly
influence those outcome areas, more research is
needed. Specifically, one would have to control for
a wide array of individual and social variables that
are not captured by the databases under review,
robust as these sources are.
In this context, the report’s authors have been content
to explore the hypothesis that arts involvement is
associated with better academic and civic outcomes
than is non- or low-arts involvement. Despite an
inability to make causal inferences, this knowledge may
prove helpful in our understanding of the behavioral
patterns of youth populations that have or lack
arts-rich backgrounds.
Percent of Young Adults Who Attended College and Achieved College-Related Outcomes (2000)
Low-SES Students
Note: Differences shown in bold are statistically significant.
Source: NELS:88. From 1988, when participants were in the 8th grade, to 2000, when most had turned 26.
Low arts High arts
Ever attended college after high school
48% 71%
Ever attended a four-year college
17% 39%
If they attended college:
Earned as highest degree:
Associate’s degree 10% 24%
Bachelor’s degree 6% 18%
Graduate or professional degree
0% 1%
Earned mostly A’s in college 9% 15%
Introduction

12 National Endowment for the Arts
Key Findings
Academic AchievementTeenagers and young adults of low socioeconomic status (SES) who have a history of in-depth arts involvement show better academic outcomes than do low-SES youth who have less arts involvement. They earn better grades and demonstrate higher rates of college enrollment and attainment.
Among low-SES students:
1. Eighth graders who had high levels of arts engagement from kindergarten through elementary school showed higher test scores in science and writing than did students who had lower levels of arts engagement over the same period.
Average Science Test Scores of 8th Graders (2007) (out of 100 possible points)
0
10
20
30
40
50
60
70
80
90
100
Overall sample (all SES)High arts, low SESLow arts, low SES
72
7984
Source: ECLS-K. From 1999, when participants were in kindergarten, to 2007, when they were in 8th grade.
Note: The tests administered to students in this database were designed by the U.S. Department of Education and incorporate National Assessment of Educational Progress (NAEP) standards.
Average Writing Test Scores of 8th Graders (2007) (on a five-point scale)
0.00
0.50
1.00
1.50
2.00
2.50
3.00
3.50
4.00
4.50
5.00
Overall sample (all SES)High arts, low SESLow arts, low SES
2.6
2.9 3.0
Source: ECLS-K. From 1999, when participants were in kindergarten, to 2007, when they were in 8th grade.
Note: The tests administered to students in this database were designed by the U.S. Department of Education and incorporate National Assessment of Educational Progress (NAEP) standards.

13Key Findings
2. Students who had arts-rich experiences in high school were more likely than students without those experiences to complete a calculus course. Also, students who took arts courses in high school achieved a slightly higher grade-point average (GPA) in math than did other students.
3. In two separate databases, students who had arts-rich experiences in high school showed higher overall GPAs than did students who lacked those experiences.
• Better GPAs were also observed among high-SES students who had earned arts credits in high school: 3.17, on average, compared with 2.97 for the high-SES students who had earned few or no arts credits, and 2.84 for the full sample.v
Percent of 10th Graders Who Went on to Complete a High School Calculus Course (2004)
0%
10%
20%
30%
40%
50%
60%
70%
80%
90%
100%
Overall sample (all SES)High arts, low SESLow arts, low SES
23%
33%
44%
Source: ELS: 2002. From 2002, when participants were in 10th grade, to 2004, when most participants had completed 12th grade.
Mean Math GPA of High School Students (2005) (on a four-point scale)
0.00
0.40
0.80
1.20
1.60
2.00
2.40
2.80
3.20
3.60
4.00
Overall sample (all SES)High arts, low SESLow arts, low SES
2.482.63
2.54
Source: NLSY97. From 1998, when participants were 13–17 years old, to 2005, when 69 percent of respondents to the initial wave of data collection (1997) had full transcript data available.
Note: Arts course credits from high school transcripts are the sole indicators of arts engagement in the NLSY97 database.
Mean GPA of High School Students (2004) (on a four-point scale)
0.00
0.40
0.80
1.20
1.60
2.00
2.40
2.80
3.20
3.60
4.00
Overall sample (all SES)High arts, low SESLow arts, low SES
2.412.63 2.73
Source: ELS:2002, when participants were in 10th grade, to 2004, when most participants had completed 12th grade.
Mean GPA of High School Students (2005) (on a four-point scale)
0.00
0.40
0.80
1.20
1.60
2.00
2.40
2.80
3.20
3.60
4.00
Overall sample (all SES)High arts, low SESLow arts, low SES
2.55
2.942.84
Source: NLSY97. From 1998, when participants were 13–17 years old, to 2005, when 69 percent of respondents to the initial wave of data collection (1997) had full transcript data available.
Note: Arts course credits from high school transcripts are the sole indicators of arts engagement in the NLSY97 database.

14 National Endowment for the Arts
4. High school students who earned few or no arts credits were five times more likely not to have graduated than students who earned many arts credits.
5. Both 8th-grade and high school students who had high levels of arts engagement were more likely to aspire to college than were students with less arts engagement.
Percent of 13- to 17-Year-Olds Who Did Not Graduate from High School (2008)
0%
10%
20%
30%
40%
50%
60%
70%
80%
90%
100%
Overall sample (all SES)High arts, low SESLow arts, low SES
22%
4% 7%
Source: NLSY97. From 1998, when participants were 13–17 years old, to 2008.
Note: Arts course credits from high school transcripts are the sole indicators of arts engagement in the NLSY97 database.
Percent of 8th Graders Who Planned to Earn a Bachelor’s Degree (2007)
0%
10%
20%
30%
40%
50%
60%
70%
80%
90%
100%
Overall sample (all SES)High arts, low SESLow arts, low SES
43%
74%71%
Source: ECLS-K. From 1999, when participants were in kindergarten, to 2007, when they were in 8th grade.
Percent of 12th Graders Who Planned to Earn a Bachelor’s Degree (2004)
0%
10%
20%
30%
40%
50%
60%
70%
80%
90%
100%
Overall sample (all SES)High arts, low SESLow arts, low SES
42%
61%67%
Source: ELS:2002. From 2002, when participants were in 10th grade, to 2004, when most participants had completed 12th grade.

15
6. Arts-engaged high school students enrolled in competitive colleges—and in four-year colleges in general—at higher rates than did low-arts-engaged students.
• Even among high-SES individuals, college-going rates were higher if students had engaged in arts-rich experiences in high school, according to a separate database. Ninety-four percent of the high-arts group went on to a four-year college, versus 76 percent of the low-arts, high-SES group.vi
Percent of 10th Graders Who Went on to Enroll in a Bachelor’s Degree Program (2006)
0%
10%
20%
30%
40%
50%
60%
70%
80%
90%
100%
Overall sample (all SES)High arts, low SESLow arts, low SES
19%
32%
46%
Source: ELS:2002. From 2002, when participants were in 10th grade, to 2006, when most participants had turned 20.
Percent of 10th Graders Who Went on to Enroll in a Highly or Moderately Selective Four-Year College (2006)1
0%
10%
20%
30%
40%
50%
60%
70%
80%
90%
100%
Overall sample (all SES)High arts, low SESLow arts, low SES
26%
41%
57%
1 Represented as a share of the 46 percent of all 10th graders who enrolled in a bachelor’s degree program.
Source: ELS:2002. From 2002, when participants were in 10th grade, to 2006, when most participants had turned 20.
Note: For an explanation of how college selectivity was determined, see Education Longitudinal Study of 2002 (ELS:2002): A First Look at the Initial Postsecondary Experiences of the High School Sophomore Class of 2002, available at nces.ed.gov/pubs2008/2008308.pdf
Key Findings
16 National Endowment for the Arts
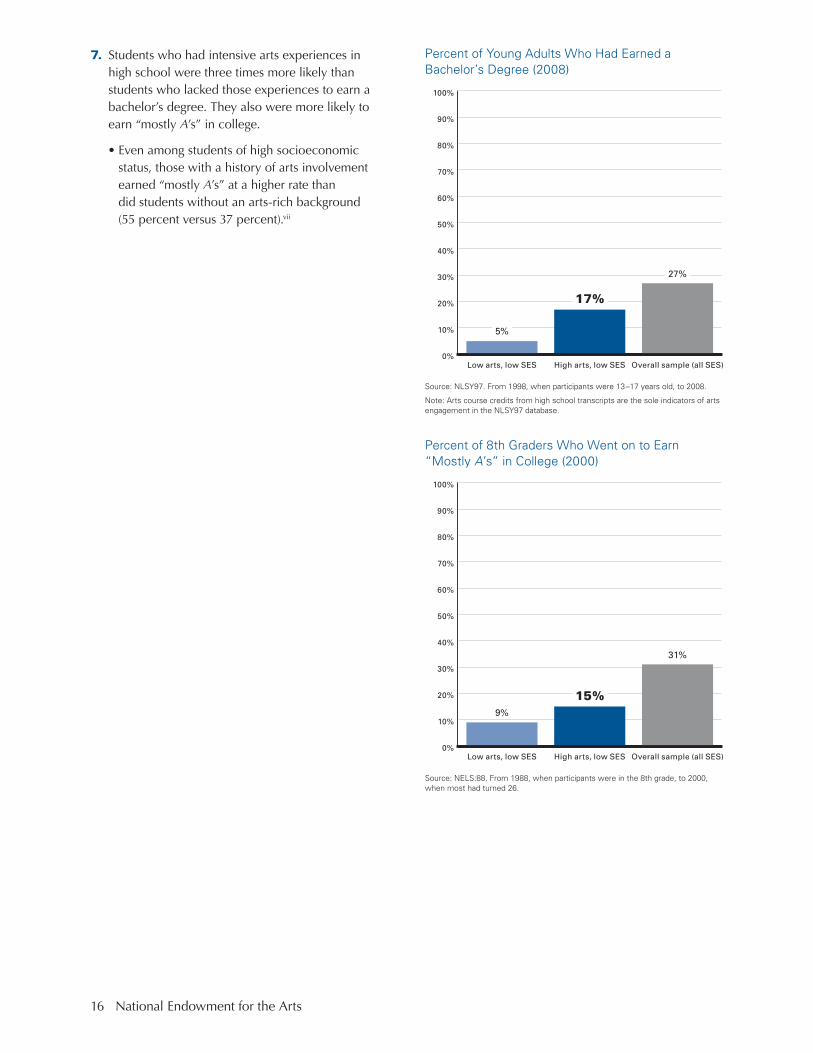
7. Students who had intensive arts experiences in high school were three times more likely than students who lacked those experiences to earn a bachelor’s degree. They also were more likely to earn “mostly A’s” in college.
• Even among students of high socioeconomic status, those with a history of arts involvement earned “mostly A’s” at a higher rate than did students without an arts-rich background (55 percent versus 37 percent).vii
Percent of Young Adults Who Had Earned a Bachelor’s Degree (2008)
0%
10%
20%
30%
40%
50%
60%
70%
80%
90%
100%
Overall sample (all SES)High arts, low SESLow arts, low SES
5%
17%
27%
Source: NLSY97. From 1998, when participants were 13–17 years old, to 2008.
Note: Arts course credits from high school transcripts are the sole indicators of arts engagement in the NLSY97 database.
Percent of 8th Graders Who Went on to Earn “Mostly A’s” in College (2000)
0%
10%
20%
30%
40%
50%
60%
70%
80%
90%
100%
Overall sample (all SES)High arts, low SESLow arts, low SES
9%
15%
31%
Source: NELS:88. From 1988, when participants were in the 8th grade, to 2000, when most had turned 26.
17
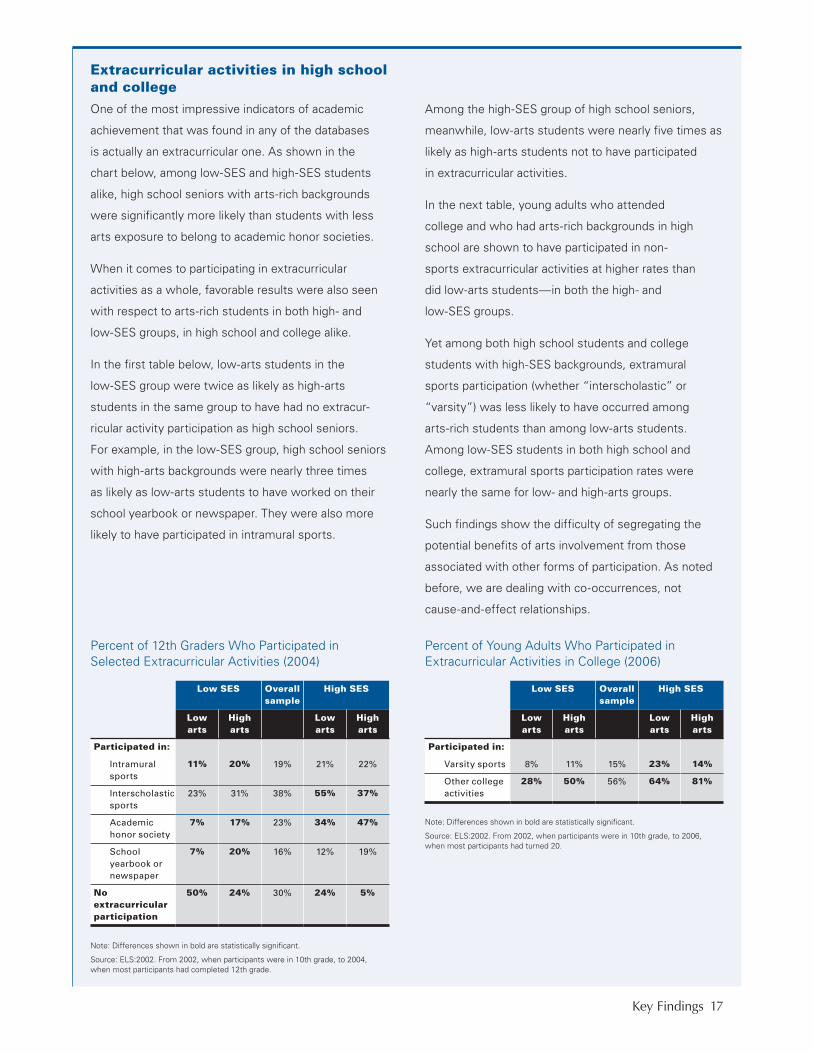
Extracurricular activities in high school and college
One of the most impressive indicators of academic
achievement that was found in any of the databases
is actually an extracurricular one. As shown in the
chart below, among low-SES and high-SES students
alike, high school seniors with arts-rich backgrounds
were significantly more likely than students with less
arts exposure to belong to academic honor societies.
When it comes to participating in extracurricular
activities as a whole, favorable results were also seen
with respect to arts-rich students in both high- and
low-SES groups, in high school and college alike.
In the first table below, low-arts students in the
low-SES group were twice as likely as high-arts
students in the same group to have had no extracur-
ricular activity participation as high school seniors.
For example, in the low-SES group, high school seniors
with high-arts backgrounds were nearly three times
as likely as low-arts students to have worked on their
school yearbook or newspaper. They were also more
likely to have participated in intramural sports.
Among the high-SES group of high school seniors,
meanwhile, low-arts students were nearly five times as
likely as high-arts students not to have participated
in extracurricular activities.
In the next table, young adults who attended
college and who had arts-rich backgrounds in high
school are shown to have participated in non-
sports extracurricular activities at higher rates than
did low-arts students—in both the high- and
low-SES groups.
Yet among both high school students and college
students with high-SES backgrounds, extramural
sports participation (whether “interscholastic” or
“varsity”) was less likely to have occurred among
arts-rich students than among low-arts students.
Among low-SES students in both high school and
college, extramural sports participation rates were
nearly the same for low- and high-arts groups.
Such findings show the difficulty of segregating the
potential benefits of arts involvement from those
associated with other forms of participation. As noted
before, we are dealing with co-occurrences, not
cause-and-effect relationships.
Percent of 12th Graders Who Participated in Selected Extracurricular Activities (2004)
Note: Differences shown in bold are statistically significant.
Source: ELS:2002. From 2002, when participants were in 10th grade, to 2004, when most participants had completed 12th grade.
Low SES Overall sample
High SES
Low arts
High arts
Low arts
High arts
Participated in:
Intramural sports
11% 20% 19% 21% 22%
Interscholastic sports
23% 31% 38% 55% 37%
Academic honor society
7% 17% 23% 34% 47%
School yearbook or newspaper
7% 20% 16% 12% 19%
No extracurricular participation
50% 24% 30% 24% 5%
Percent of Young Adults Who Participated in Extracurricular Activities in College (2006)
Note: Differences shown in bold are statistically significant.
Source: ELS:2002. From 2002, when participants were in 10th grade, to 2006, when most participants had turned 20.
Low SES Overall sample
High SES
Low arts
High arts
Low arts
High arts
Participated in:
Varsity sports 8% 11% 15% 23% 14%
Other college activities
28% 50% 56% 64% 81%
Key Findings

18 National Endowment for the Arts
Civic EngagementYoung adults who had intensive arts experiences in high school are more likely to show civic-minded behavior than young adults who did not. They take an interest in current affairs, as evidenced by comparatively high levels of volunteering, voting, and engagement with local or school politics. In many cases, this difference appears in both low- and high-SES groups.
1. In both low- and high-SES groups, 8th graders with a history of arts engagement were more likely than other students to read a newspaper at least one day in the past week.
2. High school students from low SES backgrounds with arts-rich experiences participated in student government and school service clubs at four times the rate of low-SES students who lacked those experiences.
Percent of 8th Graders Who Read a Newspaper at Least Once a Week (2007)
0%
10%
20%
30%
40%
50%
60%
70%
80%
90%
100%
High arts,high SES
Low arts,high SES
Overallsample
High arts,low SES
Low arts,low SES
44%
73%66%
61%
83%
Source: ECLS-K. From 1999, when participants were in kindergarten, to 2007, when they were in 8th grade.
Percent of 12th Graders Who had Participated in Student Government (2004)
0%
10%
20%
30%
40%
50%
60%
70%
80%
90%
100%
Overall sample (all SES)High arts, low SESLow arts, low SES
4%
16% 13%
Source: ELS:2002. From 2002, when participants were in the 10th grade, to 2004, when most participants completed 12th grade.
Percent of 12th Graders Who Had Participated in School Service Clubs (2004)
0%
10%
20%
30%
40%
50%
60%
70%
80%
90%
100%
High arts,high SES
Low arts,high SES
Overallsample
High arts,low SES
Low arts,low SES
5%
19%17%
21%
30%
Source: ELS:2002. From 2002, when participants were in 10th grade, to 2004, when most participants had completed 12th grade.

19
Reading books and visiting libraries
As we have seen already, low-SES youth with
arts-rich backgrounds were more likely than their
less-arts-involved counterparts to read newspapers or
participate in high school yearbook or newspaper
production. But the NELS:88 database includes two
other indicators of literary involvement: book reading
and library visits.
According to this database, 26-year-olds from
low-SES backgrounds who had engaged with the arts
intensely from middle school through high school were
more likely than the low-arts, low-SES group to have
done either literary activity. Eighty-two percent of the
high-arts, low-SES group read at least one book in the
preceding year (1999-2000). This was roughly the same
share of book readers as in the overall study population
(81 percent), and it was higher than the corresponding
share of the low-arts, low-SES group (74 percent).
Regarding library visits, 55 percent of the high-arts,
low-SES group in the database did this activity at
least once in the past year, compared with 48 percent
of the overall sample and 43 percent of the low-arts,
low-SES group.
3. In both high- and low-SES groups, young adults who had arts-rich experiences in high school were more likely than other young adults to have volunteered recently.
Key Findings
Percent of Young Adults Who Volunteered within the Last Two Years (2006)
0%
10%
20%
30%
40%
50%
60%
70%
80%
90%
100%
High arts,high SES
Low arts,high SES
Overallsample
High arts,low SES
Low arts,low SES
26%
47%43%
53%
70%
Source: ELS:2002. From 2002, when participants were in 10th grade, to 2006, when most participants had turned 20.
Percent of Young Adults Who Volunteered at Least Once a Month (2006)
0%
10%
20%
30%
40%
50%
60%
70%
80%
90%
100%
High arts,high SES
Low arts,high SES
Overallsample
High arts,low SES
Low arts,low SES
20%
28%
17%
33%
43%
Source: ELS:2002. From 2002, when participants were in 10th grade, to 2006, when most participants had turned 20.

20 National Endowment for the Arts
Percent of Young Adults Who Did Civic and/or Community Volunteering (2000)
0%
10%
20%
30%
40%
50%
60%
70%
80%
90%
100%
High arts,high SES
Low arts,high SES
Overallsample
High arts,low SES
Low arts,low SES
10%
25%22%
20%
35%
Source: NELS:88. From 1988, when participants were in the 8th grade, to 2000, when most participants had turned 26.
Percent of Young Adults Who Did Not Volunteer in Past Year (2008)
0%
10%
20%
30%
40%
50%
60%
70%
80%
90%
100%
High arts,high SES
Low arts,high SES
Overallsample
High arts,low SES
Low arts,low SES
73%
64% 65%61%
51%
Source: NLSY97. From 1998, when participants were 13–17 years old, to 2008.
Note: Arts course credits from high school transcripts are the sole indicators of arts engagement in the NLSY97 database.
Percent of Young Adults Who Volunteered 1–5 Times a Year (2008)
0%
10%
20%
30%
40%
50%
60%
70%
80%
90%
100%
Overall sample (all SES)High arts, low SESLow arts, low SES
19%
26% 25%
Source: NLSY97. From 1998, when participants were 13–17 years old, to 2008.
Note: Arts course credits from student transcripts are the sole indicators of arts engagement in the NLSY97 database.

21
4. Young adults who had arts-rich experiences in high school were more likely to vote and/or to participate in a political campaign. Virtually all of these differences were observed only in low-SES groups.
Percent of Young Adults Who Had Registered to Vote (2000)
0%
10%
20%
30%
40%
50%
60%
70%
80%
90%
100%
Overall sample (all SES)High arts, low SESLow arts, low SES
67%
78% 76%
Source: NELS:88. From 1988, when participants were in the 8th grade, to 2000, when most had turned 26.
Percent of Young Adults Who Voted in the 2004 National Election (2006)
0%
10%
20%
30%
40%
50%
60%
70%
80%
90%
100%
Overall sample (all SES)High arts, low SESLow arts, low SES
31%
45%52%
Source: ELS:2002. From 2002, when participants were in 10th grade, to 2006, when most participants had turned 20.
Percent of Young Adults Who Voted in a Local Election (2006)
0%
10%
20%
30%
40%
50%
60%
70%
80%
90%
100%
Overall sample (all SES)High arts, low SESLow arts, low SES
29%
43%50%
Source: ELS:2002. From 2002, when participants were in 10th grade, to 2006, when most participants had turned 20.
Key Findings
Percent of Young Adults Who Participated in a Political Campaign (2000)
0%
1%
2%
3%
4%
5%
6%
7%
8%
9%
10%
High arts,high SES
Low arts,high SES
Overallsample
High arts,low SES
Low arts,low SES
2.8%
4.1%3.6%
1.4%
7.1%
NOTE: Scale is 0 to 10%.
Source: NELS:88. From 1988, when participants were in the 8th grade, to 2000, when most had turned 26.

22 National Endowment for the Arts
Labor market outcomes
All four databases used for this report currently exclude
information from adults beyond their mid-to-late 20s;
two of the databases (NELS:88 and ECLS-K) have
stopped collecting information entirely. It is impossible,
therefore, to report reliably about long-term career
outcomes associated with children and teenagers who
have had arts-rich experiences.
Taken together, however, NELS:88 and NLSY97
contain data tracing the career aspirations and initial
jobs of young adults with arts backgrounds.
The first table below is a snapshot of college major
selection by 20-year-olds of low socioeconomic status.
Drawing from NELS:88 data, the table reveals that
30 percent of college students who had intensive arts
experiences in middle school and high school chose
a major that aligns with preparation for a professional
career. That figure is twice the percentage of low-arts
20-year-olds who had chosen such majors — and it
exceeds the comparable rate for the overall sample.
The next table also uses NELS:88 data. It shows
that 50 percent of all low-SES adults with arts-rich
backgrounds anticipated serving by age 30 in a
career that the U.S. Bureau of Labor Statistics
describes as “professional.” In contrast, 21 percent of
the low-arts group forecasted serving in such careers,
which include law, medicine, and management.
Percent of College-Going 20-Year-Olds Who Chose Professionally Oriented Majors (1994)
Low-SES Students
Note: Differences shown in bold are statistically significant.
Source: NELS:88. From 1988, when participants were in the 8th grade, to 1994, when most had turned 20.
Low arts High arts Overall sample (all SES)
Professional majors: 13.5% 29.7% 21.7%
Accounting, finance, and management
3.8% 6.8% 5.8%
Education 3.2% 5.9% 3.7%
Nursing and allied health
3.1% 9.8% 7.8%
Social sciences 2.2% 3.0% 2.0%
Biological sciences 0.6% 1.8% 1.3%
Arts 0.6% 2.4% 1.1%
Percent of Young Adults Who Anticipated Serving in Professional Careers by Age 30 (2000)
Low-SES Students
Note: Differences shown in bold are statistically significant.
Source: NELS:88. From 1988, when participants were in the 8th grade, to 2000, when most had turned 26.
Low arts High arts Overall sample (all SES)
Planning professional careers:
21.1%
49.5%
38.7%
Manager 5.6% 6.8% 7.5%
Sales 0.3% 1.2% 1.4%
Teacher 3.5% 8.2% 5.5%
Artist/entertainer 0.0% 3.8% 3.2%
Lawyer 1.6% 3.2% 2.0%
Physician 0.3% 2.6% 1.8%
Nurse/other medical professional
5.1%
15.2%
10.7%
Other professionalviii 4.7% 8.5% 6.6%
23
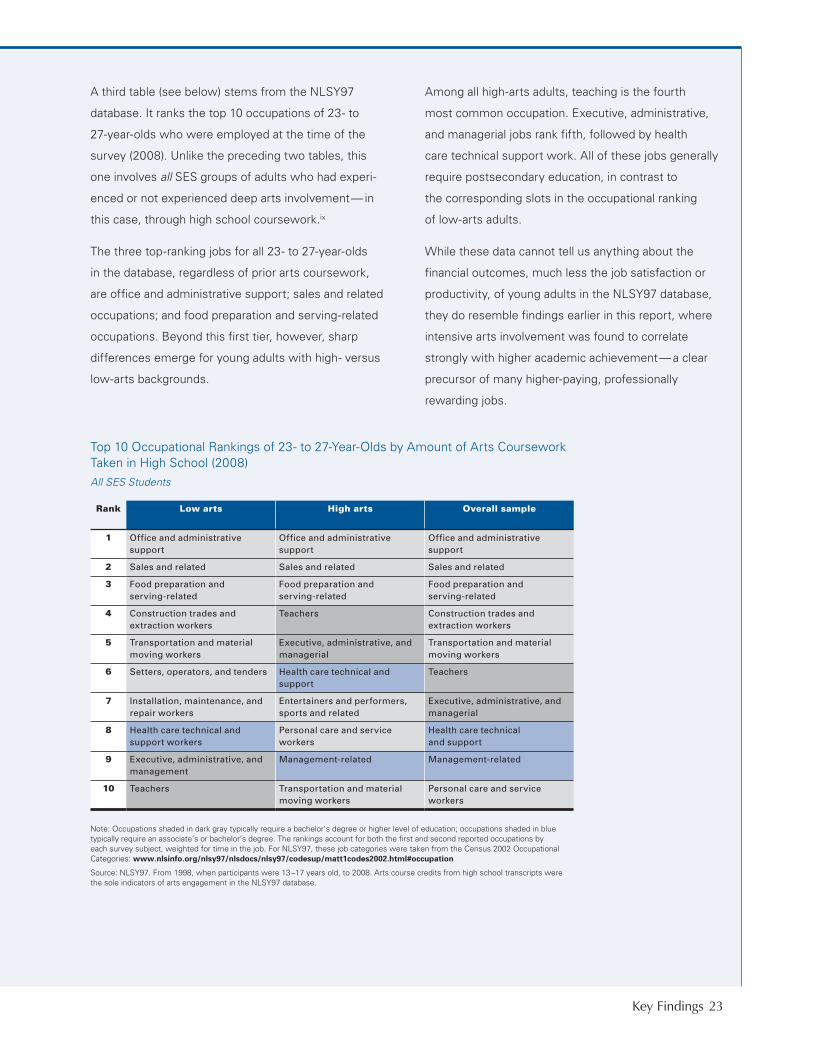
A third table (see below) stems from the NLSY97
database. It ranks the top 10 occupations of 23- to
27-year-olds who were employed at the time of the
survey (2008). Unlike the preceding two tables, this
one involves all SES groups of adults who had experi-
enced or not experienced deep arts involvement— in
this case, through high school coursework.ix
The three top-ranking jobs for all 23- to 27-year-olds
in the database, regardless of prior arts coursework,
are office and administrative support; sales and related
occupations; and food preparation and serving-related
occupations. Beyond this first tier, however, sharp
differences emerge for young adults with high- versus
low-arts backgrounds.
Among all high-arts adults, teaching is the fourth
most common occupation. Executive, administrative,
and managerial jobs rank fifth, followed by health
care technical support work. All of these jobs generally
require postsecondary education, in contrast to
the corresponding slots in the occupational ranking
of low-arts adults.
While these data cannot tell us anything about the
financial outcomes, much less the job satisfaction or
productivity, of young adults in the NLSY97 database,
they do resemble findings earlier in this report, where
intensive arts involvement was found to correlate
strongly with higher academic achievement— a clear
precursor of many higher-paying, professionally
rewarding jobs.
Top 10 Occupational Rankings of 23- to 27-Year-Olds by Amount of Arts Coursework Taken in High School (2008)
All SES Students
Note: Occupations shaded in dark gray typically require a bachelor’s degree or higher level of education; occupations shaded in blue typically require an associate’s or bachelor’s degree. The rankings account for both the first and second reported occupations by each survey subject, weighted for time in the job. For NLSY97, these job categories were taken from the Census 2002 Occupational Categories: www.nlsinfo.org/nlsy97/nlsdocs/nlsy97/codesup/matt1codes2002.html#occupation
Source: NLSY97. From 1998, when participants were 13–17 years old, to 2008. Arts course credits from high school transcripts were the sole indicators of arts engagement in the NLSY97 database.
Rank Low arts High arts Overall sample
1 Office and administrative support
Office and administrative support
Office and administrative support
2 Sales and related Sales and related Sales and related
3 Food preparation and serving-related
Food preparation and serving-related
Food preparation and serving-related
4 Construction trades and extraction workers
Teachers Construction trades and extraction workers
5 Transportation and material moving workers
Executive, administrative, and managerial
Transportation and material moving workers
6 Setters, operators, and tenders Health care technical and support
Teachers
7 Installation, maintenance, and repair workers
Entertainers and performers, sports and related
Executive, administrative, and managerial
8 Health care technical and support workers
Personal care and service workers
Health care technical and support
9 Executive, administrative, and management
Management-related Management-related
10 Teachers Transportation and material moving workers
Personal care and service workers
Key Findings

24 Conclusions
Conclusions
This report displays correlations between arts activity among at-risk youth and subsequent levels of academic performance and civic engagement. For this task, the authors relied on four large longitudinal databases. Each source has unique strengths and limitations in terms of study sample size, age range, and the types of variables included—whether related to arts involvement (in-school and/or extracurricular), academic progress, or social and/or civic participation. Yet after accounting for these differences, three main conclusions arise:
1. Socially and economically disadvantaged children and teenagers who have high levels of arts engagement or arts learning show more positive outcomes in a variety of areas than their low-arts-engaged peers.
• In middle school, high school, and beyond, they tend to do better on a host of academic and civic behavioral measures than do at-risk youth who lack deep arts backgrounds. To varying degrees, those outcomes extend to school grades, test scores, honors society membership, high school graduation, college enrollment and achievement, volunteering, and engagement in school or local politics.
2. At-risk teenagers or young adults with a history of intensive arts experiences show achievement levels closer to, and in some cases exceeding, the levels shown by the general population studied.
• These findings suggest that in-school or extracur-ricular programs offering deep arts involvement may help to narrow the gap in achievement levels among youth of high- versus low-SES.
3. Most of the positive relationships between arts involvement and academic outcomes apply only to at-risk populations (low-SES). But positive relationships between arts and civic engagement are noted in high-SES groups as well.
• Even youth from socially and economically advantaged backgrounds may find access to greater civic and social participation via deep arts involvement.x
As stated on p. 11, the data in this report do not permit an analysis of causal links that might exist between deep arts involvement and academic and civic behavioral outcomes. All of the findings attest only to statistical correlations, though the literature does point to various theories that may account for causal links between arts involvement and academic and social development.xi For conclusive evidence of the direct impact of arts participation on youth achievement, it would be necessary to control for a larger range of variables than are given here. Ideally, such variables would reflect the disparate influences of home, school, family, and neighborhood; of gender, race, and ethnicity; of health and disability status, and a host of psychosocial factors. Then, too, one would want to account for the different qualities of arts instruction or exposure in each case, and, further, to identify a single hypothesis for a mechanism of action. Nevertheless, this report consolidates some of the best available data on the relationship between arts- and youth-related variables, and, in this capacity, affords a basis for more rigorous inquiry.

25
Appendix: Meet the Databases
Appendix: Meet the Databases
National Education Longitudinal Study of 1988 (NELS:88)Lead sponsor: U.S. Department of Education, National Center for Education Statistics
Sample size at baseline: 24,599
Study population at baseline: 8th-grade students attending 1,052 schools across the U.S.
Years of data collection: 1988, 1990, 1992, 1994, 2000
Data collection methods: Surveys of students, parents, teachers, and school administrators. Cognitive tests in reading, math, science, and social studies (history/geography/civics). High school and postsec-ondary transcripts, where extant.
Student arts-related variables: 8th grade: attending concerts or other musical events; going to art museums; attending an art class at least once a week; attending a music class at least once a week; attending a drama/speech class at least once a week; participating in band or orchestra; participating in chorus or choir; participating in dance. 10th
grade: participating in drama club; volume of course-work in art; volume of coursework in music; volume of coursework in drama; participating in school music group; participating in school play or musical; frequency of music, art, or dance class-taking. 12th grade: participating in school music group; participating in school play, musical, or drama club; frequency of music, art, or dance class-taking.
How researchers scored arts engagement: One point was awarded for participation in an arts event or activity, with 3 points for participation as an officer or leader. Scores were also awarded for duration of arts course-taking—e.g., 1 for a single-semester course; 2 for a full school year; 3 for three semesters; and 4 for two full school years. For extracurricular arts activities, extra points were awarded for higher frequency of engagement: e.g., 1 for once a week; 2 for once or twice per week; and 3 for almost every day.
Learn more about this database: nces.ed.gov/surveys/nels88/
Early Childhood Longitudinal Study, Kindergarten Class of 1998-1999 (ECLS-K)Lead sponsor: U.S. Department of Education, National Center for Education Statistics
Sample size at baseline: 22,666
Study population at baseline: Kindergarten students attending 1,277 schools across the U.S.
Years of data collection: 1998–1999, 1999–2000, 2002, 2004, 2007
Data collection methods: Child assessments; parent interviews; child interviews; questionnaires administered to students, teachers, and school administrators.
Student arts-related variables: Parents’ involvement of children in various arts activities; students’ extracurricu-lar activities and/or classes or lessons involving the arts; arts instruction and/or activities in the classroom.
How researchers scored arts engagement: One point was awarded for each of the following variables, with, where applicable, an extra point awarded for participating more than once: Concert attendance in kindergarten and/or 3rd grade; museum visits in kindergarten and/or 3rd grade; dance lessons in 1st, 3rd, and/or 5th grade; music lessons in 1st, 3rd, and/or 5th grade; performing arts classes in 1st, 3rd, and/or 5th grade; arts and crafts lessons in 1st, 3rd, and/or 5th
grade; dancing for exercise in kindergarten, 3rd, and/or 5th grade; participation in 8th-grade school drama or music; frequency of music use in kindergarten, 3rd-, and/or 5th-grade classrooms; frequency of theater use in kindergarten, 3rd-, or 5th-grade classrooms; frequency of art/music/language classes outside school in 8th grade; frequency of doing hobbies, arts, crafts, or playing a musical instrument in 8th grade.
Learn more about this database: nces.ed.gov/ecls/kindergarten.asp
26 National Endowment for the Arts
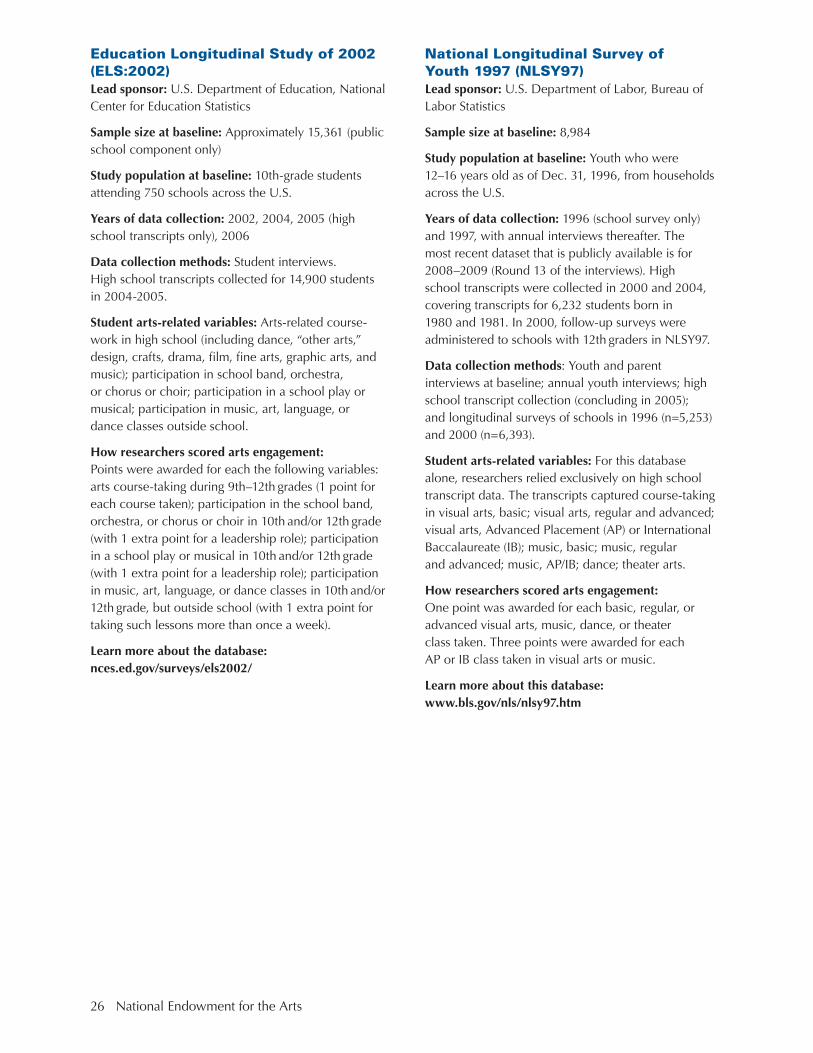
Education Longitudinal Study of 2002 (ELS:2002)Lead sponsor: U.S. Department of Education, National Center for Education Statistics
Sample size at baseline: Approximately 15,361 (public school component only)
Study population at baseline: 10th-grade students attending 750 schools across the U.S.
Years of data collection: 2002, 2004, 2005 (high school transcripts only), 2006
Data collection methods: Student interviews. High school transcripts collected for 14,900 students in 2004-2005.
Student arts-related variables: Arts-related course-work in high school (including dance, “other arts,” design, crafts, drama, film, fine arts, graphic arts, and music); participation in school band, orchestra, or chorus or choir; participation in a school play or musical; participation in music, art, language, or dance classes outside school.
How researchers scored arts engagement: Points were awarded for each the following variables: arts course-taking during 9th–12th grades (1 point for each course taken); participation in the school band, orchestra, or chorus or choir in 10th and/or 12th grade (with 1 extra point for a leadership role); participation in a school play or musical in 10th and/or 12th grade (with 1 extra point for a leadership role); participation in music, art, language, or dance classes in 10th and/or 12th grade, but outside school (with 1 extra point for taking such lessons more than once a week).
Learn more about the database: nces.ed.gov/surveys/els2002/
National Longitudinal Survey of Youth 1997 (NLSY97)Lead sponsor: U.S. Department of Labor, Bureau of Labor Statistics
Sample size at baseline: 8,984
Study population at baseline: Youth who were 12–16 years old as of Dec. 31, 1996, from households across the U.S.
Years of data collection: 1996 (school survey only) and 1997, with annual interviews thereafter. The most recent dataset that is publicly available is for 2008–2009 (Round 13 of the interviews). High school transcripts were collected in 2000 and 2004, covering transcripts for 6,232 students born in 1980 and 1981. In 2000, follow-up surveys were administered to schools with 12th graders in NLSY97.
Data collection methods: Youth and parent interviews at baseline; annual youth interviews; high school transcript collection (concluding in 2005); and longitudinal surveys of schools in 1996 (n=5,253) and 2000 (n=6,393).
Student arts-related variables: For this database alone, researchers relied exclusively on high school transcript data. The transcripts captured course-taking in visual arts, basic; visual arts, regular and advanced; visual arts, Advanced Placement (AP) or International Baccalaureate (IB); music, basic; music, regular and advanced; music, AP/IB; dance; theater arts.
How researchers scored arts engagement: One point was awarded for each basic, regular, or advanced visual arts, music, dance, or theater class taken. Three points were awarded for each AP or IB class taken in visual arts or music.
Learn more about this database: www.bls.gov/nls/nlsy97.htm
27
Notes
Notes
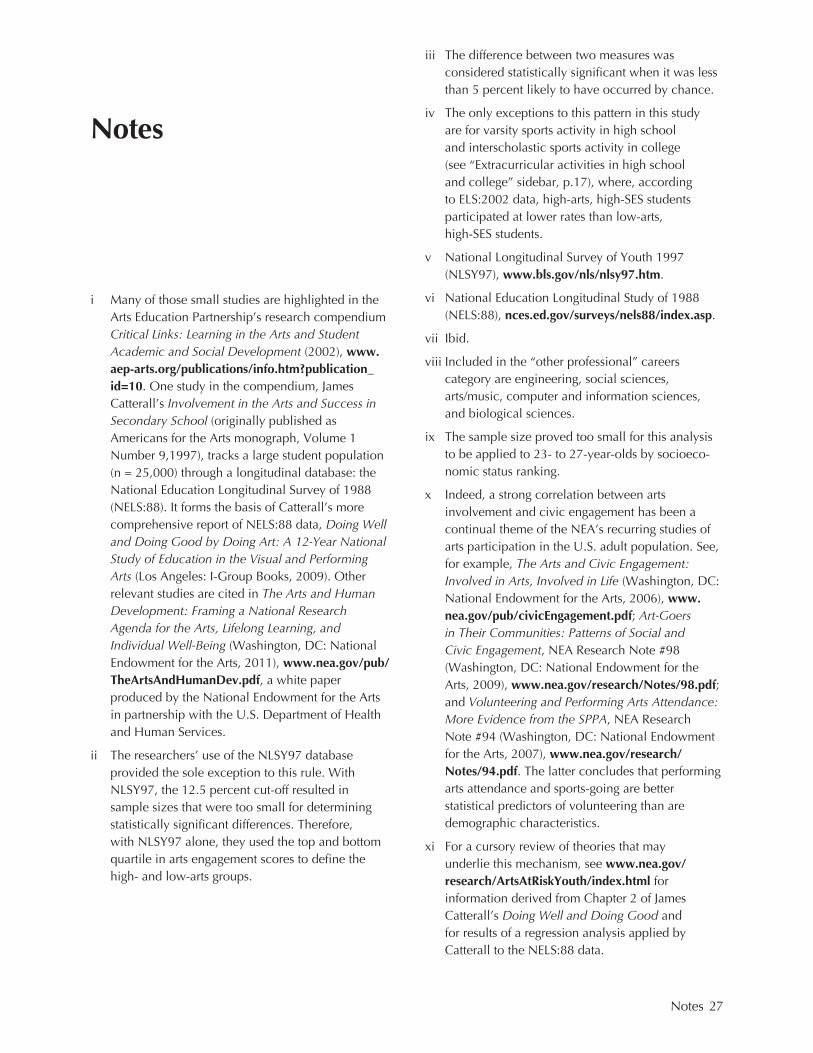
i Many of those small studies are highlighted in the Arts Education Partnership’s research compendium Critical Links: Learning in the Arts and Student Academic and Social Development (2002), www.aep-arts.org/publications/info.htm?publication_id=10. One study in the compendium, James Catterall’s Involvement in the Arts and Success in Secondary School (originally published as Americans for the Arts monograph, Volume 1 Number 9,1997), tracks a large student population (n = 25,000) through a longitudinal database: the National Education Longitudinal Survey of 1988 (NELS:88). It forms the basis of Catterall’s more comprehensive report of NELS:88 data, Doing Well and Doing Good by Doing Art: A 12-Year National Study of Education in the Visual and Performing Arts (Los Angeles: I-Group Books, 2009). Other relevant studies are cited in The Arts and Human Development: Framing a National Research Agenda for the Arts, Lifelong Learning, and Individual Well-Being (Washington, DC: National Endowment for the Arts, 2011), www.nea.gov/pub/TheArtsAndHumanDev.pdf, a white paper produced by the National Endowment for the Arts in partnership with the U.S. Department of Health and Human Services.
ii The researchers’ use of the NLSY97 database provided the sole exception to this rule. With NLSY97, the 12.5 percent cut-off resulted in sample sizes that were too small for determining statistically significant differences. Therefore, with NLSY97 alone, they used the top and bottom quartile in arts engagement scores to define the high- and low-arts groups.
iii The difference between two measures was considered statistically significant when it was less than 5 percent likely to have occurred by chance.
iv The only exceptions to this pattern in this study are for varsity sports activity in high school and interscholastic sports activity in college (see “Extracurricular activities in high school and college” sidebar, p.17), where, according to ELS:2002 data, high-arts, high-SES students participated at lower rates than low-arts, high-SES students.
v National Longitudinal Survey of Youth 1997 (NLSY97), www.bls.gov/nls/nlsy97.htm.
vi National Education Longitudinal Study of 1988 (NELS:88), nces.ed.gov/surveys/nels88/index.asp.
vii Ibid.
viii Included in the “other professional” careers category are engineering, social sciences, arts/music, computer and information sciences, and biological sciences.
ix The sample size proved too small for this analysis to be applied to 23- to 27-year-olds by socioeco-nomic status ranking.
x Indeed, a strong correlation between arts involvement and civic engagement has been a continual theme of the NEA’s recurring studies of arts participation in the U.S. adult population. See, for example, The Arts and Civic Engagement: Involved in Arts, Involved in Life (Washington, DC: National Endowment for the Arts, 2006), www.nea.gov/pub/civicEngagement.pdf; Art-Goers in Their Communities: Patterns of Social and Civic Engagement, NEA Research Note #98 (Washington, DC: National Endowment for the Arts, 2009), www.nea.gov/research/Notes/98.pdf; and Volunteering and Performing Arts Attendance: More Evidence from the SPPA, NEA Research Note #94 (Washington, DC: National Endowment for the Arts, 2007), www.nea.gov/research/Notes/94.pdf. The latter concludes that performing arts attendance and sports-going are better statistical predictors of volunteering than are demographic characteristics.
xi For a cursory review of theories that may underlie this mechanism, see www.nea.gov/research/ArtsAtRiskYouth/index.html for information derived from Chapter 2 of James Catterall’s Doing Well and Doing Good and for results of a regression analysis applied by Catterall to the NELS:88 data.

National Endowment for the Arts 1100 Pennsylvania Ave, NW
Washington, DC 20506-0001 (202) 682-5400
Not for sale. Available for free at arts.gov