the asian american market report - hispanicad.com
TRANSCRIPT
1
Numbering over
19 million in 2019, Asians represent 5.6% of the U.S. population and are the fastest-growing population segment since 2000.
The face of America is changing, and multicultural consumers already represent the majority of the expected growth in the United States now and in the future.
In this second report of the Claritas New American Mainstream series, we’ll identify the Asian American segment in great detail, especially their population growth, household income and cumulative lifetime spending within key categories.
Currently, more than 19 million Non-Hispanic Asian & Pacific Islanders live in the United States, making this group the fastest-growing population segment since 2000, with 84% growth.
Continue reading to understand why this is a group that marketers can’t afford to ignore.
Part 2 – Feb 2019
The Asian American Market Report: Understanding The New American Mainstream
The Asian American Market Report — ©2019 Claritas, LLC.
2
Executive SummaryThe Asian American population is momentous for many reasons, but perhaps most notably due to its growth rate, buying power and ancestral diversity. American marketers would serve their companies well by understanding the demographic, economic, cultural and buying trends of Asians in order to fully-capitalize on the opportunity they represent.
Numbering more than 19 million in 2019, the Asian population represents 5.6 percent of the U.S. population, but about 21 percent of population growth since 1990. When you consider that there are seven Asian cities with greater than 19 million population worldwide (Tokyo, Delhi, Shanghai, Guangzhou, Beijing, Shenzhen and Wuhan), it is clear to see how an immigration wave towards the U.S. could create a new surge in Asian Americans.
Ancestral diversity among Asians in the U.S. is quite noteworthy. Whereas two-thirds of U.S. Hispanics are of Mexican origin, the largest single ancestry group among Asian Americans is Chinese at 23 percent, followed by Filipinos and Asian-Indians at 18 percent each. This diversity presents opportunities as well as challenges. Asians are conveniently included in one diverse group; however, each nation is distinct in terms of both language and culture. Although many Asians in the U.S. are acculturated, 62 percent retain their culture of heritage (Asianicity™) at least to a modest degree.
The most compelling business case for engaging Asians is buying power. Average Asian household income in 2019 is $116,319, which is 36 percent greater than overall household income and even 22 percent greater than White household income. Furthermore, Asians are disproportionately present within the upper income ranks. As you’ll see in this report, 13.4 percent of Asian households will earn more than $200,000 in 2019 – a far greater proportion in that strata than any other major cultural segment.
Perhaps the single most convincing data point that could drive economic investment in the Asian American consumer segment is their anticipated spending over their remaining lifetimes. Claritas’ analysis shows that on average, today’s Asian household will spend $1.2 million more than non-Hispanic White households over the remainder of their lifetimes.
Mining both the quantitative and qualitative data on Asian Americans will yield the understanding needed to genuinely engage this coveted population segment. Determining which mix of traditional and digital media is key, as Asians tend to be tech-savvy and digitally connected. The ability to link Asian identifiers to cultural segments and to steer media campaigns towards the appropriate channels and devices will certainly prove worthwhile to your company’s top and bottom lines.
César M. Melgoza
The Asian American Market Report — ©2019 Claritas, LLC.

U.S. Asian & Pacific Islander 2019 Population Facts
Currently, there are 133,211,770 multicultural Americans in the U.S. and they account for 37.5% of the U.S. population.
Although Non-Hispanic Asian & Pacific Islanders account for the smallest multicultural segment at 5.8%, they were the second fastest growing ethic group at 20.61%.
3
62.5%
12.2%
5.8%
19.5%
37.5%
Non-Hispanic All OthersNon-Hispanic BlackNon-Hispanic Asian & Pacific IslanderHispanic
Population Growth 1990-2019
10.44% 16.60% 20.61%13.51%
14.56% 12.03%
40.75%
55.77%68.02%
35.30%
13.06%
0%
25%
50%
75%
100%
Growth 1990-2000 Growth 2000-2010 Growth 2010-2019
Non-Hispanic Asian & Pacific Islander Non-Hispanic BlackHispanic All Other Non-Hispanic
Source: U.S. Census Bureau for 1990-2010 and Geoscape AMDS 2019
Since 2010, Asian Americans represent the second-fastest growing ethnic group after Hispanics.
All Other non-Hispanic: - 0.66%
Source: Geoscape® AMDS 2019
The Asian American Market Report — ©2019 Claritas, LLC.

Nearly all of the U.S. population growth since 2000 has come from multicultural segments, and that trend is likely to continue in the future. The Non-Hispanic Asian & Pacific Islander population continues to show significant growth, thus representing one of the biggest opportunities for marketers to grow their businesses in the future.
Into the Future: The Multicultural Boom 2019 - 2024
Today, 19,169,385 Non-Hispanic Asian & Pacific Islanders live in the United States. Non-Hispanic Asian & P. Islanders have been the fastest-growing population segment since 2000, showing 84% growth. Virtually all of the growth now and into the foreseeable future will emanate from groups other than the traditional “majority” Non-Hispanic White population.
4
Growth During 20 Year Period 2000 - 2019
The Asian American
Population Grew 84% from 2010-2019 to Reach Nearly 19.17 Million
Source: U.S. Census Bureau for 1990-2010 and Geoscape AMDS Projections for 2019-2024.
Source: Geoscape® AMDS 2019
The Asian American Market Report — ©2019 Claritas, LLC.
Multicultural GroupAverage Growth in Population Per…
Year Month Day HourNon-Hispanic Whites -60,156 -5,013 -165 -7Hispanics 1,536,315 128,026 4,209 175Non-Hispanic Blacks 315,492 26,291 864 36Non-Hispanic Asian & Pacific Islanders 483,004 40,250 1,323 55
Multicultural Group Population Growth
Growth During 2000-2019
% of Total Growth
Non-Hispanic Whites 1,510,265 0.8% 3.2%
Hispanics 29,177,345 83% 61%
Non-Hispanic Blacks 6,443,658 19% 13%Non-Hispanic Asian & Pacific Islanders 8,758,829 84% 18%

Percent of the U.S. Population: 1990-2024
Hispanics and Asians are becoming a larger portion of our nation’s population. The Black population is growing, but is nearly constant as a proportion of the total population. Meanwhile, the Non-Hispanic White population proportion has been declining steadily as a proportion of overall American population.
5
75.8%
69.1%
63.7% 62.6%60.5%
11.8% 12.0% 12.2% 12.2% 12.2%
2.8% 3.7% 4.8% 5.6% 6.1%8.8%
12.5%16.3%
19.6% 21.1%
0%
10%
20%
30%
40%
50%
60%
70%
80%
1990 2000 2010 2019 2024
N-Hispanic All Others N-H Black N-H Asian & PI Hispanic
By 2024, Non-Hispanics Asian and Pacific Islanders will reach
more than 21.5 MM persons in the U.S.
Perc
ent P
opul
atio
n
Source: U.S. Census Bureau for 1990-2010 and Geoscape AMDS Projections for 2019-2024.
The Asian American Market Report — ©2019 Claritas, LLC.
80.1% 75.2%64.4%
50.5%41.5%
7.6%9.4%
12.0%
12.9%
13.4%
3.8% 5.0%6.0%
8.1%
5.6%
7.8% 9.9%16.1%
25.3%32.1%
0.7% 0.5% 1.5% 3.2%7.4%
0%
10%
20%
30%
40%
50%
60%
70%
80%
90%
100%
Age 75+ Boomer 1946-65 Gen X 1966-80 Millennial (Gen Y)1981-97
Age 0-4
Perc
ent o
f Tot
al G
ener
atio
n C
ohor
t
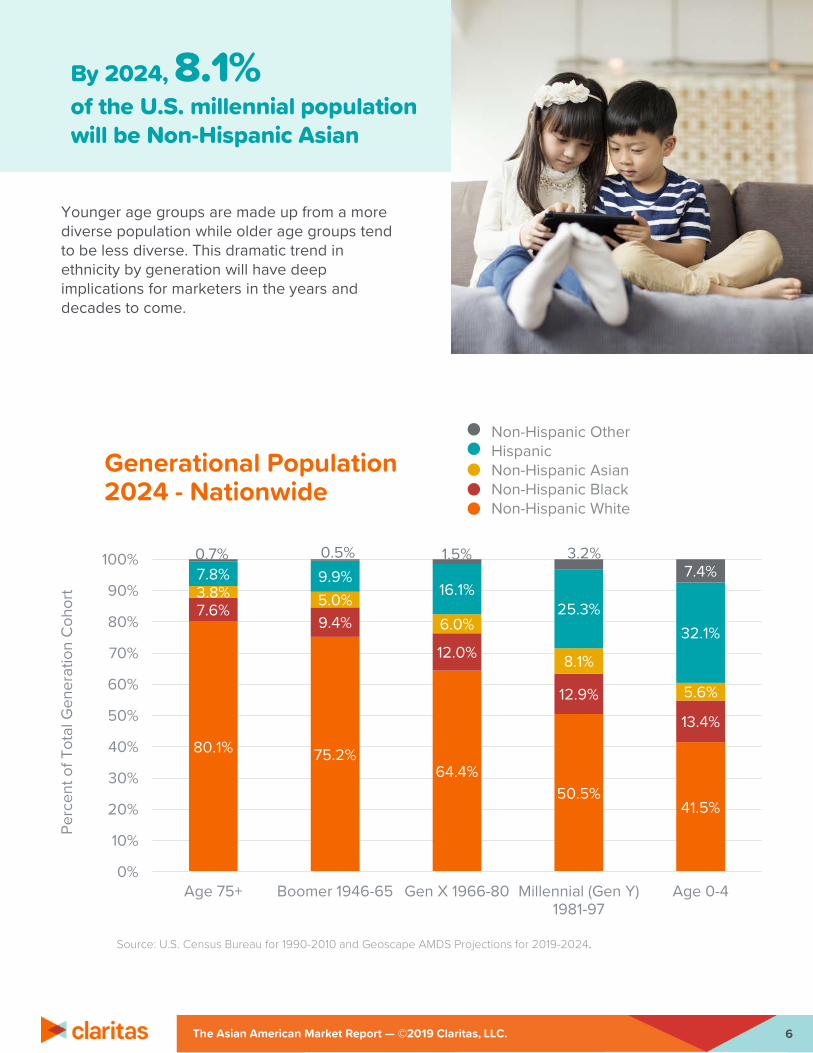
Younger age groups are made up from a more diverse population while older age groups tend to be less diverse. This dramatic trend in ethnicity by generation will have deep implications for marketers in the years and decades to come.
6
Source: U.S. Census Bureau for 1990-2010 and Geoscape AMDS Projections for 2019-2024.
Generational Population 2024 - Nationwide
By 2024, 8.1% of the U.S. millennial population will be Non-Hispanic Asian
Non-Hispanic OtherHispanicNon-Hispanic AsianNon-Hispanic BlackNon-Hispanic White
The Asian American Market Report — ©2019 Claritas, LLC.

7
Top 20 DMAs By Asian Population vs. Growth (2010-2019)
Los Angeles
New
York
San Francisco
Washington, D
C
Chicago
Seattle-Tacoma
Houston
Sacramento
Honolulu
Dallas
Philadelphia
Boston
San Diego
Atlanta
Minn.-St. Paul
Las Vegas
Phoenix
Detroit
Portland
Baltimore
0
10
20
30
40
50
60
0
2
4
6
8
10%persons, million Asian Population, 2019 % Growth, 2010-2019
Source: Geoscape® AMDS 2019
2019 U.S. Asian Population Distribution by DMA (excluding Pacific Islander)
Source: Geoscape® AMDS 2019
Where Does the Asian Population Live? Asian population segments are concentrated in Los Angeles, New York, San Francisco, D.C., Chicago and Seattle. Their presence in many other areas is growing as well with significant growth in Houston, Dallas, Atlanta, Las Vegas and Phoenix.
The Asian American Market Report — ©2019 Claritas, LLC.

8
Source: Geoscape® AMDS 2019
Asian Workday Population - Washington D.C. 2019
The map to the left illustrates the heavy concentrations of residential Asian population in certain census tracts in and around Washington D.C.
The difference between Workday and Residential populations reveals areas where day time population significantly increases and areas desirable for locating retail and service establishments to serve the working population. The areas in red show places where Asians commute to for work.
Source: Geoscape® AMDS 2019
Asian Population - Washington D.C. 2019
Asian Population & Workday Population: D.C. 2019
The Asian American Market Report — ©2019 Claritas, LLC.
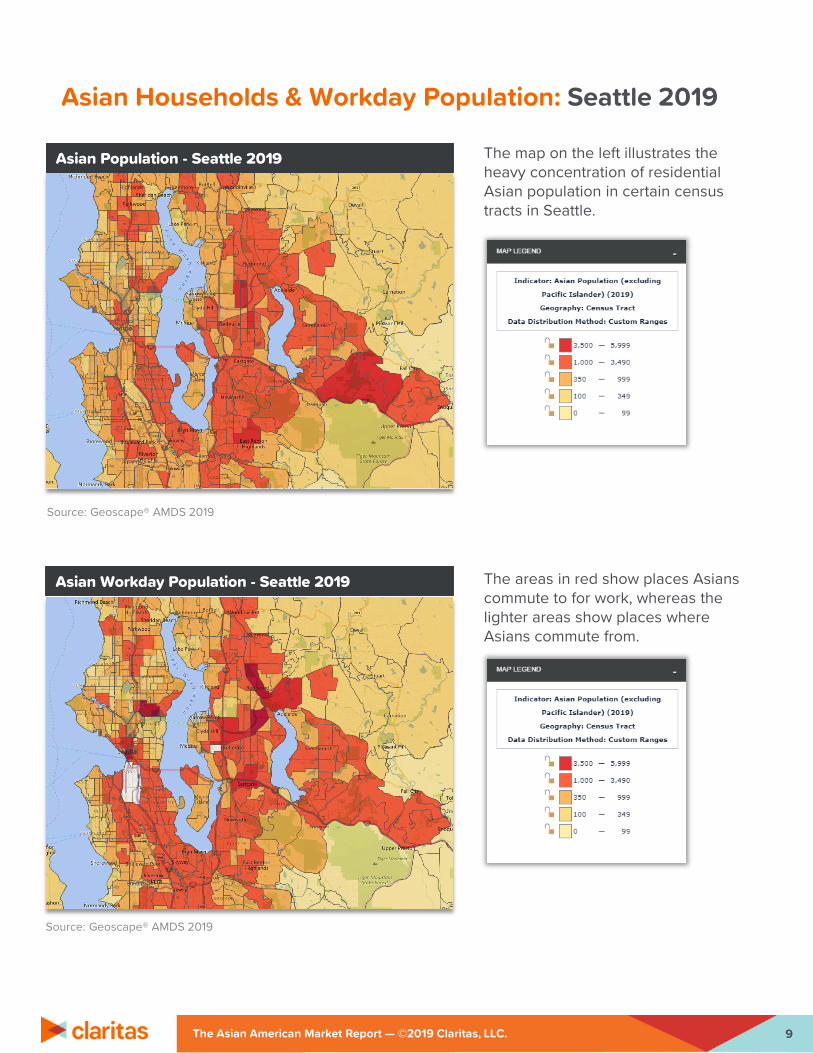
Asian Households & Workday Population: Seattle 2019
9
Source: Geoscape® AMDS 2019
The map on the left illustrates the heavy concentration of residential Asian population in certain census tracts in Seattle.
The areas in red show places Asians commute to for work, whereas the lighter areas show places where Asians commute from.
Asian Population - Seattle 2019
Source: Geoscape® AMDS 2019
Asian Workday Population - Seattle 2019
The Asian American Market Report — ©2019 Claritas, LLC.

10
$60,194
$70,727
$43,966
$91,414
$51,747
$0
$10,000
$20,000
$30,000
$40,000
$50,000
$60,000
$70,000
$80,000
$90,000
$100,000
Total White Black Asian & P.Islander
Hispanic
Annu
al H
H In
com
e (D
olla
rs)
Median Annual Household Income
Source: Geoscape® AMDS 2019
The Average U.S. Asian Household Makes $116,319 (a Whopping 36% More Than Other U.S. Households)The most compelling business case for engaging Asians is buying power. Compared to the overall 2019 median annual household income, the median Asian household income is highest, followed by Whites, Hispanics, and Blacks. Median Asian HH Income is more than 50% higher than for total U.S. households. Average Asian household income in 2019 is $116,319, which is 36 percent greater than overall household income and even 22 percent greater than White household income.
Population HHs Median HH Income Mean HH Income Aggregate HH Income
Total 125,018,808 $60,194 $85,710.10 $10,715,375,124,299
White 94,015,753 $70,727 $94,990.84 $8,930,635,153,323
Black 15,506,334 $43,966 $61,376.06 $951,717,660,040
Asian & P.I. 6,230,709 $91,414 $116,319.15 $724,750,796,367
Hispanic 17,589,124 $51,747 $69,468.61 $1,221,892,028,115
Source: Geoscape® AMDS 2019
The Asian American Market Report — ©2019 Claritas, LLC.

11
2.0 (12.7%)0.4 (6.1%) 1.5 (8.4%)
1.6 (10.5%)
0.3 (4.6%)
1.7 (9.6%)
2.1 (13.4%)
0.4 (6.0%)
2.0 (11.2%)
3.2 (21.0%)
0.6 (10.4%)
3.4 (19.2%)
2.6 (16.6%)
0.9 (15.1%)
3.4 (19.5%)
1.5 (9.4%)
0.7 (12.0%)
2.1 (11.9%)
1.6 (10.4%)
1.3 (21.4%)
2.3 (12.9%)
0.6 (3.6%)
0.7 (11.0%)
0.7 (4.2%)0.4 (2.5%)
0.8 (13.4%)
0.5 (3.1%)
0%
10%
20%
30%
40%
50%
60%
70%
80%
90%
100%
Black Asian Hispanic
Hou
seho
ld C
ount
s (M
M) &
Per
cent
's by
Inco
me
Rang
e
Ethnicity/Race
Income Ranges By Ethnicity/Race
$200k+$150k - $200k$100k - $150k$75k - $100k$50k - $75k$35k - $50k$25k - $35k$15k - $25kLess than $15k
Source: Geoscape® AMDS 2019
13.4% Asian households will earn more than $200,000 in 2019 – a far greater proportion than any other major cultural segment.
About 24% of U.S. Asian Households Will Earn $150,000 or More This YearAnnual household incomes have risen slowly during the past few post-recession years. For the largest ethnic groups, U.S. Asian households have the highest percent of growth (72.8%), earning $50,000 or more on average, followed by Hispanic and Black households. Approximately, 24% of Asian American households earn $150,000 or more per year.
24.4%
The Asian American Market Report — ©2019 Claritas, LLC.

Diversity of Asian AmericansAsianicity™ is a Geoscape® CultureCode® measuring the degree to which people of Asian heritage in the United States retain elements of their Asian culture while they acquire elements of the American culture. Asianicity can be dimensionalized by various characteristics including country-of-origin, life stage, socioeconomic strata, income, media usage and a variety of shopping behaviors. The result is an unprecedented level of detail that enables marketers to understand the dynamics of the diverse American consumer and market to them more effectively.
12
7.19
2.30
3.65
3.32
2.44
0 1 2 3 4 5 6 7 8
(AA1) Very Westernized
(AA2) Bi-Cultural Westernized
(AA3) Bi-Cultural
(AA4) Bi-Cultural Easternized
(AA5) Very Asian Identity
Asianicity™ Acculturation Segments for Asian Population 2019
English preferred (some home language); Born in U.S.; 2nd generation. Some Asian cultural practices; some “retro-acculturate”
English dominant, Born in U.S.; 3rd+ generation. Few Asian cultural practices
Very Westernized Very Asian IdentityBi-Cultural Westernized Bi-Cultural Bi-Cultural
Easternized
Bi-Lingual (equal or nearly); Immigrant as child or young adult. Many Asian cultural practices
AA1 AA2 AA3 AA4 AA5Asian language preferred (some English); Immigrant as adult; in U.S. 10+ years. Pre-dominant Asian cultural practices
Spanish dominant (nearly no English); Recent immigrant as adult (less than 10 years ago). Primarily Asian cultural practices. Identify with home country more than U.S.
38% 12% 19% 18% 13%
Asian Population (MM)
Source: Geoscape® AMDS 2019
Source: Geoscape® AMDS 2019
Although many Asians in the U.S. are acculturated, 62 percent retain their culture of heritage (Asianicity™) at least to a modest degree.
The Asian American Market Report — ©2019 Claritas, LLC.

13
Country of Origin: Asian AmericansWhen product developers think of the Asian market, it’s important to realize it is not a single group. Asians in America come from more than 40 different countries (like India, China, Vietnam, Korea, and the Philippines), representing a wide variety of cultures, languages, and preferences. Unlike Latinos, Asian Americans don’t basically share a single language.
These are very, very different cultures, with different languages, so it makes it quite hard to deliver a culturally sensitive message. Chinese plus Taiwanese form the largest Asian country of origin segment at 23% followed by slightly decreasing portions of Asian Indian, Filipino, Korean, Vietnamese and Japanese.
Other SE Asian 6%
Chinese & Taiwanese
23%
Filipino 18%
Japanese7%
Korean11%
Vietnamese10%
Asian Indian 18%
Other S. Asian 4%
Other Asian 1% Polynesian 2%
Country of Origin: Asians
Whereas two-thirds of U.S. Hispanics are of Mexican origin, the largest single ancestry group among Asian Americans is Chinese at 23%, followed by Filipinos and Asian-Indians at 18% each.
Source: Geoscape® AMDS 2019
The Asian American Market Report — ©2019 Claritas, LLC.
14
Source: Geoscape® AMDS 2019
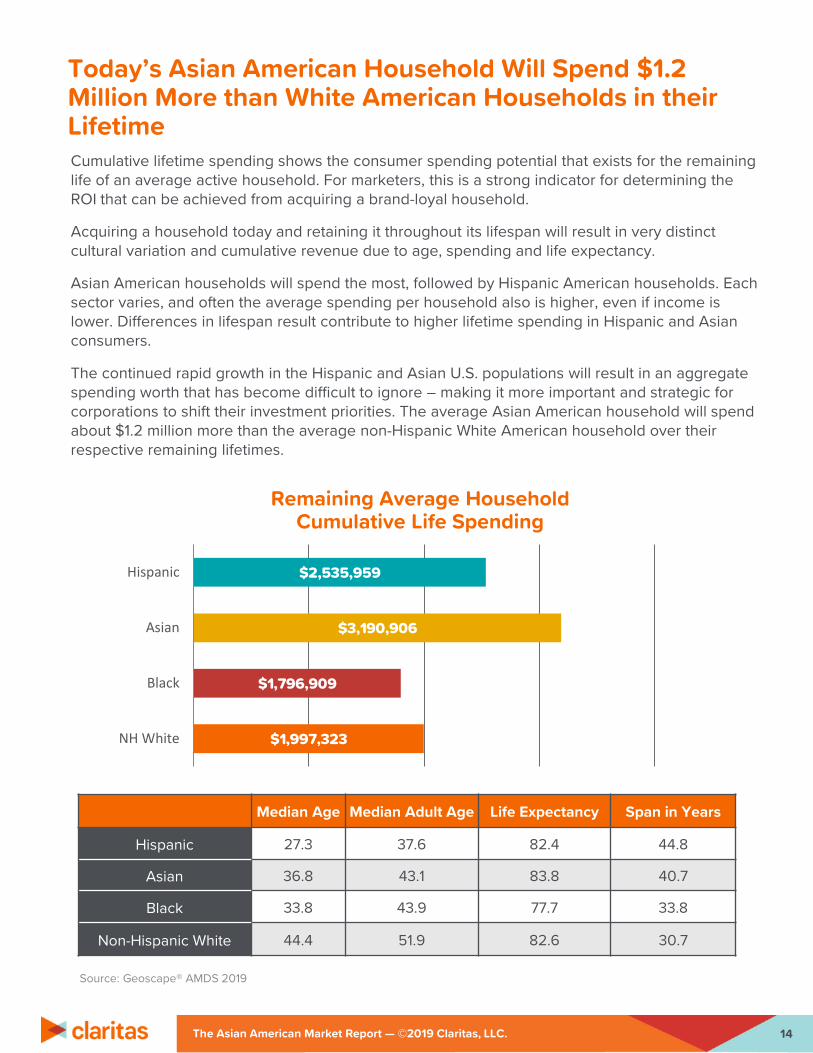
Median Age Median Adult Age Life Expectancy Span in Years
Hispanic 27.3 37.6 82.4 44.8
Asian 36.8 43.1 83.8 40.7
Black 33.8 43.9 77.7 33.8
Non-Hispanic White 44.4 51.9 82.6 30.7
$1,997,323
$1,796,909
$3,190,906
$2,535,959
NH White
Black
Asian
Hispanic
Remaining Average Household Cumulative Life Spending
Today’s Asian American Household Will Spend $1.2 Million More than White American Households in their LifetimeCumulative lifetime spending shows the consumer spending potential that exists for the remaining life of an average active household. For marketers, this is a strong indicator for determining the ROI that can be achieved from acquiring a brand-loyal household.
Acquiring a household today and retaining it throughout its lifespan will result in very distinct cultural variation and cumulative revenue due to age, spending and life expectancy.
Asian American households will spend the most, followed by Hispanic American households. Each sector varies, and often the average spending per household also is higher, even if income is lower. Differences in lifespan result contribute to higher lifetime spending in Hispanic and Asian consumers.
The continued rapid growth in the Hispanic and Asian U.S. populations will result in an aggregate spending worth that has become difficult to ignore – making it more important and strategic for corporations to shift their investment priorities. The average Asian American household will spend about $1.2 million more than the average non-Hispanic White American household over their respective remaining lifetimes.
The Asian American Market Report — ©2019 Claritas, LLC.
15
0.00.51.01.5
2.02.53.03.5
2019 2024 2029 2034 2039 2044 2049 2054 2059 2064
NH White Black
Asian
Hispanic
Cum
ulat
ive
Hou
seho
ld S
pend
ing
Mill
ions
(201
9$)
Remaining Life Span of Household
Total Household Consumer ExpendituresNH White Black Asian Hispanic
Source: Geoscape® AMDS 2019, Consumer Spending Dynamix (CSDx) 2019
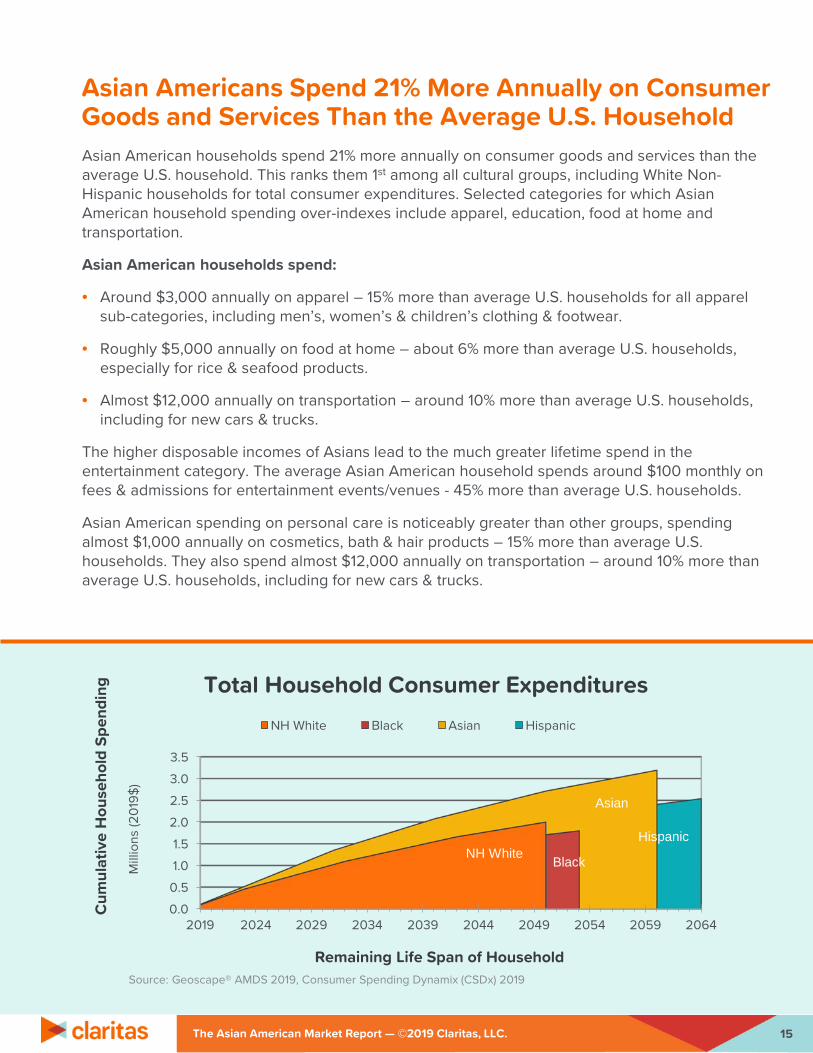
Asian Americans Spend 21% More Annually on Consumer Goods and Services Than the Average U.S. HouseholdAsian American households spend 21% more annually on consumer goods and services than the average U.S. household. This ranks them 1st among all cultural groups, including White Non-Hispanic households for total consumer expenditures. Selected categories for which Asian American household spending over-indexes include apparel, education, food at home and transportation.
Asian American households spend:
• Around $3,000 annually on apparel – 15% more than average U.S. households for all apparel sub-categories, including men’s, women’s & children’s clothing & footwear.
• Roughly $5,000 annually on food at home – about 6% more than average U.S. households, especially for rice & seafood products.
• Almost $12,000 annually on transportation – around 10% more than average U.S. households, including for new cars & trucks.
The higher disposable incomes of Asians lead to the much greater lifetime spend in the entertainment category. The average Asian American household spends around $100 monthly on fees & admissions for entertainment events/venues - 45% more than average U.S. households.
Asian American spending on personal care is noticeably greater than other groups, spending almost $1,000 annually on cosmetics, bath & hair products – 15% more than average U.S. households. They also spend almost $12,000 annually on transportation – around 10% more than average U.S. households, including for new cars & trucks.
The Asian American Market Report — ©2019 Claritas, LLC.

16
0
5
10
15
20
25
30
35
2019 2024 2029 2034 2039 2044 2049 2054 2059 2064
NH WhiteBlack
AsianHispanic
Cum
ulat
ive
Hou
seho
ld S
pend
ing
Thou
sand
s (2
019$
)
Remaining Life Span of Household
Personal Care Products & Services
NH White Black Asian Hispanic
Asian spending on personal care is noticeably greater than by other groups. Asian American households spend almost $1,000 annually on cosmetics, bath & hair products –15% more than average U.S. households.
0
20
40
60
80
100
120
2019 2024 2029 2034 2039 2044 2049 2054 2059 2064
NH White
Black
Asian
Hispanic
Cum
ulat
ive
Hou
seho
ld S
pend
ing
Thou
sand
s (2
019$
)
Remaining Life Span of Household
Apparel
NH White Black Asian Hispanic
Asian American households spend around $3,000 annually on apparel – 15% more than average U.S. households for all apparel sub-categories, including men’s, women’s & children’s clothing & footwear.
The Asian American Market Report — ©2019 Claritas, LLC.
Source: Geoscape® AMDS 2019, Consumer Spending Dynamix (CSDx) 2019
Source: Geoscape® AMDS 2019, Consumer Spending Dynamix (CSDx) 2019

17The Asian American Market Report — ©2019 Claritas, LLC.
0
10
20
30
40
50
60
2019 2024 2029 2034 2039 2044 2049 2054 2059 2064
NH WhiteBlack
AsianHispanic
Cum
ulat
ive
Hou
seho
ld S
pend
ing
Thou
sand
s (2
019$
)
Remaining Life Span of Household
Food Away from Home Quick Service Restaurants
NH White Black Asian Hispanic
Asian American households spend over $2,500 annually on quick service restaurants (for lunch & snacks) – 30% more than average U.S. households.
0
50
100
150
200
250
2019 2024 2029 2034 2039 2044 2049 2054 2059 2064
NH WhiteBlack
Asian Hispanic
Cum
ulat
ive
Hou
seho
ld S
pend
ing
Thou
sand
s (2
019$
)
Remaining Life Span of Household
Food at Home
NH White Black Asian Hispanic
Asian American households spend around $5,000 annually on food at home – about 6% more than average U.S. households, especially for rice & seafood products.
Source: Geoscape® AMDS 2019, Consumer Spending Dynamix (CSDx) 2019
Source: Geoscape® AMDS 2019, Consumer Spending Dynamix (CSDx) 2019
18
050
100150
200250300350400450500
2019 2024 2029 2034 2039 2044 2049 2054 2059 2064
NH WhiteBlack
AsianHispanic
Cum
ulat
ive
Hou
seho
ld S
pend
ing
Thou
sand
s (2
019$
)
Remaining Life Span of Household
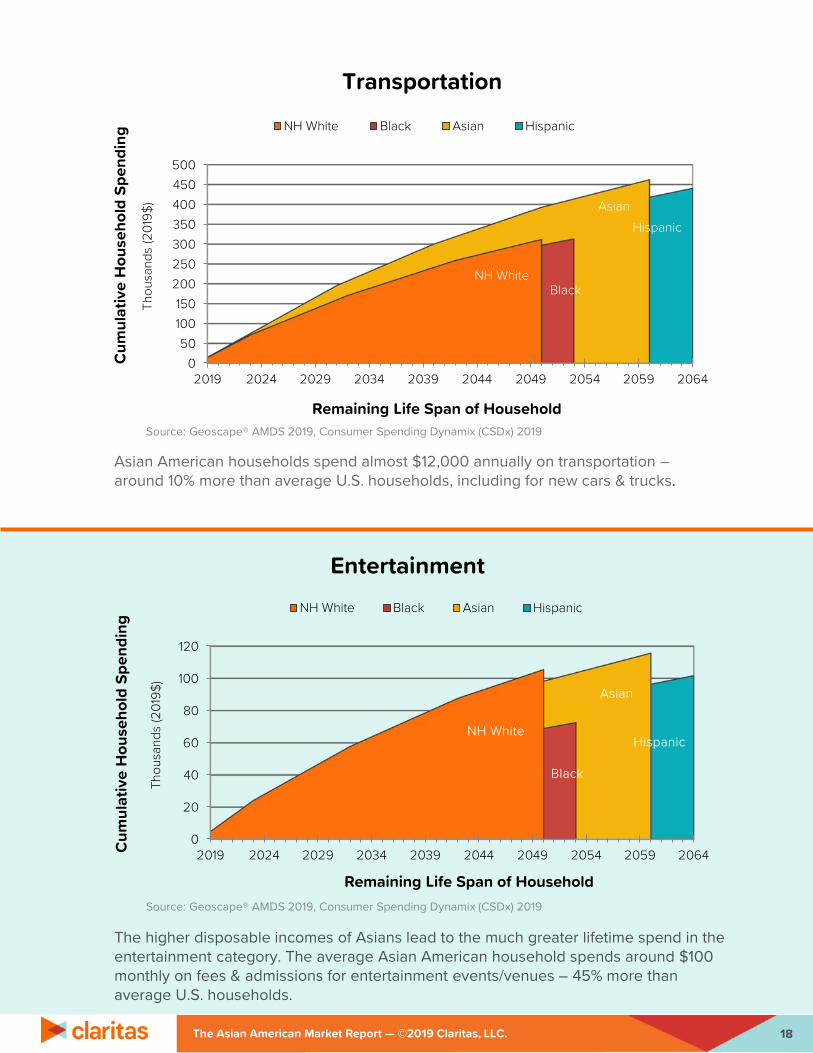
Transportation
NH White Black Asian Hispanic
Asian American households spend almost $12,000 annually on transportation –around 10% more than average U.S. households, including for new cars & trucks.
0
20
40
60
80
100
120
2019 2024 2029 2034 2039 2044 2049 2054 2059 2064
NH White
Black
Asian
Hispanic
Cum
ulat
ive
Hou
seho
ld S
pend
ing
Thou
sand
s (2
019$
)
Remaining Life Span of Household
EntertainmentNH White Black Asian Hispanic
The higher disposable incomes of Asians lead to the much greater lifetime spend in the entertainment category. The average Asian American household spends around $100 monthly on fees & admissions for entertainment events/venues – 45% more than average U.S. households.
The Asian American Market Report — ©2019 Claritas, LLC.
Source: Geoscape® AMDS 2019, Consumer Spending Dynamix (CSDx) 2019
Source: Geoscape® AMDS 2019, Consumer Spending Dynamix (CSDx) 2019

Asians Access Social Media on Smartphones 23% More Than Other Americans – and They are 2X More Likely to
Use LinkedIn
19The Asian American Market Report — ©2019 Claritas, LLC.
In the past 30 days, Asian American adults have indexed the highest on all social media sites/apps except for Instagram and Snapshot. Out of the top six social media sites/apps, Asian Americans indexed highest on LinkedIn. On LinkedIn, more specifically, Asians are roughly two times more likely than the average U.S. household to have used LinkedIn in the past 30 days.
Asian American adults also indexed highest over the past 30 days on all three major device types, including desktop computer, smartphone and tablet. In fact, Asian Americans are 23% more likely than the average to access social media on their smartphone.
Source: Geoscape® AMDS 2017, Nielsen Scarborough, 2017
Source: Geoscape® AMDS 2017, Nielsen Scarborough, 2017
Inde
xIn
dex
0
50
100
150
200
250
Facebook Instagram Snapchat Twitter LinkedIn YouTube
Adult Social Media Site/App Usage in the Past 30 days by Ethnicity (Indexed at 100)
Hispanic Asian Black White
0
20
40
60
80
100
120
140
Hispanic Asian Black White
Ways Social Networks Were Used in the Past 30 Days by Ethnicity (Indexed at 100)
On computer On smartphone On tablet

To learn more about how to find your next multicultural consumer, visit www.claritas.com/geoscape or call 800.234.5973.
About ClaritasClaritas helps companies identify customers. Not just any customers–their best customers. We help engage and deliver those customers when and where they want to be engaged. And finally, we help clients optimize those engagements with remarkable transparency and precision in near-real-time.
Our tools and data define who your best customers are, how they behave, and how to connect with them. With powerful original research, trusted data partnerships, and an expert Analytics team, we provide the why behind the buy that is the key to selling smarter and winning bigger.
Targeting the New American MainstreamTo capture multicultural growth opportunities, you must first understand them: their likes, dislikes, preferences, behaviors, etc. These insights let you create personas, tailor messages and promotions specific to their wants and needs. Marketers leverage Claritas’ deep understanding of multicultural segments, using tools, such as Geoscape CultureCodes across local, national and digital markets for smarter targeting, smarter planning and smarter buying to help drive bigger profits.
Multicultural Insights to Shape a Smarter PlanData from Geoscape American Marketscape Datastream (AMDS) can be applied to a wide variety of situations and challenges using computerized applications, such as the online Geoscape Intelligence System (GIS). Some of the applications are listed below.
• Strategic Planning• Market Potential Assessment• Product Development & Positioning• Database mining & modeling• Retail Site Selection & Distribution• Marketing Communications & Media Planning• Promotions & Direct Response• Market Research: Surveys, Focus Groups, etc.• Industry specific intelligence applications• Sales potential and forecasting• Consumer segmentation and targeting• Customer relationship management• Investment Valuation• Public & Social Services• Budget Allocation• Staffing• In-store experience management• Retail shelf-space planning
20The Asian American Market Report — ©2019 Claritas, LLC.