the association of glutathione transferase a1, m1, p1 and t1 gene
TRANSCRIPT

University of Belgrade School of Medicine
Vesna M. Ćorić
THE ASSOCIATION OF GLUTATHIONE TRANSFERASE A1, M1, P1 AND T1 GENE
POLYMORPHISMS WITH THE RISK OF RENAL CELL CARCINOMA DEVELOPMENT AND PROGRESSION
Doctoral dissertation
Belgrade, 2017.

GSTA1, GSTM1, GSTP1 and GSTT1 polymorphisms in RCC
Mentor: Professor Marija Plješa Ercegovac, MD, PhD Assocaite professor of medical and clinical biochemistry, Institute of medical and clinical biochemistry, School of Medicine, University of Belgrade Comentor: Professor Zoran Džamić, MD, PhD Assocaite professor of Urology, Clinic of Urology, Clinical Center of Serbia, Belgrade, School of Medicine, University of Belgrade Assessment committee: Professor dr Tatjana Simić, MD, PhD, Full professor of medical and clinical biochemistry, Institute of medical and clinical biochemistry, School of Medicine, University of Belgrade Professor dr Tatjana Pekmezović, MD, PhD, Full professor of epidemiology, Institute of Epidemiology, School of Medicine, University of Belgrade Professor Manuela Schmidinger, MD, PhD, Full professor of Oncology, Medizinische Universität Wien, Klinik für Innere Medizin I Klinische Abteilung für Onkologie, Waehringer Guertel 18-20, A-1090 Wien (Austria)
The date of the defence: __________________, Belgrade

GSTA1, GSTM1, GSTP1 and GSTT1 polymorphisms in RCC
Ko ne zna, a ne zna da ne zna – opasan je, izbegavajte ga! Ko ne zna, a zna da ne zna – dete je, naučite ga! Ko zna, a ne zna da zna – spava, probudite ga!
Ko zna i zna da zna – mudar je, sledite ga!
Konfučije
Mojim roditeljima Mojoj Keki
GSTA1, GSTM1, GSTP1 and GSTT1 polymorphisms in RCC
ZAHVALNICA
The two most important days in your life are the day you are born and the day you find out why.
Mark Twain
Iskreno se zahvaljujem:
Profesorki dr Tatjani Simić, na ukazanom poverenju i pruženoj prilici da budem deo njenog
istraživačkog tima, na njenim stručnim savetima, kao i na nesebičnoj pomoći u kreiranju
ideje, izradi i pisanju ove doktorske disertacije. Zahvaljujem joj se i na pruženim prilikama
koje su doprinele mom profesionalnom razvoju
Profesorki dr Mariji Plješa Ercegovac, mom mentoru, koja me je strpljivo i pažljivo usmeravala u
svim fazama izrade ove disertacije. Zahvaljujem joj se na svesrdnoj podršci, bezrezervnom
poverenju, pruženoj motivaciji i potpunoj slobodi u radu na ovoj disertaciji
Profesoru dr Zoranu Džamiću, mom komentoru, za ličnu i stručnu podršku, kao i na korisnim
savetima koji su značajno doprineli realizaciji ove disertacije
Profesorki dr Tatjani Pekmezović, na ukazanom poverenju, izdvojenom vremenu i dragocenim
savetima prilikom izrade i završnog uobličavanja doktorske disertacije
Profesorki dr Manueli Schmidinger, na korisnim sugestijama i vremenu koje je posvetila ovoj
disertaciji
Profesorki dr Ani Savić-Radojević i Docentkinji dr Mariji Matić, na stručnoj pomoći i prijateljskoj
podršci, uloženom vremenu i dragocenim savetima koji su značajno doprineli kvalitetu ove
disertacije
Dragim koleginicama Asistentkinji dr Tatjani Đukić, Asistentkinji dr Sonji Šuvakov, Asistentkinji
dr Jovani Jakovljević Uzelac, laboratorijskom tehničaru Sanji Sekulić i biologu Jeleni Smiljić, za
nesebičnu pomoć u praktičnoj realizaciji ove disertacije i prijateljskoj podršci. Posebnu
zahvalnost dugujem dragoj koleginici magistru Tanji Radić, na bezrezervnoj pomoći i podršci
u zajedničkom istraživanju
Svima koji su mi pružili pomoć prilikom izrade ove doktorske disertacije: Profesoru dr Dejanu
Dragičeviću (Klinika za urologiju Kliničkog centara Srbije), Profesoru dr Dušanu Popadiću,
Profesoru dr Milošu Markoviću i njihovim saradnicima (Institut za imunologiju i mikrobiologiju
Medicinskog fakulteta Univerziteta u Beogradu), Profesorki dr Gordani Jovanović-Basta i

GSTA1, GSTM1, GSTP1 and GSTT1 polymorphisms in RCC
Docentkinji dr Sanji Radojević-Škodrić (Institut za medicinsku patologiju Medicinskog fakulteta
Univerziteta u Beogradu), magistru sci. med. dr Jasni Ristić (Gradski zavod za javno zdravlje,
Beograd), Profesorki dr Chiari Riganti i njenim saradnicama (Università degli Studi di Torino,
Turin, Italia), Asistentkinji dr Anđelki Isaković (Istitut za medicinsku i kliničku biohemiju
Medicinskog fakulteta Univerziteta u Beogradu), Mihajlu Bošnjaku, molekularnom biologu,
Nadi Bojović glavnom laborantu biohemije i hemije, kao i Sanji Čabarkapi, višem
medicinskom laborantu (Institut za medicinsku i kliničku biohemiju Medicinskog fakulteta
Univerziteta u Beogradu).
Nastavnicima, saradnicima i laborantima Instituta za medicinsku i kliničku biohemiju
Medicinskog fakulteta Univerziteta u Beogradu, na toleranciji i podršci
Svim učesnicima istraživanja, kao i članovima njihovih porodica, na saglasnosti da učestvuju
u studiji, kao i na njihovoj saradnji
Neizmernu zahvalnost dugujem:
Najboljim roditeljima koje jedno dete može imati, Milošu i Nadi, braći Stefanu i Goranu,
mojoj Keki i Nani, za svu ljubav, bezrezervnu podršku, razumevanje i ogromnu pomoć
tokom školovanja i izrade ove disertacije
Mom Milošu, na neizmernoj ljubavi i razumevanju, beskrajnoj podršci i pomoći pri realizaciji
ove disertacije
Dragim prijateljima Jeleni Čolić, Tamari Šljivančanin Jakovljević, Nini Ristić, Maji Ristić, Andriji
Sekuliću, Djordju Klisiću i Ozrenu Katiću, na savetima i rečima podrške
Vesna Ćorić

GSTA1, GSTM1, GSTP1 and GSTT1 polymorphisms in RCC
ABSTRACT
THE ASSOCIATION OF GLUTATHIONE TRANSFERASE A1, M1, P1 AND T1 GENE POLYMORPHISMS WITH THE RISK OF RENAL CELL CARCINOMA
DEVELOPMENT AND PROGRESSION
Vesna M. Ćorić
Background: Cytosolic glutathione S-transferases (GSTs) might affect both the development
and the progression of renal cell carcinoma (RCC) due to their dual functionality. The aim of
this study was to evaluate specific role of GST gene variants (GSTA1, GSTM1, GSTT1 and
GSTP1) as determinants of risk in patients with renal cell carcinoma, independently or
simultaneously with recognized RCC risk factors, as well as to discern whether phenotype
changes reflect genotype-associated risk. Furthermore, we evaluated the effect of GST gene
variants on postoperative prognosis in RCC patients. Special attention was paid to the most
frequent type of RCC, clear renal cell carcinoma (ccRCC).
Methods: GST genotypes were determined in 305 RCC patients and 326 matched-controls in
whom overall survival was evaluated as well. The levels of benzo(a)pyrene diolepoxide
(BPDE)-DNA adducts and 8-hydroxy-2′-deoxyguanosine (8-OHdG) were determined by
ELISA method. The expression of GSTM1 and GSTP1 protein level, as well as the level of
regulatory (ASK1, JNK1/2) and executor (Caspase-3) apoptotic molecules in ccRCC tissue
samples were analyzed by method of immuniblot. The presence of GSTM1:ASK1/
GSTP1:JNK1/2 protein:protein interactions was determined by means of
immunoprecipitation.
Results: Significant association between GST genotype and risk of overall RCC and ccRCC
development was found for GSTM1-null and GSTP1-variant genotypes, independently
(p<0.05). Furthermore, 22% of all recruited ccRCC patients were carriers of combined
GSTM1-null/GSTT1-active/GSTA1-low activity/GSTP1-variant genotype, exhibiting 9.32-fold
elevated ccRCC risk compared to the reference genotype combination (p=0.041). Significant
association between GST genotype and ccRCC risk in smokers was found only for the GSTP1
genotype, while GSTM1-null/GSTP1-variant/GSTA1 low-activity genotype combination was
present in 94% of smokers with ccRCC, increasing the risk of ccRCC up to 7.57 (p=0.026).
Furthermore, ccRCC smokers with GSTM1-null genotype had significantly higher
concentration of BPDE-DNA adducts in comparison with GSTM1-active cRCC smokers (p=

GSTA1, GSTM1, GSTP1 and GSTT1 polymorphisms in RCC
0.050). No association was found between GST gene variants and the level of 8-OHdG.
However, GSTM1-null genotype was the most frequent in grade II (G2) RCC and ccRCC
tumors. Survival analysis indicated shorter overall survival for the whole group of RCC and
ccRCC patients with GSTM1-active genotype (p<0.05). Furthermore, overall RCC and ccRCC
patients with GSTM1-active genotype had a significantly higher hazard ratio (p<0.05), analyzed
in all three regression models, compared to the carriers of GSTM1-null genotype. Finally, the
presence of GSTM1:ASK1, as well as GSTP1:JNK1/2 protein:protein interactions was found
in all ccRCC tissue samples studied.
Conclusions: Certain GST polymorphisms might be associated with the risk of RCC, with
special emphasis on GSTM1-null and GSTP1-variant genotypes. Combined GSTM1-
null/GSTT1-active/GSTA1 low activity/GSTP1-variant genotypes might be considered a “risk-
associated genotype combination” in ccRCC. On the other hand, GSTM1-null genotype is
associated with favorable postoperative prognosis in RCC. The possible molecular mechanism
underlying the role of GST proteins in RCC progression might be the presence of
GSTM1:ASK1 and GSTP1:JNK1 protein:protein interactions. Hence, determination of
GSTM1 genotype might serve as a valuable indicator in both RCC risk assessment and
postoperative prognosis.
Key words: GST, RCC, risk, prognosis, survival, BPDE, 8-OHdG, MAPK, protein
expression;
Scientific Field: Medicine
Scientific Dicipline: Medical and clinical biochemistry
UDC:

GSTA1, GSTM1, GSTP1 and GSTT1 polymorphisms in RCC
Graphical abstract
GS
TM
1
GS
TM
1
AS
K1
GS
TM
1
GS
TP
1
GS
TP
1G
ST
P1
GS
TM
1
GS
TM
1
GS
TP
1
GS
TP
1
Ap
op
tosi
s
Reg
ula
tio
n o
f cell
su
rviv
al
Deto
xif
icati
on
Xen
ob
ioti
c +
GS
H
GS
H-c
on
jug
ate
Xen
ob
ioti
c +
GS
H
GS
H-c
on
jug
ate
Th
e d
ual
fun
cti
on
ali
ty o
f G
ST
s
PP
AS
K1
AS
K1
JNK
1JN
K1
Do
wn
stre
am
pro
tein
s
(Cle
ave
d C
asp
ase
-3↑
)
Cell
str
ess
Cell
str
ess
/
GS
TM
1-n
ull
gen
oty
pe
Do
wn
stre
am
targ
et
pro
tein
s
GS
TM
1-n
ull
g
eno
typ
e
Su
rviv
al ↑
GS
TM
1-n
ull
gen
oty
pe
Ris
k o
f R
CC
deve
lop
men
t ↑
GS
TP
1-va
rian
t g
eno
typ
e
Ris
k o
f R
CC
deve
lop
men
t ↑

GSTA1, GSTM1, GSTP1 and GSTT1 polymorphisms in RCC
SAŽETAK
POVEZANOST POLIMORFIZMA GENA ZA GLUTATION TRANSFERAZE A1,
M1, P1 I T1 SA RIZIKOM ZA NASTANAK I PROGRESIJOM KARCINOMA
BUBREŽNOG PARENHIMA
Vesna M. Ćorić
Uvod: Zbog uloga koje poseduju, citosolne glutation S-transferaze (GST) mogu biti značajne
kako u nastanku, tako i u progresiji karcinoma bubrežnog parenhima (KBP). U ovoj studiji je
ispitivana uloga pojedinih GST genskih varijanti (GSTA1, GSTM1, GSTT1 i GSTP1) u
nastanku KBP, nezavisno ili udruženo sa poznatim faktorima rizika za nastanak ovog
karcinoma, kao i moguća povezanost fenotipskih karakteristika tumora sa odgovarajućim
genotipom. Pored toga, ispitivan je i potencijalni prognostički značaj polimorfne ekspresije
GST proteina kod bolesnika sa KBP. Posebna pažnja je posvećena najučestalijem podtipu
KBP, svetloćelijskom karcinomu bubrežnog parenhima (sKBP).
Materijal i Metode: Polimorfizam GSTa je određivan kod 305 pacijenata sa KBP i kod 326
kontrola, uparenih po godinama i polu. Pored fenotipskih karakteristika tumora, u grupi
pacijenata sa KPB je praćeno i preživljavanje. Nivoi benzo(a)piren diolepoksid (BPDE)-DNK-
konjugata, kao i nivoi 8-hidroksi-2-deoksiguanozina (8-OHdG) su određivani ELISA
metodom. Ekspresija GSTM1 i GSTP1 proteina, kao i ekspresija regulatornih (ASK1,
JNK1/2) i egzekutornih (Caspaza 3) apoptotskih molekula u uzorcima tumorskog tkiva je
analizirana metodom imunoblota. Prisustvo GSTM1:ASK1, odnosno GSTP1:JNK1/2
protein:proteinske interakcije je ispitivano metodom imunoprecipitacije.
Rezultati: Uočen je značajan efekat GSTM1-nultog i GSTP1-varijantnog genotipa na rizik za
nastanak KBP (p<0.05). Pored toga, 22% svih pacijenata sa sKBP su bili nosioci
kombinovanog GSTM1-nultog/GSTT1-aktivnog/GSTA1-genotipa smanjene aktivnosti/GSTP1-
varijantnog genotipa i bili su u 9.32 - puta većem riziku za nastanak sKBP u poređenju sa
nosiocima referentnog genotipa (GSTM1-aktivni/GSTT1-nulti/GSTA1-aktivni/GSTP1-referentni
genotip) (p=0.041). Uočen je efekat GSTP1-varijantnog genotipa na rizik za nastanak KBP kod
pušača, dok je kombinacija GSTM1-nulti/GSTP1-varijantni/GSTA1-genotip smanjene aktivnosti bila
prisutna u 94% pušača sa sKBP, povećavajući rizik od nastanka sKBP na 7.57 puta (p=0.026).

GSTA1, GSTM1, GSTP1 and GSTT1 polymorphisms in RCC
Takođe, pušači sa sKBP, nosioci GSTM1-nultog genotipa su imali značajno više nivoe BPDE-
DNK-konjugata u poređenju sa nosiocima GSTM1-aktivnog genotipa (p=0.050). Ipak, nije
nađena asocijacija između nosilaca različitih GST genskih varijanti po pitanju nivoa 8-OHdG.
Kada je ispitivana povezanost fenotipskih karakteristika tumora sa GST genotipom, uočeno je
da je GSTM1-nulti genotip bio najučestaliji kod pacijenata sa G2 gradusom tumora. Rezultati
ispitivanja prognostičke uloge GST u KBP su pokazali da je kumulativna verovatnoća
preživljavanja pacijenata sa KBP i sKBP, nosilaca GSTM1-aktivnog genotipa bila manja u
odnosu na ispitanike sa GSTM1-nultim genotipom (p<0.05). Štaviše, pacijenti sa KBP i sKBP,
nosioci GSTM1-aktivnog genotipa imali su statistički značajno veći rizik od smrtnog ishoda u
sva tri ispitivana modela u odnosu na nosioce GSTM1-nultog genotipa (p<0.05). Konačno,
prisustvo GSTM1:ASK1, kao i GSTP1:JNK1/2 protein:proteinske interakcije je potvrđeno u
svim analiziranim uzorcima tumorskog tkiva sKBP.
Zaključci: Određeni polimorfizmi GST mogu imati značajan efekat na rizik za nastanak KBP,
sa posebnim naglaskom na GSTM1-nulti i GSTP1-varijantni genotip. Kombinovani GSTM1-
nulti/GSTT1-aktivni/GSTA1 genotip smanjene aktivnosti/GSTP1-varijantni genotip može se
smatrati “rizičnim genotipom” za nastanak sKBP. Sa druge strane, GSTM1-nuti genotip je
udružen sa boljom postoperativnom prognozom pacijenata sa KBP, a u osnovi prognostičke
uloge GST u KBP bi bilo prisustvo GSTM1:ASK1 i GSTP1:JNK1 protein:proteinskih
intrakcija. Stoga, određivanje GSTM1 genotipa može predstavljati koristan pokazatelj u proceni
rizika za nastanak KBP i postoperativnu prognozu pacijenata sa ovim karcinomom.
Ključne reči: GST, KBP, rizik, prognoza, preživljavanje, BPDE, 8-OHdG, MAPK, ekspresija
proteina;
Naučna oblast: Medicina
Uža naučna oblast: Medicinska i klinička biohemija
UDK:

GSTA1, GSTM1, GSTP1 and GSTT1 polymorphisms in RCC
Grafički abstrakt
GS
TM
1
GS
TM
1
AS
K1
GS
TM
1
GS
TP
1
GS
TP
1G
ST
P1
GS
TM
1
GS
TM
1
GS
TP
1
GS
TP
1
Ap
op
toza
Reg
ula
cij
a ć
eli
jsk
og
cik
lusa
Deto
ksi
fik
acij
a
Kse
no
bio
tik
+G
SH
GS
H-k
on
jug
at
Kse
no
bio
tik
+G
SH
GS
H-k
on
jug
at
Dvo
stru
ka
ulo
ga
GS
T
PP
AS
K1
AS
K1
JNK
1JN
K1
Nis
ho
dn
icil
jni
pro
tein
i
(Ak
tivn
aC
asp
aza-3
↑)
Str
es
Str
es/
GS
TM
1-n
ult
i g
eno
tip
Nis
ho
dn
i cil
jni
pro
tein
i
GS
TM
1-n
ult
i g
eno
tip
Pre
živ
ljava
nje
↑
GS
TM
1-n
ult
i g
eno
tip
Riz
ikza
nast
an
ak
KB
P↑
GS
TP
1-va
rija
ntn
i g
eno
tip
Riz
ikza
nast
an
ak
KB
P ↑

GSTA1, GSTM1, GSTP1 and GSTT1 polymorphisms in RCC
Contents
INTRODUCTION ................................................................................................................................................. 1
1.1 Renal cancer ............................................................................................................................................ 1
1.1.1 Incidence ........................................................................................................................................ 1
1.1.2 Diagnostics ..................................................................................................................................... 2
1.1.3 Pathology assessment ................................................................................................................... 3
1.1.4 Treatment ....................................................................................................................................... 4
1.1.5 Mortality ......................................................................................................................................... 5
1.1.6 Etiology........................................................................................................................................... 6
1.2 GUTATHIONE S- TRANSFERASES (GSTs) ............................................................................. 12
1.2.1 Structure and substrate specificity ............................................................................................ 14
1.2.2 Functions of GSTs ..................................................................................................................... 17
1.2.3 Genetic variations in human GSTs .......................................................................................... 21
1.3 GENETIC POLYMORPHISM OF GLUTATHIONE TRANSFERASES IN PATIENTS
WITH RENAL CELL CARCINOMA ......................................................................................................... 29
2 THE OBJECTIVES ..................................................................................................................................... 32
3 MATERIALS AND METHODS .............................................................................................................. 33
3.1 Design .................................................................................................................................................... 33
3.2 Study population .................................................................................................................................. 33
3.3 Ethics ..................................................................................................................................................... 34
3.4 Materials ................................................................................................................................................. 34
3.4.1 Blood and plasma samples......................................................................................................... 34
3.4.2 Tissue samples ............................................................................................................................. 35
3.5 Methods ................................................................................................................................................. 35
3.5.1 DNA isolation ............................................................................................................................. 35
3.5.2 Genotyping .................................................................................................................................. 36
3.5.3 Determination of BPDE-DNA adducts and 8-OHdG levels by enzyme linked
immunosorbent assays (ELISA) method .................................................................................................. 39
3.5.4 Identification of GSTM1, GSTP1, ASK1, JNK1/2 and Cleaved Caspase-3 by the
method of immunoblot ................................................................................................................................ 40
3.5.5 Immunoprecipitation and identification of GSTM1-1:ASK1 and GSTP1-1:JNK
protein:protein interactions by the method of immunoblot .................................................................. 43
3.5.6 Statistical analysis ........................................................................................................................ 44

GSTA1, GSTM1, GSTP1 and GSTT1 polymorphisms in RCC
4 RESULTS ....................................................................................................................................................... 46
4.1 GST polymorphism in patients with renal cell carcinoma (RCC) ................................................ 46
4.1.1 The association of GST genotypes with RCC risk ................................................................ 47
4.1.2 The association between GST genotypes and the levels of 8-OHdG in RCC patients ... 50
4.1.3 The association between GST genotypes and grade and stages of RCC ........................... 52
4.1.4 The effect of GST genotypes on overall survival in RCC patients ..................................... 57
4.2 GST polymorphism in patients with clear cell renal cell carcinoma (ccRCC) ............................ 62
4.2.1 The association of GST genotypes with ccRCC risk ............................................................. 63
4.2.2 Modifying effect on risk of ccRCC conferred by recognized risk factors for ccRCC
development ................................................................................................................................................... 65
4.2.3 GST genotypes and ccRCC risk in smokers ........................................................................... 67
4.2.4 The association between GST genotypes and tumor grade and stages of ccRCC ........... 69
4.2.5 The effect of GST genotypes on overall survival in ccRCC patients ................................. 74
4.3 GSTM1 and GSTP1 protein expression in pools of non-tumor kidney tissue samples and
ccRCC tissue samples ........................................................................................................................................ 79
4.4 Expression of regulatory apoptotic moleculs (ASK1 and JNK1/2) in pools of non-tumor
kidney tissue samples and ccRCC tissue samples ......................................................................................... 80
4.5 Expression of executor apoptotic molecul (Cleaved Caspase-3) in pools of non-tumor kidney
tissue samples and ccRCC tissue samples ...................................................................................................... 82
4.6 Correlation between GSTM1/GSTP1 and regulatory (ASK1) and executor (Cleaved
Caspase-3) apoptotic molecules ....................................................................................................................... 83
4.7 The analysis of GSTM1:ASK1 and GSTP1:JNK1/2 protein:protein interactions in ccRCC
tissue samples ..................................................................................................................................................... 84
5 DISCUSSION ............................................................................................................................................... 86
6 CONCLUSIONS .......................................................................................................................................... 98
7 REFERENCES .......................................................................................................................................... 102
LIST OF ABREVIATIONS ............................................................................................................................. 116
BIOGRAPHY...................................................................................................................................................... 118

GSTA1, GSTM1, GSTP1 and GSTT1 polymorphisms in RCC
1
INTRODUCTION
1.1 Renal cancer
Nowadays, renal masses are being increasingly detected as unexpected findings on
diagnostic abdominal imaging, usually performed for non-kidney related clinical conditions,
and may comprise a simple renal cyst that require no treatment or even follow-up (Ellimoottil
et al., 2014). However, the majority of cases comprise benign renal lesions (angiolipomas or
oncocytomas) or malignant renal lesions, that are usually subjected to further procedures and
interventions (Shah et al., 2010).
1.1.1 Incidence
Representing 2-3% of all malignancies, kidney cancer and renal pelvis cancer are
among top ten most common cancers in the world (Ferlay et al., 2015). Renal cell carcinoma
(RCC) is the predominant form of kidney malignancy, comprising various morphological
variants of RCC types with specific chromosomal alterations and molecular pathway
abnormalities (B. Escudier et al., 2014; Ljungberg et al., 2015). On the other hand, urothelial
carcinoma, arising in the renal pelvis, accounts for less than 10% of histologically confirmed
kidney carcinomas.
Figure 1. Estimated age-standardized rates of kidney incidence cases in the World, for both sexes, cancer, worldwide; Adopted from Ferlay et al., 2015, available at http://globocan.iarc.fr/

GSTA1, GSTM1, GSTP1 and GSTT1 polymorphisms in RCC
2
The incidence of RCC varies between nations. Over the course of the last few decades,
the incidence has increased in many parts of the world, probably due to the improved tumor
detection with diagnostic abdominal imaging (Mathew et al., 2002), being the highest in
Europe, North America and Australia (Petejova and Martinek, 2016). The global incidence rate
reported in 2012 was 6.0/100.000 for men and 3.0/100.000 for women (Figure 1) (Ferlay et al.,
2015). Similarly, the incidence in Serbia in 2013 was reported as 6.1 (men) and 3.0 (women) per
100.000 people (Cancer Incidence and Mortality in Central Serbia 2013, 2015). Approximately, there
is a 1.5:1 predominance in men over women, with peak incidence of RCC occurring between
60 and 70 years of age (Ljungberg et al., 2015).
1.1.2 Diagnostics
Most RCCs are asymptomatic in eraly stages. It seems that the use of high-resolution
cross-sectional imaging modalities over the last few decades has led to the increase in
incidental detection of renal masses, often characterized as small and low-graded (Gill et al.,
2010). Nowadays, between 48-66% of such RCCs are detected incidentally (Krabbe et al.,
2014). Still, many renal masses remain asymptomatic until the late stages of the disease. The
classic triad of flank pain, gross haematuria and palpable abdominal mass is now rare (6-10%)
and correlates with advanced disease and subtypes associated with poor prognosis (Patard et
al., 2005). Paraneoplastic syndromes (hypertension, anemia, weight loss as most common) are
found in approximately 30% of patients with symptomatic RCC (Sacco et al., 2009). Symptoms
caused by metastatic RCC, such as bone pain, deterioration of performance status, or
persistent cough are now observed in few patients (Kim et al., 2003).
Most renal masses can be detected accurately using imaging alone. The most traditional
approach for both detecting and characterizing renal masses are ultrasonography, computed
tomography and magnetic resonance imaging, which alone can classify renal masses as cystic or
solid (Ljungberg et al., 2015). Renal biopsies are increasingly being used for the following
purposes: (1) for histological diagnosis of radiologically indeterminate renal masses to avoid
surgery in the event of benign lesions; (2) to select patients with small renal masses for
surveillance approaches; (3) to obtain histology before ablative treatments; and (4) to select the
most suitable medical and surgical treatment strategy in the setting of metastatic RCC, as

GSTA1, GSTM1, GSTP1 and GSTT1 polymorphisms in RCC
3
explained in details by several papers on RCC management (Abel et al., 2010; Leveridge et al.,
2011; Schmidbauer et al., 2008).
1.1.3 Pathology assessment
Adult kidney cancers that originate from renal parenchyma, in particular form the
nephrons, are mainly adenocarcinomas, also known as renal cell carcinoma (RCC), whereas
those that arise from the collecting system are mainly transitional cell carcinomas (TCC).
2004 WHO classification, that was modified by the International Society of Urological
Pathology (ISUP) Vancouver Classification in 2012, recognizes three major histological
subtypes of RCC: (1) clear cell RCC (ccRCC), which arises from the proximal convolute tubule
and is the most frequent subtype of sporadic RCC in adults (70-85%), followed by (2) papillary
(pRCC), comprising type I and II (10-15%, of which 60–70% are type I) and (3) chromophobe
RCC (chRCC, 4-5%) (Srigley et al., 2013).
Less common cancers include papillary adenoma, multilocular cystic clear-cell
carcinoma, hybrid oncocytic chromophobe tumor, carcinoma of the collecting ducts of Bellini,
renal medullary carcinoma, carcinoma associated with neuroblastoma and mucinous tubular
and spindle-cell carcinoma. The ISUP Vancouver Consensus Statement added five new
epithelial tumor subtypes of renal cell carcinoma: tubulocystic, acquired cystic disease
associated clear-cell, tubulopapillary, microphthalmia family translocation, and hereditary
leiomyomatosis– renal cell carcinoma syndrome-associated (Srigley et al., 2013).
The particular information on the RCC subtype is of the utmost importance. Various
subtypes exhibit different biological behavior, prognosis and treatment option, with ccRCC
still being the most aggressive, with the highest rate of invasion, metastasis and mortality
(Protzel et al., 2012). On the other hand, if sarcomatoid or rhabdoid differentiation occurs in
any subtype, it is usually associated with highly aggressive behavior and poor prognosis (Eble
et al., 2006).
Besides RCC subtype and the presence of sarcomatoid features, histological diagnosis
includes the evaluation of nuclear grade, vascular invasion, tumor necrosis and invasion of the
collecting system and peri-renal fat. Until recently, Fuhrman nuclear grade has been the most
widely accepted grading system (Fuhrman et al., 1982). However, at the 2012 ISUP conference,
a simplified, nuclear grading system, based only on the size and the shape of nucleoli, was

GSTA1, GSTM1, GSTP1 and GSTT1 polymorphisms in RCC
4
proposed and will replace the Fuhrman grading system (Srigley et al., 2013). Moreover, new
Union for International Cancer Control tumor–node–metastasis staging system should be used
(Table 1.) (Edge and American Joint Committee on Cancer, 2010).
1.1.4 Treatment
Surgical resection appears to remain as the standard of care, in case of both radical and
partial nephrectomy. Meanwhile, cryoablation and radiofrequency ablation, where tumor is
destroyed by low or high temperatures, has gained vast attention. Concerning the management
of small, incidentally detected renal masses, another emerging approach is “watchfull waiting”.
However, given their unproven long-term efficacy, the renal ablation and “watchfull waiting”
have not established themselves as standards of care, but are, for the timebeing, reserved for
elderly and/or patients with comorbidities and small renal masses with limited life expectancy
(Ljungberg et al., 2015).
Table 1. Staging of RCC Union for International Cancer Control (UICC) tumor–node–metastasis (TNM) classification of malignant tumors; Adopted from Edge and American Joinr Committee on Cancer, 2010
T Primary tumor
Tx Primary tumor cannot be assessed
T0 No evidence of primary tumor
T1 Tumor ≤7 cm in greatest dimension, limited to the kidney
T1a Tumor ≤4.0 cm
T1b Tumor >4.0 cm but ≤7.0 cm
T2 Tumor >7.0 cm in greatest dimension, limited to the kidney
T2a Tumor >7 cm but ≤10 cm
T2b Tumor >10 cm, limited to the kidney
T3 Tumor extends to major veins or perinephric tissues but not into the ipsilateral adrenal gland and not beyond Gerota’s fascia
T3a Tumor grossly extends into the renal vein or its segmental (muscle-containing) branches, or tumor invades peri-renal and/or renal sinus fat (peri-pelvic) but not beyond Gerota’s fascia
T3b Tumor grossly extends into the vena cava below the diaphragm
T3c Tumor grossly extends into the vena cava above the diaphragm or invades the wall of the vena cava
T4 Tumor invades beyond Gerota’s fascia (including contiguous extension into the ipsilateral adrenal gland)

GSTA1, GSTM1, GSTP1 and GSTT1 polymorphisms in RCC
5
Table 1, continued. Staging of RCC, Union for International Cancer Control (UICC) tumor–node–metastasis (TNM) classification of malignant tumors; from Edge and American Joinr Committee on Cancer, 2010
N Regional lymph nodes
Nx Regional lymph nodes cannot be assessed
N0 No regional lymph node metastasis
N1 Metastasis in regional lymph node(s)
M Distant metastases
cM0 Clinically no distant metastasis
cM1 Clinically distant metastasis
pM1 Pathologically proven distant metastasis, e.g. needle biopsy
Stage grouping
Stage I T1 No M0
Stage II T2 No M0
T3 Any M0
Stage III T1-T3 N1 M0
T4 Any M0
Stage IV Any Any M1
1.1.5 Mortality
Although most of the incidentally detected renal lesions have been characterized as
small and low-grad tumors, about 20-30% of all patients are diagnosed with metastatic disease
(mRCC) due to the early hematologic dissemination (Siegel et al., 2014). Moreover, about 20%
of all patients undergoing nephrectomy will develop mRCC during follow-up (Ljungberg et al.,
2011; Petejova and Martinek, 2016). The most frequent sites of metastatic disease are lungs,
bone and brain. However, adrenal glands, contralateral kidney and liver might be involved as
well (Bianchi et al., 2012).
According to the US National Cancer Institute data, the 5-yr overall survival for all
RCC subtypes has increased since 1970’s and reached 73%, probably due to the increase in the
number of incidentally detected RCC cases and the introduction of targeted therapies
(Wahlgren et al., 2013). Still, patients with metastatic disease have a median survival of around
13 months. The 5-year survival rate in such patients is below 10%, probably due to the
chemotherapy and radiotherapy resistance, as well as low efficacy and toxicity of
GSTA1, GSTM1, GSTP1 and GSTT1 polymorphisms in RCC
6
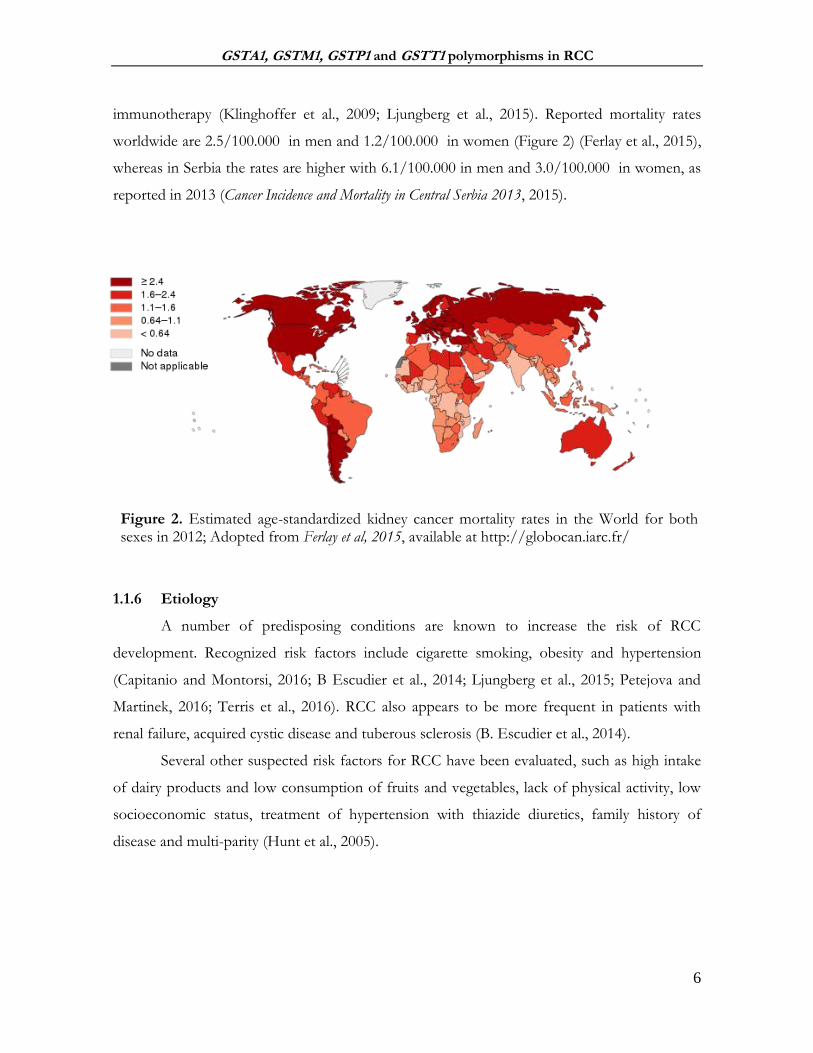
immunotherapy (Klinghoffer et al., 2009; Ljungberg et al., 2015). Reported mortality rates
worldwide are 2.5/100.000 in men and 1.2/100.000 in women (Figure 2) (Ferlay et al., 2015),
whereas in Serbia the rates are higher with 6.1/100.000 in men and 3.0/100.000 in women, as
reported in 2013 (Cancer Incidence and Mortality in Central Serbia 2013, 2015).
1.1.6 Etiology
A number of predisposing conditions are known to increase the risk of RCC
development. Recognized risk factors include cigarette smoking, obesity and hypertension
(Capitanio and Montorsi, 2016; B Escudier et al., 2014; Ljungberg et al., 2015; Petejova and
Martinek, 2016; Terris et al., 2016). RCC also appears to be more frequent in patients with
renal failure, acquired cystic disease and tuberous sclerosis (B. Escudier et al., 2014).
Several other suspected risk factors for RCC have been evaluated, such as high intake
of dairy products and low consumption of fruits and vegetables, lack of physical activity, low
socioeconomic status, treatment of hypertension with thiazide diuretics, family history of
disease and multi-parity (Hunt et al., 2005).
Figure 2. Estimated age-standardized kidney cancer mortality rates in the World for both sexes in 2012; Adopted from Ferlay et al, 2015, available at http://globocan.iarc.fr/
GSTA1, GSTM1, GSTP1 and GSTT1 polymorphisms in RCC
7
1.1.6.1 Cigarette smoking
The most well recognized risk factor for the development of RCC is cigarette smoking.
In 2004, both the International Agency for Research on Cancer (IRAC) and the U.S. Surgeon
General concluded that there are sufficient data to support causality between smoking and the
development of RCC, due to the known carcinogenic effects of numerous tobacco
components (IARC Working Group on the Evaluation of Carcinogenic Risks to Humans,
2004; Office of the Surgeon General (US) and Office on Smoking and Health (US), 2004).
The association between RCC and cigarette smoking is well established, although
reported risk for ever-smokers compared with never-smokers is moderate. Namely, a
comprehensive meta-analysis of 19 case-control and 5 cohort studies has demonstrated that
the cigarette smoking exerts a modest, but significant increase in risk for developing RCC
(RR=1.38 (95%CI: 1.27-1.50)) for both sexes (Hunt et al., 2005). Additionally, two studies
reported that the risk for RCC increased in a dose-dependent manner and was, to a certain
degree, reversible with prolonged smoking cessation (>10 years) (Hunt et al., 2005; Parker et
al., 2003). These findings corresponded with results of later study of Theis et al. who have yet
again reported the associations between cigarette smoking and RCC, as well as the protective
effects for smoking cessation (Theis et al., 2008). Moreover, it seems that there is even
evidence to support the fact that never-smokers, exposed to environmental tobacco smoke at
home or work, are also at increased risk of RCC (Hu et al., 2005; Theis et al., 2008).
A large body of epidemiological literature evaluated the risk factors for RCCs
development, however, without respect to RCC subtype. The results of recent prospective
study suggested that smoking, the greatest modifiable risk factor for RCC, increases the risk of
certain common RCC subtypes (ccRCC and pRCC) but not the others (chRCC) (Patel et al.,
2015). What is more, RCC patients who are current smokers or have a history of tobacco
exposure seem to exhibit more aggressive forms of RCC and with worst cancer-
specific/overall survival (Terris et al., 2016).
Mechanisms by which tobacco might contribute to RCC develompent are unclear and
likely multifactorial. Cigarette smoke is a rich source of free radicals, which are believed to be
responsible for initiation of many tumors by inducing DNA damage that accumulates in the
cells. In addition to free radicals, more than 60 carcinogens have been found in cigarette
smoke. Among these, sufficient evidence of carcinogenicity was found for polycyclic aromatic

GSTA1, GSTM1, GSTP1 and GSTT1 polymorphisms in RCC
8
hydrocarbons (PAHs) such as benzo(a)pyrene and aromatic amines (such as 4-amino biphenyl)
(International Agency for Research on Cancer and International Agency for Research on
Cancer, 1993). Particular interest has been given to the most abundant, benzo(a)pyrene (B(a)P)
and its carcinogenic metabolites, stereoisomers of 7,8-dihydroxy-9,10-oxy-7,8,9,10-
tetrahydrobenzo(a)pyrene (BPDE) (Alexandrov et al., 2002). The (+)-antiisomer [(+)-anti-
BPDE] seems to be the most potent carcinogen of all PAH diol epoxides (Slaga et al., 1979).
Namely, BPDE is known as ‘the bullet of the smoking gun’, leaving its fingerprints in the
blood of smokers, in the form of adducts with either serum albumin or DNA (Alexandrov et
al., 2002; Ketterer, 1996). PAH BPDE-DNA adduct are shown to induce mutation(s),
predominantly in the form of G to T transversions (Figure 3). For instance, the levels and the
distribution of BPDE-DNA adducts in lung tumor tissue, obtained from smokers, are found
to closely correlate with the gene sites containing the highest rate of p53 mutations, which was
not the case for the population of non-smokers (Hollstein et al., 1991)
Figure 3. Oxidation of benzo(a)pyrene and covalent binding to DNA. Adapted from
Lieberman et al., 2013;

GSTA1, GSTM1, GSTP1 and GSTT1 polymorphisms in RCC
9
Another major component of tobacco, nicotine, might also contribute to RCC
tumorigenesis by stimulating pathological angiogenesis. Nicotine is known to increase
endothelial cell number, capillary network formation and angiogenic response in neoplasia,
mediated in part by the vascular endothelial growth factor protein, commonly up-regulated in
ccRCC (Heeschen et al., 2001). However, in pRCC angiogenesis appears not to have a major
role in tumorigenesis and, therefore, is not likely to be linked with smoking (Ooi et al., 2011).
1.1.6.2 Obesity
Excess bodyweight, whether in people who are overweight (defined as a body-mass
index, BMI of 25 to 29·9 kg/m²) or obese (BMI of 30 kg/m² or greater), is increasingly being
recognized as an important risk factor for some common cancers (Renehan et al., 2008). In
case of RCC, excess body weight has been recognized as a risk factor in several case control
and cohort studies (Beebe-Dimmer et al., 2012; Bergström et al., 2001; Chow et al., 2000; Leiba
et al., 2013; Pischon et al., 2006), following a dose dependent response pattern (Adams et al.,
2008; Pischon et al., 2006). Namely, it has been suggested that overweight and obese patients
had an increased risk of RCC, by 24% for men and 34% for women, for every 5 kg/m2
increase in BMI (Renehan et al., 2008). Moreover, a quantitative summary analysis of 14
studies reported a relative risk for both sexes of 1.07 (95% CI: 1.05-1.09) per unit of increase in
BMI (corresponding to 3 kg body weight increase for a subject of average height) (Bergström
et al., 2001). In a large cohort of Norwegian man and woman, Bjørge et al have established
remarkably similar results with calculated relative risk of 1.05 per unit increase in BMI (Bjørge
et al., 2004). Several studies indicated that excess bodyweight in late adolescence is associated
with an increased risk of RCC (Beebe-Dimmer et al., 2012; Leiba et al., 2013). Nevertheless, it
seems that obesity is a favorable factor in terms of prognosis of RCC, despite its contribution
to increased RCC risk (Haferkamp et al., 2008; Kamat et al., 2004).
Several mechanisms, explaining the increased risk of RCC development in obese
patients have been proposed, however, direct evidence in humans is limited. These include
chronic renal tissue hypoxia, insulin resistance and a compensatory hyperinsulinemia, altered
endocrine milieu and production of adipokines, obesity-induced inflammatory response, as
well as lipid peroxidation and oxidative stress, as shown in Figure 4 (Klinghoffer et al., 2009).

GSTA1, GSTM1, GSTP1 and GSTT1 polymorphisms in RCC
10
1.1.6.3 Hypertension
The effect of hypertension, or its treatment, on the risk of RCC has been evaluated in a
number of studies, which provided several lines of evidence supporting the fact that history of
long-term hypertension is associated with the increased risk of RCC (Brennan et al., 2008;
Chow et al., 2000; Corrao et al., 2007; Vatten et al., 2007; Weikert et al., 2008). Namely, one of
the largest European prospective studies demonstrated two- to three-fold increased risk for
RCC development in patients with both elevated systolic and diastolic blood pressure, that was
independent of gender, BMI, smoking and the use of antihypertensive therapy (Weikert et al.,
2008). Multiple studies, comprising patients from both Europe and the USA, reported the
same results, emphasizing the dose-response association of increasing RCC risk with rising
blood pressure (Chow et al., 2000; Vatten et al., 2007; Weikert et al., 2008).
Furthermore, data from two cohort studies highlighted the hypothesis that underlying
disorder of hypertension, rather than its treatment, increases the risk of RCC, while effective
Figure 4. Potential obesity-related mechanisms responsible for RCC development; Adopted from Klinghoffer et al, 2009. Abbreviations: IGF-1- insulin growth factor; IL-6- interleukin 6; CRP- c reactive protein; RCC- renal cell carcinoma.

GSTA1, GSTM1, GSTP1 and GSTT1 polymorphisms in RCC
11
blood pressure control may modify the risk (Chow et al., 2000; Weikert et al., 2008).
Uncontrolled hypertension can lead to a number of diseases, many of which are
recognized as predisposing conditions for the RCC development, such as end-stage renal
disease. Although several theories have been proposed to explain the association between
hypertension and RCC, neither experimental studies, nor epidemiologic investigations have
elucidated the biological mechanism underlying the observed association. It is presumed that
renal carcinogenesis in part may be promoted by the increased formation of reactive oxygen
species, as well as dysregulated lipid peroxidation in the proximal renal tubules of both
hypertensive and obese individuals (Gago-Dominguez et al., 2002). Moreover, there is
evidence suggesting that the mechanism behind hypertension and other recognized risk factors
of kidney cancer, such as smoking and obesity, may include tissue hypoxia (Sharifi and Farrar,
2006). Many other mechanism have been proposed, such as abnormality in the apoptotic
process, mitogenic effect of angiotensin II, catecholamines and vasopressin, potential
carcinogenetic mechanisms of diuretics, etc. (Corrao et al., 2007). However, more detailed
experimental approaches are necessary to elucidate the potential mechanism behind
hypertension associated RCC risk.
1.1.6.4 Genetic factors
A number of familial syndromes with well-identified causative genetic mutations (such
as Von Hipper-Lindau disease, etc), strongly predispose affected individuals to the development
of RCC. Still, these hereditary syndromes comprise only a small portion of RCC cases, with
majority of cases developing sporadically (Pfaffenroth and Linehan, 2008).
Although recognized risk factors for RCC development (smoking, obesity and
hypertension) are rather common in general population, only a small group of exposed people
will eventually develop RCC. This suggests that the development of RCC can be partially
explained by genetic variations among the populations (Yang et al., 2013). Namely, it is well
established that health maintenance, as well as disease development is highly influenced by
gene-environment interaction (Figure 5). In particular, the exposure to the same environmental
factors does not warrant the same effect on different individuals, due to the presence of a
number of genetic variations, significantly contributing to inter-individual differences in
susceptibility to disease development (Hollman et al., 2016; Yadav et al., 2014).

GSTA1, GSTM1, GSTP1 and GSTT1 polymorphisms in RCC
12
1.2 GUTATHIONE S- TRANSFERASES (GSTs)
A growing number of genes encoding enzymes involved in biotransformation and
cellular defense (such as cytochrome P450, UDP-glucuronosyltransferase, sulfotransferase,
etc.) has been identified, leading to increased knowledge of the allelic variants in genes that
may result in a differential susceptibility to environmental and oxidative stress (Board and
Menon, 2013; Hollman et al., 2016). In humans, cellular detoxification system is divided into
three phases: Phase I (comprising reactions of oxidation, reduction and hydrolysis), Phase II
(conjugation) and Phase III (exeretrion). Glutathione transferases (EC 2.5.1.18), also referred
to as glutathione S-transferases or GSTs, are multifunctional enzymes involved in number of
catalytic and non-catalytic processes, however, traditionally recognized as principal Phase II
enzymes. Namely, GSTs are known for their ability to catalyze the nucleophilic addition of the
glutathione (GSH) to a wide variety of nonpolar compounds of exogenous and endogenous
origin, with electrophilic functional groups, rendering the products more water-soluble and
Figure 5. Genetic variants and environmental factors determine the risk of a disease; Adopted from Di Pietro et al, 2010.
GSTA1, GSTM1, GSTP1 and GSTT1 polymorphisms in RCC
13
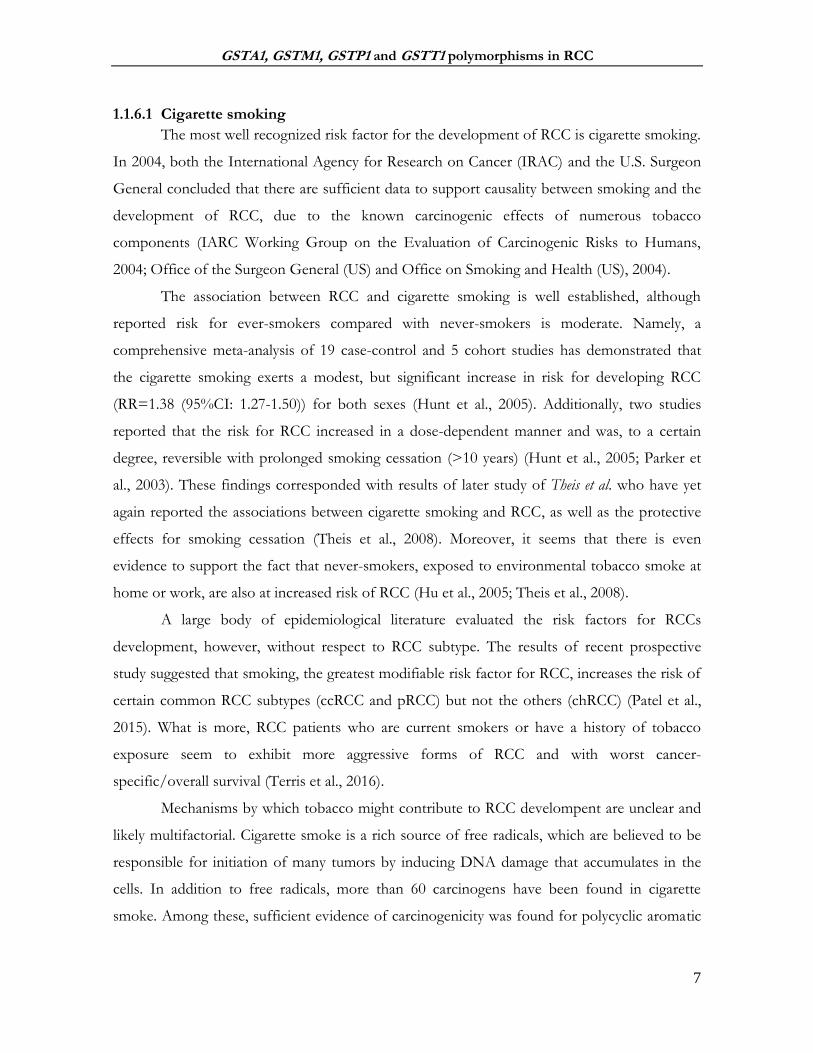
facilitating their elimination from the cell by Phase III enzymes (Figure 6) (Di Pietro et al.,
2010; Hayes et al., 2005; Tew and Townsend, 2012; Wu and Dong, 2012).
There are three major families of GST proteins: (1) cytosolic GSTs - constituting the
largest family, (2) mitochondrial and (3) microsomal, also known as Membrane Associated
Protein in Eicosanoid and Glutathione metabolism, (MAPEG) (Hayes et al., 2005). Cytosolic
GST enzymes are further categorized in 7 classes, designated by the names of the Greek letters
and abbreviated in Roman capitals: alpha, A (five members), mu, M (five members), pi, P (one
member), theta, T (two members), zeta, Z (one member), omega, O (two members), and
sigma, S (one member) subfamilies (Figure 7), based on their amino acid sequence identity
(Mannervik et al., 2005). Namely, members of the same class possess more than 40% amino
acid sequence identity (sometimes more than 90%) and less than 25% sequence identity
between classes (Hayes et al., 2005).
Figure 6. Conjugation of xenobiotic to GSH-conjugates, catalyzed by GSTs; Adopted from Di Pietro et al., 2010

GSTA1, GSTM1, GSTP1 and GSTT1 polymorphisms in RCC
14
1.2.1 Structure and substrate specificity
Soluble GSTs function as approximately 50 kDA dimers, constituted as homodimers
or heterodimers being formed from subunits within a given GST isoenzyme class (Hayes and
Pulford, 1995) Although it is still unclear whether the dimeric structure is relevant for all
biologicals function of the GSTs, evidence suggests that the dimeric structure increases the
stability and provides a proper structure of the active site, at least for the efficient catalysis
(Abdalla et al., 2002; Armstrong, 2010). On the other hand, there are in vivo evidence of
monomer-dimer equilibrium of GSTs that are involved in protein:protein interactions, having
the capacity to dissociate into monomers in order to form heterodimers with other monomeric
proteins, such as mitogen activated protein kinases (Adler et al., 1999; Cho et al., 2001).
A single GST unit consists of an N-terminal α/β-domain (or G-domain) and an all-α-
helical domain (or H-domain) (Wu and Dong, 2012). The G-domain is conserved throughout all
classes as it represents the binding site for tripeptide cofactor - glutathione (GSH, γ-glutamyl-
cysteinyl-glycine). Cytosolic GSTs seem to be subdivided on the basis of different mode of
GSH activation (Atkinson and Babbitt, 2009). Namely, the sulfur atom of GSH is located at
the N-terminal end and is invariably hydrogen bonded to a catalytic residue in the protein. This
hydrogen bond interaction plays a crucial role in GST catalysis by stabilizing the activated
Figure 7. Classification of human glutathione transferases (GSTs) based on amino acid sequence identity. Adopted from Wu and Dong, 2012.

GSTA1, GSTM1, GSTP1 and GSTT1 polymorphisms in RCC
15
GSH (thiolate anion, GS–). Moreover, different subgroups of GST contain various catalytic
residues interacting and subsequently activating the GSH: (1) tyrosine in the alpha-, mu-, pi-, and
sigma class of GSTs, (2) serine in the theta- and zeta-class of GSTs, and (3) cysteine in the
omega-class of GSTs (Armstrong, 2010).
The H-domain is not conserved by nature and varies greatly in shape, size and chemical
character (hydrophobicity) across classes, enabling numerous electrophilic compounds to bind
to it in a non-specific binding mode (Oakley, 2011). For instance, GSTA1-1 is known for its
‘promiscuous substrate selectivity’, being able to catalyze various, structurally unrelated
compounds such as steroids, benzo(a)pyrene diol epoxides, as well as products of lipid
degradation (Wu and Dong, 2012). Contrary to alpha GSTs, mu-class members have larger
active site and are able to bind many bulkier electrophilic agents such as aflatoxin B1-epoxides
and benzpyrene diols (Wu and Dong, 2012). Among their substrates, GSTs conjugate even the
signaling molecules such as 15-deoxy-Δ12,14-prostaglandin J2 and 4-hydroxynonenal and
therefore might modulate a number of signaling pathways (Hayes et al., 2005). The list of some
of the recognized GST substrates is presented in Table 2, available in numerous studies on
xenobiotics substrate specificity of GSTs (Armstrong, 2010; Hayes et al., 2005). It is
noteworthy to mention that humans express a large number of different GSTs with
overlapping substrate specificities, resulting in difficulty to identify isoenzymes solely on their
catalytic properties (Habig et al., 1974; Hayes et al., 2005).
For example, polyaromatic hydrocarbons (PAH) represent an important class of
environmental pollutants and are shown to be substrates for multiple classes of GST (Table
2.). As indicated in Table 2, the diol epoxides of PAHs are catalyzed predominantly by GSTs,
with the Mu class showing the highest activity towards most PAH epoxides, especially (+)-anti-
BPDE (Hayes and Strange, 2000; Sundberg et al., 2002, 1998), followed by GSTP1-1 and
GSTA1-1 (Figure 8) (Sundberg et al., 2002).

GSTA1, GSTM1, GSTP1 and GSTT1 polymorphisms in RCC
16
Table 2. Recognized substrates of cytosolic GST; Adopted from Armstrong, 2010; Hayes et al., 2005
Abbreviations: 5-ADD, 5-androstene-3,17-dione; BCDE, benzo[g]chrysene diol epoxide; BCNU, 1,3-bis(2-chloroethyl)-1-nitrosourea; BPDE, benzo(a)pyrene diol epoxide; BPhDE, benzo[c]phenanthrene diol epoxide; CDE, chrysene-1,2-diol 3,4-epoxide; COMC-6, crotonyloxymethyl-2-cyclohexenone; DBADE, dibenz[a,h]anthracene diol epoxide; DBPDE, dibenzo[a,l]pyrene diol epoxide; EA, ethacrynic acid; EPNP, 1,2-epoxy-3-(p-nitrophenoxy)propane; N-a-PhIP, N-acetoxy-2-amino-1-methyl-6-phenylimidazo[4,5-b]pyridine.
GST enzyme GST preferred substrate
GSTA1 ‘5-ADD, BCDE, BPDE, Busulfan, Chlorambucil, DBADE, DBPDE, BPhDE, N-a-PhIP
GSTM1 trans-4-phenyl-3-buten-2-one, BPDE, CDE, DBADE, trans-stilbene oxide, styrene-7,8-oxide
GSTT1 BCNU, butadiene epoxide, CH2Cl2, EPNP, ethylene oxide
GSTP1 acrolein, base propenals, BPDE, CDE, Chlorambucil, COMC-6, EA, Thiotepa
Figure 8. The metabolism of B(a)P; Adopted from Lodovicici et al., 2004; Abbreviations: B(a)P: benzo(a)pyrene; mEH: microsomal epoxide hydrolase

GSTA1, GSTM1, GSTP1 and GSTT1 polymorphisms in RCC
17
1.2.2 Functions of GSTs
GSTs comprise a set of cellular proteins (GSTome) with various catalytic and non-
catalytic functions (Grek et al., 2013; Wu and Dong, 2012).
1.2.2.1 Metabolism of xenobiotics by GSTs
Namely, GST have been described as one of the most important enzymes involved in
cell detoxification processes as they are crucial for their role in metabolizing both exogenous
(chemical carcinogens, environmental pollutants and even antitumor agents) and endogenous
electrophilic compounds (Hayes et al., 2005). Strong electrophiles arise from both xenobiotic
and endobiotic compounds, being a result of mixed-function oxidation activity of cytochrome
P-450 in Phase I reactions (Dourado et al., 2008).
The primary metabolic role of GST is to detoxify such reactive electrophiles, by
catalyzing reaction of conjugation with GSH (Figure 7). The reaction catalyzed by GST
consists of the nucleophilic addition of the sulfur thiolate of GSH to a wide range of
compounds, containing electrophilic atoms of carbon, sulfur, nitrogen and phosphorous
(Dourado et al., 2008). Namely, upon GSH activation, the nucleophilic sulfur atom attacks the
electrophilic toxic compound present in the H-site, usually producing a less toxic compound, a
glutathione S-conjugate (GSH conjugate). The formation, processing and transport of GSH
conjugates takes place in a number of organs (liver, biliary tract, gastrointestinal tract, and
kidney) and involves considerable inter- and intra-organ cooperativity (Commandeur et al.,
1995; Hinchman and Ballatori, 1994). Namely, upon formation, GSH conjugates are
recognized and exported from the cell by ATP-dependent transmembrane pumps, such as P-
glycoproteins and multidrug resistance-related proteins (MRP1, MRP2) (Haimeur et al., 2004;
Paumi et al., 2001) and consequently subjected to metabolism of mercapturic acid via
formation of the S-cysteine conjugates (Figure 9). The kidney is shown to play a very
important role in the metabolism of both GSH conjugates and S-cysteine conjugates to their
corresponding mercapturic acids (Commandeur et al., 1995), followed by the excretion in the
urine (Egner et al., 2008) or bile (Teichert et al., 2009) in Phase III. Of note, GST effectiveness
depends on the combined actions of glutamate cysteine ligase and GSH synthase to supply
GSH and, on the other hand, the actions of transporters to remove GSH conjugates from the
cell (Di Pietro et al., 2010).
GSTA1, GSTM1, GSTP1 and GSTT1 polymorphisms in RCC
18
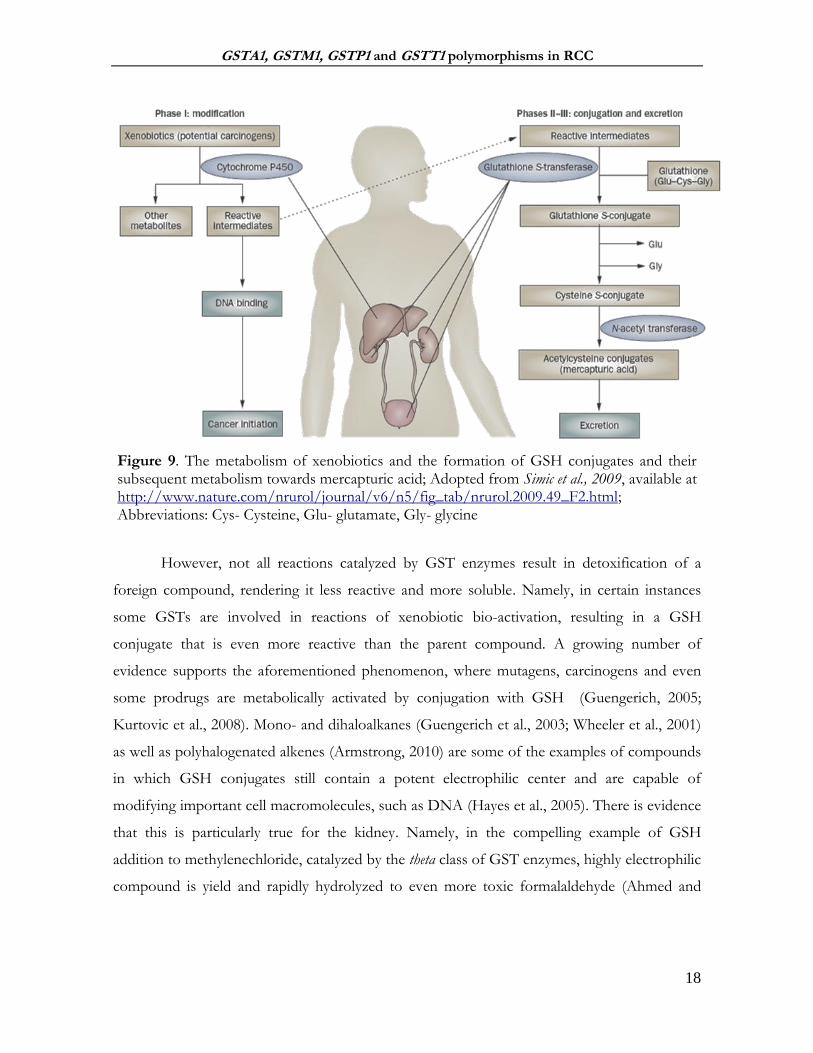
However, not all reactions catalyzed by GST enzymes result in detoxification of a
foreign compound, rendering it less reactive and more soluble. Namely, in certain instances
some GSTs are involved in reactions of xenobiotic bio-activation, resulting in a GSH
conjugate that is even more reactive than the parent compound. A growing number of
evidence supports the aforementioned phenomenon, where mutagens, carcinogens and even
some prodrugs are metabolically activated by conjugation with GSH (Guengerich, 2005;
Kurtovic et al., 2008). Mono- and dihaloalkanes (Guengerich et al., 2003; Wheeler et al., 2001)
as well as polyhalogenated alkenes (Armstrong, 2010) are some of the examples of compounds
in which GSH conjugates still contain a potent electrophilic center and are capable of
modifying important cell macromolecules, such as DNA (Hayes et al., 2005). There is evidence
that this is particularly true for the kidney. Namely, in the compelling example of GSH
addition to methylenechloride, catalyzed by the theta class of GST enzymes, highly electrophilic
compound is yield and rapidly hydrolyzed to even more toxic formalaldehyde (Ahmed and
Figure 9. The metabolism of xenobiotics and the formation of GSH conjugates and their subsequent metabolism towards mercapturic acid; Adopted from Simic et al., 2009, available at http://www.nature.com/nrurol/journal/v6/n5/fig_tab/nrurol.2009.49_F2.html; Abbreviations: Cys- Cysteine, Glu- glutamate, Gly- glycine

GSTA1, GSTM1, GSTP1 and GSTT1 polymorphisms in RCC
19
Anders, 1976; Meyer et al., 1991) that might contribute to the process of the target-organ
toxicity and possible renal tumorigenicity (Anders and Dekant, 1998).
1.2.2.2 Metabolism of endogenous compounds by GSTs
Being a multifunctional group of enzymes, GSTs are involved in intracellular binding
and transport of hydrophobic compounds (Hayes and Pulford, 1995), catalysis of key steps in
the synthesis of leukotrienes, prostaglandins (Inoue et al., 2003) and steroid hormones (Tars et
al., 2010), as well as the degradation of tyrosine (Hayes et al., 2005).
Moreover, GSTs are involved in the inactivation and reduction of endogenous reactive
by-products generated during oxidative stress. Namely, an increase in the intracellular levels of
reactive oxygen/nitrogen species (ROS/RNOS), including oxygen and nitrogen-free radicals,
leads to membrane dysfunction, DNA damage and inactivation of proteins. It is presumed that
chronic oxidative stress has numerous pathological consequences, including the development
of complex diseases, such as cancer. ROS/RNOS are shown to damage cellular constituents,
not only in a direct way, but also indirectly through the production of reactive secondary
metabolites. Polyunsaturated fatty acids in cell membranes are particularly sensitive to the
process of lipid peroxidation, resulting in the production of short-living lipid hydroperoxides
that tend to break down to yield more reactive secondary electrophiles, some of which are
genotoxic (Marnett et al., 2003). Phospholipid, fatty acid and cholesterol hydroperoxides are
substrates for several GSTs, especially for the members of class alpha class enzymes (Seeley et
al., 2006). Among the substrates for GSTA4-4 are products of lipid peroxide oxidation,
acrolein and 4-hydorxynonenal (4-HNE) (Hubatsch et al., 1998). Furthermore, the oxidation
of nucleotides yields base propenals and hydroperoxides that are detoxified by GSTs.
Overall, it seems that some GST isoenzymes exhibit selenium independent glutathione
peroxidase activity and along with other antioxidant enzymes provide a certain shield against a
range of harmful electrophiles, produced during redox imbalance (Hayes and McLellan, 1999).
Another interesting implication of GSTs in the protection against oxidative damage and the
control of redox signaling pathway function is their capability of S-glutathionylation. Namely,
S-glutathionylation is a posttranslational protein modification, characterized by the conjugation
of GSH to low PKa cysteine sulfydryl or sulfonic-acid moieties in target proteins, in response
to endogenous oxidative or nitrosative stress-mediated signaling events or from exposure to

GSTA1, GSTM1, GSTP1 and GSTT1 polymorphisms in RCC
20
external environmental drug treatment (Tew et al., 2011). Moreover, there is a growing body
evidence delineating the importance of S-glutathionylation in the regulation of protein
structure and function (Tew et al., 2011).
1.2.2.3 The role of GSTs in the regulation of cell signaling
In addition to their role in the biotransformation reactions, there is some evidence
which clearly indicates the involvement of GST in the cellular survival, proliferation and
apoptosis as well, by the means of protein:protein interactions with the signaling molecules.
(Board and Menon, 2013; Laborde, 2010; McIlwain et al., 2006; Tew and Townsend, 2012).
Namely, GSTs are shown to negatively regulate protein kinases such c-Jun NH2-terminal
kinase (JNK1) and apoptosis signal-regulating kinase 1 (ASK1).
The first example of GST-mediated kinase regulation was the discovery of the
GSTP1:JNK1 complexes (Adler et al., 1999). Namely, it seems that under physiological
conditions, a portion of GSTP1 is bound to kinase JNK1, regulating the level of JNK1 activity.
However, in case of increased ROS content, the GSTP1:JNK1 complex dissociates which in
turn leads to the association of GSTP1 into oligomers (Figure 10, A). Now activated, JNK1
induces a chain of events, starting from the phosphorylation of its substrate, the transcription
factor c-Jun, and resulting in apoptosis (Adler et al., 1999; Board and Menon, 2013). A similar
pattern was observed in the case of GSTP1 interaction with Factor 2 bound to the TNFα
receptor (TRAF2). On one hand, the dissociation of this particular complex results in the
oligomerization of the GSTP1 and on the other, in differentiation/proliferation or apoptosis,
depending on the severity of oxidative stress. It is noteworthy to mention that the catalytic
activity of GSTP1 is not affected by the involvement in protein:protein interactions, suggesting
that the active site of GSTP1 is not engaged in this process (Tew and Townsend, 2012).
Another example of protein:protein interaction, similar to the one of GSTP1, is a
complex between mitogen activated kinase (MAPK) ASK1 and GSTM1-1, found to be
important for the maintenance of the normal level of p38 phosphorylation (Figure 10, B) (Cho
et al., 2001). Namely, ASK1 is MAPK kinase kinase (MAPK3) that activates JNK1 and p38
pathways, leading to cytokine and stressed-induced apoptosis (Ichijo et al., 1997).
Environmental stress causes the disruption of the complex of GSTM1:ASK1, which
accumulates GSTM1 into oligomers, while ASK1 is being activated (Dorion et al., 2002). This

GSTA1, GSTM1, GSTP1 and GSTT1 polymorphisms in RCC
21
dissociation results in a subsequent activation of JNK1 and p38-dependent signal pathways,
ultimately leading to stress-induced apoptosis. Similarly to GSTP1, this role of GSTM1 seems
to be independent of the GST enzyme activity (Cho et al., 2001).
Finally, even GSTA1 possesses the capacity of forming protein:protein complexes with
JNK1. Namely, the homology between GSTA and GSTP family members may explain why
GSTA1 by a similar mechanism can also suppress JNK1 signaling, caused by inflammatory
cytokines or oxidative stress. It seems that enhanced GSTA1-1 expression significantly
decreases the number of cells subjected to the apoptosis due to inhibition of JNK1-dependent
phosphorylation of c-jun and the activation of Caspase-3 (Romero et al., 2006).
1.2.3 Genetic variations in human GSTs
GSTs are members of a multi-gene family. The most studied GSTs are encoded by
clusters of paralogous genes on a given chromosome (Hollman et al., 2016). Apart from
variations found between GST classes, a substantial genetic heterogeneity was found within
Figure 10. Various interactions between GSTs and protein kinases, implicated in stress-signaling pathway: (A) protein:protein interaction of GSTP1:JNK1, (B) protein:protein interaction of GSTM1:ASK1; Adopted from Board and Menon, 2013; Abbreviations: ROS- reactive oxygen species; JNK1: c-Jun NH2-terminal kinase; ASK1- apoptosis signal-regulating kinase 1; TRAF2- factor 2 bound to the TNFα receptor;

GSTA1, GSTM1, GSTP1 and GSTT1 polymorphisms in RCC
22
classes, because of gene duplications, deletions and single nucleotide polymorphisms in both
coding and non-coding gene regions. Many of the variations found within genes encoding for
human cytosolic GSTs make a direct impact on the protein structure, function and expression,
reshaping their substrate specificity and diversity as well (Board and Menon, 2013). Some of
the most frequently studied GST polymorphisms are present in Table 3.
Table 3. Polymorphism in human cytosolic GST; Adapted from Hayes et al., 2005
Class Allele Nucleotides in gene at
variable position Protein affected
Alpha GSTA1*A −631T, −567T, −69C, −52G “Reference” protein levels GSTA1*B −631G, −567G, −69T, −52A Low protein levels
Mu GSTM1*A 519G Lys173
GSTM1*B 519C Asn173
GSTM1*0 Gene deletion No protein
GSTM1*1x2 Gene duplication Overexpression of GSTM1
protein
Theta GSTT1*A 310A Thr104 GSTT1*B 310C Pro104 GSTT1*0 Gene deletion No protein
Pi GSTP1*A 313A, 341C, 555C Ile105, Ala114, Ser185 GSTP1*B 313G, 341C, 555T Val105, Ala114, Ser185105 GSTP1*C 313G, 341T, 555T Val105, Val114, Ser185 GSTP1*D 313A, 341T Ile105, Val114
Abbreviations: Lys- lysine; Asn- asparagine; Thr- threonine; Pro- proline; Ile- isoleucine; Ala- alanine; Ser- serine; Val- valine;
Vast majority of polymorphisms identified within genes encoding for cytosolic GSTs
comprise single nucleotide substitution or variation (SNP). Generally, SNPs are divided into
synonymous and non-synonymous. Synonymous polymorphisms (sSNP) occur due to the
nucleotide change resulting in the amino acid substitution, however, without affecting protein
function. On the other hand, missense, nonsense and frameshift changes represent non-
synonymous mutations (nsSNP) that generate a significant change in terms of structure and
consequently function of translated protein. Several lines of evidence indicate that out of 237
coding nsSNP found in GSTs genes (Table 4) (Yadav et al., 2014), certain nsSNPs seem to
exert deleterious effects, leading to carcinogenesis and the development of other non-
malignant diseases (Hayes and Strange, 2000; McIlwain et al., 2006). Moreover, due to the
functional significance of GST polymorphisms, Hollman et al. have recently suggested a

GSTA1, GSTM1, GSTP1 and GSTT1 polymorphisms in RCC
23
classification of diseases that are highly related to SNPs found in GSTs. The five proposed
categories are: (1) cancers (2) inflammatory or immune-mediated disorders (3) neurological
disorders (4) aging-related or metabolic disorders and (5) reproductive disorders.
Environmental toxins are the most important affecting factors for all five categories of diseases
and are the causing factors for all cancers, inflammatory or immunological disorders, as well as
reproductive disorders (Hollman et al., 2016).
Table 4. Genes encoding for major cytosolic GSTs and their SNP distribution; Adapted from Yadav et al., 2014
Gene Family
Genome Location
Total SNP
nsSNP sSNP 3′UTR 5′UTR iSNP
GSTM Chr1 1072 92 53 55 8 864
GSTA Chr6 1702 98 43 34 21 1506
GSTP Chr11 180 17 6 3 6 148
GSTT Chr22 239 30 11 3 5 192
Total
3193 237 113 95 40 2710
Abbreviations: nsSNP:-non-synonymous SNP; sSNP- synonymous SNP; 3′UTR- 3′ untranslated region; 5′UTR- 5′ untranslated region; iSNP -intronic SNP.
Deletional polymorphisms of genes encoding for human cytosolic GSTM1 and GSTT1
are rather common in human population. They result in a null genotype, characterized by a
general lack in enzymatic activity. In last two decades, the impact of GSTM1 and GSTT1
deficiency was the subject of a vast number of molecular epidemiological studies that tried to
elucidate if the association between some diseases known to be caused by environmental
agents and GST gene polymorphisms do exist.
1.2.3.1 Glutathione S-transferase M1
GSTM1 protein is composed of 218 amino acids, organized as either homo or
heterodimers with calculated molecular mass of 25.712 Da for each subunit. Isoelectric point
for this protein is around: at pH 6.6 (Mannervik, 1985).
GSTA1, GSTM1, GSTP1 and GSTT1 polymorphisms in RCC
24
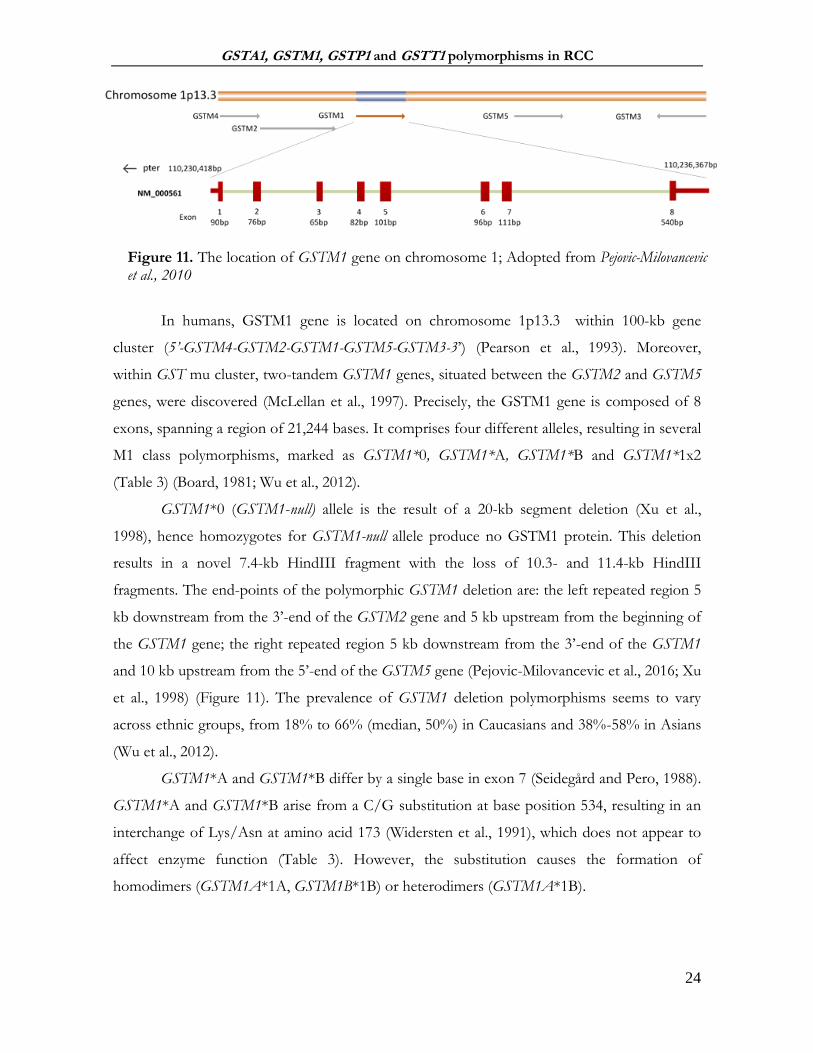
In humans, GSTM1 gene is located on chromosome 1p13.3 within 100-kb gene
cluster (5’-GSTM4-GSTM2-GSTM1-GSTM5-GSTM3-3’) (Pearson et al., 1993). Moreover,
within GST mu cluster, two-tandem GSTM1 genes, situated between the GSTM2 and GSTM5
genes, were discovered (McLellan et al., 1997). Precisely, the GSTM1 gene is composed of 8
exons, spanning a region of 21,244 bases. It comprises four different alleles, resulting in several
M1 class polymorphisms, marked as GSTM1*0, GSTM1*A, GSTM1*B and GSTM1*1x2
(Table 3) (Board, 1981; Wu et al., 2012).
GSTM1*0 (GSTM1-null) allele is the result of a 20-kb segment deletion (Xu et al.,
1998), hence homozygotes for GSTM1-null allele produce no GSTM1 protein. This deletion
results in a novel 7.4-kb HindIII fragment with the loss of 10.3- and 11.4-kb HindIII
fragments. The end-points of the polymorphic GSTM1 deletion are: the left repeated region 5
kb downstream from the 3’-end of the GSTM2 gene and 5 kb upstream from the beginning of
the GSTM1 gene; the right repeated region 5 kb downstream from the 3’-end of the GSTM1
and 10 kb upstream from the 5’-end of the GSTM5 gene (Pejovic-Milovancevic et al., 2016; Xu
et al., 1998) (Figure 11). The prevalence of GSTM1 deletion polymorphisms seems to vary
across ethnic groups, from 18% to 66% (median, 50%) in Caucasians and 38%-58% in Asians
(Wu et al., 2012).
GSTM1*A and GSTM1*B differ by a single base in exon 7 (Seidegård and Pero, 1988).
GSTM1*A and GSTM1*B arise from a C/G substitution at base position 534, resulting in an
interchange of Lys/Asn at amino acid 173 (Widersten et al., 1991), which does not appear to
affect enzyme function (Table 3). However, the substitution causes the formation of
homodimers (GSTM1A*1A, GSTM1B*1B) or heterodimers (GSTM1A*1B).
Figure 11. The location of GSTM1 gene on chromosome 1; Adopted from Pejovic-Milovancevic et al., 2010

GSTA1, GSTM1, GSTP1 and GSTT1 polymorphisms in RCC
25
Finally, in Saudi Arabian population, a unique GSTM1 variant GSTM1*1x2, containing
a duplicated GSTM1 gene has been identified (Evans et al., 1996) presumably leading to ultra-
rapid enzyme activity of GSTM1 protein (McLellan et al., 1997).
Among all GSTM1 polymorphisms, the highest attention was given to GSTM1
deltional polymorphism. The GSTM1 deficiency appears to be associated with a modest but
significant risk of several types of cancers, such as lung (Ye et al., 2006), colon
(Economopoulos and Sergentanis, 2010) and bladder (Matic et al., 2013), as well as various
response rates to some chemotherapeutics (Ambrosone et al., 2001). The underlying
mechanism conferring an increased risk of cancer in GSTM1-null carriers would be that such
individuals are more susceptible to chemical-induced carcinogenesis due to the diminished
activity of xenobiotic-metabolizing defense system (Di Pietro et al., 2010). Moreover,
monomeric form of GSTM1 is shown to negatively regulate kinase-dependent proliferation
pathways by forming protein:protein complexes with MAPK kinase kinase ASK1 (Cho et al.,
2001; Dorion et al., 2002). Slower tumor progression, as well as impaired clinical response to
therapy in a variety of tumor types has been associated with altered GSTM1 expression.
Namely, it has been speculated that carriers of GSTM1-null genotype exhibit better survival,
possibly due to the decreased level of apoptotic activity in tumor tissue (De Martino et al.,
2010; McIlwain et al., 2006).
1.2.3.2 Glutathione S-transferase T1
The gene for GSTT1 is situated at chromosome 22 (22q11.23), and composed of 5
exons, spanning a region of 8,179 bases (Figure 12). In the case of GSTT1, gene homozygous
deletion, termed “GSTT1-null” genotype is present in ∼20% of Caucasians, leading to the lack
of GSTT1 enzyme activity (Wiencke et al., 1995). Namely, a 54251bp fragment comprising the
gene for GSTT1, is found to be deleted from chromosome 22, most likely by a homologous
recombination event between two highly homologous sequence stretches that flank GSTT1
(Pejovic-Milovancevic et al., 2016; Sprenger et al., 2000).
Another GSTT1 polymorphism was found in exon 3 of GSTT1 gene, resulting in two
different variants: GSTT1*A and GSTT1*B. The substitution of threonine at residue 104 to a
proline causes a decrease in catalytic activity due to the conformational change located in the
middle of alpha-helix 4 (Alexandrie et al., 2002).

GSTA1, GSTM1, GSTP1 and GSTT1 polymorphisms in RCC
26
GSTT1-1 has been highly conserved during evolution and played a major role in
phase-II biotransformation of a number of drugs and industrial chemicals, e.g. cytostatic drugs,
hydrocarbons and halogenated hydrocarbons. However, it seems that when it comes to gene-
environment interactions, GSTT1 deficiency may be either deleterious or beneficial depending
upon circumstances. Apparently, GSTT1 may play a role as a risk modifier only in the case of
subjects exposed to relevant substrates (Buzio et al., 2003). Namely, as mentioned earlier,
members of the GST theta class are involved in GSH conjugation of certain halo- and
dihaloalkanes, producing even more toxic reactive intermediates (Guengerich et al., 2003). On
the other hand, GSTT1 is capable of detoxifying compounds such as methyl bromide (Pemble
et al., 1994), ethylene dibromide (Ploemen et al., 1995) and ethylene oxide (Yong et al., 2001).
1.2.3.3 Glutathione S-transferase A1
Gene cluster for members of GST alpha is localized on chromosome 6p12.1-6p12.2,
covering more than 400 kb of genes GSTA1-GSTA5 (Morel et al., 2002) (Figure 13). GSTA1
is dominantly expressed in the liver. However, GST alpha expression seems to be modified by
genetic polymorphism. GSTA1 polymorphism is represented by three apparently linked single
nucleotide polymorphisms in an SP1-responsive element within the proximal promoter (G-
52A, C-69T and T-567G), plus at least four SNPs further upstream and a silent SNP A-375G
(Figure 13).
Figure 12. The location of GSTT1 gene on chromosome 22; adopted from Pejovic-Milovancevic et al., 2016

GSTA1, GSTM1, GSTP1 and GSTT1 polymorphisms in RCC
27
Two variants, GSTA1*A (-567T, -69C,-52G) and GSTA1*B (-67G, -69T, -52A), have
been named according to the linked functional SNPs. The frequency of the GSTA1*A
haplotype ranges between 0.6 and 0.85 in African, Asian and European populations. It seems
that aforementioned substitutions result in differential expression with lower transcriptional
activation of variant GSTA1*B than common GSTA1*A allele (Coles and Kadlubar, 2005).
Namely, it has been shown that the mean expression of GSTA1 in liver samples of GSTA1*A
homozygotes was approximately 4-fold higher than that of GSTA1*B homozygotes (Coles et
al., 2001). On the other hand, no difference in expression was found in pancreatic tissue,
suggesting that the effect of this polymorphism might be tissue specific (Coles and Kadlubar,
2003). Moreover, Chuang et al. have clearly demonstrated that GSTA1 is a biomarker for clear
cell RCCs by means of several molecular techniques, whereas the same marker was absent in
other renal tumors (Chuang et al., 2005).
GSTA1, along with GSTA2, catalyzes the glutathione conjugation of a wide range of
electrophiles, possess glutathione dependent steroid isomerase activity and GSH‐dependent
selenium independent peroxidase activity (Coles and Kadlubar, 2005). It has been suggested
that this genetic variation of GSTA1 can change an individual's susceptibility to carcinogens
and toxins, as well as affect the efficacy of some drugs (Coles and Kadlubar, 2003). However,
the results of these studies have been rather conflicting.
1.2.3.4 Glutathione S-transferase P1
GSTP1 gene is located on the chromosome 11q13 (Figure 14). Two common
functional variants have been found within these gene, resulting in a interchange in amino
acids 105 (Isoleucine, Ile to Valine,Val) and 114 (Alanine, Ala to Valine) (Ali-Osman et al.,
Figure 13. The location of GSTA1 gene on chromosome 6; adopted from Savic-Radojevic and Radic, 2014

GSTA1, GSTM1, GSTP1 and GSTT1 polymorphisms in RCC
28
1997). Four haplotypes have been identified: GSTP1*A (*Ile105+*Ala114), GSTP1*B
(*Val105+*Ala114), GSTP1*C (*Val105+*Val114) and GSTP1*D (*Ile105+*Val 114) (Watson
et al., 1998). The allele frequencies for GSTP1*A, *B, and *C in Caucasian populations are
found to be 0.685, 0.262, and 0.0687, respectively (Garte et al., 2001).
Far more studied substitution is the *Ile105Val, occurring due to the nucleotide
substitution A1404G at exon 5, base pair 313, contributing to the architecture of the
hydrophobic substrate binding H-site and different substrate specificity (Reinemer et al., 1992).
For instance, GSTP1 variants exhibit significantly different rates of conjugating activity
towards (+)-anti-BPDE, with higher turnover for isoform GSTP1*Val105 than for isoform
GSTP1*Ile105, due to the more favorable substrate-binding setting in the H-site (Hu et al.,
1997). This finding was further supported by the results of Sundberg et al., who additionally
suggested that higher risk for tumor formation by PAH in homozygous carriers of
GSTP1*Val105 is not caused by a lower catalytic efficacy of the corresponding enzyme, but
proposed a display of other reasons (Sundberg et al., 1998).
Throughout the literature, GSTP1 genotype has been associated with differences in
cancer susceptibility, chemotherapeutic response and overexpression in variety of tumors.
However, several lines of evidence indicate that the underlying mechanism might not be solely
based on the polymorphic expression of GSTP1. Namely, the fact that GSTP is shown to be a
potent inhibitor of signaling molecules, such as JNK1, via formation of protein:protein
interactions (Adler et al., 1999; Tew et al., 2011), seems to affect survival and/or apoptotic
pathways, related to the observed drug resistance (Adler et al., 1999; McIlwain et al., 2006;
Figure 14. The location of GSTP1 gene on chromosome 11; adopted from Simic, 2016

GSTA1, GSTM1, GSTP1 and GSTT1 polymorphisms in RCC
29
Townsend et al., 2005). It has been suggested that the upregulation of GSTP found in many
drug-resistant tumors such as ovarian, lung, breast colon and hematological cancers (Laborde,
2010), might cause negative regulation of JNK1 through aforementioned protein:protein
interactions and subsequently suppress apoptotic pathways, conferring resistance to drug-
induced death (Board and Menon, 2013).
1.3 GENETIC POLYMORPHISM OF GLUTATHIONE TRANSFERASES IN
PATIENTS WITH RENAL CELL CARCINOMA
Mounting evidence suggests that members of the subfamily of cytosolic GSTs possess
roles far beyond the classical GSH-dependent enzymatic conjugation of electrophilic
metabolites and xenobiotics. Namely, a well-known homo- and hetero-dimeric forms of GSTs
seem to exist in a redox-sensitive dynamic equilibrium with its monomeric forms, that are
capable of forming protein:protein interactions with other cellular proteins (Tew et al., 2011).
The latest interpretation of such protein:protein interactions emphasizes that multiple signaling
and regulatory functions of GSTs coexist with the classical enzymatic and small molecule
binding role of these proteins (Bartolini and Galli, 2016). Such vast capabilities of GSTs
become very important when it comes to tumorigenesis and even therapy resistance.
The impact of GST functional human polymorphisms on cancer susceptibility as well
as therapeutic outcomes has been extensively studied in the context of its Phase II
detoxification properties. However, the role of these polymorphisms as mediators of protein:
protein interactions in better understanding of the cancer progression is yet to be determined.
In case of RCC, some studies suggest that cytosolic GSTs might be implicated not
solely in the development, but also in the progression of RCC (Ahmad et al., 2012; De Martino
et al., 2010; Salinas-Sánchez et al., 2012; Sweeney et al., 2000). GSTs are involved in the
biotransformation of several compounds recognized as risk factors for RCC (Hayes and
Strange, 2000). The main site for the initial glutathione conjugation of toxic compounds is
generally assumed to be the liver, followed by a mandatory transfer of conjugates to the kidney
(Simic et al., 2009). However, the initial bio-activation step of some nephrocarcinogens can
take place in the kidney itself (Green et al., 1997). The potential genotoxicity of carcinogens
depends on the biotransformation capacity of renal tissue. Prominent genetic heterogeneity,
resulting from the gene deletions, as well as from SNPs in the coding and non-coding regions

GSTA1, GSTM1, GSTP1 and GSTT1 polymorphisms in RCC
30
of GST genes, might affect GST isoenzyme profiles in renal parenchyma and therefore serve as
a valuable indicator for predicting the risk of cancer development (Di Pietro et al., 2010).
There is a growing body of evidence suggesting that during the tumor development,
important changes appear in the cellular redox homeostasis as well. This can be particularly
true for the kidney due to its high metabolic activity and oxygen demands (Simic et al., 2009).
Moreover, it is believed that renal cell carcinoma also belongs to tumors in which significant
changes occur in cellular redox balance. This can be partially explained by the fact that all three
recognized risk factors for RCC development (obesity, hypertension and smoking) have been
linked with increased endogenous formation of reactive oxidants. Thus, in RCC, marked
oxidative alterations of lipids, proteins and DNA have been found (Pljesa-Ercegovac et al.,
2008). Although a broad range of DNA products are produced during oxidative damage to
DNA (Valavanidis et al., 2009), 8-hydroxy-2′-deoxyguanosine (8-OHdG) is the most widely
used fingerprint of radical attack towards DNA (Figure 15). Results obtained from several
studies indicated the significant role of 8-OHdG as a potential biomarker in risk assessment
and prognosis of various diseases associated with oxidative stress mechanisms, such as cancers,
aging and degenerative diseases (Valavanidis et al., 2009). However, despite the fact that some
GST isoenzymes might be involved in regulation of cellular redox homeostasis by their
nonselenium-dependent GPX activity, their role in the DNA antioxidant protection and
corresponding level of 8-OHdG has not been assesed in such context in RCC.
Figure 15. The structure of 8-hydorxyguanine (8-OHdG)

GSTA1, GSTM1, GSTP1 and GSTT1 polymorphisms in RCC
31
Furthermore, DNA adducts associated with tobacco smoking have been suggested as a
marker of biologically effective dose of tobacco carcinogens that might improve individual
cancer risk prediction (Wiencke, 2002). As previously mentioned, cigarette smoke is a rich
source of both free radicals, shown to induce DNA damage that accumulates in cells, but also
more than 60 carcinogens, such as PAHs. Both free radicals and reactive PAH metabolites are
detoxified by GSTs (Filiadis and Hrouda, 2000; Jung and Messing, 2000). So far, the
relationship between GST genotype and BPDE-DNA adduct formation in determining the
risk for RCC has not been evaluated in patients with RCC.
Although the associations between the certain GST genotypes and RCC risk has been
debated in a certain number of published literature (Abid et al., 2016; Cheng et al., 2012;
Huang et al., 2015; Jia et al., 2014; Liu et al., 2012; Yang et al., 2013), the data on the
prognostic value of GST polymorphism in patients with RCC are scarce (De Martino et al.,
2010), probably due to the fact that the molecular mechanism supporting the role of GSTs in
RCC progression has not been clarified as yet. Since GSTP1 was shown to be an endogenous
inhibitor of JNK1, whereas GSTM1 negatively regulates ASK1, both might contribute to the
lower tissue apoptotic activity. In the setting of the tumor tissue, the aforementioned
interactions might correlate with high-graded tumors. So far, there are no data which would
indicate the significance of this protein:protein interactions in human RCC in terms of tumor
progression. What is more, it is still unclear whether the polymorphic expression of GSTs may
influence the activity of apoptotic signal pathways in RCC progression.

GSTA1, GSTM1, GSTP1 and GSTT1 polymorphisms in RCC
32
2 THE OBJECTIVES
Due to the potential functional significance of common polymorphisms in genes
encoding for cytosolic glutathione transferase A1, M1, T1 and P1 in both onset and prognosis
of RCC, the aim of our investigation was:
1. To evaluate the role of GSTA1 (rs3957357), GSTM1, GSTP1 (rs1695) and GSTT1 gene
polymorphisms in susceptibility to development of renal cell carcinoma, as well as, to
investigate if there is a combined effect of genotype and the recognized renal cell carcinoma
risk factors (smoking, obesity, hypertension)
2. To evaluate whether the presence of GSTA1, GSTM1, GSTP1 and GSTT1 gene
variants is associated with higher levels of byproducts of oxidative DNA damage (8-OHdG)
and increased formation of BPDE-DNA adducts, as well as, clinical characteristics of the
tumor (tumor stage, pT and grade, G)
3. To evaluate whether polymorphic expression of GST protein might have a prognostic
role in patients with renal cell carcinoma
4. To evaluate the association between GSTM1 and GSTP1 expression and expression of
regulatory (ASK1, JNK1/2) and executor (Caspase-3) apoptotic molecules in human ccRCC
tissue samples, as well as, the presence of GSTM1:ASK1 and GSTP1:JNK1/2 protein:protein
interactions

GSTA1, GSTM1, GSTP1 and GSTT1 polymorphisms in RCC
33
3 MATERIALS AND METHODS
3.1 Design
Case-control study
3.2 Study population
Incident RCC cases, treated and followed at the Clinic of Urology, Clinical Center of Serbia,
Belgrade, between 2011 and 2014, were enrolled into this study. The case group comprised a
total of 305 subjects (201 men, 104 women; average age 59.25±11.47 years) with histologically
confirmed diagnosis of RCC according to the 2004 WHO classification of Tumors (Eble et al.,
2006), modified by ISUP Vancouver Classification (Srigley et al., 2013) and 2009 TNM
classification system (Sobin et al., 2010). Inclusion criteria for the RCC patients were:
The presence of malignantly enhanced lesion confirmed by imaging
(ultrasound/computed tomography/magnetic resonance imaging),
Confirmed histological diagnosis (RCC type, nuclear grade, sarcomatoid features,
vascular invasion, tumor necrosis and invasion of the collecting system and peri-renal
fat)
Patients with nephrectomy (partial or total)
Male or female, age ≥ 18 years old
Subject's willingness to provide written informed consent
Cases were excluded if they had a previous positive history of cancer.
The control group initially comprised 454 individuals (233 men, 221 women, average
age 60.40±12.31 years) who had undergone surgery for benign conditions, unrelated to both
non-malignant and malignant urological condition at the same clinical center. The initial
control group was further matched to RCC patients according to gender and age, and finally
included 326 individuals (209 men, 117 women; average age 60.75±11.52 years) with no
previous personal history of cancer. Inclusion criteria for the controls were:
The verified absence of malignantly enhanced lesions
Male or female, age ≥ 18 years old
Subject's willingness to provide written informed consent
Controls were excluded if they had a previous personal history of cancer.
GSTA1, GSTM1, GSTP1 and GSTT1 polymorphisms in RCC
34
Responce rate was 93% and the most common reason for no participation was personal.
The basic demographic data and recognized risk factors for RCC (smoking history,
obesity and hypertension) were obtained from the study subjects using the structured
questionnaire (Djukic et al., 2013) composed at the Institute of Epidemiology, Faculty of
Medicine University in Belgrade, during the time of blood collection. In our study, obese
patients were defined as individuals with BMI above 25kg/m2 and smokers as individuals who
reported every day smoking during a minimum of 60-day period prior to their enrollment in
the study. Further on, participants were asked about the number of cigarettes smoked per day
and duration of smoking. All collected data referred to a time period prior to the diagnosis of
RCC for the cases, and a corresponding period for the controls.
3.3 Ethics
The study was approved by the Institutional Ethical board (October 13th, 2011,
approval number 29/X-3, Faculty of Medicine, University of Belgrade, Serbia) and was
performed in accordance with principles of Helsinki declaration from 2013. Informed written
consent was obtained from all recruited subjects.
3.4 Materials
3.4.1 Blood and plasma samples
EDTA blood was collected from each patient treated at the Clinic of Urology, Clinical
Center of Serbia, Belgrade. 400µl of the whole blood was taken for the purpose of the DNA
isolation and the rest was centrifuged for 10 min at 3600 rpm/4°C for plasma separation. In
order to prevent the auto-oxidation of the plasma sample, 10µl of butilated hydroxytoluen (10
mmol/L) was added per ml of plasma.
EDTA blood samples were stored at -20°C whereas plasma samples were kept at -80
°C at the Institute of Medical and Clinical biochemistry, Faculty of Medicine, University of
Belgrade, Serbia.

GSTA1, GSTM1, GSTP1 and GSTT1 polymorphisms in RCC
35
3.4.2 Tissue samples
Tumor and respective non-tumor samples (n=20) were taken during partial or total
nephrectomy from patient treated at the Clinic of Urology, Clinical Center of Serbia, Belgrade.
All tissue samples had their RCC type, nuclear grade, sarcomatoid features, vascular invasion,
tumor necrosis and invasion of the collecting system and peri-renal fat confirmed. The samples
were stored in RNAlater RNA Stabilization reagent (Qiagen, Chatsworth, California, USA) at -20⁰C
and kept at the Institute of Medical and Clinical biochemistry, Faculty of Medicine, University
of Belgrade, Serbia.
3.5 Methods
3.5.1 DNA isolation
Total DNA was isolated from 200µl of the whole peripheral blood and up to 25mg of
non-tumor kidney tissue samples, using QIAamp DNA Blood Mini Kit (Qiagen, Chatsworth CA,
USA) according to the manufacture’s protocol. Namely, the QIAamp DNA purification
procedure comprised 5 steps and was carried out using QIAamp Mini spin columns with a small
chance of sample-to-sample cross-contamination. In the first step, optimized detergent buffers
and enzyme Proteinase K (600 mAU/ml, 40 mAU/mg protein) were used to lyse samples and
stabilize DNA. In the case of non-tumor kidney tissue samples, no mechanical
homogenization was necessary, as the tissue samples were lysed enzymatically during
prolonged incubation with Proteinase K. In the second step, DNA was adsorbed onto the
QIAamp silica membrane during a brief centrifugation. The lysate buffering conditions are
adjusted to allow optimal binding of the DNA to the QIAamp silica membrane. In the
following two steps, the DNA bound to the QIAamp membrane was washed with Buffer AW1
and Buffer AW2 in 2 centrifugation without affecting DNA binding. The washing steps can be
repeated as the residual contaminants can inhibit genotyping and other downstream enzymatic
reactions. Purified DNA was eluted from the QIAamp Mini spin column in a concentrated form
in AE Buffer. Isolated DNA, free of protein, nucleases and other contaminants or inhibitors,
was stored at -20⁰C for later use. DNA concentration and purity were determined
spectrophotometrically at 230, 260, 280 i 320 nm using GeneQuantpro (Biochrom, Cambridge,
England).

GSTA1, GSTM1, GSTP1 and GSTT1 polymorphisms in RCC
36
3.5.2 Genotyping
Genotyping was performed blinded to the case-control status and blinded quality
control samples were inserted to validate genotyping identification procedures. Concordance
for blinded samples was 100%. All assays performed contained positive and negative controls.
All primers used are synthesized and bought from Metabion International AG (Planegg, Germany)
(Table 5).
Table 5. The PCR genotyping conditions
3.5.2.1 Genotyping of GSTM1 and GSTT1
The DNA sequences of GSTM1 and GSTT1 were analyzed by multiplex polymerase
chain reaction (PCR) in Mastercycler gradient thermal cycler (Eppendorf, Hamburg, Germany) according
to the method by Abdel-Rahman et al. (Abdel-Rahman et al., 1996) (Table 5).
The multiplex PCR technique used to detect homozygous deletions
of GSTM1 and GSTT1 included primers for GSTM1, GSTT1 and CYP1A1 housekeeping
Gene Primer sequences PCR protocol Gel electrophoresis
results
GSTA1 C69T
(rs3957357)
F, 5′- GCATCAGCTTGCCCTTCA -3′,
R, 5′- AAACGCTGTCACCGTCCTG -3′
Denature: 94˚C
for 4mins Followed by 94˚C
for 20s Annealing: 58˚C
for 20s Extension: 72˚C
for 40s #cycles: 33
Final extension: 72˚C for 5 mins
Eam1104I incubation at
37˚C overnight GSTA1*CC- 400bp GSTA1*CT- 400bp,
308bp and 92bp GSTA1*TT- 308bp and
92bp
GSTM1 F, 5′-GAACTCCCTGAAAAGCTAAAGC-3′, R, 5′-GTTGGGCTCAAATATACGGTGG-3′
Multiplex PCR: Denature: 94˚C
for 4mins Followed by 94˚C
for 30s Annealing: 59˚C
for 30s Extension: 72˚C
for 45s #cycles: 30
Final extension: 72˚C for 5mins
GSTM1-active: 215bp band
GSTM1-null: no band
GSTT1 F, 5′-TTCCTTACTGGTCCTCACATCTC-3′,
R, 5′-TCACCGGATCATGGCCAGCA-3′
GSTT1-active: 481bp band
GSTT1-null-: no band
CYP1A1
F, 5’-GAACTGCCACTT CAGCTGTCT-3’ R, 5’-CAGCTGCATTTG GAAGTGCTC-3’
312bp band

GSTA1, GSTM1, GSTP1 and GSTT1 polymorphisms in RCC
37
gene, used as an internal control for amplifiable DNA (Table 5). Isolated DNA (~50ng) was
amplified in a total volume of 25 μl reaction mixture containing 7.5 pmol of each primer,
12.5µl of MasterMix (0,05U/μL Taq DNK polymerase, 4 mmol MgCl2 i 0,4 mmol of dNTP)
and water (Thermo Fisher Scientific, Waltham, Massachusetts, USA). Amplified PCR products
(GSTM1: 215 bp, GSTT1: 481 bp, CYP1A1: 312 bp) were electrophoresed (125V constant,
0.27A, 50W) on 2% agarose gel, stained with SYBR® Safe DNA Gel Stain (Invitrogen Corporation,
Carlsbad, CA, USA) and visualized on GL200 Camera (Gel Logic Imaging System, Kodak) or on
Chemidoc (Biorad, Hercules, CA, USA) (Figure 16).
Since the assay does not distinguish heterozygous or homozygous wild-type genotypes
and therefore detects the presence (at least one allele present, homozygote or heterozygote) or
the absence (complete deletion of both alleles, homozygote) of the genotype, the active
genotype were detected according to presence of the particular band (GSTM1-active: 215 bp,
GSTT1-active: 481 bp) and the absence of these bands was indicative of the null genotypes.
Figure 16. 2% agarose gel electrophoretogram: PCR products of the GSTM1 and GSTT1 genes. Lanes 8 and 10 comprise PCR products of patients with the GSTT1-active/GSTM1-active genotype (481 bp and 215 bp bands, respectively); lanes 1, 2, 3, 6 and 9 comprise PCR products of patients with the GSTT1-active/GSTM1-null genotype (481 bp bands); Lane 7 comprises PCR products of patients with GSTT1-null/GSTM1-active genotype (215bp bands); Lines 4, 5 and 11 indicate patients with GSTT1-null/GSTM1-null genotype; 312bp band represents the CYP1A1 housekeeping gene, used as internal control for amplifiable DNA; M, DNA marker
3.5.2.2 The genotyping of GSTA1*C69T (rs3957357)
The analysis of the SNP GSTA1*C69T (rs3957357) was performed using PCR-
restriction fragment length polymorphism (RFLP) according to the method by Ping et al (Table
5) (Ping et al., 2006). A 400 bp fragment was amplified in a total volume of 20μl reaction
mixture containing 12.5pmol of each primer, 10µl of MasterMix and water (Thermo Fisher

GSTA1, GSTM1, GSTP1 and GSTT1 polymorphisms in RCC
38
Scientific, Waltham, Massachusetts, USA) and subjected to the PCR protocol indicated in the
Table 5. For RFLP analysis, 5µl of PCR product was digested overnight at 37°C with 2U of
restriction enzyme EarI and 1xTango Buffer (Thermo Fisher Scientific, Waltham, Massachusetts, USA)
in total volume of 15µl. DNAse free water was used as the negative control. Digested products
(GSTA1*CC: 400bp, GSTA1*CT: 400bp + 308 pb + 92bp and GSTA1*TT: 308bp+92 bp)
were separated on 3% agarose gel (125V constant, 0.27A, 50W) and stained with SYBR® Safe
DNA Gel Stain (Invitrogen Corporation, Carlsbad, CA, USA) and visualized on GL200 Camera (Gel
Logic Imaging System, Kodak) or on Chemidoc (Biorad, Hercules, CA, USA) (Figure 17).
Figure 17. 3% agarose gel electrophoretogram: PCR-RFLP restriction products of the GSTA1 gene. Lanes 1 and 2 comprise PCR products of patients with the GSTA1*CC genotype (400 bp bands); lanes 3, 5, 6 and 7 comprise PCR-RFLP restriction products of patients with the GSTA1*CT genotype (400bp, 308bp, 92bp bands); Lane 4 comprises RFLP-PCR restriction products of patients with GSTA1*TT genotype (308bp, 92bp bands); M, DNA marker; N, negative control without a DNA content.
3.5.2.3 The genotyping of GSTP1*Ile105Val (rs1695)
For analyses of SNP polymorphism GSTP1*Ile105Val (transition substitution: A/G;
context sequence [VIC/FAM]: CGTGGAGG ACCTCCGCTGCAA ATAC [A/G]
TCTCCCTC ATCTACACCAACTATGT), a 5´ nuclease TaqMan® SNP Genotyping Assays
(Life Technologies, Applied Biosystems, Carlsbad, CA, USA, assay ID: C__3237198_20 ) was used for
amplifying and detecting respective SNP alleles in purified genomic DNA samples according
to the manufactures’ instructions.
Reaction mixture, containing MasterMix, water (Thermo Fisher Scientific, Waltham,
Massachusetts, USA) and fluorescence probes were pipetted by EppMotion automated liquid

GSTA1, GSTM1, GSTP1 and GSTT1 polymorphisms in RCC
39
handling system (Eppendorf, Hamburg, Germany). PCR amplification and the plotted fluorescence
signal endpoint reading was performed on Mastercycler ep realplex (Eppendorf, Hamburg, Germany).
3.5.3 Determination of BPDE-DNA adducts and 8-OHdG levels by enzyme linked
immunosorbent assays (ELISA) method
The level of benzo(a)pyrene diol epoxide DNA adducts (BPDE-DNA) was determined
using the standard method OxiSelect BPDE-DNA Adduct ELISA Kit (Cell Biolabs, Inc., San Diego,
California, USA) according to the manufactures’ instructions. Namely, isolated DNA samples
were diluted to a concentration of 2 𝜇g/mL. BPDE-DNA standards and DNA samples were
adsorbed onto a 96-well DNA high-binding plate. The BPDE-DNA adducts present in the
sample or standard were probed with an anti-BPDE-I antibody, followed by the incubation with
a horse radish peroxidase (HRP) conjugated secondary antibody. Sample/standard absorbance
was read at 450/620nm wavelength on LKB 5060-006 Micro Plate Reader (Vienna, Austria). The
BPDE-DNA adduct content in samples was determined by comparing with a standard curve
that was prepared from predetermined BPDE-DNA standards (Figure 18). The results were
expressed as ng/ml of BPDE-DNA adducts.
Figure 18. BPDE-DNA ELISA Standard Curve. Equation: y = a + b*x; y- Abs450/620 (nm); a-slope; b-intercept; x- BPDE-DNA adduct level in ng/ml; Adj. R Square: 0.9892
0 10 20 30 40 50 60 70
0,0
0,1
0,2
0,3
0,4
0,5
0,6
Ab
s 4
50
/62
0 (
nm
)
BPDE-DNA adducts (ng/ml)

GSTA1, GSTM1, GSTP1 and GSTT1 polymorphisms in RCC
40
The quantitative measurement of 8-hydroxy-2′-deoxyguanosine (8-OHdG) was
determined using the standard method OxiSelect Oxidative DNA Damage ELISA kit (Cell Biolabs,
Inc., San Diego, California, USA), according to the manufacture’s protocol. Namely, 50µl of
plasma samples or 8-OHdG standards were added to an 8-OHdG/BSA conjugate pre-
absorbed microplate. After a brief incubation, an anti-8-OHdG monoclonal antibody was
added, followed by an horse radish peroxidase (HRP) conjugated secondary antibody.
Sample/standard absorbance was read at 450/620nm wavelength on LKB 5060-006 Micro Plate
Reader (Vienna, Austria). The 8-OHdG content in plasma samples was determined by
comparison with predetermined 8-OHdG standard curve (Figure 19). The results were
expressed as ng/ml of 8-OHdG.
Figure 19. 8-OHdG ELISA Standard Curve. Equation: y = 0.7118 + (0.06325 - 0.7118) * x^1.5955 / (0.5166^1.5955 + x^1.5955), y- absorbance at 450/620, x-concentration of 8-OHdG; Adj. R-Square: 0.9936
3.5.4 Identification of GSTM1, GSTP1, ASK1, JNK1/2 and Cleaved Caspase-3 by the
method of immunoblot
3.5.4.1 Tissue sample preparation
ccRCC tumor and respective non-tumor kidney tissue samples (n=20) were
homogenized in ice cold tissue lysis buffer (50mM Tris, 200mM NaCl, 1mM dithiothreitol, pH
0.01 0.1 1 10
0.0
0.1
0.2
0.3
0.4
0.5
0.6
0.7
0.8
Ab
s 4
50
/62
0 (
nm
)
8OHdG (ng/ml)

GSTA1, GSTM1, GSTP1 and GSTT1 polymorphisms in RCC
41
7,8) containing protease and phosphatase inhibitors (Sigma-Aldrich, St. Louis, Missouri, USA).
After homogenization, samples were centrifuged at 3000rpm/4°C for 10 min. Obtained
supernatants were separated and centrifuged at 36100rpm/4°C for 60 min.
3.5.4.2 Pooling of non-tumor kidney tissue samples for Western blot analysis
In order to reduce biological variance, two separate pools of non-tumor kidney tissue
samples were prepared according to the GSTM1 genotype: (1) GSTM1-active pool, containing
non-tumor kidney tissue samples of RCC patients carrying the GSTM1-active genotype and (2)
GSTM1-null pool containing non-tumor kidney tissue sample of ccRCC patients carrying
GSTM1-null genotype. The pools were prepared by mixing the equal parts of 6 different
samples.
3.5.4.3 Protein quantification
Protein quantification was performed in obtained cytosols and pools using Bicinchoninic
Acid Protein Assay kit (BCA-1, Sigma-Aldrich, St. Louis, Missouri, USA) on a 96-well plate. The
assay is based on the formation of a Cu+2-protein complex under alkaline conditions, followed
by reduction of the Cu+2 to Cu+1. The amount of reduction is proportional to content of the
protein present. Protein concentrations were calculated from a BSA protein standard curve
(Figure 20) and expressed as µg/µl.
Figure 20. Standard curve of net absorbance versus protein sample concentration; Equation: y = a + b*x; y- net absorbance at 562nm; a-slope; b-intercept; x- protein sample concentration in µg/µl; Adj. R Square: 0.9879
0.0 0.2 0.4 0.6 0.8 1.0
0.0
0.2
0.4
0.6
0.8
1.0
1.2
1.4
1.6
Ne
t A
bso
rba
nce
at 5
62
nm
Protein Sample Concentration (µg/µl)
GSTA1, GSTM1, GSTP1 and GSTT1 polymorphisms in RCC
42
3.5.4.4 Western blot analysis
Obtained ccRCC cytosols and pools of non-tumor kidney tissue samples were
subjected to Sodium Dodecyl Sulfate-Polyacrilamide Gel Electrophoresis (SDS-PAGE) and
immunoblot analysis for the identification of ASK1, JNK1/2, GSTM1, GSTP1 and Cleaved
Caspase-3 according to the method of Laemmli et al. (Laemmli, 1970) and Towbin et al (Towbin
et al., 1979).
Polyacrilamide gels were designed as percent solutions (Table 6) and made according to
the given formulation from dH20, 30% acrylamide mix (Biorad, Hercules, CA, USA), Tris
Buffer, 10% Sodium Dodecyl Sulfate (SDS, Merck Millipore, Darmstadt, Germany), 10% amonium
per-sulphate (APS, Thermo Fisher Scientific, Waltham, Massachusetts, USA) and
tetramethylethylenediamine (TEMED, Biorad, Hercules, CA, USA), depending on the
investigated protein molecular weight. In order to reduce and denaturate the proteins, the one
part of a loading buffer, containing 2 x Laemmeli buffer (Biorad, Hercules, CA, USA) and
dithiothreitol (DTT, SERVA Electrophoresis GmbH, Heidelberg, Germany) in a final concentration
of 50mM, was mixed with the one part of the sample. The mixture was boiled at 95⁰C for 5
minutes. Finally, 50µg of total protein was loaded per SDS-PAGE gel. In order to determine
the protein size and to monitor the progress of an electrophoresis run, the appropriate
molecular weight marker was used (PageRuler™ Prestained Protein Ladder, 10 to 180 kDa, Thermo
Fisher Scientific, Waltham, Massachusetts, USA)
Electrophoresis (200V constant, at 4°C) was performed using Biorad Mini-PORTEAN
Tetra Cell (Biorad, Hercules, CA, USA) followed by transfer onto nitrocellulose membranes
(100V constant, at 4°C) using Biorad Criterion™ blotter system (Biorad, Hercules, CA, USA). Protein
transfer was confirmed by Ponceau S staining (Sigma-Aldrich, St. Louis, Missouri, USA).
Membranes were blocked overnight with constant shaking at 4°C in 3% milk/1% BSA
in Tris-buffered saline with 0.1% Tween20 (TTBS, Sigma-Aldrich, St. Louis, Missouri, USA).
Primary antibodies against ASK1 ( Santa Cruz, Dallas, Texas, USA), JNK1/2 (Sigma-Aldrich, St.
Louis, Missouri, USA), GSTM1 ( Santa Cruz, Dallas, Texas, USA), GSTP1 (Abcam, Cambridge,
UK), Cleaved Caspase-3 (Cell Signaling, Danvers, Massachusetts, USA) and β-actin (Sigma-Aldrich,
St. Louis, Missouri, USA) were diluted in 1% BSA in phosphate-buffered saline, added to the
membranes and incubated for 3h at room temperature on orbital shaker. Afterwards,

GSTA1, GSTM1, GSTP1 and GSTT1 polymorphisms in RCC
43
membranes were washed and incubated with appropriate HRP conjugated secondary
antibodies (1:2000, Sigma-Aldrich, St. Louis, Missouri, USA) for 1hr at room temperature. Finally,
the membranes were treated with chemiluminescence detection substrate (Invitrogen Corporation,
Carlsbad, CA, USA) for 1min and exposed to X-ray films (Amesham Hyperfilm ECL, GE
Healthcare, Buckinghamshire, England).
Densitometry analysis of the scanned X-ray was performed using open source image
processing program Image J (National Institutes of Health, Bethesda, USA).
Table 6. Electorphoresis and blot conditions according to the protein size and primary antibody type
3.5.5 Immunoprecipitation and identification of GSTM1-1:ASK1 and GSTP1-1:JNK
protein:protein interactions by the method of immunoblot
Immunoprecipitation experiments were performed using Catch and Release® v2.0 High
Throughput (HT) Immunoprecipitation Assay Kit-96 well (Upstate Biotech Inc. for Merck Millipore,
Darmstadt, Germany) according to the manufactures’ instructions. Namely, 96-well filter plate
was pre-coated with 20% w/v slurry resign and Affinity Ligand. Cytosols containing 1µg/µl of
total cell proteins were incubated either with 2µg of the primary antibody against GSTM1
(rabbit, Santa Cruz, Dallas, Texas, USA) or GSTP1 (rabbit, Abcam, Cambridge, UK ), followed by
Protein
Size of the
protein (kDa)
Gel percentage
(%)
Type of primary antibody
Dilution of the
primary antibody
(R)
Type of the secondary antibody
ASK1 165 8% monoclonal anti-
mouse 1:500
anti-mouse developed in goat
JNK1/2 46/55 10% monoclonal anti-
rabbit 1:1000
anti-rabbit developed in goat
GSTM1 26 12% polyclonal anti-
rabbit 1:500
anti-rabbit developed in goat
GSTP1 23 12% polyclonal anti-
rabbit 1:500
anti-rabbit developed in goat
Cleaved Caspase-3
17/19 14% monoclonal anti-
rabbit 1:1000
anti-rabbit developed in goat
Β-globin 42 8-14% monoclonal anti-
mouse 1:2000
anti-mouse developed in goat

GSTA1, GSTM1, GSTP1 and GSTT1 polymorphisms in RCC
44
repeating washing steps. Finally, samples were re-suspended in 30µl of 2xLamelly buffer (Biorad,
Hercules, CA, USA), heated at 90°C for five minutes and collected by centrifugation at
1500rpm for one minute. Supernatant fraction was further subjected to SDS-PAGE and
Western blot analysis in oreder to investigate the existence of GSTM1:ASK1 or GSTP1:JNK1
protein:protein interactions, respectively, according to the previously described protocols
(Laemmli, 1970; Towbin et al., 1979).
3.5.6 Statistical analysis
In this study, the data of continuous variables were expressed as mean ± standard
deviation (SD) or median (minimum-maximum) whereas categorical variables were presented
using frequency (n, %) counts. Distribution was tested by using Kolmogorov–Smirnov. Differences
in investigated parameters were assessed by using ANOVA test for continuous data with
normal distribution and Mann–Whitney rank-sum test for continuous data with non-normal
distribution. Finally, χ2 test was used for categorical variables. Hardy-Weinberg equilibrium was
tested for each polymorphism calculating χ2 test for the patients and the controls separately.
The genetic variants and their risk for disease were computed by odds ratios (OR) and
95% confidence intervals (CI) by logistic regression analysis. OR was adjusted by variables
indicating recognized risk factors for RCC, as potential confounders, as well as by age and
gender.
The effect of four GST genotypes on overall survival, defined as time from
nephrectomy to the date of death or last follow-up (November 1st 2015.) was evaluated in
overall group of RCC patients, as well as ccRCC patients. The follow-up data were available in
285 patients with RCC and 219 patients with ccRCC. The loss of 20 ccRCC patients’ occurred
due to the loss of their contact information. Median follow-up was 43 (1-125) months.
Survival analysis was performed using the Kaplan-Meier method to estimate the
cumulative survival probability. The long-rank test was performed for the assessment of
differences in survival according to the different categories of variables.
The predictive value of different GST genotypes in overall mortality were assessed by
the Cox proportional hazard regression models, adjusted by covariates in three different
models: Model 1 was adjusted to age and gender, Model 2 to the covariates from Model 1 and
recognized risk factors for RCC development (pack-years for smoking, obesity, hypertension)
GSTA1, GSTM1, GSTP1 and GSTT1 polymorphisms in RCC
45
and Model 3 to the covariates from Model 2 and clinical characteristics of tumor (tumor type,
grade G, pT stage). Calculations were performed using the SPSS software version 17.0 (Chicago,
IL, USA). P value of ≤0.05 will considered to be statistically significant.
The association between GSTM1-1 and ASK1 with Cleaved Caspase-3 expression was
analyzed using Pearson’s or Spearman’s coefficient of linear correlation.
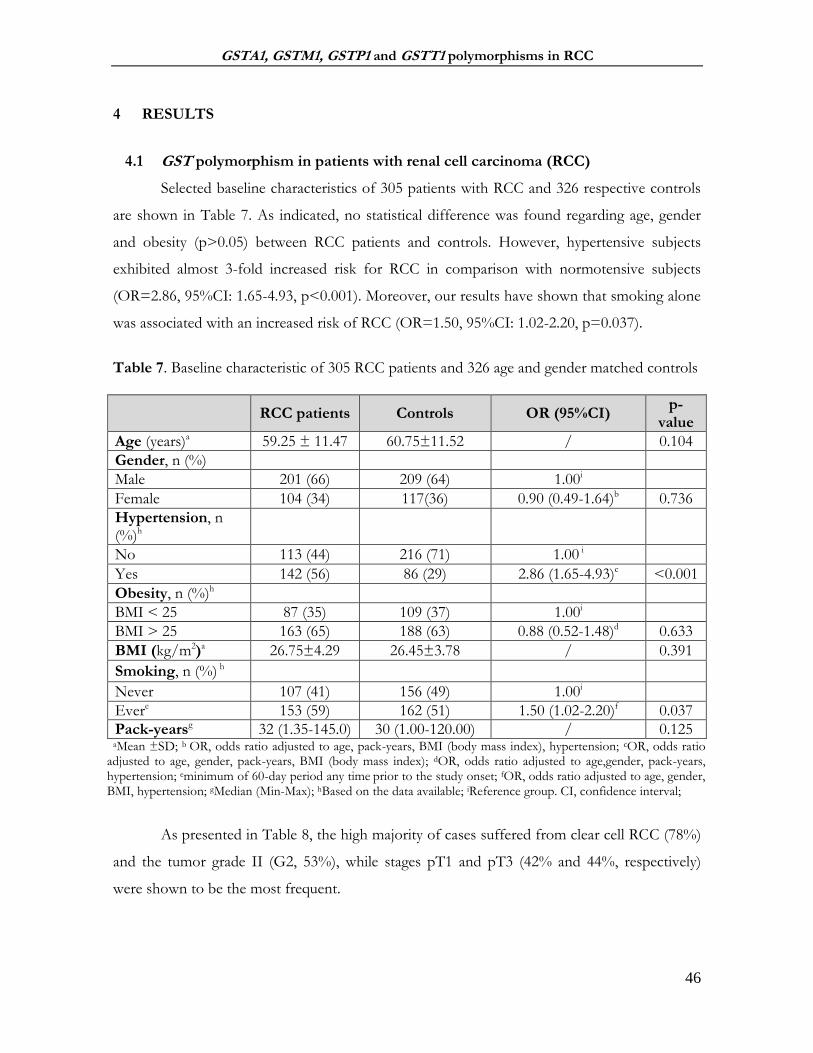
GSTA1, GSTM1, GSTP1 and GSTT1 polymorphisms in RCC
46
4 RESULTS
4.1 GST polymorphism in patients with renal cell carcinoma (RCC)
Selected baseline characteristics of 305 patients with RCC and 326 respective controls
are shown in Table 7. As indicated, no statistical difference was found regarding age, gender
and obesity (p>0.05) between RCC patients and controls. However, hypertensive subjects
exhibited almost 3-fold increased risk for RCC in comparison with normotensive subjects
(OR=2.86, 95%CI: 1.65-4.93, p<0.001). Moreover, our results have shown that smoking alone
was associated with an increased risk of RCC (OR=1.50, 95%CI: 1.02-2.20, p=0.037).
Table 7. Baseline characteristic of 305 RCC patients and 326 age and gender matched controls
RCC patients Controls OR (95%CI) p-
value
Age (years)a 59.25 ± 11.47 60.75±11.52 / 0.104
Gender, n (%)
Male 201 (66) 209 (64) 1.00i
Female 104 (34) 117(36) 0.90 (0.49-1.64)b 0.736
Hypertension, n (%)h
No 113 (44) 216 (71) 1.00 i
Yes 142 (56) 86 (29) 2.86 (1.65-4.93)c <0.001
Obesity, n (%)h
BMI < 25 87 (35) 109 (37) 1.00i
BMI > 25 163 (65) 188 (63) 0.88 (0.52-1.48)d 0.633
BMI (kg/m2)a 26.75±4.29 26.45±3.78 / 0.391
Smoking, n (%) h
Never 107 (41) 156 (49) 1.00i
Evere 153 (59) 162 (51) 1.50 (1.02-2.20)f 0.037
Pack-yearsg 32 (1.35-145.0) 30 (1.00-120.00) / 0.125 aMean ±SD; b OR, odds ratio adjusted to age, pack-years, BMI (body mass index), hypertension; cOR, odds ratio
adjusted to age, gender, pack-years, BMI (body mass index); dOR, odds ratio adjusted to age,gender, pack-years, hypertension; eminimum of 60-day period any time prior to the study onset; fOR, odds ratio adjusted to age, gender, BMI, hypertension; gMedian (Min-Max); hBased on the data available; iReference group. CI, confidence interval;
As presented in Table 8, the high majority of cases suffered from clear cell RCC (78%)
and the tumor grade II (G2, 53%), while stages pT1 and pT3 (42% and 44%, respectively)
were shown to be the most frequent.

GSTA1, GSTM1, GSTP1 and GSTT1 polymorphisms in RCC
47
Table 8. Clinical characteristics of patients’ tumor
Tumor type RCC patients, n (%)
Clear cell RCC 239 (78)
Papillary RCC 39 (13)
Chromophobe RCC 19 (6)
Collecting Duct RCC 5 (2)
Other 3 (1)
Tumor grade, n (%)a
Grade I, G1 33 (13)
Grade II, G2 139 (53)
Grade III, G3 77 (30)
Grade IV, G4 11 (4)
pT stage, n (%)b
pT1 120 (42)
pT2 35 (12)
pT3 127 (44)
pT4 7 (3) a,b Data available data on patients’ tumor grade and pT stage, depending on the type of surgery and pathohistology diagnostics;
4.1.1 The association of GST genotypes with RCC risk
As shown in Table 9, higher frequency of GSTM1-null carriers was observed in RCC
patients (55%) with an adjusted OR of 1.85 (95%CI: 1.10-3.09, p=0.020), indicating a
significant association of the GSTM1-null genotype with RCC risk. However, GSTT1-active and
GSTA1-CC (active) genotypes did not seem to enhance the risk for RCC (OR=0.99, 95%CI:
0.55-1.77, p=0.977 and OR=1.05, 95%CI: 0.61-1.79, p=0.865, respectively). By contrast,
GSTP1 IleVal+ValVal (variant) genotype was notably over-represented among cases (75%)
compared to controls (57%). Moreover, the risk of RCC was elevated (OR=3.86, 95%CI: 2.11-
7.05, p<0.001) among carriers of the GSTP1 IleVal+ValVal (variant) genotype compared to the
carriers of the GSTP IleIle (wild-type) genoype.

GSTA1, GSTM1, GSTP1 and GSTT1 polymorphisms in RCC
48
Table 9. GST genotypes in relation to the risk of RCC
aActive, if at least one active allele present; bNull if no active alleles present; cLow activity, if at least one T allele present. dVariant, if at least one Val allele present; eOR, odds ratio adjusted to age, gender, pack years, BMI, hypertension; CI, confidence interval; fReference group; Deletion GSTM1 and GSTT1 genotypes were investigated in 305 cases and all recruited controls. SNP polymorphism GSTA1*C69T and GSTP1*Ile105Val were analyzed in 305 and 301 RCC cases, respectively, and all recruited controls.
In order to test the effect of gene-gene interaction for all four GST genotypes, both
crude and adjusted odds ratio was calculated (Table 10). Interestingly, a significant association,
in terms of RCC risk, was found when the combined effect of GSTM1 and GSTP1 genotypes
was assessed alone (GSTM1-active/GSTP1 wild-type vs. GSTM1-null/GST-variant: adjusted
OR=9.41, 95%CI: 3.40-26.04, p<0.001) or together with other GST genotypes (GSTM1-
active/GSTA1-active/GSTP1 wild-type vs. GSTM1-null/GSTA1-low activity/GSTP1-variant,
adjusted OR=14.28, 95%CI: 2.82-72.54, p=0.001 or GSTM1-active/GSTT1-null/GSTP1 wild-
type vs. GSTM1-null/GSTT1-active/GSTP1-variant, adjusted OR=18.10, 95%CI: 1.75-186.66,
p=0.015). Ultimately, when all four GST genotypes were analyzed, the number of RCC
patients, carrying presumably “the risk-associated genotype” combination GSTM1-
null/GSTT1-active/GSTA1-low activity/GSTP1-variant (62 out of 305), prevailed over the number
of RCC patients with GSTM1-active/GSTT1-null/GSTA1-active/GSTP1wild type genotypes (1
out of 305). According to our results, patients with “the risk-associated genotype” combination
were at 15-fold higher risk for RCC development (crude OR=15.12, 95%CI: 1.86-122.64,
p=0.011; OR adjusted to age and gender 15.70, 95%CI: 1.91-128.58, p=0.010) compared to
the reference genotype.
GST genotype RCC patients n,
% Controls n, % OR (95%CI)e p- value
GSTM1
activea 136 (45) 163 (50) 1.00f
nullb 169 (55) 163 (50) 1.85 (1.10-3.09) 0.020
GSTT1
nullb 79 (26) 89 (27) 1.00f
activea 226 (74) 237 (73) 0.99 (0.55-1.77) 0.977
GSTA1 (rs 3957357)
CC (active) 94 (31) 134 (41) 1.00f
CT+TT (low activity)c 211 (69) 192(59) 1.05 (0.61-1.79) 0.865
GSTP1 (rs1695)
IleIle (wild-type) 74 (25) 141 (43) 1.00f
IleVal+ValVal (variant)d 227 (75) 185 (57) 3.86 (2.11-7.05) <0.001

GSTA1, GSTM1, GSTP1 and GSTT1 polymorphisms in RCC
49
Table 10. Combined effect of GST genotypes on risk of RCC
aActive, if at least one active allele present; bNull, if no active alleles present; cVariant, if at least one Val allele present; dLow activity, if at least one T allele present; eReference group; fOR odds ratio adjusted to age, gender, pack years, BMI, hypertension; gOR odds ratio adjusted to age and gender; CI, confidence interval;
Combined Genotype RCC patients,
n % Controls,
n% Crude OR (95%CI)
p-value
Adjusted OR (95%CI)
p-value
GSTM1/GSTP1 genotype `
GSTM1-activea/GSTP1-wild type 29 (19) 70 (43) 1.00 e 1.00 e
GSTM-nullb/GSTP1-variantc 122 (81) 92 (57) 3.20 (1.92-5.33) <0.001 9.41 (3.40-26.04) f <0.001
GSTM1/GSTA1/GSTP1 genotype
GSTM1-activea/GSTA1-active/GSTP1-wild type
11 (11) 36 (38) 1.00 e 1.00 e
GSTM-nullb/GSTA1-low activityd/GSTP1-variantc
87 (89) 59 (62) 4.82 (2.27-10.23) <0.001 14.28 (2.81-72.54) 0.001
GSTM1/GSTT1/GSTP1 genotype
GSTM1-activea/GSTT1-nullb/GSTP1-wild type
3 (3) 16 (19) 1.00 e 1.00 e
GSTM-nullb/GSTT1-active/GSTP1-variantc 90 (97) 67 (81) 7.16 (2.00-25.38) 0.002 18.10 (1.75-186.6) 0.015
GSTM1/GSTT1/GSTA1/GSTP1 genotype
GSTM1-activea/GSTT1-nullb/GSTA1-active/
GSTP1-wild type 1 (2) 10 (19) 1.00 e 1.00g
GSTM-nullb/GSTT1-activea/GSTA1-low activityd/ GSTP1-variantc
62 (98) 41 (81) 15.12 (1.86-122.6) 0.011 15.70 (1.91-128.5)g 0.010

GSTA1, GSTM1, GSTP1 and GSTT1 polymorphisms in RCC
50
Finally, we decided to test the cumulative effect of GST risk-associated genotypes (GSTM1-
null, GSTT1-active, GSTA1-low activity and GSTP1-variant) on the risk of RCC development. As
indicated in the Table 11, a trend in OR was observed (OR=4.52, 95%CI: 0.54-37.63, p=0.162 in
patients with one risk-associated genotype, OR=8.64, 95%CI: 1.08-68.92, p=0.042 in RCC patients
with 2 risk-associated genotypes, OR=10.70, 95%CI: 1.91-128.58, p=0.025 in patients with 3 risk-
associated genotypes), with the highest OR present in RCC patients with “the risk-associated
genotype” combination: GSTM1-null/GSTT1-active/GSTA1-low activity/GSTP1-variant (OR=15.70,
95%CI: 1.91-128.58, p=0.010).
Table 11. Cumulative effect of GST risk-associated genotypes on the risk of RCC development
0: Reference genotype combination (GSTM1-active/GSTT1-null/GSTA1 active/GSTP1-wild type); 1, 2, 3, 4: 1, 2, 3, 4: The number of the present risk-carrying genotypes: either one of each risk-carrying, or two of each risk-carrying, or three of each risk-carrying or all four risk-carrying GST genotypes (GSTM1-null or GSTT1-active or GSTA1 low-activity or GSTP1-variant); aOR odds ratio adjusted to age, gender; CI, confidence interval; bReference group;
4.1.2 The association between GST genotypes and the levels of 8-OHdG in RCC patients
Since oxidative stress might be implicated in the development of RCC, we determined the
levels of 8-OHdG (ng/ml) in RCC patients, stratified by the presence or absence of the recognized
risk factors for RCC development and analyzed them with respect to various GST genotypes (Tables
12-14). Although the obtained values were slightly higher in RCC patients with „risk-associated
genotypes“ compared to the values observed in RCC patients carrying genotypes not associated to
RCC risk, the results did not reach the statistical significance (p>0.05).
Number of risk-associated GST
genotypes
RCC patients n, %
Controls n, % OR (95%CI)a p- value
0 1 (1) 10 (3) 1.00b
1 22 (7) 50 (15) 4.52 (0.54-37.63) 0.162
2 94 (31) 112 (34) 8.64 (1.08-68.92) 0.042
3 122 (41) 113 (35) 10.70 (1.34-85.18) 0.025
4 62 (21) 41 (13) 15.70 (1.91-128.58) 0.010

GSTA1, GSTM1, GSTP1 and GSTT1 polymorphisms in RCC
51
Table 12. The association between GST genotypes and the levels of 8-OHdG (ng/ml) in RCC patients stratified according to the smoking status
aActive, if at least one active allele present; bNull if no active alleles present; cLow activity, if at least one T allele present. dVariant, if at least one Val allele present; eMean (Min-Max) values; fminimum of 60-day of smoking period any time prior to the study onset
Table 13. The association between GST genotypes and the levels of 8-OHdG (ng/ml) in RCC patients stratified according to the BMI category
aActive, if at least one active allele present; bNull if no active alleles present; cLow activity, if at least one T allele present. dVariant, if at least one Val allele present; eMean (Min-Max) values; fBody mass index above 25kg/m2
Genotype Smoking 8-OHdG (ng/ml) e
GSTM1 GSTM1-activea No 1.21 (0.49-3.72)
GSTM1-nullb Yesf 1.32 (0.52-4.92)
p-value 0.811
GSTT1 GSTT1-nullb No 1.36 (0.77-3.72)
GSTT1-activea Yesf 1.32 (0.52-3.14)
p-value 0.983
GSTA1 (rs 3957357)
GSTA1-active No 1.35 (0.39-4.92)
GSTA1-low activityc Yesf 1.36 (0.49-6.52)
p-value 0.892
GSTP1 (rs1695) GSTP1-wild type No 1.21 (0.69-2.24)
GSTP1-variantd Yesf 1.24 (0.39-3.98)
p-value 0.794
Genotype Obesity 8-OHdG (ng/ml) e
GSTM1 GSTM1-activea No 1.21 (0.49-2.51)
GSTM1-nullb Yesf 1.28 (0.52-2.81)
p-value 0.962
GSTT1 GSTT1-nullb No 1.14 (0.91-4.92)
GSTT1-activea Yesf 1.24 (0.52-3.14)
p-value 0.984
GSTA1 (rs 3957357)
GSTA1-active No 1.14 (0.49-6.51)
GSTA1-low activityc Yesf 1.28 (0.39-7.29)
p-value 0.345
GSTP1 (rs1695)
GSTP1-wild type No 1.21 (0.62-4.92)
GSTP1-variantd Yesf 1.24 (0.39-7.29)
p-value 0.982

GSTA1, GSTM1, GSTP1 and GSTT1 polymorphisms in RCC
52
Table 14. The association between GST genotypes and the levels of 8-OHdG (ng/ml) in RCC patients stratified according to the level of blood pressure
aActive, if at least one active allele present; bNull if no active alleles present; cLow activity, if at least one T allele present. dVariant, if at least one Val allele present; eMean (Min-Max) values
4.1.3 The association between GST genotypes and grade and stages of RCC
In order to discern whether the GST polymorphisms might affect the RCC tumor
progression, we assessed the association between GST polymorphisms and grade and stages of RCC
included in the study (Figures 21-24). The results concerning the GSTM1-null genotype showed
significant difference with respect to tumor grade (p=0.016). Namely, GSTM1-null genotype was the
most frequent in grade II tumors (G2, Figure 21A). Unfortunately, there was no statistical difference
found for GSTT1, GSTA1 and GSTP1 genotypes (Figure 21B and Figure 22).
Regarding the tumor stage, no association was observed between any of the analysed GST
genotypes and RCC stage (Figure 23 and Figure 24, p>0.05).
Genotype Hypertension 8-OHdG (ng/ml)e
GSTM1 GSTM1-activea No 1.21 (0.49-3.98)
GSTM1-nullb Yes 1.36 (0.52-2.81)
p-value 0.999
GSTT1 GSTT1-nullb No 1.43 (0.79-4.92)
GSTT1-activea Yes 1.44 (0.52-3.14)
p-value 0.498
GSTA1 (rs 3957357)
GSTA1-active No 1.08 (0.49-1.69)
GSTA1-low activityc Yes 1.24 (0.39-7.29)
p-value 0.342
GSTP1 (rs1695)
GSTP1-wild type No 0.94 (0.62-4.92)
GSTP1-variantd Yes 1.14 (0.39-7.29)
p-value 0.425

GSTA1, GSTM1, GSTP1 and GSTT1 polymorphisms in RCC
53
Figure 21. The frequency of GST deletional risk-associated genotypes in RCC patients stratified according to tumor grade: (A) GSTM1-null genotype; (B) GSTT1-active genotype
(A)
(B)

GSTA1, GSTM1, GSTP1 and GSTT1 polymorphisms in RCC
54
Figure 22. The frequency of GST SNP risk-associated genotypes in RCC patients stratified according to tumor grade: (A) GSTA1-low activity genotype; (B) GSTP1-variant genotype
(A)
(B)
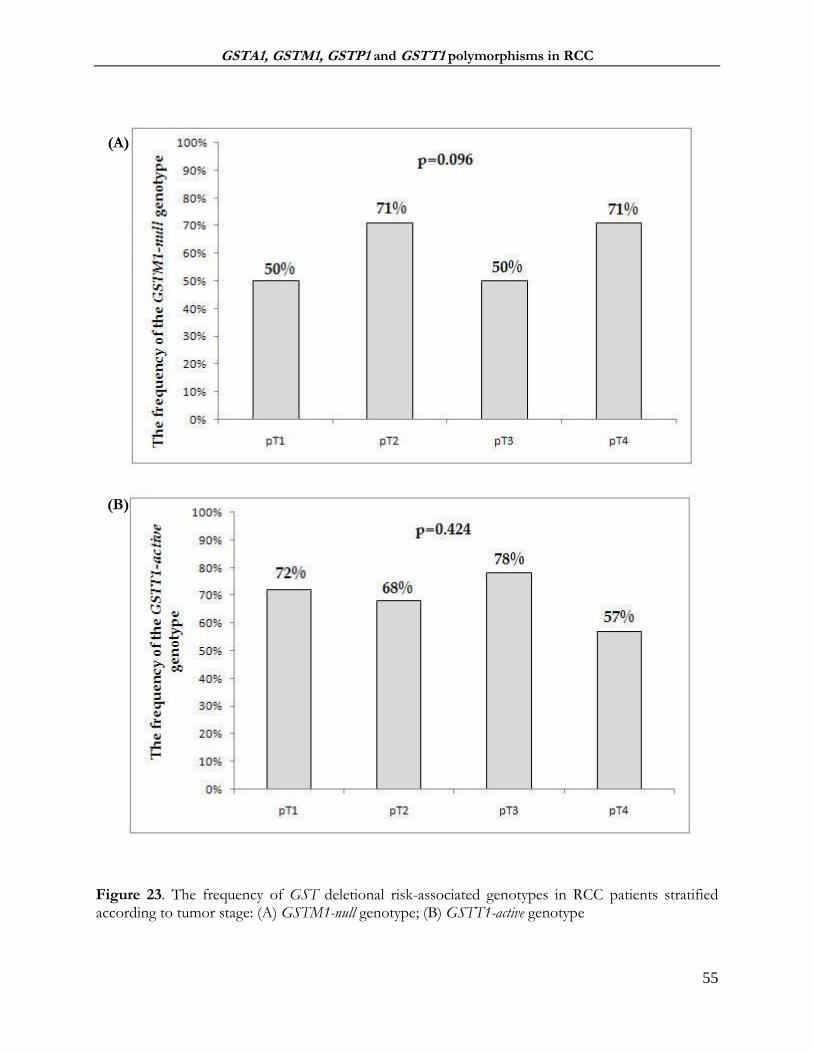
GSTA1, GSTM1, GSTP1 and GSTT1 polymorphisms in RCC
55
Figure 23. The frequency of GST deletional risk-associated genotypes in RCC patients stratified according to tumor stage: (A) GSTM1-null genotype; (B) GSTT1-active genotype
(A)
(B)

GSTA1, GSTM1, GSTP1 and GSTT1 polymorphisms in RCC
56
Figure 24. The frequency of GST SNP risk-associated genotypes in RCC patients stratified according to tumor stage: (A) GSTA1-low activity genotype; (B) GSTP1-variant genotype
(A)
(B)

GSTA1, GSTM1, GSTP1 and GSTT1 polymorphisms in RCC
57
4.1.4 The effect of GST genotypes on overall survival in RCC patients
In the group of 285 patients with RCC included in the follow-up, there were 85 (30%)
deaths during the mean follow-up of 46.64±28.13 months (ranging from 1-125) months.
In Table 15, the frequencies of GST genotypes in living and deceased RCC patients are
shown. Significantly higher frequency was observed only for the GSTM1-null genotype in living RCC
patients (60%) in comparison with the frequency of GSTM1-null genotype in deceased RCC patients
(45%, p=0.024). However, the obtain frequencies of other analyzed GST genotypes were not
statistically significant (p>0.05).
Kaplan-Meier survival analysis indicated shorter overall survival (Log Rank: p=0.021) only for
the patients with GSTM1-active genotype, compared to carriers of GSTM1-null genotype (Figure 25).
On the other hand, Kaplan-Meier analysis did not demonstrate a significantly shorter time towards the
death in patients carrying any other analyzed GST genotype (p>0.05, Figure 26-28).
Table 15. The frequency of the GST genotypes stratified according to the follow-up status
GST genotype Living patients
n, % Deceased
patients, n % p-value
GSTM1
activea 80 (40) 45 (55)
nullb 119 (60) 37 (45) 0.024
GSTT1
nullb 53 (27) 20 (25)
activea 146 (73) 62 (75) 0.697
GSTA1 (rs 3957357)
CC (active) 67 (33) 25 (30)
CT+TT (low activity)c 132 (67) 57 (70) 0.606
GSTP1 (rs1695)
IleIle (wild-type) 53 (27) 17 (21)
IleVal+ValVal (variant)d 143 (73) 65 (79) 0.269 aActive, if at least one active allele present; bNull if no active alleles present; cLow activity, if at least one T allele present. dVariant, if at least one Val allele present; Number of diseased patients n=85

GSTA1, GSTM1, GSTP1 and GSTT1 polymorphisms in RCC
58
Figure 25. Kaplan-Meier Survival Curves for overall mortality according to GSTM1 polymorphism; Active, if at least one active allele present; Null if no active alleles present Figure 26. Kaplan-Meier Survival Curves for overall mortality according to GSTT1 polymorphism; Active, if at least one active allele present; Null if no active alleles present
Survival Time (months)
120100806040200
Cum
ulat
ive
Surv
ival
1.0
0.8
0.6
0.4
0.2
0.0 Log Rank: p=0.021
GSTM1-null
GSTM1 -active
Survival Time (months)
120100806040200
Cum
ulat
ive
Surv
ival
1.0
0.8
0.6
0.4
0.2
0.0Log Rank: p=0.316
GSTT1 -null
GSTT1-active
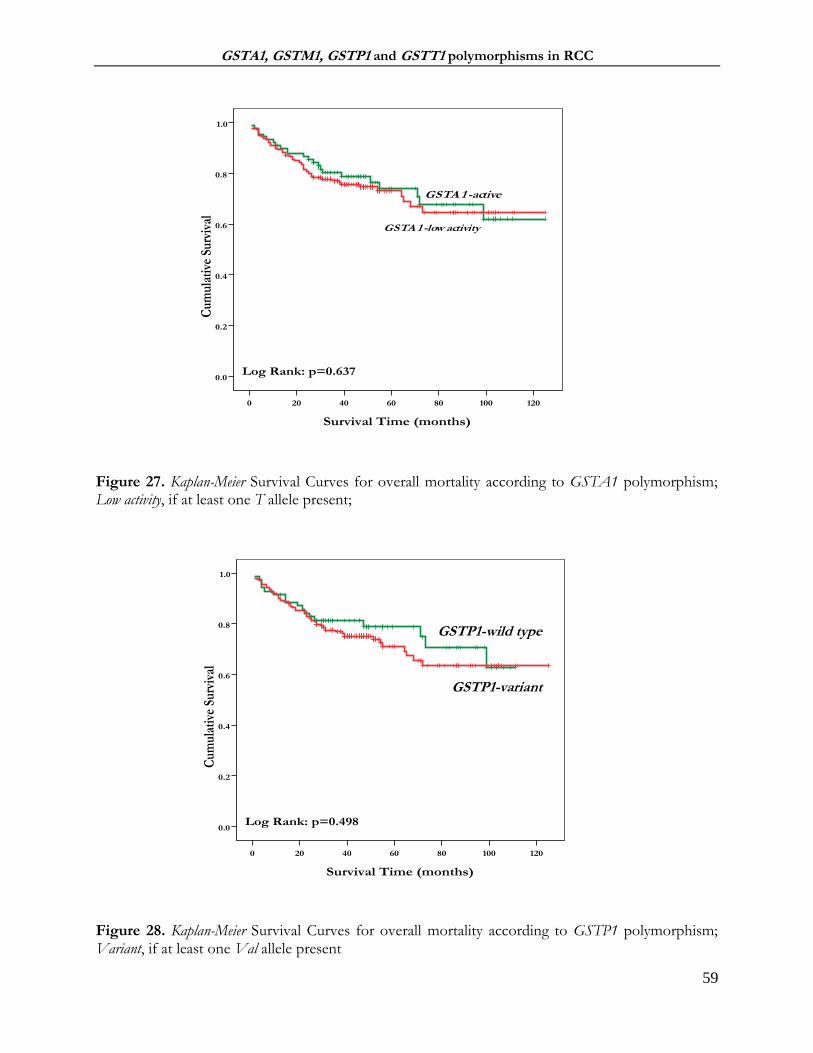
GSTA1, GSTM1, GSTP1 and GSTT1 polymorphisms in RCC
59
Figure 27. Kaplan-Meier Survival Curves for overall mortality according to GSTA1 polymorphism; Low activity, if at least one T allele present; Figure 28. Kaplan-Meier Survival Curves for overall mortality according to GSTP1 polymorphism;
Variant, if at least one Val allele present
Survival Time (months)
120100806040200
Cum
ulat
ive
Surv
ival
1.0
0.8
0.6
0.4
0.2
0.0Log Rank: p=0.637
GSTA 1 -active
GSTA 1 -low activity
Survival Time (months)
120100806040200
Cum
ulat
ive
Surv
ival
1.0
0.8
0.6
0.4
0.2
0.0Log Rank: p=0.498
GSTP1 -wild type
GSTP1-variant
GSTP1-wild type
GSTP1-variant

GSTA1, GSTM1, GSTP1 and GSTT1 polymorphisms in RCC
60
Tables 16-18 summarize the associations between different GST genotypes and overall
mortality, adjusted by covariates in three different models. According to our results of multivariate
Cox analysis, the GSTM1-active genotype was confirmed to be an independent predictor of higher
risk of overall mortality in RCC patients. Namely, this genotype had a significant multivariable
adjusted HR in all three models: in Model 1 HR=1.60 (95%CI: 1.00-2.56, p=0.047, Table 16), in
Model 2 HR=3.45 (95%CI: 1.61-7.42, p=0.001, Table 17) and in Model 3 HR=3.09 (95%CI: 1.19-
8.02, p=0.020, Table 18). A similar approach was used for analyzing the predictive value of other
GST genotypes, yet only GSTP1-variant demonstrated HR of 1.68 in Model 2 (95%CI: 0.55-5.14,
p=0.359, Table 17) and 1.70 in Model 3 (95%CI: 0.38-7.41; p=0.488, Table 18), without reaching
statistical significance.
Table 16. GST polymorphisms as predictors for overall mortality in RCC patients, Model 1
Model 1 adjusted to age and gender; aActive, if at least one active allele present;bNull, if no active alleles present; cLow activity, if at least one T allele present; dVariant, if at least one Val allele present; HR, hazard ratio; CI, confidence interval
Model 1
HR (95% CI) p-value
Risk for overall mortality comparing GSTM1-activea genotype to GSTM1-nullb genotype carriers
1.60 (1.00-2.56) 0.047
Risk for overall mortality comparing GSTT1-activea genotype to GSTT1-nullb genotype carriers
1.10 (0.62-1.97) 0.741
Risk for overall mortality comparing GSTA1-low activityc genotype to GSTA1-active genotype carriers
1.18 (0.72-1.95) 0.504
Risk for overall mortality comparing GSTP1-variantd genotype to GSTP1-wild type genotype carriers
1.23 (0.71-2.13) 0.447

GSTA1, GSTM1, GSTP1 and GSTT1 polymorphisms in RCC
61
Table 17. GST polymorphisms as predictors for overall mortality in RCC patients, Model 2
Model 2
HR (95% CI) p-value
Risk for overall mortality comparing GSTM1-activea genotype to GSTM1-nullb genotype carriers
3.45 (1.61-7.42) 0.001
Risk for overall mortality comparing GSTT1-activea genotype to GSTT1-nullb genotype carriers
0.75 (0.33-1.73) 0.511
Risk for overall mortality comparing GSTA1-low activityc genotype to GSTA1-active genotype carriers
1.03 (0.47-2.22) 0.940
Risk for overall mortality comparing GSTP1-variantd genotype to GSTP1-wild type genotype carriers
1.68 (0.55-5.14) 0.359 Model 2 adjusted to the covariates from Model 1 and recognized risk factors for RCC development (packyears, BMI, hypertension); aActive, if at least one active allele present; bNull, if no active alleles present; cLow activity, if at least one T allele present; dVariant, if at least one Val allele present; HR, hazard ratio; CI, confidence interval
Table 18. GST polymorphisms as predictors for overall mortality in RCC patients, Model 3
Model 3 adjusted to the covariates from Model 2 and clinical characteristics of tumor (tumor type, grade, pT stage); aActive, if at least one active allele present;bNull, if no active alleles present; cLow activity, if at least one T allele present; dVariant, if at least one Val allele present; HR, hazard ratio; CI, confidence interval
Model 3
HR (95% CI) p-value
Risk for overall mortality comparing GSTM1-activea genotype to GSTM1-nullb genotype carriers
3.09 (1.19-8.02) 0.020
Risk for overall mortality comparing GSTT1-activea genotype to GSTT1-nullb genotype carriers
0.97 (0.39-2.43) 0.961
Risk for overall mortality comparing GSTA1-low activityc genotype to GSTA1-active genotype carriers
0.91 (0.38-2.16) 0.839
Risk for overall mortality comparing GSTP1-variantd genotype to GSTP1-wild type genotype carriers
1.70 (0.37-7.38) 0.488

GSTA1, GSTM1, GSTP1 and GSTT1 polymorphisms in RCC
62
4.2 GST polymorphism in patients with clear cell renal cell carcinoma (ccRCC)
Since clear renal cell carcinoma (ccRCC) represents approximately 80% of all RCC and
seems to be the most aggressive RCC subtype, we further focused on the group of ccRCC patients
that were included in this study.
Baseline characteristics of patients with ccRCC and respective controls are shown in Table
19. As shown, ccRCC patients and controls did not differ in terms of age, gender, obesity and
smoking (p>0.05). However, more than half of the cases (52%) suffered from hypertension
compared to controls (26%).
Table 19. Baseline characteristic of 199 patients with ccRCC and 274 age and gender matched controls
Variable ccRCC patients Controls OR (95%CI) p-
value
Age (years)a 58.09 ± 11.51 59.77±10.96 / 0.113
Gender, n (%)
Male 133 (67) 184 (67) 1.00 (reference group)
Female 66 (33) 90 (33) 1.01 (0.68-1.49) 0.942
Hypertension, n (%)
No 75 (48) 191 (74) 1.00 (reference group)
Yes 82 (52) 67 (26) 3.07 (1.61-5.84)b 0.001
Obesity, n (%)
BMI below 25 63 (40) 92 (38) 1.00 (reference group)
BMI above 25 96 (60) 153 (62) 0.80 (0.43-1.46)c 0.478
BMI (kg/m2)a 26.41±4.49 26.36±3.49 / 0.893
Smoking, n (%)
Never 67 (41) 126 (48) 1.00 (reference group)
Everd 97 (59) 138 (52) 1.44 (0.90-2.29)e 0.125
Pack-yearsf 30 (1.35-141.00) 30 (0.10-88.00) / 0.242
Fuhrmangrade, n (%)
Grade I, G1 21 (13) / /
Grade II, G2 89 (55) / /
Grade III, G3 48 (29) / /
Grade IV, G4 5 (3) / /
pTstage, n (%)
pT1 78 (42) / /
pT2 23 (13) / /
pT3 78 (42) / /
pT4 5 (3) / / aMean ±SD; bOR, odds ratio adjusted to age, gender, pack-years, BMI (body mass index); cOR, odds ratio adjusted to age, gender, pack-years, hypertension; d Every day smoking during a minimum of 60-day period prior to the study onset; eOR, odds ratio adjusted to age, gender, BMI, hypertension; CI, confidence interval; fMedian (Min-Max).

GSTA1, GSTM1, GSTP1 and GSTT1 polymorphisms in RCC
63
4.2.1 The association of GST genotypes with ccRCC risk
The frequency of GSTM1-null genotype was higher (56%) in ccRCC patients than in controls
(50%) and individuals with GSTM1-null genotype were at 2.07-fold higher risk of ccRCC
development (95%CI: 1.11-3.84, p=0.021) (Table 20). On the other hand, no significant association
with ccRCC risk was found for GSTT1-active genotype (OR=1.08, 95%CI: 0.52-2.27, p=0.822).
Regarding SNP polymorphisms, the obtained results showed the lack of the GSTA1*C69T
polymorphism effect on ccRCC risk, since the carriers of GSTA1*CT+TT (low activity) genotype
were not at increased risk of ccRCC in comparison with individuals with GSTA1*CC (active)
genotype (OR=1.19, 95%CI: 0.63-2.25, p=0.580). Interestingly, carriers of GSTP1*IleVal+ValVal
(variant) genotype (77% of ccRCC patients compared to 58% of controls) were at 3.14-fold increased
risk of ccRCC (95%CI: 1.54-6.43, p<0.001) (Table 20).
Table 20. GST genotypes in relation to the risk of ccRCC
GST genotype ccRCC
patients n, %
Controls n, %
OR (95%CI)e p- value
GSTM1
Activea 87 (44) 137 (50) 1.00 (reference group)
Nullb 109 (56) 137 (50) 2.07 (1.11-3.84) 0.021
GSTT1
Nullb 44 (22) 71 (26) 1.00 (reference group)
Activea 152 (78) 203 (74) 1.08 (0.52-2.27) 0.822
GSTA1 (rs 3957357)
CC 65 (33) 112 (41) 1.00 (reference group)
CT+TT (low activity)c 132 (67) 162 (59) 1.19 (0.63-2.25) 0.580
GSTP1 (rs1695)
IleIle (wild-type) 44 (23) 115 (42) 1.00 (reference group)
IleVal+ValVal (variant)d 150 (77) 159 (58) 3.14 (1.54-6.43) <0.001 aActive, if at least one active allele present; bNull if no active alleles present; cLow activity, if at least one T allele present. dVariant, if at least one Val allele present; eOR, odds ratio adjusted to age, gender, pack-years, BMI, hypertension; CI, confidence interval
Combined effect on ccRCC risk was tested for all genotypes (Table 21). No significant
association, in terms of ccRCC risk, was established when the combined effect of any two of
GSTM1, GSTA1 and GSTT1 genotypes were assessed (p>0.05).

GSTA1, GSTM1, GSTP1 and GSTT1 polymorphisms in RCC
64
Table 21. Combined effect of GST genotypes on risk of ccRCC
aActive, if at least one active allele present. bNull, if no active alleles present. cLow activity, if at least one T allele present. dVariant, if at least one Val allele present; eOR, odds ratio adjusted to age, gender, pack-years, BMI, hypertension; CI, confidence interval; Ca, number of ccRCC patients; Co, controls; fReference group
GST genotypes GSTM1 GSTA1 GSTP1
Activea Nullb Activea Low-activityc Wild-type Variantd
GSTA1 (rs3957357)
Activea
Ca (%)/Co(%) 29(15)/54(20) 35(18)/58(21) - - - -
OR (95%CI)e 1.00f 2.14 (0.67-6.86) - -
p-value - 0.192 - - - -
Low-activityc
Ca/Co 58(30)/83(30) 73(37)/79(29) - - -
OR (95%CI)e 1.03 (0.41-2.61) 2.00 (0.79-5.07) - - - -
p-value 0.941 0.145 - - - -
GSTP1 (rs1695)
Wild-type
Ca (%)/Co(%) 17(9)/55(20) 27(14)/60(22) 17(9)/54(20) 26(13)/61(22) -
OR (95%CI)e 1.00f 5.63 (1.11-28.53) 1.00f 3.40 (0.72-16.00) - -
p-value - 0.032 - 0.127 - -
Variantd
Ca (%)/Co(%) 67(35)/82(30) 81(42)/77(28) 46(24)/58(21) 103 (54)/101(36) - -
OR (95%CI)e 4.40 (1.17-16.46) 11.23 (2.62-48.08) 5.39 (1.42-20.39) 4.93 (1.48-16.43) - -
p-value 0.026 <0.001 0.015 0.009 - -
GSTT1
Activea
Ca (%)/Co(%) 67(34)/102(37) 85(44)/101(36) 53(27)/82(30) 99(51)/121(44) 37(19)/85(31) 113(59)/118(43)
OR (95%CI)e 1.57 (0.49-5.01) 2.78 (0.80-9.64) 3.32 (0.72-15.22) 2.62(0.65-10.58) 2.47 (0.37-10.37) 4.10 (0.95-17.35)
p-value 0.435 0.103 0.128 0.175 0.348 0.052
Nullb
Ca (%)/Co(%) 20(10)/35(13) 24(12)/36(14) 11(6)/30(11) 32(16)/41(15) 7(4)/30(11) 35(18)/41(15)
OR (95%CI)e 1.00f 3.36 (0.77-14.66) 1.00f 3.57 (0.72-17.72) 1.00f 4.47 (0.72-27.43)
p-value - 0.101 - 0.113 - 0.105

GSTA1, GSTM1, GSTP1 and GSTT1 polymorphisms in RCC
65
On the other hand, a statistically significant association between GST polymorphism and
susceptibility to ccRCC was found when the effect of GSTP1-variant genotype was analyzed in
combination with the other three genotypes (GSTP1-variant and GSTM1-null OR=11.23, 95%CI:
2.62-48.08, p<0.001; GSTP1-variant and GSTA1low-activity OR=4.93, 95%CI: 1.48-16.43, p=0.009;
GSTP1-variant and GSTT1-active OR=4.10, 95%CI: 0.95-17.35, p=0.052).
The cumulative effect of the suggested “risk-associated” GST genotypes in RCC was
analyzed in patients with ccRCC, in comparison with the reference genotype combination (Table
22). Indeed, the obtained results were similar to results in the RCC group and showed a trend in OR
that was statistically significant only in the case of the previously termed “risk-associated genotype
combination” of all four GST genotypes. Namely, we found striking evidence in favor of increased
susceptibility to ccRCC in carriers of combined GSTM1-null, GSTT1-active, GSTA1 low-activity and
GSTP1-variant genotype. It is important to note that such individuals comprised 22% of all recruited
ccRCC patients, in comparison with 12% of control subjects, and exhibited 9.32-fold elevated risk
compared to carriers of combined GSTM1-active, GSTT1-null, GSTA1-active and GSTP1 wild-type
genotypes (95%CI: 1.08-80.18, p=0.041, Table 22).
Table 22. Cumulative effect of GST risk-associated genotypes on the risk of ccRCC development
0:Reference genotype combination (GSTM1-active/GSTT1-null/GSTA1 active/GSTP1-wild type); 1, 2, 3, 4: The number of “risk-associated genotypes”: either GSTM1-null,GSTT1-actie,GSTA1low-activity or GSTP1-variant; aOR odds ratio adjusted to age, gender; bReference group; CI, confidence interval;
4.2.2 Modifying effect on risk of ccRCC conferred by recognized risk factors for ccRCC
development
Results on the modifying effect on risk of ccRCC conferred by recognized risk factors for
ccRCC development are shown in Tables 23-25. As presented, significant modifying effect on risk
of ccRCC conferred by hypertension had individuals with either GSTM1-null, GSTT1-active, GSTA1
low-activity or GSTP1-variant genotype. Namely, they were at increased risk of ccRCC when compared
Number of “risk-associated GST genotypes”
RCC patients n, %
Controls n, % OR (95%CI)a p- value
0 1 (1) 7 (3) 1.00b
1 11 (6) 42 (15) 1.79 (0.19-16.18) 0.605
2 57 (30) 90 (33) 4.47 (0.53-37.51) 0.167
3 79 (41) 101 (37) 5.21 (0.62-43.48) 0.127
4 43 (22) 34 (12) 9.32 (1.08-80.18) 0.041

GSTA1, GSTM1, GSTP1 and GSTT1 polymorphisms in RCC
66
to the normotensive GSTM1-active, GSTT1-null, GSTA1-active or GSTP1 wild-type individuals
(OR=6.01, 95%CI: 2.48–14.52, p<0.001; OR=3.27, 95%CI: 1.20–8.91, p=0.020; OR=3.85, 95%CI:
1.54–9.58, p=0.004 and OR=8.29, 95%CI: 3.12–22.04, p<0.001 respectively, Table 23). Another
factor that contributed significantly to risk of ccRCC, only in carriers of GSTP1-variant genotype,
was smoking (OR=3.70, 95%CI: 1.75-7.83, p=0.001, Table 25).
Table 23. Modifying effect on risk of ccRCC development conferred by hypertension
aActive, if at least one active allele present; bNull, if no active alleles present; cLow activity, if at least one T allele present; dVariant, if at least one Val allele present; eOR, odds ratio adjusted to age, gender, pack-years, BMI; CI, confidence interval; fReference group
Table 24. Modifying effect on risk of ccRCC development conferred by obesity
aActive, if at least one active allele present; bNull, if no active alleles present; cLow activity, if at least one T allele present; dVariant, if at least one Val allele present; eOR, odds ratio adjusted to age, gender, pack-years, hypertension; CI, confidence interval; fReference group
Genotype vs Hypertension ccRCC patients
n, %
Controls n, %
OR (95%CI)e p-value
GSTM1 Activea/Normotensive 37 (44) 98 (72) 1.00f
Nullb/ Hypertensive 47 (56) 37 (28) 6.01 (2.48-14.52) <0.001
GSTT1 Nullb/Normotensive 57 (75) 141 (90) 1.00f
Activea/ Hypertensive 14 (10) 3.27 (1.20-8.91) 0.020
GSTA1 (rs3957357)
Activea/Normotensive 27 (33) 72 (66) 1.00f
Low activityc/ Hypertensive 56 (67) 36 (34) 3.85 (1.54-9.58) 0.004
GSTP1 (rs1695)
Wild-type/Normotensive 19 (22) 79 (68) 1.00f
Variantd/ Hypertensive 69 (78) 36 (32) 8.29 (3.12-22.04) <0.001
Genotype vs Obesity ccRCC patients
n, %
Controls n, %
OR (95%CI)e p-value
GSTM1 Activea/Non-obese 25 (35) 50 (37) 1.00f
Nullb/ Obese 47 (65) 84 (63) 1.78 (0.71-4.5) 0.212
GSTT1 Nullb/Non- obese 45 (38) 69 (38) 1.00f
Activea/ Obese 74 (62) 115 (62) 0.83 (0.26-2.26) 0.759
GSTA1 (rs3957357)
Activea/Non-obese 19 (23) 48 (32) 1.00f
Low activityc/Obese 62 (77) 103 (68) 1.39 (0.54-3.78) 0.518
GSTP1 (rs1695)
Wild-type/Non-obese 10 (12) 35 (28) 1.00f
Variantd/Obese 74 (88) 89 (72) 2.21 (0.79-6.13) 0.125

GSTA1, GSTM1, GSTP1 and GSTT1 polymorphisms in RCC
67
Table 25. Modifying effect on risk of ccRCC development conferred by smoking
aActive, if at least one active allele present; bNull, if no active alleles present; cLow activity, if at least one T allele present; dVariant, if at least one Val allele present; eOR, odds ratio adjusted to age, gender, BMI, hypertension; CI, confidence interval; fReference group
4.2.3 GST genotypes and ccRCC risk in smokers
Further on, we focused on the population of smokers with ccRCC (Table 26 and Table 27).
Significant association between GST genotype and the risk of ccRCC in smokers was found only for
the GSTP1 genotype. Namely, smokers with GSTP1-variant genotype were at 2.87-fold higher risk of
developing ccRCC (OR=2.87, 95%CI: 1.45-5.69, p=0.002, Table 26) than smokers carrying GSTP1-
wild type genotype. Although GSTM1-null genotype did not, at least independently, significantly affect
the risk of ccRCC in smokers (OR=1.71, 95%CI: 0.95-3.06, p=0.072, Table 27), when present in
combination with GSTP1-variant genotype, it contributed in a way that smokers with GSTM1-
null/GSTP1-variant genotype exhibited 5.4–fold increased risk of ccRCC (95%CI: 1.74-16.98,
p=0.004, Table 27) in comparison with carriers of GSTM1-active/GSTP1-wild type genotype. In this
manner, we confirmed the results obtained on the whole study population. The observed effect of
combined GSTM1-null/GSTP1-variant genotype on ccRCC risk was even more pronounced when
GSTA1 low-activity genotype was included. Namely, GSTM1-null/GSTP1-variant/GSTA1-low activity
combination of genotypes, which was present in 94% of smokers with ccRCC, as opposed to 70%
in controls, increased the risk of ccRCC up to 7.57 (95%CI: 1.26-45.30, p=0.026, Table 27).
Genotype vs Smoking status ccRCC
patients n, %
Controls n, %
OR (95%CI)e p-value
GSTM1
Activea/Non-smoker
37 (29) 50 (47) 1.00f
Nullb/Smoker 57 (71) 58 (53) 1.39 (0.63-2.34) 0.553
GSTT1 Nullb/Non-smoker 15 (17) 36 (25) 1.00f
Activea/Smoker 71 (83) 108 (75) 1.75 (0.82-3.75) 0.144
GSTA1 (rs3957357)
Activea/Non-smoker
25 (27) 61 (40) 1.00f
Low-activityc/Smoker
67 (73) 92 (60) 1.65 (0.87-3.13) 0.122
GSTP1 (rs1695)
Wild-type/Non-smoker
16 (17) 57 (42) 1.00f
Variantd/Smoker 77 (83) 85 (58) 3.70 (1.75-7.83) 0.001

GSTA1, GSTM1, GSTP1 and GSTT1 polymorphisms in RCC
68
Table 26. The association between individual GST genotypes and the levels of BPDE-DNA adducts in ccRCC smokers
aActive, if at least one active allele present; bNull, if no active alleles present; cLow activity, if at least one T allele present; dVariant, if at least one Val allele present; eOR odds ratio adjusted to age, gender, BMI, hypertension; CI, confidence interval; fReference group; gMedian (min-max);
The levels of BPDE-DNA adducts were initially compared between non-smokers (2.19
ng/ml (1.39-8.67)) and smokers (2.50 ng/ml (1.39-17.93)) with ccRCC, however, no statistical
significance was reached (p=0.402). In an attempt to discern whether phenotype changes reflect
genotype-associated risk of ccRCC, comparative analysis of BPDE-DNA adduct levels in ccRCC
smokers who were carriers of active/wild-type versus null/low-activity/variant genotype, individually or
in combination, was performed (Table 26 and Table 27). These results have shown that smokers
with GSTM1-null genotype had significantly higher concentration of BPDE-DNA adducts (2.74
ng/ml (1.64-17.93)) in comparison with GSTM1-active smokers (2.13ng/ml (1,39 – 5.22), p=0.050,
Table 26).
GST genotypes in smokers
ccRCC smokers n,%
Controls smokers
n,% OR (95%CI)e
p-value
BPDE-DNA adducts in
ccRCC smokers (ng/ml)g
p-valu
e
GSTM1
Activea 37 (39) 80 (58) 1.00f 2.13 (1.39-5.22)
Nullb 57 (61) 58 (42) 1.71 (0.95-3.06) 0.072 2.74 (1.64-17.93) 0.050
GSTT1
Nulla 23 (24) 30 (22) 1.00f 2.81 (1.51-8.55)
Activeb 71 (76) 108 (78) 1.07 (0.53-2.15) 0.849 2.37 (1.39-17.93) 0.324
GSTA1 (rs3957357)
Active 23 (25) 46 (33) 1.00f 2.50 (1.39-8.55)
Low-activityc 67 (75) 92 (67) 1.21 (0.65-2.25) 0.537 2.50 (1.39-17.93) 0.612
GSTP1 (rs1695)
Wild-type 16 (17) 53 (38) 1.00f 2.50 (1.76-6.95)
Variantd 77 (83) 85 (62) 2.87 (1.45-5.69) 0.002 2.44 (1.39-17.39) 0.655

GSTA1, GSTM1, GSTP1 and GSTT1 polymorphisms in RCC
69
Table 27. The association between combined GST genotypes and the levels of BPDE-DNA adducts in ccRCC smokers
aActive, if at least one active allele present; bNull, if no active alleles present; cLow activity, if at least one T allele present; dVariant, if at least one Val allele present; eOR odds ratio adjusted to age, gender, BMI, hypertension; CI, confidence interval; fReference group; gMedian (Min-Max)
4.2.4 The association between GST genotypes and tumor grade and stages of ccRCC
The analysis of GST polymorphisms as potential prognostic marker of ccRCC was
performed as presented in Figures 29-32. Once again, the results concerning the GSTM1-null
genotype showed significant difference with respect the tumors grade (Figure 29A, p=0.045).
Namely, GSTM1-null genotype was again found to be the most frequent in grade II tumors (G2).
Similarly to the results of obtained on the whole group of RCC patients, there were no statistical
difference found for other analyzed GST genotypes (Figures 30-32).
Regarding the tumor stage, no association between GST polymorphisms and ccRCC stage
was observed.
GST genotypes in smokers
ccRCC smokers
n,%
Controlssmokers
n,% OR (95%CI)e
p-value
BPDE-DNA adducts in
ccRCC smokers (ng/ml)g
p-value
GSTM1/ GSTP1
GSTM1-activea/ GSTP1 wild-type 5 (10) 27 (46) 1.00f 2.00 (1.76-2.75)
GSTM1-nullb/ GSTP1-variantd 45 (90) 32 (54) 5.44 (1.74-16.98) 0.004 2.50 (1.64-17.93) 0.347
GSTM1/GSTA1/GSTP1
GSTM1-activea/ GSTA1-active/
GSTP1 wild-typed 2 (6) 10 (30) 1.00f 2.37 (2.01-2.75)
GSTM1 nullb / GSTA1-low activityc/
GSTP1-variantd 32 (94) 23 (70) 7.57 (1.26-45.30) 0.026 2.44 (1.64-17.93) 0.813

GSTA1, GSTM1, GSTP1 and GSTT1 polymorphisms in RCC
70
Figure 29. The frequency of GST deletional risk-associated genotypes in ccRCC patients stratified according to tumor grade: (A) GSTM1-null genotype; (B) GSTT1-active genotype
(A)
(B)

GSTA1, GSTM1, GSTP1 and GSTT1 polymorphisms in RCC
71
Figure 30. The frequency of GST SNP risk-associated genotypes in ccRCC patients stratified according to tumor grade: (A) GSTA1-low activity genotype; (B) GSTP1-variant genotype
(A)
(B)

GSTA1, GSTM1, GSTP1 and GSTT1 polymorphisms in RCC
72
Figure 31. The frequency of GST deletional risk-associated genotypes in ccRCC patients stratified according to tumor stage: (A) GSTM1-null genotype; (B) GSTT1-active genotype
(A)
(B)

GSTA1, GSTM1, GSTP1 and GSTT1 polymorphisms in RCC
73
Figure 32. The frequency of GST SNP risk-associated genotypes in ccRCC patients stratified according to tumor stage: (A) GSTA1-low activity genotype; (B) GSTP1-variant genotype;
(A)
(B)

GSTA1, GSTM1, GSTP1 and GSTT1 polymorphisms in RCC
74
4.2.5 The effect of GST genotypes on overall survival in ccRCC patients
In the group of 219 patients with ccRCC that were included in the follow-up, there were 60
(27%) deaths during the mean follow-up of 48.09±0.9 (ranging from 1-125) months.
In Table 28, the frequencies of GST genotypes in living and deceased in patients with ccRCC
are shown. Significantly higher frequency was observed only for the GSTM1-null genotype in living
ccRCC patients (60%) in comparison with the frequency of GSTM1-null genotype in deceased
ccRCC patients (42%, p=0.016). However, the obtain frequencies of other analyzed GST genotypes
were not statistically significant (p>0.05, Table 28).
Table 28. The frequency of the GST genotypes stratified according to the follow-up status
aActive, if at least one active allele present; bNull if no active alleles present; cLow activity, if at least one T allele present. dVariant, if at least one Val allele present; Number of diseased patients n=60
In a similar way to the whole group included in the study, Kaplan-Meier survival analysis indicated
shorter overall survival (Log Rank: p=0.026) only for the patients with GSTM1-active genotype,
compared to ccRCC carriers of GSTM1-null genotype (Figure 33). On the other hand, Kaplan-Meier
analysis did not demonstrate a significantly shorter time towards the death in ccRCC patients
carrying any other analyzed GST genotype (p>0.05, Figures 34-36).
GST genotype Living patients
n, % Diseased
patients, n % p-value
GSTM1
activea 64 (40) 35 (58)
nullb 95 (60) 25 (42) 0.016
GSTT1
nullb 41 (25) 13 (22)
activea 118 (75) 47 (78) 0.528
GSTA1 (rs 3957357)
CC (active) 57 (36) 19 (32)
CT+TT (low activity)c 102 (64) 41 (68) 0.562
GSTP1 (rs1695)
IleIle (wild-type) 43 (27) 12 (20)
IleVal+ValVal (variant)d 114 (73) 48 (80) 0.263

GSTA1, GSTM1, GSTP1 and GSTT1 polymorphisms in RCC
75
Figure 33. Kaplan-Meier Survival Curves for overall mortality in ccRCC patients according to GSTM1 polymorphism; Active, if at least one active allele present; Null if no active alleles present
Figure 34. Kaplan-Meier Survival Curves for overall mortality ccRCC patients according to GSTT1 polymorphism; Active, if at least one active allele present; Null if no active alleles present
Survival Time (months)
120100806040200
Cum
ulat
ive
Surv
ival
1.0
0.8
0.6
0.4
0.2
0.0Log Rank: p=0.026
GSTM1-null
GSTM1 -active
Survival Time (months)
120100806040200
Cum
ulat
ive
Surv
ival
1.0
0.8
0.6
0.4
0.2
0.0Log Rank: p=0.203
GSTT1-null
GSTT1-active

GSTA1, GSTM1, GSTP1 and GSTT1 polymorphisms in RCC
76
Figure 35. Kaplan-Meier Survival Curves for overall mortality ccRCC patients according to GSTA1 polymorphism; Low activity, if at least one T allele present Figure 36. Kaplan-Meier Survival Curves for overall mortality ccRCC patients according to GSTP1 polymorphism; Variant, if at least one Val allele present.
Survival Time (months)
120100806040200
Cum
ulat
ive
Surv
ival
1.0
0.8
0.6
0.4
0.2
0.0Log Rank: p=0.780
GSTA 1 -active
GSTA 1 -low activity
Survival Time (months)
120100806040200
Cum
ulat
ive
Surv
ival
1.0
0.8
0.6
0.4
0.2
0.0Log Rank: p=0.468
GSTP1 -wild type
GSTP1-variant
GSTP1-wild type
GSTP1-variant
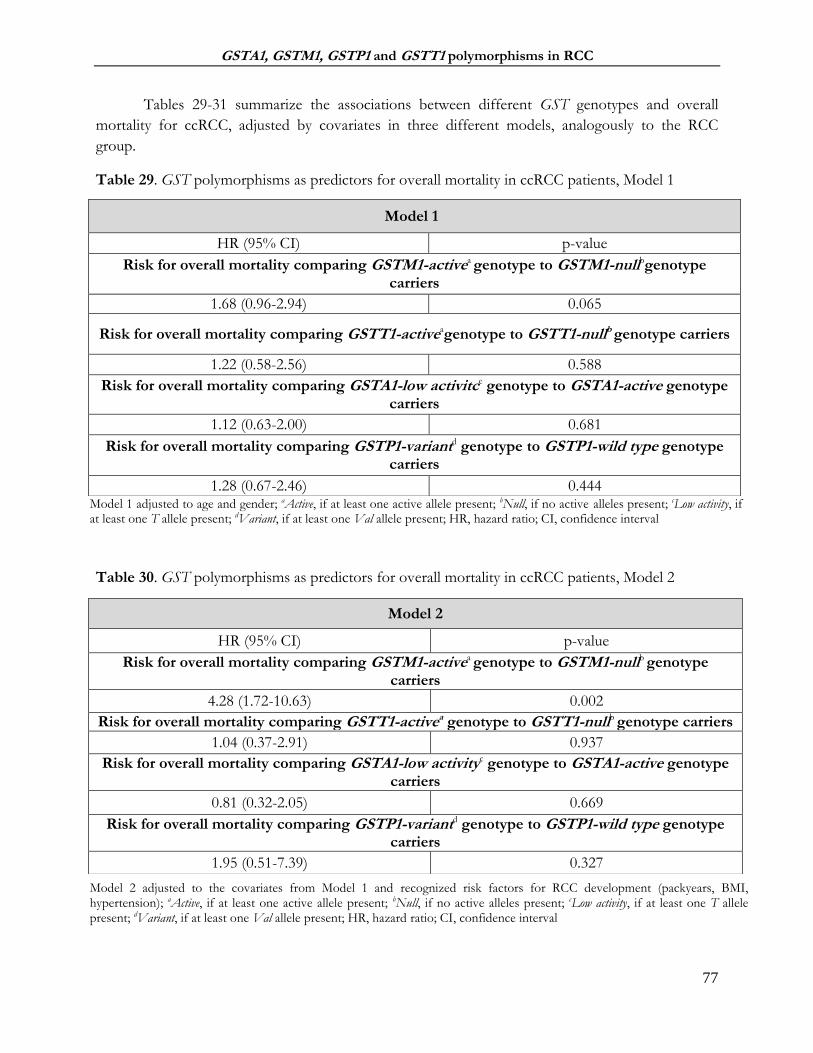
GSTA1, GSTM1, GSTP1 and GSTT1 polymorphisms in RCC
77
Tables 29-31 summarize the associations between different GST genotypes and overall
mortality for ccRCC, adjusted by covariates in three different models, analogously to the RCC
group.
Table 29. GST polymorphisms as predictors for overall mortality in ccRCC patients, Model 1
Model 1 adjusted to age and gender; aActive, if at least one active allele present; bNull, if no active alleles present; cLow activity, if at least one T allele present; dVariant, if at least one Val allele present; HR, hazard ratio; CI, confidence interval
Table 30. GST polymorphisms as predictors for overall mortality in ccRCC patients, Model 2
Model 2 adjusted to the covariates from Model 1 and recognized risk factors for RCC development (packyears, BMI, hypertension); aActive, if at least one active allele present; bNull, if no active alleles present; cLow activity, if at least one T allele present; dVariant, if at least one Val allele present; HR, hazard ratio; CI, confidence interval
Model 1
HR (95% CI) p-value
Risk for overall mortality comparing GSTM1-activea genotype to GSTM1-nullbgenotype carriers
1.68 (0.96-2.94) 0.065
Risk for overall mortality comparing GSTT1-activeagenotype to GSTT1-nullb genotype carriers
1.22 (0.58-2.56) 0.588
Risk for overall mortality comparing GSTA1-low activitce genotype to GSTA1-active genotype carriers
1.12 (0.63-2.00) 0.681
Risk for overall mortality comparing GSTP1-variantd genotype to GSTP1-wild type genotype carriers
1.28 (0.67-2.46) 0.444
Model 2
HR (95% CI) p-value
Risk for overall mortality comparing GSTM1-activea genotype to GSTM1-nullb genotype carriers
4.28 (1.72-10.63) 0.002
Risk for overall mortality comparing GSTT1-activea genotype to GSTT1-nullb genotype carriers
1.04 (0.37-2.91) 0.937
Risk for overall mortality comparing GSTA1-low activityc genotype to GSTA1-active genotype carriers
0.81 (0.32-2.05) 0.669
Risk for overall mortality comparing GSTP1-variantd genotype to GSTP1-wild type genotype carriers
1.95 (0.51-7.39) 0.327

GSTA1, GSTM1, GSTP1 and GSTT1 polymorphisms in RCC
78
Table 31. GST polymorphisms as predictors for overall mortality in ccRCC patients, Model 3
Model 3 adjusted to the covariates from Model 2 and clinical characteristics of tumor (grade, pT stage); aActive, if at least one active allele present; bNull, if no active alleles present; cLow activity, if at least one T allele present; dVariant, if at least one Val allele present; HR, hazard ratio; CI, confidence interval
We managed to confirm the results obtained on the whole group included in the study, as
the GSTM1-active genotype was proved to be an independent predictor of higher risk of overall
mortality in ccRCC patients as well. Namely, this genotype had a significant multivariable adjusted
HR in Model 2 HR=4.2 (95%CI: 1.72-10.63, p=0.002, Table 30) and in Model 3 HR=5.93 (95%CI:
1.64-21.50, p=0.007, Table 31). A similar approach was used for analyzing the predictive value of
other GST genotypes, however, the results did not reach statistical significance although 2-fold
higher HR was observed for GSTP1-varinat genotype in Model 2 (HR=1.95, 95%CI: 0.51-7.39,
p=0.327, Table 30) and Model 3 (HR=1.85, 95%CI: 0.32-10.61, p=0.487, Table 31).
Model 3
HR (95% CI) p-value
Risk for overall mortality comparing GSTM1-activea genotype to GSTM1-nullb genotype carriers
5.93 (1.64-21.50) 0.007
Risk for overall mortality comparing GSTT1-activeagenotype to GSTT1-nullb genotype carriers
1.30 (0.41-4.07) 0.644
Risk for overall mortality comparing GSTA1-low activityc genotype to GSTA1-active genotype carriers
0.67 (0.24-4.81) 0.432
Risk for overall mortality comparing GSTP1-variantd genotype to GSTP1-wild type genotype carriers
1.85 (0.32-10.61) 0.487

GSTA1, GSTM1, GSTP1 and GSTT1 polymorphisms in RCC
79
4.3 GSTM1 and GSTP1 protein expression in pools of non-tumor kidney tissue samples
and ccRCC tissue samples
After the fact that the GSTM1 and GSTP1 variants have conferred a significant risk towards
RCC development, GSTM1 and GSTP1 protein expression was determined in pools of non-tumor
kidney tissue samples and ccRCC tissue samples, with respect to tumor grade.
GSTM1 protein has been shown to carry out regulatory functions in terms of cell survival
and/or ASK1-dependent apoptotic cell death, depending on the strength and duration of the cell
stress. Owning to the fact that GSTM1 deletion polymorphisms is found in 50% of White
population, cytosols - obtained from pools of non-tumor kidney tissue samples and RCC tissue
samples, were subdivided according to the GSTM1 genotype, for the purpose of the determination
of the ASK1 and Cleaved Caspase-3 protein expression. The following immnoblot analysis has
confirmed the absence of GSTM1 protein in samples of GSTM1-null individuals and, vicevrsa, the
presence of GSTM1 protein in GSTM1-active individuals (Figure 37). Furthermore, the densitometry
analysis has shown the change in GSTM1 expression with ccRCC grade advancement. Namely, a
significantly lower expression of the GSTM1 protein was found across ccRCC tumor grades in
comparison with non-tumor kidney tissue pools (p<0.001, Figure 37B).
**
**
**
Figure 37. Expression of GSTM1 protein (26kDa) in pool of non-tumor kidney tissue samples, as well as in ccRCC tissue samples (G1-G3) according to GSTM1 genotype; N- GSTM1-null genotype; A-GSTM1-active genotype; G1- tumor grade I; G2- tumor grade II; G3- tumor grade III
Non-tumor tissue pool G1 G2 G3
N A N A N A N A
GSTM1 -26kDa (A)
(B)
p<0.001
**
** **

GSTA1, GSTM1, GSTP1 and GSTT1 polymorphisms in RCC
80
Sevelral studies have demonstrated that GSTP differential expression in tumor tissue seems
to correlate with the tumor grade and heightened drug resistance. Since RCC is known for its
chemotherapy and radiotherapy resistance, we determined the GSTP1 protein expression in pools of
non-tumor kidney tissue samples, as well as in ccRCC tissue samples, irrespective of the GSTP1
genotype (Figure 38). In this case, no statistical difference was found for GSTP1 protein levels in
ccRCC tissue samples (p>0.05). However, a trend was observed indicating the gradual increase of
GSTP1 protein expression across tumor grade (Figure 38B). No statistical significance in terms of
GSTP1 protein level has been found between the pools of non-tumor kidney tissue samples and
ccRCC tissue samples (Figure 38B, p>0.05).
4.4 Expression of regulatory apoptotic moleculs (ASK1 and JNK1/2) in pools of non-
tumor kidney tissue samples and ccRCC tissue samples
Several lines of evidence suggest that monomeric forms of GSTM1 and GSTP1 proteins
seem to negatively regulate aforementioned kinase-dependent proliferation pathways, by forming
protein:protein complexes with regulatory MAP kinases, such as ASK1 and JNK1, respectively.
Therefore, we further investigated the exspresion of ASK1 and JNK1/2 in obtained pools of non-
tumor kidney tissue samples and ccRCC tissue samples.
Figure 38. Expression of GSTP1 (23kDa) protein in pool of non-tumor kidney tissue samples, as well as in ccRCC tissue samples (G1-G3); G1- tumor grade I; G2- tumor grade II; G3- tumor grade III
G1 G2 G3 Non-tumor tissue pool
GSTP1 -23kDa (A)
(B)
p>0.05
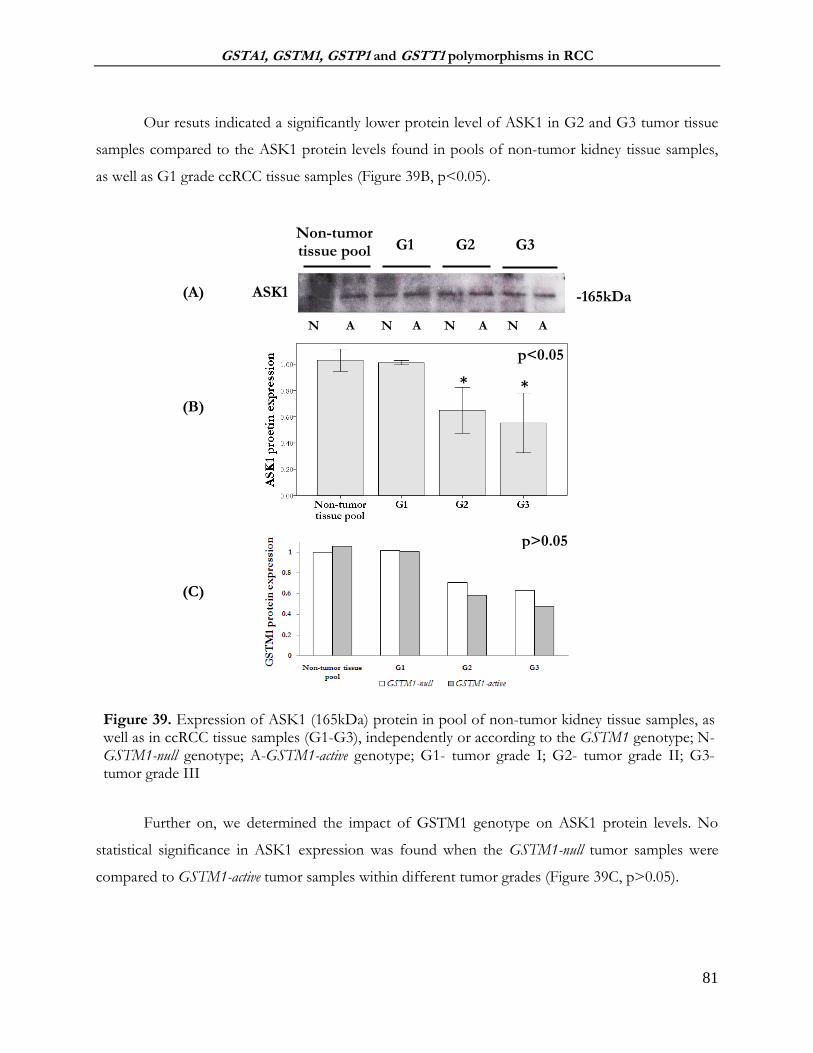
GSTA1, GSTM1, GSTP1 and GSTT1 polymorphisms in RCC
81
Our resuts indicated a significantly lower protein level of ASK1 in G2 and G3 tumor tissue
samples compared to the ASK1 protein levels found in pools of non-tumor kidney tissue samples,
as well as G1 grade ccRCC tissue samples (Figure 39B, p<0.05).
Further on, we determined the impact of GSTM1 genotype on ASK1 protein levels. No
statistical significance in ASK1 expression was found when the GSTM1-null tumor samples were
compared to GSTM1-active tumor samples within different tumor grades (Figure 39C, p>0.05).
Figure 39. Expression of ASK1 (165kDa) protein in pool of non-tumor kidney tissue samples, as well as in ccRCC tissue samples (G1-G3), independently or according to the GSTM1 genotype; N- GSTM1-null genotype; A-GSTM1-active genotype; G1- tumor grade I; G2- tumor grade II; G3- tumor grade III
* *
N A N A N A N A
Non-tumor tissue pool G1 G2 G3
ASK1 -165kDa
p>0.05
(A)
(B)
(C)
p<0.05
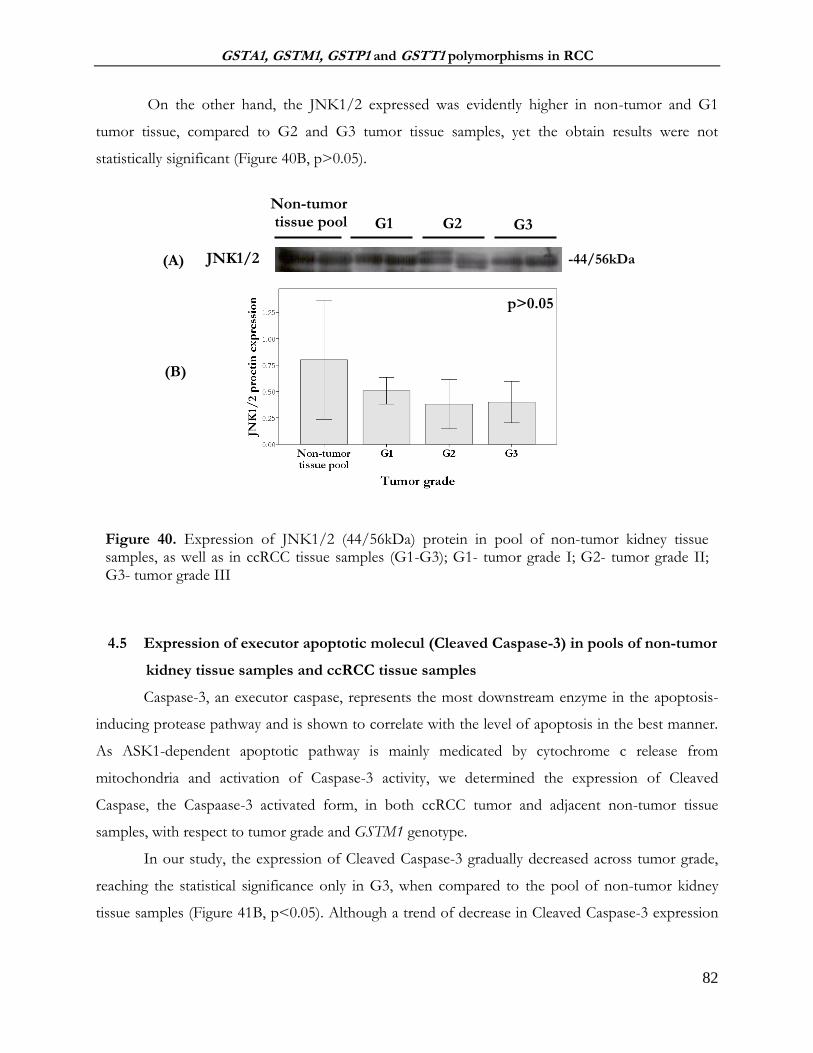
GSTA1, GSTM1, GSTP1 and GSTT1 polymorphisms in RCC
82
On the other hand, the JNK1/2 expressed was evidently higher in non-tumor and G1
tumor tissue, compared to G2 and G3 tumor tissue samples, yet the obtain results were not
statistically significant (Figure 40B, p>0.05).
4.5 Expression of executor apoptotic molecul (Cleaved Caspase-3) in pools of non-tumor
kidney tissue samples and ccRCC tissue samples
Caspase-3, an executor caspase, represents the most downstream enzyme in the apoptosis-
inducing protease pathway and is shown to correlate with the level of apoptosis in the best manner.
As ASK1-dependent apoptotic pathway is mainly medicated by cytochrome c release from
mitochondria and activation of Caspase-3 activity, we determined the expression of Cleaved
Caspase, the Caspaase-3 activated form, in both ccRCC tumor and adjacent non-tumor tissue
samples, with respect to tumor grade and GSTM1 genotype.
In our study, the expression of Cleaved Caspase-3 gradually decreased across tumor grade,
reaching the statistical significance only in G3, when compared to the pool of non-tumor kidney
tissue samples (Figure 41B, p<0.05). Although a trend of decrease in Cleaved Caspase-3 expression
Figure 40. Expression of JNK1/2 (44/56kDa) protein in pool of non-tumor kidney tissue samples, as well as in ccRCC tissue samples (G1-G3); G1- tumor grade I; G2- tumor grade II; G3- tumor grade III
Non-tumor tissue pool G1 G2 G3
-44/56kDa JNK1/2 (A)
(B)
p>0.05

GSTA1, GSTM1, GSTP1 and GSTT1 polymorphisms in RCC
83
was evident across tumor grades and the protein level was obviously lower in GSTM1-active
individuals, the results were not statistically significant (Figure 41C, p>0.05).
4.6 Correlation between GSTM1/GSTP1 and regulatory (ASK1) and executor (Cleaved
Caspase-3) apoptotic molecules
A strong positive correlation (correlation coefficient, r>0.5) was found GSTM1 and Cleaved
Caspase-3 expression (r=0.81, p=0.014), as well as ASK1 and Cleaved Caspase-3 expression (r=0.93,
p=0.001). On the other hand, weak positive correlation (correlation coefficient, r<0.3) was found
between GSTP1 and Cleaved Caspase-3 expression (r=0.024, p=0.999) (Table 32).
** **
p>0.05
Figure 41. Expression of Cleaved Caspase-3 (19/17kDa) protein in pool of non-tumor kidney tissue samples, as well as in ccRCC tissue samples (G1-G3) independently or according to the GSTM1 genotype; N- GSTM1-null genotype; A-GSTM1-active genotype
Non-tumor tissue pool G1 G2
-19/17 kDa Cleaved
Caspase-3
N A N A N A N A
*
G3
(A)
(B)
(C)
p<0.05
p>0.05

GSTA1, GSTM1, GSTP1 and GSTT1 polymorphisms in RCC
84
Table 32. Correlation between GSTM1/GSTP1 and regulatory (ASK1) and executor (Caspase-3) apoptotic molecules
4.7 The analysis of GSTM1:ASK1 and GSTP1:JNK1/2 protein:protein interactions in
ccRCC tissue samples
In order to clarify the potential molecular mechanism underlying the role of GSTM1
in RCC progression, the presence of GSTM1:ASK1 protein:protein interaction was analyzed in
specimens of tumor tissue obtained from 20 patients with ccRCC. Tumor tissue samples were
divided in three groups, according to the tumor’s grade (n=6 of grade I, G1, n=7 of grade II, G2,
n=7 of grade III, G3). Protein immunoprecipitation was performed and followed by Western blot
analysis. Indeed, the presence of GSTM1:ASK1 protein:protein interaction was confirmed in all
ccRCC samples studied (Figure 42).
Figure 42. Cytosols obtained from ccRCC tissue homogenates were immunoprecipitated with anti-GSTM1 antibody. The samples were subjected to SDS-PAGE electrophoresis on 10% gel, followed by incubation with the primary antibodies against GSTM1 and ASK1; G1- tumor grade I; G2- tumor grade II; G3- tumor grade III. IP- immunoprecipitation; WB- Western blot
Since it is already known that GSTP1 may act as an inhibitor of apoptosis by means of
controlling JNK catalytic activity, we analyzed if the potential presence of GSTP1:JNK1/2
Correlation Correlation coefficient (r) p-value
GSTM1 and Cleaved Caspase-3 expression
0.81 0.014
ASK1 and Cleaved Caspase-3 expression
0.93 0.001
GSTP1 and Cleaved Caspase-3 expression
0.024 0.999

GSTA1, GSTM1, GSTP1 and GSTT1 polymorphisms in RCC
85
complexes in specimens of tumor tissue obtained from 20 patients with ccRCC. As described
previously, tumor tissue samples were divided in three groups, according to the tumor’s grade (n=6
of grade I, G1, n=7 of grade II, G2, n=7 of grade III, G3). Protein immunoprecipitation, followed
by Western blot analysis, showed the presence of JNK1/2/GSTP1 complexes in all ccRCC samples
studied (Figure 43).
Figure 43. Cytosols obtained from ccRCC tissue homogenates were immunoprecipitated with anti-GST3/GST pi antibody. The samples were subjected to SDS-PAGE electrophoresis on 10% gel, followed by incubation with the primary antibodies against GST3/GST pi and JNK1/2; G1- tumor grade I; G2- tumor grade II; G3- tumor grade III. IP- immunoprecipitation; WB- Western blot
In this manner, we confrmed that GSTM1 and GSTP1 proteins do form protein:protein
complexes with regulatory MAP kinases, ASK1 and JNK1, respectively and in that way seem to
negatively regulate kinase-dependent proliferation pathways.

GSTA1, GSTM1, GSTP1 and GSTT1 polymorphisms in RCC
86
5 DISCUSSION
Prominent genetic heterogeneity, resulting from either gene deletions or SNPs in the coding
and non-coding regions of GST genes, might serve as a valuable indicator of cancer risk assessment
(Di Pietro et al., 2010; Hollman et al., 2016; Josephy, 2010). Moreover, there is a growing body of
evidence that GSTs may participate in tumor progression and affect patients’ survival by regulating a
number of cellular processes via protein:protein interactions as endogenous negative regulators of
protein kinases (Board and Menon, 2013; Laborde, 2010; McIlwain et al., 2006; Pajaud et al., 2012;
Tew and Townsend, 2012).
In this study, we noted an increased risk of both overall RCC and ccRCC development in
carriers of GSTM1-null and GSTP1-variant genotypes, which was even more pronounced when they
were in combination. Furthermore, 22% of all recruited ccRCC patients were carriers of combined
GSTM1-null/GSTT1-active/GSTA1 low-activity/ GSTP1-variant genotype, which might be considered
as “risk-associated genotype combination”. On the other hand, an unfavorable postoperative
prognosis was found for both overall RCC and ccRCC carriers of the GSTM1-active genotype. The
molecular mechanism underlying the role of monomeric GSTM1 and GSTP1 forms in RCC
progression might be explained by the presence of GSTM1:ASK1 and GSTP1:JNK1/2
protein:protein interactions.
Due to a complex process of RCC development and progression, so far, little progress has
been made towards the development of specific biomarkers that would be useful for the following
RCC clinical scenarios: (a) identifying subjects who have or are very likely to develop RCC, (b)
identifying renal masses that can be placed under active surveillance prior to resection, as opposed to
tumors of advanced pathologic stage, and (c) precise more accurate prognosis of patients with
developed RCC. In recent years, attention has been reverted towards genetic variants, such as
deletional and SNP polymorphisms, often referred to as “quantitative trait loci”, that could contribute
a small, but significant risk not only for the development, but also for the progression of complex
disorder such as cancer (Foulkes, 2009). Hence, the panel of candidate genes, with respect to their
different cellular functions, are currently being investigated as a part of potential future marker
profile for renal cell carcinoma, including carcinogen detoxification genes, such as GSTs (Protzel et
al., 2012). This xenobiotic-metabolizing enzymes play an important role in cellular protection from
chemical stress, by conjugating reduced glutathione to a variety of electrophilic xenobiotics or
products of oxidative stress (Hayes et al., 2005; Oakley, 2011). Presumably, GST genotyping could

GSTA1, GSTM1, GSTP1 and GSTT1 polymorphisms in RCC
87
identify individuals in whom this process is diminished, due to complete lack or alteration in GST
enzyme activity.
The GSTM1-null genotype was the focus of numerous investigations attempting to elucidate
the effect of GSTM1 deficiency and susceptibility to cancers. The underlying hypothesis of these
studies is that homozygous deletion of GSTM1 may leave susceptible tissues unprotected from
somatic DNA mutations, due to impaired ability to detoxify electrophilic carcinogen, and may place
GSTM1-null individuals at increased cancer risk. Many of these studies failed to demonstrate such an
association, including the impact of GSTM1-null genotype on RCC development, which has been
further evaluated in numerous meta-analysis (Abid et al., 2016; Cheng et al., 2012; Huang et al.,
2015; Jia et al., 2014; Liu et al., 2012; Yang et al., 2013). However, this refers only to GSTM1-null
genotype as individual risk factor for RCC, while it has been suggested that when present together
with polymorphisms in certain genes related to activation or detoxification of renal carcinogens
(CYP1A1, GSTT1, GSTP1, NAT2), GSTM1-null genotype is associated with increased risk of RCC
(De Martino et al., 2010). Still, our study did demonstrate that the GSTM1-null was a significant
genetic risk factor for RCC development, which was further in complete agreement with our
findings regarding the role of GSTM1 polymorphism in ccRCC development. A possible
explanation for discrepancy in obtained results might be attributed to the evident lack of patients’
individual-level data that are necessary for adjusted risk analysis, as well as to differences in the study
populations. To our knowledge, the present study is the first that was conducted on a significant
number of RCC cases (comprising patients with clear cell RCC, papillary RCC, chromophobe RCC,
collecting duct RCC, etc.) and respective controls, with available detailed individual information
regarding demographic data, clinical characteristics of tumor and lifestyle factors, used for adjusted
risk analysis.
Another widely investigated GST polymorphism, GSTT1, seems to be even more
controversial (Cheng et al., 2012; Salinas-Sánchez et al., 2012; Yang et al., 2013). GSTT1 deficiency
is the result of a gene deletion. After the discovery that GSTT1 can activate some compounds to
even more reactive intermediates (Brüning et al., 1997; Guengerich, 2005; Thier et al., 2003), the
GSTT1 deletion polymorphism was the subject of many studies, some of which tried to determine if
the presence of the GSTT1-active genotype was associated with RCC development, independently or
in combination with high and long-term exposure to certain environmental or occupational hazards
(Buzio et al., 2003; Karami et al., 2008; Longuemaux et al., 1999). Apparently, GSTT1 may play a
role as a risk modifier only in the case of subjects exposed to relevant substrates (Buzio et al., 2003).

GSTA1, GSTM1, GSTP1 and GSTT1 polymorphisms in RCC
88
On one hand, GSTT1 is involved in detoxification of ethylene oxide, formed endogenously from
ethene, which is present at high levels in cigarette smoke (Hayes and Pulford, 1995). On the other
hand, there is also evidence that GSTT1-active individuals, occupationally exposed to relevant
compounds, such as halo- and dihaloalkanes, may produce potentially nephrotoxic glutathione
conjugated compounds resulting in toxic effects and selective vulnerability of the tubular renal
epithelium (Buzio et al., 2003; Hayes and Pulford, 1995; Meyer et al., 1991) Thus, the knowledge of
specific environmental compounds, involved in the carcinogenesis process, is of quite importance
for evaluating the relationships between GSTT1 genotype and cancer susceptibility. In case of RCC,
Buzio et al. (Buzio et al., 2003) and Karami et al. (Karami et al., 2008) reported an increased risk of this
tumor in GSTT1-active individuals, occupationally exposed to pesticides produced from halogenated
compounds. Moreover, Brüning et al.(Brüning et al., 1997) suggested that high occupational exposure
to the solvent trichloroethene also increased the risk for RCC among GSTT1-active individuals.
Regarding the present study, it has been shown that GSTT1-active genotype did not, at least
independently, contribute to RCC susceptibility. Although the structured questioners used in this
study comprised a question regarding the occupational title that was held for more than one year, we
considered it a poor tool for estimating the exposure levels to specific agents. Nevertheless, our
results are in agreement with the 2 most recent meta-analysis (Jia et al., 2014; Yang et al., 2013) who
found no association between the GSTT1 polymorphism and RCC risk in the overall and European
populations.
In contrast to other GSTs, only one polymorphism has been found in the coding region of
GSTA1 gene, whereas several SNPs have been identified in 5’ non-coding promoter region of
GSTA1 gene, among them GSTA1*C69T (rs3957356). Although it has been suggested that GSTA1
expression is dominantly observed in clear cell RCC (Simic et al., 2009), whereas completely absent
in chromophobic type of this tumor (Liu et al., 2007), the data on the potential role of GSTA1 SNP
in both onset and prognosis of RCC are limited (Searchfield et al., 2011). This is even more
surprising, considering the fact that GST alpha is predominantly expressed in the proximal
convoluted tubule, the main site of nephrotoxins and renal carcinogens toxicity (Dekant, 1993), and
from which clear cell RCC originates (Simic et al., 2001, 2001). The results obtained in this study
showed no significance in terms of increased risk for RCC and even ccRCC development in carriers
of GSTA1-low activity genotype (CT+TT), at least when analyzed independently. The possible
explanation would be that the effect of this particular polymorphism may be masked by the activity
of others GSTs, due to the overlapping substrate specificities.

GSTA1, GSTM1, GSTP1 and GSTT1 polymorphisms in RCC
89
GSTP1 SNP (rs1659) is one of the most extensively studied GST polymorphisms. This SNP
encodes the Ile105Val substitution, which influences Ile105 and Val105 variants’ catalytic efficacy
(Dusinská et al., 2001; Hu et al., 1997) and has been investigated not only in terms of cancer
susceptibility, but also in relation to drug resistance (Laborde, 2010; Townsend et al., 2005;
Townsend and Tew, 2003). Some of the available data suggest that active, yet functionally different
GSTP1 isoenzymes may play a key role in the metabolism of environmental carcinogens, hence
affecting the risk of RCC (Longuemaux et al., 1999). However, certain meta-analyses on GST
polymorphisms in RCC did not report any significant individual association between GSTP1
genotype and RCC risk (Jia et al., 2014; Yang et al., 2013). Once again, the overall sample size, as
well as the lack of some important information, such as pathological status, environmental exposure
and lifestyle habits, prevented the authors of these meta-analysis from determining the association
between GSTP1 variants and RCC risk. Nevertheless, it has been already established that in
comparison with normal kidney tissue, RCC contains significantly lower GSTP1 activity
(Longuemaux et al., 1999), suggesting that GSTP1 might act as local modifier of renal cancer
tumorigenesis. Our results on RCC patients indeed demonstrated a significantly increased risk for
cancer development in patients carrying GSTP1-variant (ValVal) genotype, which was in line with
the results obtained on the subpopulation of ccRCC patients. This particular association was even
more pronounced when the combined effect of GST polymorphism and the susceptibility to overall
RCC and ccRCC dvelopment was assessed in various genetic models, comprising GSTP1-variant
genotype. What is more, the relevance of the patients’ clinical data, available for the adjusted risk
analysis in this study, enhanced the association, as demonstrated by the obtained adjusted ORs, that
was calculated next to the crude ORs.
The simultaneous identification of all GST genotypes appears to be of particular importance
for reliable interpretation of the role of the GST family in RCC development, as the impaired
activity of the single given GST may be compensated by other isoforms, due to the overlapping
substrate specificities. Interestingly, we found that 22% of all ccRCC patients in our study were
carriers of combined GSTM1-null/GSTT1-active/GSTA1 low-activity/GSTP1-variant genotype,
suggesting that this particular combination of GST genotypes might be considered as „risk-
associated genotype combination” in RCC. Moreover, a trend in OR was observed when the
cumulative effect of GST genotypes on the risk of both overall RCC and ccRCC development was
analyzed. So far, only a small number of case-control studies have assessed the combined effect of
GST polymorphism and the susceptibility to RCC. Ahmad et al. (Ahmad et al., 2012) have found that

GSTA1, GSTM1, GSTP1 and GSTT1 polymorphisms in RCC
90
three-way combination of GSTM1-null, GSTT1-null and GSTP1-variant genotypes resulted in 4.5-fold
increase in RCC risk, which partially agrees with our results, while Sweeny et al. (Sweeney et al., 2000)
have shown an elevated risk of RCC in carriers of GSTT1-null genotype in all combinations of
GSTM1 and GSTP1 genotypes. The effect of gene-gene interaction was further analyzed in a couple
of meta-analysis, however, most of the genetic models showed no significant association between
combined effect of GSTs polymorphism and RCC risk (Jia et al., 2014; Yang et al., 2013).
Cigarette smoking, hypotension and obesity are considered as recognized risk factors for
RCC development, accounting for about half of the cases diagnosed in the USA (Sweeney et al.,
2000). In this study, we observed an increase in RCC risk among individuals with smoking habits
and hypertension, which lends support to previous findings in the literature (Brennan et al., 2008;
Hunt et al., 2005; Theis et al., 2008; Weikert et al., 2008). However, our study failed to show any
association between obesity and RCC. This apparent lack of correlation can be possibly attributed to
the fact that our recruited controls were hospital based and to the prevalence of overweight
individuals that might have been higher.
Cigarette smoking is a very well recognized risk factor for RCC development. Since GSTs
are involved in the metabolism of carcinogens in cigarette smoke, GST genotype and smoking may
have a synergic effect on RCC risk. Moreover, the results of recent prospective study suggested that
smoking increases the risk of certain common RCC subtypes, such as ccRCC and pRCC, but not the
chRCC (Patel et al., 2015). The data on GSTM1 and GSTT1 genotypes among RCC cases and
controls, stratified by smoking status, were available only in 2 studies (Karami et al., 2008; Sweeney
et al., 2000) and were further analyzed in meta-analysis of Jia et al. No significant association between
tested GST genotypes and RCC risk among smokers was found, most probably due to the small
sample size (Jia et al., 2014). In our study, the significant association between GST genotype and the
risk of ccRCC in smokers was found only for the GSTP1 genotype. Moreover, our results have
shown that the GSTM1-null/GSTP1-variant/GSTA1 low-activity genotype combination was present in
94% of smokers with ccRCC, increasing the risk of ccRCC up to 7.57. Unfortunately, none of the
ccRCC smokers in our study had the four-way „risk-associated genotype combination”.
Interestingly, we were the first to show that ccRCC smokers with GSTM1-null genotype had
significantly higher concentration of BPDE-DNA adducts compared to GSTM1-active ccRCC
smokers. The hypothesized role of GSTM1 deficiency in carcinogenesis suggests that DNA damage
may occur at a higher rate in carriers of GSTM1-null genotype than in GSTM1-active individuals
(Rebbeck, 1997). A number of studies consistent with this hypothesis have been conducted in

GSTA1, GSTM1, GSTP1 and GSTT1 polymorphisms in RCC
91
various pathologies but RCC, some reporting an increased levels of various DNA adducts in
GSTM1-null individuals, due to their inability to eliminate potentially harmful active carcinogenic
compounds (studies discussed in (Alexandrov et al., 2002; Rebbeck, 1997). This seems to be
biologically plausible, especially in the case of compounds that are known to be metabolized by
GSTM1 and are involved in the carcinogenic process. Namely it has been shown that GSTM1
influences sensitivity to chemical carcinogenesis in individuals exposed to widespread environmental
contaminants such as benzo(a)pyrene, styrene-7,8-oxide, and trans-stilbene oxide (Rebbeck, 1997).
In particular, tobacco smoke, dietary habits and indoor ambient air are important sources of
exposure to benzo(a)pyrene (B(a)P), already implicated as one of the components of tobacco smoke
related to the induction of lung cancer in smokers (Watanabe et al., 2009). In humans, B(a)P
undergoes two successive oxygenation reactions, mediated predominantly by CYP1A1, ultimately
leading to BPDE production. This highly mutagenic compound is predominately metabolized by
GSTM1 followed by GSTP1 and GSTA1, with the different variants showing different substrate
specificity (Alexandrov et al., 2002; Sundberg et al., 2002, 1998). The study of Lodovici et al have
characterized subjects with GSTM1-null and GSTP1 wild-type as carriers of “high-risk” genotypes,
associated with higher levels of BPDE-DNA adducts (Lodovici et al., 2004). Indeed, sever lines of
evidence suggest that GSTP1*Val allelic variant of the enzyme possesses greater catalytic activity for
BPDE and other PAH diol epoxides (Alexandrov et al., 2002; Sundberg et al., 2002, 1998). Although
GSTM1-null ccRCC smokers in this study had significantly higher levels of BPDE DNA-adducts,
our results failed to demonstrate any significant correlation between GSTP1 polymorphism and
BPDE-DNA adducts, suggesting that some other GSTP1 substrates might also be important in
RCC development. Other factors, such as CYP1A1 expression, DNA repairing processes, as well as
cell turnover could also affect the level of such DNA adducts and should be taken in consideration
as well (Alexandrov et al., 2002).
Regarding the modifying effect on risk of ccRCC conferred by hypertension, it seems that
this recognized risk factor contributed to genotype-associated ccRCC risk in all examined
polymorphisms, once again with special emphasis on GSTM1-null and GSTP1-variant genotypes. Still,
as hypertension alone was significantly associated with ccRCC development, the obtained results
indicated a possible effect of exposure rather than the effect of the polymorphism itself. However,
the obtained results might also be explained by the significant antioxidant role of GSTs, since
oxidative stress is recognized as an important pathogenetic factor in the hypertension development
(Polimanti et al., 2013). In this line, it has been suggested that the determination of GST genotypes

GSTA1, GSTM1, GSTP1 and GSTT1 polymorphisms in RCC
92
might be helpful in identifying individuals at high-risk for hypertension, especially in the case of
GSTA1 polymorphism (Oniki et al., 2008).
We found no significant association in terms of modifying effect on risk of ccRCC conferred
by obesity. The literature data regarding the GST-BMI interaction seem to be scarce. Sweeney at al.
have found an association between GSTT1-null genotype and RCC risk that seemed to vary by BMI,
with the strongest association among subjects in the lowest tertile of BMI, who were otherwise at
low risk of RCC (Sweeney et al., 2000). According to the authors, the possible mechanism might
involve reactive oxidants, where the protection by GSTT1 is important among individuals with low
levels of exposure, but becomes over-whelmed and does not the affect risk among the highly
exposed. However, it is possible that the GSTT1-BMI interaction was a chance finding (Sweeney et
al., 2000).
Interestingly, all of the three recognized risk factors for RCC development (smoking,
hypertension and obesity) have been linked with increased endogenous formation of reactive
oxidants and lipid peroxidation, as possible underlying mechanisms. Moreover, it has already been
shown that changes in redox status in RCC tumor tissue occur as a consequence of decreased
enzyme antioxidant capacity, together with altered GST alpha expression, contributing to both RCC
development and tumor growth (Pljesa-Ercegovac et al., 2008). Some of the GST enzymes are
shown to possess catalytic activity towards phospholipids, hydroperoxide, supporting the fact that
GSTs may prevent DNA damage from lipid peroxides formed endogenously due to redox
imbalance (Ahmad et al., 2012; Hurst et al., 1998; Seeley et al., 2006). Presumably, the presence of
polymorphisms in GST genes may result in a lower antioxidant capacity of GST enzymes and higher
level of oxidant DNA damage (Sweeney et al., 2000). Therefore, we determined the levels of 8-
hydroxy-2′-deoxyguanosine (8-OHdG), the most widely used fingerprint of radical attack towards
DNA, in RCC patients that were stratified by the presence or absence of the recognized risk factors
for RCC development, and analyzed them with respect to various GST genotypes. Although the
acquired values were slightly higher in RCC patients with „risk-associated genotypes“ compared to
the values observed in RCC patients with reference genotype, obtained results did not reach the
statistical significance.
When assessing the potential prognostic value of GST polymorphism in RCC patients, our
result indicated that carriers of GSTM1-null genotype had significantly better survival compared to
the carriers of GSTM1-active genotype. Moreover, GSTM1-null genotype independently predicted
favorable postoperative prognosis for RCC patients when the association between different GST

GSTA1, GSTM1, GSTP1 and GSTT1 polymorphisms in RCC
93
genotypes and overall mortality, adjusted by covariates in three different models, was analyzed.
Finally, the frequency of the GSTM1-null genotype was significantly higher among living overall
RCC and ccRCC patients in comparison with the deceased. Indeed, our results on the role of
GSTM1-null genotype in RCC patients survival are in complete agreement with previous results of
De Martino et al. who have also reported that the GSTM1-null genotype was associated with a higher
survival rate in RCC patients (De Martino et al., 2010). Moreover, these findings are consistent with
a decreased death rate that was found for GSTM1-null women, however, diagnosed with breast
cancer (Ambrosone et al., 2001). One of the possibly most clinically important observation regarding
the GSTM1 deficiency is that it significantly contributed to survival of patients undergoing
chemotherapy for childhood leukemia (Board and Menon, 2013).
Unfortunately, no statistically significant results were obtained for other investigated GST
polymorphisms in terms of postoperative prognosis and the risk of overall mortality, although 1.7-
fold increased risk was found for carriers of GSTP1-variant (ValVal) genotype in two investigated
models. Previous data on the prognostic role of GSTs seem to been limited only to GSTM1
polymorphism. Yet another study investigated whether the expression of GST α and GST π has any
prognostic value in RCC patients, however, without assessing the effect of most common GST
polymorphisms. Survival analysis was restricted to ccRCC and indicated a better survival of patients
with ccRCC tumors expressing GST α (Searchfield et al., 2011).
Our results on the association between GST polymorphisms and tumor grade /clinical TNM
stage of RCC have shown significant correlation only for the GSTM1 genotype. The association of
the GSTM1-null with tumor grade II (G2) was noted for RCC and for its most frequent subtype,
ccRCC. The results of this study are in agreement with the findings of De Martino et al. who have also
reported that the GSTM1-null genotype was associated with a lower tumor grade (De Martino et al.,
2010). On the other hand, two case-control studies have demonstrated an association of GSTT1-null
genotype with more advanced clinical TNM stages and tumor grades in RCC patients, which were
further confirmed in a very recent meta-analyisis of Huang et al (Huang et al., 2015). According to the
recent study by Tan et al, another GST µ class member, GSTM3 and its SNP rs1332018 variant, has
proved to be not only a significant risk factor, but also significant prognostic factor for RCC
development (Tan et al., 2013).
The possible molecular mechanism underlying the role of GSTM1 protein in RCC
progression might be explained through the effect of GSTM1 on one of the major signal
transduction pathway, which includes a cascade of three classes of protein kinases: mitogen-activated

GSTA1, GSTM1, GSTP1 and GSTT1 polymorphisms in RCC
94
protein kinase kinase kinase (MAP3K), MAPK kinase (MAP2K) and MAPK. This evolutionally
conserved intracellular system is known for regulating the cellular stress response (Shiizaki et al.,
2013). First in line is the apoptosis signal-regulating kinase 1 (ASK1), a MAP3K family member,
that can activate the well-known MAPK signaling cascades, the c-Jun NH2-terminal kinase/stress-
activated protein kinase (JNK/SAPK) and the p38 (Ichijo et al., 1997), both involved in cellular
stress-induced apoptosis (Ichijo et al., 1997; Shiizaki et al., 2013; Tobiume et al., 2001). Namely,
ASK1 is activated by various types of stress, including oxidative stress, endoplasmatic reticulum
stress, anti-cancer drugs and calcium overload, as well as by receptor mediated inflammatory signals
such as TNF-α and lipopolysaccharide (Matsuzawa et al., 2010). In unstimulated cell, ASK1 is
constitutively engaged in forming high molecular mass complex, termed ASK1 signalosome, that
consists of homo-oligomeric ASK1, its negative regulator thioredoxin (Trx) and other mostly
unidentified components (Noguchi et al., 2005). What is more, the formation of an even higher
mass complex of ASK1 (>3000kDa) seems to be induced under ROS and TNF-α stimulation
(Shiizaki et al., 2013). There, Trx disassociates from ASK1, while tumor necrosis factor-receptor
associated factor-2/6 (TRAF2/TRAF6) are recruited to signalosome, positively regulating ASK1
activity by facilitating the auto-phosphorilation of ASK1 (Noguchi et al., 2005).
The redox regulatory protein Trx is one of the most studied negative regulators of ASK1
(Fujino et al., 2007; Matsuzawa et al., 2010; Shiizaki et al., 2013). However, many studies have
revealed that a variety of antioxidant enzymes and molecular chaperons also inhibit the activation of
ASK1 (Matsuzawa et al., 2010). According to the results obtained booth in vivo and in vitro, mouse
GSTMu1-1 physically interacts with ASK1 as well, functioning as another ASK1 negative regulator.
Namely, Cho et al. have shown that under unstimulated conditions, mGSTM1-1 block ASK1
oligomersiation, suppresses ASK1 mediated activation of JNK/SAPK signaling cascade and
represses ASK1-dependent apoptotic cell death, independently of its transferase activity (Cho et al.,
2001; Dorion et al., 2002). Interestingly, it has been shown that the same region of ASK1 seems to
be engaged in protein:protein interactions with either GSTM1-1 or Trx, suggesting the presence of a
pool of GSTM1:ASK1-1 and ASK1:Trx complexes under unstressed conditions (Pajaud et al.,
2012). Various types of cell stress (heat shock or reactive oxygen species) can result in the release of
ASK1 from GSTM1:ASK1-1 or ASK1:Trx complexes, ASK1 oligomerisation, autophosphorylation
and subsequently the activation of the p38 signal pathway (Dorion et al., 2002).
The results of this study, for the first time, have confirmed the association between GSTM1
and ASK1 in human ccRCC tissue samples. Our next goal was to assess the significance of this

GSTA1, GSTM1, GSTP1 and GSTT1 polymorphisms in RCC
95
protein:protein interaction and see if the polymorphic expression of GSTM1 may influence the
ASK1-dependent apoptosis. As ASK1-JNK/p38 apoptotic pathway is mainly medicated by
cytochrome c release from mitochondria and activation of Caspase-3 activity (Hatai et al., 2000), we
determined the expression of ASK1 and Cleaved Caspase-3 in both ccRCC tumor and adjacent non-
tumor tissue samples, all stratified according to the GSTM1 genotype. Caspase-3, an executor
caspase, represents the most downstream enzyme in the apoptosis-inducing protease pathway and is
shown to correlate with the level of apoptosis in the best manner. Cleaved Caspase-3 is its activated
form, responsible for the actual destruction of the cell, cleaving multiple structural and repaired
proteins (Pljesa-Ercegovac et al., 2011). As expected, a trend of decrease in ASK1 and Cleaved
Caspase-3 expressions was evident with grade advancement. Moreover, although there was no
statistically significant difference in the protein level between the carriers of two GSTM1 genotypes,
the level of both ASK1 and Cleaved Caspase-3 was obviously lower in GSTM1-active individuals
across all tumor grades, supporting the possible role of GSTM1 as yet another negative regulator of
ASK1-dependent apoptosis mediated by mitochondria-dependent caspase activation. The ASK1-
JNK/p38 pathway was found to be of quite importance for the occurrence of the apoptosis in RCC
cells. Namely, Hassan et al. demonstrated that upon the induction of ASK1-JNK/p38 pathway by
anti-Fas monoclonal antibody, the activation of Fas-Associated protein with Death Domain
(FADD)-Caspase-8-Bid signaling occurred in studied RCC cell lines, resulting in the translocation of
both Bax and Bak proteins, and subsequently mitochondrial dysregulation that is characterized by
the loss of mitochondrial membrane potential, cytochrome c release and cleavage of Caspase-9,
Caspase-3 and Poly (ADP-ribose) polymerase (PARP) (Hassan et al., 2009). Indeed, our results
indicated a strong positive correlation between the expression of ASK1 and Cleaved Caspase-3.
In summary, it can be speculated that RCC patients with GSTM1-null genotype, and
consequently deficient GSTM1, may have higher ASK1 activity, resulting in increased apoptotic
activity in the tumor. On the other hand, patients with GSTM1-active genotype may have increased
tumor proliferation due to decreased ASK1-dependent apoptotic activity, leading to RCC
progression and poorer survival. The mentioned events may be even more evident when stressors,
such as heat shock or reactive oxygen species, activate ASK1 (McIlwain et al., 2006).
Monomeric form of GSTP1 protein seem to be involved in protein:protein with JNK1 or
MAPK8, which has been demonstrated to promote one of the most important regulatory functions
of GSTP1 - stress-dependent regulation of cell cycle progression through either differentiation,
proliferation, senescence or apoptotic responses (Bartolini and Galli, 2016). Namely, it is known that
GSTA1, GSTM1, GSTP1 and GSTT1 polymorphisms in RCC
96
by means of protein:protein interactions, GSTP1 directly targets at least three proteins in one
response-pathway: TRAF2 and its downstream targets, JNK and ASK1. Structural aspects of these
interactions remain poorly characterized. Earliest and better characterized physical interactions of
GSTP1 includes the one with kinase JNK1 (Adler et al., 1999). So far, it is known that four putative
domains are involved in the interaction between GSTP1 subunits and JNK. Two of these are
involved in GSTP1 binding to JNK, whereas the other two affect phosphorylation of JNK (Adler
and Pincus, 2004). It is speculated that the proposed mechanisms by which GSTP1 inhibits
activation of JNK comprises either blocking phosphorylation of JNK or the promotion of
dephosphorylation of phosphorylated JNK (Adler and Pincus, 2004). The particular GSTP1:JNK1
interaction has been reported in human leukemia, hepatic carcinoma, bladder cancer and
neuroblastoma cells (Pljesa-Ercegovac et al., 2010). Moreover, the results of this study have
confirmed the presence of GSTP1:JNK1/2 complex in all investigated RCC samples. This
protein:protein interaction seems to be of particular importance as it represents the new, functional
link between upregulated GSTP1 and malignant phenotype. In particular, the overexpression of
GSTP1 was found in not only in tumors but in drug resistant cells, correlating with tumor stage and
grade (Simic et al., 2009; Townsend and Tew, 2003). For a long time, the elevated expression of the
GSTP1 in tumors has been frequently associated with detoxification reactions. However, GSTP1
overexpression has been determined even in cases when there was no evidence that the selecting
drug was a substrate for this enzyme. Indeed, the signaling and regulatory functions observed
between the monomeric forms of GSTP1s and other cellular proteins, seems to perfectly coexist
with the classical detoxification function of dimeric GSTP1, thus linking the GSTP-mediated
detoxification and signaling response to electrophilic stressors (Bartolini and Galli, 2016). Namely,
upregulation of GSTP in tumors would result in an increase in inactive sequestered JNK
subsequently suppressing apoptotic signaling pathways and conferring resistance to drug induced
cell death. This would explain the correlation observed between increased GSTP1 expression in
tumors and survival. Identified protein:protein or metabolic/redox interactions of the monomeric
and oligomeric forms of GSTP proteins suggest that the role of GSTP as regulatory protein
becomes very important in tumorogenesis and drug resistance. In theory, in case of excess ROS
generation following drug administration, GSTP1 would dissociate from JNK and trigger a cascade
of signaling events starting with the activation of c-Jun via phosphorylation, leading subsequently to
proliferation or apoptosis (Board and Menon, 2013).

GSTA1, GSTM1, GSTP1 and GSTT1 polymorphisms in RCC
97
In this study, the protein level of GSTP1 increased with tumor grade advancement whereas
the expression of JNK1/2 differed between low and high graded samples. However, the effect of
polymorphic expression of GSTP1 on the JNK1-dependent apoptosis was not estimated. So far,
only one study of Thevenin et al. have shown that GSTP1 variant Val allele is a better JNK1
inhibitor, hence with the greater antiapoptotic effect than the wild-type Ile allele (Thévenin et al.,
2011).
This study has several limitations that need to be addressed. The PCR analysis of GSTM1
and GSTT1 genotypes does not positively distinguish between homozygous wild type from
heterozygous individuals which may not reflect the true underlying genetic model and thus may not
provide a valid and accurate estimate of the genetic risk. Furthermore, the case-control design was
used for estimating of associations between GST genotypes and risk of RCC and therefore the
selection bias might influence the results. Additionally, recall bias regarding the recognized risk
factors for RCC development might have influenced the results as well. Furthermore, the data on
environmental or occupational exposure were not validated, hence not used in the analysis of the
obtained results. Our control group was hospital-based and relatively small. Therefore, the use of
population controls may have been more appropriate. In this line, the study subjects were white
only; therefore the possible effect of ethnicity could not be evaluated. Moreover, the BPDE-DNA
adduct levels were not determined in control population.
GSTA1, GSTM1, GSTP1 and GSTT1 polymorphisms in RCC
98
6 CONCLUSIONS
Based on the provided results and discussion, the following conclusions can be drawn:
The results of this study have confirmed that smoking and hypertension are independent risk
factors for RCC development:
o Smokers exhibit 1.5-fold increased risk for RCC development compared to non-
smokers
o Hypertensive patients exhibit 3-fold increased risk for RCC development compared
to normotensive patients
GSTM1-null, as well as GSTP1-variant genotypes represent independent risk factors for RCC
development:
o Carriers of GSTM1-null genotype exhibit 2-fold increased risk for overall RCC and
specifically ccRCC development compared to the carriers of GSTM1-active genotype
o Carriers of GSTP1-variant genotype exhibit 3-ford increased risk for overall RCC and
specifically ccRCC development compared to the carriers of GSTP1-wild type
genotype
Combined GSTM1-null/GSTT1-active/GSTA1- low activity/GSTP1-variant genotype might be
considered as “risk-associated genotype combination” in both overall RCC and ccRCC
patients:
o There is a dominant combined effect of GSTM1-null/GSTP1-variant genotypes on
overall RCC and ccRCC risk development
o There is a cumulative effect of “risk-associated genotype combination” on overall
RCC and ccRCC risk development
Significant modifying effect on ccRCC risk develompent conferred by hypertension was
observed in carriers of GST variant genotypes:
o Hypertensive patients with GSTM1-null genotype exhbit 6-fold increased risk of
ccRRC development in comparison with normotensive patients with GSTM1-active
genotype
o Hypertensive patients with GSTT1-active genotype exhbit 3-fold increased risk of
ccRRC development in comparison with normotensive patients with GSTT1-null
genotype

GSTA1, GSTM1, GSTP1 and GSTT1 polymorphisms in RCC
99
o Hypertensive patients with GSTA1-low activity genotype exhbit 4-fold increased risk
of ccRRC development in comparison with normotensive patients with GSTA1-
active genotype
o Hypertensive patients with GSTP1-variant genotype exhbit 8-fold increased risk of
ccRRC development in comparison with normotensive patients with GSTP1-wild
type genotype
The lack of modifying effect on ccRCC risk develompent conferred by obesity was observed
in carriers of GST variant genotypes
Significant modifying effect on ccRCC risk develompent conferred by smoking was
observed in carriers of GST variant genotype::
o Smokers with GSTP1-variant genotype exhibit 4-fold increased risk of ccRCC
development when compared to the non-smokers with GSTP1-wild type genotype
o Smokers with GSTP1-variant genotype exhibit 3-fold increased risk of ccRCC
development when compared to the smokers with GSTP1-wild type genotype
o Smokers with combined GSTM1-null/GSTP1-variant genotype exhibit 5-fold
increased risk of ccRCC development when compared to the smokers with GSTM1-
active/GSTP1-wild type genotype
o Smokers with combined GSTM1-null/GSTP1-variant/GSTA1-low activity genotype
exhibit 7-fold increased risk of ccRCC development when compared to the smokers
with GSTM1-active/GSTP1-wild type/GSTA1-active genotype
The presence of GSTM1-null genotype is associated with significantly higher levels of
BPDE-DNA adduct formation in ccRCC smokers
The presence of GST variants is not associated with higher levels of byproducts of oxidative
DNA damage (8-OHdG) in RCC patients, even when stratified according to the presence
of recogized risk factors for RCC development
The presence of GSTM1 genotype is associated with RCC tumor grade:
o GSTM1-null genotype was the most frequent in grade II (G2) RCC and ccRCC
tumors
o No association was observed between GSTA1, GSTT1 and GSTP1 genotypes and
overall RCC and ccRCC stage

GSTA1, GSTM1, GSTP1 and GSTT1 polymorphisms in RCC
100
GSTM1 genotype represents a significant prognostic factor in overall RCC and specifically
ccRCC patients:
o Significantly higher frequency of the GSTM1-null genotype was observed in living
overall RCC and ccRCC patients in comparison with the frequency of GSTM1-null
genotype in deceased overall RCC and ccRCC patients included in the follow-up
o Shorter overall survival was found for the whole group of RCC, as well as ccRCC
patients with GSTM1-active genotype, compared to the RCC and ccRCC carriers of
GSTM1-null genotype
o GSTM1-active genotype was confirmed to be an independent predictor of higher risk
of overall mortality compared to the GSTM1-null genotype, in the whole group of
RCC and ccRCC patients, when analyzed in 3 different proportional hazard
regression models
The expression pattern of the analyzed GSTM1 and GSTP1 protein, as well as regulatory
(ASK1, JNK1/2) and executor (Cleaved-Capsase 3) apoptotic molecules varied with tumor
grade:
o Significantly lower expression of the GSTM1 protein was found in ccRCC tissue
samples with higher grade in comparison with non-tumor kidney tissue pool
o Significantly lower expression of ASK1 was found in G2 and G3 ccRCC tissue
samples
o A gradual increase of GSTP1 protein expression across tumor grade was observed in
ccRCC tissue samples
o JNK1/2 expressesion was higher in non-tumor and G1 tumor tissue, compared to
G2 and G3 in ccRCC tissue samples
o The expression of Cleaved Caspase-3 gradually decreased across tumor grade in
ccRCC tissue samples
The supposed molecular mechanism underlying the prognostic role of GSTM1 protein is the
negative regulation of apoptotic signaling pathways through sequestration of signaling
ASK1 kinase by GSTM1 protein:
o The presence of GSTM1:ASK1 protein:protein interaction was found in all ccRCC
samples studied

GSTA1, GSTM1, GSTP1 and GSTT1 polymorphisms in RCC
101
o A strong positive correlation was found between GSTM1 and expression of executor
(Cleaved Caspase-3) apoptotic molecules
o Cleaved Caspase-3 protein levels were lower in GSTM1-active individuals across
tumor grade in comparison with Cleaved Caspase-3 protein levels in GSTM1-null
individuals
Non-catalytical regulatory role of GSTP1 protein was confirmed in all ccRCC tissue samples:
o The presence of GSTP1:JNK1/2 complexes was found in all ccRCC tissue samples
Overall, GST variants may contribute to individual RCC risk assessment in terms of both
development and postoperative prognosis

GSTA1, GSTM1, GSTP1 and GSTT1 polymorphisms in RCC
102
7 REFERENCES
Abdalla, A.-M., Bruns, C.M., Tainer, J.A., Mannervik, B., Stenberg, G., 2002. Design of a monomeric human glutathione transferase GSTP1, a structurally stable but catalytically inactive protein. Protein Eng. 15, 827–834.
Abdel-Rahman, S.Z., el-Zein, R.A., Anwar, W.A., Au, W.W., 1996. A multiplex PCR procedure for polymorphic analysis of GSTM1 and GSTT1 genes in population studies. Cancer Lett. 107, 229–233.
Abel, E.J., Culp, S.H., Matin, S.F., Tamboli, P., Wallace, M.J., Jonasch, E., Tannir, N.M., Wood, C.G., 2010. Percutaneous biopsy of primary tumor in metastatic renal cell carcinoma to predict high risk pathological features: comparison with nephrectomy assessment. J. Urol. 184, 1877–1881. doi:10.1016/j.juro.2010.06.105
Abid, A., Ajaz, S., Khan, A.R., Zehra, F., Hasan, A.S., Sultan, G., Mohsin, R., Hashmi, A., Niamatullah, N., Rizvi, S.A.-H., Mehdi, S.Q., Khaliq, S., 2016. Analysis of the glutathione S-transferase genes polymorphisms in the risk and prognosis of renal cell carcinomas. Case-control and meta-analysis. Urol. Oncol. Semin. Orig. Investig. doi:10.1016/j.urolonc.2016.04.005
Adams, K.F., Leitzmann, M.F., Albanes, D., Kipnis, V., Moore, S.C., Schatzkin, A., Chow, W.-H., 2008. Body size and renal cell cancer incidence in a large US cohort study. Am. J. Epidemiol. 168, 268–277. doi:10.1093/aje/kwn122
Adler, V., Pincus, M.R., 2004. Effector peptides from glutathione-S-transferase-pi affect the activation of jun by jun-N-terminal kinase. Ann. Clin. Lab. Sci. 34, 35–46.
Adler, V., Yin, Z., Fuchs, S.Y., Benezra, M., Rosario, L., Tew, K.D., Pincus, M.R., Sardana, M., Henderson, C.J., Wolf, C.R., Davis, R.J., Ronai, Z., 1999. Regulation of JNK signaling by GSTp. EMBO J. 18, 1321–1334. doi:10.1093/emboj/18.5.1321
Ahmad, S.T., Arjumand, W., Seth, A., Kumar Saini, A., Sultana, S., 2012. Impact of glutathione transferase M1, T1, and P1 gene polymorphisms in the genetic susceptibility of North Indian population to renal cell carcinoma. DNA Cell Biol. 31, 636–643. doi:10.1089/dna.2011.1392
Ahmed, A.E., Anders, M.W., 1976. Metabolism of dihalomethanes to formaldehyde and inorganic halide. I. In vitro studies. Drug Metab. Dispos. Biol. Fate Chem. 4, 357–361.
Alexandrie, A.-K., Rannug, A., Juronen, E., Tasa, G., Warholm, M., 2002. Detection and characterization of a novel functional polymorphism in the GSTT1 gene. Pharmacogenetics 12, 613–619.
Alexandrov, K., Cascorbi, I., Rojas, M., Bouvier, G., Kriek, E., Bartsch, H., 2002. CYP1A1 and GSTM1 genotypes affect benzo[a]pyrene DNA adducts in smokers’ lung: comparison with aromatic/hydrophobic adduct formation. Carcinogenesis 23, 1969–1977.
Ali-Osman, F., Akande, O., Antoun, G., Mao, J.X., Buolamwini, J., 1997. Molecular cloning, characterization, and expression in Escherichia coli of full-length cDNAs of three human glutathione S-transferase Pi gene variants. Evidence for differential catalytic activity of the encoded proteins. J. Biol. Chem. 272, 10004–10012.
Ambrosone, C.B., Sweeney, C., Coles, B.F., Thompson, P.A., McClure, G.Y., Korourian, S., Fares, M.Y., Stone, A., Kadlubar, F.F., Hutchins, L.F., 2001. Polymorphisms in glutathione S-transferases (GSTM1 and GSTT1) and survival after treatment for breast cancer. Cancer Res. 61, 7130–7135.
Anders, M.W., Dekant, W., 1998. Glutathione-dependent bioactivation of haloalkenes. Annu. Rev. Pharmacol. Toxicol. 38, 501–537. doi:10.1146/annurev.pharmtox.38.1.501

GSTA1, GSTM1, GSTP1 and GSTT1 polymorphisms in RCC
103
Armstrong, R.N., 2010. Glutathione Transferases, in: Comprehensive Toxicology. Elsevier, pp. 295–321.
Atkinson, H.J., Babbitt, P.C., 2009. Glutathione Transferases Are Structural and Functional Outliers in the Thioredoxin Fold. Biochemistry (Mosc.) 48, 11108–11116. doi:10.1021/bi901180v
Bartolini, D., Galli, F., 2016. The functional interactome of GSTP: A regulatory biomolecular network at the interface with the Nrf2 adaption response to oxidative stress. J. Chromatogr. B 1019, 29–44. doi:10.1016/j.jchromb.2016.02.002
Beebe-Dimmer, J.L., Colt, J.S., Ruterbusch, J.J., Keele, G.R., Purdue, M.P., Wacholder, S., Graubard, B.I., Davis, F., Chow, W.-H., Schwartz, K.L., 2012. Body mass index and renal cell cancer: the influence of race and sex. Epidemiol. Camb. Mass 23, 821–828. doi:10.1097/EDE.0b013e31826b7fe9
Bergström, A., Hsieh, C.C., Lindblad, P., Lu, C.M., Cook, N.R., Wolk, A., 2001. Obesity and renal cell cancer--a quantitative review. Br. J. Cancer 85, 984–990. doi:10.1038/sj.bjc.6692040
Bianchi, M., Sun, M., Jeldres, C., Shariat, S.F., Trinh, Q.-D., Briganti, A., Tian, Z., Schmitges, J., Graefen, M., Perrotte, P., Menon, M., Montorsi, F., Karakiewicz, P.I., 2012. Distribution of metastatic sites in renal cell carcinoma: a population-based analysis. Ann. Oncol. Off. J. Eur. Soc. Med. Oncol. ESMO 23, 973–980. doi:10.1093/annonc/mdr362
Bjørge, T., Tretli, S., Engeland, A., 2004. Relation of height and body mass index to renal cell carcinoma in two million Norwegian men and women. Am. J. Epidemiol. 160, 1168–1176. doi:10.1093/aje/
Board, P.G., 1981. Gene deletion and partial deficiency of the glutathione S-transferase (ligandin) system in man. FEBS Lett. 135, 12–14.
Board, P.G., Menon, D., 2013. Glutathione transferases, regulators of cellular metabolism and physiology. Biochim. Biophys. Acta BBA - Gen. Subj. 1830, 3267–3288. doi:10.1016/j.bbagen.2012.11.019
Brennan, P., van der Hel, O., Moore, L.E., Zaridze, D., Matveev, V., Holcatova, I., Janout, V., Kollarova, H., Foretova, L., Szeszenia-Dabrowska, N., Mates, D., Rothman, N., Boffetta, P., Chow, W.-H., 2008. Tobacco smoking, body mass index, hypertension, and kidney cancer risk in central and eastern Europe. Br. J. Cancer 99, 1912–1915. doi:10.1038/sj.bjc.6604761
Brüning, T., Lammert, M., Kempkes, M., Thier, R., Golka, K., Bolt, H.M., 1997. Influence of polymorphisms of GSTM1 and GSTT1 for risk of renal cell cancer in workers with long-term high occupational exposure to trichloroethene. Arch. Toxicol. 71, 596–599.
Buzio, L., De Palma, G., Mozzoni, P., Tondel, M., Buzio, C., Franchini, I., Axelson, O., Mutti, A., 2003. Glutathione S-transferases M1-1 and T1-1 as risk modifiers for renal cell cancer associated with occupational exposure to chemicals. Occup. Environ. Med. 60, 789–793.
Cancer Incidence and Mortality in Central Serbia 2013, 2015. . Institute of Public Health of Serbia “Dr Milan Jovanović Batut.”
Capitanio, U., Montorsi, F., 2016. Renal cancer. The Lancet 387, 894–906. doi:10.1016/S0140-6736(15)00046-X
Cheng, H.-Y., You, H.-Y., Zhou, T.-B., 2012. Relationship between GSTM1/GSTT1 Null Genotypes and Renal Cell Carcinoma Risk: A Meta-Analysis. Ren. Fail. 34, 1052–1057. doi:10.3109/0886022X.2012.708380
Cho, S.G., Lee, Y.H., Park, H.S., Ryoo, K., Kang, K.W., Park, J., Eom, S.J., Kim, M.J., Chang, T.S., Choi, S.Y., Shim, J., Kim, Y., Dong, M.S., Lee, M.J., Kim, S.G., Ichijo, H., Choi, E.J., 2001. Glutathione S-transferase mu modulates the stress-activated signals by suppressing apoptosis signal-regulating kinase 1. J. Biol. Chem. 276, 12749–12755. doi:10.1074/jbc.M005561200

GSTA1, GSTM1, GSTP1 and GSTT1 polymorphisms in RCC
104
Chow, W.H., Gridley, G., Fraumeni, J.F., Järvholm, B., 2000. Obesity, hypertension, and the risk of kidney cancer in men. N. Engl. J. Med. 343, 1305–1311. doi:10.1056/NEJM200011023431804
Chuang, S.-T., Chu, P., Sugimura, J., Tretiakova, M.S., Papavero, V., Wang, K., Tan, M.-H., Tan, M., Lin, F., Teh, B.T., Yang, X.J., 2005. Overexpression of glutathione s-transferase alpha in clear cell renal cell carcinoma. Am. J. Clin. Pathol. 123, 421–429. doi:10.1309/AQXR-6B2Q-PUGD-638C
Coles, B.F., Kadlubar, F.F., 2005. Human alpha class glutathione S-transferases: genetic polymorphism, expression, and susceptibility to disease. Methods Enzymol. 401, 9–42. doi:10.1016/S0076-6879(05)01002-5
Coles, B.F., Kadlubar, F.F., 2003. Detoxification of electrophilic compounds by glutathione S-transferase catalysis: determinants of individual response to chemical carcinogens and chemotherapeutic drugs? BioFactors Oxf. Engl. 17, 115–130.
Coles, B.F., Morel, F., Rauch, C., Huber, W.W., Yang, M., Teitel, C.H., Green, B., Lang, N.P., Kadlubar, F.F., 2001. Effect of polymorphism in the human glutathione S-transferase A1 promoter on hepatic GSTA1 and GSTA2 expression. Pharmacogenetics 11, 663–669.
Commandeur, J.N., Stijntjes, G.J., Vermeulen, N.P., 1995. Enzymes and transport systems involved in the formation and disposition of glutathione S-conjugates. Role in bioactivation and detoxication mechanisms of xenobiotics. Pharmacol. Rev. 47, 271–330.
Corrao, G., Scotti, L., Bagnardi, V., Sega, R., 2007. Hypertension, antihypertensive therapy and renal-cell cancer: a meta-analysis. Curr. Drug Saf. 2, 125–133.
De Martino, M., Klatte, T., Schatzl, G., Remzi, M., Waldert, M., Haitel, A., Stancik, I., Kramer, G., Marberger, M., 2010. Renal cell carcinoma Fuhrman grade and histological subtype correlate with complete polymorphic deletion of glutathione S-transferase M1 gene. J. Urol. 183, 878–883. doi:10.1016/j.juro.2009.11.032
Dekant, W., 1993. Bioactivation of nephrotoxins and renal carcinogens by glutathione S-conjugate formation. Toxicol. Lett. 67, 151–160.
Di Pietro, G., Magno, L.A.V., Rios-Santos, F., 2010. Glutathione S-transferases: an overview in cancer research. Expert Opin. Drug Metab. Toxicol. 6, 153–170. doi:10.1517/17425250903427980
Djukic, T.I., Savic-Radojevic, A.R., Pekmezovic, T.D., Matic, M.G., Pljesa-Ercegovac, M.S., Coric, V.M., Radic, T.M., Suvakov, S.R., Krivic, B.N., Dragicevic, D.P., Simic, T.P., 2013. Glutathione S-transferase T1, O1 and O2 polymorphisms are associated with survival in muscle invasive bladder cancer patients. PloS One 8, e74724. doi:10.1371/journal.pone.0074724
Dorion, S., Lambert, H., Landry, J., 2002. Activation of the p38 signaling pathway by heat shock involves the dissociation of glutathione S-transferase Mu from Ask1. J. Biol. Chem. 277, 30792–30797. doi:10.1074/jbc.M203642200
Dourado, D., Fernandes, P., Ramos, M., 2008. Mammalian Cytosolic Glutathione Transferases. Curr. Protein Pept. Sci. 9, 325–337. doi:10.2174/138920308785132677
Dusinská, M., Ficek, A., Horská, A., Raslová, K., Petrovská, H., Vallová, B., Drlicková, M., Wood, S.G., Stupáková, A., Gasparovic, J., Bobek, P., Nagyová, A., Kováciková, Z., Blazícek, P., Liegebel, U., Collins, A.R., 2001. Glutathione S-transferase polymorphisms influence the level of oxidative DNA damage and antioxidant protection in humans. Mutat. Res. 482, 47–55.
Eble, J.N., Weltgesundheitsorganisation, International Agency for Research on Cancer (Eds.), 2006. Pathology and genetics of tumours of the urinary system and male genital organs: [...

GSTA1, GSTM1, GSTP1 and GSTT1 polymorphisms in RCC
105
editorial and consensus conference in Lyon, France, December 14 - 18, 2002], Reprint. ed, World Health Organization classification of tumours. IARC Press, Lyon.
Economopoulos, K.P., Sergentanis, T.N., 2010. GSTM1, GSTT1, GSTP1, GSTA1 and colorectal cancer risk: a comprehensive meta-analysis. Eur. J. Cancer Oxf. Engl. 1990 46, 1617–1631. doi:10.1016/j.ejca.2010.02.009
Edge, S.B., American Joint Committee on Cancer (Eds.), 2010. AJCC cancer staging manual, 7th ed. ed. Springer, New York.
Egner, P.A., Kensler, T.W., Chen, J.-G., Gange, S.J., Groopman, J.D., Friesen, M.D., 2008. Quantification of sulforaphane mercapturic acid pathway conjugates in human urine by high-performance liquid chromatography and isotope-dilution tandem mass spectrometry. Chem. Res. Toxicol. 21, 1991–1996. doi:10.1021/tx800210k
Ellimoottil, C., Greco, K.A., Hart, S., Patel, T., Sheikh, M.M., Turk, T.M.T., Flanigan, R.C., 2014. New Modalities for Evaluation and Surveillance of Complex Renal Cysts. J. Urol. 192, 1604–1611. doi:10.1016/j.juro.2014.07.099
Escudier, B., Michaelson, M.D., Motzer, R.J., Hutson, T.E., Clark, J.I., Lim, H.Y., Porfiri, E., Zalewski, P., Kannourakis, G., Staehler, M., Tarazi, J., Rosbrook, B., Cisar, L., Hariharan, S., Kim, S., Rini, B.I., 2014. Axitinib versus sorafenib in advanced renal cell carcinoma: subanalyses by prior therapy from a randomised phase III trial. Br. J. Cancer 110, 2821–2828. doi:10.1038/bjc.2014.244
Escudier, B., Porta, C., Schmidinger, M., Algaba, F., Patard, J.J., Khoo, V., Eisen, T., Horwich, A., on behalf of the ESMO Guidelines Working Group, 2014. Renal cell carcinoma: ESMO Clinical Practice Guidelines for diagnosis, treatment and follow-up. Ann. Oncol. 25, iii49-iii56. doi:10.1093/annonc/mdu259
Evans, D.A., Seidegård, J., Narayanan, N., 1996. The GSTM1 genetic polymorphism in healthy Saudi Arabians and Filipinos, and Saudi Arabians with coronary atherosclerosis. Pharmacogenetics 6, 365–367.
Ferlay, J., Soerjomataram, I., Dikshit, R., Eser, S., Mathers, C., Rebelo, M., Parkin, D.M., Forman, D., Bray, F., 2015. Cancer incidence and mortality worldwide: sources, methods and major patterns in GLOBOCAN 2012. Int. J. Cancer 136, E359-386. doi:10.1002/ijc.29210
Filiadis, I., Hrouda, D., 2000. Genetic factors in chemically-induced transitional cell bladder cancer. BJU Int. 86, 794–801.
Foulkes, A.S., 2009. Genetic Association Studies, in: Applied Statistical Genetics with R. Springer New York, New York, NY, pp. 1–27.
Fuhrman, S.A., Lasky, L.C., Limas, C., 1982. Prognostic significance of morphologic parameters in renal cell carcinoma. Am. J. Surg. Pathol. 6, 655–663.
Fujino, G., Noguchi, T., Matsuzawa, A., Yamauchi, S., Saitoh, M., Takeda, K., Ichijo, H., 2007. Thioredoxin and TRAF family proteins regulate reactive oxygen species-dependent activation of ASK1 through reciprocal modulation of the N-terminal homophilic interaction of ASK1. Mol. Cell. Biol. 27, 8152–8163. doi:10.1128/MCB.00227-07
Gago-Dominguez, M., Castelao, J.E., Yuan, J.-M., Ross, R.K., Yu, M.C., 2002. Lipid peroxidation: a novel and unifying concept of the etiology of renal cell carcinoma (United States). Cancer Causes Control CCC 13, 287–293.
Garte, S., Gaspari, L., Alexandrie, A.K., Ambrosone, C., Autrup, H., Autrup, J.L., Baranova, H., Bathum, L., Benhamou, S., Boffetta, P., Bouchardy, C., Breskvar, K., Brockmoller, J., Cascorbi, I., Clapper, M.L., Coutelle, C., Daly, A., Dell’Omo, M., Dolzan, V., Dresler, C.M., Fryer, A., Haugen, A., Hein, D.W., Hildesheim, A., Hirvonen, A., Hsieh, L.L., Ingelman-Sundberg, M., Kalina, I., Kang, D., Kihara, M., Kiyohara, C., Kremers, P., Lazarus, P., Le
GSTA1, GSTM1, GSTP1 and GSTT1 polymorphisms in RCC
106
Marchand, L., Lechner, M.C., van Lieshout, E.M., London, S., Manni, J.J., Maugard, C.M., Morita, S., Nazar-Stewart, V., Noda, K., Oda, Y., Parl, F.F., Pastorelli, R., Persson, I., Peters, W.H., Rannug, A., Rebbeck, T., Risch, A., Roelandt, L., Romkes, M., Ryberg, D., Salagovic, J., Schoket, B., Seidegard, J., Shields, P.G., Sim, E., Sinnet, D., Strange, R.C., Stücker, I., Sugimura, H., To-Figueras, J., Vineis, P., Yu, M.C., Taioli, E., 2001. Metabolic gene polymorphism frequencies in control populations. Cancer Epidemiol. Biomark. Prev. Publ. Am. Assoc. Cancer Res. Cosponsored Am. Soc. Prev. Oncol. 10, 1239–1248.
Gill, I.S., Aron, M., Gervais, D.A., Jewett, M.A.S., 2010. Clinical practice. Small renal mass. N. Engl. J. Med. 362, 624–634. doi:10.1056/NEJMcp0910041
Green, T., Dow, J., Ellis, M.K., Foster, J.R., Odum, J., 1997. The role of glutathione conjugation in the development of kidney tumours in rats exposed to trichloroethylene. Chem. Biol. Interact. 105, 99–117.
Grek, C.L., Zhang, J., Manevich, Y., Townsend, D.M., Tew, K.D., 2013. Causes and consequences of cysteine S-glutathionylation. J. Biol. Chem. 288, 26497–26504. doi:10.1074/jbc.R113.461368
Guengerich, F.P., 2005. Activation of alkyl halides by glutathione transferases. Methods Enzymol. 401, 342–353. doi:10.1016/S0076-6879(05)01021-9
Guengerich, F.P., McCormick, W.A., Wheeler, J.B., 2003. Analysis of the kinetic mechanism of haloalkane conjugation by mammalian theta-class glutathione transferases. Chem. Res. Toxicol. 16, 1493–1499. doi:10.1021/tx034157r
Habig, W.H., Pabst, M.J., Jakoby, W.B., 1974. Glutathione S-transferases. The first enzymatic step in mercapturic acid formation. J. Biol. Chem. 249, 7130–7139.
Haferkamp, A., Pritsch, M., Bedke, J., Wagener, N., Pfitzenmaier, J., Buse, S., Hohenfellner, M., 2008. The influence of body mass index on the long-term survival of patients with renal cell carcinoma after tumour nephrectomy. BJU Int. 101, 1243–1246. doi:10.1111/j.1464-410X.2007.07375.x
Haimeur, A., Conseil, G., Deeley, R.G., Cole, S.P.C., 2004. The MRP-related and BCRP/ABCG2 multidrug resistance proteins: biology, substrate specificity and regulation. Curr. Drug Metab. 5, 21–53.
Hassan, M., Feyen, O., Grinstein, E., 2009. Fas-induced apoptosis of renal cell carcinoma is mediated by apoptosis signal-regulating kinase 1 via mitochondrial damage-dependent caspase-8 activation. Cell. Oncol. Off. J. Int. Soc. Cell. Oncol. 31, 437–456. doi:10.3233/CLO-2009-0488
Hatai, T., Matsuzawa, A., Inoshita, S., Mochida, Y., Kuroda, T., Sakamaki, K., Kuida, K., Yonehara, S., Ichijo, H., Takeda, K., 2000. Execution of apoptosis signal-regulating kinase 1 (ASK1)-induced apoptosis by the mitochondria-dependent caspase activation. J. Biol. Chem. 275, 26576–26581. doi:10.1074/jbc.M003412200
Hayes, J.D., Flanagan, J.U., Jowsey, I.R., 2005. Glutathione transferases. Annu. Rev. Pharmacol. Toxicol. 45, 51–88. doi:10.1146/annurev.pharmtox.45.120403.095857
Hayes, J.D., McLellan, L.I., 1999. Glutathione and glutathione-dependent enzymes represent a co-ordinately regulated defence against oxidative stress. Free Radic. Res. 31, 273–300.
Hayes, J.D., Pulford, D.J., 1995. The glutathione S-transferase supergene family: regulation of GST and the contribution of the isoenzymes to cancer chemoprotection and drug resistance. Crit. Rev. Biochem. Mol. Biol. 30, 445–600. doi:10.3109/10409239509083491
Hayes, J.D., Strange, R.C., 2000. Glutathione S-transferase polymorphisms and their biological consequences. Pharmacology 61, 154–166. doi:28396
GSTA1, GSTM1, GSTP1 and GSTT1 polymorphisms in RCC
107
Heeschen, C., Jang, J.J., Weis, M., Pathak, A., Kaji, S., Hu, R.S., Tsao, P.S., Johnson, F.L., Cooke, J.P., 2001. Nicotine stimulates angiogenesis and promotes tumor growth and atherosclerosis. Nat. Med. 7, 833–839. doi:10.1038/89961
Hinchman, C.A., Ballatori, N., 1994. Glutathione conjugation and conversion to mercapturic acids can occur as an intrahepatic process. J. Toxicol. Environ. Health 41, 387–409. doi:10.1080/15287399409531852
Hollman, A., Tchounwou, P., Huang, H.-C., 2016. The Association between Gene-Environment Interactions and Diseases Involving the Human GST Superfamily with SNP Variants. Int. J. Environ. Res. Public. Health 13, 379. doi:10.3390/ijerph13040379
Hollstein, M., Sidransky, D., Vogelstein, B., Harris, C.C., 1991. p53 mutations in human cancers. Science 253, 49–53.
Hu, J., Ugnat, A.-M., Canadian Cancer Registries Epidemiology Research Group, 2005. Active and passive smoking and risk of renal cell carcinoma in Canada. Eur. J. Cancer Oxf. Engl. 1990 41, 770–778. doi:10.1016/j.ejca.2005.01.003
Hu, X., O’Donnell, R., Srivastava, S.K., Xia, H., Zimniak, P., Nanduri, B., Bleicher, R.J., Awasthi, S., Awasthi, Y.C., Ji, X., Singh, S.V., 1997. Active site architecture of polymorphic forms of human glutathione S-transferase P1-1 accounts for their enantioselectivity and disparate activity in the glutathione conjugation of 7beta,8alpha-dihydroxy-9alpha,10alpha-ox y-7,8,9,10-tetrahydrobenzo(a)pyrene. Biochem. Biophys. Res. Commun. 235, 424–428. doi:10.1006/bbrc.1997.6777
Huang, W., Shi, H., Hou, Q., Mo, Z., Xie, X., 2015. GSTM1 and GSTT1 polymorphisms contribute to renal cell carcinoma risk: evidence from an updated meta-analysis. Sci. Rep. 5, 17971. doi:10.1038/srep17971
Hubatsch, I., Ridderström, M., Mannervik, B., 1998. Human glutathione transferase A4-4: an alpha class enzyme with high catalytic efficiency in the conjugation of 4-hydroxynonenal and other genotoxic products of lipid peroxidation. Biochem. J. 330 ( Pt 1), 175–179.
Hunt, J.D., van der Hel, O.L., McMillan, G.P., Boffetta, P., Brennan, P., 2005. Renal cell carcinoma in relation to cigarette smoking: meta-analysis of 24 studies. Int. J. Cancer 114, 101–108. doi:10.1002/ijc.20618
Hurst, R., Bao, Y., Jemth, P., Mannervik, B., Williamson, G., 1998. Phospholipid hydroperoxide glutathione peroxidase activity of human glutathione transferases. Biochem. J. 332 ( Pt 1), 97–100.
IARC Working Group on the Evaluation of Carcinogenic Risks to Humans, 2004. Tobacco smoke and involuntary smoking. IARC Monogr. Eval. Carcinog. Risks Hum. World Health Organ. Int. Agency Res. Cancer 83, 1–1438.
Ichijo, H., Nishida, E., Irie, K., ten Dijke, P., Saitoh, M., Moriguchi, T., Takagi, M., Matsumoto, K., Miyazono, K., Gotoh, Y., 1997. Induction of apoptosis by ASK1, a mammalian MAPKKK that activates SAPK/JNK and p38 signaling pathways. Science 275, 90–94.
Inoue, T., Irikura, D., Okazaki, N., Kinugasa, S., Matsumura, H., Uodome, N., Yamamoto, M., Kumasaka, T., Miyano, M., Kai, Y., Urade, Y., 2003. Mechanism of metal activation of human hematopoietic prostaglandin D synthase. Nat. Struct. Biol. 10, 291–296. doi:10.1038/nsb907
International Agency for Research on Cancer, International Agency for Research on Cancer (Eds.), 1993. Beryllium, cadmium, mercury, and exposures in the glass manufacturing industry: ... views and expert opinions of an IARC Working Group on the Evaluation of Carcinogenic Risks to Humans, which met in Lyon, 9 - 16 February 1993, IARC monographs on the evaluation of carcinogenic risks to humans. Lyon.

GSTA1, GSTM1, GSTP1 and GSTT1 polymorphisms in RCC
108
Jia, C.-Y., Liu, Y.-J., Cong, X.-L., Ma, Y.-S., Sun, R., Fu, D., Lv, Z.-W., 2014. Association of glutathione S-transferase M1, T1, and P1 polymorphisms with renal cell carcinoma: evidence from 11 studies. Tumor Biol. 35, 3867–3873. doi:10.1007/s13277-013-1513-5
Josephy, P.D., 2010. Genetic variations in human glutathione transferase enzymes: significance for pharmacology and toxicology. Hum. Genomics Proteomics HGP 2010, 876940. doi:10.4061/2010/876940
Jung, I., Messing, E., 2000. Molecular mechanisms and pathways in bladder cancer development and progression. Cancer Control J. Moffitt Cancer Cent. 7, 325–334.
Kamat, A.M., Shock, R.P., Naya, Y., Rosser, C.J., Slaton, J.W., Pisters, L.L., 2004. Prognostic value of body mass index in patients undergoing nephrectomy for localized renal tumors. Urology 63, 46–50.
Karami, S., Boffetta, P., Rothman, N., Hung, R.J., Stewart, T., Zaridze, D., Navritalova, M., Mates, D., Janout, V., Kollarova, H., Bencko, V., Szeszenia-Dabrowska, N., Holcatova, I., Mukeria, A., Gromiec, J., Chanock, S.J., Brennan, P., Chow, W.-H., Moore, L.E., 2008. Renal cell carcinoma, occupational pesticide exposure and modification by glutathione S-transferase polymorphisms. Carcinogenesis 29, 1567–1571. doi:10.1093/carcin/bgn153
Ketterer, B., 1996. Effects of genetic polymorphism and enzyme induction in the glutathione S-transferase family on chemical safety and risk assessment. Environ. Toxicol. Pharmacol. 2, 157–160. doi:10.1016/S1382-6689(96)00047-6
Kim, H.L., Belldegrun, A.S., Freitas, D.G., Bui, M.H.T., Han, K., Dorey, F.J., Figlin, R.A., 2003. Paraneoplastic signs and symptoms of renal cell carcinoma: implications for prognosis. J. Urol. 170, 1742–1746. doi:10.1097/01.ju.0000092764.81308.6a
Klinghoffer, Z., Yang, B., Kapoor, A., Pinthus, J.H., 2009. Obesity and renal cell carcinoma: epidemiology, underlying mechanisms and management considerations. Expert Rev. Anticancer Ther. 9, 975–987. doi:10.1586/era.09.51
Krabbe, L.-M., Bagrodia, A., Margulis, V., Wood, C.G., 2014. Surgical management of renal cell carcinoma. Semin. Interv. Radiol. 31, 27–32. doi:10.1055/s-0033-1363840
Kurtovic, S., Grehn, L., Karlsson, A., Hellman, U., Mannervik, B., 2008. Glutathione transferase activity with a novel substrate mimics the activation of the prodrug azathioprine. Anal. Biochem. 375, 339–344. doi:10.1016/j.ab.2007.12.033
Laborde, E., 2010. Glutathione transferases as mediators of signaling pathways involved in cell proliferation and cell death. Cell Death Differ. 17, 1373–1380. doi:10.1038/cdd.2010.80
Laemmli, U.K., 1970. Cleavage of structural proteins during the assembly of the head of bacteriophage T4. Nature 227, 680–685.
Leiba, A., Kark, J.D., Afek, A., Derazne, E., Barchana, M., Tzur, D., Vivante, A., Shamiss, A., 2013. Adolescent obesity and paternal country of origin predict renal cell carcinoma: a cohort study of 1.1 million 16 to 19-year-old males. J. Urol. 189, 25–29. doi:10.1016/j.juro.2012.08.184
Leveridge, M.J., Finelli, A., Kachura, J.R., Evans, A., Chung, H., Shiff, D.A., Fernandes, K., Jewett, M.A.S., 2011. Outcomes of small renal mass needle core biopsy, nondiagnostic percutaneous biopsy, and the role of repeat biopsy. Eur. Urol. 60, 578–584. doi:10.1016/j.eururo.2011.06.021
Liu, L., Qian, J., Singh, H., Meiers, I., Zhou, X., Bostwick, D.G., 2007. Immunohistochemical analysis of chromophobe renal cell carcinoma, renal oncocytoma, and clear cell carcinoma: an optimal and practical panel for differential diagnosis. Arch. Pathol. Lab. Med. 131, 1290–1297. doi:10.1043/1543-2165(2007)131[1290:IAOCRC]2.0.CO;2
GSTA1, GSTM1, GSTP1 and GSTT1 polymorphisms in RCC
109
Liu, R., Wang, X.-H., Liu, L., Zhou, Q., 2012. No association between the GSTM1 null genotype and risk of renal cell carcinoma: a meta-analysis. Asian Pac. J. Cancer Prev. APJCP 13, 3109–3112.
Ljungberg, B., Bensalah, K., Canfield, S., Dabestani, S., Hofmann, F., Hora, M., Kuczyk, M.A., Lam, T., Marconi, L., Merseburger, A.S., Mulders, P., Powles, T., Staehler, M., Volpe, A., Bex, A., 2015. EAU guidelines on renal cell carcinoma: 2014 update. Eur. Urol. 67, 913–924. doi:10.1016/j.eururo.2015.01.005
Ljungberg, B., Campbell, S.C., Cho, H.Y., Jacqmin, D., Lee, J.E., Weikert, S., Kiemeney, L.A., 2011. The Epidemiology of Renal Cell Carcinoma. Eur. Urol. 60, 615–621. doi:10.1016/j.eururo.2011.06.049
Lodovici, M., Luceri, C., Guglielmi, F., Bacci, C., Akpan, V., Fonnesu, M.L., Boddi, V., Dolara, P., 2004. Benzo(a)pyrene diolepoxide (BPDE)-DNA adduct levels in leukocytes of smokers in relation to polymorphism of CYP1A1, GSTM1, GSTP1, GSTT1, and mEH. Cancer Epidemiol. Biomark. Prev. Publ. Am. Assoc. Cancer Res. Cosponsored Am. Soc. Prev. Oncol. 13, 1342–1348.
Longuemaux, S., Deloménie, C., Gallou, C., Méjean, A., Vincent-Viry, M., Bouvier, R., Droz, D., Krishnamoorthy, R., Galteau, M.M., Junien, C., Béroud, C., Dupret, J.M., 1999. Candidate genetic modifiers of individual susceptibility to renal cell carcinoma: a study of polymorphic human xenobiotic-metabolizing enzymes. Cancer Res. 59, 2903–2908.
Mannervik, B., 1985. The isoenzymes of glutathione transferase. Adv. Enzymol. Relat. Areas Mol. Biol. 57, 357–417.
Mannervik, B., Board, P.G., Hayes, J.D., Listowsky, I., Pearson, W.R., 2005. Nomenclature for Mammalian Soluble Glutathione Transferases, in: Methods in Enzymology. Elsevier, pp. 1–8.
Marnett, L.J., Riggins, J.N., West, J.D., 2003. Endogenous generation of reactive oxidants and electrophiles and their reactions with DNA and protein. J. Clin. Invest. 111, 583–593. doi:10.1172/JCI18022
Mathew, A., Devesa, S.S., Fraumeni, J.F., Chow, W.-H., 2002. Global increases in kidney cancer incidence, 1973-1992. Eur. J. Cancer Prev. Off. J. Eur. Cancer Prev. Organ. ECP 11, 171–178.
Matic, M., Pekmezovic, T., Djukic, T., Mimic-Oka, J., Dragicevic, D., Krivic, B., Suvakov, S., Savic-Radojevic, A., Pljesa-Ercegovac, M., Tulic, C., Coric, V., Simic, T., 2013. GSTA1, GSTM1, GSTP1, and GSTT1 polymorphisms and susceptibility to smoking-related bladder cancer: a case-control study. Urol. Oncol. 31, 1184–1192. doi:10.1016/j.urolonc.2011.08.005
Matsuzawa, A., Takeda, K., Ichijo, H., 2010. ASK1. AfCS-Nat. Mol. Pages. doi:10.1038/mp.a002816.01
McIlwain, C.C., Townsend, D.M., Tew, K.D., 2006. Glutathione S-transferase polymorphisms: cancer incidence and therapy. Oncogene 25, 1639–1648. doi:10.1038/sj.onc.1209373
McLellan, R.A., Oscarson, M., Alexandrie, A.K., Seidegård, J., Evans, D.A., Rannug, A., Ingelman-Sundberg, M., 1997. Characterization of a human glutathione S-transferase mu cluster containing a duplicated GSTM1 gene that causes ultrarapid enzyme activity. Mol. Pharmacol. 52, 958–965.
Meyer, D.J., Coles, B., Pemble, S.E., Gilmore, K.S., Fraser, G.M., Ketterer, B., 1991. Theta, a new class of glutathione transferases purified from rat and man. Biochem. J. 274 ( Pt 2), 409–414.
Morel, F., Rauch, C., Coles, B., Le Ferrec, E., Guillouzo, A., 2002. The human glutathione transferase alpha locus: genomic organization of the gene cluster and functional

GSTA1, GSTM1, GSTP1 and GSTT1 polymorphisms in RCC
110
characterization of the genetic polymorphism in the hGSTA1 promoter. Pharmacogenetics 12, 277–286.
Noguchi, T., Takeda, K., Matsuzawa, A., Saegusa, K., Nakano, H., Gohda, J., Inoue, J.-I., Ichijo, H., 2005. Recruitment of tumor necrosis factor receptor-associated factor family proteins to apoptosis signal-regulating kinase 1 signalosome is essential for oxidative stress-induced cell death. J. Biol. Chem. 280, 37033–37040. doi:10.1074/jbc.M506771200
Oakley, A., 2011. Glutathione transferases: a structural perspective. Drug Metab. Rev. 43, 138–151. doi:10.3109/03602532.2011.558093
Office of the Surgeon General (US), Office on Smoking and Health (US), 2004. The Health Consequences of Smoking: A Report of the Surgeon General, Reports of the Surgeon General. Centers for Disease Control and Prevention (US), Atlanta (GA).
Oniki, K., Hori, M., Takata, K., Yokoyama, T., Mihara, S., Marubayashi, T., Nakagawa, K., 2008. Association between glutathione S-transferase A1, M1 and T1 polymorphisms and hypertension. Pharmacogenet. Genomics 18, 275–277. doi:10.1097/FPC.0b013e3282f56176
Ooi, A., Wong, J.-C., Petillo, D., Roossien, D., Perrier-Trudova, V., Whitten, D., Min, B.W.H., Tan, M.-H., Zhang, Z., Yang, X.J., Zhou, M., Gardie, B., Molinié, V., Richard, S., Tan, P.H., Teh, B.T., Furge, K.A., 2011. An antioxidant response phenotype shared between hereditary and sporadic type 2 papillary renal cell carcinoma. Cancer Cell 20, 511–523. doi:10.1016/j.ccr.2011.08.024
Pajaud, J., Kumar, S., Rauch, C., Morel, F., Aninat, C., 2012. Regulation of signal transduction by glutathione transferases. Int. J. Hepatol. 2012, 137676. doi:10.1155/2012/137676
Parker, A.S., Cerhan, J.R., Janney, C.A., Lynch, C.F., Cantor, K.P., 2003. Smoking cessation and renal cell carcinoma. Ann. Epidemiol. 13, 245–251.
Patard, J.-J., Leray, E., Rioux-Leclercq, N., Cindolo, L., Ficarra, V., Zisman, A., De La Taille, A., Tostain, J., Artibani, W., Abbou, C.C., Lobel, B., Guillé, F., Chopin, D.K., Mulders, P.F.A., Wood, C.G., Swanson, D.A., Figlin, R.A., Belldegrun, A.S., Pantuck, A.J., 2005. Prognostic value of histologic subtypes in renal cell carcinoma: a multicenter experience. J. Clin. Oncol. Off. J. Am. Soc. Clin. Oncol. 23, 2763–2771. doi:10.1200/JCO.2005.07.055
Patel, N.H., Attwood, K.M., Hanzly, M., Creighton, T.T., Mehedint, D.C., Schwaab, T., Kauffman, E.C., 2015. Comparative Analysis of Smoking as a Risk Factor among Renal Cell Carcinoma Histological Subtypes. J. Urol. 194, 640–646. doi:10.1016/j.juro.2015.03.125
Paumi, C.M., Ledford, B.G., Smitherman, P.K., Townsend, A.J., Morrow, C.S., 2001. Role of multidrug resistance protein 1 (MRP1) and glutathione S-transferase A1-1 in alkylating agent resistance. Kinetics of glutathione conjugate formation and efflux govern differential cellular sensitivity to chlorambucil versus melphalan toxicity. J. Biol. Chem. 276, 7952–7956. doi:10.1074/jbc.M009400200
Pearson, W.R., Vorachek, W.R., Xu, S.J., Berger, R., Hart, I., Vannais, D., Patterson, D., 1993. Identification of class-mu glutathione transferase genes GSTM1-GSTM5 on human chromosome 1p13. Am. J. Hum. Genet. 53, 220–233.
Pejovic-Milovancevic, M.M., Mandic-Maravic, V.D., Coric, V.M., Mitkovic-Voncina, M.M., Kostic, M.V., Savic-Radojevic, A.R., Ercegovac, M.D., Matic, M.G., Peljto, A.N., Lecic-Tosevski, D.R., Simic, T.P., Pljesa-Ercegovac, M.S., 2016. Glutathione S-Transferase Deletion Polymorphisms in Early-Onset Psychotic and Bipolar Disorders: A Case-Control Study. Lab. Med. 47, 195–204. doi:10.1093/labmed/lmw017
Pemble, S., Schroeder, K.R., Spencer, S.R., Meyer, D.J., Hallier, E., Bolt, H.M., Ketterer, B., Taylor, J.B., 1994. Human glutathione S-transferase theta (GSTT1): cDNA cloning and the characterization of a genetic polymorphism. Biochem. J. 300 ( Pt 1), 271–276.

GSTA1, GSTM1, GSTP1 and GSTT1 polymorphisms in RCC
111
Petejova, N., Martinek, A., 2016. Renal cell carcinoma: Review of etiology, pathophysiology and risk factors. Biomed. Pap. 160, 183–194. doi:10.5507/bp.2015.050
Pfaffenroth, E.C., Linehan, W.M., 2008. Genetic basis for kidney cancer: opportunity for disease-specific approaches to therapy. Expert Opin. Biol. Ther. 8, 779–790. doi:10.1517/14712598.8.6.779
Ping, J., Wang, H., Huang, M., Liu, Z.-S., 2006. Genetic analysis of glutathione S-transferase A1 polymorphism in the Chinese population and the influence of genotype on enzymatic properties. Toxicol. Sci. Off. J. Soc. Toxicol. 89, 438–443. doi:10.1093/toxsci/kfj037
Pischon, T., Lahmann, P.H., Boeing, H., Tjønneland, A., Halkjaer, J., Overvad, K., Klipstein-Grobusch, K., Linseisen, J., Becker, N., Trichopoulou, A., Benetou, V., Trichopoulos, D., Sieri, S., Palli, D., Tumino, R., Vineis, P., Panico, S., Monninkhof, E., Peeters, P.H.M., Bueno-de-Mesquita, H.B., Büchner, F.L., Ljungberg, B., Hallmans, G., Berglund, G., Gonzalez, C.A., Dorronsoro, M., Gurrea, A.B., Navarro, C., Martinez, C., Quirós, J.R., Roddam, A., Allen, N., Bingham, S., Khaw, K.-T., Kaaks, R., Norat, T., Slimani, N., Riboli, E., 2006. Body size and risk of renal cell carcinoma in the European Prospective Investigation into Cancer and Nutrition (EPIC). Int. J. Cancer 118, 728–738. doi:10.1002/ijc.21398
Pljesa-Ercegovac, M., Mimic-Oka, J., Dragicevic, D., Savic-Radojevic, A., Opacic, M., Pljesa, S., Radosavljevic, R., Simic, T., 2008. Altered antioxidant capacity in human renal cell carcinoma: role of glutathione associated enzymes. Urol. Oncol. 26, 175–181. doi:10.1016/j.urolonc.2007.02.007
Pljesa-Ercegovac, M., Savic-Radojevic, A., Dragicevic, D., Mimic-Oka, J., Matic, M., Sasic, T., Pekmezovic, T., Vuksanovic, A., Simic, T., 2011. Enhanced GSTP1 expression in transitional cell carcinoma of urinary bladder is associated with altered apoptotic pathways. Urol. Oncol. 29, 70–77. doi:10.1016/j.urolonc.2008.10.019
Pljesa-Ercegovac, M., Savic-Radojevic, A., Kravic-Stevovic, T., Bumbasirevic, V., Mimic-Oka, J., Simic, T., 2010. Co-localization of GSTP1 and JNK in transitional cell carcinoma of urinary bladder. Genet. Mol. Biol. 33, 460–462.
Ploemen, J.H., Wormhoudt, L.W., van Ommen, B., Commandeur, J.N., Vermeulen, N.P., van Bladeren, P.J., 1995. Polymorphism in the glutathione conjugation activity of human erythrocytes towards ethylene dibromide and 1,2-epoxy-3-(p-nitrophenoxy)-propane. Biochim. Biophys. Acta 1243, 469–476.
Polimanti, R., Carboni, C., Baesso, I., Piacentini, S., Iorio, A., De Stefano, G.F., Fuciarelli, M., 2013. Genetic variability of glutathione S-transferase enzymes in human populations: functional inter-ethnic differences in detoxification systems. Gene 512, 102–107. doi:10.1016/j.gene.2012.09.113
Protzel, C., Maruschke, M., Hakenberg, O.W., 2012. Epidemiology, Aetiology, and Pathogenesis of Renal Cell Carcinoma. Eur. Urol. Suppl. 11, 52–59. doi:10.1016/j.eursup.2012.05.002
Rebbeck, T.R., 1997. Molecular epidemiology of the human glutathione S-transferase genotypes GSTM1 and GSTT1 in cancer susceptibility. Cancer Epidemiol. Biomark. Prev. Publ. Am. Assoc. Cancer Res. Cosponsored Am. Soc. Prev. Oncol. 6, 733–743.
Reinemer, P., Dirr, H.W., Ladenstein, R., Huber, R., Lo Bello, M., Federici, G., Parker, M.W., 1992. Three-dimensional structure of class pi glutathione S-transferase from human placenta in complex with S-hexylglutathione at 2.8 A resolution. J. Mol. Biol. 227, 214–226.
Renehan, A.G., Tyson, M., Egger, M., Heller, R.F., Zwahlen, M., 2008. Body-mass index and incidence of cancer: a systematic review and meta-analysis of prospective observational studies. Lancet Lond. Engl. 371, 569–578. doi:10.1016/S0140-6736(08)60269-X

GSTA1, GSTM1, GSTP1 and GSTT1 polymorphisms in RCC
112
Romero, L., Andrews, K., Ng, L., O’Rourke, K., Maslen, A., Kirby, G., 2006. Human GSTA1-1 reduces c-Jun N-terminal kinase signalling and apoptosis in Caco-2 cells. Biochem. J. 400, 135–141. doi:10.1042/BJ20060110
Sacco, E., Pinto, F., Sasso, F., Racioppi, M., Gulino, G., Volpe, A., Bassi, P., 2009. Paraneoplastic syndromes in patients with urological malignancies. Urol. Int. 83, 1–11. doi:10.1159/000224860
Salinas-Sánchez, A.S., Sánchez-Sánchez, F., Donate-Moreno, M.J., Rubio-del-Campo, A., Serrano-Oviedo, L., Gimenez-Bachs, J.M., Martínez-Sanchiz, C., Segura-Martín, M., Escribano, J., 2012. GSTT1, GSTM1, and CYP1B1 gene polymorphisms and susceptibility to sporadic renal cell cancer. Urol. Oncol. Semin. Orig. Investig. 30, 864–870. doi:10.1016/j.urolonc.2010.10.001
Schmidbauer, J., Remzi, M., Memarsadeghi, M., Haitel, A., Klingler, H.C., Katzenbeisser, D., Wiener, H., Marberger, M., 2008. Diagnostic accuracy of computed tomography-guided percutaneous biopsy of renal masses. Eur. Urol. 53, 1003–1011. doi:10.1016/j.eururo.2007.11.041
Searchfield, L., Price, S.A., Betton, G., Jasani, B., Riccardi, D., Griffiths, D.F.R., 2011. Glutathione S-transferases as molecular markers of tumour progression and prognosis in renal cell carcinoma: GST-alpha in human RCC. Histopathology 58, 180–190. doi:10.1111/j.1365-2559.2010.03733.x
Seeley, S.K., Poposki, J.A., Maksimchuk, J., Tebbe, J., Gaudreau, J., Mannervik, B., Bull, A.W., 2006. Metabolism of oxidized linoleic acid by glutathione transferases: peroxidase activity toward 13-hydroperoxyoctadecadienoic acid. Biochim. Biophys. Acta 1760, 1064–1070. doi:10.1016/j.bbagen.2006.02.020
Seidegård, J., Pero, R.W., 1988. The genetic variation and the expression of human glutathione transferase mu. Klin. Wochenschr. 66 Suppl 11, 125–126.
Shah, S., Watnick, T., Atta, M.G., 2010. Not all renal cysts are created equal. Lancet Lond. Engl. 376, 1024. doi:10.1016/S0140-6736(10)60956-7
Sharifi, N., Farrar, W.L., 2006. Perturbations in hypoxia detection: a shared link between hereditary and sporadic tumor formation? Med. Hypotheses 66, 732–735. doi:10.1016/j.mehy.2005.11.003
Shiizaki, S., Naguro, I., Ichijo, H., 2013. Activation mechanisms of ASK1 in response to various stresses and its significance in intracellular signaling. Adv. Biol. Regul. 53, 135–144. doi:10.1016/j.jbior.2012.09.006
Siegel, R., Ma, J., Zou, Z., Jemal, A., 2014. Cancer statistics, 2014. CA. Cancer J. Clin. 64, 9–29. doi:10.3322/caac.21208
Simic, T., Mimic-Oka, J., Ille, K., Savic-Radojevic, A., Reljic, Z., 2001. Isoenzyme profile of glutathione S-transferases in human kidney. Urol. Res. 29, 38–44.
Simic, T., Savic-Radojevic, A., Pljesa-Ercegovac, M., Matic, M., Mimic-Oka, J., 2009. Glutathione S-transferases in kidney and urinary bladder tumors. Nat. Rev. Urol. 6, 281–289. doi:10.1038/nrurol.2009.49
Slaga, T.J., Bracken, W.J., Gleason, G., Levin, W., Yagi, H., Jerina, D.M., Conney, A.H., 1979. Marked differences in the skin tumor-initiating activities of the optical enantiomers of the diastereomeric benzo(a)pyrene 7,8-diol-9,10-epoxides. Cancer Res. 39, 67–71.
Sobin, L.H., Gospodarowicz, M.K., Wittekind, C., International Union against Cancer (Eds.), 2010. TNM classification of malignant tumours, 7th ed. ed. Wiley-Blackwell, Chichester, West
Sussex, UK ; Hoboken, NJ.
GSTA1, GSTM1, GSTP1 and GSTT1 polymorphisms in RCC
113
Sprenger, R., Schlagenhaufer, R., Kerb, R., Bruhn, C., Brockmöller, J., Roots, I., Brinkmann, U., 2000. Characterization of the glutathione S-transferase GSTT1 deletion: discrimination of all genotypes by polymerase chain reaction indicates a trimodular genotype-phenotype correlation. Pharmacogenetics 10, 557–565.
Srigley, J.R., Delahunt, B., Eble, J.N., Egevad, L., Epstein, J.I., Grignon, D., Hes, O., Moch, H., Montironi, R., Tickoo, S.K., Zhou, M., Argani, P., ISUP Renal Tumor Panel, 2013. The International Society of Urological Pathology (ISUP) Vancouver Classification of Renal Neoplasia. Am. J. Surg. Pathol. 37, 1469–1489. doi:10.1097/PAS.0b013e318299f2d1
Sundberg, K., Dreij, K., Seidel, A., Jernström, B., 2002. Glutathione conjugation and DNA adduct formation of dibenzo[a,l]pyrene and benzo[a]pyrene diol epoxides in V79 cells stably expressing different human glutathione transferases. Chem. Res. Toxicol. 15, 170–179.
Sundberg, K., Johansson, A.S., Stenberg, G., Widersten, M., Seidel, A., Mannervik, B., Jernström, B., 1998. Differences in the catalytic efficiencies of allelic variants of glutathione transferase P1-1 towards carcinogenic diol epoxides of polycyclic aromatic hydrocarbons. Carcinogenesis 19, 433–436.
Sweeney, C., Farrow, D.C., Schwartz, S.M., Eaton, D.L., Checkoway, H., Vaughan, T.L., 2000. Glutathione S-transferase M1, T1, and P1 polymorphisms as risk factors for renal cell carcinoma: a case-control study. Cancer Epidemiol. Biomark. Prev. Publ. Am. Assoc. Cancer Res. Cosponsored Am. Soc. Prev. Oncol. 9, 449–454.
Tan, X., Wang, Y., Han, Y., Chang, W., Su, T., Hou, J., Xu, D., Yu, Y., Ma, W., Thompson, T.C., Cao, G., 2013. Genetic variation in the GSTM3 promoter confer risk and prognosis of renal cell carcinoma by reducing gene expression. Br. J. Cancer 109, 3105–3115. doi:10.1038/bjc.2013.669
Tars, K., Olin, B., Mannervik, B., 2010. Structural basis for featuring of steroid isomerase activity in alpha class glutathione transferases. J. Mol. Biol. 397, 332–340. doi:10.1016/j.jmb.2010.01.023
Teichert, J., Sohr, R., Hennig, L., Baumann, F., Schoppmeyer, K., Patzak, U., Preiss, R., 2009. Identification and quantitation of the N-acetyl-L-cysteine S-conjugates of bendamustine and its sulfoxides in human bile after administration of bendamustine hydrochloride. Drug Metab. Dispos. Biol. Fate Chem. 37, 292–301. doi:10.1124/dmd.108.022855
Terris, M., Klaassen, Z., Kabaria, R., 2016. Renal cell carcinoma: links and risks. Int. J. Nephrol. Renov. Dis. 45. doi:10.2147/IJNRD.S75916
Tew, K.D., Manevich, Y., Grek, C., Xiong, Y., Uys, J., Townsend, D.M., 2011. The role of glutathione S-transferase P in signaling pathways and S-glutathionylation in cancer. Free Radic. Biol. Med. 51, 299–313. doi:10.1016/j.freeradbiomed.2011.04.013
Tew, K.D., Townsend, D.M., 2012. Glutathione-s-transferases as determinants of cell survival and death. Antioxid. Redox Signal. 17, 1728–1737. doi:10.1089/ars.2012.4640
Theis, R.P., Dolwick Grieb, S.M., Burr, D., Siddiqui, T., Asal, N.R., 2008. Smoking, environmental tobacco smoke, and risk of renal cell cancer: a population-based case-control study. BMC Cancer 8. doi:10.1186/1471-2407-8-387
Thévenin, A.F., Zony, C.L., Bahnson, B.J., Colman, R.F., 2011. GST pi modulates JNK activity through a direct interaction with JNK substrate, ATF2. Protein Sci. Publ. Protein Soc. 20, 834–848. doi:10.1002/pro.609
Thier, R., Brüning, T., Roos, P.H., Rihs, H.-P., Golka, K., Ko, Y., Bolt, H.M., 2003. Markers of genetic susceptibility in human environmental hygiene and toxicology: the role of selected CYP, NAT and GST genes. Int. J. Hyg. Environ. Health 206, 149–171. doi:10.1078/1438-4639-00209

GSTA1, GSTM1, GSTP1 and GSTT1 polymorphisms in RCC
114
Tobiume, K., Matsuzawa, A., Takahashi, T., Nishitoh, H., Morita, K., Takeda, K., Minowa, O., Miyazono, K., Noda, T., Ichijo, H., 2001. ASK1 is required for sustained activations of JNK/p38 MAP kinases and apoptosis. EMBO Rep. 2, 222–228. doi:10.1093/embo-reports/kve046
Towbin, H., Staehelin, T., Gordon, J., 1979. Electrophoretic transfer of proteins from polyacrylamide gels to nitrocellulose sheets: procedure and some applications. Proc. Natl. Acad. Sci. U. S. A. 76, 4350–4354.
Townsend, D.M., Findlay, V.L., Tew, K.D., 2005. Glutathione S-transferases as regulators of kinase pathways and anticancer drug targets. Methods Enzymol. 401, 287–307. doi:10.1016/S0076-6879(05)01019-0
Townsend, D.M., Tew, K.D., 2003. The role of glutathione-S-transferase in anti-cancer drug resistance. Oncogene 22, 7369–7375. doi:10.1038/sj.onc.1206940
Valavanidis, A., Vlachogianni, T., Fiotakis, C., 2009. 8-hydroxy-2′ -deoxyguanosine (8-OHdG): A Critical Biomarker of Oxidative Stress and Carcinogenesis. J. Environ. Sci. Health Part C 27, 120–139. doi:10.1080/10590500902885684
Vatten, L.J., Trichopoulos, D., Holmen, J., Nilsen, T.I.L., 2007. Blood pressure and renal cancer risk: the HUNT Study in Norway. Br. J. Cancer 97, 112–114. doi:10.1038/sj.bjc.6603823
Wahlgren, T., Harmenberg, U., Sandström, P., Lundstam, S., Kowalski, J., Jakobsson, M., Sandin, R., Ljungberg, B., 2013. Treatment and overall survival in renal cell carcinoma: a Swedish population-based study (2000-2008). Br. J. Cancer 108, 1541–1549. doi:10.1038/bjc.2013.119
Watanabe, K.H., Djordjevic, M.V., Stellman, S.D., Toccalino, P.L., Austin, D.F., Pankow, J.F., 2009. Incremental lifetime cancer risks computed for benzo[a]pyrene and two tobacco-specific N-nitrosamines in mainstream cigarette smoke compared with lung cancer risks derived from epidemiologic data. Regul. Toxicol. Pharmacol. RTP 55, 123–133. doi:10.1016/j.yrtph.2009.06.007
Watson, M.A., Stewart, R.K., Smith, G.B., Massey, T.E., Bell, D.A., 1998. Human glutathione S-transferase P1 polymorphisms: relationship to lung tissue enzyme activity and population frequency distribution. Carcinogenesis 19, 275–280.
Weikert, S., Boeing, H., Pischon, T., Weikert, C., Olsen, A., Tjonneland, A., Overvad, K., Becker, N., Linseisen, J., Trichopoulou, A., Mountokalakis, T., Trichopoulos, D., Sieri, S., Palli, D., Vineis, P., Panico, S., Peeters, P.H.M., Bueno-de-Mesquita, H.B., Verschuren, W.M.M., Ljungberg, B., Hallmans, G., Berglund, G., Gonzalez, C.A., Dorronsoro, M., Barricarte, A., Tormo, M.J., Allen, N., Roddam, A., Bingham, S., Khaw, K.-T., Rinaldi, S., Ferrari, P., Norat, T., Riboli, E., 2008. Blood Pressure and Risk of Renal Cell Carcinoma in the European Prospective Investigation into Cancer and Nutrition. Am. J. Epidemiol. 167, 438–446. doi:10.1093/aje/kwm321
Wheeler, J.B., Stourman, N.V., Thier, R., Dommermuth, A., Vuilleumier, S., Rose, J.A., Armstrong, R.N., Guengerich, F.P., 2001. Conjugation of haloalkanes by bacterial and mammalian glutathione transferases: mono- and dihalomethanes. Chem. Res. Toxicol. 14, 1118–1127.
Widersten, M., Holmström, E., Mannervik, B., 1991. Cysteine residues are not essential for the catalytic activity of human class Mu glutathione transferase M1a-1a. FEBS Lett. 293, 156–159.
Wiencke, J.K., 2002. DNA adduct burden and tobacco carcinogenesis. Oncogene 21, 7376–7391. doi:10.1038/sj.onc.1205799
Wiencke, J.K., Pemble, S., Ketterer, B., Kelsey, K.T., 1995. Gene deletion of glutathione S-transferase theta: correlation with induced genetic damage and potential role in endogenous

GSTA1, GSTM1, GSTP1 and GSTT1 polymorphisms in RCC
115
mutagenesis. Cancer Epidemiol. Biomark. Prev. Publ. Am. Assoc. Cancer Res. Cosponsored Am. Soc. Prev. Oncol. 4, 253–259.
Wu, B., Dong, D., 2012. Human cytosolic glutathione transferases: structure, function, and drug discovery. Trends Pharmacol. Sci. 33, 656–668. doi:10.1016/j.tips.2012.09.007
Wu, W., Peden, D., Diaz-Sanchez, D., 2012. Role of GSTM1 in resistance to lung inflammation. Free Radic. Biol. Med. 53, 721–729. doi:10.1016/j.freeradbiomed.2012.05.037
Xu, S., Wang, Y., Roe, B., Pearson, W.R., 1998. Characterization of the human class Mu glutathione S-transferase gene cluster and the GSTM1 deletion. J. Biol. Chem. 273, 3517–3527.
Yadav, P., Chatterjee, A., Bhattacharjee, A., 2014. Identification of deleterious nsSNPs in α, μ, π and θ class of GST family and their influence on protein structure. Genomics Data 2, 66–72. doi:10.1016/j.gdata.2014.03.004
Yang, X., Long, S., Deng, J., Deng, T., Gong, Z., Hao, P., 2013. Glutathione S-Transferase Polymorphisms (GSTM1, GSTT1 and GSTP1) and Their Susceptibility to Renal Cell Carcinoma: An Evidence-Based Meta-Analysis. PLoS ONE 8, e63827. doi:10.1371/journal.pone.0063827
Ye, Z., Song, H., Higgins, J.P.T., Pharoah, P., Danesh, J., 2006. Five glutathione s-transferase gene variants in 23,452 cases of lung cancer and 30,397 controls: meta-analysis of 130 studies. PLoS Med. 3, e91. doi:10.1371/journal.pmed.0030091
Yong, L.C., Schulte, P.A., Wiencke, J.K., Boeniger, M.F., Connally, L.B., Walker, J.T., Whelan, E.A., Ward, E.M., 2001. Hemoglobin adducts and sister chromatid exchanges in hospital workers exposed to ethylene oxide: effects of glutathione S-transferase T1 and M1 genotypes. Cancer Epidemiol. Biomark. Prev. Publ. Am. Assoc. Cancer Res. Cosponsored Am. Soc. Prev. Oncol. 10, 539–550.

GSTA1, GSTM1, GSTP1 and GSTT1 polymorphisms in RCC
116
LIST OF ABREVIATIONS
4-HNE: 4-hydorxynonenal
8-OHdG: 8-hydroxy-2′-deoxyguanosine
APS: amonium per-sulphate
ASK1: apoptosis signal-regulating kinase
B(a)P: benzo(a)pyrene
BCA: bicinchoninic acid
BMI: bodi mass index
BPDE: benzo(a)pyrene diolepoxide
BSA: bovine serum albumine
Ca: cases
ccRCC: clear renal cell carcinoma
chRCC: chromophobe renal cell racinoma
CI: confidence interval
Co: controls
DNA: deoxyribonucleic acid
DTT: dithiothreitol
EDTA: Ethylenediaminetetraacetic acid
ELISA: enzyme linked immunosorbent assays
FAAD: Fas-Associated protein with Death Domain
GST: glutathione S-transferase
GSH: glutathione
HRP: horseradish peroxidase
IRAC: International Agency for Research on Cancer
ISUP: International Society of Urological Pathology
JNK1: c-Jun NH2-terminal kinase
MAPK: mitogen activated kinase
mRCC: metastatic renal cell carcinoma
OR: odds ratio
PAH: polyaromatic hydrocarbons
PARP: Poly (ADP-ribose) polymerase

GSTA1, GSTM1, GSTP1 and GSTT1 polymorphisms in RCC
117
PCR: polymerase chain reaction
pRCC: papillary renal cell carcinoma
RCC: renal cell carcinoma
RFLP: restriction fragment length polymorphism
RNOS: reactive nitrogen oxygen species
ROS: reactive oxygen species
RR: relative risk
SAPK: stress-activated protein kinase
SDS: sodium dodecyl sulfate
SDS-PAGE: sodium dodecyl sulfate-polyacrilamide gel electrophoresis
SNP: single nucleotide polyorphism
TCC: transitional cell carcinoma
TNM: tumor–node–metastasis
TRAF2: factor 2 bound to the TNFα receptor
Trx: thioredoxin
UICC: Union for International Cancer Control
UDP: Uridine diphosphate
WHO: World health organisation

GSTA1, GSTM1, GSTP1 and GSTT1 polymorphisms in RCC
118
BIOGRAPHY
Teaching Assistant Vesna Ćorić, MD was born in Belgrade in 1985, where she
completed her elementary and high school education with honors. In 2004, she started her
studies at Faculty of Medicine, University of Belgrade. Over the course of her studies, she was
engaged as a student teaching assistant at the Institute of Human Genetics (2005-2006),
Institute of Medical Pathology (2007-2008) and at the Institute of Medical and Clinical
Biochemistry (2007-2010), at the Faculty of Medicine, University of Belgrade. She received the
Scholarship from Ministry of Education of Serbia (2005-2010) and Scholarship Endowment of
Dragoljub Marinkovic, managed by the University of Belgrade (2008-2010). In 2007, Vesna Ćorić
joined the research group headed by Professor dr Tatjana Simić, Vice Dean for Research at
Faculty of Medicine, University of Belgrade. She took a special interest in studying the
potential role of glutathione S-transferase polymorphisms in patients with renal cell carcinoma.
She presented the results of her experimental work at numerous foreign and domestic
conferences and won two prizes for best oral presentations. She graduated from the School of
Medicine University of Belgrade in 2010, with average grade 9.31/10.00.
In 2010/2011, Vesna Ćorić enrolled in her PhD studies at the School of Medicine,
University of Belgrade – Molecular Medicine module. In 2011, she started working at the
Institute of Medical and Clinical Biochemistry as a Research Trainee, on project No. 175052
entitled “The role of glutathione S-transferase polymorphisms in susceptibility to disease
development”, financed by the Serbian Ministry of Education and Science. In 2012, she
became a Teaching Associate in the field of Medical Biochemistry. During the school year
2013/2014, Vesna Ćorić started her residency in Laboratory Medicine and in September 2014
she was promoted to a Teaching Assistant. She participated in numerous domestic and foreign
conferences. Dr Ćorić attended the „SFRR-IUBMB Advanced School 2012“ summer school
in Spetses (Greece), where she won the prize for best poster presentation. In 2013 she spent 3
months in the ERAWEB (Erasmus Mundus – Western Balkans) academic exchange program
in Torino (Italy) at the Medical Faculty, University of Torino, where she worked on a project
entitled „Optimization of oncological therapy: new drugs against Multidrug Resistance“,
headed by Professor dr Chiara Riganti. From 2014-2016 Dr Ćorić acted as a PhD
representative within the Executive board of ORPHEUS (Organization of PhD education in
Biomedicine and Health Sciences in the European System) and during that time she organized
GSTA1, GSTM1, GSTP1 and GSTT1 polymorphisms in RCC
119
several workshops on PhD education. She participated in establishing the first PhD candidates’
association at the School of Medicine, University of Belgrade.
Vesna Ćorić is the author/co-author of 15 in extenso papers published in journals
indexed in the Science Citation Index (SCI). Her papers have been cited 76 times according to
SCOPUS, and her h index is 4.


1. Autorstvo - Dozvoljavate umnožavanje, distribuciju i javno saopštavanje dela, i prerade,
ako se navede ime autora na način određen od strane autora ili davaoca licence, čak i u
komercijalne svrhe. Ovo je najslobodnija od svih licenci.
2. Autorstvo – nekomercijalno. Dozvoljavate umnožavanje, distribuciju i javno
saopštavanje dela, i prerade, ako se navede ime autora na način određen od strane autora ili
davaoca licence. Ova licenca ne dozvoljava komercijalnu upotrebu dela.
3. Autorstvo - nekomercijalno – bez prerade. Dozvoljavate umnožavanje, distribuciju i
javno saopštavanje dela, bez promena, preoblikovanja ili upotrebe dela u svom delu, ako se
navede ime autora na način određen od strane autora ili davaoca licence. Ova licenca ne
dozvoljava komercijalnu upotrebu dela. U odnosu na sve ostale licence, ovom licencom se
ograničava najveći obim prava korišćenja dela.
4. Autorstvo - nekomercijalno – deliti pod istim uslovima. Dozvoljavate umnožavanje,
distribuciju i javno saopštavanje dela, i prerade, ako se navede ime autora na način određen
od strane autora ili davaoca licence i ako se prerada distribuira pod istom ili sličnom
licencom. Ova licenca ne dozvoljava komercijalnu upotrebu dela i prerada.
5. Autorstvo – bez prerade. Dozvoljavate umnožavanje, distribuciju i javno saopštavanje
dela, bez promena, preoblikovanja ili upotrebe dela u svom delu, ako se navede ime autora
na način određen od strane autora ili davaoca licence. Ova licenca dozvoljava komercijalnu
upotrebu dela.
6. Autorstvo - deliti pod istim uslovima. Dozvoljavate umnožavanje, distribuciju i javno saopštavanje dela, i prerade, ako se navede ime autora na način određen od strane autora ili davaoca licence i ako se prerada distribuira pod istom ili sličnom licencom. Ova licenca dozvoljava komercijalnu upotrebu dela i prerada. Slična je softverskim licencama, odnosno licencama otvorenog koda.