the astrophysical journal, 550:691 2001. the american...
TRANSCRIPT
THE ASTROPHYSICAL JOURNAL, 550 :691È702, 2001 April 1( 2001. The American Astronomical Society. All rights reserved. Printed in U.S.A.
MONTE CARLO SIMULATIONS OF GLOBULAR CLUSTER EVOLUTION. II. MASS SPECTRA,STELLAR EVOLUTION, AND LIFETIMES IN THE GALAXY
KRITEN J. JOSHI,1 CODY P. NAVE,2 AND FREDERIC A. RASIO3,4Department of Physics, Massachusetts Institute of Technology, 6-201 MIT, 77 Massachusetts Avenue, Cambridge, MA 02139
Received 1999 December 8 ; accepted 2000 November 30
ABSTRACTWe study the dynamical evolution of globular clusters using our new two-dimensional Monte Carlo
code, and we calculate the lifetimes of clusters in the Galactic environment. We include the e†ects of amass spectrum, mass loss in the Galactic tidal Ðeld, and stellar evolution. We consider initial Kingmodels containing N \ 105È3 ] 105 stars, with the dimensionless central potential 3, and 7, andW0\ 1,with power-law mass functions m~a, with a \ 1.5, 2.5, and 3.5. The evolution is followed up to corecollapse or disruption, whichever occurs Ðrst. We compare our results with those from similar calcu-lations using Fokker-Planck methods. The disruption and core collapse times of our models are signiÐ-cantly longer than those of one-dimensional Fokker-Planck models. This is consistent with recentcomparisons with direct N-body simulations, which have also shown that the one-dimensional Fokker-Planck models can signiÐcantly overestimate the escape rate from tidally truncated clusters. However, weÐnd that our results are in very good agreement with recent two-dimensional Fokker-Planck calcu-lations, for a wide range of initial conditions, although our Monte Carlo models have a slightly lowermass-loss rate. We Ðnd even closer agreement of our results with modiÐed Fokker-Planck calculationsthat take into account the Ðnite nature of the system. In agreement with previous studies, our resultsshow that the direct mass loss due to stellar evolution can signiÐcantly accelerate the mass-loss ratethrough the tidal boundary, by reducing the binding energy of the cluster and making it expand. Thise†ect causes most clusters with a low initial central concentration to disrupt quickly in the(W0[ 3)Galactic tidal Ðeld. The disruption is particularly rapid in clusters with a relatively Ñat mass spectrum.Only clusters born with high central concentrations or with very steep initial mass functions(W0Z 7)
are likely to survive to the present and undergo core collapse. We identify the mechanism by(a Z 3.5)which clusters disrupt as a dynamical instability in which the rate of mass loss increases catastrophicallyas the tidal boundary moves inward on the crossing timescale. To understand the various processes thatlead to the escape of stars, we study the velocity distribution and orbital characteristics of escaping stars.We also compute the lifetime of a cluster on an eccentric orbit in the Galaxy, such that it Ðlls its Rochelobe only at perigalacticon. We Ðnd that such an orbit can extend the disruption time by at most afactor of a few compared to a circular orbit in which the cluster Ðlls its Roche lobe at all times.Subject headings : celestial mechanics, stellar dynamics È globular clusters : general È
methods : numerical
1. INTRODUCTION
The development of numerical methods for simulatingthe dynamical evolution of dense star clusters in phasespace started in the 1970s with Monte Carlo techniques(Henon 1971a, 1971b ; Spitzer 1987 and references therein),and several groups applied these techniques to addressproblems related to the evolution of globular clusters. Amethod based on the direct numerical integration of theFokker-Planck (F-P) equation in phase space was laterdeveloped by Cohn (1979, 1980). The F-P methods havesince been greatly improved, and they have been extendedto more realistic simulations that take into account(approximately) the presence of a mass spectrum and tidalboundaries (Takahashi 1995, 1996, 1997 ; Takahashi & Por-tegies Zwart 1998, 2000, hereafter TPZ00), binary inter-actions (Gao et al. 1991 ; Drukier et al. 1999), gravitationalshock heating by the galactic disk and bulge (Gnedin, Lee,& Ostriker 1999), and mass loss due to stellar evolution (see
1 1 Union Square South 17-B, New York, NY 10003 ; kjoshi=alum.mit.edu.
2 cpnave=mit.edu.3 rasio=mit.edu.4 Alfred P. Sloan Research Fellow.
Meylan & Heggie 1997 for a recent review). Direct N-bodysimulations can also be used to study globular clusterdynamics (see Aarseth 1999 for a recent review), but, untilrecently, they have been limited to rather unrealisticsystems containing very low numbers of stars. The GRAPEfamily of special-purpose computers now makes it possibleto perform direct N-body integrations for clusters contain-ing up to N D 32,000 single stars, although the computingtime for such large simulations remains considerable (seeMakino et al. 1997 and references therein). This is thesecond of a series of papers in which we study globularcluster dynamics using a Monte Carlo technique similar tothe original Henon (1971b) method. Parallel super-computers now make it possible for the Ðrst time to performMonte Carlo simulations for the dynamical evolution ofdense stellar systems containing up to N D 105È106 stars inless than D1 day of computing time.
The evolution of globular clusters in the Galacticenvironment has been studied using a variety of theoreticaland numerical techniques. The Ðrst comprehensive study ofcluster lifetimes was conducted by Cherno† & Weinberg(1990, hereafter CW90) using F-P simulations. Theyincluded the e†ects of a power-law mass spectrum, a tidalcuto† radius imposed by the tidal Ðeld of the Galaxy, and
691
692 JOSHI, NAVE, & RASIO Vol. 550
mass loss due to stellar evolution. Their results were sur-prising, and far reaching, since they showed for the Ðrst timethat the majority of clusters with a wide range of initialconditions would be disrupted in yr and would not[1010survive until core collapse. CW90 carried out their calcu-lations using a one-dimensional F-P method, in which thestellar distribution function in phase space is assumed todepend on the orbital energy only. However, more recently,similar calculations undertaken using direct N-body simu-lations gave cluster lifetimes up to an order of magnitudelonger compared to those computed by CW90 (Fukushige& Heggie 1995 ; Portegies Zwart et al. 1998). The discrep-ancy appears to be caused by an overestimated mass-lossrate in the one-dimensional F-P formulation (Takahashi &Portegies Zwart 1998), which does not properly account forthe velocity anisotropy in the cluster. To overcome thisproblem, new two-dimensional versions of the F-P method(in which the distribution function depends on both energyand angular momentum) have been employed (Takahashi1995, 1996, 1997 ; Drukier et al. 1999).
The two-dimensional F-P models provide cluster life-times in signiÐcantly better agreement with direct N-bodyintegrations (Takahashi & Portegies Zwart 1998). However,the two-dimensional F-P models still exhibit a slightlyhigher mass-loss rate compared to N-body simulations.This may result from the representation of the system interms of a continuous distribution function in the F-P for-mulation, which e†ectively models the behavior of thecluster in the N ] O limit. To test this possibility, Taka-hashi & Portegies Zwart (1998) introduced an additionalfree parameter in their F-P models, attempting to takelescinto account the Ðnite ratio of the crossing time to therelaxation time (see also Lee & Ostriker 1987 ; Ross,Mennim, & Heggie 1997). They used this free parameter tolower the overall mass-loss rate in their F-P models andobtained better agreement with N-body simulations(performed with up to N \ 32,768). TPZ00 show that,after calibration, a single value of gives consistent agree-lescment with N-body simulations for a broad range of initialconditions.
The Ðrst paper in this series presented details about ournew parallel Monte Carlo code as well as the results of aseries of initial test calculations (Joshi, Rasio, & PortegiesZwart 2000, hereafter Paper I). We found excellent agree-ment between the results of our test calculations and thoseof direct N-body and one-dimensional Fokker-Plancksimulations for a variety of single-component clusters (i.e.,containing equal-mass stars). However, we found that, fortidally truncated clusters, the mass-loss rate in our modelswas signiÐcantly lower and the core collapse times signiÐ-cantly longer than in corresponding one-dimensional F-Pcalculations. We noted that, for a single case (a W0 \ 3King model), our results were in good agreement with thoseof two-dimensional F-P calculations by K. Takahashi(1999, private communication).
In this paper we extend our Monte Carlo calculations tomulticomponent clusters (described by a continuous,power-law stellar mass function), and we study the evolu-tion of globular clusters with a broad range of initial condi-tions. Our calculations include an improved treatment ofmass loss through the tidal boundary, as well as mass lossdue to stellar evolution. Our new method treats the massloss through the tidal boundary more carefully in part bymaking the time step smaller, especially in situations where
the tidal mass loss can lead to an instability resulting inrapid disruption of the cluster. We also account for theshrinking of the tidal boundary in each time step by iter-atively removing stars with apocenter distances greaterthan the tidal boundary and recomputing the tidal radiususing the new (lower) mass of the cluster. We compare ournew results with those of CW90 and TPZ00. We also gobeyond these previous studies and explore several otherissues relating to the precollapse evolution of globular clus-ters. We study in detail the importance of the velocityanisotropy in determining the stellar escape rate. We alsocompare the orbital properties of escaping stars in dis-rupting and collapsing clusters. Finally, we consider thee†ects of an eccentric orbit in the Galaxy, allowing for thepossibility that a cluster may not Ðll its Roche lobe at allpoints in its orbit.
As in most previous studies, the calculations presented inthis paper are for clusters containing single stars only. Thedynamical e†ects of hard primordial binaries for the overallcluster evolution are not signiÐcant during most of the pre-collapse phase, although a large primordial binary fractioncould accelerate the evolution to core collapse sincebinaries are on average more massive than single stars.Energy generation through binaryÈsingle star and binary-binary interactions becomes signiÐcant only when thecluster approaches core collapse and interaction rates in thecore increase substantially (Hut, McMillan, & Romani1992 ; Gao et al. 1991 ; McMillan & Hut 1994). Formationof hard ““ three-body ÏÏ binaries can also be neglected untilthe cluster reaches a deep core collapse phase. During theprecollapse evolution, hard binaries behave approximatelylike single more massive stars, while soft binaries (whichhave a larger interaction cross section) may be disrupted.Since we do not include the e†ects of energy generation byprimordial binaries in our calculations, the (well-deÐned)core collapse times presented here may be reinterpreted ascorresponding approximately to the onset of the ““ binary-burning ÏÏ phase, during which a similar cluster containingbinaries would be supported in quasi-equilibrium byenergy-generating interactions with hard binaries in its core(Spitzer & Mathieu 1980 ; Goodman & Hut 1989 ; McMil-lan, Hut, & Makino 1990 ; Gao et al. 1991). Our calcu-lations of disruption times (for clusters that disrupt in thetidal Ðeld of the Galaxy before reaching core collapse) arelargely independent of the cluster binary content, since thecentral densities and core interaction rates in these clustersalways remain very low.
Our paper is organized as follows. In ° 2 we describe thetreatment of tidal stripping and mass loss due to stellarevolution in our Monte Carlo models, along with a dis-cussion of the initial conditions for our simulations. In ° 3we present the results of our simulations and comparisonswith F-P calculations. In ° 4 we summarize our results.
2. MONTE CARLO METHOD
Our code, described in detail in Paper I, is based on theorbit-averaged Monte Carlo method Ðrst developed byHenon (1971a, 1971b). Although in Paper I we only present-ed results of test calculations performed for single-component clusters, the method is completely general, andthe implementation of an arbitrary mass spectrum isstraightforward. This section describes additional featuresof our code that were not included in Paper I : an improvedtreatment of mass loss through the tidal boundary (° 2.1)
No. 2, 2001 GLOBULAR CLUSTER EVOLUTION. II. 693
and a simple implementation of stellar evolution (° 2.2). Theconstruction of initial multicomponent King models for ourstudy of cluster lifetimes is described in ° 2.3. The highlysimpliÐed treatments of tidal e†ects and stellar evolutionadopted here are for consistency with previous studies, sinceour intent in this paper is still mainly to establish the accu-racy of our code by presenting detailed comparisons withthe results of other methods. In future work, however, weintend to implement more sophisticated and up-to-datetreatments of these e†ects.
2.1. T idal Stripping of StarsIn an isolated cluster, the mass-loss rate (up to core
collapse) is relatively small, since escaping stars mustacquire positive energies mostly through rare, strong inter-actions in the dense cluster core (see discussion in Paper I,° 3.1). In contrast, for a tidally truncated cluster, the massloss is dominated by di†usion across the tidal boundary(also referred to as ““ tidal stripping ÏÏ). In our Monte Carlosimulations, a star is assumed to be tidally stripped from thecluster (and lost instantaneously) if the apocenter of its orbitin the cluster is outside the tidal radius. This is in contrast tothe energy-based escape criterion that is used in one-dimensional F-P models, where a star is considered lost ifits energy is greater than the energy at the tidal radius,regardless of its angular momentum. As noted in Paper I,the two-dimensional treatment is crucial in order to avoidoverestimating the escape rate, since stars with high angularmomentum, i.e., on more circular orbits, are less likely to betidally stripped from the cluster than those (with the sameenergy) on more radial orbits.
A subtle yet important aspect of the mass loss across thetidal boundary is the possibility of the tidal strippingprocess becoming unstable if the tidal boundary movesinward too quickly. As the total mass of the clusterdecreases through the escape of stars, the tidal radius of thecluster shrinks. This causes even more stars to escape, andthe tidal boundary shrinks further. If at any time during theevolution of the cluster the density gradient at the tidalradius is too large, this can lead to an unstable situation, inwhich the tidal radius continues to shrink on the dynamicaltimescale, causing the cluster to disrupt. The developmentof this instability characterizes the Ðnal evolution of all clus-ters with a low initial central concentration that disrupt inthe Galactic tidal Ðeld before reaching core collapse.
We test for this instability at each time step in our simula-tions, by iteratively removing escaping stars and recomput-ing the tidal radius with the appropriately lowered clustermass. For stable models, this iteration converges quickly,giving a Ðnite escape rate. Even before the development ofthe instability, this iterative procedure must be used for anaccurate determination of the mass-loss rate. When themass-loss rate due to tidal stripping is high, we also imposea time step small enough that no more than 1% of the totalmass is lost in a single time step. This is to ensure that thepotential is updated frequently enough to take the mass lossinto account. This improved treatment of tidal strippingwas not used in our calculations for Paper I. However, allthe results presented in Paper I were for clusters with equal-mass stars, with no stellar evolution. Under those condi-tions, all models reach core collapse, with no disruptions.The issue of unstable mass loss is not signiÐcant in thosecases, and hence the results of Paper I are una†ected.
2.2. Stellar EvolutionOur simpliÐed treatment follows those adopted by CW90
and TPZ00. We assume that a star evolves instantaneouslyto become a compact remnant at the end of its main-sequence lifetime. Indeed, since the evolution of our clustermodels takes place on the relaxation timescale (i.e., the timestep is a fraction of the relaxation time yr), whilet
rZ 109
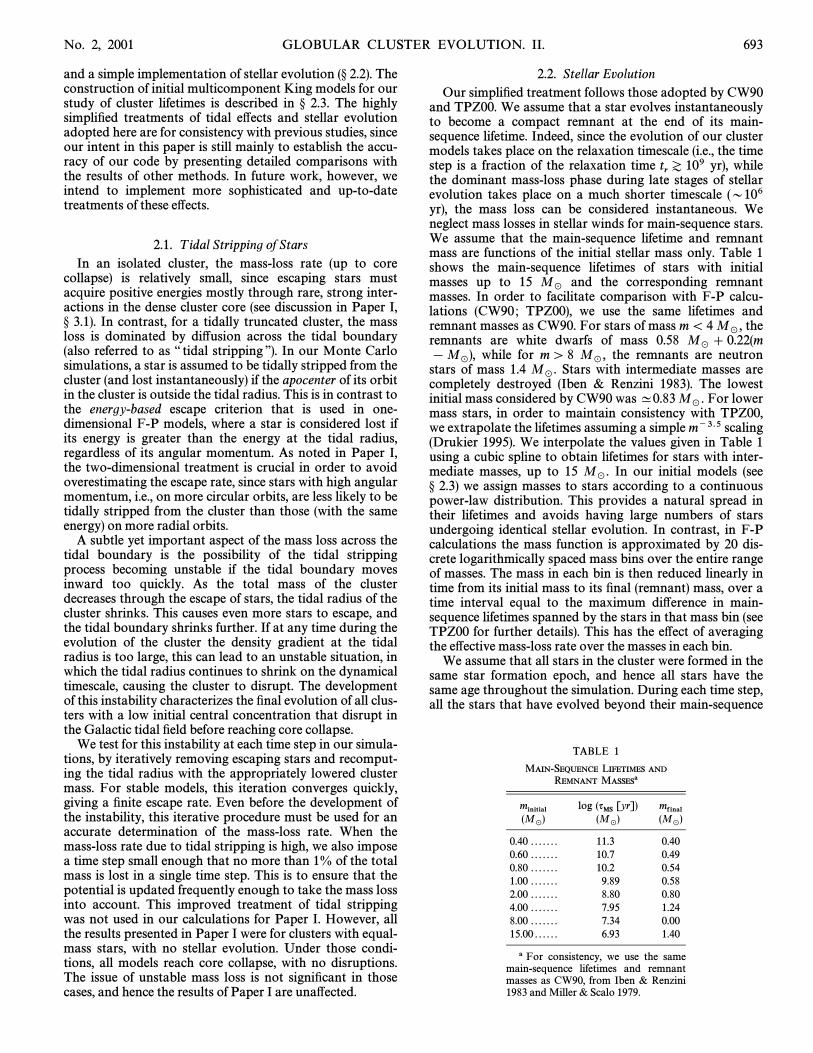
the dominant mass-loss phase during late stages of stellarevolution takes place on a much shorter timescale (D106yr), the mass loss can be considered instantaneous. Weneglect mass losses in stellar winds for main-sequence stars.We assume that the main-sequence lifetime and remnantmass are functions of the initial stellar mass only. Table 1shows the main-sequence lifetimes of stars with initialmasses up to 15 and the corresponding remnantM
_masses. In order to facilitate comparison with F-P calcu-lations (CW90; TPZ00), we use the same lifetimes andremnant masses as CW90. For stars of mass m\ 4 theM
_,
remnants are white dwarfs of mass 0.58 M_
] 0.22(mwhile for m[ 8 the remnants are neutron[ M
_), M
_,
stars of mass 1.4 Stars with intermediate masses areM_
.completely destroyed (Iben & Renzini 1983). The lowestinitial mass considered by CW90 was ^0.83 For lowerM
_.
mass stars, in order to maintain consistency with TPZ00,we extrapolate the lifetimes assuming a simple m~3.5 scaling(Drukier 1995). We interpolate the values given in Table 1using a cubic spline to obtain lifetimes for stars with inter-mediate masses, up to 15 In our initial models (seeM
_.
° 2.3) we assign masses to stars according to a continuouspower-law distribution. This provides a natural spread intheir lifetimes and avoids having large numbers of starsundergoing identical stellar evolution. In contrast, in F-Pcalculations the mass function is approximated by 20 dis-crete logarithmically spaced mass bins over the entire rangeof masses. The mass in each bin is then reduced linearly intime from its initial mass to its Ðnal (remnant) mass, over atime interval equal to the maximum di†erence in main-sequence lifetimes spanned by the stars in that mass bin (seeTPZ00 for further details). This has the e†ect of averagingthe e†ective mass-loss rate over the masses in each bin.
We assume that all stars in the cluster were formed in thesame star formation epoch, and hence all stars have thesame age throughout the simulation. During each time step,all the stars that have evolved beyond their main-sequence
TABLE 1
MAIN-SEQUENCE LIFETIMES AND
REMNANT MASSESa
minitial log (qMS [yr]) mfinal(M
_) (M
_) (M
_)
0.40 . . . . . . . 11.3 0.400.60 . . . . . . . 10.7 0.490.80 . . . . . . . 10.2 0.541.00 . . . . . . . 9.89 0.582.00 . . . . . . . 8.80 0.804.00 . . . . . . . 7.95 1.248.00 . . . . . . . 7.34 0.0015.00 . . . . . . 6.93 1.40
a For consistency, we use the samemain-sequence lifetimes and remnantmasses as CW90, from Iben & Renzini1983 and Miller & Scalo 1979.

694 JOSHI, NAVE, & RASIO Vol. 550
TABLE 2
FAMILY PROPERTIESa
trh Rg
Family F (Gyr) (kpc)
1 . . . . . . 5.00] 104 2.4 5.82 . . . . . . 1.32] 105 6.4 153 . . . . . . 2.25] 105 11 264 . . . . . . 5.93] 105 29 68
a Sample parameters for families 1È4, fora King model, with andW0\ 3 m6 \ 1 M
_N \ 105. Distance to the Galactic center Rgis computed assuming that the cluster is in a
circular orbit, Ðlling its Roche lobe at alltimes.
lifetimes are labeled as remnants, and their masses arechanged accordingly. In the initial stages of evolution (t [108 yr), when the mass-loss rate due to stellar evolution ishighest, care is taken to make the time step small enough sothat no more than 1% of the total mass is lost in a singletime step. This is to ensure that the system remains veryclose to virial equilibrium through this phase.
2.3. Initial ModelsThe initial condition for each simulation is a King model
with a power-law mass spectrum. In order to facilitate com-parison with the F-P calculations of CW90 and TPZ00, weselect the same set of initial King models for our simula-tions, with values of the dimensionless central potential
3, and 7. Most of our calculations were performedW0\ 1,with N \ 105 stars, with a few calculations repeated withN \ 3 ] 105 stars and showing no signiÐcant di†erences inthe evolution. We construct the initial model by Ðrst gener-ating a single-component King model with the selected W0.We then assign masses to the stars according to a power-law mass function
f (m)P m~a , (1)
with m between 0.4 and 15 We consider three di†erentM_
.values for the power-law index, a \ 1.5, 2.5, and 3.5,assuming no initial mass segregation. Although this methodof generating a multicomponent initial King model is con-venient and widely used to create initial conditions fornumerical work (including N-body, F-P, and Monte Carlosimulations), the resulting initial model is not in strict virialequilibrium since the masses are assigned independently ofthe positions and velocities of stars. However, we Ðnd thatthe initial clusters relax to virial equilibrium within just afew time steps in our simulations. Virial equilibrium is thenmaintained to high accuracy during the entire calculation,with the virial ratio 2T / oW o \ 1 to within less than 1%.
In addition to selecting the dimensionless model parame-ters N, and a (which specify the initial dynamical stateW0,of the system), we must also relate the dynamical timescalewith the stellar evolution timescale for the system. The basicunit of time in our models is scaled to the relaxation time.Since the stellar evolution timescale is not directly related tothe dynamical timescale, the lifetimes of stars (in yr) cannotbe computed directly from our code units. Hence, in orderto compute the mass loss due to stellar evolution, we mustadditionally relate the two timescales by converting theevolution time to physical units. To maintain consistencywith F-P calculations, we use the same prescription as
CW90. We assume a value for the initial relaxation time ofthe system, which is deÐned as follows :
tr\ 2.57F (Myr) , (2)
where
F4M0M
_
Rg
kpc220 km s~1
vg
1ln N
. (3)
Here is the total initial mass of the cluster, is itsM0 Rgdistance to the Galactic center (assuming a circular orbit),
is the circular speed of the cluster, and N is the totalvgnumber of stars. (This expression for the relaxation time is
derived from eqs. [1], [2], and [6] of CW90 with m\M_
,and Following CW90, a group of modelsr \ r
t, c1\ 1.)
with the same value of F (constant relaxation time) at thebeginning of the simulation is referred to as a ““ family.ÏÏ Oursurvey covers families 1, 2, 3, and 4 of CW90. For each valueof and a, we consider four di†erent models, one fromW0each family.
To convert from our code units, or ““ virial units ÏÏ (seePaper I, ° 2.8 for details), to physical units, we proceed asfollows. For a given family (i.e., a speciÐed value of F),cluster mass and N, we compute the distance to theM0,Galactic center using equation (3). The circular velocityR
gof 220 km s~1 for the cluster (combined with thenRg)
provides an inferred value for the mass of the Galaxy Mgcontained within the cluster orbit. Using andM0, M
g, R
g,
we compute the tidal radius for the cluster, as rt\
in physical units (pc). The ratio of the tidalRg(M0/3M
g)1@3,
radius to the virial radius (i.e., in code units) for a Kingrtmodel depends only on and hence is known for theW0initial model. This gives the virial radius in pc. The unit of
mass is simply the total initial cluster mass HavingM0.expressed the units of distance and mass in physical units,the unit of evolution time (which is proportional to therelaxation time) can easily be converted to physical units(yr) using equation (31) from Paper I.
Table 2 shows the value of F for the four selected families.For reference, we also give the relaxation time at the half-mass radius for the models with and a \ 2.5trh W0\ 3(mean stellar mass which we compute using them6 ^ 1 M
_),
standard expression (see, e.g., Spitzer 1987),
trh \ 0.138N1@2r
h3@2
m6 1@2G1@2 ln N, (4)
where is the half-mass radius of the cluster.rh
3. RESULTS
In Paper I we presented our Ðrst results for the evolutionof single-component clusters up to core collapse. We com-puted core collapse times for the entire sequence of Kingmodels including the e†ects of a tidal bound-(W0\ 1È12),ary. Here we extend our study to clusters with a power-lawmass spectrum and mass loss due to stellar evolution.
3.1. Qualitative E†ects of T idal Mass L oss andStellar Evolution
We begin by brieÑy reviewing the evolution of single-component, tidally truncated systems. In Figure 1 we showthe core collapse times for King models with W0\ 1È12(Paper I). The core collapse times for tidally truncatedmodels are compared with equivalent isolated models.Although the isolated models also begin as King models

No. 2, 2001 GLOBULAR CLUSTER EVOLUTION. II. 695
FIG. 1.ÈComparison of core collapse times for single-W0\ 1È12component King models. Isolated models, i.e., without an enforced tidalboundary, are indicated by Ðlled circles, while tidally truncated models areindicated by Ðlled squares.
with a Ðnite tidal radius, the tidal boundary is not enforcedduring their evolution, allowing the cluster to expand freely.The most notable result is that the maximum core collapsetime for the tidally truncated clusters occurs at W0^ 5,compared to for isolated clusters. This is becauseW0\ 1the King models have a less centrally concentratedlow-W0density proÐle and hence a higher density at the tidal radiuscompared to the models. This leads to higher masshigh-W0loss through the tidal boundary, which reduces the mass ofthe cluster and shortens the core collapse time. This e†ect isfurther complicated by the introduction of a nontrivial massspectrum and mass loss due to stellar evolution in thecluster.
In Figure 2 we show a comparison of the mass-loss ratedue to the tidal boundary, a power-law mass spectrum, andstellar evolution. We consider the evolution of a W0\ 3King model, in four di†erent environments. All models con-sidered in this comparison belong to family 1 (see ° 2.3). WeÐrst compare an isolated, single-component model (withoutan enforced tidal boundary) and a tidally truncated model(as in Fig. 1). Clearly, the presence of the tidal boundary isresponsible for almost all the mass loss from the cluster, andit slightly reduces the core collapse time. Introducing apower-law mass spectrum further reduces the core collapsetime, since mass segregation increases the core density andaccelerates the development of the gravothermal instability.The shorter core collapse time reduces the total mass lossthrough the tidal boundary by leaving less time for evapo-ration. This results in a higher Ðnal mass compared to thesingle-component system, even though the mass-loss rate ishigher. Finally, allowing mass loss through stellar evolutioncauses even faster overall mass loss, which eventually dis-rupts the system. The introduction of a Salpeter-like power-law initial mass function (a \ 2.5) is sufficient to cause thiscluster to disrupt before core collapse.
FIG. 2.ÈComparison of the mass-loss rate in a King model dueW0\ 3to a tidal boundary, a power-law mass spectrum, and stellar evolution. Themass of the cluster, in units of the initial mass is shown as a function ofM0,time. The solid and short-dashed lines are for a single-component modelwith and without a tidal boundary (family 1), respectively. The dotted lineshows a model with a power-law mass spectrum, with a \ 2.5, and a tidalboundary. The long-dashed line is for a more realistic model with a tidalboundary, power-law mass spectrum, and stellar evolution. The circle atthe end of the line indicates core collapse. The line without a circle indi-cates disruption of the cluster.
The presence of a tidal boundary causes stars on radialorbits in the outer regions of the cluster to be removedpreferentially. This produces a signiÐcant anisotropy in theouter regions as the cluster evolves. As noted in Paper I, aproper treatment of this anisotropy is essential in comput-ing the mass-loss rate. A star in an orbit with low angularmomentum has a larger apocenter distance compared to astar (with the same energy) in a high angular momentumorbit. Hence, stars in low angular momentum (i.e., radial)orbits are preferentially lost through the tidal boundary,causing an anisotropy to develop in the cluster. In one-dimensional F-P models, this is not taken into account, andtherefore one-dimensional F-P models predict a muchlarger mass loss compared to two-dimensional models. InFigure 3 we show the anisotropy parameter b \ 1 [ p
t2/p
r2,
for a King model (a \ 2.5, family 1), at two di†erentW0\ 3times during its evolution. Here and are the one-p
tprdimensional tangential and radial velocity dispersions,
respectively. The initial King model is isotropic. At latertimes, the anisotropy in the outer region grows steadily asthe tidal radius moves inward.
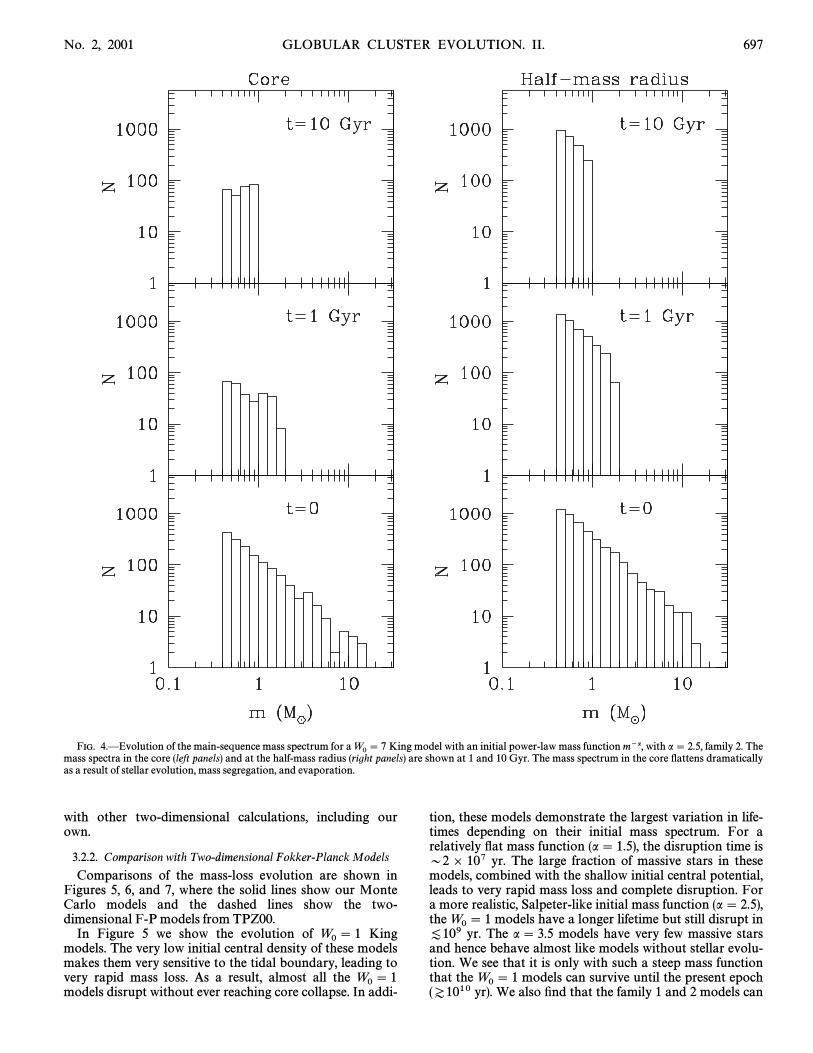
Another important consequence of stellar evolution andmass segregation is the gradual Ñattening of the stellar massfunction as the cluster evolves. In Figure 4 we show themain-sequence mass spectrum in the core and at the half-mass radius of a King model (a \ 2.5, family 2), atW0\ 7two di†erent times during its evolution. Since the heavierstars concentrate in the core and have lower mean veloci-

696 JOSHI, NAVE, & RASIO Vol. 550
FIG. 3.ÈEvolution of the anisotropy parameter for ab \ 1 [ pt2/p
r2
King model (a \ 2.5, family 1). The bottom panel shows the initialW0\ 3isotropic King model. The top panel shows the anisotropy just beforedisruption. The radius is in units of the virial radius. Stars on highlyeccentric orbits with large apocenter distances in the cluster are prefer-entially removed, causing to increase in the outer region.p
t2/p
r2
ties, the mass loss across the tidal boundary occurs prefer-entially for the lighter stars. This leads to a gradualÑattening of the overall mass function of the cluster.However, this picture is somewhat complicated by stellarevolution, which continuously depletes high-mass starsfrom the cluster. The remaining heavier stars graduallyaccumulate in the inner regions as the cluster evolves.Therefore, the Ñattening of the mass function becomes par-ticularly evident in the cluster core.
3.2. Cluster L ifetimes : Comparison withFokker-Planck Results
We now present our survey of cluster lifetimes andcompare our results with equivalent one-dimensional andtwo-dimensional F-P results. For each combination of W0and a, we perform four di†erent simulations (families 1È4),corresponding to di†erent initial relaxation times (see Table2). We follow the evolution until core collapse or disruption,whichever occurs Ðrst. We also stop the computation if thetotal bound mass decreases below 2% of the initial massand consider the cluster to be disrupted in such cases. Wecompare our results with those of two di†erent F-P studies :the one-dimensional F-P calculations of CW90 and themore recent two-dimensional calculations of TPZ00.
3.2.1. Comparison with One-dimensional Fokker-Planck Models
Table 3 compares our Monte Carlo models with the one-dimensional F-P calculations conducted by CW90. Follow-ing the same notation as CW90, the Ðnal core collapse of acluster is denoted by ““ C ÏÏ and disruption by ““D.ÏÏ The Ðnal
mass of the cluster (in units of the initial mass) and thelifetime in units of 109 yr (time to disruption or corecollapse) are also given. The evolution of clusters that reachcore collapse is not followed beyond the core collapsephase. The core collapse time is taken as the time when theinnermost Lagrange radius (radius containing 0.3% of thetotal mass of the cluster) becomes smaller than 0.001 (invirial units). For disrupting clusters, CW90 provide a valuefor the Ðnal mass, which corresponds to the point at whichthe tidal mass loss becomes unstable and the cluster dis-rupts on the dynamical timescale. However, we Ðnd that thepoint at which the instability develops depends sensitivelyon the method used for computing the tidal mass loss andrequires the potential to be updated on a very short time-scale. In this regime, since the system evolves (and disrupts)on the dynamical timescale, the orbit-averaged approxi-mation used to solve the F-P equation also breaks down.This is true for both Monte Carlo and F-P simulations. Theonly way to determine the point of instability reliably is tofollow the evolution on the dynamical timescale using directN-body integrations. Hence, for disrupting models wequote the Ðnal mass as zero and only provide the disruptiontime (which can be determined very accurately).
We Ðnd that all our Monte Carlo models disrupt laterthan those of CW90. However, for models that undergocore collapse, the core collapse times are shorter in somecases compared to CW90 because the lower mass-loss ratein our Monte Carlo models causes core collapse to takeplace earlier. The discrepancy in the disruption times some-times exceeds an order of magnitude (e.g., a \ 2.5).W0\ 1,On the other hand, the discrepancy in the lifetimes of theclusters with a \ 1.5, and 3 is only about a factor ofW0\ 12. These models disrupt very quickly, and a proper treat-ment of anisotropy does not extend their lifetimes verymuch, since the combination of a Ñat initial mass functionand a shallow initial potential leads to rapid disruption.
Out of 36 models, we Ðnd that half (18) of our MonteCarlo models reach core collapse before disruption, com-pared to fewer than 30% (10) of models in the CW90 survey.The longer lifetimes of our models allow more of the clus-ters to reach core collapse in our simulations. All the clus-ters that experience core collapse according to CW90 alsoexperience core collapse in our calculations. Since the maindi†erence between our models and those of CW90 comesfrom the di†erent mass-loss rates, we predictably Ðnd thatour results match more closely those of CW90 in all cases inwhich the overall mass loss up to core collapse is relativelysmall. For example, the more concentrated clusters (W0\7) with steep mass functions (a \ 2.5 and 3.5) show verysimilar behavior, with the discrepancy in Ðnal mass andcore collapse time being less than a factor of 2. However, wecannot expect complete agreement even in these cases, sincethe e†ects of anisotropy cannot be completely ignored.
The overall disagreement between our Monte Carlomodels and one-dimensional F-P models is very signiÐcant.This was also evident in some of the results presented inPaper I, where we compared core collapse times for tidallytruncated single-component King models, with one-dimensional F-P calculations by Quinlan (1996). This dis-crepancy has also been noted by Takahashi & PortegiesZwart (1998) and Portegies Zwart et al. (1998). Theimproved two-dimensional F-P code developed by Taka-hashi (1995, 1996, 1997) is now able to account properly forthe anisotropy, allowing for a more meaningful comparison
No. 2, 2001 GLOBULAR CLUSTER EVOLUTION. II. 697
FIG. 4.ÈEvolution of the main-sequence mass spectrum for a King model with an initial power-law mass function m~a, with a \ 2.5, family 2. TheW0\ 7mass spectra in the core (left panels) and at the half-mass radius (right panels) are shown at 1 and 10 Gyr. The mass spectrum in the core Ñattens dramaticallyas a result of stellar evolution, mass segregation, and evaporation.
with other two-dimensional calculations, including ourown.
3.2.2. Comparison with Two-dimensional Fokker-Planck Models
Comparisons of the mass-loss evolution are shown inFigures 5, 6, and 7, where the solid lines show our MonteCarlo models and the dashed lines show the two-dimensional F-P models from TPZ00.
In Figure 5 we show the evolution of KingW0\ 1models. The very low initial central density of these modelsmakes them very sensitive to the tidal boundary, leading tovery rapid mass loss. As a result, almost all the W0\ 1models disrupt without ever reaching core collapse. In addi-
tion, these models demonstrate the largest variation in life-times depending on their initial mass spectrum. For arelatively Ñat mass function (a \ 1.5), the disruption time isD2 ] 107 yr. The large fraction of massive stars in thesemodels, combined with the shallow initial central potential,leads to very rapid mass loss and complete disruption. Fora more realistic, Salpeter-like initial mass function (a \ 2.5),the models have a longer lifetime but still disrupt inW0\ 1
yr. The a \ 3.5 models have very few massive stars[109and hence behave almost like models without stellar evolu-tion. We see that it is only with such a steep mass functionthat the models can survive until the present epochW0\ 1
yr). We also Ðnd that the family 1 and 2 models can(Z1010

698 JOSHI, NAVE, & RASIO Vol. 550
TABLE 3
COMPARISON OF MONTE CARLO RESULTS WITH ONE-DIMENSIONAL FOKKER-PLANCK CALCULATIONSa
FAMILY 1 FAMILY 2 FAMILY 3 FAMILY 4
W0 a CW90 MC CW90 MC CW90 MC CW90 MC
1 . . . . . . 1.5 D D D D D D D D0.0092 0.019 0.0094 0.019 0.0093 0.02 0.0092 0.02
0 0 0 0 0 0 0 02.5 D D D D D D D D
0.034 0.43 0.034 0.46 0.035 0.55 0.034 0.580 0 0 0 0 0 0 0
3.5 D C D C D D D D2.5 31 2.9 52 3.1 55 3.2 700 0.07 0 0.02 0 0 0 0
3 . . . . . . 1.5 D D D D D D D D0.014 0.031 0.014 0.032 0.014 0.033 0.014 0.036
0 0 0 0 0 0 0 02.5 D D D D D D D D
0.28 3.6 0.29 5.1 0.29 5.8 0.29 6.50 0 0 0 0 0 0 0
3.5 C C C C D C D C21.5 33 44.4 83 42.3 130 43.5 3500.078 0.25 0.035 0.22 0 0.20 0 0.18
7 . . . . . . 1.5 D C D C D C D C1.0 2.9 3.0 6.6 4.2 10 5.9 210 0.02 0 0.02 0 0.02 0 0.02
2.5 C C C C C C C C9.6 6.3 22.5 10.5 35.5 21 83.1 600.26 0.50 0.26 0.47 0.26 0.47 0.25 0.41
3.5 C C C C C C C C10.5 6.0 31.1 22 51.3 38 131.3 800.57 0.78 0.51 0.70 0.48 0.67 0.49 0.67
a The results of CW90 are taken from their Table 5. MC denotes our Monte Carlo results. TheÐrst line describes the Ðnal state of the cluster at the end of the simulation : C indicates core collapse,while D indicates disruption. The second line gives the time to core collapse or disruption, in units of109 yr. The third line gives the Ðnal cluster mass in units of the initial mass.
reach core collapse despite having lost most of their mass,while family 3 and 4 models are disrupted.
We see very good agreement throughout the evolutionbetween our Monte Carlo models and the two-dimensionalF-P models. In all cases, the qualitative behaviors indicatedby the two methods are identical, even though the MonteCarlo models consistently have somewhat longer lifetimesthan the F-P models. The average discrepancy in the dis-ruption times for all models is approximately a factor of 2.The discrepancy in disruption times is due to a slightlylower mass-loss rate in our models, which allows the clus-ters to live longer. Since the F-P calculations correspond tothe N ] O limit, they tend to overestimate the overallmass-loss rate (we discuss this issue in more detail in thenext section). This tendency has been pointed out by Taka-hashi & Portegies Zwart (1998), who compared the resultsof two-dimensional F-P simulations with those of directN-body simulations with up to N \ 32,768. They haveattempted to account for the Ðniteness of the system in theirF-P models by introducing an additional parameter in theircalculations to modify the mass-loss rate. The comparisonshown in Figures 5, 6, and 7 is for the unmodiÐed N ] OF-P models.
We Ðnd complete agreement with TPZ00 in dis-tinguishing models that reach core collapse from those thatdisrupt. The only case in which there is some ambiguity isthe a \ 3.5, family 2 model, which clearly collapsesW0\ 1,in our calculations, while TPZ00 indicate nearly complete
disruption. This is obviously a borderline case, in which thecluster reaches core collapse just prior to disruption in ourcalculation. Since the cluster has lost almost all its mass atcore collapse, the distinction between core collapse and dis-ruption is largely irrelevant. It is important to note,however, that we Ðnd the boundary between collapsing anddisrupting models at almost exactly the same location inparameter space a, and relaxation time) as TPZ00.(W0,This agreement is as signiÐcant, if not more, than the com-parison of Ðnal masses and disruption times.
In Figure 6 we show the comparison of KingW0\ 3models. Again, the overall agreement is very good, exceptfor the slightly later disruption times for the Monte Carlomodels. The most notable di†erence from the W0\ 1models is that the models clearly reach core collapseW0\ 3prior to disruption for a \ 3.5. The core collapse times forthe a \ 3.5 models are very long (3 ] 1010È3 ] 1011 yr),with only D20% of the initial mass remaining bound atcore collapse. Here also we Ðnd perfect agreement betweenthe qualitative behaviors of the F-P and Monte Carlomodels.
In Figure 7 we show the evolution of the KingW0\ 7models. In the presence of a tidal boundary, the W0^ 5King models have the distinction of having the longest corecollapse times (see Fig. 1). This is because they begin with asufficiently high initial core density and do not expand verymuch before core collapse. Hence, the mass loss through thetidal boundary is minimal. King models with a lower W0

No. 2, 2001 GLOBULAR CLUSTER EVOLUTION. II. 699
FIG. 5.ÈEvolution of the total mass with time for King models,W0\ 1families 1È4. Comparison is made between our Monte Carlo models (solidlines) and two-dimensional F-P models (dashed lines). The three panelsshow results for di†erent values of the exponent a of the initial power-lawmass function (m~a). The four lines for each case represent families 1È4,from left to right. We indicate a core-collapsed model with a circle at theend of the line. Lines without a circle at the end indicate disruption.
lose more mass through the tidal boundary and evolvemore quickly toward core collapse or disruption, whilemodels with higher have very high initial core densities,W0leading to short core collapse times. All our modelsW0 \ 7reach core collapse. Even the models with a very Ñat massfunction (a \ 1.5) achieve core collapse, although the Ðnalbound mass in that case is very small. We again see very
FIG. 6.ÈSame as Fig. 5, but for King modelsW0\ 3
FIG. 7.ÈSame as Fig. 5, but for King modelsW0\ 7
good overall agreement between the Monte Carlo and F-Pmodels, except for the slightly higher mass-loss rate predict-ed by the F-P calculations. In the next section we discussthe possible reasons for this small discrepancy in the mass-loss rate between the Monte Carlo and F-P models.
3.2.3. Comparison with Finite Fokker-Planck Models
We Ðrst highlight some of the general issues relating tomass loss in the systems we have considered. In Figure 8 weshow the relative rates of mass loss due to stellar evolutionand tidal stripping, for 3, and 7 King models, withW0\ 1,di†erent mass spectra (a \ 1.5, 2.5, and 3.5). We see thatstellar evolution is most signiÐcant in the early phases,while tidal mass loss dominates the evolution in the laterphases. The relative importance of stellar evolution dependson the fraction of massive stars in the cluster, which domi-nate the mass loss early in the evolution. Hence, the a \ 1.5models su†er the greatest mass loss due to stellar evolution,accounting for up to 50% of the total mass loss in somecases (e.g., a \ 1.5). All models shown belong toW0\ 7,family 2. It is important to note the large variation in thetimescales and in the relative importance of stellar evolu-tion versus tidal mass loss across all models.
Through comparisons with N-body simulations, Taka-hashi & Portegies Zwart (1998) have argued that assumingN ] O leads to an overestimate of the mass-loss rate due totidal stripping of stars. To compensate for this, they intro-duce a free parameter in their calculations, to accountlescfor the Ðnite time (of the order of the crossing time) it takesfor an escaping star to leave the cluster. They calibrate thisparameter through comparisons with N-body simulations,for N \ 1024È32,768. Since for low N the N-body modelsare too noisy and the F-P models are insensitive to forlesclarge N, TPZ00 Ðnd that the calibration is most suitablydone using N D 16,000 (for further details see discussion byTPZ00). They show that a single value of this parametergives good agreement with N-body simulations for a widerange of initial conditions. Using this prescription, TPZ00provide results of their calculations for Ðnite clusters with
700 JOSHI, NAVE, & RASIO Vol. 550
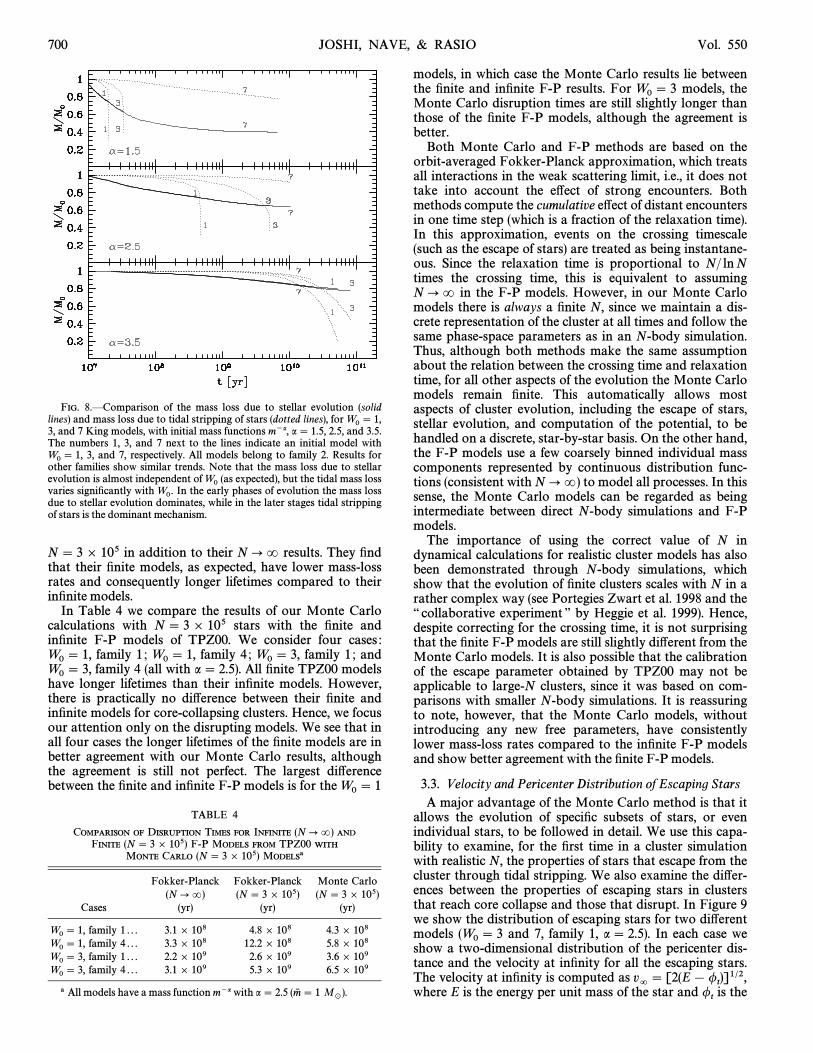
FIG. 8.ÈComparison of the mass loss due to stellar evolution (solidlines) and mass loss due to tidal stripping of stars (dotted lines), for W0\ 1,3, and 7 King models, with initial mass functions m~a, a \ 1.5, 2.5, and 3.5.The numbers 1, 3, and 7 next to the lines indicate an initial model with
3, and 7, respectively. All models belong to family 2. Results forW0\ 1,other families show similar trends. Note that the mass loss due to stellarevolution is almost independent of (as expected), but the tidal mass lossW0varies signiÐcantly with In the early phases of evolution the mass lossW0.due to stellar evolution dominates, while in the later stages tidal strippingof stars is the dominant mechanism.
N \ 3 ] 105 in addition to their N ] O results. They Ðndthat their Ðnite models, as expected, have lower mass-lossrates and consequently longer lifetimes compared to theirinÐnite models.
In Table 4 we compare the results of our Monte Carlocalculations with N \ 3 ] 105 stars with the Ðnite andinÐnite F-P models of TPZ00. We consider four cases :
family 1 ; family 4 ; family 1 ; andW0\ 1, W0\ 1, W0\ 3,family 4 (all with a \ 2.5). All Ðnite TPZ00 modelsW0\ 3,
have longer lifetimes than their inÐnite models. However,there is practically no di†erence between their Ðnite andinÐnite models for core-collapsing clusters. Hence, we focusour attention only on the disrupting models. We see that inall four cases the longer lifetimes of the Ðnite models are inbetter agreement with our Monte Carlo results, althoughthe agreement is still not perfect. The largest di†erencebetween the Ðnite and inÐnite F-P models is for the W0\ 1
TABLE 4
COMPARISON OF DISRUPTION TIMES FOR INFINITE (N ] O) AND
FINITE (N \ 3 ] 105) F-P MODELS FROM TPZ00 WITH
MONTE CARLO (N \ 3 ] 105) MODELSa
Fokker-Planck Fokker-Planck Monte Carlo(N ] O) (N \ 3 ] 105) (N \ 3 ] 105)
Cases (yr) (yr) (yr)
W0\ 1, family 1 . . . 3.1 ] 108 4.8 ] 108 4.3] 108W0\ 1, family 4 . . . 3.3 ] 108 12.2 ] 108 5.8] 108W0\ 3, family 1 . . . 2.2 ] 109 2.6 ] 109 3.6] 109W0\ 3, family 4 . . . 3.1 ] 109 5.3 ] 109 6.5] 109
a All models have a mass function m~a with a \ 2.5 (m6 \ 1 M_
).
models, in which case the Monte Carlo results lie betweenthe Ðnite and inÐnite F-P results. For models, theW0\ 3Monte Carlo disruption times are still slightly longer thanthose of the Ðnite F-P models, although the agreement isbetter.
Both Monte Carlo and F-P methods are based on theorbit-averaged Fokker-Planck approximation, which treatsall interactions in the weak scattering limit, i.e., it does nottake into account the e†ect of strong encounters. Bothmethods compute the cumulative e†ect of distant encountersin one time step (which is a fraction of the relaxation time).In this approximation, events on the crossing timescale(such as the escape of stars) are treated as being instantane-ous. Since the relaxation time is proportional to N/ ln Ntimes the crossing time, this is equivalent to assumingN ] O in the F-P models. However, in our Monte Carlomodels there is always a Ðnite N, since we maintain a dis-crete representation of the cluster at all times and follow thesame phase-space parameters as in an N-body simulation.Thus, although both methods make the same assumptionabout the relation between the crossing time and relaxationtime, for all other aspects of the evolution the Monte Carlomodels remain Ðnite. This automatically allows mostaspects of cluster evolution, including the escape of stars,stellar evolution, and computation of the potential, to behandled on a discrete, star-by-star basis. On the other hand,the F-P models use a few coarsely binned individual masscomponents represented by continuous distribution func-tions (consistent with N ] O) to model all processes. In thissense, the Monte Carlo models can be regarded as beingintermediate between direct N-body simulations and F-Pmodels.
The importance of using the correct value of N indynamical calculations for realistic cluster models has alsobeen demonstrated through N-body simulations, whichshow that the evolution of Ðnite clusters scales with N in arather complex way (see Portegies Zwart et al. 1998 and the““ collaborative experiment ÏÏ by Heggie et al. 1999). Hence,despite correcting for the crossing time, it is not surprisingthat the Ðnite F-P models are still slightly di†erent from theMonte Carlo models. It is also possible that the calibrationof the escape parameter obtained by TPZ00 may not beapplicable to large-N clusters, since it was based on com-parisons with smaller N-body simulations. It is reassuringto note, however, that the Monte Carlo models, withoutintroducing any new free parameters, have consistentlylower mass-loss rates compared to the inÐnite F-P modelsand show better agreement with the Ðnite F-P models.
3.3. Velocity and Pericenter Distribution of Escaping StarsA major advantage of the Monte Carlo method is that it
allows the evolution of speciÐc subsets of stars, or evenindividual stars, to be followed in detail. We use this capa-bility to examine, for the Ðrst time in a cluster simulationwith realistic N, the properties of stars that escape from thecluster through tidal stripping. We also examine the di†er-ences between the properties of escaping stars in clustersthat reach core collapse and those that disrupt. In Figure 9we show the distribution of escaping stars for two di†erentmodels and 7, family 1, a \ 2.5). In each case we(W0\ 3show a two-dimensional distribution of the pericenter dis-tance and the velocity at inÐnity for all the escaping stars.The velocity at inÐnity is computed as v=\ [2(E[ /
t)]1@2,
where E is the energy per unit mass of the star and is the/t

No. 2, 2001 GLOBULAR CLUSTER EVOLUTION. II. 701
FIG. 9.ÈDistribution of the pericenter distance and velocity of theescaping stars, for two di†erent King models : and 7 (family 1,W0\ 3a \ 2.5). The model (top panel) disrupts, while the modelW0\ 3 W0\ 7(bottom panel) undergoes core collapse. The pericenter distance is given inunits of the initial tidal radius of the cluster. The velocity ““ at inÐnity ÏÏ iscomputed as where E is the energy per unit mass ofv= \ [2(E[ /
t)]1@2,
the star and is the potential at the tidal radius. The escape velocity is/tdeÐned as where is the potential at the center ofvesc \ [2(/
t[ /0)]1@2, /0the cluster. The distribution of escape velocities looks signiÐcantly di†erent
in the two clusters. In the disrupting cluster the escaping stars(W0\ 3)have a wide range of escape energies at all pericenter distances, whereas inthe collapsing cluster a large fraction of the stars escape with close(W0\ 7)to the minimum energy. Only the escapers from within the central regionhave a signiÐcant range of escape energies.
potential at the tidal radius. We see that the distribution ofpericenter distances is very broad, indicating that escapetakes place from within the entire cluster, and not just nearthe tidal boundary. We see that the distribution of peri-centers is slightly more centrally peaked in the W0\ 7model than in the case. Note that the sizes of theW0\ 3cores are very di†erent for the two clusters. The W0\ 7cluster initially has a core radius of 0.2 (in virial units),which gets smaller as the cluster evolves, while the W0\ 3cluster has an initial core radius of 0.5, which does notchange signiÐcantly as the cluster evolves and disrupts. Themain di†erence between the clusters, however, is in thevelocity distribution of escaping stars. In the disruptingcluster the escaping stars have a wide range of(W0\ 3)escape energies at all pericenter distances, whereas in thecollapsing cluster a large fraction of the stars(W0\ 7)escape with close to the minimum energy. Only the escapersfrom within the central region have a signiÐcant range ofescape energies.
The very narrow distribution of escape energies for thecollapsing cluster suggests that the mechanism for escape incollapsing and disrupting clusters may be qualitatively dif-ferent. It also suggests that the single escape parameter usedby TPZ00 to correct for the tidal mass-loss rate in theirÐnite F-P calculations may be insufficient in correcting forboth types of escaping stars. This might also account for thefact that TPZ00 Ðnd almost no change in the mass-lossrate after introducing their parameter in core-lesc
FIG. 10.ÈComparison of the mass loss for a a \ 2.5 (family 2)W0\ 3,King model, on three di†erent assumed orbits in the Galaxy. The leftmostline shows a circular orbit, with radius kpc. The cluster isR
g\ 5.76
assumed to Ðll its Roche lobe at this distance. The rightmost line shows aKeplerian elliptical orbit with eccentricity 0.6 and a pericenter distance of5.76 kpc. Since the cluster on such an orbit spends most of its time at alarger distance, the cluster does not Ðll its Roche lobe at all times. Thisresults in a sharp mass loss every time the cluster approaches pericenter.The lifetime of the cluster is longer by almost a factor of 2. The interme-diate line is for an orbit in a more realistic Galactic potential, with aconstant circular velocity of 220 km s~1, with the same pericenter andapocenter distances as for the Keplerian elliptical orbit. The orbit is nolonger elliptical, and the orbital period is shorter, resulting in a lifetime thatis intermediate between the circular and elliptical cases.
collapsing models, while disrupting models show a signi-Ðcant di†erence.
3.4. E†ects of Noncircular Orbits on Cluster L ifetimesIn all the calculations presented above (as in most pre-
vious numerical studies of globular cluster evolution), weassumed that the cluster remained in a circular orbit at aÐxed distance from the center of the Galaxy. We alsoassumed that the cluster was born Ðlling its Roche lobe inthe tidal Ðeld of the Galaxy. Both of these assumptions arealmost certainly unrealistic for the majority of clusters.However, one could argue that even for a cluster on aneccentric orbit one might still be able to model the evolu-tion using an appropriately averaged value of the tidalradius over the orbit of the cluster. Here we brieÑy explorethe e†ect of an eccentric orbit, by comparing the evolutionof one of our Monte Carlo models a \ 2.5, family(W0\ 3,2) on a Roche lobe Ðlling circular orbit and on an eccentricorbit. We assume that the pericenter distance of the eccen-tric orbit is equal to the radius of the circular orbit. This isto ensure that the cluster Ðlls its Roche lobe at the samelocation, and the same value of is used to compute F inR
gthe models being compared (see eq. [3]). If we alternativelyselected the orbit such that the cluster Ðlls its Roche lobe atapocenter instead of pericenter, the outcome would beobvious : the mass loss at pericenter would be considerablyhigher, leading to much more rapid disruption of the clustercompared to the circular orbit.

702 JOSHI, NAVE, & RASIO
In Figure 10 we show the evolution of the selected modelfor three di†erent orbits. The leftmost line shows the evolu-tion for the circular orbit. The rightmost line shows theevolution for an eccentric Keplerian orbit with a typicaleccentricity of 0.6 (see, e.g., Odenkirchen et al. 1997). TheKeplerian orbit assumes that the inferred mass of theGalaxy interior to the circular orbit is held Ðxed for theeccentric orbit as well. The intermediate line shows the evol-ution for an orbit in a more realistic potential for theGalaxy, which is still spherically symmetric, but with a con-stant circular velocity of 220 km s~1 in the region of thecluster orbit (Binney & Tremaine 1987). The orbit is chosenso that it has the same pericenter and apocenter distance asthe Keplerian orbit. However, since the orbital velocity ishigher, it has a shorter period compared to the Keplerianorbit. In each of the two eccentric orbits, we see that thecluster lifetime is extended slightly (by a factor of D2). Mostof the mass loss takes place during the short time that thecluster spends near its pericenter, where it Ðlls its Rochelobe. The Keplerian orbit gives the longest lifetime, sincethe cluster spends most of its time near its apocenter, whereit does not Ðll its Roche lobe.
This comparison suggests that the lifetime of a cluster canvary by at most a factor of a few, depending on the shape ofits orbit. However, such corrections should be taken intoaccount in building accurate numerical models of real clus-ters. In addition, other e†ects that we have neglected here,such as tidal shocking during Galactic disk crossings, maya†ect cluster lifetimes more signiÐcantly (see ° 4).
4. SUMMARY
We have calculated lifetimes of globular clusters in theGalactic environment using two-dimensional Monte Carlosimulations with N \ 105È3 ] 105 King models, includingthe e†ects of a mass spectrum, mass loss in the Galactictidal Ðeld, and stellar evolution. We have studied the evolu-tion of King models with 3, and 7, and with power-W0\ 1,law mass functions m~a, with a \ 1.5, 2.5, and 3.5, up tocore collapse or disruption, whichever occurs Ðrst. In ourbroad survey of cluster lifetimes, we Ðnd very good overallagreement between our Monte Carlo models and the two-dimensional F-P models of TPZ00 for all 36 modelsstudied. This is very reassuring, since it is impossible toverify such results using direct N-body integrations for arealistic number of stars. The Monte Carlo method hasbeen shown to be a robust alternative for studying the evol-ution of multicomponent clusters. It is particularly well
suited to studying Ðnite but large-N systems, includingmany di†erent processes, such as tidal stripping and stellarevolution, which operate on di†erent timescales. We Ðndthat our Monte Carlo models are in better agreement withthe Ðnite-N F-P models of TPZ00, compared to their stan-dard F-P (N ] O) models, although our models still appearto have a slightly lower overall mass-loss rate.
Even though our simulations are becoming more sophis-ticated and realistic with the inclusion of many new impor-tant processes, there still remain substantial difficulties inrelating our results directly to observed clusters. We ignoreseveral potentially important e†ects in these calculations,including the tidal shock heating of the cluster followingpassages through the Galactic disk, as well as the presenceof primordial binaries, which can support the core againstcollapse. In recent studies using one-dimensional F-P calcu-lations, it has been shown that shock heating and shock-induced relaxation of clusters caused by repeated closepassages near the bulge and through the disk of the Galaxycan sometimes be as important as two-body relaxation fortheir overall dynamical evolution (Gnedin, Lee, & Ostriker1999). In addition, the initial mass function of clusters ispoorly constrained observationally, and our simple powerlaws may not be realistic. In our study, we assume thatclusters begin their lives Ðlling their Roche lobes. But, as wehave shown, a cluster on an eccentric orbit may spend mostof its time farther away in the Galaxy, where it might not Ðllits Roche lobe. This can lead to somewhat longer lifetimes.
The broad survey of cluster lifetimes presented here andthe similar e†ort by TPZ00 lay the foundations for moredetailed calculations, which may one day allow us toconduct reliable population synthesis studies to understandin detail the history, and predict the future evolution, of theGalactic globular cluster system.
We are very grateful to Simon Portegies Zwart forinsightful comments and helpful discussions. We are alsograteful to Koji Takahashi for kindly providing valuabledata and answering numerous questions. This work wassupported by NSF grant AST-9618116 and NASA ATPgrant NAG5-8460. C. P. N. acknowledges partial supportfrom the UROP program at MIT. F. A. R. was supported inpart by an Alfred P. Sloan Research Fellowship. This workwas also supported by the National Computational ScienceAlliance under grant AST980014N and utilized the SGI/Cray Origin2000 supercomputer at Boston University.
REFERENCESAarseth, S. J. 1999, PASP, 111, 1333Binney, J., & Tremaine, S. 1987, Galactic Dynamics (Princeton, Princeton
Univ. Press)Cherno†, D. F., & Weinberg, M. D. 1990, ApJ, 351, 121 (CW90)Cohn, H. 1979, ApJ, 234, 1036ÈÈÈ. 1980, ApJ, 242, 765Drukier, G. A. 1995, ApJS, 100, 347Drukier, G. A., Cohn, H. N., Lugger, P. M., & Yong, H. 1999, ApJ, 518, 233Fukushige, T., & Heggie, D. C. 1995, MNRAS, 276, 206Gao, B., Goodman, J., Cohn, H., & Murphy, B. 1991, ApJ, 370, 567Gnedin, O. Y., Lee, H. M., & Ostriker, J. P. 1999, ApJ, 522, 935Goodman, J., & Hut, P. 1989, Nature, 339, 40Heggie, D. C., Giersz, M., Spurzem, R., & Takahashi, K. 1999, Highlights
Astron., 11, 591Henon, M. 1971a, Ap&SS, 13, 284ÈÈÈ. 1971b, Ap&SS, 14, 151Hut, P., McMillan, S., & Romani, R. W. 1992, ApJ, 389, 527Iben, I., & Renzini, A. 1983, ARA&A, 21, 271Joshi, K. J., Rasio, F. A., & Portegies Zwart, S. 2000, ApJ, 540, 969 (Paper
I)
Lee, H. M., & Ostriker, J. P. 1987, ApJ, 322, 123Makino, J., Taiji, M., Ebisuzaki, T., & Sugimoto, D. 1997, ApJ, 480, 432McMillan, S. L. W., & Hut, P. 1994, ApJ, 427, 793McMillan, S. L. W., Hut, P., & Makino, J. 1990, ApJ, 362, 522Meylan, G., & Heggie, D. C. 1997, A&A Rev., 8, 1Miller, G. E., & Scalo, J. M. 1979, ApJ, 41, 513Odenkirchen, M., Brosche, P., Ge†ert, M., & Tucholke, H. J. 1997, NewA,
2, 477Portegies Zwart, S., Hut, P., Makino, J., & McMillan, S. L. W. 1998, A&A,
337, 363Quinlan, G. D. 1996, NewA, 1, 255Ross, D. J., Mennim, A., & Heggie, D. C. 1997, MNRAS, 284, 811Spitzer, L. 1987, Dynamical Evolution of Globular Clusters (Princeton :
Princeton Univ. Press)Spitzer, L., & Mathieu, R. D. 1980, ApJ, 241, 618Takahashi, K. 1995, PASJ, 47, 561ÈÈÈ. 1996, PASJ, 48, 691ÈÈÈ. 1997, PASJ, 49, 547Takahashi, K., & Portegies Zwart, S. F. 1998, ApJ, 503, L49ÈÈÈ. 2000, ApJ, 535, 759 (TPZ00)