the ‘true value’ of local bus services · source: (a) kpmg (2016) a study of the value of local...
TRANSCRIPT
The ‘true value’ of local bus servicesA report to Greener Journeys
June 2017
kpmg.com/uk
2 The ‘true value’ of local bus services© 2018 KPMG LLP, a UK limited liability partnership and a member firm of the KPMG network of independent member firms affiliated with KPMG International Cooperative (“KPMG International”), a Swiss entity. All rights reserved. Printed in the United Kingdom.
Important notice
Our work was completed 29 June 2017. We have not undertaken to update our presentation for events or circumstances arising after that date.
In preparing our report, our primary sources has been publically available data and reports. We do not accept responsibility for such information. Details of our principal sources are referenced throughout the report and we have satisfied ourselves, so far as possible, that the information presented in our report is consistent with other information which was made available to us in the course of our work in accordance with the terms of our Engagement Letter. We have not, however, sought to establish the reliability of those sources by reference to other evidence.
This engagement is not an assurance engagement conducted in accordance with any generally accepted assurance standards and consequently no assurance opinion is expressed. Nothing in this report constitutes legal advice or a valuation.
This report is not suitable to be relied on by any party wishing to acquire rights against KPMG LLP (other than the Client) for any purpose or in any context. Any party other than the Client thatobtains access to this options paper or a copy and chooses to rely on this report does so at its own risk. To the fullest extent permitted by law, KPMG LLP does not assume any responsibilityand will not accept any liability, including any liability arising from fault or negligence, for any loss arising from the use of this report or its contents or otherwise in connection with it to any party other than the Client.
© 2018 KPMG LLP, a UK Limited Liability Partnership and a member firm of the KPMG network of independent member firms affiliated with KPMG International Cooperative (‘KPMG International’), a Swiss entity. All rights reserved.
The KPMG name and logo are registered trademarks or trademarks of KPMG International Cooperative.

Table of contents1 Executive summary ........................................................ 1
1.1 This report ........................................................................ 1
1.2 Policy context ................................................................... 1
1.3 Key findings ....................................................................... 2
1.4 Structure of the report ..................................................... 2
2 True value methodology ................................................ 3
2.1 Analytical framework......................................................... 3
2.2 Appraisal framework ......................................................... 4
2.3 Updating the analysis ........................................................ 5
3 Updated appraisal .......................................................... 7
3.1 Overview ........................................................................... 7
3.2 Bus priority measures ....................................................... 7
3.3 Concessionary travel for older and disabled people ........10
3.4 Concessionary travel for apprentices ...............................13
3.5 Tax incentives for commuters ..........................................14
3.6 Bus Service Operators Grant ...........................................16
3.7 Evaluation of infrastructure scheme.................................18
4 Summary and discussion ............................................ 23
Appendix – Economic appraisal methodology ................. 25
1 The ‘true value’ of local bus services© 2018 KPMG LLP, a UK limited liability partnership and a member firm of the KPMG network of independent member firms affiliated with KPMG International Cooperative (“KPMG International”), a Swiss entity. All rights reserved. Printed in the United Kingdom.
Executive summary
1
1.1 This reportOver recent years Greener Journeys has published a number of studies on the economic, social and environmental costs and benefits of government investment and interventions in local bus markets. The studies include analysis of infrastructure investment including transit priority and interchange measures, fare concessions for seniors and apprentices, and general revenue support.
The studies follow appraisal guidelines set out by HM Treasury and the Department for Transport, tailored to measure the specific costs and benefits associated with each type of intervention.
Over time, market conditions change, appraisal methodologies evolve and evidence on specific costs and benefits is strengthened. It is therefore appropriate to periodically revisit and update analysis of policy measures in local bus markets to make sure that the results reflect best practice and best available evidence.
To that end, this document provides a summary of updated ‘value for money’ appraisals for:
• Bus priority measures
• Concessionary travel for older and disabled people
• Concessionary travel for apprentices
• Tax incentives for commuters
• Bus Service Operators Grant (BSOG)
It also reviews and updates estimates of economic evaluations of specific local bus infrastructure case studies including:
• Mansfield Interchange.
• Hampshire BRT (Eclipse).
• Fastway in West Sussex.
The analysis benefits, in particular, from the findings of an extensive stakeholder consultation, literature review and new econometric analysis on the value of local bus services to society published by Greener Journeys in October 2016(a). That work highlights the role of good local bus services in promoting wider social benefits from improved access to employment, education and healthcare as well as improvements in individual and community wellbeing arising from increased participation in social activities.
1.2 Policy contextIt is widely recognised that good local bus services are an essential part of vibrant, sustainable communities. Buses connect people to jobs and customers to businesses, they provide access to education and essential services, promote social inclusion and provide environmental improvements by encouraging a switch from private to public transport.
This ability to generate wider economic, social and environmental benefits means that there is a clear rationale to increase the supply of local bus services above the levels determined by the commercial market. Where these wider benefits exist, the government can improve market efficiency by targeting investment and support to expand supply and/or keep fares lower than they would otherwise be.
In Great Britain, outside of London, government bodies have a range of policy evers available to them to do just that. They can invest in infrastructure and traffic management measures to keep traffic moving, they can provide discounted or free travel for certain groups in society, they can tender and contract socially necessary services, and they can provide more general support to the sector through grants and funding competitions.Source: (a) KPMG (2016) A study of the value of local bus services to society. Report to Greener Journeys.
(b) KPMG (2015) A new vision of value, KPMG International.
2The ‘true value’ of local bus services© 2018 KPMG LLP, a UK limited liability partnership and a member firm of the KPMG network of independent member firms affiliated with KPMG International Cooperative (“KPMG International”), a Swiss entity. All rights reserved. Printed in the United Kingdom.
At the same time, government bodies have a responsibility to spend well and wisely and to make sure that they deliver value for money from expenditure. This means looking carefully at the costs and benefits of investments to make sure scarce resources are allocated to the right activities.
In this context, it is important that decision-makers understand the true value(b) of local bus services in order to make the right investment decisions and to maximise the benefits of public policies to society.
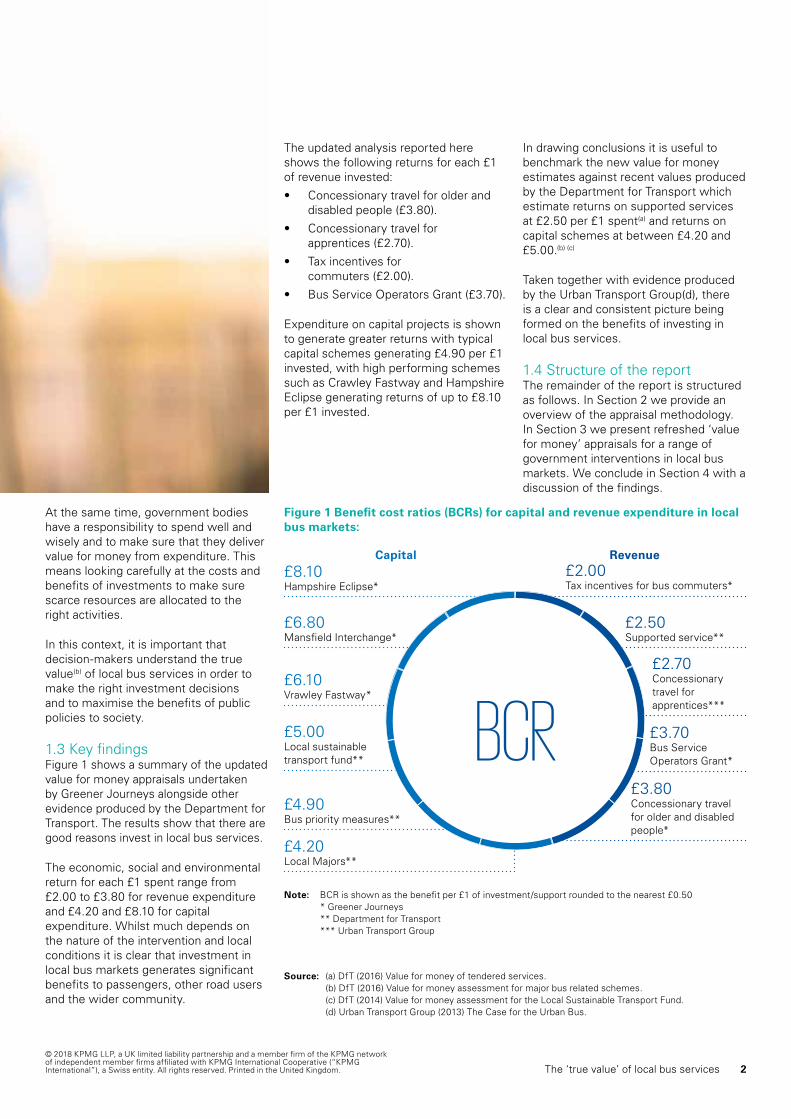
1.3 Key findingsFigure 1 shows a summary of the updated value for money appraisals undertaken by Greener Journeys alongside other evidence produced by the Department for Transport. The results show that there are good reasons invest in local bus services.
The economic, social and environmental return for each £1 spent range from £2.00 to £3.80 for revenue expenditure and £4.20 and £8.10 for capital expenditure. Whilst much depends on the nature of the intervention and local conditions it is clear that investment in local bus markets generates significant benefits to passengers, other road users and the wider community.
The updated analysis reported here shows the following returns for each £1 of revenue invested:
• Concessionary travel for older and disabled people (£3.80).
• Concessionary travel for apprentices (£2.70).
• Tax incentives for commuters (£2.00).
• Bus Service Operators Grant (£3.70).
Expenditure on capital projects is shown to generate greater returns with typical capital schemes generating £4.90 per £1 invested, with high performing schemes such as Crawley Fastway and Hampshire Eclipse generating returns of up to £8.10 per £1 invested.
In drawing conclusions it is useful to benchmark the new value for money estimates against recent values produced by the Department for Transport which estimate returns on supported services at £2.50 per £1 spent(a) and returns on capital schemes at between £4.20 and £5.00.(b) (c)
Taken together with evidence produced by the Urban Transport Group(d), there is a clear and consistent picture being formed on the benefits of investing in local bus services.
1.4 Structure of the reportThe remainder of the report is structured as follows. In Section 2 we provide an overview of the appraisal methodology. In Section 3 we present refreshed ‘value for money’ appraisals for a range of government interventions in local bus markets. We conclude in Section 4 with a discussion of the findings.
£4.20Local Majors**
£4.90Bus priority measures**
£5.00Local sustainable transport fund**
£6.10Vrawley Fastway*
£6.80Mansfield Interchange*
£8.10Hampshire Eclipse*
£2.00Tax incentives for bus commuters*
£2.50Supported service**
£2.70Concessionary travel for apprentices***
£3.70Bus Service Operators Grant*
£3.80Concessionary travel for older and disabled people*
Figure 1 Benefit cost ratios (BCRs) for capital and revenue expenditure in local bus markets:
Capital Revenue
Note: BCR is shown as the benefit per £1 of investment/support rounded to the nearest £0.50 * Greener Journeys ** Department for Transport *** Urban Transport Group
BCR
Source: (a) DfT (2016) Value for money of tendered services. (b) DfT (2016) Value for money assessment for major bus related schemes. (c) DfT (2014) Value for money assessment for the Local Sustainable Transport Fund. (d) Urban Transport Group (2013) The Case for the Urban Bus.
3 The ‘true value’ of local bus services© 2018 KPMG LLP, a UK limited liability partnership and a member firm of the KPMG network of independent member firms affiliated with KPMG International Cooperative (“KPMG International”), a Swiss entity. All rights reserved. Printed in the United Kingdom.
Cost to GovernmentTender paymentsConc. reimbursementBSOG
DemandFare-paying Concessionary
Operator revenueFarebox revenueTender paymentsConc. reimbursement BSOG
True value methodology
2
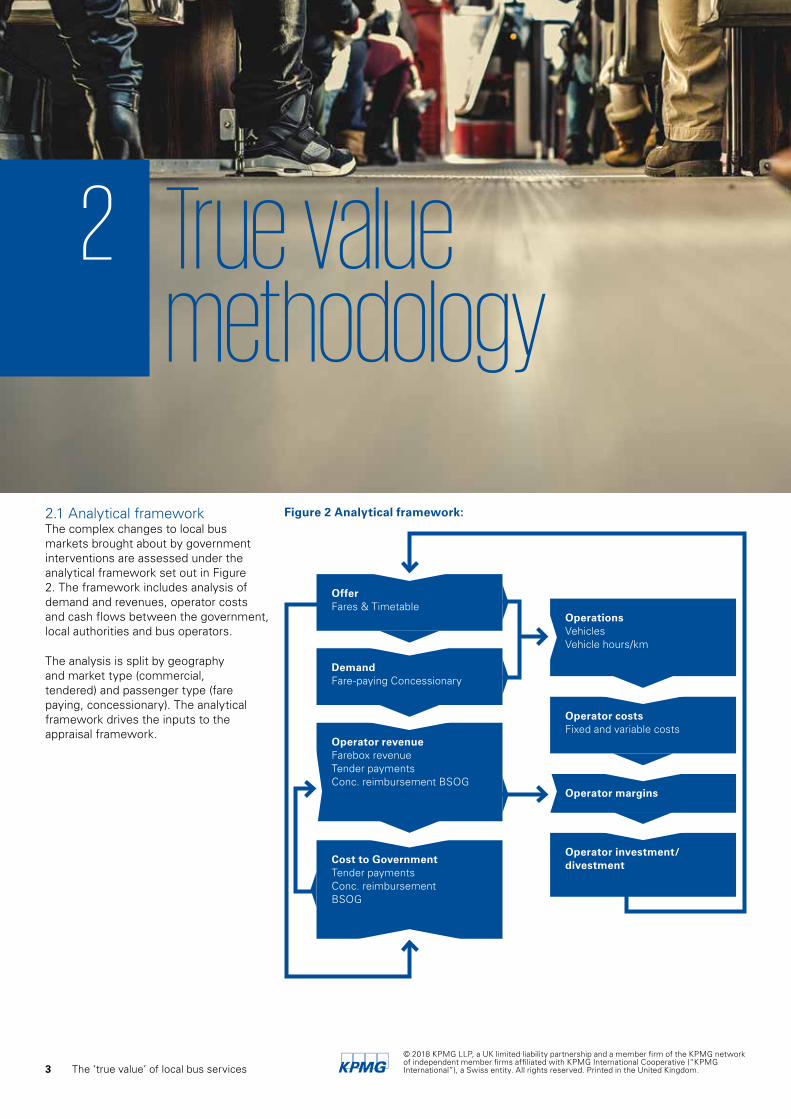
2.1 Analytical frameworkThe complex changes to local bus markets brought about by government interventions are assessed under the analytical framework set out in Figure 2. The framework includes analysis of demand and revenues, operator costs and cash flows between the government, local authorities and bus operators.
The analysis is split by geography and market type (commercial, tendered) and passenger type (fare paying, concessionary). The analytical framework drives the inputs to the appraisal framework.
Figure 2 Analytical framework:
Operator investment/divestment
OperationsVehiclesVehicle hours/km
Operator costsFixed and variable costs
Operator margins
OfferFares & Timetable
4The ‘true value’ of local bus services© 2018 KPMG LLP, a UK limited liability partnership and a member firm of the KPMG network of independent member firms affiliated with KPMG International Cooperative (“KPMG International”), a Swiss entity. All rights reserved. Printed in the United Kingdom.
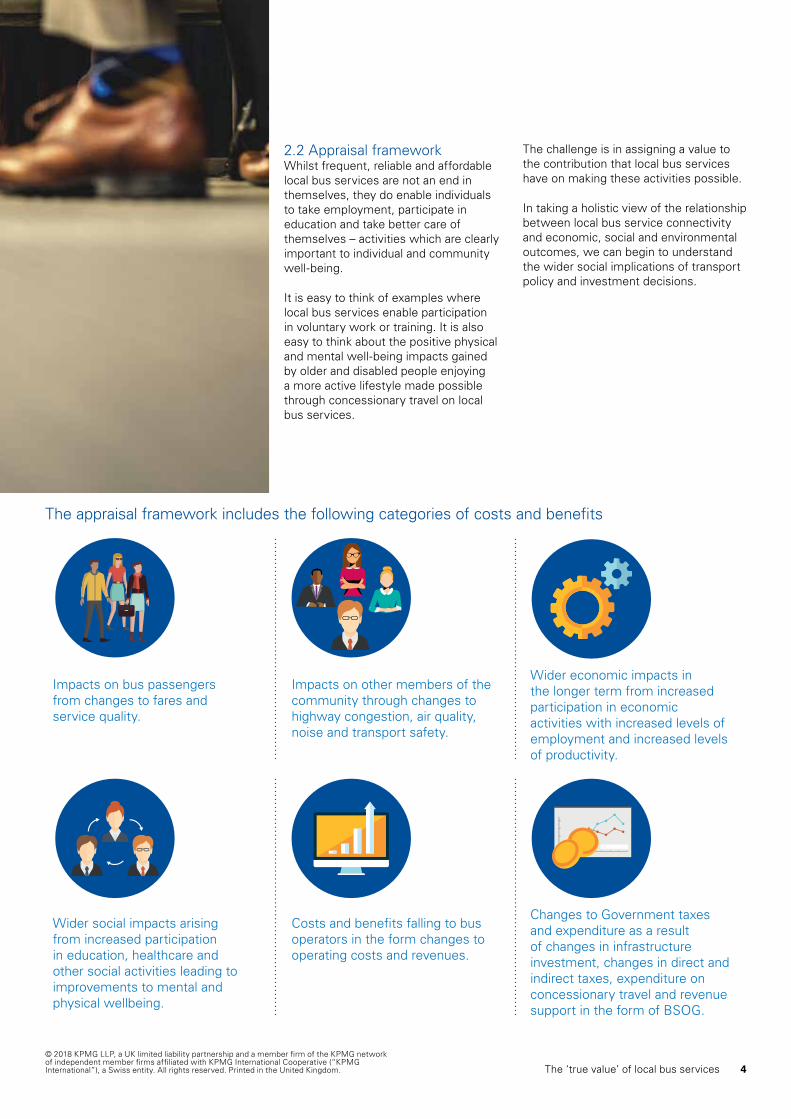
Changes to Government taxes and expenditure as a result of changes in infrastructure investment, changes in direct and indirect taxes, expenditure on concessionary travel and revenue support in the form of BSOG.
2.2 Appraisal frameworkWhilst frequent, reliable and affordable local bus services are not an end in themselves, they do enable individuals to take employment, participate in education and take better care of themselves – activities which are clearly important to individual and community well-being.
It is easy to think of examples where local bus services enable participation in voluntary work or training. It is also easy to think about the positive physical and mental well-being impacts gained by older and disabled people enjoying a more active lifestyle made possible through concessionary travel on local bus services.
The challenge is in assigning a value to the contribution that local bus services have on making these activities possible.
In taking a holistic view of the relationship between local bus service connectivity and economic, social and environmental outcomes, we can begin to understand the wider social implications of transport policy and investment decisions.
The appraisal framework includes the following categories of costs and benefits
Impacts on bus passengers from changes to fares and service quality.
Impacts on other members of the community through changes to highway congestion, air quality, noise and transport safety.
Wider economic impacts in the longer term from increased participation in economic activities with increased levels of employment and increased levels of productivity.
Wider social impacts arising from increased participation in education, healthcare and other social activities leading to improvements to mental and physical wellbeing.
Costs and benefits falling to bus operators in the form changes to operating costs and revenues.

Source: (a) Johnson, D., Mackie, P. and Shires, J. (2014) ‘Buses and the Economy II’. University of Leeds. (b) HM Treasury, New Economy and Public Service Transformation Network (2014) ‘Supporting
public service transformation: cost benefit analysis guidance for local partnerships’. (c) Department for Transport (2016) WebTAG Social Impact Appraisal Unit A4.1.8. (d) Wallis, I., Douglas, N. and Lawrence, A. (2013) Economic appraisal of public transport service
enhancements. NZ Transport Agency research report 533. 121pp. (e) Royal Voluntary Service (2011) Gold Age Pensioners: Valuing the socio-economic contribution of
older people in the UK. (f) ONS (2014) ‘Commuting and personal wellbeing. Martin, A., Goryakin, Y. and Suhrcke, M. (2014) ‘Does active commuting improve psychological
wellbeing? Longitudinal evidence from eighteen waves of the British Household Panel Survey’. Elsevier Volume 69, p. 296-303.
HM Treasury, New Economy and Public Service Transformation Network (2014) ‘Supporting public service transformation: cost benefit analysis guidance for local partnerships’
2.3 Updating the analysisIn updating the value for money analysis for investment and interventions in local bus markets we have expanded traditional transport appraisal methodologies to include:
Further details on the methodology and assumptions used in this analysis are presented in the Appendix.
Additional economic impacts• Employment benefits –
these have been refined to incorporate the latest evidence produced by Greener Journeys and the Institute of Transport Studies at the University of Leeds.(a)
• Health fiscal savings – fiscal savings from improved health as a result of increased employment based on the latest evidence from the New Economy Manchester.(b)
• Fiscal savings from increased education – fiscal benefits from increased tax receipt from increased education (evidence from New Economy Manchester). b)
Additional social impacts• Option and non-use values
from the WebTAG guidance.(c)
• Physical health benefits – benefits from increased physical activity (evidence from the New Zealand Transport Agency).(d)
• Volunteering – benefits from increased volunteering activity (research developed as part of the assessment of concessionary fares).(e)
• Psychological wellbeing – new evidence from the ONS on the impact of commuting on wellbeing and the New Economy Manchester.(f)
The ‘true value’ of local bus services5
© 2018 KPMG LLP, a UK limited liability partnership and a member firm of the KPMG network of independent member firms affiliated with KPMG International Cooperative (“KPMG International”), a Swiss entity. All rights reserved. Printed in the United Kingdom.
6The ‘true value’ of local bus services© 2018 KPMG LLP, a UK limited liability partnership and a member firm of the KPMG network of independent member firms affiliated with KPMG International Cooperative (“KPMG International”), a Swiss entity. All rights reserved. Printed in the United Kingdom.
7 The ‘true value’ of local bus services© 2018 KPMG LLP, a UK limited liability partnership and a member firm of the KPMG network of independent member firms affiliated with KPMG International Cooperative (“KPMG International”), a Swiss entity. All rights reserved. Printed in the United Kingdom.
Updated appraisal
3
3.1 OverviewIn this section of the report we present a summary of the ‘value for money’ appraisals for five types of investment and expenditure in local bus markets including:
• Bus priority measures.
• Concessionary travel for older and disabled people.
• Concessionary travel for apprentices.
• Tax incentives for commuters.
• Bus Service Operators Grant (BSOG).
We also review and update estimates of economic evaluations of specific local bus infrastructure case studies including:
• Mansfield Interchange.
• Hampshire BRT (Eclipse).
• Fastway in West Sussex.
For each appraisal and evaluation we provide a summary of the results, the challenges and opportunities facing the market, a description of the intervention, the value for money results and a discussion of the policy relevance.
3.2 Bus priority measures3.2.1 ResultsBus priority measures consist of infrastructure investments and traffic management systems that allow buses to operate more efficiently and more reliably. These include bus lanes, guided busways, queue jump lanes, selective priority at junctions, and bus gates or bus only streets.
Our updated assessment of bus priority measures shows that under the right circumstances they can deliver £4.90 per £1 of government spending. The value of the investment is however context specific with some schemes likely to generate higher benefits and some lower benefits.
3.2.2 Challenges and opportunitiesTraffic congestion is a persistent and significant problem across the UK, particularly in cities. In London, for example, average bus speeds have declined to the point where the average speed across all of the network is less than 10 miles per hour with some routes recording much lower speeds.(a)
Across the country traffic levels are at record levels. Estimates by the Department for Transport show that there were 320.5 billion vehicle miles travelled on Great Britain’s roads in the year ending December 2016. This was 1.2% higher than the previous year and an all time record being 2% higher than the pre-recession peak in the year ending September 2007.(b)
Whilst the number of trips per person in Great Britain has been falling, many areas have seen a large increase in traffic associated with increased levels of population and with the continued and rapid increase in light goods vehicles and large increases in the number of taxis and private hire vehicles.
The challenge is to make more efficient use of road capacity and the opportunity is to reduce the adverse economic consequences of congestion and the costs to society of poor air quality, ill health, and road accidents.
8The ‘true value’ of local bus services© 2018 KPMG LLP, a UK limited liability partnership and a member firm of the KPMG network of independent member firms affiliated with KPMG International Cooperative (“KPMG International”), a Swiss entity. All rights reserved. Printed in the United Kingdom.
3.2.3 Market interventionPart of the solution to this challenge lies in making better use of existing road capacity through targeted investment in local bus infrastructure and selective priority measures that improve the performance of the transport network as a whole.
Where this can be successfully delivered, reduced congestion, increased speeds and improved journey time reliability will reduce transport costs. In turn this will support economic growth by allowing businesses to more easily connect with potential suppliers, provide consumers with improved access to a wider range of suppliers and improve the functioning of the labour market, allowing skills to be better matched to employment opportunities.
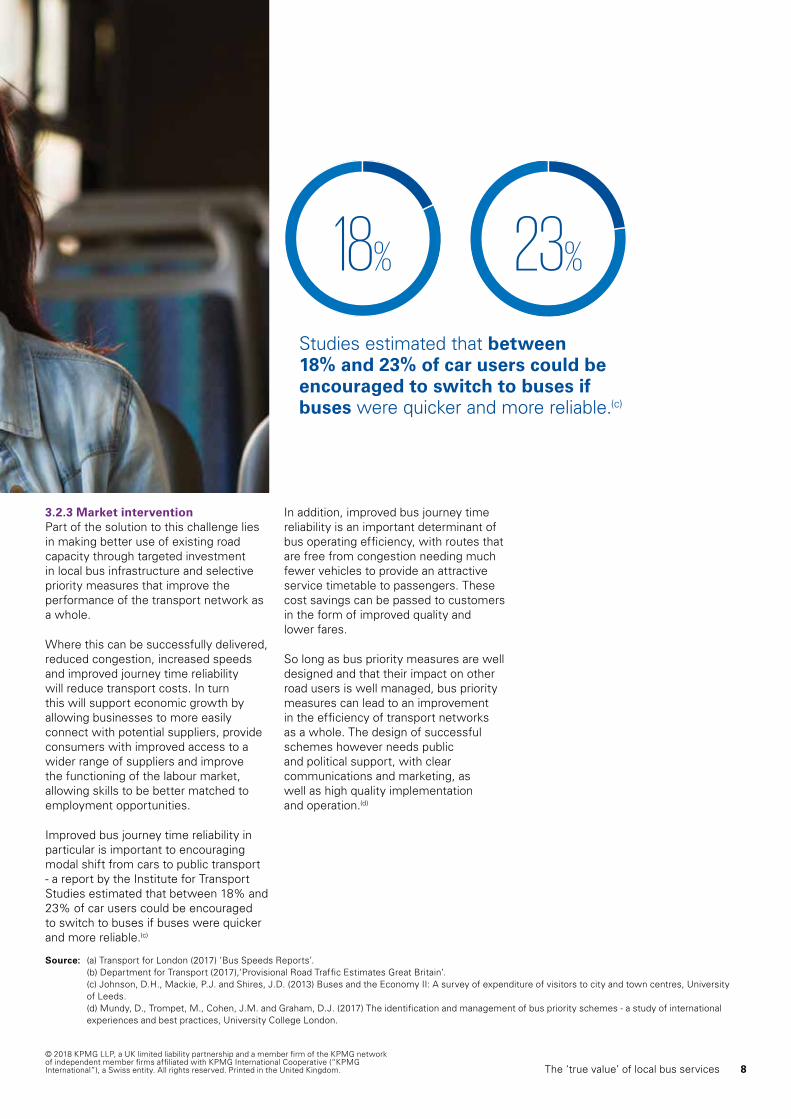
Improved bus journey time reliability in particular is important to encouraging modal shift from cars to public transport - a report by the Institute for Transport Studies estimated that between 18% and 23% of car users could be encouraged to switch to buses if buses were quicker and more reliable.(c)
In addition, improved bus journey time reliability is an important determinant of bus operating efficiency, with routes that are free from congestion needing much fewer vehicles to provide an attractive service timetable to passengers. These cost savings can be passed to customers in the form of improved quality and lower fares.
So long as bus priority measures are well designed and that their impact on other road users is well managed, bus priority measures can lead to an improvement in the efficiency of transport networks as a whole. The design of successful schemes however needs public and political support, with clear communications and marketing, as well as high quality implementation and operation.(d)
Source: (a) Transport for London (2017) ‘Bus Speeds Reports’. (b) Department for Transport (2017),‘Provisional Road Traffic Estimates Great Britain’. (c) Johnson, D.H., Mackie, P.J. and Shires, J.D. (2013) Buses and the Economy II: A survey of expenditure of visitors to city and town centres, University
of Leeds. (d) Mundy, D., Trompet, M., Cohen, J.M. and Graham, D.J. (2017) The identification and management of bus priority schemes - a study of international
experiences and best practices, University College London.
Studies estimated that between 18% and 23% of car users could be encouraged to switch to buses if buses were quicker and more reliable.(c)
18% 23%

© 2018 KPMG LLP, a UK limited liability partnership and a member firm of the KPMG network of independent member firms affiliated with KPMG International Cooperative (“KPMG International”), a Swiss entity. All rights reserved. Printed in the United Kingdom.
3.2.4 AppraisalTable 1 shows that for each £1 invested in a typical bus priority measure, up to £4.9 in economic and social benefits could be generated after making allowance for additional revenue expenditure on BSOG and concessionary fare reimbursement.
Table 1 Bus priority measures appraisal:User benefitsFrom service change £1.90Non-user benefitsDecongestion, Safety, Local Air Quality, Noise, Greenhouse Gases £0.37Reduced fuel tax revenue (£0.14)Bus operator benefitsChange in operator margin for reinvestment £0.09Wider economic and social benefitsImproved labour market accessibility £1.71Health benefits from increased physical activity £0.49Health benefits from increased employment £0.09Volunteering contributions £0.18Fiscal savings from increased education £0.18Psychological well-being from mode shift from car to bus £0.01Psychological well-being from reductions in commuting time £0.04Option values £0.01Cost to GovernmentGovernment investment £0.58BSOG £0.09Concessionary fares reimbursement £0.33Total benefits £4.9Total costs £1.0BCR 4.9
The analysis is based on the following key assumptions: 10 year appraisal period, 25% saving in in-vehicle time for bus users along the priority corridor; 50% reduction in delay for bus users along the priority corridor; 10% increase in journey time for car users on the priority corridor; and £250,000 capital cost per route kilometre.
Out of the £4.9 in total benefits, £1.90 correspond to user benefits as a result of journey time savings, £0.37 correspond to benefits from reduced car externalities as a result of a mode shift from car to bus, £2.72 correspond to wider economic and social benefits and £0.09 change in operator margin for reinvestment. Out of the £2.71 in wider benefits, £1.71 are generated as a result of improved labour market accessibility.
3.2.5 Policy relevanceHigh levels of traffic congestion in towns and cities is an increasingly important policy issue, not only in terms of reducing productivity and increasing the cost of doing business but more importantly because poor air quality is estimated to be the cause of more than 40,000 premature deaths in the UK each year.(a)
Local decision-makers need to act quickly and responsibly to reduce the adverse impacts of traffic congestion by delivering a programme of measures to make transport greener and more efficient. Well implemented local bus priority measures can be an important part of this programme.
£1.90 correspond to user benefits as a result of journey time savings
£0.37 in benefits from reduced externalities due to mode shift from car to bus, with a linked £0.14 reduction in fuel tax revenue
£2.72 correspond to wider economic and social benefits
£0.09 change in operator margin for reinvestment
Out of the £4.90 in total benefits
Source: (a) House of Commons Environment, Food and Rural Affairs Committee (2016) ‘Air quality’ Fourth Report of Session 2015-16.
The ‘true value’ of local bus services9
10The ‘true value’ of local bus services© 2018 KPMG LLP, a UK limited liability partnership and a member firm of the KPMG network of independent member firms affiliated with KPMG International Cooperative (“KPMG International”), a Swiss entity. All rights reserved. Printed in the United Kingdom.
3.3 Concessionary travel for older and disabled people3.3.1 ResultsConcessionary bus travel for older and disabled people in Britain is both popular and successful, with almost 12 million pass holders making more than 1.2 billion concessionary bus journeys in 2015/16.
The national concessionary fares schemes delivers substantial economic and social benefits valued at £3.80 per £1 of government expenditure.
3.3.2 Challenges and opportunitiesThe separate concessionary travel schemes that operate in England, Scotland and Wales are aimed at improving social inclusion but in practice deliver a range of benefits that go way beyond the immediate benefits to concessionary passengers themselves.
As the number of older people living in Britain increases, it will become increasingly important to make sure that the schemes are properly funded and that operators are properly reimbursed for carrying concessionary passengers.
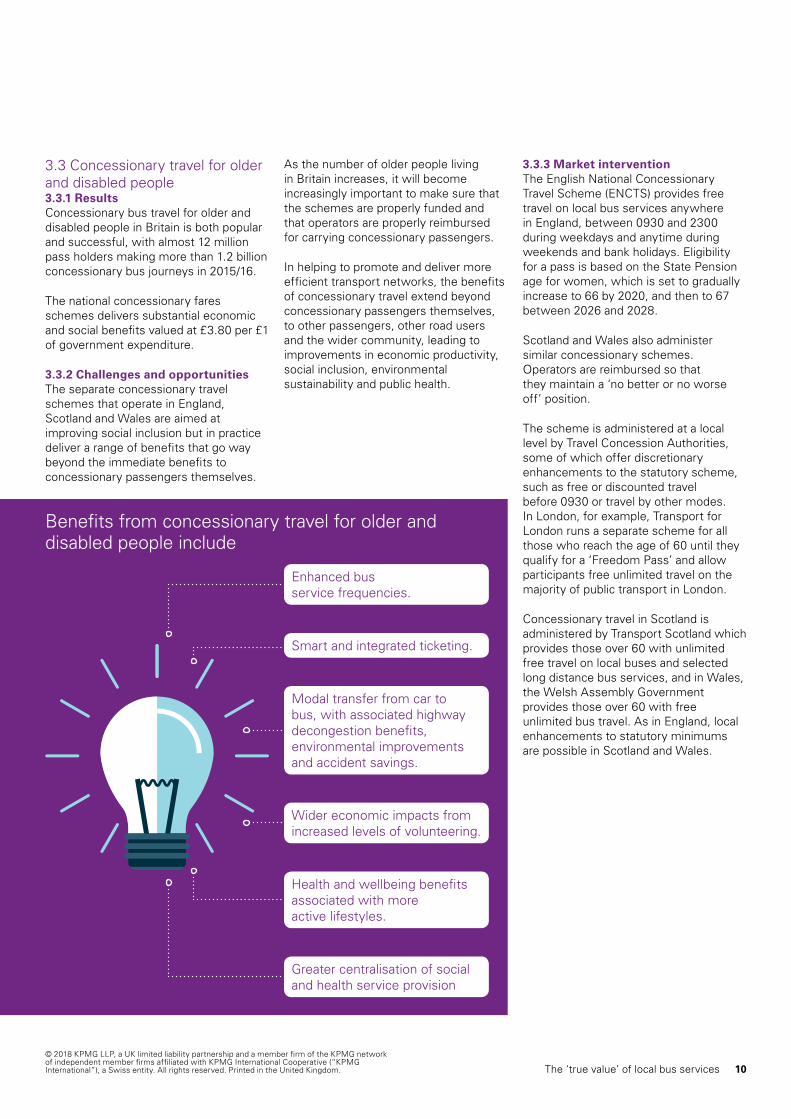
In helping to promote and deliver more efficient transport networks, the benefits of concessionary travel extend beyond concessionary passengers themselves, to other passengers, other road users and the wider community, leading to improvements in economic productivity, social inclusion, environmental sustainability and public health.
Enhanced bus service frequencies.
Smart and integrated ticketing.
Modal transfer from car to bus, with associated highway decongestion benefits, environmental improvements and accident savings.
Wider economic impacts from increased levels of volunteering.
Health and wellbeing benefits associated with more active lifestyles.
Greater centralisation of social and health service provision
Benefits from concessionary travel for older and disabled people include
3.3.3 Market interventionThe English National Concessionary Travel Scheme (ENCTS) provides free travel on local bus services anywhere in England, between 0930 and 2300 during weekdays and anytime during weekends and bank holidays. Eligibility for a pass is based on the State Pension age for women, which is set to gradually increase to 66 by 2020, and then to 67 between 2026 and 2028.
Scotland and Wales also administer similar concessionary schemes. Operators are reimbursed so that they maintain a ‘no better or no worse off’ position.
The scheme is administered at a local level by Travel Concession Authorities, some of which offer discretionary enhancements to the statutory scheme, such as free or discounted travel before 0930 or travel by other modes. In London, for example, Transport for London runs a separate scheme for all those who reach the age of 60 until they qualify for a ‘Freedom Pass’ and allow participants free unlimited travel on the majority of public transport in London.
Concessionary travel in Scotland is administered by Transport Scotland which provides those over 60 with unlimited free travel on local buses and selected long distance bus services, and in Wales, the Welsh Assembly Government provides those over 60 with free unlimited bus travel. As in England, local enhancements to statutory minimums are possible in Scotland and Wales.
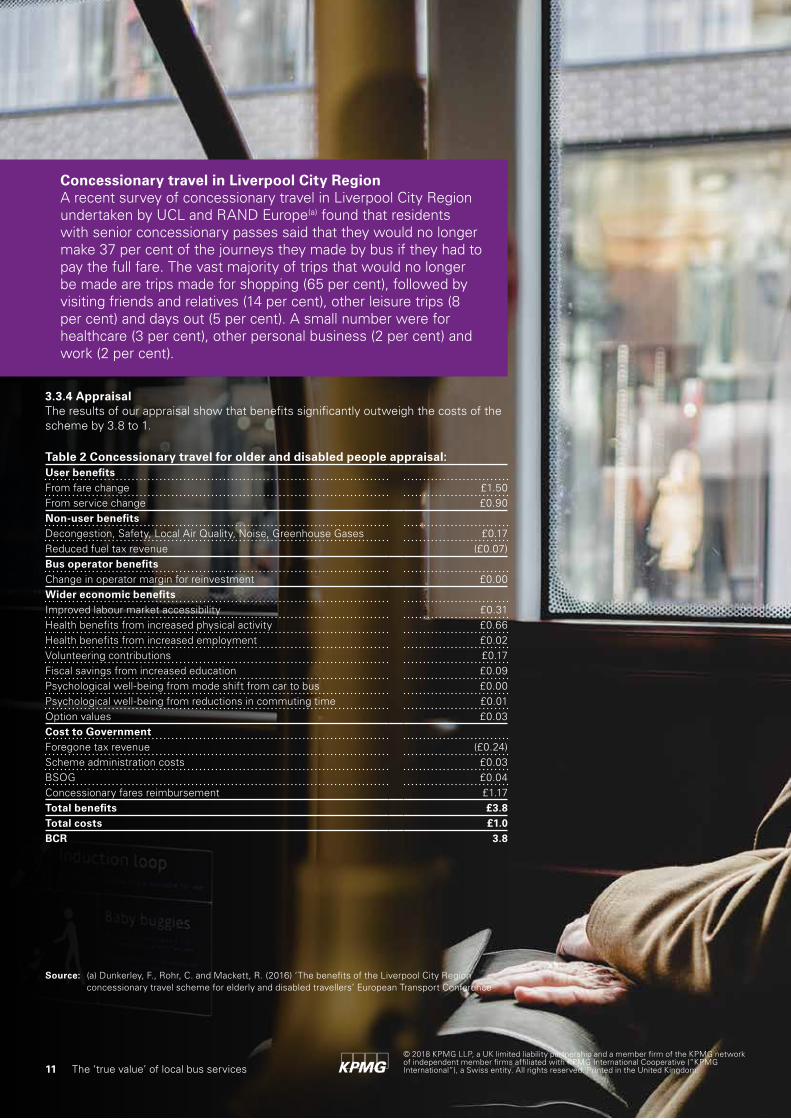
Concessionary travel in Liverpool City RegionA recent survey of concessionary travel in Liverpool City Region undertaken by UCL and RAND Europe(a) found that residents with senior concessionary passes said that they would no longer make 37 per cent of the journeys they made by bus if they had to pay the full fare. The vast majority of trips that would no longer be made are trips made for shopping (65 per cent), followed by visiting friends and relatives (14 per cent), other leisure trips (8 per cent) and days out (5 per cent). A small number were for healthcare (3 per cent), other personal business (2 per cent) and work (2 per cent).
3.3.4 AppraisalThe results of our appraisal show that benefits significantly outweigh the costs of the scheme by 3.8 to 1.
Table 2 Concessionary travel for older and disabled people appraisal:User benefitsFrom fare change £1.50From service change £0.90Non-user benefitsDecongestion, Safety, Local Air Quality, Noise, Greenhouse Gases £0.17Reduced fuel tax revenue (£0.07)Bus operator benefitsChange in operator margin for reinvestment £0.00Wider economic benefitsImproved labour market accessibility £0.31Health benefits from increased physical activity £0.66Health benefits from increased employment £0.02Volunteering contributions £0.17Fiscal savings from increased education £0.09Psychological well-being from mode shift from car to bus £0.00Psychological well-being from reductions in commuting time £0.01Option values £0.03Cost to GovernmentForegone tax revenue (£0.24)Scheme administration costs £0.03BSOG £0.04Concessionary fares reimbursement £1.17Total benefits £3.8Total costs £1.0BCR 3.8
Source: (a) Dunkerley, F., Rohr, C. and Mackett, R. (2016) ‘The benefits of the Liverpool City Region concessionary travel scheme for elderly and disabled travellers’ European Transport Conference
© 2018 KPMG LLP, a UK limited liability partnership and a member firm of the KPMG network of independent member firms affiliated with KPMG International Cooperative (“KPMG International”), a Swiss entity. All rights reserved. Printed in the United Kingdom.The ‘true value’ of local bus services11
12The ‘true value’ of local bus services
Source: (a) Department for the Environment, Transport and the Regions (1998) New Deal for Transport; Better for Everyone.
(b) HM Treasury (2006) Budget 2005, HC 372, March 2005. (c) Department for Transport (2009) Regulatory Impact Assessment Concessionary Bus Travel. (d) Department for Transport (2012) Green light for buses.
The scheme generates significant benefits for concessionary travel pass holders, estimated to total £1,331 million per year for Great Britain as a whole. Additionally, the increased capacity and enhanced service frequency needed to carry the additional concessionary passengers is also of benefit to other bus passengers and other travellers generating a further £802 million in benefits.
Evidence from the literature suggests that around a third of the journeys generated by the scheme would be made by car had the concession not been available. The corresponding reduction in car travel brings decongestion benefits to other road users, environmental improvements and a reduction in traffic related accidents, estimated to total £155 million.
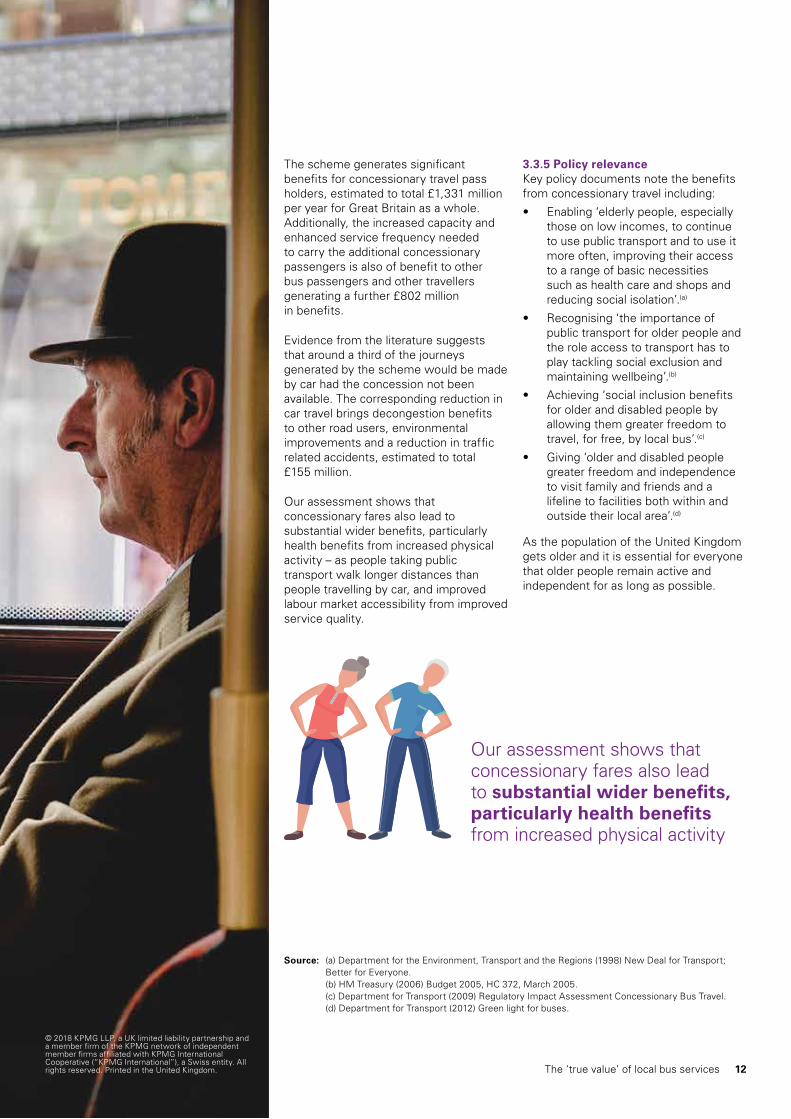
Our assessment shows that concessionary fares also lead to substantial wider benefits, particularly health benefits from increased physical activity – as people taking public transport walk longer distances than people travelling by car, and improved labour market accessibility from improved service quality.
3.3.5 Policy relevanceKey policy documents note the benefits from concessionary travel including:
• Enabling ‘elderly people, especially those on low incomes, to continue to use public transport and to use it more often, improving their access to a range of basic necessities such as health care and shops and reducing social isolation’.(a)
• Recognising ‘the importance of public transport for older people and the role access to transport has to play tackling social exclusion and maintaining wellbeing’.(b)
• Achieving ‘social inclusion benefits for older and disabled people by allowing them greater freedom to travel, for free, by local bus’.(c)
• Giving ‘older and disabled people greater freedom and independence to visit family and friends and a lifeline to facilities both within and outside their local area’.(d)
As the population of the United Kingdom gets older and it is essential for everyone that older people remain active and independent for as long as possible.
Our assessment shows that concessionary fares also lead to substantial wider benefits, particularly health benefits from increased physical activity
© 2018 KPMG LLP, a UK limited liability partnership and a member firm of the KPMG network of independent member firms affiliated with KPMG International Cooperative (“KPMG International”), a Swiss entity. All rights reserved. Printed in the United Kingdom.
13 The ‘true value’ of local bus services© 2018 KPMG LLP, a UK limited liability partnership and a member firm of the KPMG network of independent member firms affiliated with KPMG International Cooperative (“KPMG International”), a Swiss entity. All rights reserved. Printed in the United Kingdom.
3.4 Concessionary travel for apprentices3.4.1 ResultsGreener Journeys’ proposal for concessionary travel for apprentices in the first year of their apprenticeship is estimated to generate £2.70 in benefits for each £1 spent.
3.4.2 Challenges and opportunitiesThere are almost a million 16-24 year-olds in the UK who are not in education, employment or training; a large proportion of which are classified as unemployed. The problem is particularly acute amongst young people with no qualifications. Apprenticeships are clearly part of the solution to this problem, providing a route to training and employment for more than 503,900 people in England in 2015/16.
Apprentices aged 16-18 and those aged 19 and over in the first year of their apprenticeship are entitled to the ‘apprentice minimum wage’ of £3.50 an hour or approximately £6,800 per year.
The cost of getting to work can therefore account for a high proportion of the individual’s income and create a substantial barrier to participation in the labour market.
Transport for London’s concessionary travel scheme for apprenticesApprentice concessions were introduced in London in May 2013. These were made available to all apprentices over 18, living in London and in the first year of an approved apprenticeship course. The concession allows apprentices to get 30 per cent off adult rate Travelcards and Bus & Tram Passes. In 2016/17, there were over 4,000 applications for the Apprentice Oyster photocard, according to TfL statistics.
Source: (a) Spielhofer, T., Golden, S., Evans, K., Marshall, H., Mundy, E., Pomati, M. and Styles, B. (2010) Barriers to participation in education and training, Department for Education, London.
According to Department for Education research, around a third of young people who are not in employment, education or training think that they would have chosen to participate in education or training if they had more money to cover the cost of transport.(a)
The Public Accounts Committee of the House of Commons noted in 2015 that: ‘Local authority decisions on support for transport costs will impact on the participation rates in education and training. If young people cannot afford the travel costs they may drop out’. They also noted that the variation in local policy between areas reduces access and choice for some young people and creates a potential postcode inequity.
3.4.3 Market interventionThe objective of the initiative is to improve access to jobs by making it easier and cheaper for apprentices to commute to work and training by bus. The initiative will also encourage young people to make more sustainable travel choices, influencing their travel behaviour in the long term.
The proposed solution draws on experience of how similar schemes operate elsewhere. In particular the solution draws on Transport for London’s (TfL) experience in operating a concessionary travel scheme for apprentices in London. In recent years, other local or combined authorities as well as operators have also introduced concessionary fares for apprentices, such as West Midlands, West Yorkshire and Derbyshire.
Based on a stakeholder consultation, the scheme should be designed to:
• Avoid complex reimbursement arrangements for operators.
• Minimise administration costs for employers.
• Include some financial contribution from the apprentice.
Greener Journeys envisage the scheme to be operated by a third party, who would issue vouchers to eligible apprentices and would invoice the Government for the value of the voucher issued plus an administration fee.
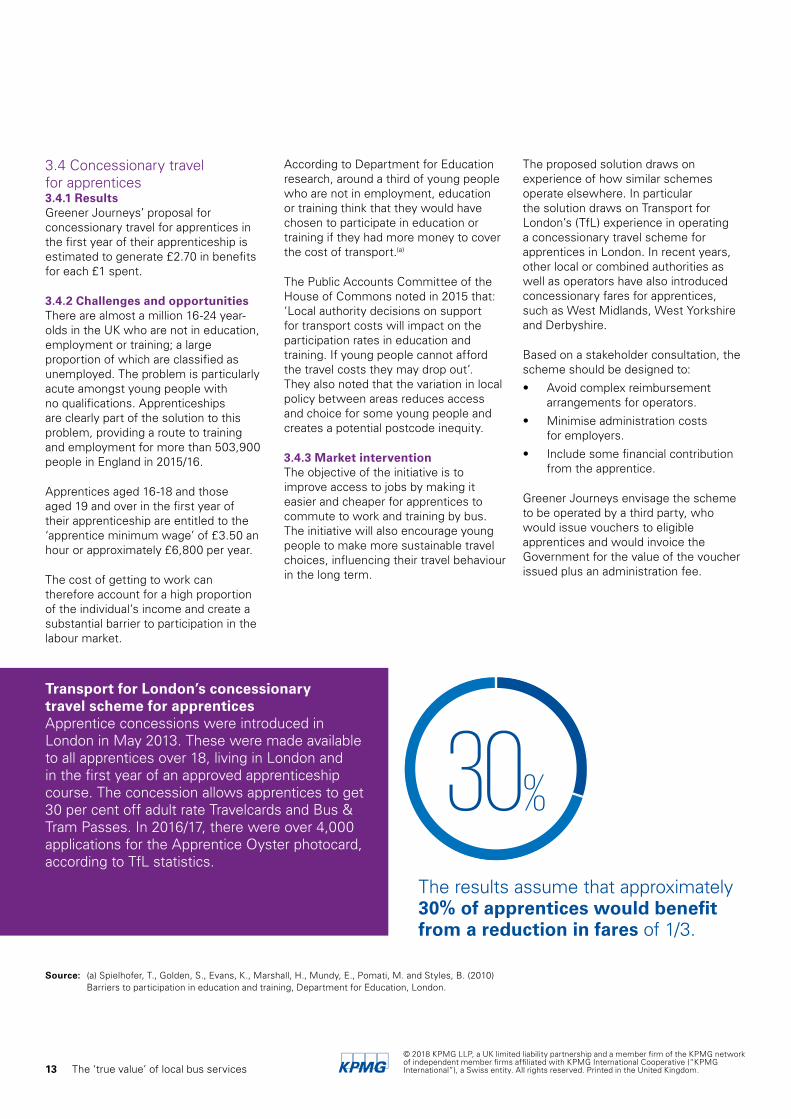
The results assume that approximately 30% of apprentices would benefit from a reduction in fares of 1/3.
30%
14The ‘true value’ of local bus services© 2018 KPMG LLP, a UK limited liability partnership and a member firm of the KPMG network of independent member firms affiliated with KPMG International Cooperative (“KPMG International”), a Swiss entity. All rights reserved. Printed in the United Kingdom.
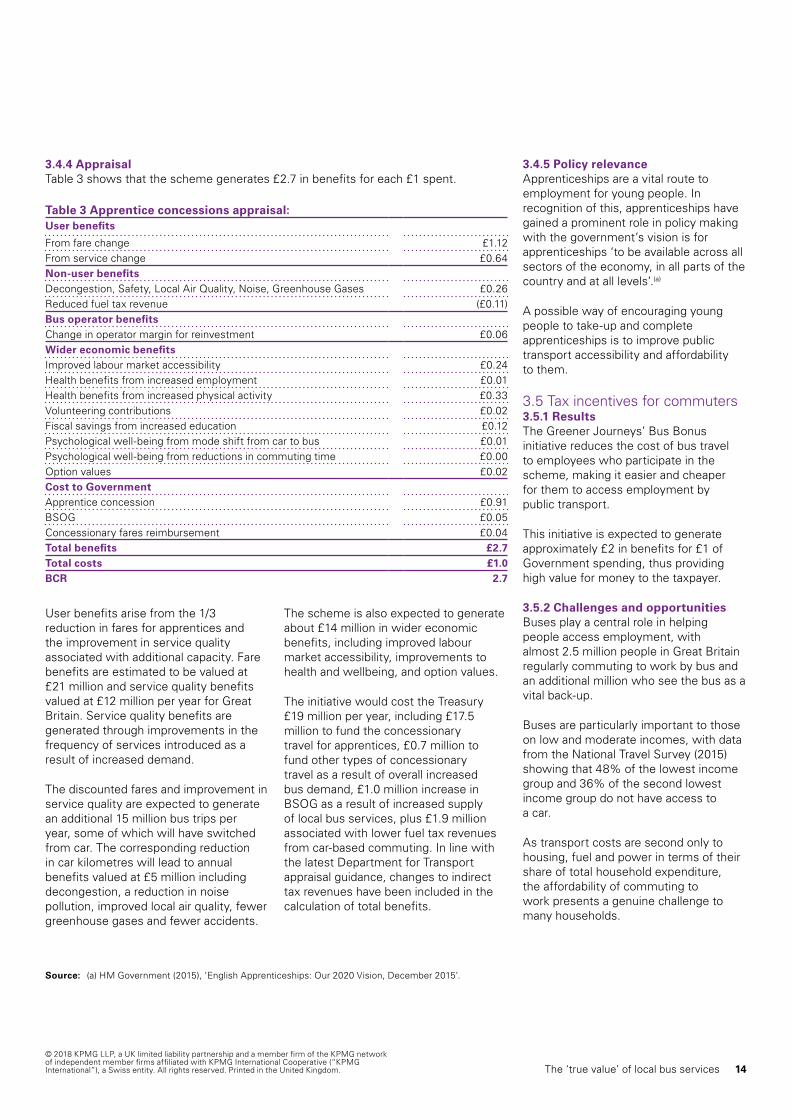
3.4.4 AppraisalTable 3 shows that the scheme generates £2.7 in benefits for each £1 spent.
Table 3 Apprentice concessions appraisal:User benefits
From fare change £1.12From service change £0.64Non-user benefitsDecongestion, Safety, Local Air Quality, Noise, Greenhouse Gases £0.26Reduced fuel tax revenue (£0.11)Bus operator benefitsChange in operator margin for reinvestment £0.06Wider economic benefitsImproved labour market accessibility £0.24Health benefits from increased employment £0.01Health benefits from increased physical activity £0.33Volunteering contributions £0.02Fiscal savings from increased education £0.12Psychological well-being from mode shift from car to bus £0.01Psychological well-being from reductions in commuting time £0.00Option values £0.02Cost to GovernmentApprentice concession £0.91BSOG £0.05Concessionary fares reimbursement £0.04Total benefits £2.7Total costs £1.0BCR 2.7
User benefits arise from the 1/3 reduction in fares for apprentices and the improvement in service quality associated with additional capacity. Fare benefits are estimated to be valued at £21 million and service quality benefits valued at £12 million per year for Great Britain. Service quality benefits are generated through improvements in the frequency of services introduced as a result of increased demand.
The discounted fares and improvement in service quality are expected to generate an additional 15 million bus trips per year, some of which will have switched from car. The corresponding reduction in car kilometres will lead to annual benefits valued at £5 million including decongestion, a reduction in noise pollution, improved local air quality, fewer greenhouse gases and fewer accidents.
The scheme is also expected to generate about £14 million in wider economic benefits, including improved labour market accessibility, improvements to health and wellbeing, and option values.
The initiative would cost the Treasury £19 million per year, including £17.5 million to fund the concessionary travel for apprentices, £0.7 million to fund other types of concessionary travel as a result of overall increased bus demand, £1.0 million increase in BSOG as a result of increased supply of local bus services, plus £1.9 million associated with lower fuel tax revenues from car-based commuting. In line with the latest Department for Transport appraisal guidance, changes to indirect tax revenues have been included in the calculation of total benefits.
3.4.5 Policy relevanceApprenticeships are a vital route to employment for young people. In recognition of this, apprenticeships have gained a prominent role in policy making with the government’s vision is for apprenticeships ‘to be available across all sectors of the economy, in all parts of the country and at all levels’.(a)
A possible way of encouraging young people to take-up and complete apprenticeships is to improve public transport accessibility and affordability to them.
3.5 Tax incentives for commuters3.5.1 ResultsThe Greener Journeys’ Bus Bonus initiative reduces the cost of bus travel to employees who participate in the scheme, making it easier and cheaper for them to access employment by public transport.
This initiative is expected to generate approximately £2 in benefits for £1 of Government spending, thus providing high value for money to the taxpayer.
3.5.2 Challenges and opportunitiesBuses play a central role in helping people access employment, with almost 2.5 million people in Great Britain regularly commuting to work by bus and an additional million who see the bus as a vital back-up.
Buses are particularly important to those on low and moderate incomes, with data from the National Travel Survey (2015) showing that 48% of the lowest income group and 36% of the second lowest income group do not have access to a car.
As transport costs are second only to housing, fuel and power in terms of their share of total household expenditure, the affordability of commuting to work presents a genuine challenge to many households.
Source: (a) HM Government (2015), ‘English Apprenticeships: Our 2020 Vision, December 2015’.

15 The ‘true value’ of local bus services© 2018 KPMG LLP, a UK limited liability partnership and a member firm of the KPMG network of independent member firms affiliated with KPMG International Cooperative (“KPMG International”), a Swiss entity. All rights reserved. Printed in the United Kingdom.
The objective of the initiative is to improve access to jobs by making it easier and cheaper for people to commute to work by bus. The initiative will encourage more people to enter the labour market and/or travel further to find work that better matches their skills.
It will also encourage commuters to switch from car to bus, easing highway congestion and reducing harmful vehicle emissions. The initiative will help promote the use of smart ticketing and, over the longer term, help to promote a vibrant and effective bus market.
3.5.3 Market interventionThis initiative allows employers to provide their employees with vouchers to help pay for the cost of commuting to work by bus. The vouchers issued will have a fixed value and will be exempt from income tax and national insurance. We refer to the initiative as the ‘Bus Bonus’.
The proposed solution draws on experience of operating public transport tax incentives elsewhere (in the US, Canada and Ireland) as well as ‘salary sacrifice’ schemes in the UK. The scheme would operate in a similar way to the childcare voucher scheme currently in place in the UK.
For Great Britain as a whole the initiative is estimated to produce £168 million in gross benefits and £83 million in net benefits.
For bus users, benefits are generated in two different ways: fare benefits and travel time benefits. Fare benefits are generated through the foregone PAYE income tax and NICs and amount to £62 million.
3.5.4 AppraisalTable 4 shows tax benefits to commuters (the Bus Bonus) to offer high value for money for the taxpayer with a benefit cost ratio equal to 2.0.
Table 4 Bus Bonus appraisal:User benefitsFrom fare change £0.72From service change £0.37Non-user benefitsDecongestion, Safety, Local Air Quality, Noise, Greenhouse Gases £0.17Reduced fuel tax revenue (£0.06)Employer benefitsEmployer NIC savings £0.21Bus operator benefitsChange in operator margin for reinvestment £0.05Wider economic benefitsImproved labour market accessibility £0.12Health benefits from increased physical activity £0.26Health benefits from increased employment £0.01Volunteering contributions £0.01Fiscal savings from increased education £0.10Psychological well-being from mode shift from car to bus £0.01Psychological well-being from reductions in commuting time £0.00Option values £0.01Cost to GovernmentForegone tax revenue £0.94BSOG £0.04Concessionary fares reimbursement £0.02Total benefits 2Total costs 1BCR 2
New York City Commuter Benefits LawNYC’s Commuter Benefits Law took effect in January 2016. Under this law, for-profit and non-profit employers with 20 or more full-time non-union employees in New York City must offer their full-time employees the opportunity to use pre-tax income to purchase qualified transportation fringe benefits. Under federal tax law, employees can currently use up to $255 a month of their pre-tax income to pay for qualified transportation. It has been estimated this law will benefit 450,000 more New York City-based employees.
Travel time benefits for bus users amount to £31.5 million. These are generated through the travel time savings from the increased frequency associated with increased patronage.
Non-user benefits, estimated to be £14 million, are generated as demand for car travel is diverted to buses as a result of the scheme, leading to reduced externalities from car travel.
Wider economic impacts amount to £43 million. These include wider social and economic benefits from improved access to employment opportunities and key public services as well as increased physical activity.
Bus operators are expected to benefit by £3.9 million as a result of increased demand and revenue.
The costs of the scheme, amounting to £85 million, consist of foregone tax revenue (as a result of tax-free travel), as well as additional revenue support to bus operations as a result of increased patronage in the form of BSOG and concessionary fares.

16The ‘true value’ of local bus services© 2018 KPMG LLP, a UK limited liability partnership and a member firm of the KPMG network of independent member firms affiliated with KPMG International Cooperative (“KPMG International”), a Swiss entity. All rights reserved. Printed in the United Kingdom.
3.5.5 Policy relevanceThe Bus Bonus initiative not only supports access to employment, but it also fits with the Government’s stated objectives to
• Boost economic growth and opportunity
• Build a One Nation Britain
• Improve journeys
• Provide safe, secure and sustainable transport.(a)
3.6 Bus Service Operators Grant3.6.1 ResultsThe Bus Service Operators Grant (BSOG) is one of the key forms of support that the Government uses to encourage the supply and demand of bus services. By bringing operating costs down, operators are incentivised to either increase supply or lower fares, attracting more demand. This leads to benefits to bus users and to society as a whole.
Our results show that BSOG, a form of revenue support based on fuel consumption, can deliver high value for money (BCR of up to 3.7).
3.6.2 Challenges and opportunitiesIn helping to deliver more efficient transport networks, the benefits of local bus services extend beyond bus users themselves to include improvements in economic productivity, social inclusion, environmental sustainability and public health. These wider economic, social and environmental benefits provide the rationale to stimulate demand by improving service quality and reducing fares.
Source: (a) DfT (2016) Single Departmental Plan 2015-2020.
To that end the Government:
• Invests in transport infrastructure and facilities to improve journey times and service reliability.
• Provides concessionary travel to older and disabled people to improve access to essential services and increase participation in social activities that would otherwise not be affordable.
• Through local authorities, enhances supply at specific locations and at specific times.
• Reduces operating costs and fares to passengers through the Bus Service Operators Grant.
It is important to recognise that the different types of Government expenditure work together to produce a combined impact that is greater than the sum of their separate effects, and furthermore, that a change in expenditure in one area will have knock-on implications for expenditure in other areas.
17 The ‘true value’ of local bus services© 2018 KPMG LLP, a UK limited liability partnership and a member firm of the KPMG network of independent member firms affiliated with KPMG International Cooperative (“KPMG International”), a Swiss entity. All rights reserved. Printed in the United Kingdom.
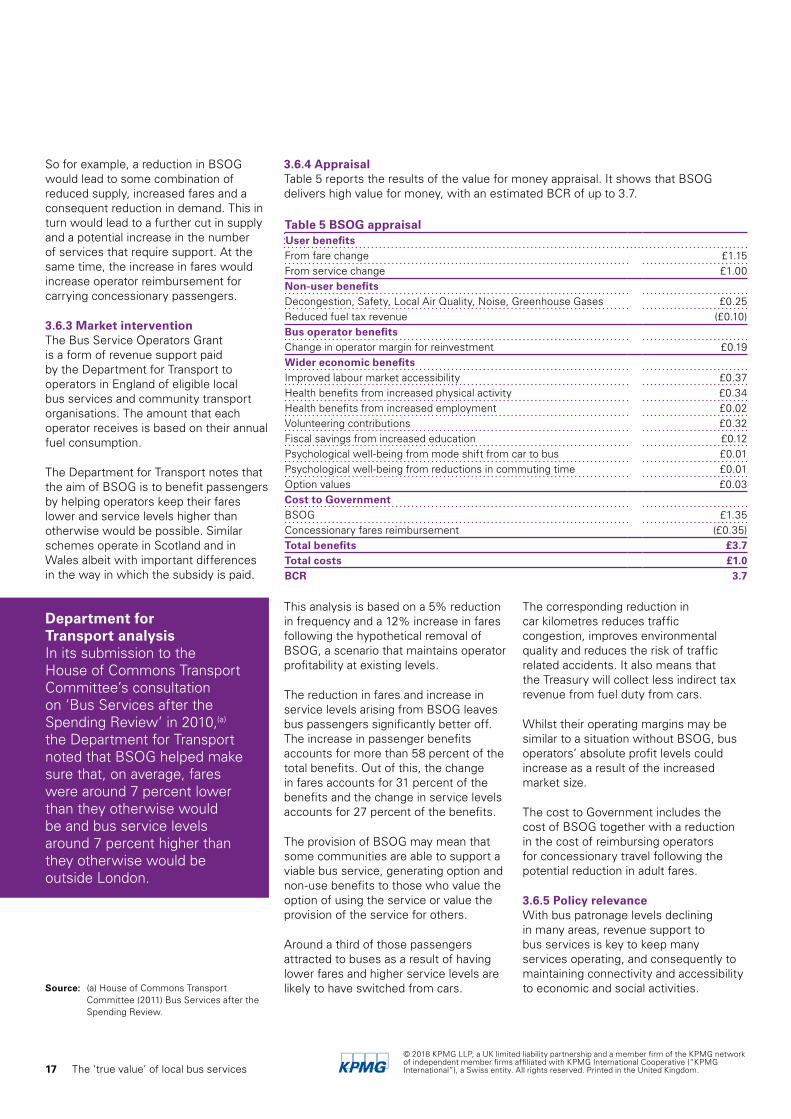
3.6.4 AppraisalTable 5 reports the results of the value for money appraisal. It shows that BSOG delivers high value for money, with an estimated BCR of up to 3.7.
This analysis is based on a 5% reduction in frequency and a 12% increase in fares following the hypothetical removal of BSOG, a scenario that maintains operator profitability at existing levels.
The reduction in fares and increase in service levels arising from BSOG leaves bus passengers significantly better off. The increase in passenger benefits accounts for more than 58 percent of the total benefits. Out of this, the change in fares accounts for 31 percent of the benefits and the change in service levels accounts for 27 percent of the benefits.
The provision of BSOG may mean that some communities are able to support a viable bus service, generating option and non-use benefits to those who value the option of using the service or value the provision of the service for others.
Around a third of those passengers attracted to buses as a result of having lower fares and higher service levels are likely to have switched from cars.
The corresponding reduction in car kilometres reduces traffic congestion, improves environmental quality and reduces the risk of traffic related accidents. It also means that the Treasury will collect less indirect tax revenue from fuel duty from cars.
Whilst their operating margins may be similar to a situation without BSOG, bus operators’ absolute profit levels could increase as a result of the increased market size.
The cost to Government includes the cost of BSOG together with a reduction in the cost of reimbursing operators for concessionary travel following the potential reduction in adult fares.
3.6.5 Policy relevanceWith bus patronage levels declining in many areas, revenue support to bus services is key to keep many services operating, and consequently to maintaining connectivity and accessibility to economic and social activities.
Table 5 BSOG appraisalUser benefitsFrom fare change £1.15From service change £1.00Non-user benefitsDecongestion, Safety, Local Air Quality, Noise, Greenhouse Gases £0.25Reduced fuel tax revenue (£0.10)Bus operator benefitsChange in operator margin for reinvestment £0.19Wider economic benefitsImproved labour market accessibility £0.37Health benefits from increased physical activity £0.34Health benefits from increased employment £0.02Volunteering contributions £0.32Fiscal savings from increased education £0.12Psychological well-being from mode shift from car to bus £0.01Psychological well-being from reductions in commuting time £0.01Option values £0.03Cost to GovernmentBSOG £1.35Concessionary fares reimbursement (£0.35)Total benefits £3.7Total costs £1.0BCR 3.7
So for example, a reduction in BSOG would lead to some combination of reduced supply, increased fares and a consequent reduction in demand. This in turn would lead to a further cut in supply and a potential increase in the number of services that require support. At the same time, the increase in fares would increase operator reimbursement for carrying concessionary passengers.
3.6.3 Market interventionThe Bus Service Operators Grant is a form of revenue support paid by the Department for Transport to operators in England of eligible local bus services and community transport organisations. The amount that each operator receives is based on their annual fuel consumption.
The Department for Transport notes that the aim of BSOG is to benefit passengers by helping operators keep their fares lower and service levels higher than otherwise would be possible. Similar schemes operate in Scotland and in Wales albeit with important differences in the way in which the subsidy is paid.
Department for Transport analysisIn its submission to the House of Commons Transport Committee’s consultation on ‘Bus Services after the Spending Review’ in 2010,(a) the Department for Transport noted that BSOG helped make sure that, on average, fares were around 7 percent lower than they otherwise would be and bus service levels around 7 percent higher than they otherwise would be outside London.
Source: (a) House of Commons Transport Committee (2011) Bus Services after the Spending Review.
18The ‘true value’ of local bus services© 2018 KPMG LLP, a UK limited liability partnership and a member firm of the KPMG network of independent member firms affiliated with KPMG International Cooperative (“KPMG International”), a Swiss entity. All rights reserved. Printed in the United Kingdom.
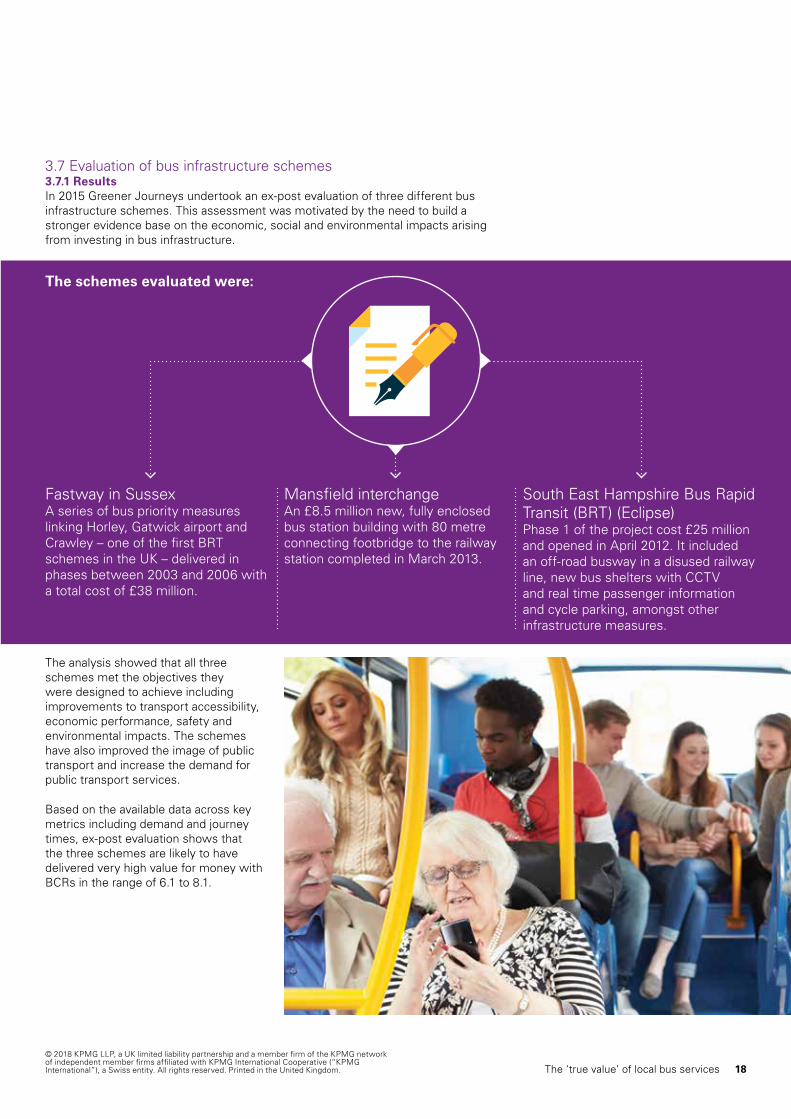
3.7 Evaluation of bus infrastructure schemes3.7.1 ResultsIn 2015 Greener Journeys undertook an ex-post evaluation of three different bus infrastructure schemes. This assessment was motivated by the need to build a stronger evidence base on the economic, social and environmental impacts arising from investing in bus infrastructure.
The analysis showed that all three schemes met the objectives they were designed to achieve including improvements to transport accessibility, economic performance, safety and environmental impacts. The schemes have also improved the image of public transport and increase the demand for public transport services.
Based on the available data across key metrics including demand and journey times, ex-post evaluation shows that the three schemes are likely to have delivered very high value for money with BCRs in the range of 6.1 to 8.1.
The schemes evaluated were:
Mansfield interchange An £8.5 million new, fully enclosed bus station building with 80 metre connecting footbridge to the railway station completed in March 2013.
Fastway in Sussex A series of bus priority measures linking Horley, Gatwick airport and Crawley – one of the first BRT schemes in the UK – delivered in phases between 2003 and 2006 with a total cost of £38 million.
South East Hampshire Bus Rapid Transit (BRT) (Eclipse) Phase 1 of the project cost £25 million and opened in April 2012. It included an off-road busway in a disused railway line, new bus shelters with CCTV and real time passenger information and cycle parking, amongst other infrastructure measures.

19 The ‘true value’ of local bus services© 2018 KPMG LLP, a UK limited liability partnership and a member firm of the KPMG network of independent member firms affiliated with KPMG International Cooperative (“KPMG International”), a Swiss entity. All rights reserved. Printed in the United Kingdom.
3.7.2 Appraisal – Mansfield InterchangeThe Mansfield interchange provides a new high quality interchange in substitution of an old station in a substandard condition. This includes new passenger facilities, taxi provision at the bus station, cycle parking, CCTV, improved walk routes to the town centre and a pedestrian bridge linking bus and rail.
The new station has therefore resulted in substantial ‘ambience’ benefits for station users, which includes bus users, as well as pedestrians, cyclists and rail users. This is reflected in customer satisfaction rates, which have shown marked increases in user satisfaction since the opening of the station and are now close to the target of 90% across a wide range of indicators.
An initial business case was submitted in 2005. This was updated in 2010 after the original proposal was amended. According to the ex ante business case, the scheme was expected to generate benefits for pedestrians, quality benefits for station users from station improvements and additional revenue for operators.
The updated ex-ante business case showed a Benefit-Cost Ratio (BCR) of 4.06 for the base case and 4.99 for an optimistic scenario over a 60-year period, indicating high value for money.The present value of benefits was in the range of £61 million to £75 million while the present value of costs was £15 million.
Greener Journeys ex-post business case analysis (Table 6) shows that the BCR of the scheme is likely to be even higher, estimated at 6.8. This is because outturn demand has been higher than the ex-ante demand forecasts and because of the additional benefits included.
Table 6 Mansfield Interchange appraisal:£’000
User benefitsTime savings for bus users (£202)Quality benefits/journey ambience £79,955Pedestrian time savings £41,629Non-user benefitsAccidents £4,915Additional non-user benefits (excluding accidents) £1,279Car user time savings £3,770Indirect taxes (£391)Bus operator benefitsOperator revenue impacts £17,973Operator cost impacts £686Wider impactsImproved labour market accessibility £2,198Health benefits from increased physical activity £2,405Health benefits from increased employment £116Volunteering contributions £115Fiscal savings from increased education £1,188Psychological well-being from mode shift from car to bus £65Psychological well-being from reductions in commuting time £301Option values £614CostsCosts £23,079Total benefits and costsTotal benefits with wider impacts £156,616Total costs £23,079BCR 6.8
3.7.3 Appraisal – South East Hampshire BRTThe South East Hampshire BRT (Eclipse) scheme consists of an off road busway along a section of disused railway line between Redlands Land in Fareham and Tichborne Way in Gosport. The dedicated busway was designed to allow buses to avoid queues and delays on the northern section on the A32 and the B3385 and to provide a more direct link to Fareham railway station. By bypassing the main areas of congestion and providing new services with increased frequencies, the scheme has led to improvements in journey time and reliability.
In addition to the busway, the services operated on this route introduced a new high quality fleet with on-board services such as free WIFI, news and updates. An improvement of the fleet was a commitment by the operator as part of the project. This service was branded as the Eclipse service. Thus, the scheme also provides significant ambience benefits to users.
Since the service started operating, patronage for Eclipse has grown significantly over the years, showing that the scheme has become very popular in the area.
Based on actual demand and time savings data, we have estimated user benefits to be approximately £120 million. Additionally, we estimate non-user benefits to be approximately £10 million and wider impacts to be £7 million.
Both non-user and wider benefits have been estimated based on actual demand data and our appraisal framework and have not been checked against actual data.

Table 7 South East Hampshire BRT appraisal:£’000
User benefitsTime savings for bus users £96,234Quality benefits/journey ambience £20,730Operator revenue impacts £209,750Operator cost impacts £37,802Non-user benefitsAccidents £17,587Greenhouse gases £3,053Additional non-user benefits (excluding accidents) £2,803Indirect taxes (£718)Wider impactsImproved labour market accessibility £48,956Health benefits from increased physical activity £4,413Health benefits from increased employment £2,585Volunteering contributions £534Fiscal savings from increased education £2,180Psychological well-being from mode shift from car to bus £120Psychological well-being from reductions in commuting time £1,308Option values £2,805CostsCosts £55,513Total benefits and costsTotal benefits with wider impacts £450,141Total costs £55,513BCR 8.1
A full business case for the South East Hampshire BRT was submitted in 2008. This presented a BCR of 1.5, with a present value of benefits of £228 million and costs of £153 million (2002 prices) over a 60-year period. This BCR represents low to medium value for money.
Of the £228 million of benefits, 25% corresponded to user benefits, including both time savings and reductions in vehicle operating costs. A further 69% of benefits corresponded to additional revenue generated by the scheme for private sector providers. Non-user benefits included environmental benefits and a reduction in accidents (approximately 7% of total benefits). Ambience benefits were not included in the ex-ante business case.
However, the inclusion of the costs associated with a reduction in parking revenues for the full 60 year appraisal period risks overestimating the present value of costs - it would be reasonable to expect that over the longer term any excess supply would be filled by demand growth from other sources, or else the available parking space would be sold off or put to an alternative use, thus achieving alternative revenues. Excluding parking revenues, the BCR goes up to 5.5, indicating high value for money.
The ex-post business case analysis shows that based on outturn demand and time savings data, and adding an estimate of ambience and wider benefits of the scheme, the BCR could go up to 8.1. It is worth noting that we have kept the discount year as 2002 to be able to include the benefits and costs that have not been updated into the appraisal. Environmental impacts and operating costs have not been updated due to lack of data availability.
20The ‘true value’ of local bus services© 2018 KPMG LLP, a UK limited liability partnership and a member firm of the KPMG network of independent member firms affiliated with KPMG International Cooperative (“KPMG International”), a Swiss entity. All rights reserved. Printed in the United Kingdom.

21 The ‘true value’ of local bus services
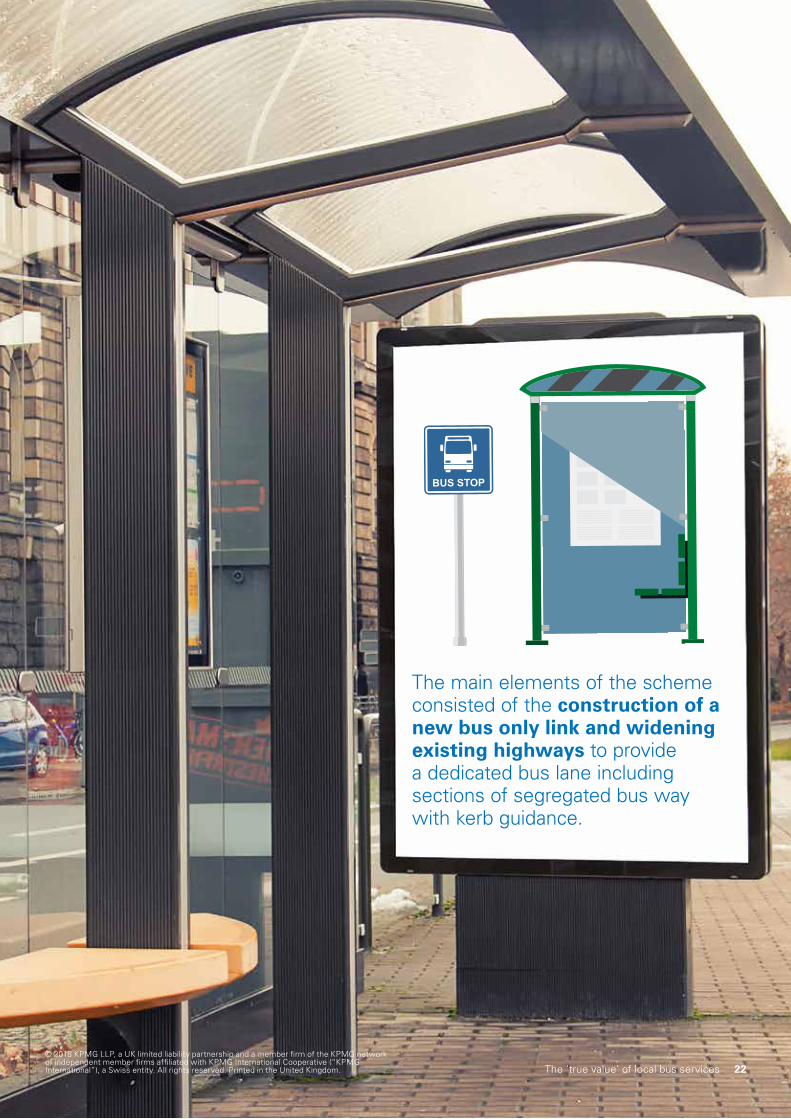
3.7.4 Appraisal – FastwayThe Fastway scheme involved the implementation of a series of bus priority measures along two core routes linking Horley, Gatwick airport and Crawley. The main elements of the scheme consisted of the construction of a new bus only link and widening existing highways to provide a dedicated bus lane including sections of segregated bus way with kerb guidance. In addition to bus infrastructure, a number of improvements were made to the buses themselves.
As a result of both infrastructure and bus service improvements, the scheme has exceeded patronage growth targets and has achieved high customer satisfaction rates. Reductions in journey times have also exceeded targets for the scheme, leading to higher benefits for bus users than initially expected.
A scheme appraisal report for Fastway was produced by West Sussex County Council in 2000. According to this business case appraisal, the Fastway scheme was expected to deliver a BCR of 1.9. This was based on a present value of benefits of £73 million and present value of costs of £38 million, thus leading to a net present value of £36 million.
Since this appraisal was undertaken, the DfT methodology for estimating BCRs has changed and benefits and costs have been reclassified. Based on the current guidance, the net present value would stay the same but the ratio of benefits and costs would change, due to lower estimated costs, leading to a BCR of 4.7. This indicates very high value for money.
The ex ante appraisal did not include any quantification of journey ambience or quality benefits, although these are described as a beneficial impact in the appraisal summary table of the business case.
Based on outturn demand, time savings and capital costs, we have produced an ex-post business case updating benefits and costs where possible.
Table 8 Fastway BRT appraisal:£ ‘000
User benefitsTime savings for bus users £118,971Quality benefits/journey ambience £14,754Operator cost impacts £0Non-user benefitsAdditional non-user benefits (excluding accidents) £311Vehicle operating costs (£12,311)Net freight impact £7,219Indirect taxes (£8,719)Wider impactsImproved labour market accessibility £34,647Health benefits from increased physical activity £585Health benefits from increased employment £1,830Volunteering contributions £1,041Fiscal savings from increased education £289Psychological well-being from mode shift from car to bus £16Psychological well-being from reductions in commuting time £388Option values £194CostsCosts £26,311Total benefits and costsTotal benefits with wider impacts £159,215Total costs £26,311BCR 6.1
Where outturn data was not available, we have assumed that benefits and costs remain the same as in the ex-ante business case – this applies to freight benefits and operating costs. We have also estimated benefits from improved service quality (‘ambience’ benefits) and wider impacts to the appraisal, which were excluded in the ex-ante business case.
The ex-post business case analysis shows that the BCR of the scheme is likely to be higher than previously estimated at 6.1. This is because demand has been higher than initially forecasted and additional benefits have been included.
© 2018 KPMG LLP, a UK limited liability partnership and a member firm of the KPMG network of independent member firms affiliated with KPMG International Cooperative (“KPMG International”), a Swiss entity. All rights reserved. Printed in the United Kingdom.
22The ‘true value’ of local bus services
The main elements of the scheme consisted of the construction of a new bus only link and widening existing highways to provide a dedicated bus lane including sections of segregated bus way with kerb guidance.
© 2018 KPMG LLP, a UK limited liability partnership and a member firm of the KPMG network of independent member firms affiliated with KPMG International Cooperative (“KPMG International”), a Swiss entity. All rights reserved. Printed in the United Kingdom.
23 The ‘true value’ of local bus services© 2018 KPMG LLP, a UK limited liability partnership and a member firm of the KPMG network of independent member firms affiliated with KPMG International Cooperative (“KPMG International”), a Swiss entity. All rights reserved. Printed in the United Kingdom.
Summary and discussion
4
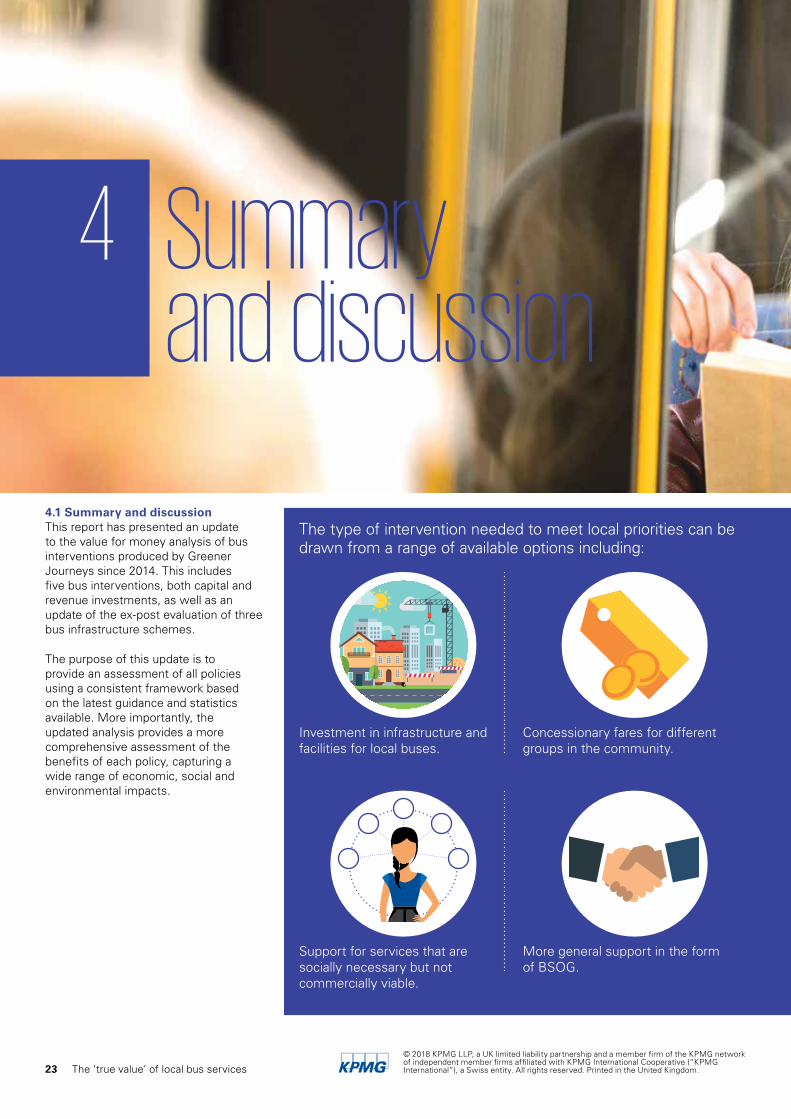
4.1 Summary and discussionThis report has presented an update to the value for money analysis of bus interventions produced by Greener Journeys since 2014. This includes five bus interventions, both capital and revenue investments, as well as an update of the ex-post evaluation of three bus infrastructure schemes.
The purpose of this update is to provide an assessment of all policies using a consistent framework based on the latest guidance and statistics available. More importantly, the updated analysis provides a more comprehensive assessment of the benefits of each policy, capturing a wide range of economic, social and environmental impacts.
The type of intervention needed to meet local priorities can be drawn from a range of available options including:
Investment in infrastructure and facilities for local buses.
Concessionary fares for different groups in the community.
More general support in the form of BSOG.
Support for services that are socially necessary but not commercially viable.

24The ‘true value’ of local bus services© 2018 KPMG LLP, a UK limited liability partnership and a member firm of the KPMG network of independent member firms affiliated with KPMG International Cooperative (“KPMG International”), a Swiss entity. All rights reserved. Printed in the United Kingdom.
Figure 3 Benefit cost ratios (BCRs) for capital and revenue expenditure in local bus markets:
£4.20Local Majors**
£4.90Bus priority measures**
£5.00Local sustainable transport fund**
£6.10Vrawley Fastway*
£6.80Mansfield Interchange*
£8.10Hampshire Eclipse*
£2.00Tax incentives for bus commuters*
£2.50Supported service**
£2.70Concessionary travel for apprentices***
£3.70Bus Service Operators Grant*
£3.80Concessionary travel for older and disabled people*
Capital Revenue
Note: BCR is shown as the benefit per £1 of investment/support rounded to the nearest £0.50 * Greener Journeys ** Department for Transport *** Urban Transport Group
BCR
The interventions are aimed at improving the attractiveness of public transport by either reducing fares or improving service quality (e.g., network size, vehicle speeds, journey time reliability, service-frequency, comfort, convenience) and each should be considered in the context of local conditions.
By maintaining the correct balance of different types of expenditure, the Government can retain flexibility to efficiently incentivise the market to deliver fares and services to maximise economic, social and environmental returns.
Figure 3 presents a list of evidence developed by Greener Journeys alongside evidence produced by the Department for Transport on the value of bus-related capital investment and revenue support initiatives.
The economic, social and environmental return for each £1 spent range from £2.00 to £3.80 for revenue expenditure and £4.20 and £8.10 for capital expenditure.
Whilst much depends on the nature of the intervention and local conditions it is clear that investment in local bus markets generates significant benefits to passengers, other road users and the wider community.
In drawing conclusions it is useful to benchmark the new value for money estimates against recent values produced by the Department for Transport and the Urban Transport Group(a) and there is a clear and consistent picture being formed on the benefits of investing in local bus services.
25 The ‘true value’ of local bus services© 2018 KPMG LLP, a UK limited liability partnership and a member firm of the KPMG network of independent member firms affiliated with KPMG International Cooperative (“KPMG International”), a Swiss entity. All rights reserved. Printed in the United Kingdom.
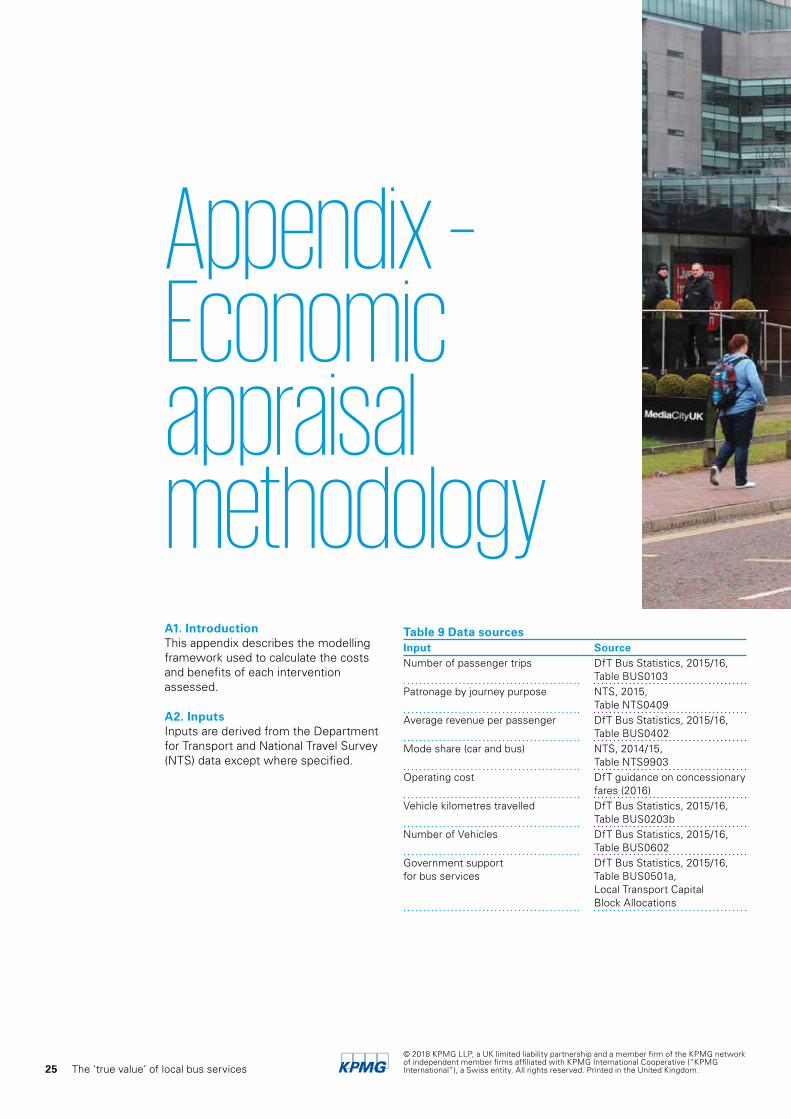
Appendix – Economic appraisal methodologyA1. IntroductionThis appendix describes the modelling framework used to calculate the costs and benefits of each intervention assessed.
A2. InputsInputs are derived from the Department for Transport and National Travel Survey (NTS) data except where specified.
Table 9 Data sourcesInput SourceNumber of passenger trips DfT Bus Statistics, 2015/16,
Table BUS0103Patronage by journey purpose NTS, 2015,
Table NTS0409Average revenue per passenger DfT Bus Statistics, 2015/16,
Table BUS0402Mode share (car and bus) NTS, 2014/15,
Table NTS9903Operating cost DfT guidance on concessionary
fares (2016)Vehicle kilometres travelled DfT Bus Statistics, 2015/16,
Table BUS0203bNumber of Vehicles DfT Bus Statistics, 2015/16,
Table BUS0602Government support for bus services
DfT Bus Statistics, 2015/16, Table BUS0501a, Local Transport Capital Block Allocations
26The ‘true value’ of local bus services© 2018 KPMG LLP, a UK limited liability partnership and a member firm of the KPMG network of independent member firms affiliated with KPMG International Cooperative (“KPMG International”), a Swiss entity. All rights reserved. Printed in the United Kingdom.
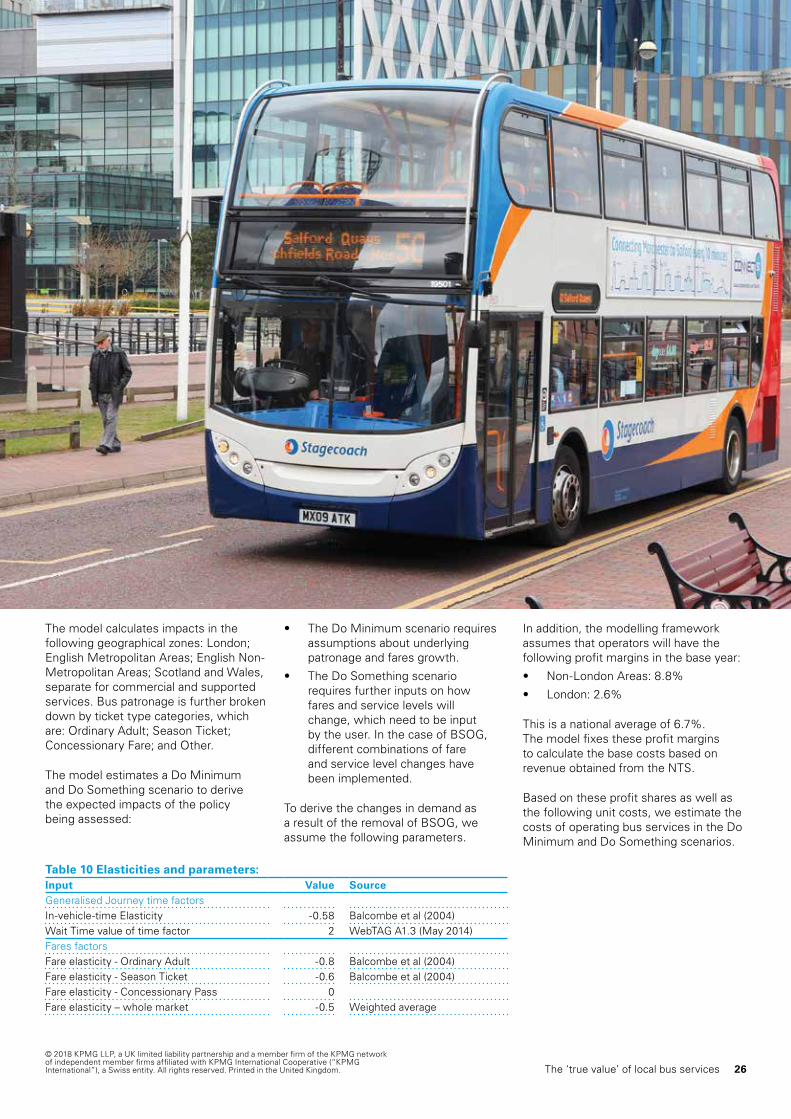
The model calculates impacts in the following geographical zones: London; English Metropolitan Areas; English Non-Metropolitan Areas; Scotland and Wales, separate for commercial and supported services. Bus patronage is further broken down by ticket type categories, which are: Ordinary Adult; Season Ticket; Concessionary Fare; and Other.
The model estimates a Do Minimum and Do Something scenario to derive the expected impacts of the policy being assessed:
• The Do Minimum scenario requires assumptions about underlying patronage and fares growth.
• The Do Something scenario requires further inputs on how fares and service levels will change, which need to be input by the user. In the case of BSOG, different combinations of fare and service level changes have been implemented.
To derive the changes in demand as a result of the removal of BSOG, we assume the following parameters.
Table 10 Elasticities and parameters:Input Value SourceGeneralised Journey time factorsIn-vehicle-time Elasticity -0.58 Balcombe et al (2004)Wait Time value of time factor 2 WebTAG A1.3 (May 2014)Fares factorsFare elasticity - Ordinary Adult -0.8 Balcombe et al (2004)Fare elasticity - Season Ticket -0.6 Balcombe et al (2004)Fare elasticity - Concessionary Pass 0Fare elasticity – whole market -0.5 Weighted average
In addition, the modelling framework assumes that operators will have the following profit margins in the base year:
• Non-London Areas: 8.8%
• London: 2.6%
This is a national average of 6.7%. The model fixes these profit margins to calculate the base costs based on revenue obtained from the NTS.
Based on these profit shares as well as the following unit costs, we estimate the costs of operating bus services in the Do Minimum and Do Something scenarios.
27 The ‘true value’ of local bus services© 2018 KPMG LLP, a UK limited liability partnership and a member firm of the KPMG network of independent member firms affiliated with KPMG International Cooperative (“KPMG International”), a Swiss entity. All rights reserved. Printed in the United Kingdom.
A3. Benefits and costs methodologyThe demand model is the driver of the entire modelling framework. Changes in demand for bus services lead to economic benefits, changes in revenue and changes in costs as a result of service level changes.
The model is based on a demand curve, where the price of travel is the generalised cost of travel. This model keeps the impact of fare changes and the impact of generalised journey time changes separate:
Generalised Cost = Fare + Generalised Journey Time
Changes in either element of generalised cost will affect demand. The magnitude of the impact on demand is determined by the elasticity of demand for the relevant elements of generalised cost:
Change in Demand (%) = Fare elasticity x Change in Fare (%) + Generalised Travel Time elasticity x Change in Generalised Journey Time (%)
Changes in demand directly drive any changes in revenue. Revenue is calculated as demand multiplied by fare for each individual geographical area. Concessionary travel reimbursement reflects both changes in fares and demand.
Benefits and disbenefits are experienced by those directly affected by the policy and also by third parties who have acquired some sort of benefit as a result of the policy. The benefits are grouped as follows: bus-user benefits, non-bus-user benefits, private sector provider impacts and wider impacts. In addition, there is a financial impact for the Government who funds the policy and supports bus services through BSOG and concessionary fares. These are described on the next page.
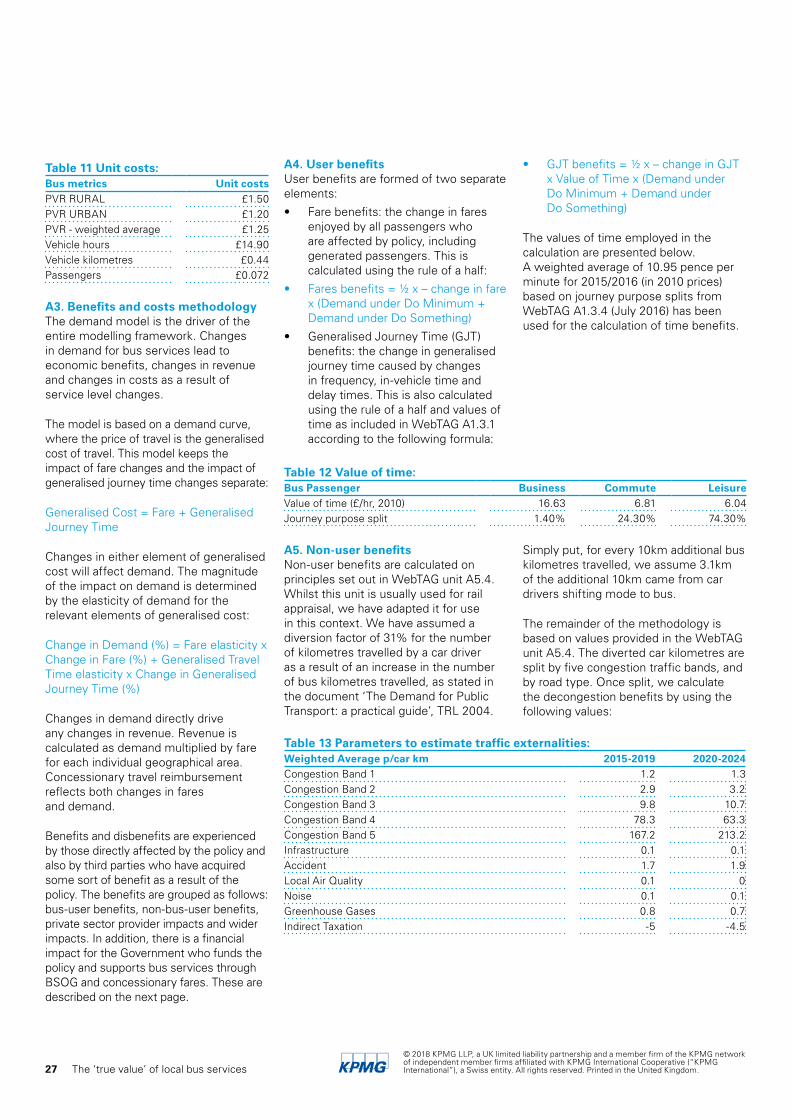
A4. User benefitsUser benefits are formed of two separate elements:
• Fare benefits: the change in fares enjoyed by all passengers who are affected by policy, including generated passengers. This is calculated using the rule of a half:
• Fares benefits = ½ x – change in fare x (Demand under Do Minimum + Demand under Do Something)
• Generalised Journey Time (GJT) benefits: the change in generalised journey time caused by changes in frequency, in-vehicle time and delay times. This is also calculated using the rule of a half and values of time as included in WebTAG A1.3.1 according to the following formula:
• GJT benefits = ½ x – change in GJT x Value of Time x (Demand under Do Minimum + Demand under Do Something)
The values of time employed in the calculation are presented below. A weighted average of 10.95 pence per minute for 2015/2016 (in 2010 prices) based on journey purpose splits from WebTAG A1.3.4 (July 2016) has been used for the calculation of time benefits.
Table 11 Unit costs:Bus metrics Unit costsPVR RURAL £1.50PVR URBAN £1.20PVR - weighted average £1.25Vehicle hours £14.90Vehicle kilometres £0.44Passengers £0.072
Table 13 Parameters to estimate traffic externalities:Weighted Average p/car km 2015-2019 2020-2024Congestion Band 1 1.2 1.3Congestion Band 2 2.9 3.2Congestion Band 3 9.8 10.7Congestion Band 4 78.3 63.3Congestion Band 5 167.2 213.2Infrastructure 0.1 0.1Accident 1.7 1.9Local Air Quality 0.1 0Noise 0.1 0.1Greenhouse Gases 0.8 0.7Indirect Taxation -5 -4.5
Table 12 Value of time:Bus Passenger Business Commute LeisureValue of time (£/hr, 2010) 16.63 6.81 6.04Journey purpose split 1.40% 24.30% 74.30%
A5. Non-user benefitsNon-user benefits are calculated on principles set out in WebTAG unit A5.4. Whilst this unit is usually used for rail appraisal, we have adapted it for use in this context. We have assumed a diversion factor of 31% for the number of kilometres travelled by a car driver as a result of an increase in the number of bus kilometres travelled, as stated in the document ‘The Demand for Public Transport: a practical guide’, TRL 2004.
Simply put, for every 10km additional bus kilometres travelled, we assume 3.1km of the additional 10km came from car drivers shifting mode to bus.
The remainder of the methodology is based on values provided in the WebTAG unit A5.4. The diverted car kilometres are split by five congestion traffic bands, and by road type. Once split, we calculate the decongestion benefits by using the following values:

28The ‘true value’ of local bus services© 2018 KPMG LLP, a UK limited liability partnership and a member firm of the KPMG network of independent member firms affiliated with KPMG International Cooperative (“KPMG International”), a Swiss entity. All rights reserved. Printed in the United Kingdom.
A6. Private sector impactsPrivate sector provider benefits are based predominantly on the financial impacts on the bus companies. This includes the difference between the Do Something scenario and the Do Minimum scenario in:
• Operating costs: these forecasts are based on changes in demand and vehicle kilometres.
• Revenue: based on fares and estimated demand.
• Total government support: concessionary reimbursement, BSOG and other relevant forms of government support.
A7. Government impactsGovernment impacts include the cost of the scheme, and changes to BSOG and concessionary fares as a result of demand changes.
A8. Wider benefitsThe wider impacts calculated in this analysis correspond to a set of wider social and economic benefits identified in the literature. Although some of them may be subject to high uncertainty, most of these benefits are increasingly accepted by the Department for Transport in economic appraisals.
The methodology employed to calculate each type of benefit is shown below.
Table 14 Wider economic and social impacts:Policy/investment Sources MethodologyEconomic impactsEmployment benefits (additional tax revenue or tax savings)
Buses and the Economy II, ITS report for Greener Journeys (2014), ONS, DfT WebTAG
An elasticity of journey time to employment (ITS 2014) is applied to changes in generalised journey time and the employment affected by the scheme (ONS) to obtain the number of potential new jobs. New jobs are then multiplied by the median wage (ONS) and the tax take on those jobs (WebTAG).
Health fiscal savings from increased employment
New Economy Tool (NET) (2016)
New jobs estimated as part of employment impacts are multiplied by the health fiscal saving of new jobs (NET).
Fiscal savings from increased education
New Economy Tool (2016) and National Travel Survey (2014)
The number of new people in education – estimated based on forecast additional bus demand that was not displace from other modes, the average proportion of education trips out of total bus trips, and education trips per person – is multiplied by the NET fiscal savings of new people in education.
Social impactsOption and non-use values
ONS, UK Bus statistics, DfT WebTAG
The change in households with good access to bus services – estimated based on existing households with poor access to buses and changes in bus services (measured as vehicle km) - is multiplied by an option value from WebTAG.
Health and wellbeing New Zealand Transport Agency (NZTA)
The change in walked km as a result of trips shifting from car to bus and generated bus demand (not displaced from other modes) is multiplied by the NZTA health benefit per walked km.
Volunteering Royal Voluntary Service (RVS) (2011)
Using shadow prices, average number of hours devoted to volunteering activities per person from the RVS, the proportion of how many of these activities may be accessed by bus, as well as generated bus travel demand by the scheme (not displaced from other modes), the value of the change in voluntary activity is estimated.
Psychological wellbeing ONS research on commuting and wellbeing (2014), New Economy Tool (2016)
Using the improvement in wellbeing researched by the ONS as a result of increased commuting by public transport and reduced commuting time, as well as the value of emotional wellbeing from the NET, the value of changes to psychological wellbeing are estimated.

29 The ‘true value’ of local bus services© 2018 KPMG LLP, a UK limited liability partnership and a member firm of the KPMG network of independent member firms affiliated with KPMG International Cooperative (“KPMG International”), a Swiss entity. All rights reserved. Printed in the United Kingdom.
© 2018 KPMG LLP, a UK limited liability partnership and a member firm of the KPMG network of independent member firms affiliated with KPMG International Cooperative (“KPMG International”), a Swiss entity. All rights reserved. Printed in the United Kingdom.
The information contained herein is of a general nature and is not intended to address the circumstances of any particular individual or entity. Although we endeavour to provide accurate and timely information, there can be no guarantee that such information is accurate as of the date it is received or that it will continue to be accurate in the future. No one should act on such information without appropriate professional advice after a thorough examination of the particular situation.
The KPMG name, logo are registered trademarks or trademarks of KPMG International.
CREATE. | CRT092472A | January 2018
kpmg.com/uk
Gerard WhelanTransport Advisory
T: +44(0)7747 021 002E: [email protected]
Contact us