the australian sugar industry - home - … · submitting to you the report on the australian sugar...
TRANSCRIPT
INDUSTRYCOMMISSION
THE AUSTRALIAN SUGAR INDUSTRY
REPORT NO. 196 MARCH 1992
Australian Government Publishing ServiceCanberra

© Commonwealth of Australia 1992ISBN 0 644 24669 3
This work is copyright. Apart from any use as permitted under the Copyright Act1968, no part may be reproduced by any process without prior written permissionfrom the Australian Government Publishing Service. Requests and concerningreproduction and rights should be addressed to the Manager, CommonwealthInformation Services, Australian Government Publishing Service, GPO BOX 84,Canberra ACT 2601.
Printed in Australia by P. .J. GRILLS, Commonwealth Government Printer, Canberra

INDUSTRYCOMMISSION
6 March 1992
Honourable J Dawkins, MPTreasurerParliament HouseCANBERRA ACT 2600
Dear Treasurer
In accordance with Section 7 of the Industry Commission Act 1989, we have the pleasure insubmitting to you the report on The Australian Sugar Industry.
Yours sincerely
Roger Mauldon Geoff Edwards
Acting AssociateChairperson Commission
COMMISSIONER
Benjamin Offices, Chan Street,Belconnen ACT Australia
PO BOX, Belconnen ACT 2616Telephone: 06 264 1144Facsimile: 06 253 1662

THE AUSTRALIANSUGAR INDUSTRY
IV
Acknowledgment
The Commission wishes to thank those staff members who contributed to this report.
CONTENTS V
CONTENTS
Page
1 OVERVIEW AND RECOMMENDATIONS 1
2 INTRODUCTION 192.1 Origins of the inquiry 192.2 Scope of the inquiry 192.3 Inquiry procedures 202.4 Structure of the report 20
3 INDUSTRY STRUCTURE 233.1 Cane growing 233.2 Sugar milling 24
3.2.1 Background 243.2.2 Raw sugar production 25
3.3 Sugar refining 273.4 Employment 273.5 The domestic market 283.6 Export markets 29
4 BACKGROUND TO THE PRESENT INSTITUTIONALAND REGULATORY FRAMEWORK 334.1 The Queensland industry 33
4.1.1 Historical background 334.1.2 Major changes between 1983 and 1990 344.1.3 The 1991 Queensland Sugar Industry Act 35
4.2 The New South Wales industry 36
5 PRODUCTION CONTROLS IN QUEENSLAND 375.1 Land assignment 375.2 Farm peaks 395.3 Regulation of the grower/mill relationship 395.4 Reasons for regulation 40
5.4.1 Offsetting the economic power of mills 415.4.2 Matching mill capacity and cane production 435.4.3 Protecting asset values 445.4.4 Guaranteeing mill throughput 455.4.5 Maintenance of prices 46

THE AUSTRALIANSUGAR INDUSTRY
VI
Page
5.4.6 Increasing export returns 465.5 Costs of production controls 46
5.5.1 Limitations on sugar production 475.5.2 Controls limit rationalisation 525.5.3 Restrictions on competition between growers 545.5.4 Limits on land use encourage the
over-use of other inputs 555.5.5 Inefficient response to price signals 555.5.6 Incentives to reduce season length 565.5.7 Cross-subsidisation of transport costs 575.5.8 Inflexible incentives for cane growing
and milling expansion 585.5.9 Conclusion 59
5.6 Proposals for change 595.6.1 Long term objective 595.6.2 Transitional arrangements 61
6 STATUTORY MARKETING OF QUEENSLAND SUGAR 656.1 Introduction 656.2 Domestic marketing 65
6.2.1 Export rebates 666.3 Export marketing 666.4 Payments to mills 676.5 Bulk sugar terminals 69
6.5.1 Ownership and administration 696.5.2 Terminal costs and payments 696.5.3 Transport allowances 70
6.6 The Commission’s assessment 716.6.1 The Corporation’s marketing services package 716.6.2 Other reasons for statutory marketing 766.6.3 Major shortcomings with present marketing arrangements 796.6.4 Summary 81
6.7 Proposals for change 826.7.1 Long term objective 836.7.2 Transitional arrangements 856.7.3 Changes to pooling arrangements and the
ownership of infrastructure 86
CONTENTS VII
Page
7 COMMONWEALTH GOVERNMENT ASSISTANCE 917.1 Tariffs 91
7.1.1 Recent changes in the tariff 917.1.2 Assistance provided by the tariff 92
7.2 Participants’ views 937.2.1 Tariffs 937.2.2 Anti-dumping procedures 95
7.3 The Commission’s assessment 967.3.1 Tariffs 967.3.2 Anti-dumping procedures 104
8 THE NEW SOUTH WALES INDUSTRY 1078.1 Production 1078.2 Harvesting 1088.3 Grower payments and raw sugar returns 1098.4 Refining 1108.5 Adjustment 110
9 INCOME AND PRICE INSTABILITY AND RISK MANAGEMENT 1139.1 Introduction 1139.2 Price variations 1139.3 Production variations 1169.4 Variations in gross returns 1189.5 Mechanisms for achieving stability 119
9.5.1 Revenue 1199.5.2 Other measures 123
9.6 The Commission’s assessment 127
10 VALUE-ADDING 13110.1 Refining 131
10.1.1 Domestic market 13110.1.2 Export refining 135
10.2 Sugar based products 13810.3 Bagasse utilisation 139
10.3.1 Energy generation 14010.3.2 Other uses 142

THE AUSTRALIANSUGAR INDUSTRY
VIII
Page
11 EFFECTS OF POLICY CHANGES 14511.1 Domestic reforms 145
11.1.1 Feasible improvements 14611.1.2 Results of simulations 150
11.2 International reforms 15411.2.1 Other countries’ protection 15411.2.2 Previous studies 15811.2.3 Simulations and results 16011.2.4 Effects of sugar trade reform on Australia 162
11.3 Domestic versus international comparisons 163
APPENDICES
A Participants who made written submissions to the inquiry 167B Sugar policies in major sugar producing nations 169C Key features of the Queensland Sugar Industry Act 1991 183D Payment arrangements for sugar 189E Sugar industry research 197F The environment 205G Modelling the effects of domestic reforms 209H Modelling the effects of international reform 219I The grower -- mill relationship 227
REFERENCES 237

GLOSSARY IX
GLOSSARY
Advances Interim payments made to mill owners before the declaration of a season’s final prices.
Aspartame A high intensity sweetener which is about 180 to 200 times sweeter than sugar. Aspartame is made by NutraSweet, a subsidiary of Monsanto. NutraSweet holds the US patent until 1992 but its patent has expires in Canada and the EC.
Assignment Land on which sugar cane may be grown. It is not illegal to grow sugar cane on unassigned land, but raw sugar produced from such cane is acquiredby the Sugar Corporation at a penal price of $1 per tonne. The mill to which cane grown on the assignment must be supplied is also specified.
Bagasse Bagasse is the plant fibre remaining after sugar has been extracted from cane. It is generally burnt to provide power for the sugar mill.
Billets The common name for the chopped lengths (approximately 300mm) of caneproduced by mechanical cane harvesters during the harvesting operation.
Bulk Terminal A port facility for storage and handling of raw sugar in bulk. The Australian industry converted from transporting raw sugar in bags to bulk through the 1950s and 1960s.
Cane payments A formula based on price of raw sugar, ccs and sugar recovery usedformula by the Queensland industry to allocate net income from sugar salesbetween growers and millers.
Cane sugar Chemical name sucrose. A carbohydrate. Sucrose can also be obtained from sugar beet and is present in fruits and other vegetables.
c&f Cost and freight. When sugar is sold on a c&f basis the seller is responsiblefor arranging and paying for cargo loading and freight to the port of discharge.
cif Cost, insurance and freight. When sugar is sold on a cif basis the seller is responsible for arranging and paying for cargo loading, freight and insurance to the port of discharge.
cow Coefficient of work. A measure of the efficiency of operation of a sugar mill. It represents recovery of raw sugar (tonnes 94 nt.) per 100 tonnes ccs in cane.

THE AUSTRALIANSUGAR INDUSTRY
X
ccs Commercial cane sugar. An estimate of the weight of raw sugar that could be obtained from cane, expressed as a percentage of a tonne of cane.
Continuous Mills crushing cane seven days a week during the crushing season incrushing lieu of five days a week.
Excess cane Cane delivered in excess of farm peak.
Excess sugar Sugar produced by a mill above its peak (see mill peaks).
Farm peak A delivery quota which represents a right to supply cane to a mill to producea given quantity of sugar, for which a 12 per cent higher (Pool 1) price is paid.
fob Free on board. The buyer arranges shipping, pays freight and insurance andtakes immediate responsibility for the sugar once it is loaded on board theship by the seller.
Futures price The price of a particular futures contract. Futures contracts are agreement to buy or sell a fixed amount of a commodity at a fixed price at a fixed date in the future. The futures market may be used for hedging or for speculativepurposes. On the London and New York sugar markets, futures prices are usually quoted up to about 18 months ahead.
GATT General Agreement on Tariffs and Trade.
HFCS High Fructose Corn Syrup. This is the most common name for the starch based fructose/glucose syrups. Corn is the starch base of these syrups. Other suitable, but not widely used, starch sources include rice, wheat and tapioca. In Europe, HFCS is referred to as isoglucose. HFCS is a direct andsignificant competitor with sugar particularly in the USA Canada, Japan andKorea. HFCS is used almost exclusively in industrial applications, particularly in beverages
ldp Landed Duty Paid. The value of imports in the receiving country landed on the wharf and including import duty.
Local award The award made each year by the Local Board is taken by the Sugar Industry Act 1991 to be a contract between the mill owner and each assignment holder in a particular mill area. It covers all matters relating to the harvesting and delivery of cane by the grower, and the transport, payment, handling and crushing of the cane by the mill owner.

GLOSSARY XI
Local board A local board consists of five members appointed for three-year terms by the Governor-in-Council on the recommendation of the Minister. The Minister is to consult with the Queensland Sugar Corporation before recommending the appointment of an independent chairperson. Two cane grower members are nominated by the Mill Suppliers’ Committee concernedand two miller members are nominated by the mill owner. The Board’s powers are set out in the Sugar Industry Act 1991, with its main function being the framing of a Local Board Award each year.
Mill peaks Production quotas specified in tonnes of raw sugar allocated to Queensland mills for which the 12 per cent higher Pool 1 price is paid. It is the sum of farm peaks in that mill area. Raw sugar produced in excess of peak receivesthe lower Pool 2 price. Mill peaks have been effectively frozen since 1982.
New York The price established at the end of a day’s trading on the New YorkNo.11 sugar futures market (New York Coffee, Sugar and Cocoaspot price Exchange). It is the price at which committee representatives
estimate that willing buyers and sellers would trade bulk raw sugarfor prompt shipment. The price is determined on the basis of 96 polfobs.
nt. Net titre. A measure of the commercial value, for refining proposes, of raw sugar. Net titre provides a method for expressing different sugar at a standard value and is used for statistical and payment purposes.
NutraSweet See Aspartame.
pol Polarisation. The sucrose content of sugar. A sugar of 98 degrees pol would contain 98 per cent sucrose.
Ratoon cane Cane is harvested by cutting the plant off at ground level. The stubble remaining puts out new shoots, and grows into what is known as a ratoon crop. One plant is usually allowed to grow two to four ratoon crops. After a final ratoon crop has been harvested the ground is usually ploughed and fallowed (rested) for a year. Legumes are often grown on the fallow ground.
Raw sugar The sugar crystals separated in a centrifuge in a raw sugar mill. Australian raw sugar is usually in two grades either about 98.8 per cent or 97.6 per centpolarisation (pol). Pol is varied to satisfy the requirements of customers.
Raw value A term used internationally to express raw and refined sugar on a common basis (96 pol equivalent). International sugar statistics are expressed in terms of metric tons raw value (mtrv).
Reasonable Markets where there is a record of sales over a number of years andassuredwhere there is every likelihood of continuing sales. It is common for marketscontracts to be written (sometimes more than a year ahead) to supply these markets.
THE AUSTRALIANSUGAR INDUSTRY
XII
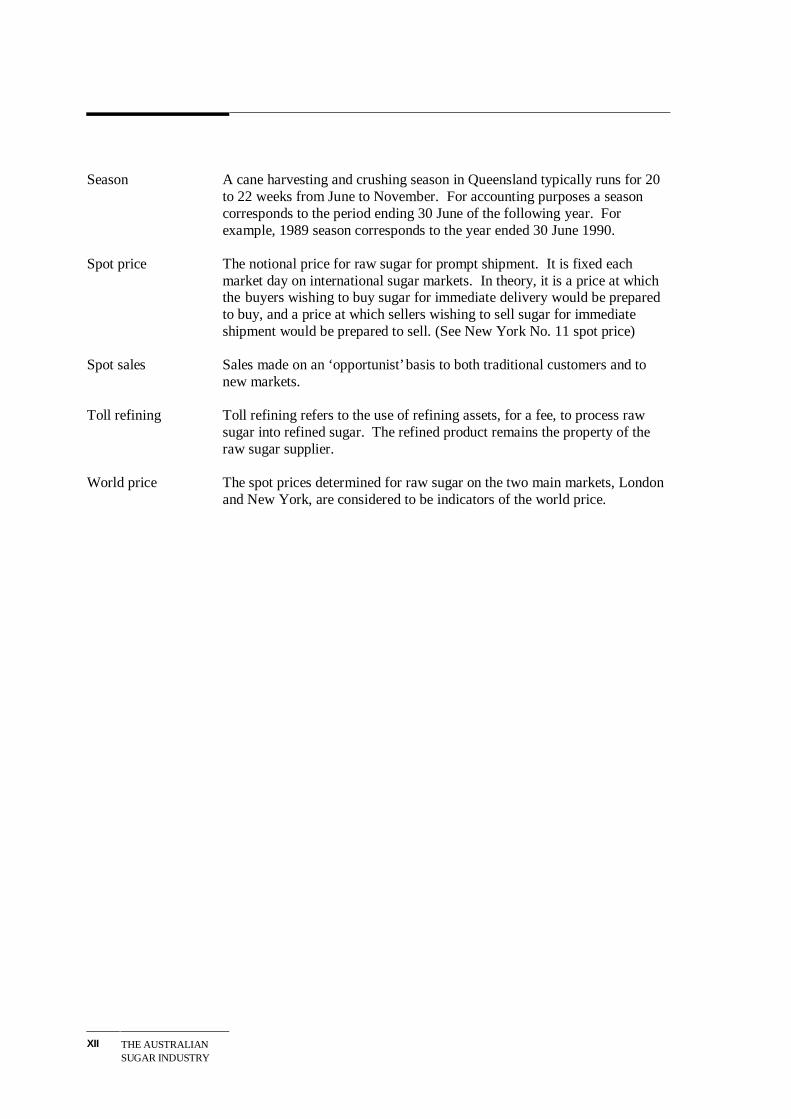
Season A cane harvesting and crushing season in Queensland typically runs for 20 to 22 weeks from June to November. For accounting purposes a season corresponds to the period ending 30 June of the following year. For example, 1989 season corresponds to the year ended 30 June 1990.
Spot price The notional price for raw sugar for prompt shipment. It is fixed each market day on international sugar markets. In theory, it is a price at which the buyers wishing to buy sugar for immediate delivery would be prepared to buy, and a price at which sellers wishing to sell sugar for immediate shipment would be prepared to sell. (See New York No. 11 spot price)
Spot sales Sales made on an ‘opportunist’ basis to both traditional customers and to new markets.
Toll refining Toll refining refers to the use of refining assets, for a fee, to process raw sugar into refined sugar. The refined product remains the property of the raw sugar supplier.
World price The spot prices determined for raw sugar on the two main markets, London and New York, are considered to be indicators of the world price.

GLOSSARY XIII
THE AUSTRALIANSUGAR INDUSTRY
XIV
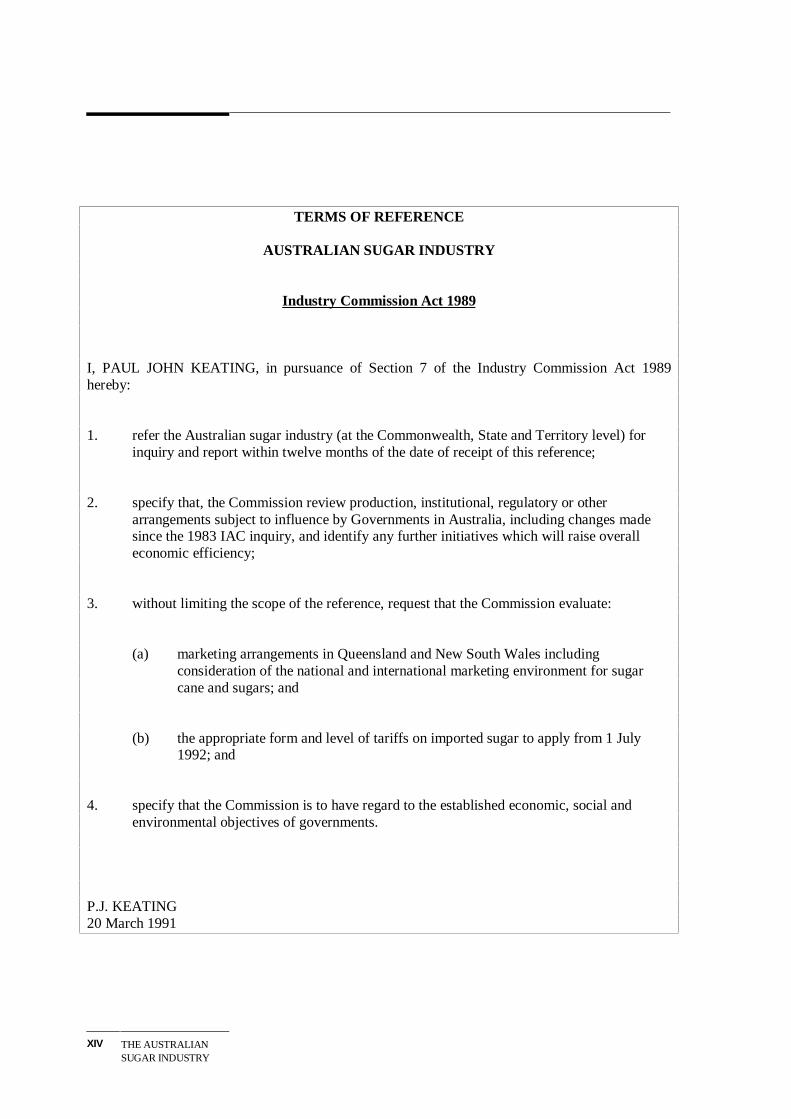
TERMS OF REFERENCE
AUSTRALIAN SUGAR INDUSTRY
Industry Commission Act 1989
I, PAUL JOHN KEATING, in pursuance of Section 7 of the Industry Commission Act 1989hereby:
1. refer the Australian sugar industry (at the Commonwealth, State and Territory level) for inquiry and report within twelve months of the date of receipt of this reference;
2. specify that, the Commission review production, institutional, regulatory or other arrangements subject to influence by Governments in Australia, including changes made since the 1983 IAC inquiry, and identify any further initiatives which will raise overall economic efficiency;
3. without limiting the scope of the reference, request that the Commission evaluate:
(a) marketing arrangements in Queensland and New South Wales including consideration of the national and international marketing environment for sugar cane and sugars; and
(b) the appropriate form and level of tariffs on imported sugar to apply from 1 July 1992; and
4. specify that the Commission is to have regard to the established economic, social and environmental objectives of governments.
P.J. KEATING20 March 1991
OVERVIEW ANDRECOMMENDATIONS
1
1 OVERVIEW AND
RECOMMENDATIONS
The raw sugar industry is one of Australia’s largest export industries. Exports representedapproximately 75 per cent of the industry’s sales of $1.2 billion in 1990-91. Queensland accountsfor around 95 per cent of production and all of Australia’s raw sugar exports. The remainder isproduced in New South Wales.
The industry competes very successfully on world markets, but its growth and performance arebeing impeded by one of the most restrictive regulatory regimes of any Australian industry.Reform of these regulatory controls is the major focus of this report.
The industry’s performance is also influenced by other factors.
Climatic variability is particularly important. As a result of droughts and cyclones, the latestseason has been one of the worst in recent years. However, Australian production takes placealong 2100 km of coastline which is subject to a range of weather systems in any one season. As aconsequence, Australia is better placed in most years to maintain supplies than are competitorswhose industries are more regionally concentrated. There is little that governments in Australiacan do to reduce the incidence of adverse climatic conditions on production levels.
Conditions in international markets are another important determinant of performance. At present,international markets are significantly influenced by protection policies pursued by many majorconsuming and producing countries. However, the Commission’s analysis suggests that the actionsof developed countries in reducing world sugar prices are broadly offset by those of somedeveloping nations. In particular, prices would be depressed if Brazil were to remove barriers thatprevent the export of sugar produced from cane currently being used domestically to manufactureethanol. Consequently, it is not clear whether price levels for sugar in a ‘free’ world market wouldbe higher or lower than those currently existing. Nevertheless, a ‘freer’ world market would benefitAustralia to the extent that it reduces price variability and creates a more open world tradingenvironment.
THE AUSTRALIANSUGAR INDUSTRY
2
It is appropriate that Australian governments engage in negotiations aimed at persuading othergovernments to dismantle trade barriers, but there can be no guarantee that they will influenceoutcomes significantly in Australia’s favour. One factor which is clearly subject to the influence ofgovernments in Australia is the regulatory controls imposed on the Queensland industry. This isthe most significant factor impeding the achievement of higher levels of efficiency. In contrast, thesmaller New South Wales industry operates without State Government legislative backing,although it benefits significantly from the regulations that apply in Queensland.
Why is the Queensland industry so highly regulated?
The answer is largely historical. The regulation has evolved from war-time measures introduced in1915. Domestic sugar prices were fixed and acquisition and marketing powers were established inQueensland. Under the Sugar Acquisition Act, all raw sugar produced in Queensland wascompulsorily acquired by the Queensland Government and sold on its behalf by the Sugar Board,the predecessor of the Queensland Sugar Corporation. Subsequently, a system of land assignmentwas introduced to control the level and location of sugar cane production. Under this system, canecould only be grown on assigned land. Growers were required to deliver cane to designated mills,and mills were required to accept all cane grown on assigned land in their mill area. Most otherfacets of the delivery and pricing arrangements were specified in accompanying regulation.
In retrospect, it is easy to understand why many in the industry supported regulation. Growersfeared the regional economic power of millers and, as the industry expanded, both growers andmillers feared that the industry could be exploited by overseas buyers. Regulations were also seenas a means of reducing risk and stabilising producer incomes, and as a way of maintaining forestablished growers the higher prices attainable from domestic sales.
However, the world is very different today. Producers in most industries now have access toconsiderable market information on which to base production and marketing decisions.Sophisticated financial tools have become available to manage price and income variability.General trade practices legislation now deals with domestic anti-competitive behaviour throughoutthe economy. The chances of overseas sellers exploiting Australian producers have diminished asthe volume of international trade has increased and as market intelligence and information systemshave developed.

OVERVIEW ANDRECOMMENDATIONS
3
The nature of the Australian sugar industry has also changed significantly. With three quarters ormore of its production exported, the sugar industry - in keeping with our economy generally - isnow far more closely integrated with the global economy. With the demise of the InternationalSugar Agreement, there is no longer an externally imposed requirement to restrict sugarproduction.
Despite these developments, the Queensland sugar industry remains highly regulated. In contrast,regulations which constrain the activity of many other rural industries (eg eggs in New SouthWales and wheat nationally) have been relaxed or removed. Regulations applying to a number ofother Queensland industries (eg grains, cotton and peanuts) have also been relaxed or removed.
Some changes were introduced in 1991 with the passing of the new Sugar Industry Act. Thisresulted in all matters relating to the promotion and regulation of the sugar industry in Queenslandbeing encompassed in the one Act. Marketing and some administrative functions were absorbed bythe newly formed Queensland Sugar Corporation. Other changes included provisions to allow forannual increases in the area of assignment and for greater flexibility in the administration of theAct.
Many in the industry appear to consider that the changes introduced in 1991 have effectivelyderegulated the industry. However, although many significant changes have been introduced in the1991 Act, the two mainstays of the regulatory package - the assignment system which controlsproduction and the compulsory acquisition powers which underpin the marketing arrangements -remain.
Some of the costs imposed by regulation could be reduced under the 1991 Act. Indeed, the newAct could be employed as a transitional mechanism to assist the industry to become moreresponsive to market forces. However, to date it has not been implemented in a manner whichallows these benefits to be fully realised. In particular, most new assignment continue to beallocated in very small increments, and transfer of assignment between mill areas, althoughpermitted under the new Act, is in practice possible only in very limited cases.

THE AUSTRALIANSUGAR INDUSTRY
4
How effective is the regulatory package?
The regulations have provided a degree of stability for both growers and millers. Each group hasbeen insulated from competitive pressures from the other. Neither has had to take responsibility formost marketing and some production decisions - matters which in most other industries areconsidered to be best determined by producers themselves. Output has generally increased and theindustry has been able to sell all sugar it produces without the need to provide credit. Compulsoryacquisition has increased returns by permitting domestic prices to be held well above export prices.
However, these benefits have not been without cost to the industry, Queensland and to theAustralian economy in general.
• The size of one of Australia's more internationally competitive industries has beenadministratively constrained. As a result, export opportunities for raw sugar, and possiblyrefined sugar, have been lost. Estimates of the potential for expansion range up to 50 per cent.The failure to make use of this potential represents a significant loss to the nation as a whole.
• New production and exports are discouraged by the application of a fixed 12 per cent paymentdifferential in favour of established growers. This is tantamount to a tax on new growers andindustry expansion. However, the benefits that accrue to established growers from thedifferential are small, representing about a 1 per cent increase in returns.
• Pro rata allocation of increases in assignment has encouraged the use of marginal land at theexpense of land in other areas better suited to cane growing. Around 5 per cent of assignedland has been assessed as marginal or unsuitable for cane-growing.
• The restraints on expansion and the taxing effect on new production of the 12 per centdifferential between Pool 1 and Pool 2 sugar prices have limited the interest and constrainedoffer prices for new irrigation farms associated with the Burdekin River Irrigation project. Atpresent, the Queensland Government recoups only about one-third of land development costs inthe Burdekin area.

OVERVIEW ANDRECOMMENDATIONS
5
• Restrictions on the transfer of assignment have helped perpetuate a scale of cane growingwhich is below that required to realise the available economies of size and to produce at leastcost.
• The regulations have impeded producers from responding to changes in market conditions -such as the harsh conditions recently experienced. Growers and millers are locked intoprescribed practices. Individually they cannot significantly expand or contract production.They cannot market their own sugar - even if it is to their financial advantage to do so. Theycannot use some of the financial instruments employed by other rural producers to manage theirown risk. As a result, innovation has been stifled.
• The lack of competition in the marketing of Australian sugar reduces the discipline on theQueensland Sugar Corporation to seek the highest market returns and to minimise costs.
• Constraints on land use have discouraged growers from pursuing best agronomic practices.They have also encouraged practices which may have adverse environmental consequences (eggreater usage of fertilisers and pesticides per hectare, and reduced fallowing).
• Controls on marketing, coupled with tariff assistance, have increased domestic sugar prices andreduced the competitiveness of user industries. In 1990-91, domestic prices of refined sugarwere estimated to be about 40 per cent higher than export prices. This imposed a cost on userindustries and final consumers of about $100 million in that year.
The output of our economy has been suppressed because the efficiency of the sugar industry hasnot been as great as it could have been, and because higher domestic sugar prices have retarded thegrowth of user industries. Significant employment opportunities have also been foregone. Onestudy estimated that economy-wide employment would increase by at least 3000 if the size of theindustry was not constrained by regulation.
Quantitative analysis undertaken by the Commission could not forecast the extent to which canegrowing would expand if the present controls were removed, or how long any expansion wouldtake. However, it suggested that if the area of land under cane were to expand by 30 per cent(which appears to be well within the available supply of land suitable for cane growing), the value
THE AUSTRALIANSUGAR INDUSTRY
6
of output (and exports) of the Queensland raw sugar industry would increase by around $375million annually. The increase in gross domestic product would be in the order of $200-$400million annually. These increases would result not simply from the expansion of land committed tocane, but also from productivity improvements that could be achieved if the present productioncontrols were lifted.
What changes should be made?
The staged removal of all production and marketing controls specifically targeted at the sugarindustry would benefit both the industry and the Queensland and Australian economies. It wouldrepresent a major departure from the current arrangements. In particular:
• the area and location of cane growing would no longer be administratively constrained;
• delivery terms and conditions would be negotiated between growers and millers having regardto the particular characteristics of each region and the needs of each party;
• millers, and perhaps some growers, would choose how they market their sugar and how theyhandle their exposure to marketing risks;
• the returns from any pooling arrangements undertaken by the Sugar Corporation or any othersugar marketer would reflect actual prices and costs associated with the marketing of raw sugar.It would not be possible to sustain a system of differential payments which are unrelated toactual market returns as presently occurs; and
• competition between multiple sellers of sugar on the domestic market would eliminate thehigher prices paid by domestic users which stem from the compulsory acquisition of all rawsugar produced in Queensland.
The changes would enable growers, millers and marketers to evaluate alternative strategies andenter into those arrangements which best suit their individual needs. Competitive pressures wouldprovide a strong incentive to ensure that production and marketing activities are undertaken asefficiently as possible.
OVERVIEW ANDRECOMMENDATIONS
7
The staged removal of the regulations would not necessarily lead to the abandonment of manycurrent practices. Experience in New South Wales demonstrates that millers and groups of growerscan voluntarily maintain many features of the regulated system. Queensland growers and millerscould, for instance, choose to continue many of the present harvesting and delivery arrangements,particularly in those areas where mills are co-operatively owned. The Sugar Corporation couldremain as a marketer of sugar and continue to perform many of its current functions (eg operate aseasonal pool) in competition with other sellers.
In most respects, the changes proposed would lead to arrangements that already exist in other ruralindustries, particularly those producing perishable products. Consequently, arguments that suchchanges will not work in practice or will cause irreparable damage to the industry are hard tosustain. In particular:
• Cane production and milling capacity would be matched through conditions specified incontracts and the pricing mechanism. As in other rural industries, contracts could providegrowers with security of access to milling capacity, and mills with a guarantee of futurethroughput. They would also provide both mills and growers with security upon which to basefuture investment decisions.
• The mutual dependence between growers and millers would limit the extent to which millerscould use market power to the detriment of growers. Trade practices legislation, the potentialfor growers to negotiate collectively with mills and to seek equity interests in established ornew mills, and the potential for growers in some regions to choose between mills also militateagainst misuse of market power.
• Empirical studies show that additional Australian sugar production would have only a minoreffect on international prices.
• There is no empirical evidence to suggest that Australian sugar can be exported at a pricepremium (considerations of quality and conditions of sale aside) other than into quota protectedmarkets. The removal of the single seller arrangements would not therefore undermine exportreturns. Special arrangements could, and should, be made to ensure that the benefits from salesto quota protected markets are retained.
• Any benefits stemming from the Corporation's marketing services package would be preserved.To the extent that the package allows the Corporation to differentiate its product and achievehigher returns, the Corporation's reputation as a marketer of sugar would be enhanced, as wouldits ability to continue as the major marketer of Queensland sugar.

THE AUSTRALIANSUGAR INDUSTRY
8
The higher price obtained from domestic sales would be largely removed once the single sellerarrangement for Queensland sugar ceased. However, even if the current regulations weremaintained, the maintenance of much of the margin would depend on the continuing provision ofCommonwealth Government assistance.
Should assistance to the industry be retained?
The sugar industry benefits from significant tariff assistance. No other export oriented ruralindustry benefits from such significant Commonwealth assistance.
The Australian sugar industry has proved that it is internationally competitive. Consequently, thecase for assistance for the small and declining proportion of Australian sugar sold on the domesticmarket (currently about 25 per cent) is weak. While all of the output of the New South Walesindustry benefits from the present tariff assistance, it is well located to supply the domestic market.The overall competitive position of the New South Wales industry in the absence of tariffs may notbe significantly different from that of the Queensland industry. On the other hand, the costsimposed on user industries by the tariffs on raw and refined sugar are considerable. These costsalso constitute a barrier to the establishment of new value-adding activities.
The Commonwealth Government is committed to generally reducing assistance to industry.Indeed, most tariffs are being reduced to 5 per cent by 1996. Given these circumstances, theCommission has been unable to identify any factors which would warrant special treatment beingafforded the Australian sugar industry. It recommends that assistance to raw and refined sugar beultimately removed.

OVERVIEW ANDRECOMMENDATIONS
9
Should the changes be introduced immediately?
Deferring change that will allow the industry to be more responsive to market forces will delay theexpected benefits. However, the immediate removal of all production and marketing regulationscould pose some difficulties. It could cause short term uncertainty, and some initial difficulties incoordinating some transport and milling activities if market circumstances change and there werean immediate and large increase in plantings. A problem could also arise in meeting existingcontractual obligations with overseas buyers if a significant proportion of mills were to elect to selldirectly to users rather than through the Corporation.
For these reasons, the Commission recommends that the existing regulations which controlproduction and marketing in Queensland be phased out. Most of the transitional arrangementsrelating to production can be implemented under the provisions of Queensland’s new SugarIndustry Act.
The Commission’s recommendations involve annual increases in assignment of at least 5 per centuntil 1996, after which time all production controls would be removed. Until 1996, 50 per cent ofnew assignment would be allocated to established growers. The remaining 50 per cent would beallocated to new growers. While a number of different mechanisms could be employed to allocateassignment to new growers (eg allocation could be made by using a tender system or, as at present,by local boards), the method used should guarantee that all available new assignment is allocated assoon as possible. All new assignment allocated to both existing and new growers would be freelytransferable between growers, both within and between mill areas.
The Queensland Sugar Corporation would retain the right to compulsorily acquire sufficient sugarto fulfil long-term contracts existing at the time of the commencement of the transition period.Producers would be free to market all remaining sugar as they wished. This would include theoption of continuing to deliver to the Corporation. However, the Corporation would no longer beobliged to purchase all, or even any, raw sugar not compulsorily acquired during the transitionalperiod. Once all existing contractual obligations are satisfied, compulsory acquisition would cease.
In its draft report, the Commission proposed that tariff assistance also be phased out. There is,however, a complication arising from the ending of compulsory acquisition. Once acquisition of

THE AUSTRALIANSUGAR INDUSTRY
10
all raw sugar in Queensland ceases, competition between sellers would reduce returns from rawsugar sold domestically to around export parity, even if tariff assistance were to remain. Thiswould eliminate the cushioning effect that phased tariff reductions would otherwise have provided,and because refiners would continue to benefit from a tariff on refined sugar, it would provide awindfall gain to domestic refiners over the phasing period.
To overcome these difficulties, the Commission recommends that the tariff be removed and a one-off transitional payment be made in lieu of tariff assistance. The payment would be equivalent tothe present value (at the time compulsory acquisition ceases) of the remaining assistance whichwould otherwise be afforded against imports from developing countries if the general rate wasprogressively reduced to Free by 1998. A single payment, rather than a series of payments asassistance is phased down, would reduce administrative costs and provide producers with thebenefits of the transitional assistance sooner. The payment would be made as soon as practicableafter the ending of compulsory acquisition (other than that required to fulfil long term contractsexisting at the time at which the transitional arrangements are introduced) ceased. Until that time,the tariffs on raw and refined sugar would remain, although both would be subject to phasedreductions.
Transitional payments to Queensland and New South Wales would be based on the average annualtonnage of raw sugar sold for domestic consumption by each state in 1989-90, 1990-91 and 1991-92, and a rate of payment per tonne based on the tariff assistance that would otherwise have beenprovided. The payment would initially be made to the Queensland Sugar Corporation and the NewSouth Wales Sugar Milling Co-operative. Payments to mills would be on the basis of assignmentin Queensland and production area entitlements in New South Wales. The payment would bedistributed between millers and growers in each mill area in the same proportion as was revenuefrom all sales of raw sugar produced in the 1989-90, 1990-91 and 1991-92 seasons. Paymentswould be distributed between individual growers within each mill area on the basis of registeredholdings of assignment and production area entitlements as at 6 March 1992.
If compulsory acquisition in Queensland were to cease for raw sugar (other than that required tosatisfy the long term contracts identified above) at the end of June 1993, then, assuming an 8 percent discount rate and a duty-free import price for raw sugar of $A300 per tonne, the transitionalpayment would amount to approximately $47 million. Producers in Queensland and New SouthWales would be entitled to about $37 million and $10 million respectively.
OVERVIEW ANDRECOMMENDATIONS
11
A single payment in the form outlined would have no bearing on producers’ decisions concerningfuture levels of output. Such a payment would therefore be purely a mechanism for supportingproducers’ incomes. The transitional payment would largely remove the incentive which a tariffprovides to maintain compulsory acquisition in order to retain the benefit of higher prices ondomestic sales. It would also allow domestic sugar users earlier access to raw and refined sugar atinternational prices. Provided compulsory acquisition ceases, the transitional payment would be ofsignificantly greater advantage to raw sugar producers than the tariff assistance, proposed in thedraft report, which would have been competed away by multiple suppliers.
Would any grower or miller be worse off?
While producers as a whole would be better off as a result of the removal of the statutoryproduction and marketing controls, some would be worse off. Higher cost growers, who wouldface competitive pressures from existing or new growers, may elect to sell out to more efficientgrowers. While mills may not be subject to the same pressures as growers, some mills would, inthe longer term, stand to lose throughput or face the risk of takeover.
The profitability of sugar production would generally not be diminished (and could be increased)by the removal of the existing controls in Queensland. Thus, land and other assets devoted to sugarproduction should retain their value. About 5 per cent of land currently in production has beenassessed as marginal or unsuitable for cane growing. The value of this land could be reduced. Onthe other hand, unassigned land owned by existing growers and those currently outside the industryshould increase in value if it is suitable for growing cane. Thus, the abolition of assignment wouldnot cause a general reduction in Queensland growers’ asset values.
The return to growers in New South Wales would be reduced by around $3600 annually as a resultof the removal of the compulsory acquisition powers in Queensland. This is because the marginabove export prices currently obtained in the domestic market - the only market supplied by theNew South Wales industry - would be largely removed. As a consequence, the value of sugar landin New South Wales would be lower following implementation of the Commission’srecommendations than it would be if the present policies were retained.
THE AUSTRALIANSUGAR INDUSTRY
12
Under the present Queensland pooling arrangements, producers receive 12 per cent higherpayments for peak entitlements of raw sugar than for sugar in excess of peak. Even if theCorporation were to maintain a seasonal pool, the absence of acquisition powers would make itfinancially impossible for the Corporation to continue to pay higher returns to holders of peak.However, holders of peak entitlements would be only marginally disadvantaged - their returnswould fall by only a little over 1 per cent. In contrast, returns to growers contributing to Pool 2would increase by a little more than 10 per cent.
Producers in Queensland, and more particularly New South Wales, would be disadvantaged by theremoval of compulsory acquisition and the tariff. By the end of the phasing period, domestic priceswould be reduced to broadly similar levels to those achieved for exports. However, as tariffassistance has not been available to other rural producers in export oriented industries, the eventualremoval of assistance would place sugar producers on a similar footing to these other ruralproducers.
Many growers and millers in Queensland and New South Wales would, however, benefit from theCommission’s proposals to separate the operations of the bulk terminals in Queensland from thatState’s payments system. The Commission proposes that the bulk terminals be established as sevenseparate companies and operated on a commercial basis. Equity in the companies, which could bedetermined by an industry committee composed of representatives of major stakeholders, would beheld in the form of freely tradeable shares. Each shareholder would initially have shares in each ofthe companies. Based on the historical cost of terminal assets and the traditional two thirds - onethird division of funds between growers and millers, the value of share entitlements for growerswould be, on average, approximately $25 000. Mills’ entitlements would range in value fromaround $1 million to $5 million.
There would be an incentive for the producers in each region to become major shareholders in thelocal terminal company. This would allow them to influence the way in which the terminal theysupply is operated. Over time, share trading could produce this outcome. In these circumstances,there would be little likelihood that terminal companies would exploit their market power by
OVERVIEW ANDRECOMMENDATIONS
13
charging ‘monopoly’ prices. Nonetheless, to guard against this outcome, and the possibility thataccess would not be provided on a non-discriminatory basis, the operation of the new terminalcompanies could be subject to scrutiny by the Trade Practices Commission and the PricesSurveillance Authority.
Existing growers would also be advantaged if they were to receive all or part of the proceeds fromthe sale of the right to supply quota protected markets. Alternatively, the money could be used tofund projects which benefit the industry generally (eg some research projects).
Adjustment pressures that some producers would face would also be moderated by the transitionalarrangements proposed by the Commission.
The Commission has concluded that any detrimental effects which might arise from removal of thestatutory production and marketing arrangements would be substantially out weighted by the gainsthat would result. The recommended changes would benefit the sugar industry, users and thenation as a whole.

THE AUSTRALIANSUGAR INDUSTRY
14
FINDINGS AND RECOMMENDATIONS
1. The major factor reducing the efficiency of the Australian sugar industry which is subject toinfluence by governments in Australia is the regulatory controls applying to the production andmarketing of raw sugar in Queensland. Any detrimental effect on the Australian industrycaused by the effect of assistance policies in other countries on the international marketingenvironment is of less importance and is not subject to Australian Government control.
2. To raise overall economic efficiency, the Industry Commission recommends that theCommonwealth Government approach the Queensland Government with a view to:
(i) amending the Sugar Industry Act 1991 such that:
-- no raw sugar manufactured in Queensland, other than that required until the end of the 1997 season to satisfy long term contracts as specified in section 2(iii) below, be vested in the Queensland Sugar Corporation; and
-- immediately following the 1995 season, the assignment system be abolished so that no constraints are placed on land that may be used for growing sugar cane or the mill to which cane is delivered, and mills are no longer required to accept sugar cane.
(ii) as soon as possible, modifying the existing arrangements applying to bulk sugar terminals in Queensland such that:
-- bulk sugar terminals are privately owned and operated on a commercial basis;
-- each bulk terminal is incorporated as a separate company;
-- each terminal provides non-discriminatory access to all parties; and
-- equity in each company initially recognises all contributions made to infrastructure by growers and millers. Equity allocations could be determined by a committee composedof representatives of major stakeholders.

FINDINGS ANDRECOMMENDATIONS
15
-- Equity holders be allocated freely tradeable shares in each of the seven companies.
(iii)introducing transitional arrangements to apply from 1993 until implementation of the changes proposed in 2(i) above such that:
-- the total area of assigned land be expanded at a minimum annual rate of 5ÿper cent;
-- 50 per cent of new assignment be allocated to new growers. All new assignment be freely transferable;
-- access to mills and the price paid for cane grown on new assignment be subject to negotiation between growers and mills. The outcome of such negotiations not prejudicethe terms and conditions afforded existing growers;
-- assignment existing prior to the 1993 season be transferable freely within a mill area and not be subject to approval by local boards. Transfer of assignment existing prior to the 1993 season between mill areas be subject only to the successful negotiation of mill access conditions with the receiving mill;
-- compulsory acquisition by the Queensland Sugar Corporation be restricted to only that quantity of raw sugar required to satisfy long term contracts with overseas buyers existing at the time at which the transitional arrangements are introduced. Such sugar be deemed to be acquired from all mills in Queensland in proportion to their raw sugar production; and
-- the Queensland Sugar Corporation's pooling arrangements be modified to remove any differential payments to producers which are unrelated to the actual returns received and the actual costs of marketing such sugar.
3. The Commission recommends that the specific tariffs on imports of raw and refined sugar beterminated, and that a single transitional payment be made to producers of raw sugar in lieu oftariff assistance. The payment would apply to the period from the cessation of compulsoryacquisition (other than that required to fulfil long term contracts existing when the transitionalarrangements are introduced) to 30 June 1998. The transitional payment would be determinedas follows:
-- an eligible tonnage be determined for Queensland and New South Wales on the basis ofeach state's average annual production of raw sugar sold for domestic consumption in 1989-90, 1990-91 and 1991-92;
THE AUSTRALIANSUGAR INDUSTRY
16
-- the rate of payment per tonne be:
-- based upon the assistance which would otherwise have been provided against raw sugar imported from developing countries by a general rate of tariff which progressively reduces from $55 per tonne at 1 July 1992 to Free by 30 June 1998 in accordance with the schedule below;
-- reduced by an amount equivalent to the average proportion that the annual export rebates paid by the Queensland Sugar Board/Corporation was of the assistance available against imports in 1989-90, 1990-91 and 1991-92; and
-- discounted to reflect the present value of tariff assistance that would otherwise havebeen afforded in future years;
-- the payment, which would be based on the eligible tonnage and the rate as determined above, be made in the first instance to the Queensland Sugar Corporation and to the New South Wales Milling Co-operative for distribution to mills and eligible growers as follows:
-- distributed to mills in Queensland and New South Wales according to each mill area’s share of registered assignments and registered production area entitlements asat 6 March 1992;
-- distributed between the mill and growers in each mill area in accordance with their respective shares of revenue from all sales of raw sugar produced in the 1989-90, 1990-91 and 1991-92 seasons; and
-- distributed between individual growers in each mill area in Queensland and New South Wales according to each grower’s share of registered assignments and registered production area entitlements as at 6 March 1992.

FINDINGS ANDRECOMMENDATIONS
17
When compulsory acquisition ceases, all tariff assistance for raw and refined sugar would beremoved. Until compulsory acquisition ceases, tariff assistance to raw and refined sugar wouldcontinue, but would be reduced annually in accordance with the schedule below. Further detailsabout the application of the transitional payment are outlined in Section 7.3.
General tariff rate to apply to imports of raw and refined sugar($ per tonne)
General Year rate1992-93 551993-94 451994-95 351995-96 251996-97 151997-98 51998-99 0
4. The Commission considers that the principal social consequences of implementing itsrecommendations would be an expansion of economic activity in cane growing areas ofQueensland, particularly in the Burdekin, Herbert River, Proserpine and Tully regions.Greater responsibilities would be placed on individual mills and growers, and on groups ofgrowers, to manage their own production and marketing arrangements. The Commissionconsiders that the Rural Adjustment Scheme and the Income Equalisation Deposits Scheme areappropriate government policies to deal with problems encountered by any individualsdisadvantaged by these changes.
5. The Commission considers that the implementation of its recommendations would reduce therates of use of non-land inputs (eg irrigation water, fertilisers and pesticides) relative to the useof land, and this would have some favourable environmental consequences. Although therecould be some environmental implications associated with the expansion of the industry, theCommission has not identified any significant adverse environmental consequences that maybe associated with implementing its recommendations. Environmental issues brought to theattention of the Commission are discussed in Appendix F.

THE AUSTRALIANSUGAR INDUSTRY
18
The Commission draws attention to its comments and suggestions on:
• the allocation of assignment to new growers (Section 5.6.2);
• options for maintaining premiums available from quota protected export markets (Section6.7.1);
• the future role of the Queensland Sugar Corporation (Section 6.7.1);
• the present pooling arrangements (Section 6.7.3);
• the need to review transport allowances (Section 6.7.3);
• anti-dumping arrangements (Section 7.3.2);
• the Queensland Sugar Corporation facilitating producers' ability to use futures markets or otherfinancial instruments to help manage risk (Section 9.6);
• further value-adding activities (Chapter 10); and
• the international marketing environment and its effects on the Australian sugar industry(Section 11.2 and 11.3).

INTRODUCTION 19
2 INTRODUCTION
The Commonwealth Government referred the Australian sugar industry to the Commission forinquiry and report by 20 March 1992. The terms of reference are set out on page xiv.
2.1 Origins of the inquiry
In the May 1988 Economic Statement, the Government announced its intention to replace theimport embargo on sugar and certain sugar products with an ad valorem tariff from 1 July 1989.This was part of a decision to reduce industry protection across-the-board. In addition, theadministered domestic price for raw and refined sugar was to be abolished. In December 1988, theMinister foreshadowed that there would be an inquiry by the Commission into the long termassistance arrangements to apply from 1992. Prior to implementation, the tariff proposal wasreviewed and, in May 1989, the Minister for Primary Industries and Energy announced a specificrate tariff structure to apply to both raw and refined sugar imports after the removal of the importembargo.
The Government’s Statements of 12 March 1991 announced reductions in tariffs on agriculturalproducts, including sugar, in line with reductions in tariff protection for all industries.1 TheGovernment also announced that the Commission had been asked to inquire and report on the sugarindustry, including the appropriate form and level of tariffs on imported sugar to apply from 1 July1992.
2.2 Scope of the inquiry
The inquiry covers all aspects of the Australian sugar industry including the growing of sugar cane,the production and marketing of raw sugar, and the production and marketing of refined sugar andsugar products.
The inquiry is primarily concerned with the effects of institutional, regulatory and otherarrangements subject to the influence of governments in Australia on the efficiency of the sugarindustry, on industries which use sugar, and on the economy generally. In addressing thesematters, the Commission has focused on industry-specific factors and on those general economicfactors which bear particularly strongly on the sugar industry.
The Commission was also asked to consider the national and international marketing environmentfor sugar cane and sugars. Of particular importance are the sugar industry policies of major
1 Building a Competitive Australia, 12 March 1991, Statements by: the Prime Minister, Bob Hawke; theTreasurer, Paul Keating; the Minister for Industry Technology and Commerce, John Button; AGPS.

THE AUSTRALIANSUGAR INDUSTRY
20
consuming countries such as the EC, the USA and Japan and other major producers, notably Brazil.In keeping with the Commission’s policy guidelines, options for change have been developedhaving regard to their implications for the economy as a whole rather than simply from theperspective of the sugar industry. The policy guidelines require the Commission to have regard tothe desire of the Commonwealth Government to: encourage the development of efficientindustries; facilitate structural adjustment; reduce unnecessary industry regulation; and recognisethe interests of other industries and consumers generally. The Commission is also required toreport on the social and environmental consequences of any recommendations it makes.
2.3 Inquiry procedures
Shortly after receiving the reference, the Commission held preliminary discussions withrepresentatives of growers, millers and sugar users. An issues paper to assist participants in thepreparation of submissions to the inquiry was subsequently released in April 1991. Furtherindustry visits in Queensland and northern New South Wales were undertaken in late June 1991.
Written submissions were received and an initial public hearing was conducted in Brisbane on 27and 28 June 1991. On 17 September 1991, the Commission held a one-day modelling workshop toexplore the scope for productivity improvements through reform of the institutional frameworkapplying to the Australian sugar industry. The workshop also looked at measuring the effects onAustralia of liberalising world sugar trade, and at the Commission’s approach to the measurementof assistance.
On the basis of information and comment presented at the public hearing and in writtensubmissions, a draft report was prepared and released on 16 October 1991. The Commission calledfor submissions on the content of the draft report and on the draft findings and recommendations.
A second public hearing to discuss the matters raised in the draft report was conducted on 26 and27 November 1991 in Brisbane. Further visits were made in Queensland following the secondpublic hearing to discuss the content of the draft report. A list of those appearing at both rounds ofhearings, along with other written submissions received, is included as Appendix A.
2.4 Structure of the report
Chapter 3 provides a brief description of the Australian sugar industry and its markets. This isfollowed by an outline of how the regulatory framework of the industry has evolved, includingchanges made since the 1983 Industries Assistance Commission (IAC) inquiry. Chapters 5 and 6

INTRODUCTION 21
examine production controls and statutory marketing arrangements respectively, in Queensland.These chapters review the major production, institutional, regulatory and other arrangementssubject to influence by governments in Australia, and identify further initiatives which will raiseoverall economic efficiency. Chapter 7 focuses on domestic market protection and the levels ofassistance available to the Australian sugar industry. It includes the Commission’s assessment ofthe appropriate form and level of tariffs to apply from 1 July 1992. Chapter 8 describes the NewSouth Wales industry. Chapter 9 explores income and price instability and risk managementissues. Chapter 10 looks at factors which influence the development of further value-addingactivities based on the sugar industry in Australia. Chapter 11 presents estimates of the effects ofoverseas sugar industry policies on the international marketing environment, and of the effects ofpotential changes within the Australian industry.

INDUSTRYSTRUCTURE
23
3 INDUSTRY STRUCTURE
In recent years sugar cane production has contributed between 4 and 8 per cent of the gross valueof Australian rural output. In 1990-91, raw sugar contributed about 1.7 per cent of the value of allAustralian exports.1 The sugar industry consists of three major sectors: cane growing, milling andrefining.
3.1 Cane growing
Sugar cane is grown along 2100 kilometres of north eastern coast between Mossman inQueensland and Grafton in New South Wales. Most farms are within 50 kilometres of the coast.About 95 per cent of sugar cane is grown in Queensland and the remainder in northern New SouthWales. However, there is potential for sugar cane to be grown in other parts of Australia. Forexample, there are proposals to develop a sugar industry in the Ord River irrigation area in theKimberley region of Western Australia.
The total area of land devoted to cane growing in Australia in 1990 was approximately 403 000hectares, comprising 372 000 in Queensland and 31 000 in New South Wales. Approximately 117thousand hectares are irrigated.2
Most Australian sugar cane is grown on highly mechanised farms, owned and operated by farmersthemselves. In 1991, sugar cane was grown on about 6500 farms in Queensland and New SouthWales. Most cane farms in Queensland grow between 30 and 90 hectares of cane, with the averagearea being some 65 hectares (see Table 3.1).
Table 3.1: Distribution of area of assignment per farm unit by region in Queensland(per cent)
0 to 30 30 to 60 60 to 90 greater thanRegion ha ha ha 90 ha
North 10.5 45.4 22.5 21.7Burdekin 14.3 43.8 19.1 22.9Central 5.0 39.6 29.3 26.1South 18.8 51.0 15.9 14.3
Queensland 11.6 45.0 22.3 21.2
Source: Queensland Department of Primary Industries, Report of the Sugar Industry Working Party, 5 June 1990, Appendix 12.
1 Derived from Australian Bureau of Statistics, Foreign Trade Statistics, Microfiche Table MX04C, June1991.2 Canegrowers, Cane Growers’ Information Handbook, Brisbane 1991, pp. 8-9.

THE AUSTRALIANSUGAR INDUSTRY
24
A hectare of land yields, on average, about 84 tonnes of cane, from which about 11 tonnes of rawsugar are produced. However, there is considerable yield variation between seasons and regionsdepending, among other things, on weather conditions and the extent of irrigation.
Sugar cane normally grows for 12 to 16 months before being harvested. However, in the coolerdistricts of northern New South Wales and southern Queensland, a major proportion of the crop isallowed to grow for 18 to 24 months. The cane is usually harvested between June and Decemberwhen the sugar content of cane is high.
After the cane is harvested, the stubble remaining puts out new shoots and grows into what isknown as a ratoon crop. One planting is usually allowed to grow two ratoon crops but, in someareas, as many as four are grown before being ploughed out and replanted. Land is usuallyfallowed for one year before the replanting of a new cane crop.
Burning of cane prior to harvesting remains the norm in the southern regions. However, green caneharvesting is becoming common, particularly in the far north of Queensland. Because cane farmsin Australia are small, most growers have their cane cut by contractors. However, in some cases,individual growers own machines and harvest their own cane. Once cut into billets, sugar cane isperishable and must be processed within a short period (normally about 16 hours) beforedeterioration commences.
3.2 Sugar milling
3.2.1 Background
The growing and milling sectors are closely interdependent due to the perishability of cane andtransport costs. Cane is delivered to mills, located in the cane growing areas, by a rail and/or roadtransport system designed to ensure that delays between harvesting and crushing are kept to aminimum. The milling process involves crushing cane to extract the raw sugar. Queensland sugarmills own, operate and maintain about 3900 kilometres of narrow gauge tramways. In New SouthWales, deliveries are by road.
There are 28 raw sugar mills in Australia, 25 of which are located in Queensland and three in NewSouth Wales. The number of mills has declined in recent years, with five mills closing in the lastfive years. The Hambledon mill near Cairns closed at the end of the 1991 season.3 Seven mills areowned by CSR Ltd (CSR), six by Bundaberg Sugar and four by the Mackay Co-operative, allwithin Queensland. Six of the eight remaining mills in Queensland are owned by local growers,
3 The other four mills already closed are Goondi, North Eton, Qunaba and Cattle Creek.
INDUSTRYSTRUCTURE
25
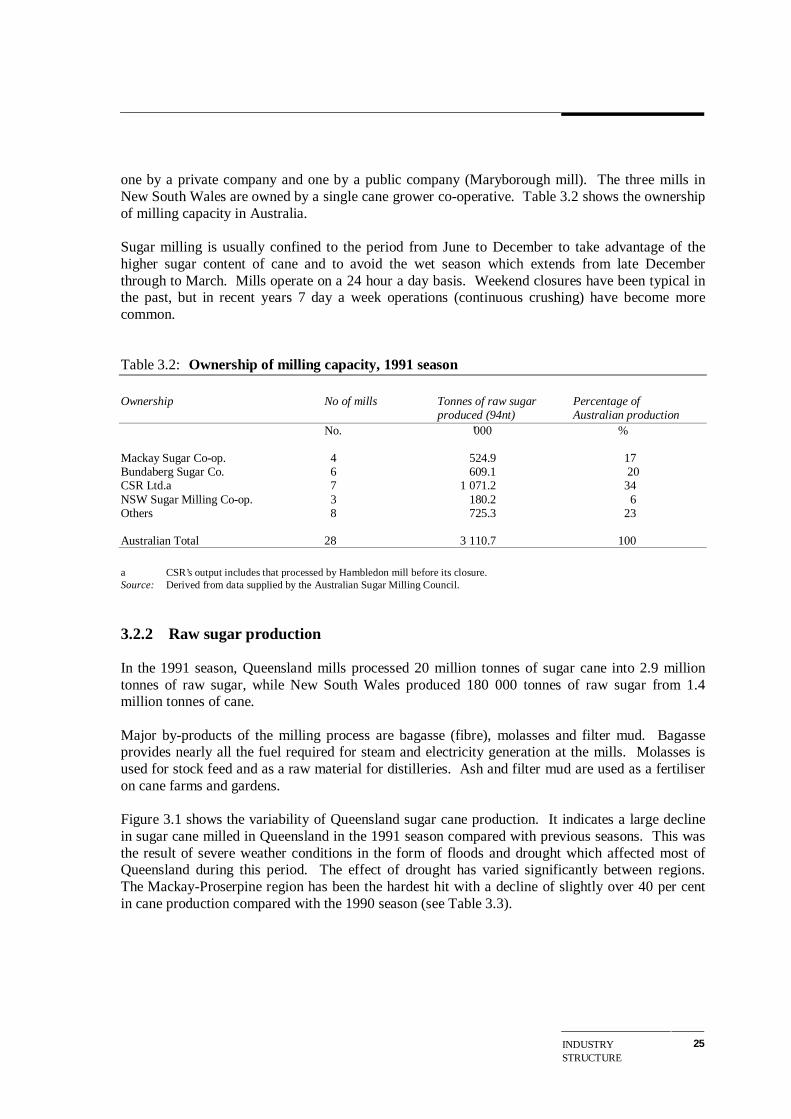
one by a private company and one by a public company (Maryborough mill). The three mills inNew South Wales are owned by a single cane grower co-operative. Table 3.2 shows the ownershipof milling capacity in Australia.
Sugar milling is usually confined to the period from June to December to take advantage of thehigher sugar content of cane and to avoid the wet season which extends from late Decemberthrough to March. Mills operate on a 24 hour a day basis. Weekend closures have been typical inthe past, but in recent years 7 day a week operations (continuous crushing) have become morecommon.
Table 3.2: Ownership of milling capacity, 1991 season
Ownership No of mills Tonnes of raw sugar Percentage ofproduced (94nt) Australian production
No. ’000 %
Mackay Sugar Co-op. 4 524.9 17Bundaberg Sugar Co. 6 609.1 20CSR Ltd.a 7 1 071.2 34NSW Sugar Milling Co-op. 3 180.2 6Others 8 725.3 23
Australian Total 28 3 110.7 100
a CSR’s output includes that processed by Hambledon mill before its closure.Source: Derived from data supplied by the Australian Sugar Milling Council.
3.2.2 Raw sugar production
In the 1991 season, Queensland mills processed 20 million tonnes of sugar cane into 2.9 milliontonnes of raw sugar, while New South Wales produced 180 000 tonnes of raw sugar from 1.4million tonnes of cane.
Major by-products of the milling process are bagasse (fibre), molasses and filter mud. Bagasseprovides nearly all the fuel required for steam and electricity generation at the mills. Molasses isused for stock feed and as a raw material for distilleries. Ash and filter mud are used as a fertiliseron cane farms and gardens.
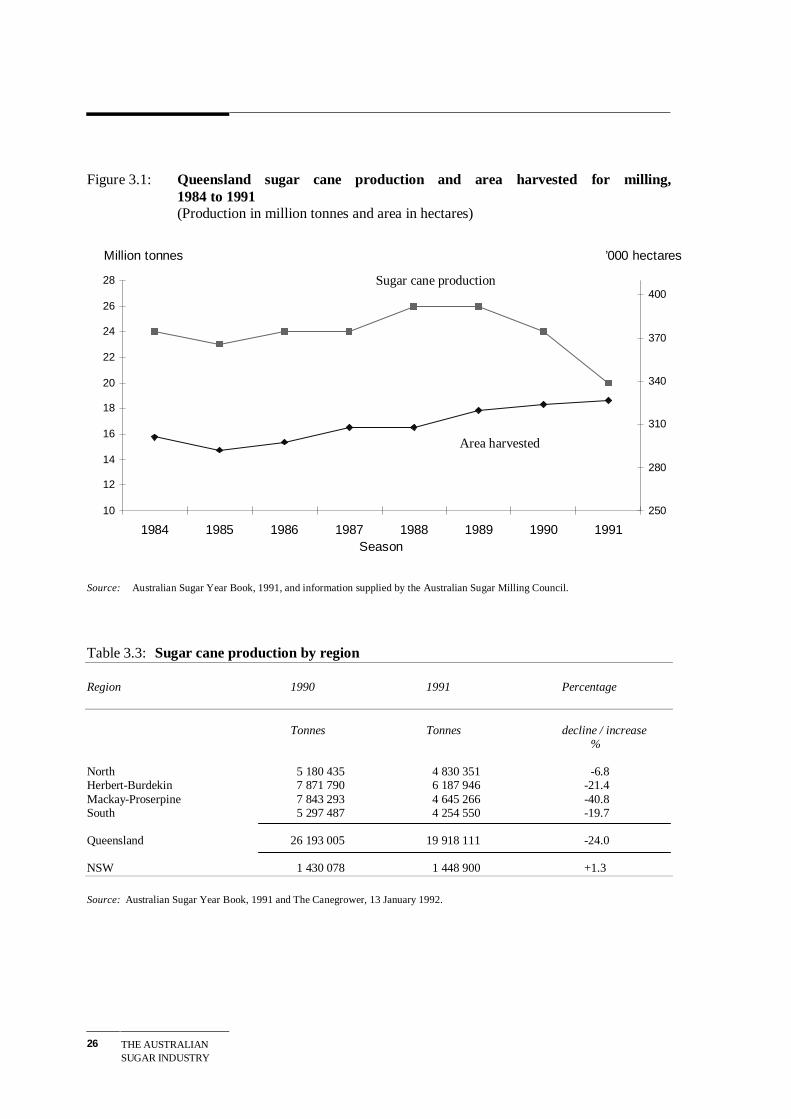
Figure 3.1 shows the variability of Queensland sugar cane production. It indicates a large declinein sugar cane milled in Queensland in the 1991 season compared with previous seasons. This wasthe result of severe weather conditions in the form of floods and drought which affected most ofQueensland during this period. The effect of drought has varied significantly between regions.The Mackay-Proserpine region has been the hardest hit with a decline of slightly over 40 per centin cane production compared with the 1990 season (see Table 3.3).
THE AUSTRALIANSUGAR INDUSTRY
26
Figure 3.1: Queensland sugar cane production and area harvested for milling,1984 to 1991(Production in million tonnes and area in hectares)
Source: Australian Sugar Year Book, 1991, and information supplied by the Australian Sugar Milling Council.
Table 3.3: Sugar cane production by region
Region 1990 1991 Percentage
Tonnes Tonnes decline / increase %
North 5 180 435 4 830 351 -6.8Herbert-Burdekin 7 871 790 6 187 946 -21.4Mackay-Proserpine 7 843 293 4 645 266 -40.8South 5 297 487 4 254 550 -19.7
Queensland 26 193 005 19 918 111 -24.0
NSW 1 430 078 1 448 900 +1.3
Source: Australian Sugar Year Book, 1991 and The Canegrower, 13 January 1992.
10
12
14
16
18
20
22
24
26
28
1984 1985 1986 1987 1988 1989 1990 1991Season
Million tonnes
250
280
310
340
370
400
’000 hectares
Sugar cane production
Area harvested

INDUSTRYSTRUCTURE
27
The 1991 harvesting season was shortened as a result of the drought. In some areas it was less than12 weeks, compared with the usual crushing season of around 21 to 22 weeks. However, becauseof the short season the sugar content of cane was 1.5 to 2 units of ccs above that of the 1990season, and if good rain falls.
3.3 Sugar refining
Raw sugar is an intermediate product which requires further refining before it can be used in themanufacture of food and beverage products or as a final consumption food product. Refineriesprocess raw sugar into white (refined) sugar and liquid sugar products. Other speciality products,such as golden syrup, treacle, coffee sugar and cube sugar are produced as part of the refiningprocess.
For many years around 95 per cent of domestic demand for refined sugar was supplied by CSR.However, in 1989, the New South Wales industry established, in a joint venture with the ManildraGroup of Companies, a refinery at Harwood (near Grafton). This has captured around 25 per centof the domestic market, reducing CSR’s share to about 69 per cent. The Millaquin Sugar CompanyPty Ltd at Bundaberg supplies around 5 per cent. Imports of refined sugar represent about one percent of the market.
The refining sector is considered in some detail in Chapter 10.
3.4 Employment
In addition to the 6500 canegrowers in both New South Wales and Queensland and their workingfamily members, approximately 900 persons are employed full-time on cane farms. Some 4000persons are employed for periods of up to six weeks each year to undertake seasonal tasks such asland preparation and planting. Also, during the harvesting season, usually about 21 to 22 weeks inthe second half of the year, 4000 persons are employed in contract harvesting, some of whom arealso engaged in plant maintenance in the off-season.
During the crushing season, mills employ up to 6000 people. This falls by about 20 per cent duringthe off-season (January to June) when most of the upgrading, servicing and maintenance of millplant, equipment and tramways is carried out.4
As sugar production is the principle activity in most sugar producing regions, employment in localgoods and service industries also depends on activity in the sugar industry.
4 Canegrowers, Cane Growers’ Information Handbook, Brisbane 1991, p. 19.
THE AUSTRALIANSUGAR INDUSTRY
28
Compared with most other agricultural industries, labour costs in cane growing are high relative tototal costs. Based on 1986-87 ABS input-output data, labour costs for the sugar industry are 46 percent of total costs, while for other rural industries, labour costs range from 31 to 41 per cent of totalcosts.
3.5 The domestic market
In 1990-91, almost 25 per cent of Australia’s raw sugar production was sold domestically torefiners, with the remainder being exported. Because of the poor seasons in 1990 and 1991, theshare of production sold to the domestic market increased. In earlier years, the domestic marketwas typically closer to 20 per cent of domestic production.
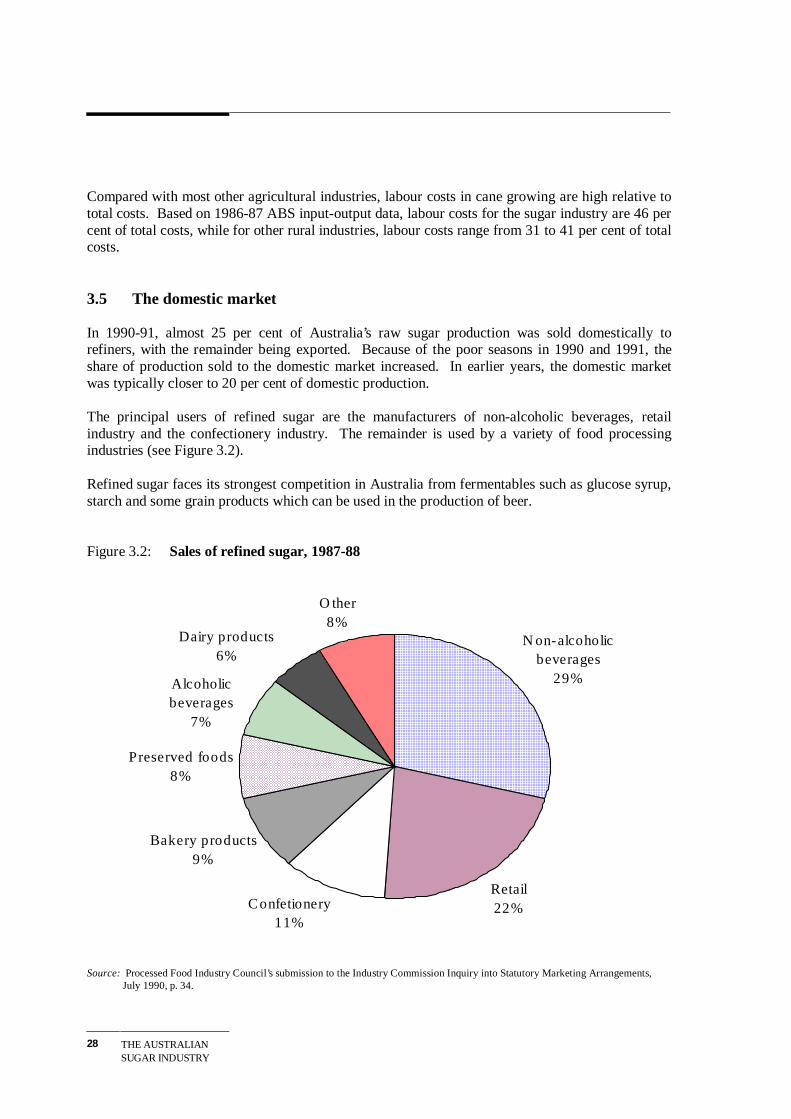
The principal users of refined sugar are the manufacturers of non-alcoholic beverages, retailindustry and the confectionery industry. The remainder is used by a variety of food processingindustries (see Figure 3.2).
Refined sugar faces its strongest competition in Australia from fermentables such as glucose syrup,starch and some grain products which can be used in the production of beer.
Figure 3.2: Sales of refined sugar, 1987-88
Source: Processed Food Industry Council’s submission to the Industry Commission Inquiry into Statutory Marketing Arrangements, July 1990, p. 34.
N on-alcoholic beverages
29%
Retail22%C onfetionery
11%
Bakery products9%
Preserved foods8%
Alcoholic beverages
7%
Dairy products6%
O ther8%
INDUSTRYSTRUCTURE
29
Refined sugar has faced only limited competition on the domestic market as a sweetener. In 1990,alternative sweeteners accounted for 17 per cent of the total sweetener market in Australia,compared with 14 per cent in 1987.5 This is a lower percentage than in the USA, the EC andJapan, where high sugar prices have resulted in considerable loss of market share to alternativesweeteners. The use of artificial sweeteners in Australia is strongly influenced by food regulationsas well as price. The patent on aspartame, one of the major artificial sweeteners, ends in April1993 and many in the industry expect a significant fall in the price to result.
Prior to the lifting of the import embargo, domestic refined sugar prices were set by formula. Thisresulted in domestic prices being more stable than those in the world market. Since the abolition ofthe embargo, domestic prices for both raw and refined sugar have been determined by internationalprices and the tariff. The Queensland Sugar Corporation, which dominates the domestic marketwith 75 per cent of sales, generally aims to sell raw sugar to refiners at prices equivalent to importparity (including the tariff). CSR sells refined sugar on the domestic market on a similar basis.The other refiners tend to follow the pricing structure set by CSR.
3.6 Export markets
All raw sugar exported by Australia is produced in Queensland. In 1990-91, Queensland exported80 per cent of the volume of its raw sugar output - a total of some 2.6 million tonnes. Figure 3.3shows the export destinations of Queensland’s raw sugar.
Most exported sugar is sold in bulk as raw sugar on a cost, insurance and freight (cif) or cost andfreight (c&f) basis. There are seven bulk sugar terminals in Queensland designed to receive, storeand load raw sugar for both the domestic and export markets. CSR is contracted by the SugarCorporation to act as the sole marketing agent in relation to all exports of Queensland sugar, exceptthose to New Zealand. CSR carries out this function within guidelines established in consultationwith the Sugar Corporation.
Although Australia produces only 3 to 3.5 per cent of the world sugar output, it is the third largestexporter (with 10 per cent of world trade), after Cuba (24 per cent) and the EC (20 per cent). Theshare of refined sugar in world trade has increased from 25 per cent of total sugar trade in the early1970s to 40 per cent by the late 1980s.
Only small quantities of refined sugar are exported by Australia, amounting to up to 30 000 tonnesa year.
5 Derived from Landell Mills Commodities Studies, Alternative Sweeteners and Bulking Agents -Opportunities and Challenges into the 1990s, 1989, Table AUS. 18.

THE AUSTRALIANSUGAR INDUSTRY
30
Figure 3.3: Exports of raw sugar by destination, 1990-1991
Source: The Sugar Board, Annual Report, 1990-91.
The world sugar market experiences extreme price variability. During the 1980s, the world ‘spot’price varied from a low of US 2.8 cents per pound (raw value) in 1985 to a high of US 25 cents in1980. For most of 1991, prices have been around US 9 cents per pound. Movements in the world‘spot’ sugar price are shown in Figure 3.4. However as, first, a significant proportion of Australianexports are sold under long term contracts and, second, the Sugar Corporation engages in hedgingoperations, the returns received by Australian producers are less variable than observed ‘spot’prices.
The international market is distorted by the protection of domestic producers by some of the majorsugar producing and consuming countries, notably the EC, Japan and the USA. These countries'policies reduce the world price and increase its variability. However, the policies of some othercountries serve to increase the world price. For example Brazil, the fourth largest sugar producer,directs some two-thirds of its cane to the production of ethanol. This reduces the volume of sugartraded internationally and tends to increase world prices. Action by other countries which distortworld sugar trade include guaranteed minimum price schemes, import restrictions, import leviesand export subsidies (see Appendix B).
Malaysia19%
Korea13%
China7%
Japan20%
Canada15%
NZ3%
USSR11%
Singapore6%
USA6%
INDUSTRYSTRUCTURE
31
Figure 3.4: Annual average world sugar prices (New York spot) and annual average Australian export returnsA$ per tonne (1989-90 dollars)
Source: Derived from data supplied by ABARE and the Queensland Sugar Corporation.
0
200
400
600
800
1000
1200
1400
1600
1800
1970-71 1975-76 1980-81 1985-86 1990-91
Year
A$/t
Average world price
Average Australian export returns

BACKGROUND TOTHE PRESENTINSTITUTIONAL
33
4 BACKGROUND TO THE PRESENT
INSTITUTIONAL AND REGULATORY
FRAMEWORK
The Queensland sugar industry dominates production in Australia, supplying about 95 per cent ofAustralia’s raw sugar output. The sugar industry in that State has been subject to extensiveregulation by the Queensland Government since the early years of this century. Although there hasbeen considerable change, the essential features of the initial regulations have been retained. Incontrast, the activities of the smaller New South Wales industry are virtually devoid of regulationbut, until recently, its operation has been closely tied to the Queensland system. CommonwealthGovernment involvement has mainly been through barriers to imports and through past agreementsrelating to domestic sugar prices.
This chapter sketches the background to the regulations which currently apply. A more detailedreview of the marketing and production regime operating in Queensland is outlined in laterchapters.
4.1 The Queensland industry
4.1.1 Historical background
In Queensland, regulations govern almost every aspect of cane growing, milling and the marketingof raw sugar. The regulations control the land on which cane can be grown, specify the mill towhich cane must be delivered, and provide the framework for determining the distribution ofrevenue between millers and growers. Compulsory acquisition powers centralise control of rawsugar marketing, including payments to mills for sugar sold.
The basis of most existing controls evolved over the period 1901 to 1939, largely supported byCommonwealth Government protection of the industry. At the time of federation, Australia was anet importer of sugar. Import protection was granted in 1901 as a condition of Queensland joiningthe Commonwealth.
Protective arrangements were changed and regulation increased in 1915 as a war-time measure. Atthat time, domestic sugar prices were fixed and, under the Sugar Acquisition Act of 1915,monopoly acquisition and marketing powers were established in Queensland. The fixing of sugarprices led to the fixing of cane prices to resolve the debate about growers’ and millers’ shares ofrevenues from sugar sales. With cane prices fixed, it was also necessary to fix the terms ofdelivery. Cane assignments were introduced to enforce the rights and obligations of growers and
THE AUSTRALIANSUGAR INDUSTRY
34
millers. Under the assignment system, cane could only be grown on assigned land and growerswere required to deliver to a specified mill. Mills were obliged to accept all cane grown on landassigned to that mill.
By 1923, Australia had become an exporter of raw sugar. From then on, formalCommonwealth/Queensland Sugar Agreements were negotiated at five year intervals. Under theseAgreements, the Queensland Government, through the Sugar Board, acquired all raw sugarproduced in Queensland and agreed to purchase all raw sugar produced in New South Wales. TheBoard also agreed to make sugar available for domestic use at an administered price. In return, theCommonwealth Government agreed to underpin the domestic price by placing an embargo onimports of sugar, golden syrup and treacle. The pricing arrangement continued until 1970, when aformula to establish annual adjustments to domestic sugar prices was introduced to replaceirregular adjustments emanating from joint Commonwealth and Queensland Governmentnegotiations.
Further attempts to control production were instigated when exports assumed increasedsignificance. In most years, sugar exported attracted lower returns than that sold on the protecteddomestic market. Consequently, exports lowered average returns to the industry. A two poolpricing system incorporating mill peaks (which were effectively entitlements to the higher returnsattained from domestic sales and reasonably assured export markets) was introduced to protect thereturns of established growing and milling interests. However, not until Australia acceded to thefirst International Sugar Agreement (ISA) in 1937 were strict production controls introduced.These controls were required to restrict exports to volumes specified under the ISA. Productionwas controlled by setting a low ‘penalty’ price for sugar produced from cane grown on unassignedland. The ISA effectively lapsed in 1984 when the signatories failed to negotiate a new agreement.
4.1.2 Major changes between 1983 and 1990
There were a number of government initiated reviews of the Australian sugar industry followingthe Industries Assistance Commission’s review in 1983. These were:
• 1985 - Sugar Industry Working Party Report;
• 1989 - Report by the Senate Standing Committee on Industry Science and Technology; and
• 1989 - Pooling System Report of the Committee of Inquiry into the Queensland Sugar Industry.
As a result of these reviews and inquiries there have been several changes to the regulation of theindustry. The major changes are outlined below.
BACKGROUND TOTHE PRESENTINSTITUTIONAL
35
• In 1985, a joint Commonwealth/Queensland price support scheme commenced. It providedsupport for up-to-peak returns whereby returns would be guaranteed at $230 per tonne in the1985 season, $225 in the 1986 season and $220 in the 1987 season. No assistance wasprovided for the 1986 and 1987 seasons as average up-to-peak returns exceeded the guaranteedprice.
• In 1986, amendments were made to the Regulations of Sugar Cane Prices Act in Queenslandwhich increased growers flexibility in their use of assigned land.
• In 1987, agreement was reached on a joint Commonwealth/State adjustment package to operatefor three years to 30 June 1989. Total funding of $100 million was made available for grants,loans and interest rate subsidies for millers and growers.1
• In 1988, the Commonwealth Government announced that from 1 July 1989 the embargo onsugar imports would be replaced by an ad valorem tariff. Following the Senate Report of 1989a specific rate tariff was introduced.
• In 1989, the Queensland Government introduced changes to the pooling arrangements for sugarrevenue. While maintaining two pools, the new arrangements provided for No 1 Pool returns(mill peak sugar) to be a constant 12 per cent higher than No 2 Pool returns (excess sugar) -irrespective of the price paid for that sugar in the marketplace.
4.1.3 The 1991 Queensland Sugar Industry Act
In 1991, following the report by the 1990 Sugar Industry Working Party (1990), the QueenslandGovernment introduced a major reorganisation of the legislation and associated administrativearrangements regulating the sugar industry in that State. This reorganisation was embodied in theSugar Industry Act 1991.
A new organisation, the Queensland Sugar Corporation, was formed to develop and implementpolicy relating to the management of the Queensland industry. The new Corporation encompassesthe functions of the Sugar Board, which had been responsible for the marketing of raw sugarproduced in Queensland, and most of the functions of the Central Sugar Cane Prices Board whichhad been responsible for the regulation of the production of sugar cane in Queensland. Appendix Cprovides a summary of key elements of the new legislation.
The new legislation disposed with much of the detailed specification of aspects of cane growingand sale to mills which characterised the old Acts. In its place, the new Corporation, and localboards which administer each mill area, have been provided with greater discretionary powers.The regulatory changes provide the potential for greater flexibility in the land assignment system
1 As interest subsidies were to apply for up to seven years, there is still some commitment under the scheme.This amounted to $0.53 million in 1989-90 and $0.34 million in 1990-91.

THE AUSTRALIANSUGAR INDUSTRY
36
and for annual increases in the total area of assigned land over the period 1991 to 1996. However,the core elements of the pre-existing legislation remain, notably the assignment system regulatingthe land on which cane can be grown and the mill to which cane can be delivered, and thecompulsory acquisition of all raw sugar. Indeed, the Sugar Industry Act 1991 encompassesprovisions which, depending on how the discretionary powers provided to the Corporation andlocal boards are exercised, could result in the Queensland sugar industry continuing to be one ofthe most highly regulated industries in Australia. These provisions, and their effects on theindustry and other sectors of the economy, are discussed in some detail in Chapters 5 and 6 of thisreport.
4.2 The New South Wales industry
Although not bound by Queensland legislation, the New South Wales industry for many yearsvoluntarily replicated the practices imposed by regulation on the Queensland industry. Output wasconstrained in a similar manner to that in Queensland. Sugar produced in New South Wales wassold by the Sugar Board on behalf of the New South Wales industry, and revenues and associatedcosts were pooled with those of the Queensland industry.
In 1989, following the lapsing of the Commonwealth/Queensland Sugar Agreement, the NewSouth Wales industry withdrew from its association with the Queensland industry. The growersco-operative assumed responsibility for production and marketing of sugar produced in the Stateand, in conjunction with the Manildra group of companies, established a joint venture refinery innorthern New South Wales.
While the New South Wales industry continues to be relatively free of government regulation, theorganisation of the industry by the grower co-operative mirrors many of the production andharvesting controls which operated prior to 1989, and the industry’s marketing strategies andreturns (entirely from domestic sales) depend heavily on policies adopted by the much largerQueensland sugar industry. The operations of the New South Wales industry are outlined morefully in Chapter 8.

PRODUCTIONCONTROLS INQUEENSLAND
37
5 PRODUCTION CONTROLS IN QUEENSLAND
Sugar production in Queensland continues to be subject to extensive regulation under the SugarIndustry Act 1991. This regulation is administered by the Queensland Sugar Corporation at thestate level, and by 25 Local Boards operating at the mill area level. The key features of theregulation are the control of the area of land under cane through the land assignment system, andregulation of the relationship between growers and millers.
5.1 Land assignment
The land assignment system is the principle means of controlling the level and location of sugarproduction in Queensland. Growers possess an assignment, specified in hectares, on which theycan grow cane. Cane produced from that land must be delivered to a designated mill which isobliged to accept cane from land assigned to it. Growing of cane on unassigned land is notprohibited, but sugar produced from cane grown on unassigned land generally receives a penaltyprice of $1 per tonne.1
The Corporation has the power to make a pro-rata reduction in the area of assignment that can beharvested in a particular season. Any adjustment is to apply equally to all assignments inQueensland. This is called the ‘adjusted area of assignment’. The area can also be adjusted togreater than 100 per cent of assignment, but this requires the approval of the Minister after
consultation with the Sugar Industry Policy Council.2
Before 1987, the transfer of assignments between growers was very restricted. Assignments wereoriginally specified in terms of particular plots of land on a designated farm, and growers could noteasily get permission to change assignments, even within existing farm boundaries. Restrictions ontransfers were relaxed somewhat in 1986 with the introduction of ‘roaming’. This permitted agrower to use up to 15 per cent of assignment on any land within a mill area.
Under the 1991 legislation, assignments may be used anywhere on the grower’s farm, and provisionhas been made for transfers (sales) both within and between mill areas. Approval for transferwithin a mill area requires a majority decision by the local board, while transfers between mill
1 In 1990, to facilitate an 8 per cent expansion in assignment, the Minister for Primary Industries determinedthat either the Pool 1 or Pool 2 price could be paid for sugar produced from cane grown on unassigned land.Provision for penalty payments for sugar grown on unassigned land is provided for in the Sugar Industry Act1991, and the $1 per tonne penal price was reinstated for the 1991 season, even though production was at itslowest for many years.2 The Sugar Industry Policy Council was established under the 1991 legislation to advise the Queensland
Government on sugar industry policy.
THE AUSTRALIANSUGAR INDUSTRY
38
areas require the unanimous approval of members of local boards of both mill areas. This meansthat transfers of assignment are more restricted between mill areas than within a mill area.
Under the new legislation, the Corporation may approve the transfer of a grower’s assignment fromone mill area to another to enable the grower to improve his viability in a new area. The growermust relinquish assignment in the original mill area in exchange for the assignment in the new area.The assignment relinquished in the original mill area is available for re-assignment as part of the2.5 per cent expansion in that mill area. Approval of local boards is not required for this transfer.
The area of assignment has increased over the years, from 333 000 hectares in 1979 to 397 000hectares at the beginning of 1992, an increase of 19 per cent.
Increases in assignment have, in the past, been granted principally on a pro-rata basis, free ofcharge, to existing assignment holders. The most recent expansions were 5 per cent in 1988, 8 percent in 1990, 2.5 per cent in 1991 and 5.5 per cent in 1992. Not all growers were in a position toaccept the expansion offered, either because of the limited land available to them, or becauseexpansion was uneconomic. Increased assignment that was not taken up was re-offered to theindustry, again on a pro-rata basis, until all assignment was taken up. This process can take anumber of years and, as a consequence, some 34 800 hectares from expansions prior to 1991 havenot been made effective.3 This represents around 10 per cent of the total area of assignment.
The introduction of ‘roaming’ also allowed an expansion in production by increasing the proportionof assignment that could be cultivated in each year. Growers could move assignment, that is, theycould ‘roam’ assignment, effectively fallowing unassigned land rather than using a proportion oftheir assignment. The new legislation does not include provisions for roaming as it has, inprinciple, been superseded by the new transfer provisions.
The 1991 Act requires assignment be expanded by a minimum of 2.5 per cent (around 10 000 ha)per year commencing in 1991 and ending in 1995. The method of allocating additional assignmentis not specified, although some of the expansion must be offered on a pro-rata basis to existingassignment holders. The Minister has announced a 5.5 per cent expansion in 1992, made up of 2.5per cent for the 1992 season, as specified in the Act, 2.5 per cent because of the delay inimplementing the 1991 expansion, and 0.5 per cent to cover assignment that had been cancelled bythe CSCPB. The Minister stated that half the expansion would be available for new growers.4
After 1995, expansion is to be determined by the Queensland Sugar Corporation.
3 Australian Canegrower, 13 January 1992, p. 9.4 News Release from the Office of Edmund Casey MLA, Minister for Primary Industries, New Year Presentfor Queensland’s Sugar Industry, 30 December 1991.

PRODUCTIONCONTROLS INQUEENSLAND
39
5.2 Farm peaks
Payment for cane grown on assigned land is based on two prices. These pricing arrangements arediscussed in Chapter 6, but the essential feature that impacts on production controls is that someproduction receives prices based on a Pool 1 price which is 12 per cent higher than the Pool 2 price.In addition to their assignment specifying the area of land that can be put to cane, most growerspossess a farm peak, usually specified in tonnes of raw sugar. Cane grown on assigned land andused to produce sugar up to the farm peak receives prices based on the higher Pool 1 sugar price.Cane grown on assigned land in excess of that required to produce the farm peak receives the lowerPool 2 price. The proportion of cane production which receives the higher price varies betweengrowers. Some, particularly older small farms, have peak entitlements equivalent to 100 per centof production, while others, notably new cane farms, have considerably less. In recent years, 80per cent of production received the Pool 1 price. This proportion increased in 1991 due to the largedecline in production in that year.
Farm peak may be transferred (sold) between growers independently of assignment, but thereceiving grower must have assigned land on which to grow cane to supply the farm peak. Theconditions and approvals governing the transferability of peak are essentially the same as thoseapplying to the transfer of assignment.
Farm peaks have been effectively frozen since 1982, although the area under assignment hascontinued to expand. Consequently, unless peak has been purchased, new cane farms rely entirelyon the lower Pool 2 returns.
5.3 Regulation of the grower/mill relationship
The legislation specifies the broad parameters which shape the relationship between growers andmills. The institutional mechanism for this is the local board, comprising grower and millerrepresentatives in each mill area. Each local board negotiates annually an agreement called a localaward. The award is subject to appeal to the Sugar Industry Tribunal. Local awards cover allmatters relating to:
• the harvesting and delivery of cane to the mill;
• the transport, handling and crushing of cane by the mill; and
• the payment for cane.
All growers are bound by the conditions in the award negotiated on their behalf by the local board.Although the Sugar Industry Act 1991 provides for the negotiation of agreements between growersand the mill outside of the award, it also includes a provision making an agreement binding on allgrowers if it has the support of 85 per cent of assignment holders.

THE AUSTRALIANSUGAR INDUSTRY
40
Revenue from the sale of raw sugar is distributed between the mill and growers under a formulacontained in local awards. While local boards have the power to determine the distribution, alllocal boards use the industry-wide formula, which has operated largely unchanged since 1915.When introduced, the formula distributed returns from the sale of raw sugar between growers andmillers in the ratio of 2:1. However, the capacity of mills to extract sugar has, over time, increasedat a greater rate than the sucrose content in cane. Consequently, the mills’ share of returns hasincreased to nearly 40 per cent. The formula used to determine the distribution of revenuesbetween mills and growers is outlined in Appendix D.
Local awards determine the price payable for cane, subject to requirements stipulated in the Actthat the basis for determining the price is the same for every assignment holder within each millarea. Cane prices are based on the average level of ccs in cane over the season for the whole millarea. Broadly speaking, all growers within a mill area receive the same price for cane of the samequality. This is outlined in more detail later in this chapter.
Concepts of fairness are a strong theme running through the collective decision making processesin the sugar industry. In large part this stems from the democratic basis of grower representationon the various boards and organisations governing aspects of the industry. Collective decisionmaking with compulsory compliance backed by legislation, (which has replaced the individualeconomic choices that operate in most other markets), shows up in such things as: the pro-rataallocation of increases in assignment to existing growers; allocating assignment to new growers inareas which are broadly comparable in size to the small holdings already existing in the industry(even if these small areas are uneconomic); a strong defence of the uniform price paid to growersirrespective of distance from the mill; and harvesting schedules designed to give each growersimilar access to the mill. Regulation of production, prices and marketing, which insulates much ofthe industry from competitive pressures among growers, among millers, and between growers andmillers, facilitates such outcomes.
5.4 Reasons for regulation
Regulation of sugar production has a long history in Queensland, dating back to the early years ofthis century when small-scale canegrowers were seen to be ‘exploited’ by milling interests. Overthe years, regulations were expanded and extended in response to a variety of circumstances, oftento overcome the adverse incentives and ‘loopholes’ created by the original controls. In time, a largenumber of major economic decisions in the industry have been usurped by regulation, or havebecome subject to approval from some regulatory body or another.
These regulations have become an integral part of how the industry is organised and operates, and alarge section of the grower community is strongly attached to them. Indeed, many find it difficultto envisage how the industry would operate in the absence of the rules and guidelines for behaviourprovided by the existing regulations.

PRODUCTIONCONTROLS INQUEENSLAND
41
The reasons that regulations are seen to be necessary include:
• to protect growers from the buying power of the mill. Conversely, mills are concerned aboutthe power of organised grower groups;
• to ensure orderly expansion that is within the capacity of industry infrastructure and does notthreaten the position of those already in the industry;
• to provide a means of co-ordinating the scheduling of the harvesting and delivery operations ina manner which is equitable between growers;
• to protect growers, potential growers, and millers from investment decisions that may not beviable;
• to protect mills against the threat of closure through significant volumes of assignment beingtransferred out of a mill area; and
• to preserve and increase industry per unit returns.
5.4.1 Offsetting the economic power of mills
The economic power of mills has been a long-term concern of growers. They see themselves asbeing in a potentially weak bargaining position because the perishability of cane limits their abilityto deliver to another mill, and because of the large number of growers in each area. Similarconcern about the economic power of processors of perishable products has been one of thefundamental rationales for the regulation of many rural activities in Australia.
The regional power of individual mills is accentuated by the tendency for most, if not all, of themills in particular regions to be owned by the one company. For example, CSR owns all the millsin the Burdekin and Herbert River areas, Mackay Co-operative owns all mills except one in theMackay region, Bundaberg Sugar Company owns all the mills except one around Bundaberg, andthe New South Wales Co-operative owns the three mills in New South Wales. These are largelyisolated sugar growing regions with little opportunity for growers to supply other mills.Competition within these regions would only emerge if there were new entrants to milling. In twoof these regions, however, the use of market power by mills is minimised by co-operativeownership.
The regional economic power of mills exists because of the significance of transport costs and theperishability of cane. Cane cannot be either stored or shipped long distances, nor offered direct toconsumers as a `fresh' product. This economic power has been exacerbated by the introduction ofmechanical harvesting and the practice of cutting cane into billets which significantly increases theperishability of cane compared with past practices of full-stick cutting. The Australian system also

THE AUSTRALIANSUGAR INDUSTRY
42
includes many tram line systems dedicated to supplying particular mills. While these features ofharvesting and transport have been adopted for sound economic reasons, and are unlikely to bereversed, they nevertheless serve to increase the mill’s regional power. The power of mills is alsoenhanced by the high capital cost of setting up new mills and the limited scope for the alternativeuse of that capital if a new venture fails. These factors, coupled with significant size economiesassociated with milling operations, create a significant barrier to competition from new mills.
The extent to which mills can exercise market power is currently limited by regulation. This hasmade it unnecessary for growers to investigate or develop alternative ways of handling such power.In its draft report, the Commission proposed that the current regulatory arrangements no longer beobligatory, allowing individual growers, or groups of growers, and the mill to enter into mutuallyagreeable contractual arrangements. This proposal resulted in considerable comment at the draftreport hearing and in submissions. Growers fear that, in the absence of regulation, mills willdictate prices and delivery terms to the detriment of growers.
In the past, there may have been some potential for mills to exploit market power. However,growers have now formed strong organisations to negotiate on a collective basis. In some regions,growers have purchased their local mill. Growers also have far greater access to information toallow them to assess whether terms offered by a mill are reasonable. The development of tradepractices legislation also provides some protection for growers against the misuse of market powerby mills. While the Act limits collusive agreements to reduce competition between suppliers, anexemption may be provided if 50 or more parties are involved.
These developments, coupled with millers’ dependence on growers to supply sufficient cane toallow the mill to operate at satisfactory levels of capacity, raise the possibility that it is growersrather than millers who possess the greater market power. For example, at the draft report hearing,the representative of the South Johnstone Canegrowers commented:
... I think I would be far more fearful in a deregulated industry of being a mill owner than a grower, because amill owner can do one thing with his mill and that is crush cane and nothing else.
Similarly, CSR stated:
Millers have to ensure cane supplies over many years, not year to year. They cannot afford to alienate growers inthe short, medium or the long term.
The regulations have provided a degree of stability and certainty by assuring growers of access tomilling capacity and mills of a supply of cane. However, in the absence of regulation, thesematters could be handled by a system of contracts. Contracts are currently employed in a numberof other rural industries which produce perishable products. For example, contracts are currently

PRODUCTIONCONTROLS INQUEENSLAND
43
used in Victoria to formalise voluntary agreements for the supply and processing of tomatoes,broilers and wine grapes.
In the short term, it is likely that contracts would largely reflect existing local awards. However,over time, growers and millers would have greater flexibility than previously existed to tailordelivery terms and conditions to accommodate the particular needs of specific regions, groups ofgrowers, or even individual growers.
It is difficult to predict the form that contracts might take: the form would be determined bygrowers and millers in each area. However, to provide a degree of stability it is likely that theywould extend over a minimum period of about 3 to 5 years and could include annual roll-overprovisions. The price paid for cane could be subject to regular review or, as is more likely, couldbe linked to world prices. To facilitate mill operations, the price could vary according to the timeof the season. Mills could, for example, pay higher prices to attract supplies of cane at either endof a season. Some variability in price over the season already exists in the form of harvestingallowances paid in some mill areas. Transport costs could continue to be borne by mills or,alternatively, an arrangement could be negotiated whereby growers bear the cost in return forhigher cane prices. In the case of disputes, contracts could be subject to arbitration under theprovisions of existing Queensland legislation. In this regard CSR stated:
We believe that an arbitration process should be, and would be, included in the contract for the determination ofany matters which are unable to be settled by agreement. By this, we mean local arbitration, not the perpetuationof a central arbitration authority.
Contracts and other aspects of the grower/miller relationship are discussed in more detail inAppendix I.
5.4.2 Matching mill capacity and cane production
Many in the industry see regulation as necessary to ensure the matching of cane production andmilling capacity and for the orderly co-ordination of harvesting, transport and milling over theseason. In the short term, this involves determining season length, harvesting schedules andtransport. In the longer term, it involves the control of the rate of expansion in the industry so thatproduction is within the capacity of the industry’s milling and transport infrastructure, and so thatexpansion does not penalise those already in the industry.
Co-ordinating production, harvesting and milling activity
Production controls facilitate the co-ordination of cane production and raw sugar milling activities.However, the need to match processing capacity with crop production and to organise the co-ordinated scheduling of harvesting over the season is not unique to the sugar industry. Many otherindustries require close co-ordination of harvesting and processing operations, especially those
THE AUSTRALIANSUGAR INDUSTRY
44
involving perishable crops. Government regulation is not essential for this to be organisedeffectively. In other industries co-ordination is handled by contractual arrangements betweenfarmers and processors, often of a long term nature. Such arrangements can guarantee both supplyto the processor and a market for the producer.
In the absence of the land assignment system and associated regulation, the interdependencebetween growers and millers would create strong incentives to organise the scheduling andtransport of cane efficiently. This has been done successfully in New South Wales. Similararrangements could be introduced without undue disruption in Queensland, particularly where millsare owned by growers.
Orderly expansion
The need to control the level of cane production by regulation to match expectations of millingcapacity reflects the lack of price signals under the regulated system operating in Queensland. In amore conventional market environment, these price signals would indicate the economicconstraints on cane production and milling, and would establish the longer-term optimum level ofactivity. Moreover, in a deregulated market, it would be unlikely that growers would expandproduction without first ensuring that they can sell the cane to a mill.
The need for growers to secure access to processing facilities, and for processors to have securityof supply is a characteristic of many industries and can be normally handled by negotiationbetween prospective sellers and buyers. If the current regulations did not apply, new cane supplywould either encourage additional milling capacity or would displace existing suppliers.Displacement of existing suppliers by new entrants is a normal feature of a competitive marketeconomy. It is difficult to identify any characteristics of the sugar industry which would warrantthe protection of existing suppliers from new entrants, or warrant other regulation of thegrower/mill relationship which locks all parties into a prescribed set of operating procedures,irrespective of differences in economic circumstances.
5.4.3 Protecting asset values
Although many participants said that assignment is currently worth little as a result of the droughtand low sugar prices, production controls have traditionally been seen by many in the industry asprotecting the asset value of established cane farms. Indeed, canegrowers were reported to beopposed to the latest expansion of assignment because:
...it would decrease the value of cane assignment and the asset value of all existing cane farms and their collateraland borrowing ability.5
5 Australian Canegrower, 13 January 1992, p. 9.

PRODUCTIONCONTROLS INQUEENSLAND
45
However, whether the value of existing cane farms would decline with the removal of productionconstraints is unclear. The value of land is determined by the expected returns that can be obtainedfrom its use. The value of cane land currently encompasses two components, the value ofassignment and the residual value of the land. The value of assignment is the capitalised value ofthe additional expected return from producing cane as opposed to undertaking an alternativeactivity. The residual value of the land (that is, its value without assignment) would be expected toreflect returns which can be obtained from the alternative activity.
The value of land with assignment is higher than the value of land without. The higher valuereflects the higher returns that can be obtained from that land by using it for cane production ratherthan alternative (lower return) activities. If the assignment system were to be removed, the value ofunassigned land that could be used for cane-growing would increase to that of ‘assigned’ land. Thevalue of existing cane farms would be largely unchanged. While the value of assignment would beeliminated, the residual, or ‘unassigned’ value of the land would be expected to increase so as toapproximate the current value of land with assignment. Only if the removal of production controlswere to reduce the price of sugar, and thus the returns from growing cane, would the value ofexisting cane land decline.
A major benefit of the assignment system for established canegrowers has been the restriction itplaces on the entitlement to participate in industry expansion. The practice of allocating the bulk ofincreased assignment to existing growers allows them to purchase land at unassigned values andthen appropriate the benefit of conversion to cane. This return would normally accrue to theoriginal landholder.
5.4.4 Guaranteeing mill throughput
Constraints on the transfer of assignment to other mill areas, as well as constraints on the freedomof growers to choose the mill to which they deliver, are a means of guaranteeing mill throughput.This is seen as being of particular importance in the northern region where cane land is under threatfrom other land-use activities, and two mills have closed in recent years. In the face of decliningsupply, mills have an incentive to resist any request by growers to sell or transfer assignment toanother mill. The current regulations provide a mechanism for the mill to override individualgrowers’ decisions to relocate production.
In principle, growers should be free to choose where they operate and which mill they wish tosupply. In these circumstances, there would be greater pressure on mills to provide efficient andeffective milling services to growers. However, the freedom of growers to choose a mill wouldneed to be balanced by the freedom of the receiving mill to accept or reject offers of cane fromgrowers who wish to transfer supply.

THE AUSTRALIANSUGAR INDUSTRY
46
If a mill cannot attract sufficient throughput then, as in other business activities, it would beappropriate for it to scale down, or cease activity. Experience with mill closures in the past is thatarrangements to supply alternative mills have been made in an effective and orderly fashion. Thedecision on whether to close a mill would clearly depend on the remaining economic life of themill, the proximity of other mills and on negotiations between mills and growers. It is undesirablefor government to guarantee any business investment by guaranteeing, by regulation, eithermarkets or supplies.
5.4.5 Maintenance of prices
Support for the continuation of production control is also based on fears that increased productionwould dilute average returns in the industry. In the past, this concern was to some degreeovercome by the two pool pricing system which isolated the returns of premium and assuredmarkets from more ‘opportunistic’ sales. However, the current arrangements, with a fixed 12 percent difference between the two pools, means that all growers will be affected by increasedproduction being sold on lower priced markets. This is a problem, however, with the method ofpooling returns to growers, rather than a problem of ‘uneconomic’ or excess production. If there isa large discrepancy between returns achieved in different markets, it is feasible to reflect this inprices paid for marginal production without eroding other growers’ returns. Thus, marginalproduction could be profitably sold in its own right without the need for output to be constrained.
5.4.6 Increasing export returns
There would be some economic case for limiting cane production if Australia was in a position toinfluence the world price for raw sugar. In that case, limiting production could benefit Australia byincreasing sugar prices. However, Australia’s share of the world sugar trade is small and, as aconsequence, Australia is commonly regarded as a price taker on international markets. This isconsidered in some detail in the following chapter.
5.5 Costs of production controls
The assignment system and associated regulation of sugar cane production provide stability andprotect incomes for some growers and millers. However, they disadvantage others in the industryand impose wider costs on Australia in the form of foregone production and income. Adverseconsequences include:
• Some land is precluded from being used for its most profitable use - that is, cane production.This constrains the quantity of cane that can be profitably produced and reduces Australia'sexport earning capability.

PRODUCTIONCONTROLS INQUEENSLAND
47
• The pro-rata allocation of increases in assignment to existing growers, together withimpediments to the transfer of assignment, mean that marginal or unsuitable land is broughtinto cane production in established areas at the expense of more suitable land in new areas.
• To the extent that a grower's right to deliver to a mill is guaranteed, and the price of cane isfixed by regulation, less efficient growers are protected from competition from more efficientexisting or potential growers.
• Assigning land to particular mills removes competition between the mills and significantlyreduces the potential for competition from new mills.
• Limits on the quantity of land that can be used to grow cane encourage the over-use of non-landinputs such as fertilisers, herbicides and water. As well as increasing costs, such practices haveadverse environmental effects.
• Restrictions on land expansion, and the prospect of penalties for failure to grow cane, limit theindustry's ability to respond to price signals and changes in demand. This is compounded bythe current two pool pricing system which has the potential to mute price signals at the marginfor growers.
These matters, along with other aspects of the present production controls which impair efficiency,are discussed below.
5.5.1 Limitations on sugar production
Extent of potential expansion
Estimates of the extent to which production is constrained by the assignment system vary. The1990 Report of the Sugar Industry Working Party estimated that land was available to sustain a 50per cent expansion in cane-growing. In 1986, ABARE modelled a potential expansion of 30 percent. The Centre for International Economics (CIE) estimated an expansion potential of 46 percent.6 The new Queensland legislation provides for a minimum expansion in assignment of some13 per cent over 5 years, commencing in 1991. This is in addition to an 8 per cent expansion inassignment in 1990.
While grower organisations generally supported most of the current production controls, viewsdiffered on the appropriate rate of expansion. In general, this reflected differences in the potentialfor expansion in different mill regions. The regions generally accepted as having the greatestpotential for expansion are Tully, the Burdekin, Herbert River and Proserpine. Although theProserpine Canegrowers believe that production controls are good for the industry, they said that:
6 Centre for International Economics (CIE), Sugar: Winning in a corrupt world market, Canberra, 1991, p.
33.

THE AUSTRALIANSUGAR INDUSTRY
48
It is our view that for the continued well being of the industry, opportunities for improved economies of scalemust be taken up.(sub.6 p.2)
The 1990 Report of the Sugar Industry Working Party identified potential land ranging from wellover 100 per cent of existing assignments in some mill areas to zero in a number of the northernmill areas. The CIE estimated that land under cane could double in the Burdekin, with increases of46 and 36 per cent in the Central and Northern regions respectively. Since breaking with theQueensland arrangements, the New South Wales industry is actively pursuing an expansion incanegrowing of up to 40 per cent.
At the first round of hearings, a representative of the Queensland Raw Sugar Industry (QSI)7
denied that the present system constrains production, saying:
I think the important issue at the moment is that assignment is not a constraint on expansion. It has been aconstraint in the past. We have a situation where the industry between 1989 - that is, going back about twoseasons - and 1996 will have had the opportunity to expand by something of the order of 30 to 35 per cent.
This was subsequently denied by some participants (eg Davco and CSR). Davco said (p172Transcript) that:
...the assignment system does severely restrict production. We are living proof of these constraints. I think Mr.Desmachelier [QSI] did concede that one individual or two may be restrained. In his address yesterday Mr.Noble [CSR] said that he must be one of the individuals. We obviously must be the second.
Not all of the recently offered expansion in assignment has been taken up. However, this does notindicate that the assignment system is not limiting production. It largely reflects the limitations ofthe current system of allocation. Not all existing growers can use the marginal pro-rata increasesoffered. Indeed, the 8 per cent expansion allowed for in 1990 was heavily over-subscribed in termsof the area of additional assignment sought. The 1991 Australian Sugar Yearbook reported that, inthe Proserpine and Herbert River areas, growers applied for over five times the amount of landmade available. In the Burdekin, some 200 farmers who presently do not grow cane applied forassignment, in addition to over-subscription by existing growers. In the Mackay area, where morethan 25 per cent of Queensland’s cane is currently grown, growers applied for twice as muchassignment as that set aside for 1990. Even in the Mossman area, where most growers are land-locked, the applications from existing and potential new growers were well above the area of extraland available.
The 2.5 per cent expansion allowed in 1991 was also heavily over-subscribed. The area applied forwas nearly 40 000 hectares, or 10 per cent of the existing area of assignment and four times the
7 The raw sugar industry submission was a joint submission to the initial round of public hearings by the
Queensland Sugar Board (now the Sugar Corporation), Canegrowers and the Australian Sugar MillingCouncil.
PRODUCTIONCONTROLS INQUEENSLAND
49
area made available.8 Some regions sought considerably more. The Pioneer mill area in theBurdekin sought a 40 per cent expansion; the Victoria mill area in the Herbert region and theMossman mill in the north each sought over 30 per cent; while the Proserpine mill area sought 29per cent.
Value of assignment
In the Commission’s view, production has been constrained. It is constrained by an absolute ceilingon assignment increases; by pro-rata allocations limiting differential regional expansion; and byrestrictions on the transfer of assignment. In addition to the over-subscription to recent offerings ofassignment, an indicator that assignment has restricted expansion in some areas is provided by thevalue that is placed on assignment.
In some areas, such as Proserpine and the Herbert River, canegrowers in recent seasons haveoffered 15 per cent of gross cane revenue, at the lower Pool 2 price, for the right to use assignmentallocated to another grower. On the basis that a hectare of land produces 85 tonnes of cane with accs of 14, and the average 1990-91 returns on raw sugar sales of US12.8 cents per pound, thisleasing cost implied a value per hectare for assignment in that year of $2700. The existence ofextensive leasing of assignment indicates that land was available which could be more profitablyused to grow cane.
Davco in its initial submission said that, in the Burdekin region in early 1991, typical land preparedfor growing cane has been sold for about $5000 a hectare, while the same land sold withassignment and peak was selling for $8000 a hectare. The difference of $3000 per hectare reflectsthe ‘scarcity value’ of the right to grow cane, together with the capitalised value of the marginbetween Pool 1 and Pool 2 prices.
The value of additional assignment varies between regions because of limitations on transferabilitybetween mill areas. The Commission received anecdotal information of the value of additionalassignment in other regions in which land is available. However, in landlocked mill areas in thenorthern region, the value of additional assignment may be virtually nil. Tully Sugar Industry saidthat, in the Tully mill area, assignment can be purchased for only $10 per hectare compared with$28 per hectare four years ago. The South Johnstone Canegrowers said that assignment hadvirtually no value in their mill area.(transcript p.222)
From discussions with industry participants, the Commission understands that, since early 1991,the value of assignment without peak has been declining, and in September 1991 it had declined toaround $1000 per hectare in the Burdekin region. Since the announcement of the 5.5 per centincrease in assignment for 1992, and with expectations of further expansions and of continuing lowprices, the value of assignment without peak in early 1992 in the Burdekin is said to have declinedto between $100 and $400 per hectare.
8 Australian Canegrower, 23 September 1991, p. 15. The area reported understates the likely area requestedas information was not available for the Invicta, Babinda and Mulgrave mill areas.
THE AUSTRALIANSUGAR INDUSTRY
50
Method of allocating expansion
Expansions of assignment in the past have been basically determined by the sugar industry.Established growers have a strong voice in such decisions. Many, even most, existing growersfaced, until recently, strong incentives to limit expansion. This is because the majority ofestablished growers have no suitable unassigned land within or adjacent to their farm. As aconsequence, there has been a large constituency in the sugar industry with incentives to resist anyexpansion in which they could not participate. The Working Party reported that some 63 per centof cane growers are landlocked and that a 10 per cent increase in assignments would leave 12 outof the 26 mill areas without land for future expansion.(page 37)
The problem of landlocked growers being unable to use the pro-rata expansions offered has beenpartially overcome under the new legislation by allowing the transfer or sale of assignment.Growers who would otherwise be unable to expand can transfer or sell assignment to other growersand thus are able to accept the additional assignment offered. However, even under the new Act,conditions are attached to transfer or sale, particularly to transfer outside a grower’s mill area.Also, given the incremental nature of expansions offered, most of the additional assignments aretoo small an area to be economically viable as a unit separate from the grower’s established farm.For example, with average size of assignment being about 60 hectares, the 2.5 per cent expansioncurrently being offered would represent only 1.5 hectares.
The method of allocation assignment by local boards to new growers came under criticism by someparticipants. Davco said that, as a result of recent decisions on the allocation of new assignment, ithad approached the local board for the criteria used and was told that such information was notnecessary and would not be forthcoming.
Davco further commented that:
By vesting all the decision making responsibilities with respect to production with the local boards, theCorporation has effectively abrogated its position and returned the industry to the rule operating before the 1991Act. Many of the good intentions of the new Act are in practice not achievable and there have been no changes toenhance flexibility, competitiveness or efficiency within the industry.(transcript p.271)
The guidelines for the allocation of new assignment in 1991 were provided by the Corporation.They are so broad that they provide little effective guidance for local boards. They effectivelyallow local boards to allocate assignment on any basis that they see fit.
CSR said that in one of its mill areas, the local board had allocated new assignment equally to newapplicants. This resulted in 17 hectares of assignment being allocated to each. A simple divisionof new assignment between new growers is perhaps understandable given the lack of useful

PRODUCTIONCONTROLS INQUEENSLAND
51
guidelines and the inevitable criticisms that choosing between applicants will bring. However, thecreation of unviable new cane farms is not desirable. CSR said that some successful applicants willnot proceed with cane farming because the small size of assignment would make ituneconomic.(transcript p 335)
Expansion in irrigated areas
Much of the additional land that can be opened up to cane-growing is in new areas made availableby irrigation. Some participants contended that irrigated land in the Burdekin River Irrigation Area(BRIA) was subsidised by government and questioned whether it is economical to expand caneproduction into these areas. In addition, they commented that 11 of the 13 farms, with assignmentand access to irrigation, offered for sale in the BRIA in October 1991 were passed in.(Sub 52, p12)
New investments in infrastructure, such as irrigation schemes, should generally be made only ifthere is a reasonable expectation that the returns will enable the full recovery of the costs of thescheme, including the capital investment. However, while many past investments in irrigationschemes may not fully recover costs, the facilities available should be used efficiently once ascheme is in place. That is, it is sensible to continue to use irrigation investments so long as returnsat least cover operating and maintenance costs.
The limited sales achieved at the BRIA auctions could well reflect the current low prices for sugarand the poor season in 1991. Both factors limit existing growers’ capacity to expand, while theformer is likely to have deterred new entrants. However, the limited interest may also reflect thecharacteristics of the farms offered. The farms on offer are small, generally around 100 hectares.There is limited scope for this land to be used for cane growing as assignment is either notavailable or is limited to 50 hectares.(Tully Sugar Industry sub 50 p 5) In addition, any cane grownon this land would only attract the lower Pool 2 cane price. Some participants commented that newgrowers have little hope of establishing a viable cane farm under these conditions, and that suchblocks could only operate in conjunction with an existing farm. The Sugar Corporation said thatthe two farms purchased in the October auction were by neighbouring canegrowers seeking toextend their holdings.
If restrictions on the area under cane were removed, and the two pool price system was abolished,the increased profitability is likely to be reflected in greater interest in land offered andconsequently in higher prices paid. An estimate of the possible impact on land prices can begauged from the margin between Pool 1 and Pool 2 prices and the cost of lease or purchase ofassignment at the time that auctions were held.
If new growers were able to obtain the average price for cane rather than the lower Pool 2 price, itwould reasonable to expect that this margin would be reflected in bids for land. Based on a longterm average price for raw sugar of US10 cents per pound and discount rates of 15 and 10 per cent,this margin would represent an additional $1500 to $2300 per hectare. In addition, the value ofassignment (without peak) in the second half of 1991 in the Burdekin was some $1000 per hectare.
THE AUSTRALIANSUGAR INDUSTRY
52
On the basis of these figures, the distortion to offer prices for land in 1991 resulting from regulationof the sugar industry is estimated to be about $2500 to $3300 per hectare. On the assumption that35 000 hectares of the 50 000 available in the BRIA could be used for cane-growing under aderegulated system, the revenue implications for the project would $85 to $115 million.
An appraisal of the BRIA scheme, and in particular the viability of further investment by theQueensland Water Resources Commission for land development was dealt with in theCommission’s draft report - Water Resources and Waste Water Disposal.
The loss to Australia from constrained expansion has been considerable. CSR commented that:
Farmers in the seven CSR mill areas applied for 26 000 hectares of land and have finally been granted 4 200hectares. We calculate that the value to the industry and the Queensland economy of refusing to assign the otherland will result in an overall revenue loss of about $68 million each year.(transcript p.334)
The Commission has estimated that, if the industry were allowed to expand by removing therestraints inherent in the assignment system, this expansion, together with increases in productivitypossible from moving to a more market based system, would result in raw sugar output (andexports) increasing by around $375 million annually (see Chapter 11).
To the extent that the sugar industry is more labour intensive than other alternative agriculturalactivities, particularly the cattle industry, the expansion of sugar growing would increaseemployment. The CIE estimated that employment could expand by between 3000 and 140 000 forthe economy as a whole, depending on the degree of sugar industry expansion and the extent towhich unemployment is a longer term phenomenon. The CIE also concluded that the current valueof income foregone over the next 15 years by limiting the rate of industry expansion was $1.1billion.
5.5.2 Controls limit rationalisation
As a consequence of past production controls, Australia has retained a structure of cane growingcharacterised by relatively small holdings. In part, this is an intentional outcome based on politicaland social pressures to maintain regional communities, and the influence that existing communitieshave on the regulatory process. In the process, gains from economies of size have been largelyprecluded. There is, however, considerable resistance in the industry to any move towards largescale cane-growing.
The potential gains from larger scale cane-growing could be significant. Davco provided data,based on a study by Sedgwick9, which indicate that cost savings of one-third are possible from
9 Sedgwick, K.N., Sugar: Outlook and Issues, National Agricultural and Resources Outlook Conference,
Canberra, 1987.

PRODUCTIONCONTROLS INQUEENSLAND
53
increasing cane farm size from 50 to 600 hectares. These estimates are consistent with those ofO’Sullivan10, who calculated that cost savings of around 30 per cent are possible by increasing farmsize from 100 to 300 hectares.
The opportunity to establish new farms exploiting economies of size is limited under the currentregulations. Assignments offered to those outside the industry are of a size that is seen to be‘equitable’ compared with those of existing farms. The Commission received comment that somenew growers were discouraged from applying for more than 40 hectares of assignment because thiswould be seen as being ‘greedy’.[Doug Mctagget, supplementary Davco data - he said he couldprovide proof, ask for this] At the draft report hearings, CSR said that:
In one of our mill areas there were applicants for relatively large tracts of land. The local board options seem tobe; one that they could select a small number of these applicants and give them a sizeable assignment or theycould give small allocations to all the applicants. They chose the latter course and as a result about 20 newassignment of 17 hectares were approved. (Transcript p335)
The data available to the Commission indicate that the benefits of increasing farm size are mostsignificant for farms with less than 100 hectares under cane. It is highly unlikely that new farmsbased on 17 or even 40 hectares of assignment could be viable; they certainly are in no position toexploit cost savings available from larger scale cane-growing.
Even in the new irrigation areas, the opportunities to set up large scale cane-growing are limited.Farms offered by the Water Resources Commission in Queensland are small, generally some 100hectares for cane-growing, for which only 50 hectares of assignment is available.[Tully sub 50 p5]Indeed, the WRC compulsorily resumes larger farms for break up into smaller properties. Whilethere are no restrictions on bidding for a number of farms, the auctions are often of non-adjacentplots, making amalgamation difficult. The views of the existing farming community in the area -dominated by existing small-scale cane-growing - appear to influence the policy for developingirrigated land.
While, in more recent years, the transferability of assignments has been less rigid, the gains fromsubsequent rationalisation will take time. One of the remaining problems is that, while assignmentsand peaks are ‘owned’ by growers and can be transferred or sold, mills have an interest inmaintaining assignment, and particularly peak within their mill area. This is because, under thecurrent pricing formula, the mill retains some 40 per cent of that higher price for peak sugar. As aconsequence, mills are reluctant to agree to the sale of assignment, and particularly peak, outsidetheir areas. The new legislation gives the mill the power to stop such transfers.
Some participants said that the requirement for unanimous approval effectively precludes thetransfer of assignment between mill areas, as the ‘losing’ mill, through its representation on onelocal board, will always veto the transfer.
10 O’Sullivan, M.H., Sugar Cane: Biological and Environmental Considerations, Alternative Uses and
Economies of Scale, Agricultural Economics Society Conference, Brisbane, 12-15 February, 1990.
THE AUSTRALIANSUGAR INDUSTRY
54
Davco said that:
The new system, which does allow the full transfer of assignment from [a grower’s] existing farm out to the newarea, is a possibility but in reality in Queensland it just does not happen.
There is less resistance to the transfer of assignment between mills under common ownership.CSR commented that such transfers are occurring.
The regulation of harvesting schedules and harvest groups can also constrain growers fromrationalising their operations. For example, a grower may be prevented from leaving a harvestgroup because the viability of the remainder of the group may be threatened, even though thegrower is forced to bear extra costs, or forgo significant savings, by staying in the group.
The pro-rata expansion of assignment to existing assignment holders, together with past restrictionson the transfer of assignment, have also encouraged the use of marginal land in existing canegrowing regions. The 1990 Report of the Sugar Industry Working Party estimated that 5 per centof assigned land was marginal or unsuitable for cane-growing.
5.5.3 Restrictions on competition between growers
Harvesting and delivery schedules, and prices for cane are determined under local awardsnegotiated on a collective basis between growers and the mill through local boards. All growersare guaranteed access to the mill at a common price. Millers and growers cannot easily negotiateindividually on price, quantity or terms of delivery for cane. Consequently, competition betweengrowers to supply cane is effectively eliminated. This reduces the incentive to innovate andimprove efficiency. More efficient growers are constrained from competing directly with the lessefficient. ABARE said (sub.33, pp. 21 & 23) that:
Regulations prevent competitive offers between individual growers, millers and end users to sell andbuy sugar cane and sugar ... The regulations and controls have constrained producers’ abilities torespond to profitable production opportunities and, over time, have led to inefficiencies in theindustry.
More generally, the current institutional arrangements controlling the harvesting, delivery and priceof cane provide a mechanism for established suppliers to restrict, harass and prohibit the entry ofnew suppliers, particularly those with production practices that differ from the establishedegalitarian ethos of the industry. If the principle that established participants in an industry could‘self regulate’ to preclude new entrants were to be accepted as a legitimate part of the widerbusiness environment, Australian industry would be far more exposed to dominance by cartels andmonopolies, to the detriment of consumers and at the expense of innovation and competitiveness inindustry. As a general principle, such practices are illegal.
PRODUCTIONCONTROLS INQUEENSLAND
55
5.5.4 Limits on land use encourages the over-use of other inputs
Land assignments impose an administered scarcity of land that can be used for sugar caneproduction. Consequently, to increase production, growers have an incentive to use additional non-land inputs, such as fertilizer, pesticides and water.
Davco said at the hearing:
Because we are restrained in how much area we may use, we tend to plough out our ratoon crops earlier than theynecessarily have to be, so we can plant a new crop and get our average tonnes per acre up. We may have easilyploughed out a fourth ratoon where it could have provided an economical yield.
While such practices may be appropriate responses given the existence of land controls, they resultin cane not being produced in the most efficient fashion. Unit production costs are higher than theyshould be. In addition, limitations on land provide an incentive to concentrate research on moreintensive cane growing practices, even though research into lower yielding broad-acre practicesand varieties may be more economically efficient.
5.5.5 Inefficient response to price signals
Restrictions on land expansion and potential penalties for failure to grow cane limit the industry’sability to respond to price signals, and to adapt to changing market circumstances and to changes inthe economic environment generally. This is compounded by the new two pool pricing systemwhich has the potential to provide growers with misleading price signals.
ABARE commented in its submission to the 1990 Working Party that:
The net effect of regulations and controls has been to constrain producers’ ability to respond to profitableopportunities. Increases in peaks and assignments have occurred only following periods of very high worldprices. Increases in production have therefore been intermittent and poorly timed. Invariably, increases inproduction have come on stream during the depressed phase of the world price cycle.
Expansions in assignment have been implemented slowly. Even in a situation where much moreadditional assignment is sought than is offered, considerable assignment from previous increaseshas still not been used. The Australian Canegrower reported comment by Canegrowerrepresentatives that 34 800 hectares of assignment from the 5 and 8 per cent expansions in 1988and 1990, equivalent to 10 per cent of existing assignment, have still not been taken up.11 Pro-rataallocations had to be offered to existing growers and, if these were not all taken up (as invariablyhappened because many growers were landlocked), allocations had to be re-offered until eventuallythe expansion was accommodated in the industry. As a consequence, the time between anannounced expansion and the actual expansion in assignments could be as long as two years.
11 Australian Canegrower, 13 January 1992, p. 9.
THE AUSTRALIANSUGAR INDUSTRY
56
The Commission has been told that the enforcement of any requirement to produce (on threat ofloss of assignment) has been relaxed. However, under the new legislation, the Corporation cancancel assignment ‘upon the wilful failure of the holder to grow sugar cane’. While theCorporation need not exercise this power, its very existence will influence growers’ decisions. TheCommission received an example of a request for transfer of assignment in 1991 that was refusedby the local board on the grounds, among other things, that the assignment was not being used togrow cane.
This is not to say that the requirement to grow cane does not have some merit within the context ofthe current system of regulation. If the requirement was significantly relaxed (a desirable situationin principle) it could have some perverse effects. For example, landlocked growers and those withland essentially unsuitable for cane expansion could accept any pro-rata assignment offered withoutbeing required to use it. This would reduce the eventual flow-on of assignment to those areas withgreater potential to expand. This further highlights the interrelated nature of much of theregulations governing the industry. Many regulations exist essentially to control the adverseconsequences of incentives established by other elements of the regulatory package.
5.5.6 Incentives to reduce season length
The average sugar content of cane (measured as ccs) ranges from around 10 at the beginning andend of the season to about 16 in the middle. Under a system where prices per unit of ccs do notvary over the season, all growers would like to deliver their cane at the time of maximum sugarcontent. This would, however, require significant investment in milling capacity which would beidle for most of the year. The economic season length is thus a trade-off between the benefits ofspreading the cost of milling capital over a longer season and the reduction in sugar yield as theseason is extended.
The problem of ‘rationing’ access to the mill over the crushing season has been overcome by aformula which pays growers according to the season average ccs for their mill area, irrespective ofthe time in the season that cane is delivered. In addition, in some mill areas, harvesting isscheduled by local boards so that cane is harvested from individual farms in small sections over anextended part of the harvesting season.
Individual growers have an incentive to increase their ccs in comparison with other growersdelivering at the same time in the season, but as a result of the existing arrangements, individualgrowers are indifferent (from the viewpoint of the prices they receive) as to the time in the seasonwhen they deliver. Growers as a group, however, have an incentive to increase average ccs byshortening the harvesting season, even if it is still profitable to grow and crush the lower ccs cane atthe ends of the season. Thus, there is continuous pressure on mills to make capital investments to
PRODUCTIONCONTROLS INQUEENSLAND
57
increase capacity to allow higher crushing rates. In addition, existing growers have an interest inlimiting new supply if this threatens to extend the crushing season, even if the growing andcrushing of that cane is profitable in its own right.
Under a more market-based system, mills would be prepared to pay a higher price for ccs in caneharvested at the beginning and end of the season in order to spread their fixed costs. The currentrequirement in the Sugar Industry Act 1991 that one price be paid to all growers makes suchpayments difficult. The Commission has been told, however, that a system of allowances hasdeveloped outside the formulated pricing system to overcome some of the shortcomings of theofficial system. For example, in some mill areas a ‘ccs underwriting’ allowance is paid tocompensate growers for lower ccs at the beginning and end of the season (basically to counteractpressure to reduce the length of the crushing season).
5.5.7 Cross-subsidisation of transport costs
Mills receive cane at delivery points at the farm end of the rail network. Where cane is deliveredby road, the mill takes delivery of cane at designated pick up points at the farm end of the transportnetwork. Most transport costs are thus borne by the mill. Growers are paid a uniform price,resulting in more distant growers being subsidised by those closer to the mill. The arrangementcould result in growers being indifferent as to whether they locate adjacent to a mill or at a moredistant site with higher transport costs.
The Bureau of Agricultural Economics12 (the predecessor to ABARE) in its study of the Mackaysugar region in 1986 said:
Cane prices do not reflect transport costs and so do not affect growers’ decisions about where to grow cane.Further, given the way in which land is assigned and peaks are allocated, many growers have little option but togrow cane at great distances from the mills. And millers are forced to transport cane great distances by road,while land close to mills and tramways remains unassigned.
It estimated a saving in transport costs of some 10 per cent from the relocation of distant cane-growing land to suitable land closer to the mill.
This does not imply, however, that under a more market-based system all transport costs would benecessarily borne by the grower, or that such costs would be delineated solely by distance from themill. Mills have an incentive to maintain throughput, and there would be circumstances in whichthe mill would be prepared to bear the cost of transport from more distant growing regions tomaintain throughput. However, under the current system these choices are not made on assessedcosts and benefits, but are applied on the basis of a single price for cane being ‘fair’. This problem
12 Bureau of Agricultural Economics, Occasional Paper No. 96, Efficiency of Transport, Milling andHandling in the Sugar Industry, AGPS, Canberra, 1986, p. 22.

THE AUSTRALIANSUGAR INDUSTRY
58
would be more significant if assignments were to become more readily transferable. Growerscould transfer assignment from areas close to the mill to areas further away, with the additionaltransport costs being borne by the mill.
In some mill areas, these problems have been recognised. Arrangements have been made outsideawards for transport costs to be shared between growers and mills. Nonetheless, the belief that onecane price is ‘fair’ is deeply entrenched in the industry and changes to the established arrangementsmust be made in the face of some resistance.
5.5.8 Inflexible incentives for cane growing and milling expansion
The current distribution of revenue between mills and growers has been largely unchanged for 70years. Despite constant complaint, the industry has been unable to agree on any fundamentalchanges to the traditional formula. The inherent inflexibility of the regulated distribution ofrevenue has not, however, been a major problem for the industry because restrictions on theexpansion of cane-growing have meant that any major mismatch of cane production and millingcapacity has not arisen.
Recent expansions in assignment have contributed to the introduction of continuous crushing toenable better utilisation of existing mill capacity, but as assignment continues to expand, theindustry will face the question of limits to existing milling capacity.
If cane production were to increase significantly under the current regulated system, it is not clearthat other elements of the regulatory system, particularly the revenue sharing arrangements, wouldbe sufficiently flexible to handle the pressures generated. Mills may be reluctant to expand millingcapacity under the current system once the gains from continuous crushing have been fullyrealised. The most likely outcome is that the expansion will be halted rather than changes made tolong established practices. Indeed, the availability of milling capacity is one of the criteria in thenew Act under which judgements on expansion by the Corporation are to be made. If the situationwere to arise where growers were prepared to seek additional assignment while mills were reluctantto invest in additional milling capacity, this would indicate that the current revenue sharingarrangements are inappropriate.
The Commission has not reviewed the revenue sharing arrangements between millers and growers.It is unlikely that any regulated pricing or revenue sharing system would be other than arbitrary orwould be sufficiently flexible to deal with changing market conditions. In the Commission’s view,only a system in which growers and millers could freely negotiate prices would provide efficientincentives for both cane-growing and milling expansion.

PRODUCTIONCONTROLS INQUEENSLAND
59
5.5.9 Conclusion
Costs would be involved in any system of private arrangements between mills and growers.However, the regulations themselves are far from costless. A cost is associated with theiradministration and, more importantly, costs stem from inefficiencies they impose on the operationand size of the industry. The regulations needlessly constrain the size and structure of the industry,preventing least cost input mixes, and reducing the ability of the industry to adapt to changedcircumstances. Indeed, the industry has been locked into a structure of small scale agricultureduring a period in which growing and harvesting technologies have changed considerably. Smallscale cane-growing is perpetuated by the practice of granting assignment to new growers in sizeswhich preclude the realisation of size economies. This runs the risk of requiring governmentassistance in the future to survive.
The regulations governing the industry have recently been changed, providing more scope for theflexible management of the industry. However, the Commission received many comments that,because of the manner in which the new legislation is being administered, industry practices arelittle different from those prior to 1991.
Following the release of the draft report, the Commission was criticised for not taking into accountthe clearly expressed wishes of the industry for the retention of the current regulations. However,the fact that a clear majority of those in the industry support regulation is not a justification for itscontinuation. In most industries, a majority would support regulation that limited competitionbetween members and severely limited the potential competition from new entrants. However,elsewhere in the economy, action to limit such competition is illegal. The Commission sees nospecial features in the sugar industry that would justify restrictions on competition.
5.6 Proposals for change
5.6.1 Long term objective
The Commission considers that, in the longer term, no constraints should be placed on the area orlocation of land used for growing sugar cane, or on the mill to which cane is delivered. Entry into,and exit from, cane-growing and milling should depend solely on the commercial judgment of theindividuals and organisations concerned. Prices for cane would be negotiated between mills andindividual growers or groups of growers.
Where suitable land is close to an existing mill, the rate at which that land would be utilized forsugar cane production would be subject to the capacity of the mill to crush the cane. Expansionwould entail negotiation of supply contracts between individual mills and growers. If the mill didnot have sufficient capacity to crush additional cane, it would be difficult for new entrants tonegotiate a contract to supply. Thus, they would be unlikely to expand production unless they weresufficiently efficient to displace traditional suppliers.

THE AUSTRALIANSUGAR INDUSTRY
60
If there were prospects of a large expansion in cane production, there would be an incentive for themill to expand capacity. This could mean that the mill would actively seek contracts with farmersto grow cane to supply the additional mill capacity. Something similar to this currently operates inNew South Wales where the milling co-operative is seeking new cane growers. There might alsobe an incentive to establish new mills. New and established growers would be free to co-operate toset up a new mill. A degree of stability, if desired, could be provided by medium or long-termcontracts, as in other industries. The Commission has looked at the question of contracts betweenthe mill and growers in more detail in Appendix I.
A necessary adjunct to the removal of the assignment system is the freeing up of the pricingmechanism to enable the price for cane, the time and scheduling of delivery, and the cost oftransport, to be negotiated between the mill and either individual growers or groups of growers.The extent to which groups of growers could negotiate with a mill would, however, be subject tothe Trade Practices Act. This limits collusive arrangements to reduce competition betweensuppliers, but provides for the exemption of pricing agreements if 50 or more parties are involved,provided that the arrangement is judged to be in the national interest and that participation isvoluntary.
Even if the assignment system and associated regulations were removed, it is possible that theessential features of the current organisation of harvesting and delivery would be retained by meansof voluntary agreements, as has occurred in New South Wales. This would, however, imply thatthe current regulations are redundant, locking in traditional practices and precluding differentarrangements in those cases where such arrangements could be profitably undertaken by somegrowers and millers.
In its draft report, the Commission proposed a set of interim arrangements aimed at the phasing outof the assignment system.
At the draft report hearings, CSR commented:
While we can understand why the Commission has suggested that the assignment system be dismantled over aperiod of years, this will have some disadvantages. The main problem likely to arise is that, during the interimperiod, a lot of industry energy and effort will inevitably be directed to convincing the legislators that changeshould either not occur or be substantially modified. There is some merit in removing the system quickly.
A number of factors influence any decision on whether interim arrangements are necessary.
Factors suggesting the need for transitional arrangements include the possibility that the currentregulations have significantly distorted economic signals to the industry so that the removal of
PRODUCTIONCONTROLS INQUEENSLAND
61
assignment could result in a large increase in planting over a relatively short period of time. Anyrapid expansion could lead to problems with both milling capacity and the capacity of theharvesting and transport system in some mill areas.
The legislation in Queensland has recently been amended in a way that allows for greater flexibilityin the regulations governing the industry. This allows for change to occur over the transitionperiod, but within a framework that those in the industry understand. The review of key aspects ofthe new legislation scheduled for 1996 provides a useful time for the introduction of moresubstantial change.
The major factor mitigating against transitional arrangements is the delay in realising the benefitsthat change will bring. Moreover, some factors suggest that change may not be rapid. Theacquisition of land and preparation for cane-growing takes some years. Sugar prices are not high atpresent, and assignment values are low in many mill areas. This would indicate that the immediateremoval of controls may not result in major change.
It is difficult to assess the relative significance of these considerations. However, the Commissionjudges that it would be preferable if the assignment system were dismantled over a number of yearsrather than abolished immediately. Most elements of the transitional arrangements proposed by theCommission could be accommodated within the new arrangements introduced by the QueenslandGovernment under its Sugar Industry Act 1991 .
5.6.2 Transitional arrangements
Interim expansion of assignment
The new Queensland legislation requires a minimum expansion of 2.5 per cent per annum inassignments between 1991 and 1995, after which decisions on expansion revert to the Corporation.The Commission considers that this minimum is too conservative. It proposes that the existingminimum 2.5 per cent expansion in assignment be increased to 5 per cent for the remaining yearsof the expansion program. As any implementation of transitional arrangements is unlikely to bepracticable until the 1993 season, this would mean a minimum 5 per cent expansion in 1993, 1994,and 1995. The assignment system would be abolished in 1996. The Commission believes that thisadditional expansion could be comfortably handled by the existing industry infrastructure. Indeed,at the draft report hearings, the Australian Sugar Milling Council advocated a minimum increase of5 per cent annually in the remaining transition period, 1992 to 1995 inclusive.
Allocation of transitional expansion of assignment to new growers
The Commission considers that the practice of reserving half the additional assignment for newgrowers should be continued over the transition period.
THE AUSTRALIANSUGAR INDUSTRY
62
In its draft report, the Commission proposed that the additional assignment be put out to tender.Under a tendering system, those seeking assignment would submit a tender specifying the area ofassignment sought and the amount per hectare the bidder was prepared to pay. Bids would beranked from highest to lowest and allocations would be made until the sum of the areas allocatedtotalled the total area available. Lower bids would be discarded and all those with successful bidswould be provided assignment at the price set by the lowest successful bid.
Revenue gained from the sale of assignment over the transition period could be used in a number ofways: it could be used to assist any canegrowers who might face financial difficulties as a result ofthe changes introduced; it could be distributed to established growers in the industry on the basis oftheir peak or assignment; it could be used to finance research in the sugar industry; or it could beretained by the Queensland Government.
There was some criticism of the tendering proposal. The Australian Sugar Milling Council saidthat the tender process would be administratively cumbersome.(transcript p 215) CSR said:
The proposed tender system would effectively impose a tax on people wishing to enter the industry; it wouldincrease the risk of any investment and potentially act as a disincentive. Further, a tender system would seem tobe too complicated a measure to be introduced for only a three year life span. (sub 56 p3)
The Commission recognises that the cost of acquiring assignment would make the entry of newgrowers more difficult. However, in suggesting the tender system, the Commission was seeking toachieve two things: firstly, to enable new farms to be established that are of a sufficient size toreap some of the available economies of size and to be viable in the long term; and secondly, toallocate new assignment to those growers and those regions which can use it most effectively. Atender system would also provide an indication of the extent to which the planned expansion ismeeting demand for assignment.
In practice, the question of how assignment is allocated and whether there is a price attached to it isessentially one of equity (as long as the price is not set so high as to preclude the use of theassignment and there are no restrictions on transfer). In this situation, the Commission does notpropose to recommend a particular method of allocating assignment. However, if assignment is tocontinue to be allocated to new growers at the discretion of local boards, the Commissionrecommends that assignment not be allocated in lots that are clearly uneconomic or are likely to bemarginal in the longer term. Rather than allocating a single large area of assignment to anindividual new grower, which may be seen to be inequitable, allocation could involve parcels ofassignment being progressively allocated to the new grower over the recommended transitionperiod. This would allow the build up of viable new farms incorporating established crop rotationpatterns. This would overcome the problem of new growers being classified as established growersonce they have been allocated their initial assignment, thus restricting them to the small pro-rata

PRODUCTIONCONTROLS INQUEENSLAND
63
expansions or requiring them to purchase assignment to expand beyond the small initial allocation.In view of the extent of the increase in assignment, and the limited period beyond which theassignment system would cease, this arrangement would not significantly disadvantage otherpotential new growers.
Pressures on administering bodies to distribute new assignment as widely as possible lead to theproliferation of small and potentially uneconomic cane farms. However, while it may be difficultto get the initial allocation of assignment ‘right’, so long as assignment can be freely bought andsold, and the transaction costs are not too high, the final distribution between growers and betweenregions will eventually reflect the relevant costs and benefits of cane-farming. Greater freedom totransfer assignment is thus an important factor in ensuring that expansion is efficiently utilised.
Transferability of assignment
The current system of approving transfers appears to be seriously hampering the movement ofassignment and the gains that this would generate. The Commission proposes that the transfer ofall new assignment (that is, new assignment allocated to both existing and new growers) besignificantly liberalised by removing the need for unanimous approval by the relevant local boards.The transfer of new assignment would only require the agreement of the receiving mill.
Associated changes
As assignment is expanded, other regulatory changes would be necessary. For example, it wouldbe undesirable to expand assignments indefinitely, while retaining the requirement on the mill toaccept all cane grown on assigned land. Nor would it always be desirable to retain the system ofone cane price, irrespective of distance from the mill or the time in the season in which cane isharvested and delivered.
One way of overcoming this problem could be, in the interim, to retain the requirement for mills toaccept cane, and retain the existing cane formula, but apply it only to cane from assignments issuedprior to the 1993 season. The acceptance of cane from any additional assignment would be subjectto negotiation between mills and the holders of the additional assignment.
Just as mills would not be obliged to process cane in excess of that from 1992 assignments,growers would not be required to fully utilise their additional assignments.
These would be transitional arrangements and, in time, all arrangements between mills and growerswould be subject to negotiation and the normal obligations associated with contractual or otherarrangements.

STATUTORYMARKETING OFQUEENSLAND SUGAR
65
6 STATUTORY MARKETING OF QUEENSLAND
SUGAR
6.1 Introduction
The marketing of all raw sugar produced in Queensland is the responsibility of the QueenslandSugar Corporation which was established under State legislation in 1991. It absorbed all of thefunctions of the Sugar Board (which had been responsible for the marketing of Queensland’s rawsugar) and most of the functions of the Central Sugar Cane Prices Board (which oversightedproduction controls).
The capacity of the Corporation to act as a sole marketer is underpined by legislation giving it thepower to compulsorily acquire all raw sugar produced in Queensland. On acquisition, ownership isvested in the Corporation. For mills, ownership of raw sugar is replaced by a right to receivepayment from the Corporation. Prior to 1991, raw sugar was acquired by the QueenslandGovernment and sold on its behalf by the Sugar Board.
Raw sugar produced in Queensland is marketed solely by the Corporation within Australia and inNew Zealand, and exported to other countries by CSR as marketing agent for the Corporation.CSR operates seven bulk sugar terminals along the Queensland coast on behalf of the Corporation.Sugar is shipped from bulk terminals either to refineries in Australia or to overseas destinations.
6.2 Domestic marketing
Until 1989, the Sugar Board was the sole seller of raw sugar produced in both Queensland and NewSouth Wales, as well as the sole seller of refined sugar. Raw sugar was refined (principally byCSR) on a contract (toll) basis, with the sugar remaining the property of the State.
In 1989, following the removal of the embargo on sugar imports and the lapsing of theCommonwealth-Queensland Sugar Agreement, the New South Wales industry established arefinery enabling it to sell directly onto the domestic market. However, the capacity of the NewSouth Wales industry is limited and some 75 per cent of the domestic market requirements for rawsugar is supplied by the Queensland Sugar Corporation.
The Board’s tolling arrangement with refiners lapsed in 1989. Since then, the SugarBoard/Corporation has sold raw sugar to CSR, to the relatively small refining operations ofBundaberg Sugar at Millaquin (now owned by Tate and Lyle), and a small amount to the Manildra
THE AUSTRALIANSUGAR INDUSTRY
66
Harwood refinery in New South Wales. The cessation of toll refining significantly changed theCorporation’s cash flow. It now sells on a cash basis to the refiners, resulting in a much earlierreceipt of revenue. This has reduced the Corporation’s requirements for borrowings to provideadvance payments to millers.
The Queensland Sugar Corporation has adopted a landed duty paid import parity pricing policy inpricing raw sugar on the domestic market.
The dominance of the Sugar Corporation in the raw sugar market is broadly matched by thedominance of CSR in the refined sugar market. The company supplies nearly 70 per cent of thedomestic market.
6.2.1 Export rebates
Prior to July 1989, an Export Sugar Rebate Scheme operated within the context of theCommonwealth-Queensland Sugar Agreement. The rebate applied to sugar used by exporters ofcertain products containing sugar when the administered domestic price of sugar exceeded theworld sugar price. The world price was calculated as the landed duty free price of imported sugarif the import embargo had not applied. When the domestic price was lower than this landed worldprice, domestic manufacturers retained the benefit of the lower domestic price.
Since the lifting of the embargo, the Sugar Board/Corporation has maintained rebates for exportedproducts incorporating significant quantities of sugar. The Corporation gives the rebate on rawsugar sold to the two Queensland refiners, CSR and Bundaberg Sugar. The refiners maysubsequently offer export rebates to relevant customers. The rebates are intended to offset theadverse effects that tariffs incorporated in the Corporation’s import parity pricing policy have onthe competitiveness of exported products containing sugar.1
The Commission understands that the rebate offered is equal to the developing country tariffapplying to raw sugar imports, thereby equating sugar costs to the duty free import price. This priceis still higher than the price at which raw sugar is exported from Australia. In 1990-91, exportrebates provided by the Sugar Board amounted to slightly over $5 million.
6.3 Export marketing
Australia generally exports around 80 per cent of its raw sugar production. As the output of theNew South Wales industry is directed only to the domestic market, all exports are from Queenslandand are subject to the control of the Queensland Sugar Corporation.
1 The Manildra Harwood sugar refinery has not offered export rebates to its customers.
STATUTORYMARKETING OFQUEENSLAND SUGAR
67
As the sole export marketing agent, CSR is responsible for the negotiation of export sales and theorganisation of shipping of raw sugar to all destinations other than New Zealand. The company isemployed, under a contract negotiated annually, on a fee for service basis. Negotiations betweenCSR and overseas buyers are undertaken in consultation with the Corporation.
The Corporation negotiates a significant share of its sugar exports on a long term contract basis andsells all sugar on a cif or c&f basis. In the 1990 season, long term contracts accounted for almost40 per cent of sales. The Corporation has long term contracts with China, Malaysia, Singapore,and South Korea, and did have one with the former USSR. Payments for all export sales arereceived at the time of shipment.
6.4 Payments to mills
In accordance with the legislation, total revenue from domestic and export sales of raw sugar isdivided into two pools and distributed to mills in Queensland. Prior to this distribution, deductionsare made for all costs associated with the sale of sugar, all costs of the Corporation in discharge ofits functions (including marketing and promotion, transport, bulk handling and storage, waterfrontand shipping, and some costs associated with the operation of local boards), and any reservesnecessary to fund its operation.
The two pool pricing system has a long history in Queensland. A mill’s entitlement to receive thePool 1 price is called the ‘mill peak’ and is specified in tonnes of raw sugar. Raw sugar produced inexcess of the mill peak receives the Pool 2 price. Mill peaks have been frozen since 1982 and, as aconsequence, any increases in production have received the Pool 2 price. Sugar produced fromcane grown on unassigned land is classified as ‘penalty sugar’ and, if delivered, would generallyreceive the penalty price of $1 per tonne. However, as noted in the previous chapter, such sugarwas paid the Pool 2 price in 1990.
Prior to 1990, Pool 1 consisted of returns from the domestic market and sugar sold on long termcontracts (including sugar sold under the US quota), together with any proceeds of other saleswhich may have been necessary to increase the quantity of sugar sold in Pool 1 to the aggregate ofmill peaks. Pool 2 was sugar produced on assigned land in excess of mill peaks. Because of thevolatility of the spot market price, the Pool 2 price could be higher than the Pool 1 price, asoccurred in the 1989 season, but generally the Pool 1 price was higher than that for Pool 2.
Since the beginning of the 1990 season, the legislation has required that the Pool 1 price be 12 percent higher than the Pool 2 price. This differential was established in response to recommendationsmade in 1989 by a Committee of Inquiry into The Queensland Sugar Industry Pooling System andRelated Matters.

THE AUSTRALIANSUGAR INDUSTRY
68
The Committee recommended that peak entitlements be preserved because it perceived a need toprovide added incentive to maintain throughput in mills operating in landlocked areas and becauseof the contribution established producers had made to infrastructure. However, to provide greatercertainty in its application, the Committee proposed that a fixed differential exist between the twopools. The Committee found that, during the ten years between 1978 and 1987, the price paid forPool 1 sugar was, on average, 12 per cent higher than that paid for Pool 2 sugar. Consequently, afixed differential of 12 per cent was recommended and subsequently implemented. This means thatthere is really only the one pool, but there are two prices paid for sugar delivered to the pool.
Over the last 20 years, the quantity of sugar receiving Pool 1 price (peak sugar) has been some 85to 95 per cent of the total quantity of sugar produced. In the 1990 season, Pool 2 represented arelatively small proportion (about 8 per cent) of all raw sugar produced. Consequently, theapplication of the 12 per cent differential resulted in the Pool 2 price being nearly 10 per centbelow the average price achieved for sales to all markets. Conversely, the gain for Pool 1producers was small: they received less than 1 per cent more than they would have received if allproducers contributing to the pool had received the same return (ie the average for all sales). Asthe industry expands, the gain to Pool 1 producers would increase relative to the average of allreturns.
Under the new Queensland legislation, the Queensland Sugar Corporation is, after 5 years, requiredto report on the two-pool pricing system and to assess alternatives.
The Sugar Board’s sales revenue for raw sugar for the 1990 season totalled some $1280 million,about 15 per cent less than 1989 revenue. As all sugar is sold c&f or cif, sales revenue includes afreight component. Expenses incurred by the Sugar Board represented approximately 10.2 per centof revenue from the 1990 season.
Payments to mills from the two pools have been made according to different schedules (seeAppendix D). Prior to 1990, millers received considerably higher initial advances and earlierprogress payments for Pool 1 sugar than for Pool 2 sugar. However, following the acceptance ofrecommendations made by the 1989 Committee of Inquiry, the differences are now lesspronounced, but still significant. The initial advance to mills for Pool 2 sugar was set at 70 per centof the initial advance paid to mills for Pool 1 sugar. Subsequent payments for both Pool 1 and Pool2 are at the discretion of the Corporation. The slower payment schedule for Pool 2 returns in 1990and 1991 meant that the differential between the two pools was, in effect, somewhat greater than 12per cent. The timing of progressive payments to producers for the 1989 and 1990 seasons is shownin Appendix D. The Corporation has decided that, for the 1992 season, the timing of interim andsubsequent advance payments will be the same for all producers and that the 12 per centdifferential will apply to all payments.
STATUTORYMARKETING OFQUEENSLAND SUGAR
69
6.5 Bulk sugar terminals
Most raw sugar produced in Queensland is delivered to a bulk terminal for shipment to exportmarkets or to domestic refineries. There are seven bulk sugar terminals in Queensland.2
Bulk sugar terminals fulfil two functions: the bulk storage of raw sugar and the loading of rawsugar on to ships for delivery to local refineries and export markets. Limited storage capacity isavailable at the mills themselves.
6.5.1 Ownership and administration
The sugar export terminals are nominally owned by the Harbour Boards. The Queensland SugarCorporation holds a lease over the land on which the terminals are built, and is responsible for themanagement of the terminals.
Under the agency agreement with the Corporation, CSR is responsible for the overall managementand co-ordination of the day-to-day activities of the bulk sugar terminals. Each terminal has a localorganisation to handle operations. A central administration co-ordinates the functions of the localorganisations.
In submissions to the 1990 Sugar Industry Working Party, the Sugar Board expressed concernabout the ownership structure of bulk sugar terminals. It said that this had caused difficulties withrespect to maintenance, insurance and structural alterations. The Commission understands thatconsideration was given to transferring the ownership of bulk sugar terminals from the HarbourBoards to the new Corporation, but that the matter was not resolved before the new Sugar IndustryAct was finalised.
6.5.2 Terminal costs and payments
In 1989-90, the operating cost (net of capital charges) of bulk terminals varied considerably, withmost ranging from $2.60 per tonne to $4.51 a tonne.3 Operating costs were significantly higher inBrisbane, at $8.57 per tonne. This cost was, in part, the result of a major loss in throughputpreviously obtained from New South Wales. The total operating cost of the bulk sugar terminals in1989-90 was $11.7 million.
2 Bulk sugar terminals are located at Cairns, Mourilyan, Lucinda, Townsville, Mackay, Bundaberg andBrisbane.3 Bulk Sugar Terminal Organisations, Annual Report, 1989-90, p. 12.
THE AUSTRALIANSUGAR INDUSTRY
70
The utilisation of terminals varies considerably. The South Johnstone Mill stated that the storagecapacity to throughput ratio at its regional terminal - Mourilyan - is relatively low at 0.47.4 At theother extreme, the corresponding rate for the Brisbane terminal is around 0.9. The average is 0.65.
Expenditure on maintenance and new capital items is financed by the Sugar Corporation out ofsugar sale proceeds. Since 1974, major items of capital expenditure have included the constructionof the jetty at the Lucinda terminal, which was built at a cost of $56.8 million, and the Brisbanebulk sugar terminal.
Considerable capital investment is tied up in the bulk sugar terminals. The book value of theterminals is some $213 million, ranging from $64 million for the Lucinda terminal to $6 million forthe Mourilyan terminal.5 The total value of all the terminals would be considerably greater if itwas based on current replacement cost.
6.5.3 Transport allowances
The Corporation requires mills to deliver to specified terminals as part of its acquisitionarrangements. Most mills pay the total transport cost to the terminal. However, a system oftransport allowances operates for some mills. This was introduced when the bulk terminals wereconstructed over the period 1956 to 1964. Allowances were designed to compensate for higherdelivery costs following a decision to deliver to a terminal other than the one the mill previouslyused. The Sugar Industry Working Party Report of 1985 recommended that these allowances bephased out, with mills bearing the full cost of raw sugar transport to terminals. Thisrecommendation was not adopted. The Report of the 1990 Sugar Industry Working Party statedthat ‘any attempt to change the allowances is contrary to the goodwill that was intended’.
The Queensland Sugar Corporation said that the distribution of costs and benefits resulting fromthe conversion to bulk handling are likely to be different now than when the bulk terminals wereconstructed. The Sugar Corporation has not attempted to measure the impacts of these charges andlevies. However, the Corporation acknowledges that they may impact on the overall economicefficiency of the industry. Under the Sugar Industry Act 1991, the Queensland Sugar Corporationis required, within two years, to review the rules and procedures relating to the calculation and thedistribution of returns to mill owners and cane growers. The Commission understands that thereview will include an assessment of transport allowances.
4 This indicates that the volume shipped is slightly more than twice the storage capacity.5 The Sugar Board, Annual Report, 1989-90, p. 27, states that the value applied to bulk terminal leases isequivalent to the historical cost of assets currently leased from port authorities.

STATUTORYMARKETING OFQUEENSLAND SUGAR
71
6.6 The Commission’s assessment
As there is only one marketer of raw sugar produced in Queensland, it is difficult to assess theefficiency of the existing statutory marketing arrangements. However, while little empiricalevidence was presented, most industry participants considered that the arrangements providesubstantial benefits for the industry. In support of this view, participants identified a variety ofadvantages said to result from the present arrangements. The following section examines thesematters: firstly in relation to issues identified by the QSI and, subsequently, in relation to otheraspects of the marketing arrangements raised by other participants.
6.6.1 The Corporation’s marketing services package
In its submission to the draft report hearing, the Queensland Sugar Corporation agreed that it haslittle influence over world prices:
The Queensland Sugar Corporation accepts the notion put by the Industry Commission, ABARE and others that ithas limited influence over the world price for sugar.
However, the Corporation, CSR and some other participants contend that the sole sellerarrangement has permitted the development of a comprehensive ‘marketing services package’ forQueensland sugar. In its submission to the initial hearings, the QSI stated that the major elementsof the marketing services package are:
• management and control of raw sugar quality;
• long term sales contract arrangements, often with government supported central buyingagencies;
• management and control of logistics, particularly through the bulk sugar terminal facilitiesoperated under the auspices of the Sugar Board/Corporation;
• economies of size; and
• product promotion and market development programmes for Queensland sugar.
It is claimed that the package results in Queensland sugar being of a consistently high quality andbeing accompanied by similarly high service levels (eg sugar is delivered in a timely and reliablefashion). High product quality and service levels are said to rely to a significant extent on theCorporation's ability to co-ordinate the activity of the industry throughout Queensland: forexample, to source sugar from a range of regions so as to guarantee supply even if some areas areaffected by bad weather, and to elect to ship from one of a number of ports so as to minimiseloading and shipping costs.
According to the Corporation, these features - high product quality and service levels - provide `ahigh level of product differentiation for Queensland raw sugar'. As a result, the Corporation statedthat:

THE AUSTRALIANSUGAR INDUSTRY
72
... Queensland is the preferred supplier of raw sugar in all of its markets. This has enabled the Corporation toattract significant premiums to the world price on its sales of raw sugar.
Following the draft report hearing, the Commission met with representatives of the Corporationand CSR to consider a confidential paper which seeks to evaluate the value (ie the premium)attributable to the marketing services package. Such assessments necessarily involve comparingreturns achieved for Queensland raw sugar with those attained by other exporting nations.However, given that there is only limited information available about other countries’ exportingactivities, it is virtually impossible to obtain and validate information to ensure that thecomparisons are valid. For example, to meaningfully compare returns for Queensland sugar withshipments by other exporting countries, information is required about differences in: the quality ofsugar (eg the polarisation levels and the fine grain and starch content); the volume of sales; thetiming of sales; the freight and delivery arrangements; the financial arrangements (eg terms andtiming of payments); and the level of support services provided (eg technical assistance andadvice). In the absence of information of this nature, it is not possible to demonstrate whetherQueensland sugar is, or is not, sold at a premium on world markets.
Even if it could be shown that Queensland sugar is sold at a premium, that in itself would notsupport the maintenance of the present statutory marketing arrangements. To justify sucharrangements, it is necessary to demonstrate that advantages stemming from the currentarrangements are dependent on there being only one seller of Queensland sugar. In other words,the net return achieved by the Corporation is higher than that which would be achieved if therewere multiple sellers of Queensland sugar. The likelihood that the elements of the Corporation’smarketing service package would lead to this outcome are considered below.
Management and control of raw sugar quality
Queensland sugar is recognised as being of high quality relative to sugar produced in many othercountries. However, there is a cost associated with producing sugar of a high standard.Consequently, a strategy of marketing sugar of a high quality must attain commensurately higherprices to compensate for the additional costs incurred. If, as it is claimed, returns to growers aremaximised by selling sugar of a high quality, there would seem to be no reason why the sametechnical standards could not be observed, and similar quality levels attained, if there were morethan one seller of Queensland sugar.
The present arrangements permit the Corporation to manage sugar stocks from all regions so as tocompensate for any deficiencies that may be associated with sugar produced in any single region orto meet particular customers’ requirements. The same flexibility could obviously not exist if sugarwere sold by some millers, as well as the Corporation. However, as milling activity is mainly
STATUTORYMARKETING OFQUEENSLAND SUGAR
73
conducted by a small number of companies that each own a number of mills, there would still beconsiderable flexibility to accommodate variations in quality. On the other hand, commercialtraders in sugar may have greater flexibility than the Sugar Corporation. They would be able toutilise sugar sourced from other countries to help match sugar characteristics with customers’requirements.
Long term contract and government-to-government sales
The QSI stated that:
The Sugar Corporation has been able to arrange a number of long term sales contracts for Queensland raw sugar.A significant number of these arrangements are with government buying agencies. Even where they are not, thestanding of the seller as a Queensland Government statutory authority is an important factor in facilitating thearrangement.
The size and status of the Queensland Sugar Corporation may facilitate the negotiation of long termcontracts. However, there is no reason to believe that such activity is the sole preserve of statutorymarketing arrangements, or that such sales require compulsory acquisition powers. A number ofAustralian mills are significant suppliers in their own right. Mills owned by CSR supply 34 percent of Queensland’s raw sugar and have well established international marketing links.Bundaberg, which supplies 20 per cent of Queensland’s raw sugar, also has international linksthrough its new parent company - Tate and Lyle. Mackay sugar produces 17 per cent ofQueensland sugar. All would be sufficiently large to supply any of the contracts currently suppliedby the Corporation, and two are well known to overseas buyers.
Some buyers - including overseas government purchasing agencies - may prefer to conductbusiness with a government body rather than a private trader. However, this would only be aproblem if the Sugar Corporation ceased to trade in sugar. If it continued to trade, in competitionwith private traders, any perceived advantage associated in government-to-government dealingswould be maintained.
This is not to deny that the nature of long term contracts, and the willingness of a statutoryauthority to enter into them, would change if compulsory acquisition were abolished. If long termcontracts were entered into in the absence of compulsory acquisition, the Corporation (or any othertrader) may need to negotiate long term supply contracts with local mills. The mills in turn mayneed to negotiate supply and price agreements with growers reflecting the more stable prices andassured sales inherent in long term contracts. However, if long term contracts offer benefits thatsuppliers desire, growers and millers would presumably be willing to enter into such agreements.
Logistical control of bulk shipping terminals
The Corporation contended that the bulk sugar terminals operated under its auspices are‘universally accepted as the most efficient in the world’. It stated that the resultant benefits thataccrue to the industry include: lower storage and handling costs; shorter loading times; an enhancedreputation with customers; and the ability to sell on either a c&f or a cif basis.
THE AUSTRALIANSUGAR INDUSTRY
74
The Commission can see no reason why there would be any decrease in the efficiency of bulksugar terminals or in the options available for the export of sugar if the sole seller arrangementwere terminated. It considers that these benefits would be preserved, irrespective of the number ofsellers. Indeed, the Commission considers that the implementation of its recommendations on thefuture ownership of the bulk terminals (see section 6.7.3) would increase the efficiency of terminaloperations.
Economies of size
Some economies of size (and scope) are likely to be available in the marketing of raw sugar. Inaddition, there are likely to be some economies of size in bulk handling and shipping. However, itis not clear that these economies are only available at a Queensland-wide level. Indeed, it is likelythat economies of bulk handling and shipping are available at a regional level. This is reflected inthe distribution of seven bulk sugar terminals along the Queensland coast.
Substantial economies of size in storage and marketing would normally lead to the development oflarger commercial structures, which would offer lower prices or better services to attract customers,in order to benefit from the economies available. Acquisition is not necessary to generate suchgains. Statutory marketing arrangements encompassing powers of acquisition inhibit thedevelopment of these commercial structures. Indeed, they force the industry into ‘large scale’marketing where smaller organisations may be more effective. Under the present arrangements,the industry is not in a position to assess whether an alternative structure would be superior.
Although it considers that there could be some significant adjustment costs in the short term, thisoutcome was acknowledged by the QSI:
Theoretically, allowing competition in exporting raw sugar would not prevent the achievement of economies ofsize. In the long term, as the export segment of the market adjusted to its most efficient structure, the smallerfirms would not survive with the lowest cost service being provided by the remaining operators.
Given the changed ownership arrangements proposed for bulk shipping terminals (see section6.7.3), and sufficient notice of change, the Commission can see no reason why significantadjustment cost would be incurred in the short term.
It is also claimed that economies of size enable the Corporation to employ risk managementmechanisms (ie futures, options and swaps) which ‘would not be commercially justified by smallermarketing firms’. If this is the case, it should provide the Corporation with a competitive edge overpotential rivals. However, given the size of Australian production and the likelihood of alternativetraders in Queensland sugar being involved in trade of other commodities, and possibly sugar of

STATUTORYMARKETING OFQUEENSLAND SUGAR
75
other origins, the likelihood of alternative marketers of Australian sugar not being able to exercise arange of risk management options is small. Moreover, the abolition of compulsory acquisitionwould allow individual producers the opportunity to employ financial market instruments tomanage their own risks. Participants stated that the present marketing arrangements allow littlescope for this to occur.
Promotion and market development
The Commission agrees with the QSI that promotion and market development is mostappropriately undertaken as a co-ordinated industry activity. If this does not occur there is alwaysthe possibility of ‘free-riding’ with a generic commodity like sugar. This can arise because of thehomogeneous nature of sugar: it is difficult to promote (say) Mackay sugar without simultaneouslypromoting sugar grown in neighbouring regions. In these circumstances, individual producers maybe reluctant to engage in promotion and market development activities unless they receivecompensation for the benefits received by producers who do not contribute to promotion activities.At the industry level, this can result in less being expended on promotion and market developmentthan is efficient.
At present, the sole seller arrangements eliminate the possibility of free-rider problems. However,it is not essential to have such arrangements to ensure that appropriate levels of promotion andmarket development are undertaken. Such expenditure can be financed by compulsory levies on allproducers. This is currently the case in a number of other rural industries (eg wool and beef).Although there would be a need for the funds to be expended or distributed by a statutory body, thecollection of the levy would not require the maintenance of the present statutory marketingarrangement or compulsory acquisition.
Summary
The Commission does not believe it is possible to establish empirically whether or not theQueensland Sugar Corporation’s marketing services package compensates the industry for the extracosts it imposes and enables the Corporation to ‘attract significant premiums to the world price onits sales of raw sugar’. However, even if this is the case, the Commission considers that theadvantages bestowed by the marketing services package would remain if there were no longercompulsory acquisition and the Corporation was no longer the sole seller of Queensland raw sugar.If this were to occur, those producers who value the Corporation’s marketing strategies couldcontinue to have their sugar marketed by the Corporation and continue to enjoy the benefits thatmight entail. At the same time, those producers who believe they can increase their returns bymarketing their sugar themselves, or by selling to other marketing bodies, would be free to do so.

THE AUSTRALIANSUGAR INDUSTRY
76
6.6.2 Other reasons for statutory marketing
Participants identified a range of other benefits not directly associated with the Corporation’smarketing services package which they claimed are associated with the existing statutory marketingarrangements. These relate to:
• price premiums;
• countervailing market power;
• maintenance of minimum quality standards;
• stabilisation of returns; and
• the provision of assistance.
Price premiums
A number of participants (eg the Herbert River District Growers) claimed that the centralisedcontrol of exports made possible by the present marketing arrangements permits the Corporation toextract `price premiums' from some export markets.
If Australia were in a position to influence world sugar prices, it might be possible to extract a pricepremium by limiting supplies, or the number of suppliers of sugar, to some export markets. Thebenefits, in the form of higher world sugar prices would, of course, be available also to suppliersfrom other countries. However, Australia's share of the world sugar trade is small and, as aconsequence, Australia is commonly regarded as a price taker on international markets. In thisregard, an ABARE study by Sturgiss et al6 stated that:
... the long term reaction of world price to changes in Australian sugar production would be small ... In the longrun, a 1 per cent rise in Australia’s exports is estimated to lead to a decline in the world price of between 0.13 and0.27 per cent ... Australia should be regarded as unable to influence world prices to its advantage.
In its submission to this current inquiry, ABARE commented:
For all practical purposes, Australia cannot control supply onto world markets to its advantage. It thereforeseems unlikely that premiums could be extracted from overseas buyers on a sustainable basis ...
Some industry participants shared this view. For example, Bundaberg Sugar Company noted that:
There is no evidence that the industry, despite the single seller arrangements, is anything other than a price takeron world markets. Nor is any substantial price premium evident. The benefits that accrue seem to be in the areaof securing outlets through service and operating efficiency, and the ability to contract long term supply in someinstances.
6 Sturgiss R., Connell P., and Tobler P., ‘Australia’s influence on world sugar prices’, Agriculture andResources Quarterly 2(1), 47-55, 1990.

STATUTORYMARKETING OFQUEENSLAND SUGAR
77
As noted above, the Queensland Sugar Corporation agrees that it has little ability to influenceworld prices. However, this is not to say that the Corporation would be unable to obtain a pricecommensurate with the quality of sugar it sells, the services it delivers and guarantees which maybe associated with export sales. If the quality, services and guarantees are superior to those ofcompetitors, this would presumably be reflected in higher prices. But such higher prices cannot beattributed to the Corporation’s single seller status - they are a reflection of product quality and/orsale conditions.
In certain cases, Australia has been provided with restricted access to particular overseas markets inwhich prices are supported by the protection policies of the countries concerned. A currentexample is the US quota market which recently has accounted for about 4ÿ per cent of Australia'sraw sugar exports. The US quota is allocated by the US embassy each year. As the sole exportagent of the Queensland Sugar Corporation, CSR has been the only company to receive thecertificates of eligibility allocated by the embassy. However, any actual or potential Australianexporter of sugar is free to apply for part or all of this quota. Whoever receives the quota, or ashare of the quota, is in a position to gain any premium available. Premiums which may beavailable in such markets are not a consequence of Queensland's statutory marketing arrangements.They simply reflect the fact that the quota must be supplied from Australian sources.
In the domestic market the situation is different. A single domestic seller is able to extract a pricemargin above the export price because of the freight costs of importing raw sugar and the tariff.The difference between export and duty paid import prices is significant. The Commission hasestimated the domestic price to be some 38 to 46 per cent higher than average export returns -equivalent to $110 to $125 million in 1989-90. However, this benefit is extracted from othersectors of the Australian community and is a transfer rather than a creation of wealth.
Countervailing market power
Many participants consider that the statutory marketing arrangements allow the Corporation tocounter the market power of traders (including sugar producers themselves) and other buyers ofQueensland sugar. According to the QSI:
The world sugar market is dominated by a few large and powerful trade houses. Furthermore the domesticmarket for raw sugar is heavily concentrated on the buying side. The existence of compulsory acquisition andstatutory marketing arrangements ensures that the single seller structure is effective.
Similarly, CSR said that:

THE AUSTRALIANSUGAR INDUSTRY
78
The single seller arrangement is demonstrably effective in raw sugar export markets. The merits of a single sellerin negotiating international commodity trade arrangements are becoming recognisable especially when there arerelatively few buyers, as in the case of raw sugar (sub. No. 9 attach. p. 9).
However, the international sugar market is highly developed, with traders well informed on rulingprices throughout the world. In addition, there is a well developed futures market operating forsugar. In this situation, there would seem to be little scope for Australian suppliers to be‘manipulated’ by large international concerns in relation to price. Also, Australian supplies areunlikely to be marketed by a large number of small ‘vulnerable’ companies. Over 70 per cent ofQueensland’s raw sugar production is undertaken by three organisations, two of which (CSR andTate and Lyle) are directly involved in the international marketing of sugar.
The situation on the domestic market is more complex. Participants’ concerns centred on thebuying power of CSR - the country’s major refiner. For example, the Proserpine Cooperative SugarMilling Association Ltd believes that, if a single body were not in control of sales on the domesticmarket, then the ‘big players’ in the industry would take all of the higher priced sales and leave thesmaller and independent sugar manufacturers with the lower priced export sales. (sub. No. 5 p. 3)
The scope for a large refiner or other large domestic buyer to use market power to the detriment ofsellers of raw sugar is, however, limited. If compulsory acquisition was removed to allow multiplesellers of raw sugar on the domestic market, the present price margin would be competed downuntil returns from domestic and export sales were broadly similar. In these circumstances, therewould be little scope for refiners to force prices down since domestic mills would always beprepared to divert sugar from the domestic to the export market.
Maintenance of minimum quality standards
In an environment characterised by multiple sellers, shipments of poor quality sugar could diminishthe international reputation that Australia has established as a supplier. The underlying premise isthat raw sugar is seen in the world market as generically Australian, rather than as the supply ofindividual mills or traders. However, as such action would jeopardise the seller’s prospects ofnegotiating further sales, there would be a strong incentive to avoid this and other forms of‘opportunistic’ behaviour. If damage to Australia’s reputation were to occur because of the actionsof a few sellers, more direct means of regulating minimum quality standards would be preferable tocompulsory acquisition.
Stabilisation of returns
The Sugar Corporation noted that price stabilisation is not a primary objective of its marketingstrategy. Nevertheless, a degree of stabilisation of returns to individual producers is achieved as aresult of the Corporation’s pattern of sales, its long term contract arrangements, its commodity andcurrency hedging operations, and the pooling system.

STATUTORYMARKETING OFQUEENSLAND SUGAR
79
Many producers prefer the stability and security which they consider are provided by a statutorymarketing organisation. In these circumstances, if use of a statutory marketing agency werevoluntary, it would continue to attract a significant share of sales. There seems to be no reasonwhy it would be necessary to maintain compulsory acquisition so that all industry output has to bemarketed by the statutory authority and those who do not seek such stability and security are forcedto join those who do.
Provision of assistance
Because the Australian sugar industry is predominantly export oriented, domestic prices would, inthe absence of compulsory acquisition or some other statutory support of domestic prices, tendtowards export prices, irrespective of the level of tariff. Thus, the current statutory marketingarrangements enable the industry to maximise the benefits provided by tariff assistance. However,if assistance were considered justified, there are other ways of providing it (eg by means of abounty) which would provide the same level of benefits to the industry, but which do not requirecompulsory acquisition and sole seller arrangements.
6.6.3 Major shortcomings with present marketing arrangements
Major shortcomings of the existing statutory marketing arrangement include:
• the pooling mechanism;
• the lack of flexibility inherent in the arrangements; and
• import parity pricing.
Pooling arrangements
Prior to the introduction of the current 12 per cent fixed margin between Pool 1 and Pool 2 sugar,prices in the two pools reflected the actual average prices received in different classes of markets.In most years, the Pool 1 price was higher than the Pool 2 price.
One objective of separately identifying the returns was to prevent marginal (or additional)production decisions being influenced by higher returns from other markets. Efficient decisions onwhether to produce in excess of peak should be based on the return received from sales of theadditional output.
The present arrangements `lock in' a fixed difference between pool returns, even though the actualdifference in returns is constantly changing. For example, the additional margin on the domesticmarket is declining as tariffs are reduced. Consequently, in periods of high `spot' prices, returns atthe margin may well be higher than those under long term contracts. But, under the new
THE AUSTRALIANSUGAR INDUSTRY
80
arrangements, the Pool 2 price will always be lower. Thus, output would not expand appropriately,even if world prices are high. In periods of low ‘spot’ prices, the reverse could apply. The Pool 2price could overstate actual returns, encouraging more production at a time when output wouldnormally fall. Consequently, the current fixed differential between the pools can lead to perverseoutcomes.
To the extent that the pooling of revenue disguises quality or other differences between growers ormills (other than differences in ccs which are currently accounted for), inappropriate decisionsabout location and the quality of sugar produced may result. For example, regions which producethe highest quality of sugar are not appropriately rewarded, nor are initiatives by any individualmill to improve quality. Indeed, under the pooling arrangement there is no incentive for a mill todifferentiate or improve its product, even if this would increase actual market returns.
Under the current system, millers meet all costs from the farm gate up to and including delivery tothe bulk terminal (apart from some transport allowances discussed in section 6.5.3). Costs withinand beyond the bulk terminal are pooled across all raw sugar acquired by the Corporation,irrespective of different costs for the storage, handling and marketing of sugar from differentlocations in Queensland. The biggest cost item is freight and insurance.
Costs of transport to markets vary between the different milling regions in Queensland. Forexample, Cairns has a freight advantage to South East Asia and Japan. Bundaberg has a freightadvantage in supplying the domestic market. Freight differences to more distant markets, such asthe USA and Europe, are probably less significant. In addition, bulk terminal operating costs varybetween ports.
The pooling of these costs disadvantages regions which are best placed to service the markets inwhich Australian sugar is, or could be, sold. It encourages over-production in areas less well suitedfor servicing sugar markets although, to date, such effects have been to some extent offset by theconstraint imposed on output levels by the assignment system. In a less regulated system, thepooling of costs could have a significant adverse effect on industry efficiency.
Lack of flexibility
The statutory marketing arrangements lock all participants into a prescribed set of practices. Thereis little or no incentive or opportunity to conduct business in more innovative ways. Millers areprevented from selling raw sugar or from negotiating with buyers. Growers and millers cannot takeadvantage of futures contracts and other financial instruments.
The present arrangements mean that competitive pressures are constrained. There is no competitoragainst which the Corporation has to compete. In the absence of competition, the pressure toensure that returns are maximised and costs minimised is reduced.

STATUTORYMARKETING OFQUEENSLAND SUGAR
81
Import parity pricing
Domestic prices of products which are predominantly exported usually reflect export prices.However, the compulsory acquisition arrangements applying in Queensland result in there beingonly one seller of sugar produced in Queensland. In these circumstances, the raw sugar industry isable to price domestic sales of raw sugar at import parity plus the available tariff protection. Whilethis is of benefit to the raw sugar industry, it is at the expense of users - in particular, refiningactivity.
Import parity pricing has the effect of making Australia less attractive as a location for sugarrefining. The Corporation makes rebates available for export products using significant quantitiesof sugar. Presumably, such rebates could also apply to exports of refined sugar. However, underthe Corporation’s current rebate policy, the rebates would compensate only for the price increaseattributable to the tariff (ie they would not compensate for freight costs). Under this arrangement,potential refiners pay higher prices than they would under a competitive domestic market. Asdiscussed in Chapter 10, some consider that Australia could forego significant growth opportunitiesif it does not develop an export oriented refining sector.
Domestic prices of refined sugar also correspond broadly to duty paid import parity prices. Thisdisadvantages consumers and other Australian industries which must purchase sugar at higherprices. The Sugar Users Group Australia (SUGA)7 stated that:
Because of a combination of Queensland and Commonwealth Government policies, members of SUGA havepaid at least $100 per tonne above free trade prices for their refined sugar over the last two years.
6.6.4 Summary
Many features of the sugar marketing arrangements in Queensland shield growers and millers frommarket forces. The compulsory acquisition and control of domestic and export sales of Queenslandraw sugar by the Corporation limit the ability of growers and millers to seek out new markets andto ensure that the most appropriate range of commercial marketing services is provided. Theyforce domestic prices towards import parity and penalise users. By removing the potential forcompetition, they also reduce the incentive to ensure that marketing costs are minimised. There isnot the same pressure for change and innovation as exists in most other industries.
7 The Sugar Users Group - Australia, comprises the Australian Soft Drink Association Ltd and the ConfectioneryManufacturers of Australasia Ltd.
THE AUSTRALIANSUGAR INDUSTRY
82
Pooling of revenues and costs is not based on competitive commercial considerations. It distortsthe incentives to produce what the market requires, and to minimise the costs of sugar productionand distribution. The fixed 12 per cent differential between pools provides minimal benefit (in theorder of a 1 per cent increase in returns) to contributors to Pool 1, but significantly penalises Pool 2contributors. In effect, it is a tax on new producers and on exports.
In the Commission’s view, few of the benefits attributable to compulsory acquisition and the otherstatutory marketing arrangements depend on the existence of such regulatory mechanisms. In theirabsence, the Sugar Corporation could continue to be a major marketer of Queensland sugar. Thoseelements which are collectively represented as its ‘marketing services package’ could bemaintained. Those benefits attributed to the package would be little affected by the presence ofother sellers. As Australia does not appear to be able to influence the world sugar price to itsadvantage, additional sellers would not adversely affect export returns. Australia’s regional millinggroups would be capable of independently marketing sugar without being at the mercy of largebuyers. Indeed, given the wide knowledge of international sugar prices, it is difficult to see howany seller could be seriously exploited by buyers.
Queensland benefits from compulsory acquisition and statutory marketing arrangements to theextent that it can extract higher prices on the tariff protected domestic market. However, thepractice of pricing raw sugar at import parity may have discouraged the development of refiningcapacity and other value-added activities in Queensland and elsewhere in Australia. Theproduction controls and the 12ÿper cent payment differential associated with the statutorymarketing arrangements have undoubtedly limited the size of the industry and impaired theefficiency of one of the State's largest industries. The Commission considers that these factorsoutweigh by a considerable margin the benefits (principally higher domestic prices) which thepresent marketing arrangements bestow on the State of Queensland. From a national perspective,the additional margin on domestic sales penalises all domestic users.
6.7 Proposals for change
Under the current regulated marketing arrangements, Australia has been successful in selling all ofits raw sugar. Sales are for cash and, in some years, supplies have had to be rationed because ofraw sugar shortages.
However, it is pertinent to ask whether Australia could have done better if there had been noacquisition or mandatory single seller of Queensland's sugar. In other words, could raw sugar havebeen marketed at a lower cost? Could higher returns have been attained, especially in periodswhen supplies have had to be rationed? Would multiple sellers find new markets for Australiansugar? Are opportunities missed by restricting marketing activity to the high quality end of the

STATUTORYMARKETING OFQUEENSLAND SUGAR
83
market and by applying the 12 per cent pool differential so as to effectively tax new production?Are there opportunities to increase returns by offering sales on credit terms and by selling on an fobbasis, rather than selling exclusively for cash on a cif or c&f basis?
The Commission considers that Australia would benefit if the sugar marketing arrangements weremodified so as to provide producers with a range of different marketing options. This wouldinvolve removing the sole seller status of the Sugar Corporation and permitting competition inmarketing. In turn, this would facilitate the use of a greater range of marketing strategies; allow andencourage innovation; and promote the development of an industry in which Australia has a clearnatural advantage. To this end, the Commission has considered what might be an appropriate longterm objective and the need, if any, for short to medium term strategies to facilitate adjustment to aless regulated set of marketing arrangements.
6.7.1 Long term objective
In the longer term, there appear to be no compelling reasons to retain the Sugar Corporation’scompulsory acquisition powers. Their removal would require changes to State legislation. Asthere is no Commonwealth Government impediment which restricts trade in sugar, this wouldallow any organisation (or individual) to participate in sugar marketing activities.
Terminating the present arrangements could still leave a role for the Corporation. Its retentionwould capitalise on its established marketing expertise and the goodwill that it has developed as thesole marketer of Queensland raw sugar. The need to fulfil existing contractual obligations mayalso provide grounds for retaining the Corporation, at least in the short term. In the longer term,the Corporation could remain as a trader and continue to operate a seasonal pool and/or sell sugaron commission. Those who value the security and/or services provided by the Corporation couldcontinue to deal with it. Its powers would, however, differ markedly from those currently existing.Marketing through the Corporation would be voluntary and the Corporation would compete on anequal footing with private traders on both domestic and export markets.
While the Corporation could continue to oversee industry promotional campaigns, facilitate thedissemination of information and assist in co-ordinating industry-wide activities (eg the collectionof industry levies for research), this could lead to conflicts of interest. Consequently, it would bepreferable for these tasks to be undertaken by an independent body with no direct interest in thetrading of raw or refined sugar.
The termination of the existing marketing arrangements would introduce significantly greatercompetition into the domestic market. Consequently, even if the tariff on raw sugar remained, anyhigher prices extracted from domestic sales which depend upon centralised selling would becompeted away.
THE AUSTRALIANSUGAR INDUSTRY
84
As sugar could be purchased or sold by any miller, trading organisation (including thoserepresenting grower interests) or user, millers would have a considerably wider array of marketingoptions than currently exists. Millers would be able to negotiate with a number of potential buyersand consider a range of selling options. For example, they could sell directly to traders or largeusers and receive cash on delivery; they could elect to store sugar and sell later in the season if theyjudged prices would be more favourable; they could pursue forward selling options, such asentering into contracts to supply sugar to users at specified times in the future; and they could‘hedge’ using futures contracts. Some mills could elect to expand into refinery activities as hasoccurred in the New South Wales industry.
If growers were prepared to manage their own risk in marketing raw sugar, they could seek to havecane milled on a ‘toll’ basis - retaining ownership of the raw sugar. Similar arrangements forcontract ginning operate in the cotton industry. In this way, growers would be able to undertaketheir own hedging operations.
There would need to be agreements between growers, or groups of growers, and mills aboutsupplies, the scheduling of deliveries, and the price of cane. The high level of mutual dependencebetween growers and millers could be reflected in the emergence of new co-operative ventures.
Private traders in sugar would obviously seek to generate profits. However, this does notnecessarily imply that growers would be worse off. Traders could make profits and, at the sametime, growers could also achieve higher returns. This could reflect traders’ ability to profit fromarbitrating and through their involvement in freight and currency markets, and/or an ability tomarket sugar at lower cost than the Corporation. Moreover, mills would only sell to private tradersif they offered higher returns than those expected from selling to the Corporation, or higher returnsthan those available from direct sales by mills to users.
The increased competition would ultimately allow growers and millers to choose between anincreased range of marketing options. Competition in the supply of services to growers wouldincrease the incentive for suppliers to contain costs. This would not only advantage growers, butwould also benefit users and consumers.
One consequence of a more market based selling regime would be the emergence of opportunitiesto sell without pooling. While some pooling of revenue and costs could continue to be practised bythe Corporation or by private traders and mills, increased competitive pressures would mean thatpool returns would have to reflect more closely actual market returns. As a result, greatervariations in per unit returns to mills would emerge, reflecting differences in transport costs andsugar quality. Premiums or discounts would reflect quality differentials. This would provide anincentive for individual mills to vary quality so as to best meet market requirements. While somemills may be disadvantaged compared with the current system, prices would more accuratelyreflect variations in costs between regions and would provide more accurate signals for productionand investment decisions.

STATUTORYMARKETING OFQUEENSLAND SUGAR
85
If compulsory acquisition and the single seller arrangements were to be terminated, the ‘ownership’of the premium US quota would need to be resolved. Currently the US embassy issues certificatesof eligibility to CSR as the sole Australian exporter. However, under a deregulated marketingsystem, any mill or sugar trader could apply to the US embassy for all or part of the quota allocatedto Australia, and it may be necessary to consider formal arrangements to allocate this quotaamongst Australian suppliers. The mechanism for this would be through the Commonwealthissuing export licenses for all or part of the quota each year. The allocation of export licencescould take a number of forms. These include:
• granting the sole right to supply such markets to particular Australian suppliers;
• reserving such markets for the Corporation; and
• auctioning the right to supply such markets.
The first two options would result in the premiums from the US quota being appropriated byparticular suppliers, either the Corporation or other suppliers who had been granted the right tosupply. However, the benefits of the quota should be available to the whole sugar industry. Thiswould lead to the consideration of the third option, where the premiums would be clearly identifiedunder an auctioning or tender system, and the gains would be available for distribution to the wholesugar industry. The revenue raised could be used to fund projects expected to benefit the industryas a whole (eg some research projects), or could be distributed among all industry participants.Alternatively, the revenue could be retained by the Commonwealth Government.
6.7.2 Transitional arrangements
Two matters lead to a consideration of transitional arrangements. The first is the existence of longterm contracts. The second is the time it may take for some mills (particularly some of the smallerindependent mills) to investigate independent marketing options and to establish marketingnetworks for their own sugar. To address these matters, the Commission recommends that theCorporation be given only limited powers of compulsory acquisition over the transition period.
The Commission proposes that the Corporation retain the right to acquire sufficient raw sugar (on apro-rata basis from all mills in Queensland8) to enable it to fulfil long term contracts existing at thetime that the transition period commences. As the Commission's proposals could not beimplemented until the 1993 season, and given that most long term contracts run for 3 to 4 years,
8 In practice, this would probably involve an arrangement whereby all mills are compensated on a pro-ratabasis for the returns achieved on contract sales, but sugar is physically sourced from only some mills so as tominimise transport costs or to achieve the specified mix of quality characteristics.
THE AUSTRALIANSUGAR INDUSTRY
86
the transition period for acquisition would remain until the end of the 1997 season. Any new orrenegotiated long term contracts entered into by the Corporation during the transitional periodwould be on the basis of raw sugar supply agreements with mills. Acquisition would not be anoption in relation to such contracts.
Mills would be free to market independently all raw sugar in excess of that acquired for existinglong term contracts. As some mills may not be confident about their ability to market significantquantities of raw sugar in the short term, they would retain the option of continuing to deliver sugarto the Corporation for sale. As mills became more confident and developed their marketingnetworks, the amount of sugar delivered to the Corporation would decline, unless the Corporationcould offer better terms than could be obtained from private traders or direct mill sales.
It is likely that the first market entered by mills on an independent basis would be the domesticmarket. Returns might initially be higher than those available on the export market, and it is likelythat marketing would be easier. However, competition between independent sellers on the domesticmarket would mean that, in time, returns from domestic sales would be driven towards thoseobtainable from exports, irrespective of any tariff on raw sugar, except for such premiums thatcould be obtained from marketing services and locational advantages. On the other hand, ifassistance were provided by alternative means (eg a bounty), higher returns to producers could bemaintained on domestic sales, even though domestic prices would decline to around export levels.The level and form of assistance afforded the sugar industry is discussed in Chapter 7.
6.7.3 Changes to pooling arrangements and the ownership of infrastructure
The Commission considers that the pooling arrangements and the ownership and administration ofinfrastructure need to be modified, even if there are no changes to the present acquisition powers orproduction controls.
Pooling arrangements
The pooling of sugar revenues and associated costs and the 12ÿ per cent margin in favour of peakentitlements can distort production and investment decisions and reduce incentives to innovate andprovide services at minimum cost.
These deleterious effects arise largely because of the level of aggregation at which revenues andcosts are pooled. Disaggregating revenues and costs further would ensure that growers' returnsreflect more accurately the market value of sugar delivered to the Corporation. The Commissiondoes not have sufficient information on which to make a judgement about how the Corporation'scosts should best be aggregated or disaggregated between mills. However, it is possible to makesome judgement about the pooling of revenue.

STATUTORYMARKETING OFQUEENSLAND SUGAR
87
It would be only a coincidence if the current fixed 12 per cent margin reflected the differencebetween the returns from marginal exports and all other sales. Consequently, it is a poor indicatoron which to base production decisions. The Commission considers that, to the extent thatsignificantly different prices continue to be received from premium and reasonably assured marketscompared with marginal sales, these differences should be reflected in the returns to mills andgrowers. In this respect, the pricing system operating before the introduction of the fixed 12 percent margin was more efficient than the current system. Maintaining the 12 per cent margin wouldrepresent a significant tax on new entrants and on expanded production.
As assistance is reduced, the administrative costs of operating two prices may exceed any benefitfrom reflecting small price differences back to producers. On this basis, the Commission considersthat one pool and one price would be appropriate.
Bulk sugar terminals
The main items of infrastructure shared across the industry are the bulk sugar terminals along theQueensland coast. Currently, these terminals are owned by Harbour Boards and operated by theSugar Corporation.
The existing 12 per cent price differential between the two sugar pools, which was instigatedfollowing a 1989 Inquiry, is in part justified within the industry as a means of providing a return tothe established growers who have mainly financed the construction of the terminals. However, thelink between the pool price margin and contributions to infrastructure is tenuous. The 12 per centmargin is based on an historical average of the previous Pool 1 and Pool 2 prices. These poolprices were based on actual prices received for sugar sold in different markets, and did not containany component to allow for the relative contribution to the industry’s infrastructure from the twopools.
The Commission considers that it is undesirable to link returns for sugar to past contributions toinfrastructure. It would be better to separate ownership and payments for infrastructure from thepooling operations of the Corporation. This would clearly separate both equity in the bulkterminals, and returns on that equity, from the payment for sugar to mills and cane to growers.
The Commission considers that the bulk terminals should be operated on a commercial basis, atarms’ length from the growing and milling sectors of the industry. The use of infrastructure wouldbe on a user pays basis, with any profit from the sale of infrastructure services being paid as adividend to equity holders. As sugar producers, both past and present, have paid for theconstruction of the terminals, ownership could reside with them. As both users and shareholders,producers should have a strong interest in ensuring that the terminals are operated efficiently.
A single terminal company to operate all seven terminals may be administratively simple.However, this would encourage the maintenance of ‘network’ pricing, whereby users in each region

THE AUSTRALIANSUGAR INDUSTRY
88
pay charges based on the average cost incurred by all terminals. It would be more efficient if portcharges reflected the actual cost incurred in shipping from each regional port. The formation ofseparate terminal companies would allow this to occur. It would also mean that investmentdecisions would be based on the financial viability of individual ports, and would not be influencedby cross-subsidies between ports. The prospect of direct competition developing between ports,albeit small, to attract supplies from adjacent regions , would also be stifled if a single terminalcompany were formed. Nonetheless, to the extent that terminal costs influence producers’ ability tomarket sugar, there will be pressure for each port to minimise its costs. For these reasons, theCommission considers that terminals should be established as seven separate companies.
In its draft report, the Commission suggested that equity in the terminals could be allocated on thebasis of peak entitlements. This would be administratively simple but, as CSR pointed out, theterminals have also been funded by Pool 2 contributors. This clearly needs to be recognised whendetermining ownership. As the determination of ownership shares will require detailed industryinformation, the Commission considers that this issue would best be determined by an industrycommittee under the auspices of the Sugar Corporation. In recognition of their contribution toterminal infrastructure, the committee should include representatives of holders of peakentitlements, other growers (including representatives of the New South Wales industry) andmillers.
The capital value of terminals varies considerably, and growers from all regions have contributedto all terminals. Consequently, the Commission considers that those entitled to shares shouldinitially be allocated shares in each of the seven terminal companies. Shareholders would be ableto trade freely in the shares of the terminals, with their value set by the marketplace on the basis ofthe capital assets of the terminal company and its profitability. It is possible that share tradingwould result in each bulk terminal ultimately being predominantly owned by producers served bythe port. Closer identification of individual ports with the regions they serve would increase thediscipline on terminal authorities to manage efficiently and critically appraise new investmentdecisions.
The value of shares allocated to individual growers would vary but, on the basis of the historicalcost of terminal assets, the average value per grower would be about $25 000, assuming that theassets are divided between growers and millers on a two thirds - one third basis. On the samebasis, the value to mills would range from around $1 million for the smallest mill up toapproximately $5 million for the largest.
As direct competition between bulk sugar terminals is likely to be small, each terminal would havesignificant market power. To the extent that ownership of terminals resides with local producers,the likelihood that market power would be used to raise prices and/or restrict access may bereduced. Nevertheless, the Commission considers that, to guard against anti-competitive practices
STATUTORYMARKETING OFQUEENSLAND SUGAR
89
and monopoly pricing, the operations of the terminals would need to be subject to scrutiny by theTrade Practices Commission and the Prices Surveillance Authority. Consideration could also begiven to imposing a ‘common user’ requirement on terminals. This would require each terminal toprovide access to all users on a non-discriminatory basis.
The issue of transport allowances referred to in section 6.5.3 would be resolved if compulsoryacquisition were abolished. Mills would be free to use the terminal or alternative transport of theirchoice, at their own cost. If compulsory acquisition were to remain, it is not clear whether thecurrent allowances are justified. The allowances may have compensated for real cost increases formills when they were introduced. However, it is unlikely that the industry would revert to theprevious transport arrangements now that raw sugar is transported in bulk. The Commissionsupports proposals that the transport allowances be reviewed by the Sugar Corporation. Thereview should be undertaken as soon as possible.
COMMONWEALTHGOVERNMENTASSISTANCE
91
7 COMMONWEALTH GOVERNMENT
ASSISTANCE
When the embargo on imports of sugar was abolished in 1989, assistance was provided by theCommonwealth Government in the form of tariffs on imports of raw and refined sugar. Tariffprotection is being phased down under a program announced in 1989 and modified in 1991. Theterms of reference for this inquiry ask the Commission to inquire into, and report on, "theappropriate form and level of tariffs on imported sugar to apply from 1 July 1992." A relatedmatter, which participants see as linked to the question of tariff assistance, concerns the anti-dumping measures which are available to the industry. This chapter discusses both of these issues.
7.1 Tariffs
7.1.1 Recent changes in the tariff
In the May 1988 Economic Statement, the Government announced its intention to replace the longstanding sugar import embargo with ad valorem tariffs on raw and refined sugar1. This was part ofa decision to reduce industry protection across-the-board. The Government proposed ad valoremtariffs of 35 per cent on raw sugar and 25 per cent on refined sugar, both phasing to 15 per cent bymid-1992.
The sugar industry objected to the Government’s proposal arguing that ad valorem tariffs wereunsuitable because the world price of sugar was volatile, and ad valorem tariffs would provide leastprotection for the industry when the price is lowest and when the industry is most vulnerable toimport competition. Following industry requests and a report by a Senate Select Committee2, theGovernment modified its tariff proposal and implemented a specific tariff on imports of both rawand refined sugar of $115 per tonne for two years reducing to $95 per tonne from 1 July 1991; andto $70 per tonne from 1 July 1992 less, in all instances, 5 per cent ad valorem for imports fromdeveloping countries3.
In the March 1991 Economic Statement, the Government announced a reduction in tariffs, from thescheduled $95 per tonne at 1 July 1991 to $76 per tonne, and from $70 per tonne at 1 July 1992 to$55 per tonne. At the then current world sugar prices and exchange rates, the proposed specific
1 Economic Statement (May 1988) delivered by the (then) Treasurer P.J. Keating.2 Assistance for the Sugar Industry, report by the Senate Standing Committee on Industry, Science and
Technology, May 1989, p 60.3 The Minister of Primary Industries and Energy, Media Release, May 1989.

THE AUSTRALIANSUGAR INDUSTRY
92
rates would equate to ad valorem tariffs of about 28 and 21 per cent respectively. This is a greaterlevel of assistance than is given to most other agricultural industries.
7.1.2 Assistance provided by the tariff
The Commission uses two summary measures of assistance to estimate the effects of Governmentintervention on industry. These are the nominal rate of assistance and the effective rate ofassistance.
The nominal rate measures the level of assistance provided to an industry’s products. It is thepercentage by which producer returns are increased by assistance, relative to the situation of noassistance. The effective rate is a measure of the net level of assistance provided to an industry. Ittakes account of the taxing effect of assistance on inputs as well as the beneficial effects ofassistance to outputs. More precisely, it is the percentage by which returns to value-adding factors(land, labour and capital) are increased relative to the situation of no assistance.
The Commission usually uses estimates of effective rates as an indicator of the incentives forresources to be drawn into an industry compared with other industries in Australia. However,because the production of cane, and thus the level of resources in the Queensland industry, isdirectly controlled by the assignment system, measured effective rates of assistance are of limiteduse for this purpose. Consequently, the impact of both tariffs and the regulatory system has beeninvestigated using a general equilibrium model of the Australian economy. The results of thegeneral equilibrium work are presented in Chapter 11.
Details of the Commission’s estimates of nominal and effective rates of assistance for the sugarindustry are included in ‘Assistance to the Australian Sugar Industry’, a background paper preparedfor the Commission’s workshop on modelling held in Brisbane on 17 September 1991.4 Copies ofthis paper are available on request. The following section provides a summary of the Commission’sestimates of domestic price distortions and nominal rates resulting from tariffs and the sugarmarketing arrangements in Australia.
Raw Sugar
As a result of the statutory marketing arrangements for Queensland sugar and tariff protection,substantially higher unit returns are achieved from domestic sales of raw sugar than are obtainedfrom export sales. In the absence of the statutory marketing arrangements, and with competitionbetween domestic millers, arbitrage between the domestic and export markets would normallyresult in domestic unit returns being similar to export unit returns, other things being equal.
4 Industry Commission, Australian Sugar Industry Inquiry, Assistance to the Australian Sugar Industry,Background Paper No. 3, prepared for the Workshop on Modelling, 17 September 1991.
COMMONWEALTHGOVERNMENTASSISTANCE
93
Based on the tariffs applying to imports from developing countries, the Commission has estimatedthe difference between the domestic price and the export price - the ‘domestic price distortion’ - tobe about 38 per cent in 1989-90. Based on the currently announced reductions in tariffs andconstant sugar prices, the domestic price distortion is estimated to fall to around 23 per cent by 1July 1992 .
The 38 per cent higher prices received from the domestic market increased returns overall by some9 per cent in 1989-90. This nominal rate of assistance of 9 per cent in 1989-90 is estimated to fallto about 5 per cent by 1 July 1992.
Refined Sugar
The domestic market for refined sugars has been supplied almost exclusively from local productionwith only minimal quantities being either imported or exported. Because of this, the Commissionhas assumed that the refined sugar industry is an import competing industry. On this basis,estimates of domestic price distortions are based solely on the level of the protective tariff - acomparison with import prices - rather than by comparison with export prices as was the case forraw sugar.
Estimates of domestic price distortions for refined sugar based on the levels of duties ondeveloping country imports are 13 per cent from 1 July 1989 and 4 per cent from 1 July 1992.
7.2 Participants’ views
7.2.1 Tariffs
Most participants from the sugar industry argued for the continuation of tariffs on imported sugar.Some requested temporary assistance to support the industry in the face of drought and low worldprices. On the other hand, sugar users were critical of the tariff and the costs it imposes ondomestic sugar using industries.
The Queensland raw sugar industry (QSI) said that the tariff on raw sugar helps overcome several‘market failures’, particularly the lack of micro-economic reform elsewhere in the Australianeconomy, and counteracts ‘corrupt’ world prices. As a result, it contended that the costs of thetariff to the economy as a whole are very low compared with the benefits it provides, particularly toregional economies. The QSI pointed to inefficiencies in domestic input markets which imposemajor costs on the sugar industry. One example given was inefficient coastal shipping practiceswhich, according to the QSI, reduce the competitiveness of the Australian industry compared withThailand, the most likely competitor on the Australian market.

THE AUSTRALIANSUGAR INDUSTRY
94
In a similar vein, the Australian Cane Farmers Association (ACFA) suggested that tariffs beadjusted only after the EC and USA make and complete substantial changes in their tariff policies,and after such changes have an impact on world sugar prices.
The QSI also argued that tariffs should be retained to compensate for perceived shortcomings in theexisting anti-dumping provisions. It sees the tariff as an interim arrangement to reduce thepotential for the dumping of sugar onto the Australian market until Australia’s anti-dumping lawsare streamlined and made more effective for rural industries.
The QSI said ad valorem tariffs do not provide the type of assistance required, in that they provideassistance which is inverse to the industry’s needs. The QSI proposed a sliding scale tariff so that,as world prices improve, the level of tariff protection would fall. It suggested that a tariff of $95per tonne be applied if world prices fell to US8 cents a pound or lower, reducing to zero if pricesare US12 cents a pound or higher.
Following the publication of the draft report, the Queensland Sugar Corporation said that analternative to the tariff proposal could be assistance by way of bounty. It suggested a bounty at therate of $22 per tonne on the production of raw sugar, and that the bounty be reduced if the pace ofmicroeconomic reform accelerates or there are further reductions in distortions in the world sugarmarket. The Commission estimates that this bounty would cost some $80 million per annum.
In contrast to the QSI, Bundaberg Sugar, which has interests in cane growing, milling and refining,did not see tariff assistance as particularly important. It said that, as domestic consumptionrepresents only about 20 per cent of Australian sugar production, domestic tariff protection is ofminor significance and should be maintained only at a level consistent with that generally applyingwithin the nation.
CSR made the following comments:
The Queensland raw sugar industry claims to be, and is, one of the most efficient in the world. On that basis it isdifficult to justify automatic tariff protection for all sales of raw sugar to the domestic market. In the same light,it is difficult to agree with the proposition that because most, or all, other industries [sugar industries overseas]have some form of protection for their domestic market, Australia should too. (sub 9, p28)
Both Bundaberg Sugar and CSR said that there is a need for temporary/emergency assistance forparts of the industry to remain viable at times of very low world prices. In these circumstances,CSR believes assistance should be provided in a way that does not penalise refiners. CSRproposed 5 years of government support that was repayable in times of higher prices.
Users of sugar opposed tariff assistance. The Sugar Users Group Australia (SUGA), was critical ofthe impact that tariffs on imported sugar have on the competitiveness of major users of sugar inAustralia. It said that:
...because of a combination of Queensland and Commonwealth Government policies, members ofSUGA have paid at least $100 per tonne above free trade prices for their refined sugar over the lasttwo years.
COMMONWEALTHGOVERNMENTASSISTANCE
95
SUGA further stated that:
In the absence of a raw sugar statutory marketing monopolist in Queensland, and given the existence of TradePractices provisions outlawing price rigging amongst rival mills, it is unlikely that any of the margins aboveexport parity currently enjoyed on Queensland raw sugar would be commercially obtainable.
and that:
Commonwealth imposed duties help to uphold the Queensland legislation by ‘raising the stakes’ for the statutorysugar monopoly enjoyed by the Sugar Corporation.
SUGA also said that, because the sugar tariffs are specific in nature rather than ad valorem, theirproportionate burden is greatest at times when relatively low world sugar prices are encouragingthe expansion of world trade in competitive sugar-based products. SUGA requested the immediateand complete removal of import duties on raw and refined sugar. It suggested that, if theCommonwealth is to assist the sugar industry, whether for income support or some other reason, itshould employ direct subsidies or other means which do not increase the costs of sugar users.
ABARE commented that tariff policy is not the appropriate policy instrument for supporting orstabilising industry income or assisting industry adjustment. It said that, if government assistancefor income support or industry adjustment can be justified, then the policy instruments would needto allow for targeted assistance to be provided on an individual farm, mill or regional basis.ABARE noted that, at the farm level, the Rural Adjustment Scheme is available for this policyobjective.
7.2.2 Anti-dumping procedures
Many participants referred to anti-dumping measures in the context of protecting Australian sugarproducers from imports of sugar at low or ‘corrupt’ prices. Most expressed concern about thecomplexity of Australia’s anti-dumping arrangements, the procedural delays before dumping dutiesor securities could be imposed, and the difficulty in proving ‘material injury’.
THE AUSTRALIANSUGAR INDUSTRY
96
Australia’s anti-dumping legislation is based on the General Agreement on Tariffs and Trade(GATT) Anti-Dumping Code. Essentially, if imported goods are sold on the Australian marketbelow their ‘normal value’ in the country of export, they can be assessed as being dumped.5 Ifdumping is found to cause or threaten ‘material injury’ to an Australian industry, anti-dumpingaction may be taken. Though the GATT Code sets out the criteria which must be met before anti-dumping action can be taken, there is nothing in the GATT rules which requires action to be taken.CSR said that it has voiced its concerns over the anti-dumping procedures to a range of Senateinquiries. Its main concerns are that:
• the domestic industry is ill-equipped to counter dumping action because it does not have speedyaccess to import data;
• the procedures discriminate in favour of the importer against the local manufacturer in regard toprivacy and onus of proof; and
• the procedures are too lengthy (up to 12 months) to be of any real value.
CSR considers that cash securities should be placed on imports as soon as a prima facie case ofdumping is established.
The QSI said that Australia's anti-dumping legislation and its current administration provides littleprotection to an export oriented industry such as sugar. It also said that the existing legislation doesnot allow the initiation of dumping action by suppliers of inputs to a product competing with adumped product. However, this has been reviewed and the legislation has now been amended topermit such action. The QSI stated that long delays between presenting arguments againstdumping and the decision being made reduces the effectiveness of anti-dumping action. It alsoclaimed that it is almost impossible to establish a causal link between dumping and material injuryin an export oriented industry.
7.3 The Commission’s assessment
7.3.1 Tariffs
The provision of tariff assistance to an export oriented industry would normally provide littleassistance as competition between sellers would force domestic prices towards export parity.However, this is not the case in the sugar industry. As the Sugar Corporation is the dominantsupplier of raw sugar, it is able to set the domestic price of raw sugar at duty paid import parityprices. In a more competitive environment, this would not be possible.
5 The ‘normal value’ is generally defined as the price of like goods on the exporter’s home market.

COMMONWEALTHGOVERNMENTASSISTANCE
97
The benefit to growers and millers from higher prices on the domestic market resulting fromcompulsory acquisition by the Queensland Sugar Corporation and the tariff is estimated to havetotalled about $103 million per annum in 1989-90 and 1990-91, reducing to $51 million by 1992-93 with the Commonwealth Government’s planned reduction in tariff assistance. This benefit ismade up of two components. The first component (which is the same throughout the years 1989-90 to 1992-93) is an estimated $16 million derived from the ability to base domestic prices onimport rather than export prices. The remaining $87 million per annum in 1989-90 and 1990-91represents the increase over duty free import prices made possible by the tariff. This tariffcomponent will phase down to $35 million by 1992-93. To the extent that not all raw sugar is solddomestically at import parity prices which include the tariff, the estimates overstate the assistancereceived. For example, in 1989-90 the Sugar Board provided rebates equivalent to $2.7 million,and in 1990-91 rebates totalled $5.1 million.6
The benefit from Queensland’s statutory marketing arrangements and the tariff has a significantlydifferent impact on growers in Queensland and New South Wales. This is because all sales of NewSouth Wales sugar are to the domestic market compared with about 20 per cent of Queensland’ssugar sales. The difference between the export parity price and the duty free import parity price isestimated to represent about $1 300 per grower per year in Queensland, and $3 600 per grower peryear in New South Wales (under the assumption that growers receive 60 per cent of the assistanceavailable) in 1989-90.
The $55 per tonne tariff that will be introduced on 1 July 1992 is estimated to provide about $28million of assistance for the Queensland industry, equivalent to about $2 900 annually per grower.For New South Wales, assistance equivalent to around $7 million per annum would be provided.This represents approximately $8 000 per grower. These estimates are based on the DevelopingCountry tariff which the industry maintains is the relevant level of protection given the likely andactual source of sugar imports.
As some 80 per cent of Australia’s output is exported, the assistance provided by the tariff has littleimpact on average per unit returns for the industry as a whole. At the $115 per tonne tariff,assistance provided in the 1990 season was equivalent to about 6.5 per cent of total revenue fromsales of Australian raw sugar. This will decline to some 2 per cent of sales revenue when the tariffis reduced to the planned $55 per tonne on 1 July 1992 (assuming prices and production remain at1990 levels).
The arguments advanced by participants for the retention of tariffs on imports of sugar are not, inthe Commission’s view, sustainable. Tariffs are inappropriate as a means of overcoming marketfailures or the assistance policies adopted by other sugar producing countries, or to compensate forinefficiencies in domestic input markets.
6 Under the export rebate scheme, a rebate equivalent to the developing country tariff is given to refiners ofraw sugar to pass on to exporters of products incorporating sugar.

THE AUSTRALIANSUGAR INDUSTRY
98
As a small country operating independently in the world market, Australia must operate within theprices that currently exist, and adapt to those prices. In terms of the range of alternativeopportunities for Australian investment, it is largely immaterial why prices in the world market arethe way they are unless Australia has the opportunity to influence them. If they are low because ofnatural factors and/or market characteristics, or low because of massive subsidies, it makes littledifference to the choices facing Australia. Australia is better off to adjust to these prices rather thanattempt to deny them. Only if there is a likelihood that the observed prices are temporary, or thatAustralian policies could influence them, would there be a case for action. Even in this situation, ifthe prospects of long term viability exist once prices return to ‘normal’, the question arises as towhether the industry itself should not bear the costs associated with temporary downturns.
This is not to suggest that Australia should not continue to be vigorous in attempting to dismantlesubsidies in international trade. However, in doing so, it needs to be recognised that there is nocertainty that reform of sugar policies in other countries would benefit Australia. While thepolicies of other OECD countries clearly depress world prices, the policies of some developingcountries serve to increase world prices. For example, if Brazil were to abandon its heavilysubsidised ethanol program, the potentially large increase in sugar on world markets could negatethe favourable effects of change initiated by OECD countries (see Chapter 11).
The Commission accepts the view put forward by participants that the Australian sugar industry isinternationally competitive by world standards. It also has important linkages with domesticregional economies. However, in this respect, the sugar industry is not unique. Other exportoriented rural industries such as wool, wheat, beef and rice are also internationally competitive, andalso have important regional linkages. Significantly, none of these industries is a recipient of tariffassistance.
When evaluating the impact of tariffs, account must be taken of their effect on other industries,final consumers and the performance of the economy generally. This includes both the cost of thetariff to users and the higher cost resulting from the regulation of marketing. The Commission hasestimated that, in 1990-91, the tariff and marketing arrangements increased the domestic price ofraw sugar by about 40 per cent, equivalent to $100 million in that year. As a result of the alreadyannounced reductions in tariffs, this is estimated to decrease to 23 per cent on 1 July 1992,equivalent to $51 million per year.
According to some sugar users, tariffs have reduced their competitiveness on the domestic marketand inhibited their ability to compete on international markets. In addition to the tariff, users havecriticised the market dominance of CSR in the refining industry and the high refining cost structureresulting from the Queensland Sugar Corporation’s acquisition powers which allow it, as thedominant domestic supplier, to price raw sugar at import parity prices (including the tariff).
COMMONWEALTHGOVERNMENTASSISTANCE
99
In the absence of the Sugar Corporation’s acquisition powers, the price of raw sugar on thedomestic market would probably be close to export parity. If the tariff on refined sugar remained,this would, at least in the short term, significantly increase the margin for domestic refining as thedominance of CSR in refining would allow the continuation of refined sugar pricing at importparity prices (inclusive of the tariff). However, the increase in domestic refining margins couldencourage new entrants into refining for the domestic market. If this occurred, there would beincreased competition in the refining sector and downward pressure on refined sugar prices. Thedomestic refining industry is discussed in more detail in Chapter 10.
The sliding scale form of specific duties proposed by the QSI has the advantage of not penalisingrefiners when the international price of raw sugar is high. On the other hand, because themagnitude of the duty increases as prices fall, and because the duty is specific in value terms, it canprovide high assistance when prices are low. For example, at international prices of US8 cents perpound, the QSI estimates suggest that domestic prices would be 40 per cent higher thaninternational prices. This is a higher level of assistance than that afforded most other Australianindustry. Even if low prices persist for only a limited period, the cost imposed on sugar usingindustries could be substantial.
SUGA requested that, if assistance is provided, it should be in a form that does not increase the costto domestic users, some of whom are exporters or who compete against imports using sugarobtained at prices significantly lower than those available to local industry. Assistance whichwould not increase the cost to domestic users would involve the replacement of tariff assistancewith a subsidy on domestic market sales. On the basis of domestic sales of 900 000 tonnes and the$95 a tonne tariff suggested by the QSI, the cost of equivalent assistance provided by a subsidywould be about $85 million per annum. While this option would not penalise users, it would haveto be financed by taxpayers generally. As a consequence, other sectors of the community would beworse off. However, if providing assistance to the sugar industry is seen as being in the nationalinterest, assistance by way of subsidy could be viewed as a more equitable means of funding thatassistance.
The QSI said that assistance to the sugar industry should be provided to compensate for otherinefficiencies in the economy, and should only be reduced as microeconomic reform proceeds.However, if every sector of the economy were successful in deferring reform pending actionelsewhere, there is a danger the whole process of microeconomic reform would grind to a halt. Inthe Commission’s view, the most appropriate approach is to address the problems concurrently anddirectly. In this context, the Commission notes that governments have initiated some measures toimprove efficiency in other industries upon which the sugar industry relies, for example thewaterfront and rail transport. Nonetheless, progress in implementing reforms in some areas hasbeen slow, and there is a pressing need to increase the pace of change. This will assist the sugarindustry and encourage growth in the economy generally.
THE AUSTRALIANSUGAR INDUSTRY
100
Because of recent changes in the Queensland sugar industry’s regulatory environment, someparticipants argued that the industry needs more time to adjust, and more time to improveefficiency before reducing tariff assistance further. Equally, however, it can be argued that theindustry has been continually adjusting to new circumstances. If tariff changes were postponed, theadvent of further new circumstances could mean that change may never eventuate. Moreover,while tariffs remain on sugar, producers continue to receive inappropriate price signals on which tobase decisions on adjustment. This is frustrating the capacity of users to take advantage of theimproved competitiveness on both domestic and world markets which would result if tariffs wereremoved.
Protection against import competition has survived from a time when the industry waspredominantly selling domestically. However, the Australian sugar industry is nowoverwhelmingly export-oriented, with more than three-quarters of production being exported. Anyexpansion in output resulting from the increases in assignment required by the recent changes inQueensland legislation would further increase the industry’s dependence on export markets. Whilethe available assistance increases returns to growers, it is certainly not central to the survival of theindustry as a whole. The continuation of tariff assistance, however, provides an incentive tomaintain acquisition and statutory marketing in order to gain the domestic premium made availableby the tariff.
The Commission has been unable to identify any special characteristics of the Australian sugarindustry that would warrant a higher level of assistance than is provided to other industriesgenerally, and to other export oriented agricultural industries. The Government has clearly statedan objective of reducing assistance to all activities in Australia. Assistance for other industries isbeing progressively reduced to a ceiling of 5 per cent by 1996. In a statement to the CanegrowersConvention, the then Minister for Primary Industries and Energy, Mr. Kerin, announced that theGovernment is disposed to achieve reductions in assistance to the sugar industry over the longerterm in line with those for other industries.7
The Commission considers that, as with other export oriented rural industries, the sugar industryshould ultimately not provided with any tariff protection or other form of assistance against importcompetition.
Phased reduction in the tariff
In the draft report, the Commission proposed that the specific tariff rate be phased down on thebasis of the schedule outlined in Table 7.1 below. The proposed specific rate for 1996-97,equivalent to 5 per cent ad valorem, was based on a sugar price of US10 to 11 cents per pound, orabout A$300 per tonne.
7 Speech by the (then) Minister for Primary Industries and Energy, John Kerin, Canegrowers Convention,Brisbane, 1 May 1991.
COMMONWEALTHGOVERNMENTASSISTANCE
101
Table 7.1: Tariff rates proposed in the draft report to apply from 1 July of each year
General IndicativeRate DC Rate
Year ($/tonne) ($/tonne)a
1992 55 401993 45 301994 35 201995 25 101996 15 01997 5 01998 0 0
a The developing country preference would remain at the present level of 5 per cent of the customs value of imports over the phasingperiod. While the general tariff rate would remain constant within each 12 month period, the tariff applying to imports from DCsources would change from shipment to shipment depending on the value for duty of imports.
The tariff proposal, however, presents some problems when considered in conjunction with theCommission’s recommendation to remove compulsory acquisition. Once mills were free to marketraw sugar individually, there would be multiple sellers of raw sugar from Queensland.Competition between mills to supply the domestic market would then mean that raw sugar isunlikely to be sold domestically at prices significantly higher than export returns. While this isotherwise a desirable outcome, it would eliminate the cushioning effect that the progressivereduction in the raw sugar tariff was intended to have. The effect of moving in one step to exportpricing in the domestic market could be especially unsettling for the New South Wales industry. Inaddition, the removal of compulsory acquisition while the tariff on refined sugar remains, wouldresult in a windfall gain to refiners. This gain would reflect refiners’ ability to purchase raw sugarat export parity prices while, because of limited competition in the domestic refining industry in theshort term, continuing to sell refined sugar at import parity prices, inclusive of any tariff.
At the draft report hearing, CSR suggested that the problem of windfall gains for domestic refinerscould be overcome by the Queensland Sugar Corporation retaining compulsory acquisition powersover raw sugar destined for the domestic market during the period over which tariff assistance isphased out.
The Commission does not support the retention of compulsory acquisition for this purpose,primarily because it would continue to allow an efficient export oriented activity to use marketpower to maintain domestic prices at artificially high levels to the detriment of sugar users.

THE AUSTRALIANSUGAR INDUSTRY
102
Alternative transitional payment
To avoid the loss of transitional assistance and to avoid any windfall gain to refiners, theCommission considered replacing the tariff with a bounty. However, a traditional bounty based onactual sales of raw sugar to the domestic market over the years in which the bounty is paid, couldbe bid away by domestic suppliers as they sought market share in the higherreturn domesticmarket. This would present similar problems to those raised by the transitional tariff.
The Commission therefore recommends that the tariffs on raw and refined sugar be removed andreplaced by a one-off transitional payment. The transitional payment would be based on:
• an eligible tonnage based on past domestic production of raw sugar for the local market; and
• a payment per tonne based on an estimate of the capitalised value of the assistance that wouldhave been provided by the phased tariff outlined in Table 7.1.
No transitional payment or tariff would be provided to the production of refined sugar as thecurrent refined sugar tariff exists essentially to compensate for the higher costs imposed by tariffson the raw sugar input. These costs would be removed if assistance to raw sugar were provided bydirect payment instead of tariff.
The Commission recommends that the payment arrangements become operative as soon ascompulsory acquisition in Queensland is removed (other than that required to fulfil long termcontracts existing at the time that the transitional arrangements commence). In the interim, thetariff would continue, and be phased down on the basis of the schedule outlined in Table 7.1.
Calculation of the eligible tonnage for Queensland and New South Wales, the rate of payment pertonne, and the distribution of payment within each state are as follows.
Eligible tonnage for Queensland and New South Wales
The Commission recommends that the tonnage on which the payment be made be the averageannual tonnage of raw sugar supplied to domestic refiners from domestic production in Queenslandand New South Wales in the years 1989-90, 1990-91 and 1991-92. For New South Wales, thiswould represent about 180 000 tonnes, equivalent to total average production in New South Wales.For Queensland, the base tonnage would be about 690 000 tonnes, equivalent to about 20 per centof Queensland's average annual production in the period.
COMMONWEALTHGOVERNMENTASSISTANCE
103
Rate of payment per tonne
Representatives of the Australian sugar industry have consistently maintained that the relevantlevel of assistance provided by the tariff is the developing country rate because of the actual andpotential source of imports into the Australian market. Indeed, the sugar rebate offered by theSugar Corporation is based on the expected developing country tariff, rather than the higher generaltariff rate.
The Commission recommends that the rate of payment per tonne be set equivalent to thecapitalised value of the assistance per tonne that would have been provided by the phased tariff(outlined in Table 7.1) against imports from developing countries. The relevant tariff assistancewould be that remaining from the phased tariff at the time that compulsory acquisition ceases(other than that required to fulfil long-term contracts). That is, if acquisition ceased on 1 July 1993,the relevant tariff assistance would be that which would have been provided by the tariff in theyears 1993-94, 1994-95 and 1995-96. If acquisition ceased on 1 July 1994, the relevant tariffassistance would be that which would have been provided by the tariff in the years 1994-95 and1995-96.
The rate of payment per tonne would be reduced by an amount equivalent to the average proportionthat the value of export rebates, paid by the Queensland Sugar Board/Corporation, was ofassistance available in the years 1989-90, 1990-91 and 1991-92.
The following example of the calculation of the rate of payment is based on the cessation ofcompulsory acquisition on 1 July 1993. On the basis of an import price for raw sugar of $A300 pertonne, the tariff assistance against imports from developing countries would be $30 per tonne in1993-94, $20 in 1994-95 and $10 in 1995-96. When adjusted for the extent of export rebates,equivalent to, on average, $4 per tonne or 4.2 per cent of the assistance at the time, the assistanceper year is estimated to be $27.8 per tonne in 1993-94, $19.2 in 1994-95, and $9.6 in 1995-96. Thepresent value of this assistance, using a discount rate of 8 per cent, is estimated to be $53.8 pertonne of raw sugar. On the basis of the eligible tonnage in each state estimated earlier, thisamounts to a payment of $37.1 million to Queensland and $9.7 million to New South Wales - atotal cost to the Commonwealth of $46.8 million.
Payment of the transitional amount would be made initially to the Queensland Sugar Corporationand the New South Wales Milling Co-operative for distribution within each state on the followingbasis.
Distribution between mills
The distribution of payment between mills within Queensland would be on the basis of the sharethat the land assigned to each mill was of the total area of assignment in Queensland as at 6 March1992. Within New South Wales, the distribution between mills would be on the basis of the shareof production area entitlements associated with each mill as at 6 March 1992. However, as allmills in New South Wales are owned by the New South Wales Sugar Milling Co-operative, thedistribution of payment between mills in that state is not essential.

THE AUSTRALIANSUGAR INDUSTRY
104
Within Queensland, payment would be split between mills and growers in each mill area on thebasis of the average distribution of raw sugar revenues in the years 1989-90, 1990-91 and 1991-92.In New South Wales, the distribution would be on the basis of the New South Wales averagedistribution of revenue between the Co-operative and growers in the base years.
The distribution of the growers’ share of the payment between individual growers in each mill areain Queensland would be on the basis of each grower’s share of assignment in that mill area as at 6March 1992. The distribution of payments between growers in New South Wales would be on thebasis of each grower’s share of production area entitlements in New South Wales as at 6 March1992.
Cost of payments
The cost of providing assistance to the production of raw sugar for the domestic market by way ofdirect transitional payments is estimated to be $46.8 million if acquisition were to cease on 1 July1993. This cost would be born by the community generally through the tax system.
As well as continuing phased assistance to the industry, and reducing the potential windfall torefiners, direct payments would immediately reduce the cost that the tariff assistance available tothe sugar industry imposes on domestic users of sugar, including the food processing industry. Theavailability of direct payments would also remove the incentive to maintain compulsory acquisitionwhich is otherwise created by the availability of tariff assistance.
In summary, the Commission sees no compelling efficiency reasons for providing special long-term assistance arrangements for the sugar industry - an industry which is efficient and well suitedto Australia. The industry has demonstrated for nearly 70 years that it is competitive on worldmarkets. It is thus well placed to compete on the domestic market against imports. Furthermore,protection against import competition is an inappropriate instrument to address other industryconcerns, such as price instability and income fluctuations. The case for Government assistance tomeet stability objectives by other methods is discussed in Chapter 9.
7.3.2 Anti-dumping procedures
Since 1989, when the import embargo was lifted and tariffs were introduced on imported sugar,less than 1 per cent of domestic sugar needs has been imported. Consequently, the issue of anti-dumping has not arisen in the past. However, many participants stated that there is the potential forimports at dumped prices.

COMMONWEALTHGOVERNMENTASSISTANCE
105
About 25 per cent of world sugar consumption is internationally traded. In almost all majorproducing and exporting countries, including Australia, sugar is sold on the domestic market atprices which exceed export prices. This is a result of domestic prices being supported by tariffs,quotas, or other support mechanisms. Internationally, more than one-fifth of all trade is underpreferential or special arrangements. The rest is traded on the world market at prices which areoften as little as 30 per cent of the average price for sugar traded under preferential agreements.8 Assuch, in a technical sense, almost all sugar traded on international market can be, under the GATTcode9, regarded as "dumped".
In June 1991, the Government amended Part XVB of the Customs Act 1901 relating to anti-dumping provisions. The amendments provide for the calculation of a full dumping margin at thepreliminary finding stage of a dumping inquiry; anti-dumping remedies for primary producers inagricultural industries affected by dumping of imports of processed agricultural products; anddumping measures to apply for three years from the date on which each notice or undertaking ispublished. These amendments should address some of the participants’ criticisms of the anti-dumping arrangements, particularly procedural delays and flexibility.
In November 1990, the Senate referred certain aspects of the operations of the anti-dumping system
to the Senate Standing Committee on Industry, Science and Technology. In its report10, theCommittee recommended changes designed to result in ‘quicker, cheaper and easier anti-dumpingaction while still complying with the GATT’.
The Committee recommended that:
• the Government continue its efforts in the GATT negotiations to broaden the definition of`domestic industry' to provide for the producers of raw agricultural products to be consideredpart of the domestic industry for the purposes of anti-dumping actions involving processedproducts;
• to help with the assessment of material injury, the Australian Customs Service together with theAustralian Bureau of Agricultural and Resource Economics develop computer-based industrymodels which incorporate those economic factors unique to the relevant industry;
8 Hawaiian Sugar Planters’ Association, Hawaiian Sugar Manual 1990. The manual (page 23) states that:
For sugar traded under preferential or other type of trade agreements, the average price has beenaround 23 cents per pound. In contrast, sugar traded on the world market averaged just 6.8 cents perpound from 1983 to 1988.
9 Dumping is defined in Article 2, Paragraph 1 of the Gatt Anti-Dumping Code as the introduction of aproduct of one country "into the commerce of another country at less than its normal value, if the exportprice of the product exported from one country to another, is less than the comparable price, in the ordinarycourse of trade, for the like product when destined for consumption in the exporting country".
10 Inquiry into Australia’s Anti-Dumping and Countervailing Legislation, report by the Senate StandingCommittee on Industry, Science and Technology, June 1991.
THE AUSTRALIANSUGAR INDUSTRY
106
• legislation be amended to extend the sunset period from three to five years; and
• rather than requiring a complete re-testing of a case once the sunset provision takes effect, areview be conducted before the automatic termination of action, with the review limited to theissue of injury or the threat of injury.
The Committee noted that the change announced in the March 1991 Statement to broaden thedefinition of `industry' had yet to be clarified in regard to its consistency with GATT rules. TheGATT has typically adopted a narrow interpretation of the term `industry'. The Committeeregarded the amendment to Australia's legislation as ensuring that, to the maximum extent possibleunder the current GATT Codes, injury to Australian primary production caused by imports ofdumped or subsidised goods will be considered.
The Committee made a number of other recommendations aimed at streamlining the anti-dumpingprocess, reducing the cost to industry of pursuing an application, and requiring Customs to providemore direct assistance to industry in mounting a case.
In response to the Senate Standing Committee review, and a review conducted by the Departmentof Industry, Technology and Commerce and the Anti-Dumping Authority, a ministerial statementwas released on 5 December 199111. Major features of the ministerial statement included:
• the extension of the life of the Anti-Dumping Authority for eight years;
• a reduction in the time for the consideration of applications; and
• an extension in the life of anti-dumping and countervailing duties from three to five years.
The changes in the recent amendments to the Customs Act and those proposed by the SenateStanding Committee run counter to the recommendations contained in the Garnaut Report12 that`by the beginning of the twenty-first century, Australia should aim to join the small, high wage,international-oriented industrial economies of Europe by avoiding all "anti-dumping" measures andcourses of action'.
The Commission is unable see any grounds for the introduction of any special anti-dumpingarrangements for sugar and sugar products which are not available to any other industry.
11 The Minister for Industry, Technology and Commerce, Ministerial Statement, Senate, Daily Hansard, 5December 1991, pp. 4283-9.12 Garnaut, R 1989, Australia and the Northeast Asian Ascendancy, AGPS, Canberra.

THE NEW SOUTHWALES INDUSTRY
107
8 THE NEW SOUTH WALES INDUSTRY
Until 1989, the Queensland Government, through the Queensland Sugar Board, purchased all rawsugar produced in New South Wales and marketed that sugar with that of the Queensland industry.Following the expiry of the Commonwealth/Queensland Sugar Agreement, the New South Walessugar industry decided to discontinue the arrangements it had with Queensland and make its ownmarketing arrangements.
All sugar cane grown in New South Wales is now milled by the New South Wales Sugar MillingCo-operative (NSWSMC) to which all New South Wales sugar cane growers belong. The Co-operative was formed in 1978 to purchase the three local sugar mills from CSR. In 1989, theNSWSMC entered into a 50-50 partnership (Manildra Harwood Sugars) with the Manildra groupof companies to build and operate a refinery at Harwood, near Grafton. Raw sugar produced by theNSWSMC is now sold to Manildra Harwood Sugars. All refined sugar produced by the jointventure is currently sold on the domestic market. In contrast to Queensland, production andmarketing arrangements are not underpinned by State government legislation. In fact, the majorform of government intervention occurs at the Commonwealth rather than the State level, in theform of tariff protection against imported sugar.
8.1 Production
Cane is grown in New South Wales by about 550 growers in three mill areas, Condong,Broadwater and Harwood, located on three major rivers on the north New South Wales coast.Until 1989, production of sugar cane was controlled by land assignments which, by agreement,were administered by the QCSPB. Expansion of assignments were allocated on the same pro ratabasis as in Queensland.
Since the termination of the agreement with Queensland, much of the previous system oforganising the industry in New South Wales has been retained under a co-operative arrangement.Production of sugar cane is managed by a system of Production Area Entitlements (PAEs) whichare similar to the assignment areas operating in Queensland. However, expansion in New SouthWales is no longer constrained. As the capacity of the refinery exceeds current New South Walesraw sugar production, the New South Wales industry is encouraging growers, both existing andnew, to expand cane production over the next ten years by about 40 per cent. Prior to expansion,the agreement of the NSWSMC is required, as is a contribution to the nominal share capital in theCo-operative ($130 per hectare). This is based on the contribution by growers to finance the
THE AUSTRALIANSUGAR INDUSTRY
108
original purchase of the sugar mills from CSR in the late 1970s. The money is refundable over anumber years if a grower leaves the industry. Additional PAEs are available to both new andestablished growers and are transferable within the industry.
PAEs totalled about 30ÿ000 hectares in 1991, from which 15 500 hectares of cane were harvested.Some 1.45 million tonnes of sugar cane and about 175 500 tonnes of raw sugar were produced.This represented nearly 7 per cent of Australian production of raw sugar in 1991.
All cane in New South Wales is grown without irrigation. In fact, flood mitigation and drainage isa significant production cost. Because cane growth is slower in New South Wales compared withQueensland due to the cooler climate, approximately 65 per cent of the area of cane harvested in1991 was two-year cane (ie cane which has been allowed to grow for two years before beingharvested). The remainder of the cane harvested is one-year cane. Within New South Wales, two-year cane yields average about 110 tonnes per hectare, while the yield of one-year cane averages 60tonnes per hectare. By comparison, yields of one-year cane in non-irrigated areas in Queenslandusually average above 75 tonnes per hectare.
The area on which sugar cane can be economically grown in New South Wales is limited bytopography, distance from the closest mill, and the availability of frost-free land. Frost does notkill the cane, but burns the top shoots. This tends to cause the cane to stool and branch, making itdifficult to harvest. A significant amount of the existing land used for cane is on the flood plains ofthe northern rivers which are subject to frequent severe floods. Consequently, alternative uses forthis land is limited. Some land suitable for further expansion tends to be limited by the competitivepressure from other agricultural pursuits, such as dairying.
8.2 Harvesting
Cane in New South Wales is harvested after the cane is burnt to remove the trash. Green caneharvesting is not currently practised because of the relative low temperatures. The trash blanketresulting from green harvesting does not allow sufficient warming of the soil by the sun foroptimum ratoon regrowth.
Cane harvesting groups are mainly farmer co-operatives which jointly own harvesting equipmentand, in some situations, other specialised equipment infrequently used by individual growers. Inthe 1989 season (the latest year for which figures are available), a total of 36 harvesters operated.The average tonnage harvested per machine varied between each of the three mill areas – about49 000 tonnes per harvester for the Harwood mill area, 42 000 for Broadwater and 31 000 for theCondong mill area. This compares with an average of slightly less than 20 000 tonnes perharvester in Queensland although, in some mill districts, the figure is much higher.
THE NEW SOUTHWALES INDUSTRY
109
Unlike Queensland, there is no tramway system in New South Wales. Cane is delivered to mills byroad transport. The cost of transport to nearby pick-up points is met by individual growers.Transport costs from those points to the mills is met by the milling co-operative, that is, it is sharedamong growers. Provision exists for the milling co-operative to charge a transport fee for moredistant growers, but this has not been done to date and is not expected to be introduced in theforeseeable future as the Co-operative is actively encouraging the expansion of production. Wherethe cane is transported to mills by growers, the Co-operative provides transport rebates.
8.3 Grower payments and raw sugar returns
The NSWSMC enters into a 5 year contract (which is known as a Memorandum of Agreement)with cane growers. The price growers receive for sugar cane is largely determined by a formulasimilar to that used by local boards in Queensland.
Grower receipts for 1989 cane averaged about $29 per tonne. The potential for disputes over thedistribution of money between mills and growers, as occur in Queensland, is minimised by thegrowers’ co-operative ownership of mills. Timing of payments for sugar cane is largely determinedby the timing of receipts of sugar revenue. Also, as the raw sugar produced in New South Walesby the Co-operative is sold to the joint venture refinery, there are some savings in selling expenses,which are no doubt shared between the Co-operative and the joint venture. The price at which rawsugar produced by the NSWSMC is sold to the joint venture is determined through commercialnegotiation.
Growers share in the profits or losses incurred by the NSWSMC and profits or losses from the Co-operative’s share in the joint venture refinery.
Bundaberg and some grower organisations in Queensland expressed concern about the distributionof the benefits of tariff assistance between the Queensland raw sugar industry and the New SouthWales industry. For example, Bundaberg said:
Within the domestic market the Queensland single seller arrangement has allowed a ‘domestic premium’ aboveworld raw prices to be obtained. This situation is the result of the quite inappropriate circumstances which havearisen since the 1989 removal of the embargo on imports, application of a tariff and the decision by the NewSouth Wales industry to refine for the domestic market.
The net result is that New South Wales producers have been receiving 100% of the ‘benefits oftariff protection’ on their output while Queensland producers receive effectively only 15% onoutput. Clearly this situation is grossly improper and inefficient.
The New South Wales industry is clearly in a position to benefit from the existing tariff bydirecting all its raw sugar production onto the domestic market. The Queensland raw sugarindustry, because it is a major exporter, receives the benefit of tariff protection for only a smallshare of its raw sugar output. However, this is an inevitable result of the acquisition and single

THE AUSTRALIANSUGAR INDUSTRY
110
seller arrangements in Queensland and the substantial differences in the size of the industry in thetwo states. In the absence of acquisition in Queensland, it is likely that the domestic price wouldfall to something approaching export parity. Ultimately, this would mean that neither industrywould benefit by being able to sell sugar domestically at prices significantly higher than importparity.
8.4 Refining
The Manildra Harwood Sugars refinery has a capacity to refine 250 000 tonnes of sugar per year.It refines all of New South Wales’ raw sugar output and has purchased additional raw sugar fromthe Sugar Board. In 1990, purchases from the Sugar Board/Corporation amounted toapproximately 40 000 tonnes.
All refined sugar from the Harwood refinery is sold on the domestic market in competition withother domestic refiners and with any imported refined sugar. Manildra Harwood Sugars suppliesabout 25 per cent of the domestic market, the other domestic refiners have about 74 per cent of themarket, with imports supplying about 1 per cent. Manildra Harwood Sugars’ profits (losses) fromrefining and selling on the domestic market are shared between the joint venture partners.
CSR stated that, because the New South Wales industry is now vertically integrated, the NewSouth Wales refiner does not have to bear the costs of the tariff on locally produced raw sugar andcan undercut its competitors on the domestic market. However this is not clear. Even if there wereno joint venture in New South Wales, the NSWSMC would be in a position to sell all of its rawsugar production to other domestic refiners (namely CSR) or potential refiners at close to the dutypaid import parity price set by the Queensland Sugar Corporation. If the prices at which sugar issold (transferred) to the joint venture refinery by NSWSMC is less than duty paid import parity, theco-operative would expect to receive compensation in the form of its share in the profits (losses) inthe joint venture over the long term.
In Queensland the situation is different as there are competing interests - the Corporation and therefiners. In these circumstances, it is not unexpected that the Sugar Corporation would charge dutypaid import parity prices for raw sugar. Indeed, it is obliged by legislation to maximise returns togrowers from raw sugar sales. The only "inequity" would appear to arise as a result of theQueensland legislation which prevents CSR from integrating backwards so as to emulate thearrangements adopted in New South Wales.
8.5 Adjustment
The reductions in tariffs on raw and refined sugar which have previously been announced will havea greater impact on returns to the industry in New South Wales than in Queensland. This isbecause the industry in New South Wales sells all of its output on the domestic market, whereasonly 20 per cent of Queensland’s output is sold domestically. The Commission estimates that the

THE NEW SOUTHWALES INDUSTRY
111
already announced reductions in tariffs will reduce average assistance per grower in New SouthWales from $19 000 in 1989-90 to $8 000 per grower in 1992-93. This compares with a reductionfrom $7 000 to $2 900 per grower in Queensland over the same period.
The Commission has recommended the replacement of tariff assistance with a one-off payment tothe Australian sugar industry. This recommendation is, among other things, based on a recognitionthat competition on the domestic market following the removal of compulsory acquisition couldhave significantly undermined the phased tariff assistance proposed in the draft report, with apotentially greater impact on the New South Wales Industry (see Chapter 7). The recommendeddirect payment system is aimed at overcoming this problem.

INCOME AND PRICEINSTABILITY ANDRISK MANAGEMENT
113
9 INCOME AND PRICE INSTABILITY AND RISK
MANAGEMENT
9.1 Introduction
Income instability results from fluctuations in both yield and prices. Also, because few growershave alternative production options, there is little opportunity to reduce income fluctuations byaltering the activity mix on sugar cane farms. Sugar cane growing is a protracted biologicalprocess (1 to 2 years from planting to first harvest), dependent on the weather and subject to manynatural hazards such as floods, droughts, cyclones, frosts and the impacts of pests and diseases.Production in other major sugar producing countries can be similarly affected by seasonalconditions. Abrupt changes can therefore occur in the supply of sugar to world markets.
World sugar prices are very sensitive to small changes in supplies. The price volatility is normallyreflected in the freely traded sector of the world market which represents less than 20 per cent ofthat market. Thus, when world shortages and surpluses occur, they have a large impact on prices.In either case, there is little supply response within any single season. At the international level,some attempts have been made by both sugar suppliers and users to overcome supply and pricevariability by holding sugar stocks.
As about 80 per cent of Australia’s raw sugar production is exported, export prices for sugar are thedominant factor determining the gross returns Australian producers receive. Two important factorsinfluence export prices. First, international trade in sugar is only a small proportion of total worldproduction and consumption. Second, protection policies in major trading countries such as theEC, Japan and the US insulate both domestic consumers and producers in these countries fromchanges in world prices. Consequently, responses in these countries to changes in internationalprices are limited. This assigns most of the adjustment burden to the relatively small internationalmarket and causes the volume of world trade, and the prices at which it occurs, to fluctuatemarkedly. Self-sufficiency policies and production instability in other major countries, along withcycles in world economic activity, further amplify price fluctuations. Because of these factors,prices for sugar, levels of production and producer gross returns and incomes are volatile.
9.2 Price variations
About 30 per cent of Australia’s recent sugar exports have been sold on long term contracts (3 to 5years forward) where the prices have been more or less fixed for the term of the contracts. Theprices received under such contracts have tended to reflect long term trends in world sugar prices.
THE AUSTRALIANSUGAR INDUSTRY
114
A significant proportion of the remaining sugar exported has been sold to what are referred to bythe Sugar Corporation as ‘assured’ markets. The prices received for sugar sold on these markets arenormally negotiated on the basis of futures contracts. A futures price is not the market’s assessmentof what the price will be at the future time, but is the current valuation for sugar to be delivered atthat future time. This enables the pricing of sugar to be separated from physical selling. Anyremaining sugar is sold at prices negotiated on a shorter term outlook which reflect ‘spot’ prices.
It is understood that the Sugar Board/Corporation has not sold sugar on the ‘spot’ market1, but‘spot’ prices ultimately affect negotiated prices in long term contracts and the prices negotiated forother sugar export sales. Almost all sales have been negotiated in United States currency. Thus,the prevailing exchange rate is also an important determinant of export returns.
The year to year volatility in world raw sugar prices (New York No 11 Spot) is evident from theyearly average ‘spot’ price series presented in Figure 9.1. There also has been significant variationin ‘spot’ prices within years. For example, in the calendar year 1990, the ‘spot’ price over a fourmonth period rose from US12c/lb (about A$355/tonne2) to US17c/lb (A$500/tonne), and then fellto US10c/lb (A$295/tonne).
The Sugar Corporation stated that the aim of its marketing strategy is to maximise long termreturns rather than to stabilise them. But, although price stabilisation may not be a primaryobjective of its marketing strategy, a degree of stabilisation of returns to producers is achieved as aresult of its pattern of sales, the range of its markets serviced, its long term contract arrangements,its commodity and currency hedging operations, and its pooling arrangements.
Until 1989, the price of sugar on the domestic market was determined by formula and, accordingly,domestic sales receipts were predictable. Since then, however, the price received for sugar on thedomestic market has been determined largely by duty paid import parity prices. These reflect theprevailing world price of sugar, the tariff, the exchange rate and the cost of transporting sugar toAustralia. Consequently, the prices received for domestic sales are now more variable than theyhave been in the past.
In summary, the practice of selling a significant proportion of raw sugar exports at pricesdetermined well in advance of shipment, coupled with - until recently - a stable domestic pricingregime, has meant that prices received by millers and growers have been considerably less variablethan futures or ‘spot’ market prices.
Further, individual sugar producers have been insulated from price variability because a significantproportion of production has been sold under long term contracts and because all sugar receipts for
1 The ‘spot’ market is defined as the market for sugar ready for immediate shipment and delivery.2 Based on A$1=US75 cents.

INCOME AND PRICEINSTABILITY ANDRISK MANAGEMENT
115
each season’s sales have been pooled. Returns to mills and to growers have reflected averageprices received, less average selling costs over the season, rather than the price on the particularday that an individual’s output happens to be sold or priced. This has smoothed the effect of shortterm price fluctuations on individual returns. The price signal has still been present, but the shortterm volatility in prices is not evident.
One consequence of the pricing practices and pooling arrangements has been that, in some years,prices received by sugar producers have been less than the average ‘spot’ prices receivable onworld markets and, in other years, greater. Average real prices (in 1989-90 dollars) available on‘spot’ markets and the gross returns to Australian sugar producers between 1970-71 and 1990-91are presented in Figure 9.1.
Figure 9.1: Average world price (New York spot) and gross returns to Australian producersa
A$ per tonne (1989-90 dollars)
a Gross returns are shared between growers and mills according to the cane price formula.Source: Based on data from Queensland Sugar Board Annual Reports and data supplied by the Queensland Sugar Corporation.
As can be seen from the figure, returns to producers over the last two decades have trendeddownwards, and even with the smoothing effect resulting from the marketing and pooling
0
200
400
600
800
1000
1200
1400
1600
1800
1970-71 1975-76 1980-81 1985-86 1990-91
Year
A$/t
Average world price
Gross returns to producers
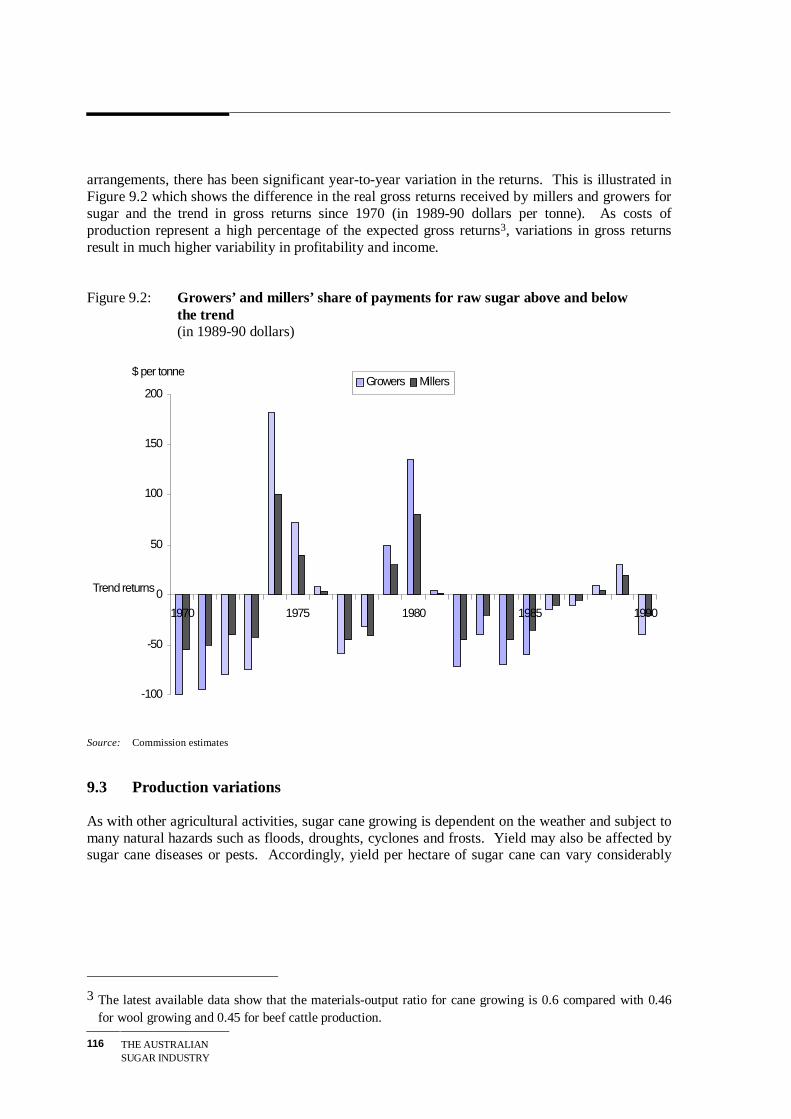
THE AUSTRALIANSUGAR INDUSTRY
116
arrangements, there has been significant year-to-year variation in the returns. This is illustrated inFigure 9.2 which shows the difference in the real gross returns received by millers and growers forsugar and the trend in gross returns since 1970 (in 1989-90 dollars per tonne). As costs ofproduction represent a high percentage of the expected gross returns3, variations in gross returnsresult in much higher variability in profitability and income.
Figure 9.2: Growers’ and millers’ share of payments for raw sugar above and below the trend(in 1989-90 dollars)
Source: Commission estimates
9.3 Production variations
As with other agricultural activities, sugar cane growing is dependent on the weather and subject tomany natural hazards such as floods, droughts, cyclones and frosts. Yield may also be affected bysugar cane diseases or pests. Accordingly, yield per hectare of sugar cane can vary considerably
3 The latest available data show that the materials-output ratio for cane growing is 0.6 compared with 0.46
for wool growing and 0.45 for beef cattle production.
-100
-50
0
50
100
150
200
1970 1975 1980 1985 1990
Trend returns
$ per tonneGrowers Millers

INCOME AND PRICEINSTABILITY ANDRISK MANAGEMENT
117
from year to year. Apart from the variation in yield, there are also considerable variations in thesugar content of cane. This is influenced by seasonal agronomic conditions. An indication ofvariations in yields and sugar content over the last 10 years can be gauged from Figure 9.3. Sugarcane yields and sugar content tend to be inversely related. Sugar content rises in dry seasons, butthis rise is insufficient to compensate for the effects of yield reduction. The sharp reduction inyield in the 1991 season compared with earlier seasons was due to the wide spread drought and theeffects of cyclone ‘Joy’.
Yield reducing factors can be specific to farms or can apply to whole areas. In many cases there islittle that individual cane growers can do about variations in yields caused by natural hazardsbeyond pursuing good management practices (both agronomic and financial) and taking theavailable precautionary measures.
Yields and sugar content may vary because of deliberate action by growers. In response to anexpected fall in price for cane, a grower may decide to reduce input costs. For example, a growermay choose to forgo the application of fertiliser when a net benefit is not apparent.
Figure 9.3: Average ccs and tonnes of cane per hectare: Queensland, 1980-1991
Source: Australian Sugar Yearbook, various issues and data supplied by the Australian Sugar Milling Council
12.00
12.50
13.00
13.50
14.00
14.50
15.00
1980 1981 1982 1983 1984 1985 1986 1987 1988 1989 1990 1991
Year
CCS
62
66
70
74
78
82
86
Tonnes/ Hectare
ccs
Tonnes /Hectare
THE AUSTRALIANSUGAR INDUSTRY
118
Variations in sugar production can also arise from variations in the area of land under cane.However, in the case of sugar, the assignment system ensures that there is relatively little year toyear variation in the area of land under cane.
The significance of variations in raw sugar production due to yield fluctuations differs from millarea to mill area. For example, in the Plane Creek mill area in the Mackay region, variations in rawsugar production from one year to the next over the last 10 years have been as much as 35 per cent.In other areas, such as the Invicta mill area in the Burdekin region, year to year variations inproduction have been less significant (about 10 per cent).
9.4 Variations in gross returns
The Commission has undertaken an analysis of variations in growers’ and millers’ gross returns perhectare - a proxy for income - from their trend values in the period 1980 to 1990. These variationsin gross returns reflect variations about trends in prices received for raw sugar, cane yields andsugar content.
The analysis revealed that, on a regional basis, when prices for sugar were high in 1980, grossreturns per hectare to growers were between $1450 and nearly $2000 (or nearly 45 per cent higherin 1989-90 dollars) above the trend value. In 1981, gross returns per hectare were around trendlevels. This was followed by six seasons where gross returns were less than the trend. Grossreturns in the 1988 and 1989 seasons were above the trend, but fell below the trend again in the1990 season. The gross returns to millers showed similar variations.
This instability of miller and grower incomes arose principally from the variability of sugar pricesreceived. Prior to 1989, these prices were stabilised to some extent by the administered domesticpricing arrangements. Variations of yields and sugar content appear to have been of lesserimportance, particularly at a regional level. This is not to deny that they may have been importantto some individual growers and to some particular mills. The low income expected by producers inQueensland for the 1991 season is largely a result of a sharp drop in yields caused by the adverseeffects of drought, followed by cyclone ‘Joy’, then severe drought again.
The Commission also carried out an analysis of the variability of average gross unit values of sugarand other Australian rural commodities for the period 1970-71 to 1989-90. The results4 revealed
4 The analysis involved calculating the conditional co-efficient of variation of the average gross unit returns
for the years 1970 to 1989 for a number of agricultural products. This parameter, which is defined as thestandard error of the estimates about a linear trend fitted by least squares, expressed as a percentage of themean, is an accepted measure of variation around a mean. The results were (in per cent): sugar - 22.4;barley - 18.4; wheat - 13.9; dried vine fruits - 16.8; apples - 7.6; pears - 9.5; wool - 24.8; milk - 13.99; andcattle and calves - 27.8.
INCOME AND PRICEINSTABILITY ANDRISK MANAGEMENT
119
that, while the unit gross returns for sugar were volatile, average unit gross returns for wool and forcattle and calves were even more so. However, as the ratio of farm costs to value of output forsugar cane is higher than for wool and beef cattle, the variability of net returns for sugar canerelative to those for wool and beef cattle resulting from variations in gross returns would be moresignificant.
9.5 Mechanisms for achieving stability
9.5.1 Revenue
Price risk management
The Sugar Board/Corporation, acting on behalf of growers and millers, has used sugar futures andexchange rate contracts for hedging and long term contracts in an attempt to maximise returns fromsugar sales and to ‘lock into’ what are regarded as acceptable returns. To some extent, this has alsoinsulated sugar returns from the highly volatile world ‘spot’ prices and provided a degree ofstability in producer prices.
The use of futures and other financial instruments to hedge and manage risk is fraught with dangersunless the instruments are used strictly in accordance with pricing of physical stocks or managingactual financial exposure. Even then, movements in the markets may result in fluctuations in themargins between physical commodity prices and futures prices. In such a situation, it is possiblethat a loss could be incurred or, on the other hand, a windfall profit could be made.
The Sugar Corporation acquires all raw sugar produced in Queensland. As a consequence, theability of individual growers and millers to separately manage their own price risk is removed.This is particularly so when sugar is sold one year, and in some cases, two years after the decisionto grow cane and produce sugar. Producers are unable to determine the price they will ultimatelyreceive for their output because they are not aware of the Corporation’s marketing contracts, on-going arrangements or hedging positions, although the Corporation does provide producers withindicative pool prices for a season, regularly throughout the season, and for the forthcomingseason. The operations of the Corporation in its futures trading and hedging activity are notunderwritten by government.
When committing themselves to produce sugar cane, growers have access to information on pastpayments for sugar and information provided by the Corporation and other agencies (eg ABARE)on prospective prices. However, the Queensland regulations have constrained growers’ capacity toreact to the available market information. For example, if a grower’s view about future price levelsis pessimistic, he may judge it prudent to reduce sugar cane production. However, under theassignment system, this could result in the forfeiture of assignment. Accordingly, cutting back onproduction in order to minimise losses is not an option for growers who foresee a longer termfuture in cane.

THE AUSTRALIANSUGAR INDUSTRY
120
If growers/millers had equity in raw sugar produced and directly faced prevailing prices withoutcompulsory acquisition, they would be in a stronger position to manage their own risk. There are anumber of ways they could go about this.
First, growers could decide whether, based on the prevailing price and their judgement about futureprices, they wished to produce cane or not. For growers, this decision would also depend on thealternative uses of the resources used. Some growers may choose to leave resources idle ratherthan risk making losses. Others might choose to diversify into other agricultural pursuits. Evenunder the current regulatory regime, some growers have chosen this latter route.
Second, if prices appear attractive for sugar production, growers and millers could elect to enterinto a contract to supply at a fixed price, or ‘forward sell’ sugar. In this way they would be assuredof the price they would receive for their output.
Third, growers and millers could use futures contracts in order to ‘lock into’ a particular price. Forexample, if the current futures price was US15c/lb, then producers could hedge against receiving aprice lower than this by selling sugar futures. In this way, they could lock themselves into thefutures price and minimise downside risk. However, in doing so, they would forgo any possiblegain if prices rose and would incur the normal transaction costs of buying and selling futurescontracts. There are variations to this simplified hedging position where producers could engage inprofit maximising activity as future prices fluctuate.
At the initial public hearing, the Sugar Corporation stated that there is scope for individual industryparticipants to hedge their own production, though it is not possible at the moment. It added thatarrangements could be developed to enable producers to hedge, if the industry so wished. TheCorporation has said it will prepare a discussion paper on developing an optional hedging facilityfor producers. However, the Commission expects that it would not be feasible to provide, in thepresent regulated regime, the same opportunities for producers to benefit by using futures marketsthat would exist in a less regulated environment.
Pooling
A pooling mechanism, whereby all revenue from a season’s sales and associated marketing costsare aggregated to yield an average price to all contributors to the pool, can smooth out fluctuationswhich might normally be encountered by individual producers. In the case of the sugar industry,there is some differentiation in payments depending on pool entitlements, but this adjustment is notnow directly related to the prices actually received in the different markets in which sugar is sold.

INCOME AND PRICEINSTABILITY ANDRISK MANAGEMENT
121
As is evident from support for the present arrangements, many producers value the risk-sharingprovided by the pooling arrangements. These arrangements, however, impose certain costs onothers. The potential for pooling, especially the form existing in the sugar industry, to causeinefficient production decisions and prevent innovations in marketing was discussed in Chapters 5and 6. Compulsory pooling also makes it difficult or impossible for growers and millers to usecertain other methods of reducing their price risks - such as futures contracts and other financialinstruments. That is, pooling in the sugar industry works against voluntary use of markets to tailorrisk reduction to the situation of individual growers and millers.
Buffer stocks
With a buffer stock scheme, an authority acting on behalf of an industry aims to buy stocks whenthe market price is low and sell stocks when the market price is high. If a country possesses powerin the world market, and if the buffer stock scheme is operated successfully, price instability isreduced. A buffer stock scheme operated for the Australian wool industry from 1970 untilFebruary 1991. Over most of that period, fluctuations in wool prices were reduced as a result ofthe buying and selling of wool by the Australian Wool Corporation. However, because Australiahas little influence on world prices for sugar, it would not be feasible for it to stabilise sugar pricesusing a buffer stock scheme.
A system of buffer stocks and production quotas operated under the now lapsed International SugarAgreement. Under this agreement, a group of producing and consuming nations sought to stabilisesugar prices in international trade.5
Stabilisation funds
Buffer fund price stabilisation schemes operated for several Australian rural industries from the late1940s to the late 1970s. Under these schemes, producers paid a levy in years when prices werehigh. The proceeds of the levy were paid into a stabilisation fund and used to supplementproducers’ prices in years when the market price was low. Levies were exempt from taxation, andpayments received by farmers from the stabilisation fund were taxable. Participation wascompulsory, and the levy was mandated by government legislation. The Government played anunderwriting role, contributing to prices if this was necessary when stabilisation was exhausted.
5 Industries Assistance Commission, The Sugar Industry, Report No. 332, Australian Government PublishingService, Canberra, 11 November 1983, pp 67, 71.

THE AUSTRALIANSUGAR INDUSTRY
122
Buffer funds had major disadvantages. They discouraged production when market prices werehigh and encouraged it when prices were low. They denied producers the use, for other purposes,of sums paid as stabilisation levies. This was so regardless of the relative importance attached toprice stabilisation and other objectives, such as farm development, by individual farmers. Bufferfunds destabilised incomes of individual farmers in some situations, such as when high pricescoincided with low levels of production.
Underwriting
Minimum guaranteed prices were features of many of the post-war stabilisation schemes. Howeverduring the 1980s the prices for a number of rural industries (wheat, apples and pears, dairy productsand dried sultanas) were underwritten at a percentage of a moving average of recent and expectedreturns. The sugar industry has never had its prices underwritten this way, but in 1985, a jointCommonwealth/Queensland/New South Wales Government price support scheme commenced forthe sugar industry. The scheme was to provide price support for up-to-peak returns wherebyreturns would be guaranteed at $230 per tonne for the 1985 season, $225 for the 1986 season and$220 for the 1987 season. For the 1985 season, up-to-peak returns were augmented by a $6.94million payment by the Queensland Government. Additional price support payments of $14.65million and $0.38 million were made by the Commonwealth and New South Wales Governmentsrespectively. However, as prices for the 1986 and 1987 seasons were above the price supportlevels, no further payments were made.
If the Commonwealth or a state government were not to provide government-financedunderwriting, the sugar industry has the option of itself funding an underwriting scheme. In May1988, the Commonwealth Government stated:
should individual industries [original emphasis] wish to continue with the policy of underwriting and beprepared to establish their own industry-funded underwriting schemes, the Government would be prepared towork in consultation with the industries concerned to develop appropriate arrangements.6
The Government added that, while it recognised that specific industry arrangements may need tovary to reflect industry characteristics, several principles should be applied. These principles are:
• the underwritten price should be set at a level which ensures that price underwriting is triggeredonly by extraordinary downward price movements;
• industry should assume increasing responsibility for meeting the costs of reducing priceuncertainty;
• the reference price for underwriting should be closely aligned to world prices;
• as far as practicable, the underwritten price should be announced in time to be taken intoaccount in determining the current season's production; and
• there should be transparency in the calculation of reference prices and estimates of relevantreference prices should be regularly updated and publicly announced.
6 Department Primary Industries and Resources - Policies for Growth, A Government Policy Statement,1988, p. 37.
INCOME AND PRICEINSTABILITY ANDRISK MANAGEMENT
123
A major potential inefficiency associated with price underwriting is that, by raising producers’ priceexpectations, it encourages production to be higher than it would otherwise be. This can deferrationalisation. It also has implications for other sectors of the community. It can, for example,result in resources being drawn out of other rural activities and, if funded by government, canimpose significant cost on taxpayers in years in which it is ‘triggered’.
If the sugar industry wished to introduce a self-financing industry-funded scheme, it could be mademandatory for all participants or, alternatively, producers could elect whether or not they wished toparticipate. If the scheme were to be compulsory, it would require government legislative backingbut, in Queensland, with compulsory acquisition, a mechanism already exists for itsimplementation.
A drawback to compulsory schemes is that they deter some producers from pursuing other costeffective options for dealing with risk. This problem would be avoided if price underwriting wereintroduced on a voluntary basis, although other problems could emerge (eg difficulties associatedwith producers opting in and out of the scheme). Moreover, if a voluntary scheme wereintroduced, it is questionable whether it would be of greater benefit than the current voluntaryIncome Equalisation Deposits (IED) scheme. The IED scheme, being income based, covers morethan just price risks. An additional advantage is that the IED scheme, being generally available torural producers, is neutral across eligible activities.
9.5.2 Other measures
Apart from the industry specific measures, primary producers can avail themselves of some specialfeatures of the tax law to help manage the consequences of fluctuating incomes. They can useIEDs to help stabilise year-to-year incomes without incurring tax disadvantages, and they canaverage their incomes over time to establish a rate of taxation which will not result in them payingmore tax than others who have more stable income flows.
One of the consequences of having a progressive income tax schedule based on an annual incomeassessment is that, where two individuals have the same taxable income over a number of years, theone whose tax fluctuates more widely from year to year pays more tax. The additional tax has twomain affects. First, there is an equity effect as different taxpayers earning the same income over aperiod of years are not treated equally. Second, there is an efficiency effect as the tax system is notneutral between resource uses yielding stable and unstable income flows. This tends to discourageinvestments which result in fluctuating incomes.
In addition, primary producers can carry forward losses indefinitely for taxation purposes. Incontrast, other businesses are limited to seven years of loss carry forward. Primary producers mayalso make use of measures designed to meet the general welfare goals of the community.

THE AUSTRALIANSUGAR INDUSTRY
124
The Income Equalisation Deposits scheme
The IED scheme, for which all primary producers are eligible, provides a mechanism for offsettingthe effects of fluctuations in producers’ incomes so that they are not disadvantaged by theprogressive nature of personal income tax rates. The scheme enables producers to deposit fundswith the Commonwealth Government in high income years and to withdraw them in years whentheir income falls. The amount of a deposit is allowable as a deduction from taxable income in theyear of deposit. Withdrawals are added to taxable income in the year they are withdrawn.
Under the current scheme, which was introduced in July 1989, primary producers receive a marketrate of interest on 61 per cent of the deposit. The other 39 per cent, on which interest is not paid,represents the average component which would have been subject to tax in the year of deposit butfor the use of the deferral provision. A tax benefit accrues to producers taking advantage of thescheme when the average rate of tax on an amount in the year of withdrawal is lower than theaverage rate of tax otherwise payable on that amount in the year of its deposit. This happens ifincome is shifted into a lower marginal tax bracket, or if marginal tax rates are reduced over time.
Since the early 1980s, nominal income tax rates have been reduced significantly. If this trend wereto continue over the life of the IED scheme, nearly all growers could obtain a tax benefit throughuse of the scheme, while stabilising their disposable incomes. With the IED scheme, growersthemselves must plan for years of low income by making deposits in years of relatively highincome. Only if they initiate such action, can they obtain assistance through the available taxbenefits.
At the draft report hearing, some participants suggested that the IED arrangements did not provideappropriate incentives for growers to use the scheme. It was suggested that, as IED withdrawalswere subject to provisional tax, some growers were reluctant to utilise the IED arrangements.Withdrawals are subject to the same tax provisions as income earned in the year of withdrawal. Iftax liability on growers’ income, including the IED withdrawal, is below that assessed by theAustralian Tax Office, growers have the right to have their provisional tax liability reassessed bythe Office. As such, the Commission sees nothing unjust or inequitable in the current taxationtreatment of IED withdrawals.
Tax averaging
Even if primary producers do not wish to transfer funds between years through the use of IEDs,they can average their income over a number of years for the purpose of determining tax liability.
INCOME AND PRICEINSTABILITY ANDRISK MANAGEMENT
125
Under the tax averaging provisions, primary producers may use the incomes of the current year andthe preceding four years to determine the tax rate applicable for the current year. The tax rateapplicable is determined by the average income over the period. The tax for the current year isthen determined as the current year’s income multiplied by the tax rate.7 The averaging provisionsapply to the whole income of the taxpayer, and not just to the income derived from primaryproduction.
One effect of the provisions is to establish equity between primary producers who have fluctuatingincomes and other individuals who have stable, but equivalent incomes, over a number of years.However, tax payments are greater in low income years and lower in high income years than theywould be in the absence of tax averaging. Thus, in the absence of the use of IEDs to transferincomes between high and low income years, tax averaging tends to accentuate after-tax incomevariability.
Both the averaging and the indefinite carry forward of losses provisions advantage primaryproducer taxpayers relative to other taxpayers in the community. Many taxpayers engaged in otherindustries and in paid employment are subject to income fluctuations, but are not able to useincome averaging for tax purposes or to indefinitely carry forward losses. To this extent, thelimited eligibility provisions are inequitable.
Rural Adjustment Scheme
The Commonwealth provides broad-based structural adjustment and income assistance to farmersexperiencing financial difficulties arising from circumstances beyond their control through theRural Adjustment Scheme (RAS)8. Assistance under the RAS is available to all industries withinthe agricultural sector. RAS is administered by State and Territory Governments under legislationcomplementary to Commonwealth legislation.
The RAS assists farmers to improve performance by helping them to increase the size of theirfarms, to restructure their liabilities, improve managerial and financial skills, or adopt betterpractices and technology. After all other options have been considered, RAS helps eligible farmerswithout prospects to leave the industry.
Part A provides assistance to producers who are suffering, or are likely to suffer, financialdifficulties due to circumstances beyond their control, and who have been assessed as being viablein the long term. It takes the form of concessional finance to improve or expand, for example, acane farm.
7 For example, tax for a taxpayer who has a current taxable income of $40 000 and average income of$30 000 (including the current year), would be calculated as $40 000 multiplied by the tax rate applicable for$30 000.8 Prior to July 1 1989, assistance was also separately available to canegrowers and other farming and smallbusiness sectors under the Natural Disaster Relief Arrangements. These arrangements were jointly funded bythe states and the Commonwealth as the need arose. After July 1 1989, alternative Commonwealth assistancefor such circumstances was incorporated under Part B of RAS.

THE AUSTRALIANSUGAR INDUSTRY
126
Under Part B, short term assistance - again in the form of concessional finance for debtreconstruction and carry-on finance - may be made available if the Commonwealth and the relevantstate government agree that an industry is suffering a severe temporary downturn. To be assistedunder this Part, growers must be assessed as having sound long term prospects.
Part C provides assistance to producers who are: not viable in the long run; are suffering personalfinancial hardship and are considering leaving primary production; or have left, or are arranging toleave. Two forms of assistance are available. Household support assistance is available toproducers who are intending to sell their property. It provides income support equivalent tounemployment benefits when a grower is ineligible to receive the latter for a period of up to twoyears. Re-establishment assistance involves the payment of a grant, subject to an assets test, of upto $28 000 to primary producers who have left the industry or who have entered into arrangementsto do so.
Expenditure under RAS in Queensland received by canegrowers totalled $0.29 million in 1989-90,$0.58 million in 1990-91 and, in the six months to December 1991, $1.53 million. In the sixmonths to December 1991, 441 applications for assistance were submitted, of which 219 weresuccessful. There were 145 applications with 72 being successful for the previous full year. Of thenearly $30 million of RAS assistance distributed in Queensland in the period 1 July 1989 to 31December 1991, about 8 per cent was distributed to canegrowers. In New South Wales, in thesame period, there were no application from canegrowers for assistance under RAS.
The Budget allocation for RAS for 1991-92 was $160 million. In October 1991, the Governmentrevised the funding for RAS in the light of the severe and widespread downturn and the effects ofthe drought in Australia’s rural sector. The main elements involved increasing Commonwealthfunding to $173.1 million, increasing the Commonwealth/State contributions to Part B from 1:1 to2:1; and increasing access to social security benefits to assist unemployed members of farmingfamilies (see below).
Further, the Government, in its February 1992 Economic Statement, announced increased fundingfor RAS. Under Part A, an additional $10 million is to be made available for each of the 1991-92,1992-93 and 1993-94 financial years. Also, the Government announced additional funding of$10.8 million in 1991-92 and $5 million in 1992-93 to fund a 75 per cent interest subsidy oncommercial loans under Part B of RAS for the purpose of assisting in crop planting by farmers withliquidity and cash problems. The scheme will target broadacre producers of cereals, coarse grains,oil seeds and grain legumes, as well as some sugar producers.
Although not established as a means of achieving income stability or as a means to overcome risk,the RAS has provided a ‘safety net’ to growers during prolonged periods of adverse circumstances.To this extent, resources may remain in an industry when, if normal commercial pressures were toapply, they may have been redeployed.

INCOME AND PRICEINSTABILITY ANDRISK MANAGEMENT
127
Social security
Canegrowers, like other individuals in the rural community and the community in general, areeligible for the full range of social security benefits providing normal eligibility criteria are met.For example, they are eligible for work search allowances providing they are assessed to be full-time unemployed and are looking for full-time employment. Spouses of canegrowers are assessedin the same way.
In its 1991-92 Budget, the Commonwealth Government modified the assets tests for eligibility forthe Family Allowance and Family Allowance Supplement for Low Income Families Schemes toapply for two years after 1 January 1992. In October 1991, the Government announced it hadbought forward the implementation date for these arrangements to 1 December 1991. Farmers, aswell as people with non-farm businesses, can benefit from the changes. The new rules assist lowincome families in financial hardship who are currently ineligible for family payments because thevalue of their assets exceeds the prescribed limited. Under the new rules, farmers qualify for theFamily Allowance Supplement if they have income below the married rate of benefit of $13 078(with adjustment for each child), with limited available funds (below $6000 for a single person and$10 000 for couples) and assets of less than $600 000. The Government has also introduced anasset test for the Family Allowance from 1 January 1992 of $600 000. However, people withassets over this limit meeting the income and available funds criteria are still eligible.
9.6 The Commission’s assessment
Fluctuations in returns due to weather, biological factors and prices are an inherent part of theagricultural environment. The most important source of the fluctuations in growers’ and millers’returns is unstable world prices. Prices for sugar in world markets have fluctuated more than theyhave for many other rural commodities. This is, in part, a consequence of protectionist policies forsugar in several major countries, and of the impacts of those policies on the residual world marketfor sugar. Australian policies which reduce the responsiveness of sugar production andconsumption to world prices contribute to this instability. Australia is seeking to reduceinternational protection for sugar and other rural commodities through the GATT round ofmultilateral trade negotiations. Success in these negotiations would make sugar prices more stablein world markets.
In the Commission’s view, the case for specific action by governments to shelter Australiangrowers, millers or sugar users from fluctuations in world sugar prices is weak. The case forgovernments playing this stabilising role is no stronger than is the case for their holding the level ofdomestic sugar prices above world prices, either routinely or when world prices are low.
THE AUSTRALIANSUGAR INDUSTRY
128
Of the policy measures which fall in the category of ‘price stabilisation’, the costs appear to be highin relation to the benefits. The measures having the best prospects of being successful are probablybuffer fund stabilisation arrangements and price underwriting. However, Australia’s experiencewith these measures in agricultural industries - including sugar - indicates that they have significantlimitations. Price underwriting, even at a conservative level, involves the risk of a substantial costto taxpayers. The buffer fund schemes which have operated in Australian agriculture havedistorted price signals facing farmers and have compelled all farmers in an industry to immobilisepart of their resources in the stabilisation funds in years of high prices, regardless of their incomesituation and their priorities. These schemes also have required underwriting by the government toguarantee that funds are always sufficient to supplement farmers’ prices in the agreed way whenprices are low.
IEDs can be viewed as improving upon, and hence making redundant, buffer fund pricestabilisation. IEDs improve upon buffer fund schemes of the type used previously in Australia inbeing voluntary, more flexible in the amount of stabilisation that can be achieved, not distortingprice signals, and providing stabilisation against all sources of fluctuations in incomes.
Stabilisation of prices is a weak rationale for pooling arrangements if that stability is imposed on allparticipating producers or buyers. The need for risk reduction varies among individuals, who couldbe expected to undertake their own appropriate risk reduction strategies, such as productdiversification, asset management and the use of insurance or hedging markets. Stabilisationpolicies which require the compulsory participation of producers or buyers reduce the incentivesfor sound production and financial control and retard the development of risk avoidance marketswhich operate in some other industries and countries.
The Industries Assistance Commission (IAC) looked at the objectives of stabilisation policesgenerally in an inquiry into rural income fluctuations in the late 1970s9. Its main conclusions werethat there was little evidence to suggest that price stabilisation schemes would encourage efficientresource use, and that such schemes were likely to lead to an inefficient use of resources bydiscouraging profitable adjustments to price trends. It noted:
Individual producers, in agriculture and other sectors, adjust to risk and uncertainty in the way they organise theirbusinesses, employing stabilising measures and strategies in the light of their own situations and preferences andthe costs involved. It should not be assumed that farmers’ evaluations of the benefits and costs of alternative riskreducing strategies are inadequate or that the social costs of risk reduction could be reduced by intervention.
In the Commission’s view, it would be desirable if growers and millers were in a position to hedgeagainst possible adverse price movements. If growers and millers could use futures contracts to
9 Industries Assistance Commission, Rural Income Fluctuations, Report No. 161, AGPS, Canberra, 1978.

INCOME AND PRICEINSTABILITY ANDRISK MANAGEMENT
129
‘lock into’ a particular price, much uncertainty could be removed. However, as the SugarCorporation acquires all raw sugar produced in Queensland, growers and millers do not have anycontrol over marketing on which to base a hedging position. Indeed, at present any activity bygrowers and millers involving futures markets or other financial instruments can only be regardedas speculation. The Commission can see merit in the development by the Corporation of anyfacility which would enable individual growers and millers to undertake hedging to reduce risksassociated with adverse movements in the returns they receive for their output. Therecommendations outlined in Chapters 5 and 6 of this report would, if implemented, ultimatelyprovide producers with the freedom to choose both the extent and manner in which they engage inactivities to stabilise prices and incomes and reduce risks.
It may be appropriate for the Sugar Corporation to offer voluntary stabilising options, such as pricepooling or entry to hedging markets, to participating producers. Furthermore, to the extent that theCorporation improves market information and helps to maintain stable access to overseas markets,it can contribute to price stability and improve resource use efficiency.
In its May 1988 Economic Statement, the Commonwealth Government signalled its intention toreduce domestic price support, to restrict price and cost pooling, and to phase out its underwritingrole in line with general reductions in assistance elsewhere in the economy. Its March 1991Industry Statement continued that process. Although the Government has indicated some supportfor industry-funded underwriting, the Commission has reservations about the benefits of suchschemes, particularly if participation is compulsory. Other existing mechanisms may be moreadvantageous. For example, provisions within the Australian tax system, the RAS and the socialsecurity system reduce the impact of fluctuations in both prices and yields on the disposableincomes of cane growers and other farmers. Changes to IEDs and the RAS in 1989, and FamilyAllowances in 1991, have improved the capacity of these provisions to deal consistently andequitably with fluctuations, from whatever source, in the incomes of farmers.
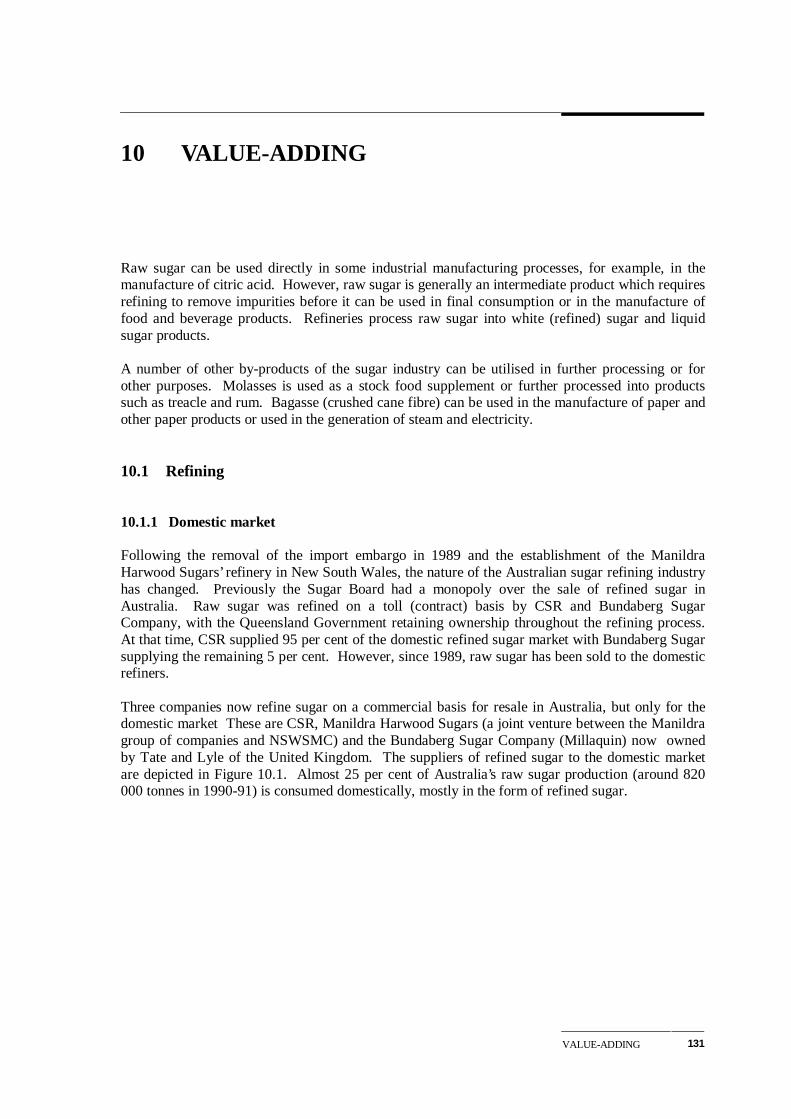
VALUE-ADDING 131
10 VALUE-ADDING
Raw sugar can be used directly in some industrial manufacturing processes, for example, in themanufacture of citric acid. However, raw sugar is generally an intermediate product which requiresrefining to remove impurities before it can be used in final consumption or in the manufacture offood and beverage products. Refineries process raw sugar into white (refined) sugar and liquidsugar products.
A number of other by-products of the sugar industry can be utilised in further processing or forother purposes. Molasses is used as a stock food supplement or further processed into productssuch as treacle and rum. Bagasse (crushed cane fibre) can be used in the manufacture of paper andother paper products or used in the generation of steam and electricity.
10.1 Refining
10.1.1 Domestic market
Following the removal of the import embargo in 1989 and the establishment of the ManildraHarwood Sugars’ refinery in New South Wales, the nature of the Australian sugar refining industryhas changed. Previously the Sugar Board had a monopoly over the sale of refined sugar inAustralia. Raw sugar was refined on a toll (contract) basis by CSR and Bundaberg SugarCompany, with the Queensland Government retaining ownership throughout the refining process.At that time, CSR supplied 95 per cent of the domestic refined sugar market with Bundaberg Sugarsupplying the remaining 5 per cent. However, since 1989, raw sugar has been sold to the domesticrefiners.
Three companies now refine sugar on a commercial basis for resale in Australia, but only for thedomestic market These are CSR, Manildra Harwood Sugars (a joint venture between the Manildragroup of companies and NSWSMC) and the Bundaberg Sugar Company (Millaquin) now ownedby Tate and Lyle of the United Kingdom. The suppliers of refined sugar to the domestic marketare depicted in Figure 10.1. Almost 25 per cent of Australia’s raw sugar production (around 820000 tonnes in 1990-91) is consumed domestically, mostly in the form of refined sugar.
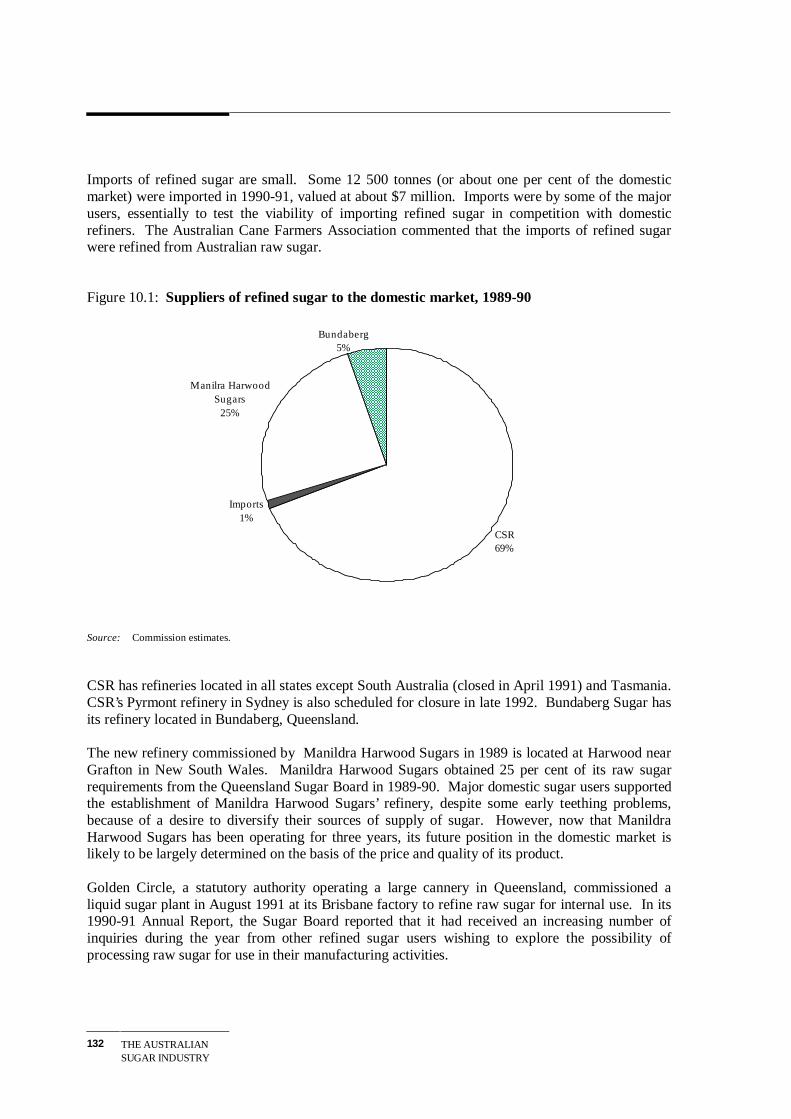
THE AUSTRALIANSUGAR INDUSTRY
132
Imports of refined sugar are small. Some 12 500 tonnes (or about one per cent of the domesticmarket) were imported in 1990-91, valued at about $7 million. Imports were by some of the majorusers, essentially to test the viability of importing refined sugar in competition with domesticrefiners. The Australian Cane Farmers Association commented that the imports of refined sugarwere refined from Australian raw sugar.
Figure 10.1: Suppliers of refined sugar to the domestic market, 1989-90
Source: Commission estimates.
CSR has refineries located in all states except South Australia (closed in April 1991) and Tasmania.CSR’s Pyrmont refinery in Sydney is also scheduled for closure in late 1992. Bundaberg Sugar hasits refinery located in Bundaberg, Queensland.
The new refinery commissioned by Manildra Harwood Sugars in 1989 is located at Harwood nearGrafton in New South Wales. Manildra Harwood Sugars obtained 25 per cent of its raw sugarrequirements from the Queensland Sugar Board in 1989-90. Major domestic sugar users supportedthe establishment of Manildra Harwood Sugars’ refinery, despite some early teething problems,because of a desire to diversify their sources of supply of sugar. However, now that ManildraHarwood Sugars has been operating for three years, its future position in the domestic market islikely to be largely determined on the basis of the price and quality of its product.
Golden Circle, a statutory authority operating a large cannery in Queensland, commissioned aliquid sugar plant in August 1991 at its Brisbane factory to refine raw sugar for internal use. In its1990-91 Annual Report, the Sugar Board reported that it had received an increasing number ofinquiries during the year from other refined sugar users wishing to explore the possibility ofprocessing raw sugar for use in their manufacturing activities.
CSR69%
Imports 1%
Manilra Harwood Sugars
25%
Bundaberg5%

VALUE-ADDING 133
Refineries have generally been located so that transport costs from refineries to users areminimised. Transport costs for refined sugar are significantly higher than those for raw sugar asrefined sugar must generally be transported either bagged or in specially designed containers thatminimise contamination, rather than shipped in bulk. In a paper presented to the 1991Canegrowers’ Convention, Ian Burgess, Managing Director of CSR said that:
Sugar refineries have usually been built in or near large urban centres. The economics of transport dictated this inthe past. However, technological advances in the shipment of refined sugar mean it will not always be so.
Refined sugar pricing
Because of the limited competition between refiners on the domestic market, the price of refinedsugar is essentially determined by the price at which imported refined sugar is available. Theimport price of refined sugar consists of the world market price for refined sugar, plus the cost ofimporting to Australia and the tariff (the duty paid import parity price).
CSR provided information on the current costs associated with importing refined sugar. Thissuggests that shipping and related costs associated with importing refined sugar free into store(excluding the fob cost and import duty) from the EC are about $170 per tonne, and from Asia thecosts are about $145 per tonne. Thus, based on a tariff of $76 per tonne less a discount of 5 percent for developing countries and a world price (ex Asia) of US15 cents per pound for refinedsugar, the duty paid import parity free into store price for refined sugar would be about $200 pertonne above the world price. On the basis of estimates of freight and port costs supplied byABARE, the duty paid import parity free into store price for refined sugar would be $155 per tonneabove world price.
SUGA stated that, because of a combination of Queensland and Commonwealth Governmentpolicies, members of SUGA have paid at least $100 per tonne above the free trade price (duty freeimport parity) for domestically produced refined sugar over the last two years. Based on CSR’sestimates of the transport and related costs of importing refined sugar and SUGA’s estimate of theeffects of Government policies, the duty paid import parity price for refined sugar would be evenhigher than the Commission’s and ABARE’s estimates - about $245 per tonne above the worldprice. SUGA commented the announced reductions in the import tariff would only reduce the priceof refined sugar by $20 per tonne.
In their submission to the Commission’s 1990 inquiry into Statutory Marketing Arrangements, theAustralian Soft Drink Association, the Confectionery Manufacturers of Australia and the IceCream Manufacturers’ Federation estimated that the (then) Sugar Board’s pricing powers had the
THE AUSTRALIANSUGAR INDUSTRY
134
effect of raising prices of refined sugar, on average, by more that $100 per tonne. This wasestimated to increase the costs of the confectionery industry by over $20 million annually. Acrossall sugar users, the cost was estimated at some $90 million annually.
In contrast, the Sugar Corporation stated that the prices of raw and refined sugar on the domesticmarket are independently determined; domestic raw sugar prices are determined on the basis ofduty paid import parity for raw sugar and the domestic prices for refined sugar are determined bythe duty paid import parity for refined sugar. Thus, the Corporation suggests that domestic pricesof raw and refined sugar are not necessarily related; that is, there is no fixed refining margin. Thisis also the situation in the international markets where the refining margin (the difference betweenthe world prices of raw and refined sugar) tends to be volatile.
Domestic prices for refined sugar are currently led by the pricing policies of CSR, within theconstraints of import competition. It is in Manildra Harwood Sugars’ and Bundaberg Sugar’sinterests, with refining capacities limited to 25 per cent and five per cent respectively of thedomestic market, to set their prices in response to the lead from CSR.
Because of the cost impact of the tariff on the local price of refined sugar, some manufacturersclaimed that they are turning toward artificial sweeteners such as fructose, corn syrup and glucoseas a substitute for refined sugar. Production of fructose started in Australia in the mid 1980s andsales are now running at some 10 000 tonne per year. Corn syrup is now widely used in the UnitedStates. While it is currently not produced in Australia, the feasibility of doing so has beencanvassed in recent months, The patent for another artificial sweetener, aspartame (used in Coca-Cola products) ends in April 1993. In view of these developments, there could be increasedcompetition between artificial sweeteners and sugar during the 1990s.
Since the removal of the import embargo and the imposition of tariffs on imported sugar, thedomestic price of refined sugar is no longer administratively determined. Movements in thedomestic price of refined sugar have basically reflected world prices. At the time the newarrangements took effect, world stocks of sugar were low and world prices for sugar were rising.There was a sharp increase in the domestic price of sugar. As a consequence, the PricesSurveillance Authority received a number of complaints from confectionery, soft drink and otherfood manufacturers about increases in the price of manufacturer’s grade sugar. Following aninvestigation of the complaints, the Authority stated it was satisfied that the price movementsreflected costs and were related to import parity prices. The Authority decided to take no action,but has continued to monitor developments in the industry.
In the Commission’s view, given the level of concentration in the refining sector and the absence ofsignificant competition between refiners on the domestic market, it is likely that the duty paid

VALUE-ADDING 135
import parity pricing of refined sugar will prevail. The price of refined sugar could fall below thislevel if the difference between the price of raw sugar on the domestic market and duty paid importparity price of refined sugar increases the refining margin. This could attract new entrants into therefining sector and increase competition on the domestic market. This could occur if theacquisition powers of the Sugar Corporation were removed and competition between millers forraw sugar sales on the domestic market forced prices to fall towards export parity. Potentialcompetition from alternative sweeteners could also place downward pressure on the domestic priceof sugar, particularly in some end-uses.
10.1.2 Export refining
Australia has not exported significant quantities of refined sugar. However, in recent years therehave been discussions about the potential to establish a large scale export-oriented refinery inQueensland. Prior to its take over by Tate and Lyle, Bundaberg Sugar commented that:
The potential for refined sugar exports from Australia has been the subject of considerable investigation duringthe past 18 months. There is a growing level of acceptance that white sugar is the growth market of the future -particularly in the Asian Pacific region. The white sugar premium is at record levels and transport and logisticproblems are being addressed by new technology. Two export refining proposals were put forward early in 1990.CSR Limited proposed a very large facility in Townsville to supply both domestic and export marketsindependent of the industry authority. Bundaberg, in a joint venture with other mills, put forward a proposal for asomewhat smaller dedicated export refinery to operate on a risk sharing basis with the Sugar Board.
In discussing the world sugar outlook and future prices and markets, ABARE in its submission tothis inquiry made the following comments:
The transport advantages and low costs of production in the Thai and Australian industries could indicate thatthey, among other exporters, are the best placed to meet the growing Asian markets. However, many of thesedeveloping markets are seeking white, rather than raw, sugar.
Australia at present is not well placed to respond directly to this growth in white sugar trade. Virtually all ofAustralia’s sugar trade is in raw sugar. However, a significant part of the growth in white sugar exports has beenmet by countries such as China, the Republic of Korea, Singapore and Malaysia, which import Australian rawsugar....
In the absence of an export based white sugar sector, Australia may not fully benefit from future marketdevelopment and growth opportunities although it will possibly gain indirectly from increased sales to tollrefiners such as China, South Korea and Malaysia. Australia’s share of world sugar trade is likely to decline if itremains solely a raw sugar exporter.
More recently (October 1991), CSR announced its intention to trial a new technique which will usebagasse to fuel a refining process at its Ayre Kalamia mill. CSR expects to export a sample 20 000tonnes of white sugar refined by the new technology from Townsville in the first year of operation.The new process requires minimal additional plant and low capital investment. It will use the mill’s

THE AUSTRALIANSUGAR INDUSTRY
136
energy generation capacity in the off-season when otherwise the mill would be idle. It involvesplacing a refining module at the mill and utilising bagasse to generate the necessary energy for therefining process in the off-season. Bagasse is a waste from the milling process and its disposalcurrently presents major problems for many mills.
Although there is evidence of expanding opportunities in export markets in Asia for refined sugar,some factors appear to be hindering the establishment and viability of a large scale export-orientedrefining sector in Australia.
First, because of the existing compulsory acquisition and single seller arrangement, potentialexport-oriented refiners are unable to negotiate on price with the millers of raw sugar produced inQueensland. Negotiation for the purchase of Queensland raw sugar can only take place with theQueensland Sugar Corporation. As raw sugar is acquired by the Corporation and its charter is tomaximise the returns to the raw sugar industry, it sells raw sugar on the domestic market at close toduty paid import parity prices. When sugar or sugar products are for export, there are rebatearrangements to compensate for the penalty imposed as a result of the import duty on raw sugar.However, even with compensation arrangements, the price still remains significantly higher thanexport parity because there are other costs associated with importing sugar (eg transport costs). Inthe case of refining for export, the price of raw sugar would presumably need to be close to exportparity otherwise refining for export is unlikely to be viable. At the Canegrowers Convention in1991, Ian Burgess, Managing Director of CSR, said that CSR’s proposal for an export refinery hasbeen put on hold because of "uncertainty created by the sugar control arrangements inQueensland". Similarly, Bundaberg Sugar criticised the present regulations saying that:
We are of the view that a system of allowing ex-mill sales ... would over time facilitate efficient development ofwhite sugar exports - particularly from those mill areas closest to the developing market in Asia.
Second, the current transport costs of exporting refined sugar to final markets are considerablyhigher than the costs of exporting raw sugar. Other costs being equal, refiners located in finalmarkets would thus have a significant competitive advantage over a refiner located in Australia,unless Australian refiners were able to offset the transport cost disadvantage by achieving higherlevels of efficiency in the refining processes or by obtaining inputs at lower cost.
Third, unless potential export refiners obtain other inputs and services at internationallycompetitive prices they would be further disadvantaged. Tariffs, although reducing, still apply tomuch of the materials, plant and equipment required for the establishment of new refineries. Salestax also applies to some capital items and materials inputs. An increase in the rate of micro-economic reforms is required to reduce the costs of non-traded inputs. Reforms to increase theefficiency of electricity supply would for example, enhance the viability of export refineries (seebelow).
VALUE-ADDING 137
Finally, the refining margin on refined sugar appears to be extremely volatile reflecting fluctuationsin world raw sugar and refined sugar prices which are not always correlated. Thus, investment inexport-oriented refining capacity could be regarded as high risk.
While the costs of producing and exporting refined sugar remain significantly higher than overseascompetitors, and while exporting raw sugar is profitable, it could be in Australia’s and the rawsugar industry’s interests to develop an off-shore refining capacity to refine Australian raw sugarcloser to emerging market opportunities, or to develop closer ties with refiners in these areas. Atpresent, there does not appear to be anything to prevent the raw sugar industry from doing so,except that individual producers (millers) of raw sugar cannot benefit directly by participating insuch arrangements because of compulsory acquisition and the single desk export arrangement forraw sugar.
The experimental refining of sugar for export at CSR’s Ayre Kalamia mill has the potential toproduce refined sugar at low cost. However, the success of the trial depends on a number offactors. These include the price at which CSR can acquire raw sugar from the Sugar Corporation,the costs of transporting refined sugar to and from Townsville to final markets, the extent to whichthe enterprise can minimise other costs and on its success in marketing refined sugar. Onepotential difficulty is that refined sugar is to be shipped in bags and, thus, will have to be shippedvia conventional ports rather than through the sugar industry’s bulk terminals. Costs associatedwith physically moving refined sugar across the wharf and loading it are considered high undercurrent waterfront management.
Should this experimental refining prove successful, there would appear to be no reason why othermillers could not adopt similar technology and also refine raw sugar for export. One possibleadditional barrier which other millers might face would be the lack of marketing expertise whichCSR and the Sugar Corporation have. However, this could be overcome if CSR, the Corporationor any other trader was able act on behalf of millers in marketing refined sugar.
In its February 1992 Economic Statement, the Government announced a number of initiativeswhich have the potential to enhance the competitiveness of value-adding activities, includingrefining. For example, the Government stated that it aims to improve productivity and competitionin all areas of port activity and that it will give full and early consideration to the forthcomingreport by the House of Representatives Standing Committee on Transport, Communications andInfrastructure on the interface between seaports and land transport. It has also announced itsintention to extend its reform program to include a Prices Surveillance Authority examination ofland-based charges by shipping conferences in Australian ports and its intention to request that theIndustry Commission inquire into port activities and services.
THE AUSTRALIANSUGAR INDUSTRY
138
Also, the Government announced new arrangements in the business tax system for an accelerationof depreciation allowances for plant and equipment and certain infrastructure. In addition, theGovernment has decided to supplement the depreciation changes for a limited period byintroducing a development allowance for certain larger scale investments. The developmentallowance, which will be set at a rate of 10 per cent and be available when plant is first used orinstalled ready for use, will be modelled broadly on the investment allowance that operatedbetween 1976 and 1985. To be eligible, projects must involve total capital expenditure of $50million or more. The allowance will only apply to the plant and equipment component of theinvestment. In addition, certain eligibility criteria will apply. For example, the projects must beworld competitive; there must be no substantial assistance or protection; there must be efficientpricing of inputs under the control of public administration and statutory marketing authorities;and there must be management and industrial relations arrangements which promote theachievement of world best practice.
These new arrangements and allowances should enhance the investment opportunities in all value-added activities, including refining. The cost of establishing an export refinery is likely to exceed$50 million, but meeting conditions relating to the lack of substantial assistance and efficient inputpricing by statutory marketing authorities may be more difficult.
Some of the other value-added activities related to the sugar industry are discussed below.
10.2 Sugar based products
The principal users of refined sugar are the manufacturers of non-alcoholic beverages, theconfectionery industry and food processing industries. These industries account for about 80 percent of Australia’s refined sugar requirements. The remainder is sold by retailers for finalconsumption. Products manufactured by most sugar users compete on the domestic market againstimports and, where competitive, on world markets. The extent to which these industries are able tosuccessfully compete on the domestic market depends, in part, on the tariff on competitive importsand on their ability to obtain inputs at competitive prices. Their ability to obtain inputs atinternationally competitive prices also affects export capacity.
Domestic food processors claimed that domestic marketing arrangements for sugar addsubstantially to their costs and unfairly penalise them when in competition with high sugar contentimports. The SUGA stated that:
As the closure of Allens’ Maryborough plant illustrates, the 300 per cent surge in imports since 1988 has virtuallymade liquorice manufacture in Australia uneconomic. The imports are coming from sugar exporting countrieswhere manufacturers can obtain sugar at free trade prices.

VALUE-ADDING 139
For sugar based products sold on world markets, manufacturers have obtained some relief from thetariff inflated domestic price of refined sugar. As previously indicated, the SugarBoard/Corporation, in conjunction with CSR and Bundaberg Sugar, has operated an export rebatescheme for sugar incorporated in exported products. Currently, the Corporation gives the rebate onraw sugar sold to the two Queensland refiners, CSR and Bundaberg Sugar. The refiners maysubsequently offer export rebates to relevant customers. The rebates are intended to offset theadverse effects that tariffs have on the competitiveness of exported products containing sugar. In1990-91, export rebates provided by the Sugar Board amounted to slightly over $5 million. TheManildra Harwood refinery has not offered export rebates to its customers.
The Commission understands that the rebate offered is equal to the developing country tariffapplying to raw sugar imports, thereby equating sugar costs to the duty free import price. Thisprice is still higher than the price at which raw sugar is exported from Australia.
In the absence of both the acquisition and the tariff, sugar would be available to value-addingactivities at prices below duty free import parity. As such, the competitiveness of domestic value-adding activities in both the export and import-competing sectors would be enhanced.
The Government has recognised the arrangements currently in place for the sugar industrysubstantially increase the price of sugar used in value-adding activities over that available toproducers in competitor countries. For example, in its March 1991 Economic Statement, theGovernment announced its intention to provide a production bounty to Australian manufacturers ofcitric acid by fermentation1, in part, to compensate for the existing sugar marketing arrangements.
While the compulsory acquisition of raw sugar remains, sugar-using industries will continue to bedisadvantaged as the domestic price of sugar is likely to remain close to import parity. However,the implementations of the recommendations contained in this report would, in the longer term,result in the removal of the Sugar Corporation’s acquisition power and tariff assistance.Consequently, the cost of sugar inputs to value-adding activities would fall, and thecompetitiveness of sugar using industries would be increased.
10.3 Bagasse utilisation
A major by-product of the milling process is the fibrous residue or bagasse, the disposal of which isa major problem for the millers. About 3.5 million tonnes of dry bagasse is produced each year inthe milling process. Some of the bagasse is used to produce steam and generate electricity for use
1 Bounty (Citric Acid) Bill 1991, Second Reading Speech.
THE AUSTRALIANSUGAR INDUSTRY
140
within mills2. In some cases, surplus energy is sold to the Queensland Electricity Commission(QEC). Although bagasse is used overseas to produce paper of various grades, liner and corrugatedboard, there is currently no production of paper products using bagasse in Australia.
10.3.1 Energy generation
Currently, 100 MW of capacity is installed at sugar mills fuelled by bagasse, but this only operatesduring the crushing season (or about 4 months a year). Some contend that electricity generation islimited to the crushing season because the QEC’s purchasing policy makes energy generationuneconomical outside the milling season.
Dr David Hagen of the Australian National University stated that, in Queensland, the QECexercises inhibitory monopolistic powers in effectively refusing to accept any power generated byindependent producers, particularly the sugar mills. It is suggested that QEC sets the buyback priceof electricity so low as to make it commercially impossible to generate electricity to sell to the grid,mainly to protect its own generation interests.
Dr David Hagen stated:
...price of 2c/kWh paid by the Queensland Electricity Commission is an example of current monopolisticgovernment imposed barriers to renewable energy in Australia where the buyback is set at only the fuel cost ofdisplacing coal.
• The buyback rate of 2c/kWh is substantially less than the average generation cost of fossil fuels of about4c/kWh as shown in the Electricity Supply Association of Australia's annual report.
• This low buyback rate ignores the very high costs to society of about 4c/kWh for generating electricity.
In a submission to a recent Commission inquiry on Greenhouse Gas Emissions3, the SugarResearch Institute stated that sugar mills could play a greater role by supplying the grid and, byreplacing output from coal fired plants, could reduce carbon dioxide emissions.
In a recent paper presented by Kaneff and Hagen4 it was stated:
2 A study which was issued by the World Bank Industry and Energy Department identifies several possible
ways by which surplus bagasse could be used to generate electricity for sale to grids. - Identifying the BasicConditions for Economic Generation of Public Electricity from Surplus Bagasse in Sugar Mills, EnergySeries Paper No 34, Reprinted April 1991, (Originally Published in October 1983).
3 Industry Commission, Costs and Benefits of Reducing Greenhouse Gas Emissions, Report No 15,November 1991, AGPS.
4 Kaneff, S. & Hagen, D.l., Sugarcane and Solar Thermal Power Systems, Solar 1991 Conference, Energyfor a Sustainable World, Australian & New Zealand Solar Energy Society, Adelaide, SA, 5-7 December1991.
VALUE-ADDING 141
• Efficient co-generation from the delivered bagasse (plus the other cane residues) with efficient mills couldgenerate over 10 percent of all the electricity generated in Australia or 60 percent of electricity in Queensland andstill meet all mill process heat needs.
• Sugar mills could increase their gross revenue [at current production levels] by up to $700 million per year orover 50 percent of sugar revenues by converting to efficient plants, gasifying their bagasse, and generatingelectricity in modern aeroderivative or combined cycle turbines (using the rest of the sugarcane biomass ornatural gas to generate power in the off-season).
The Australian Sugar Milling Council endorsed the broad thrust of Dr Hagen’s submission.However, it indicated that the estimate of the potential could be optimistic, particularly as thetechnology involved could still be considered to be in the development stage.
CSR is also in broad agreement with the submission by Dr Hagen, but is not as optimistic withregard to the scope for power generation. CSR considers the maximum power output may belimited to 120kWh/tonne of cane compared with the figure of 460 kWh/tonne of cane quoted. Thedifference is attributable to two factors; first, the technology required is in its infancy and, second,year round generation would require supplementary fuel such as coal.
In a submission to a recent Commission inquiry into Energy Generation and Distribution5, theQueensland Government noted that QEC buys electricity from private suppliers:
... on the basis of its [QEC's] assessment of the costs it avoids by purchasing such electricity. In the cases whereelectricity is supplied only as and when available, these savings are limited to fuel costs, but if a private operationis able to guarantee to operate to an agreed schedule, additional payments are made on account of capital costs ofgenerating plant which may be notionally avoided or deferred because of the purchase capacity.
During the Commission’s inquiry into Energy Generation and Distribution, a number ofparticipants alleged that the prices at which electricity authorities throughout Australia are preparedto purchase electricity from private generators for re-sale are unrealistically low. However, inaddressing this issue, the Commission indicated that, to some extent, low buy back prices may havereflected high levels of surplus generating capacity which existed in most electricity authoritiesduring the 1980s. Mention was also made of legislative barriers to competition that providestate/territory government owned electricity authorities with the sole right to supply electricity forpublic sale in their region. This factor, coupled with the lack of competition from substitute energysources in many electricity markets (eg street lighting and urban rail transport), has reduced thepressures on publicly owned authorities to minimise supply costs. In turn, this has reduced theincentive for government utilities to substitute privately generated electricity for in-house capacitywhere it is cost effective to do so.
5 Industry Commission, Energy Generation and Distribution, Report No. 11, May 1991, AGPS.
THE AUSTRALIANSUGAR INDUSTRY
142
To improve the efficiency of electricity supply, the Commission proposed a range of measuresencompassing the breaking up of the existing government electricity monopolies, privatisation ofsome parts of the industry and the corporatisation of the remaining publicly owned entities. Ifimplemented, these measures would considerably increase the level of competition within theindustry and provide a strong incentive for suppliers to acquire electricity from the cheapestavailable source. In these circumstances, both the demand and price for power from privategenerators, such as sugar mills, would almost certainly increase.
Sugar mills and other potential generators/co-generators of electricity could also benefit from theCommission’s recommendation that electricity transmission grids and distribution systems beoperated on an ‘open access’ basis. This would require that, subject to certain guidelines (egregulations covering safety matters), any party could have access to the electricity transmissionsand distribution systems. This would permit private generators to sell directly to users. Forexample, it would permit CSR mills to sell to adjacent sugar growers, to other electricity users or tosupply electricity for use by CSR establishments located in other parts of Queensland engaged inother forms of commercial activity. Such an arrangement would provide a means by whichpotential generator/co-generators could trade in electricity without having to negotiate buy backprices with electricity authorities.
Agreement to provide open access to state electricity grids was accepted at the July 1991 SpecialPremiers’ Conference as part of an agreement to form a ‘national grid’ linking all eastern andsouthern states. It was also decided to develop a protocol to cover the operations of a national gridfor consideration at a later date. A draft of the protocol was released in December 1991. Whilerecognising that open access should ultimately be provided, the draft would not provide privategenerators or users access to the grid until an unspecified ‘later date’.
In its February 1992 Economic Statement, the Government announced that it would contribute upto $100 million to strengthen existing interstate linkages, conditional on the formation of a separateNational Grid Corporation to own and operate the transmission infrastructure in southern andeastern states. This initiative should increase the likelihood of the development of a competitivemarket in electricity and facilitate participation in electricity generation by private generators,including sugar mills.
10.3.2 Other uses
As reported in the Commission’s report on Pulp and Paper6, bagasse is pulped in many countriesincluding South Africa, Brazil, Cuba, India, Indonesia, China and Taiwan. In 1987, an estimated93 bagasse pulp mills were operating at output capacities of 30 tonnes per day or more.
6 Industry Commission, Pulp and Paper: Bleaching and the Environment, Report No. 1, May 1990, AGPS.

VALUE-ADDING 143
Bagasse fibres are short and comparable to those of hardwood. About 40 per cent of the rawbagasse comprises pith which produces a low strength paper with inferior paper properties.Bagasse pulp must be depithed to minimise the use of pulping chemicals. Depithed bagasse pulp issuitable for tissue papers and other papers requiring dense, low porosity sheets.
In a submission to the Pulp and Paper inquiry, Queensland Bagasse claimed that Australia isessentially the last of the major sugar producing countries which does not exploit its bagasse. Thecompany has proposed a 50 000 tonne pulp mill, costing $150 million, to be sited in northernQueensland. It would produce, using a soda pulping process, both bleached and unbleached pulpfor the export market. Bleaching would involve either chlorine dioxide or a non-chlorine bleachingagent. Though the pulp produced would not have the strength or brightness of equivalent woodpulps, it could be blended with wood pulp in proportions up to 60 per cent, as already done in otherparts of the world.
The Mackay Sugar Co-operative indicated that mills have been trying for many years to findalternative uses for surplus bagasse, ranging from stockfeed to particle board. To date, nofinancially viable project has been developed. It said, however, that it is giving seriousconsideration to a proposal to enter into a joint venture with an Australian company to manufacturepulp from bagasse.
A 1988-89 proposal by CSR for a bagasse pulp mill in the Burdekin irrigation area is still on hold.The proposal is similar to that of Queensland Bagasse. The mill would have a production capacityof 50ÿ000 tonnes of chlorine bleached and unbleached pulp. To provide enough raw material for apulp mill producing 50 000 air dry tonnes per annum, the bagasse from three or four sugar millswould be required -- such a mill would need to be centrally located near a cluster of existing sugarmills.
At the Pulp and Paper inquiry, CSR said that, although it was technically viable, the project was onhold because of the absence of domestic markets, international market uncertainty and theenvironmental problems of chlorine bleaching. It said:
In the absence of a satisfactory domestic market, [CSR] will continue to monitor the situation, particularly thereaction of pulp prices to new pulp manufacturing capacity expected to come on-stream in 1991-92.
In its report on Pulp and Paper, the Commission concluded that prospects for pulp and paper madefrom non-wood feedstocks appear limited on the domestic market. This was because none of thelarge pulp and paper companies sees any advantage in pulping non-wood feedstocks. Some ofthese companies have their own extensive forestry interests, and there appears to be a surplus ofpulpwood available from State forestry commissions. As a result, if pulp and paper were to beproduced in Australia from non-wood feedstocks, they may have to be exported.
EFFECTS OF POLICYCHANGES
145
11 EFFECTS OF POLICY CHANGES
11.1 Domestic reforms
Several influences of the regulatory system are identified in this Chapter as constraining theindustry’s efficiency. Their effects are estimated using modelling techniques. The regulatoryinfluences simulated are:
(a) the limits imposed on the size of the industry by the assignment system,
(b) the constraints on exploiting economies of size at the farm level, due mainly to the difficultyof transferring assignment;
(c) the higher domestic prices made possible by the tariff and the acquisition policy in Queensland.
For comparison, simulations of the effects of reforms in other areas of the Australian economy, andof reform of sugar industry policies in other countries are also presented.
The model used for the domestic simulations is ORANI-FOOD. Although its database has not beenupdated and still relies on 1980-81 information, ORANI-FOOD was chosen for this inquirybecause it is better suited to the analysis of reforms within the sugar industry than standardORANI. Not only are cane-growing, sugar milling and sugar refining separately identified inORANI-FOOD, but also the model incorporates a detailed representation of the agricultural andfood processing sectors generally. Details of the model are presented in Appendix G.
General equilibrium models like ORANI-FOOD are not suited to analysing transition processes.Because of this, the question of how to move from the current environment to a less regulated one,as well as the costs associated with such a move, are not covered. These issues were discussed inChapters 5 and 6.
On 17 September 1991, the Commission held a modelling workshop in Brisbane, presenting itspreliminary analyses of the above issues. Modelling work was also presented by ABARE and theCentre for International Economics. Comments of participants were taken into account whenpreparing the Commission’s reports.
The differences between the analyses reported in this Chapter and in the workshop paper mainlyconcern the domestic reforms considered. First, potential cost savings from lower initial values forsugar land have not been included in these simulations. The main reason for this is the uncertaintyof the direction in which land values will initially change. Second, the responsiveness of thedemand for Australian sugar in ORANI-FOOD to the world price of raw sugar was set relativelylow (an export demand elasticity of --5) so as to be consistent with the international model used toassess the effects of other countries’ protection (Appendix G).
THE AUSTRALIANSUGAR INDUSTRY
146
11.1.1 Feasible improvements
The major production constraint imposed on the sugar industry by the current institutionalarrangements is the limit on the amount of cane that can be grown. A clear indication that moresugar would be produced in a deregulated environment is that the administratively set expansionsin assigned areas have, to-date, been heavily over-subscribed.
In 1991, a year of low world prices and drought, the land sought by applicants was equivalent to atleast a 10 per cent expansion, when only 2.5 per cent was made available. In the previous year,when expansion was set at 8 per cent, the applications were five times higher in the Proserpine andHerbert River areas. They were double the set 8 per cent in the Mackay area, where around a thirdof Queensland’s cane is currently grown. Details of the extent of over-subscription are presented inChapter 5.
One manifestation of the scarcity of land approved for cane-growing is that, in most sugar-growingregions, a premium is paid on assignment. In areas where major expansion is possible, such as theBurdekin, Proserpine and Herbert River, the value of land with assignment is generally abovesimilar land without assignment. In recent years the premium has varied between $ 1000 and $3000a hectare. The premiums have also varied across regions (Chapter 5).
The above suggests that, if the constraints to entry, location and rationalisation were removed, thesugar industry would expand significantly, though it is not clear at what pace. Removal ofconstraints on location and amalgamation would facilitate formation of larger farms, withconsequent efficiencies from lower per unit production costs through exploitation of economies ofsize.
The reforms modelled are described below.
Land expansion
Estimates of the extent to which available land would be taken up for cane-growing vary. TheSugar Industry Working Party reported that there was additional land suitable for cane-growingequivalent to a 50 per cent expansion in the area of land already assigned.1 The QueenslandDepartment of Primary Industries estimated a greater potential for expansion (Table 11. 1).
The potential for expansion varies between regions. Some mill areas are effectively landlocked,with little room for expansion, while others have significant areas that could be used for theproduction of sugar cane. Over half of the additional land identified as being suitable for cane-growing is located in the Burdekin and Herbert River areas (Table 11. 1).
1 Sugar Industry Working Party, Report to the Queensland Minister for Primary Industries, Brisbane, 1990.

EFFECTS OF POLICYCHANGES
147
Table 11.1: Availability of land suitable for cane-growing, 1990Number Of Total area Additional
landMill Area growers assigned availablel
ha ha
Northern 1 404 83 799 59 000Burdekin/Herbert 1 334 85 644 134 0002
Mackay 505 110 059 33 232Southern 1 429 83 196 20 884
State Total 5 672 362 699 247 116
1 Queensland Department of Primary Industries estimates. These are considerably higher than estimates by the Queensland CaneGrowers’ Council and by the CSR/CIE - see Centre for International Economics (1991. p. 33). 2 Includes the 94 000 ha estimate for theHerbert and the 40 000 ha lower bound estimate for the Burdekin (assuming minimum irrigation development).
Source: Sugar Industry Working Party (1990), Appendix 8.
Judging by the extent of over- subscription for the 1990 and 1991 assignments, expansion of theindustry is likely to remain constrained for many years despite announced increases in assignment.
For the modelling work it was assumed that, if cane-growers were free to respond to marketincentives, land under cane would expand by 30 per cent. A simulation assuming a 15 per centexpansion was also carried out.
The practice of granting increases in assignment on a pro-rata basis to existing assignment holdershas encouraged the use of marginal land in existing cane-growing regions at the expense of moresuitable land in new areas. Restrictions on the transfer of assignment between mill areas mean thatgrowers in landlocked areas are unable to use their increased assignment in another mill area. As aconsequence, growers have an incentive to move onto more marginal adjacent land, rather than loseassignment.
The Sugar Industry Working Party estimated that some 5 per cent of assigned land was marginal orunsuitable for cane-growing.2 For this analysis it was assumed that, in a more flexibleenvironment, production from the 5 per cent of marginal areas would shift to the new areas (egBurdekin, Herbert River, Proserpine).
Simulating the removal of the assignment system requires, in the model, the shifting of land intocane-growing away from other agricultural uses. In the simulations the Commission increased thearea of land available to ORANI-FOOD’s cane-growing industry by 30 per cent, with offsettingreductions in the area available to alternative agricultural activities. The movement of activity frommarginal land in existing regions to the new areas has been modelled as a further expansion of 5per cent in the new areas and an equivalent decline in existing areas.
2 Ibid
THE AUSTRALIANSUGAR INDUSTRY
148
At the Commission’s workshop, some participants expressed concern about the ability of theindustry to expand by 30 per cent due to the difficulties of financing an expansion of thatmagnitude. However, the extent of over-subscription of assignment in recent years suggests thatexisting and potential cane-growers consider that they would be able to finance expansions wellbeyond those set for 1990 and 1991.
The timeframe of expansions is not specified in the model. The rate at which land suitable for cane-growing is taken up in practice will depend on producers’ assessment of the short and long-termprice prospects for sugar. However, while a crucial commercial issue, world price prospects are notrelevant to the simulations presented. This is because the simulations are only concerned with theeffects of the policy changes modelled, keeping all other economic factors, including the worldprice, unchanged.
Lower production costs
Per unit production costs vary significantly across farms, some operations being run moreefficiently than others. For example, production costs on marginal land are likely to beconsiderably higher than the average and the costs of recent entrants to the industry would need tobe relatively low to make up for receiving the lower pool 2 price and, for some, the costs of havingto lease assignment. This suggests that there is significant scope for productivity improvements onmany established farms. The Commission has attempted to assess the extent to which per unitproduction costs vary with farm size and between farms of the same size. However, there wasinsufficient data on cane farm cost structures from the usual official sources, such as ABARE andthe ABS.
In its submission Davco alluded to the productivity improvements that could be achieved throughgreater use of broad-area farming techniques. Davco described how it managed to achievesignificant cost reductions on its 570 ha Burdekin region cane farm. It explained how, by settingout each paddock as a one kilometre square -- so as to minimise the time and quantity of labourrequired in irrigating, cultivating and harvesting -- it achieved significant cost reductions.
Based on figures produced in Sedgwick, Davco estimated the potential cost savings fromeconomies of size (Figure 11.1).3 In the calculations, savings arose because employed and imputedowner-operator labour, and depreciation on capital fell on a per tonne basis as farm size increased.The costs associated with fertilisers, fuels, levies, repairs, irrigation, harvesting and interest oncapital borrowing were assumed to be constant on a per tonne basis, irrespective of farm size.
3 Sedgwick, KX, Estimates of Profitability of Burdekin Irrigation Farms, Queensland Department of
Primary Industries, Information Series QI 87011, Brisbane, 1990.

EFFECTS OF POLICYCHANGES
149
Figure 11.1 indicates that in 1987 the cost of production for the average 65 ha cane farm inQueensland was around $30 per tonne. For farms of around 300 ha or more, the unit costs ofproduction were estimated to be around $20 per tonne -- a saving of one third. These estimates arein line with the findings of O’Sullivan, who calculated that cost savings of around 30 per cent arepossible by increasing farm size from 100 ha to 300 ha.4 Actual variations in per unit costs acrossfarms suggest that cost differences of around 30 per cent are currently occurring in the industry.For example, growers who lease assignment at a cost of 15 per cent of gross returns and are alsoreceiving the 12 per cent lower pool 2 price must, of necessity, operate with a significantly lowercost structure (up to 30 per cent) than the marginal grower who receives pool 1 returns.
Figure 11.1: Average cost of production, 1987
Source: Submission by DAW0 (No. 24, p. 22).
The Commission has assumed for modelling purposes that the potential 30 per cent land expansionand the 5 per cent relocation of marginal lands in Queensland would result in large farms in thenew areas, while the average farm size would remain unchanged in existing areas. Cost reductionsof around a third would thus result for 26 per cent of the cultivated area Australia-wide. This isequivalent to a cost reduction of around 9 per cent when averaged across all cane farms withinAustralia. The cost reductions would arise from adoption by more, growers of best practice canegrowing, including exploitation of available economies of size.
4 O’Sullivan, M. H., Sugar Cane: Biological and Environmental Considerations, Alternative Uses and
Economies of Scale, Contributed paper presented to Agricultural Economics Society Conference, Brisbane,12-15 February, 1990.

THE AUSTRALIANSUGAR INDUSTRY
150
In practice, even in an unconstrained environment not all new farms would be large. Offsetting this,however, would be changes in traditional cane-growing regions, a less constrained environmentmaking it easier for existing farms to amalgamate and thus reap the benefits of economies of size.Thus, it is unclear whether the 9 per cent cost reduction simulated is an over or under-estimate ofwhat might actually occur Australia-wide.
Removal of domestic price distortions
The tariff, together with acquisition and the single seller arrangements in Queensland, allows theraising of the domestic price of raw sugar above the price at which the majority of raw sugar isexported. The maximum price that can be charged on the domestic market, while still keeping outimports, is the landed duty paid price of imported raw sugar. With no tariff, and in the absence ofacquisition, competition for the domestic market between mills would be likely to reduce thedomestic price of raw sugar close to export parity.
For refined sugar it is unclear whether, in a deregulated environment, the industry would remainimport competing or become a significant exporter. For the simulations it was assumed that theindustry would remain import competing. The benchmark price for calculating the domestic pricedistortions was thus the duty-free import parity price for refined sugar.
The domestic price distortions considered in the simulations are the developing country ratescalculated for 1991-92 (28 per cent of the export parity price for raw sugar and 7 per cent of theimport parity price for refined sugar). The effects of the 1989-90 estimate (38 and 13 per cent) andthe 1992-93 estimate (23 and 4 per cent) are also considered. Details are in Workshop Paper No. 3,’Assistance to the Australian Sugar Industry’, available from the Commission on request.
There is some debate as to whether the estimate for raw sugar is too high, given that the domesticprice may not be set at the maximum allowed by the tariff. However, a major conclusion of thesimulations is that the effect of removing the tariff by itself is small compared with that of otherpossible reforms. Such a conclusion would not be altered if the estimated values of the domesticprice distortions were lowered.
11.1.2 Results of simulations
The following changes to the current system were simulated:
(a) land expansion and on-farm productivity improvements: a 30 per cent land expansion plus a9 per cent reduction in on-farm costs estimated to be available through exploitation ofeconomies of size. The cost savings were simulated as a uniform productivity improvementarising from improved use of all farm inputs; and
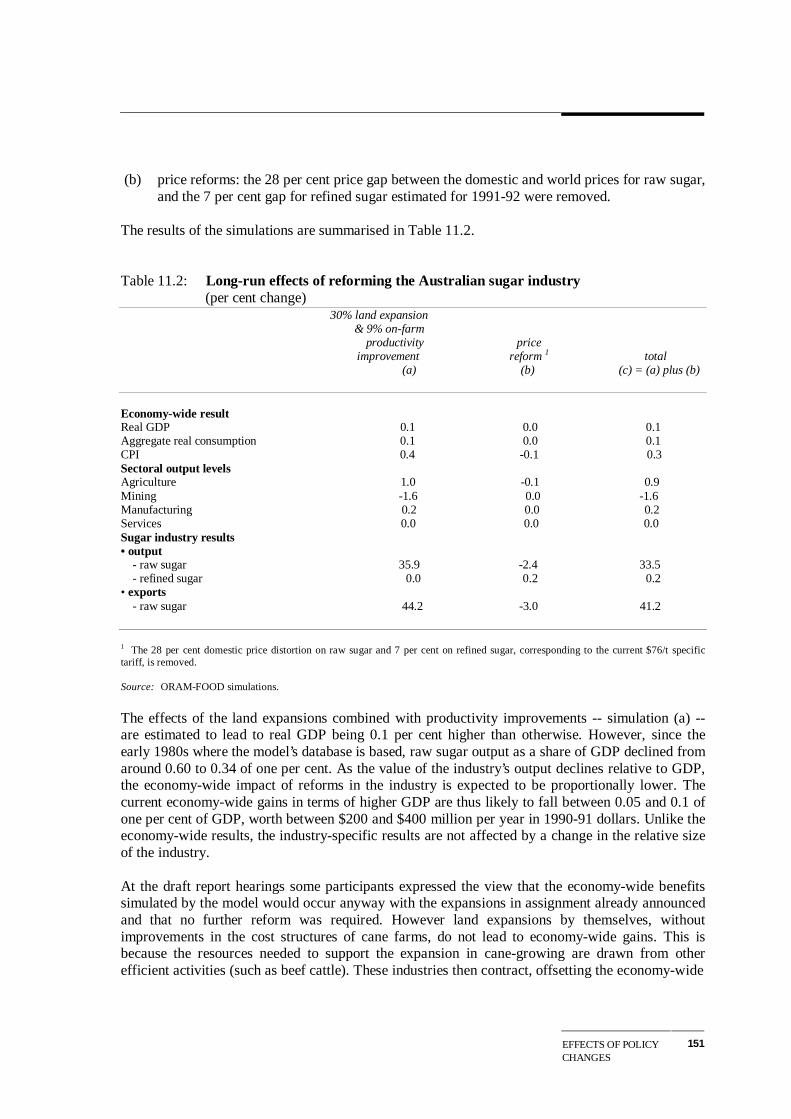
EFFECTS OF POLICYCHANGES
151
(b) price reforms: the 28 per cent price gap between the domestic and world prices for raw sugar,and the 7 per cent gap for refined sugar estimated for 1991-92 were removed.
The results of the simulations are summarised in Table 11.2.
Table 11.2: Long-run effects of reforming the Australian sugar industry (per cent change)
30% land expansion & 9% on-farm productivity price improvement reform 1 total (a) (b) (c) = (a) plus (b)
Economy-wide resultReal GDP 0.1 0.0 0.1Aggregate real consumption 0.1 0.0 0.1CPI 0.4 -0.1 0.3Sectoral output levelsAgriculture 1.0 -0.1 0.9Mining -1.6 0.0 -1.6Manufacturing 0.2 0.0 0.2Services 0.0 0.0 0.0Sugar industry results• output
- raw sugar 35.9 -2.4 33.5- refined sugar 0.0 0.2 0.2
• exports- raw sugar 44.2 -3.0 41.2
1 The 28 per cent domestic price distortion on raw sugar and 7 per cent on refined sugar, corresponding to the current $76/t specifictariff, is removed.
Source: ORAM-FOOD simulations.
The effects of the land expansions combined with productivity improvements -- simulation (a) --are estimated to lead to real GDP being 0.1 per cent higher than otherwise. However, since theearly 1980s where the model’s database is based, raw sugar output as a share of GDP declined fromaround 0.60 to 0.34 of one per cent. As the value of the industry’s output declines relative to GDP,the economy-wide impact of reforms in the industry is expected to be proportionally lower. Thecurrent economy-wide gains in terms of higher GDP are thus likely to fall between 0.05 and 0.1 ofone per cent of GDP, worth between $200 and $400 million per year in 1990-91 dollars. Unlike theeconomy-wide results, the industry-specific results are not affected by a change in the relative sizeof the industry.
At the draft report hearings some participants expressed the view that the economy-wide benefitssimulated by the model would occur anyway with the expansions in assignment already announcedand that no further reform was required. However land expansions by themselves, withoutimprovements in the cost structures of cane farms, do not lead to economy-wide gains. This isbecause the resources needed to support the expansion in cane-growing are drawn from otherefficient activities (such as beef cattle). These industries then contract, offsetting the economy-wide

THE AUSTRALIANSUGAR INDUSTRY
152
benefits of the expansion in the sugar industry. It is the productivity improvements made possibleby deregulation of the sugar industry that allow an improvement in GDP and the living standards ofAustralians, by using less resources per unit of sugar output, and not the 30 per cent land expansionfor sugar alone.
In simulation (a) the higher level of economy-wide activity, stimulated by the expansion of a moreproductive cane-growing industry, leads to upward pressure on wages and inflation. The CPI wasestimated to increase slightly, by 0.4 per cent. Raw sugar output and exports were estimated to be36 and 44 per cent higher, respectively. In 1990-9 1, a 44 per cent expansion in exports would havebeen worth $375 million.
The cost reductions resulting from on-farm productivity improvements have been modelled as anequal improvement in the efficiency of use of all inputs. One implication of this is that averagecane yields are simulated to increase (land expands by 30 per cent while cane output expands by 36per cent, leading to an implied 4.5 per cent yield increase). There are likely to be forces operatingin both directions on average yields following deregulation. With the relaxation of land constraintsthere would be less pressure for farmers to use fertilisers and other non-land inputs to increaseyields. However, the most marginal land currently being used may no longer be planted to cane andexpansions of cane-growing land would most likely be concentrated in newly available irrigatedareas, such as the Burdekin. Since yields in these areas are well above the current Queenslandaverage, their expansion would put upward pressure on the average yield achieved by the industry.
The expansion in output would not be evenly distributed across regions. Based on the assumptionthat the regional distribution of the expansion would be broadly proportional to the additional landavailable in each region, production would expand in the Burdekin and Herbert River by over 80per cent, in the Northern region by close to 40 per cent, and in the Mackay and Southern regions byover 10 per cent (Figure 11.2).5 This is broadly in line with the findings of the Centre forInternational Economics, which used an ORANI based model with Australia’s sugar industrydisaggregated into five regions.6 In its ’unconstrained expansion’ simulation, the Centre predictedoutput expansions of 36 per cent in the North, 119 per cent in the Burdekin, 50 per cent in theCentral region and 25 per cent in the South (Table A2).
Although Australia’s sugar industry is simulated to expand overall, not all cane-growers areexpected to benefit. In its workshop paper ABARE predicted, using its cane farm model, thatlandlocked farmers would be worse off, receiving slightly lower prices for their cane, with most ofthe benefit flowing onto non-landlocked farms. ABARE predicted a 32 per cent increase in theaverage net farm revenue of non-landlocked farms.
5 Since the policy changes do not affect New South Wales growers, no change was assumed for New South Wales.6 Centre for International Economics, Sugar Winning in a Corrupt World Market, report commissioned by
CSR Limited, 1991.
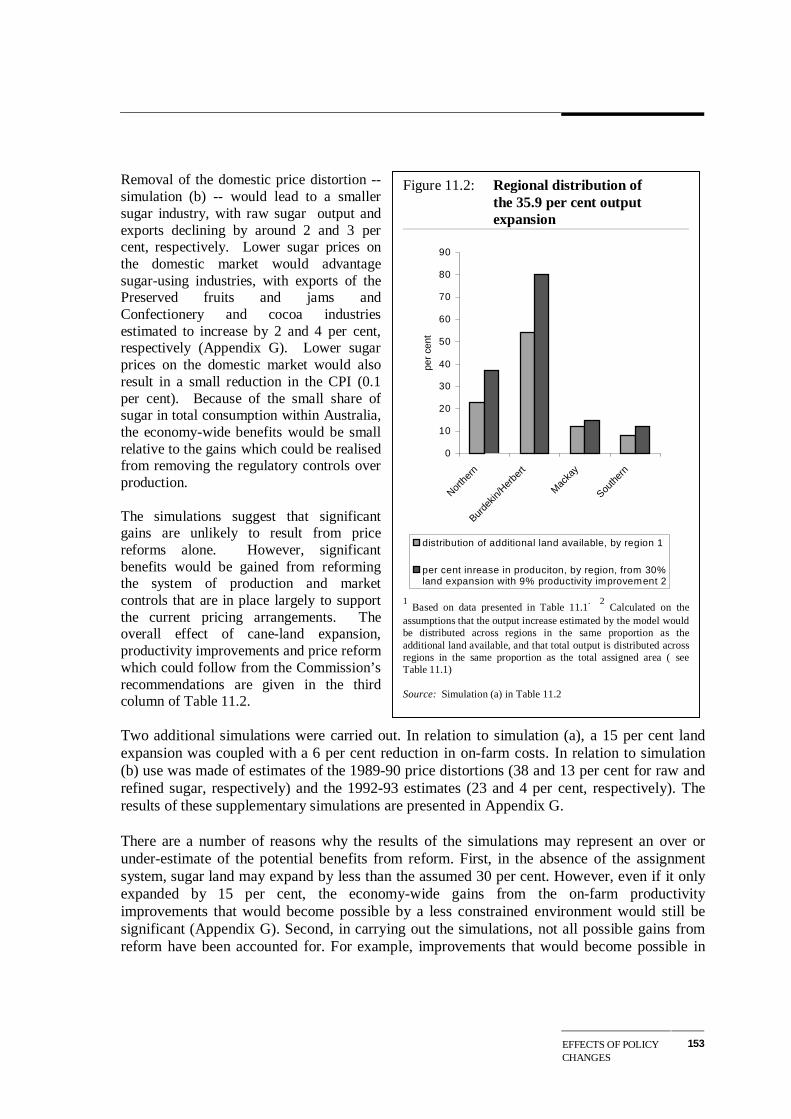
EFFECTS OF POLICYCHANGES
153
Removal of the domestic price distortion --simulation (b) -- would lead to a smallersugar industry, with raw sugar output andexports declining by around 2 and 3 percent, respectively. Lower sugar prices onthe domestic market would advantagesugar-using industries, with exports of thePreserved fruits and jams andConfectionery and cocoa industriesestimated to increase by 2 and 4 per cent,respectively (Appendix G). Lower sugarprices on the domestic market would alsoresult in a small reduction in the CPI (0.1per cent). Because of the small share ofsugar in total consumption within Australia,the economy-wide benefits would be smallrelative to the gains which could be realisedfrom removing the regulatory controls overproduction.
The simulations suggest that significantgains are unlikely to result from pricereforms alone. However, significantbenefits would be gained from reformingthe system of production and marketcontrols that are in place largely to supportthe current pricing arrangements. Theoverall effect of cane-land expansion,productivity improvements and price reformwhich could follow from the Commission’srecommendations are given in the thirdcolumn of Table 11.2.
Two additional simulations were carried out. In relation to simulation (a), a 15 per cent landexpansion was coupled with a 6 per cent reduction in on-farm costs. In relation to simulation(b) use was made of estimates of the 1989-90 price distortions (38 and 13 per cent for raw andrefined sugar, respectively) and the 1992-93 estimates (23 and 4 per cent, respectively). Theresults of these supplementary simulations are presented in Appendix G.
There are a number of reasons why the results of the simulations may represent an over orunder-estimate of the potential benefits from reform. First, in the absence of the assignmentsystem, sugar land may expand by less than the assumed 30 per cent. However, even if it onlyexpanded by 15 per cent, the economy-wide gains from the on-farm productivityimprovements that would become possible by a less constrained environment would still besignificant (Appendix G). Second, in carrying out the simulations, not all possible gains fromreform have been accounted for. For example, improvements that would become possible in
Figure 11.2: Regional distribution of the 35.9 per cent output expansion
0
10
20
30
40
50
60
70
80
90
North
ern
Burde
kin/H
erber
t
Mac
kay
South
ern
per
cent
distribution of additional land available, by region 1
per cent inrease in produciton, by region, from 30%land expansion with 9% productivity improvement 2
1 Based on data presented in Table 11.1
. 2 Calculated on the
assumptions that the output increase estimated by the model wouldbe distributed across regions in the same proportion as theadditional land available, and that total output is distributed acrossregions in the same proportion as the total assigned area ( seeTable 11.1)
Source: Simulation (a) in Table 11.2
THE AUSTRALIANSUGAR INDUSTRY
154
harvesting, in the transport of cane and in its processing, as well as the economies of size in theexisting cane-growing regions that are likely to occur once constraints on the location andamalgamation of farms are removed, have not been modelled.
In summary, the key findings are that:
• significant benefits would anise from removing regulations which constrain production andsupport the raw sugar and cane pricing arrangements. Removal of the tariff alone would haverelatively little direct impact; and
• the 9 per cent on --farm productivity improvement resulting from a more flexible industryallowed by the freeing up of regulations would provide considerable industry-wide benefits (36per cent increase in output leading to $375 million worth of additional raw sugar exportsannually) and economy -- wide benefits (0.05 to 0. 1 per cent increase in real GDP, worthbetween $200 and $400 million annually).
11.2 International reforms
The purpose of the international simulations reported in this Section is to assess the implicationsfor Australia of various reforms in world sugar trade. The analyses have been prepared in responseto section 3(a) of the terms of reference which requests the Commission to consider, amongst otherthings, the international marketing environment for sugar.
Several publicly available models can be used to analyse the effects of international sugar reform.Most cover all major agricultural commodities. One exception is SUGABARE, developed by theAustralian Bureau of Agricultural and Resource Economics (ABARE), which focuses on the worldtrade of sugar only.7 For this report, the Commission has mainly used SUGABARE. For purposesof comparison, the Commission also made use of its multicommodity World Food Trade (WFT)model. Both are described in Appendix H.
SUGABARE and the WFT model were used to assess the extent to which other countries'protection raises or lowers the world price of raw sugar. ORANI-FOOD was then used to estimatethe implications for Australia of the changes in world sugar prices that would be likely in aliberalised trading environment.
11.2.1 Other countries’ protection
There appears to be a general perception that world sugar prices have been depressed as a result ofother countries' sugar policies. Most submissions commented on the high protection offered to thesugar industries of key OECD economies. The OECD group, however, accounts for only arelatively small proportion of world raw sugar production and consumption. Policies of both OECD
7 Australia Bureau of Agricultural and Resource Economics, The Economic Consequences of International
Sugar Trade Reform, Discussion Paper 89.7, AGPS, Canberra, 1989.
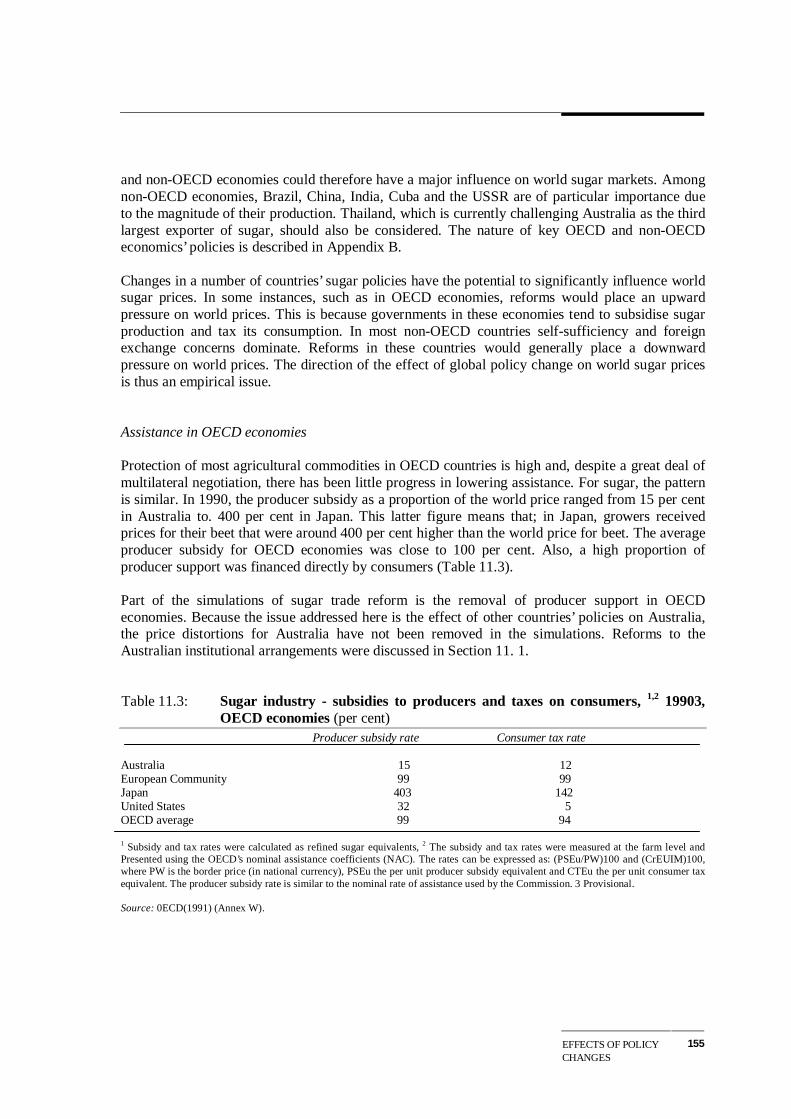
EFFECTS OF POLICYCHANGES
155
and non-OECD economies could therefore have a major influence on world sugar markets. Amongnon-OECD economies, Brazil, China, India, Cuba and the USSR are of particular importance dueto the magnitude of their production. Thailand, which is currently challenging Australia as the thirdlargest exporter of sugar, should also be considered. The nature of key OECD and non-OECDeconomics’ policies is described in Appendix B.
Changes in a number of countries’ sugar policies have the potential to significantly influence worldsugar prices. In some instances, such as in OECD economies, reforms would place an upwardpressure on world prices. This is because governments in these economies tend to subsidise sugarproduction and tax its consumption. In most non-OECD countries self-sufficiency and foreignexchange concerns dominate. Reforms in these countries would generally place a downwardpressure on world prices. The direction of the effect of global policy change on world sugar pricesis thus an empirical issue.
Assistance in OECD economies
Protection of most agricultural commodities in OECD countries is high and, despite a great deal ofmultilateral negotiation, there has been little progress in lowering assistance. For sugar, the patternis similar. In 1990, the producer subsidy as a proportion of the world price ranged from 15 per centin Australia to. 400 per cent in Japan. This latter figure means that; in Japan, growers receivedprices for their beet that were around 400 per cent higher than the world price for beet. The averageproducer subsidy for OECD economies was close to 100 per cent. Also, a high proportion ofproducer support was financed directly by consumers (Table 11.3).
Part of the simulations of sugar trade reform is the removal of producer support in OECDeconomies. Because the issue addressed here is the effect of other countries’ policies on Australia,the price distortions for Australia have not been removed in the simulations. Reforms to theAustralian institutional arrangements were discussed in Section 11. 1.
Table 11.3: Sugar industry - subsidies to producers and taxes on consumers, 1,2 19903,OECD economies (per cent)
Producer subsidy rate Consumer tax rate
Australia 15 12European Community 99 99Japan 403 142United States 32 5OECD average 99 94
1 Subsidy and tax rates were calculated as refined sugar equivalents, 2 The subsidy and tax rates were measured at the farm level andPresented using the OECD’s nominal assistance coefficients (NAC). The rates can be expressed as: (PSEu/PW)100 and (CrEUIM)100,where PW is the border price (in national currency), PSEu the per unit producer subsidy equivalent and CTEu the per unit consumer taxequivalent. The producer subsidy rate is similar to the nominal rate of assistance used by the Commission. 3 Provisional.
Source: 0ECD(1991) (Annex W).
THE AUSTRALIANSUGAR INDUSTRY
156
The effect of policies within the OECD group is to depress world sugar prices below what theywould be in a ’free-trade’ environment. Estimates of the extent to which reform in OECDeconomies would be likely to raise world prices are presented in sections 11.2.2 and 11.2.3.
Assistance in non-OECD economies
In non-OECD economies the focus tends to be on self-sufficiency and foreign exchange concerns.Because little information is available on the policies of many of these countries, reforms innon-OECD economies are much harder to define and simulate. Some attempts can, however, bemade to assess the changes in the world price of raw sugar that would be likely to follow reforms inthese economies.
If Brazil were to adopt a more market-oriented approach towards its fuel policy, it would lowerethanol subsidies and ease export controls on raw sugar. This is because ethanol is not a cost-effective alternative to petrol, given current crude oil prices (see Borrell).8
At one extreme, if all cane grown in Brazil were used to produce raw sugar (rather than beingdiverted to ethanol), the increases in Brazil’s production would be equivalent to a rise of around 11per cent in the world’s raw sugar production. This would correspond to a ten fold increase inBrazilian exports. For this report it was assumed that, in the medium term, Brazil would place lessemphasis on its ethanol policies and that this would allow a third of the cane allocated to ethanolproduction to be diverted to the production of raw sugar, leading to a 50 per cent increase inBrazilian raw sugar production.9 In 1989, this would have amounted to a 400 per cent increase inBrazil’s raw sugar exports.
Policies in Mexico also severely constrain sugar production. Borrell notes that in Mexico stateagencies affect the cultivation and milling of cane, influence the operations of the sweetener usingsector and govern virtually all aspects of pricing 10
At the Commission’s modelling workshop, the question arose as to whether raw sugar production innon-OECD countries would actually expand if government policies were relaxed. The propositionwas that these economies may be inefficient sugar producers and that their cane-growers may beheavily subsidised, in an indirect way, by the complex web of regulations currently in place.
8 Borrell, B., How a Change in Brazil’s Sugar Policies Would Affect The World Sugar Market, Policy
Research and Extension Affairs, Working Papers, International Trade, International EconomicsDepartment, The World Bank, April, WPS 522, Washington D.C, 1991.
9 The figure of a third for diversion of the cane allocated to ethanol production was chosen for technicalreasons. It was the greatest proportion diverted that SUGABARE was able to handle. This is because themodel tends to show unrealistically large production responses to price changes outside the range of thehistorical data on which it is based, due to the exponential terms in its production equations (Appendix H).
10 Borrell, B., The Mexican Sugar Industry, Problems and Prospects, Working Papers, International Trade,International Economics Department, The World Bank, February, WPS 522, Washington D.C, 1991.
EFFECTS OF POLICYCHANGES
157
The Commission investigated this issue and found that key non-OECD economies tended to becost-effective sugar producers. For example, Landell Mills ranked Thailand 6th, Brazil 7th, Mexico15th and India 24th in terms of ex-mill cane sugar production costs out of the 61 countries itsurveyed in 1986-87.11 Australia ranked 8th, the US (mainland) 29th, Hawaii 35th and Japan 60th.That Brazil, India, Thailand and Mexico are still relatively efficient producers is shown by thegrower price data released recently by the US Department of Agriculture12 (see Appendix H). Theavailable evidence thus suggests that several key non-0ECD economies are efficient sugarproducers, with potential to compete internationally without government assistance.
The increase in the volume of sugar traded internationally if Brazil and Mexico adopted moremarket-driven policies would be very large. Trade expansion of that order would be expected toplace a considerable downward pressure on the world price of raw sugar.
For Thailand, it is unclear whether the setting of domestic prices represents assistance to growersand/or millers. There seems to be a general view that the Thai sugar industry is heavily exposed tothe world free market. This suggests that, even if the industry were assisted, the level of assistancewould be quite low.
Cuba’s share of world sugar exports could decline considerably if the planned withdrawal of theimplicit subsidies by the states previously belonging to the USSR were actually implemented.However, Soviet sugar imports may also decline, as its member states strive for greater selfsufficiency in an attempt to save foreign exchange. Because the net effect of the breaking up of theUSSR/Cuba relationship is unclear, changes to the USSR/Cuba trade agreement have not beensimulated.
In other non-OECD countries it is possible that imports of sugar will in general grow more rapidlyin the future than in the past. The tendency in these countries to relax trade barriers, in an attemptto secure IMF loans, suggests that their imports will increase significantly over the next 5 to 10years. Key countries among the non-OECD group are Thailand, which is a major exporter andIndia, which is a major producer. Government interventions seem to be minimal in Thailand,however until recently they have been considerable in India. With taxes on sugar production inIndia having been lowered as part of India’s recently announced trade reforms, that country couldbecome an exporter of sugar. This could place a significant downward pressure on the world priceof raw sugar.
The likely direction of world sugar price changes as a result of reforms in key non-OECDeconomies is indicated in Table 11.4.
Overall, liberalisation of sugar polices in key non-OECD economies would be likely to place asignificant downward pressure on the world price of raw sugar.
11Landell Mills Commodity Studies (1989), ’A World Survey of Sugar and HFCS Production Costs, 1979/80
to 1986/87’.12 US Department of Agriculture (1991), World Sugar Situation and Outlook, May.
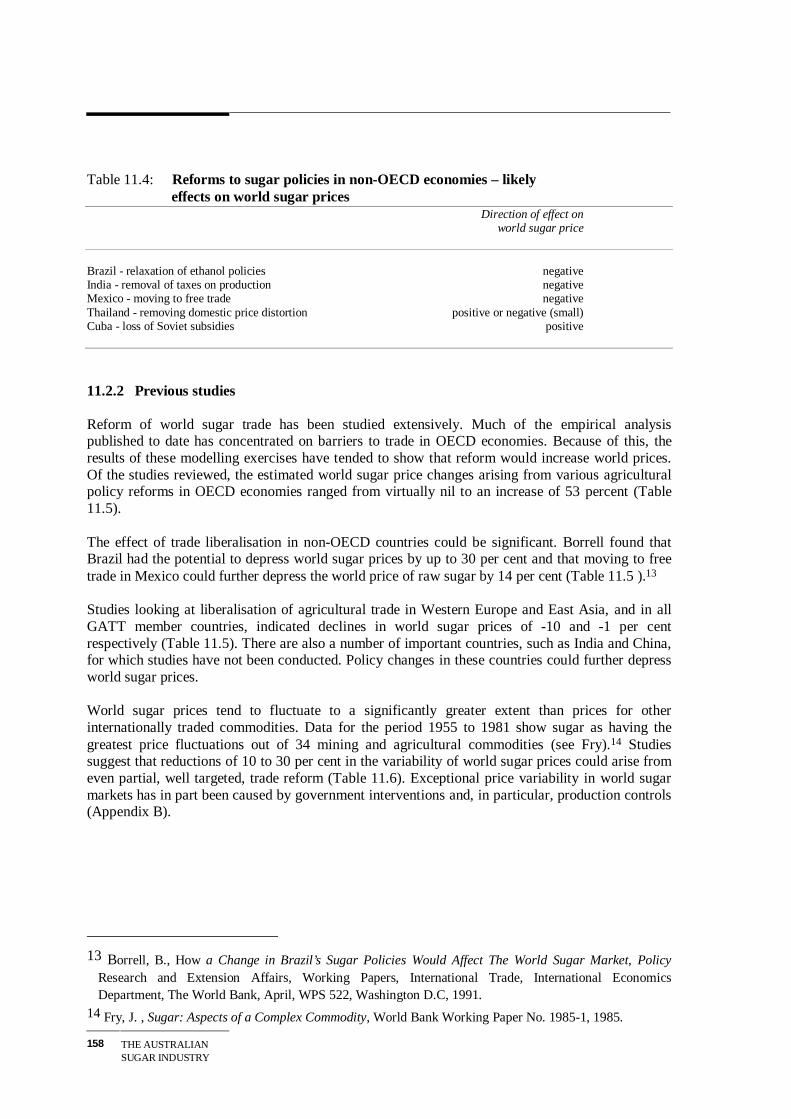
THE AUSTRALIANSUGAR INDUSTRY
158
Table 11.4: Reforms to sugar policies in non-OECD economies – likely effects on world sugar prices
Direction of effect onworld sugar price
Brazil - relaxation of ethanol policies negativeIndia - removal of taxes on production negativeMexico - moving to free trade negativeThailand - removing domestic price distortion positive or negative (small)Cuba - loss of Soviet subsidies positive
11.2.2 Previous studies
Reform of world sugar trade has been studied extensively. Much of the empirical analysispublished to date has concentrated on barriers to trade in OECD economies. Because of this, theresults of these modelling exercises have tended to show that reform would increase world prices.Of the studies reviewed, the estimated world sugar price changes arising from various agriculturalpolicy reforms in OECD economies ranged from virtually nil to an increase of 53 percent (Table11.5).
The effect of trade liberalisation in non-OECD countries could be significant. Borrell found thatBrazil had the potential to depress world sugar prices by up to 30 per cent and that moving to freetrade in Mexico could further depress the world price of raw sugar by 14 per cent (Table 11.5 ).13
Studies looking at liberalisation of agricultural trade in Western Europe and East Asia, and in allGATT member countries, indicated declines in world sugar prices of -10 and -1 per centrespectively (Table 11.5). There are also a number of important countries, such as India and China,for which studies have not been conducted. Policy changes in these countries could further depressworld sugar prices.
World sugar prices tend to fluctuate to a significantly greater extent than prices for otherinternationally traded commodities. Data for the period 1955 to 1981 show sugar as having thegreatest price fluctuations out of 34 mining and agricultural commodities (see Fry).14 Studiessuggest that reductions of 10 to 30 per cent in the variability of world sugar prices could arise fromeven partial, well targeted, trade reform (Table 11.6). Exceptional price variability in world sugarmarkets has in part been caused by government interventions and, in particular, production controls(Appendix B).
13 Borrell, B., How a Change in Brazil’s Sugar Policies Would Affect The World Sugar Market, Policy
Research and Extension Affairs, Working Papers, International Trade, International EconomicsDepartment, The World Bank, April, WPS 522, Washington D.C, 1991.
14 Fry, J. , Sugar: Aspects of a Complex Commodity, World Bank Working Paper No. 1985-1, 1985.

EFFECTS OF POLICYCHANGES
159
Table 11.5: Effects on the world price of sugar of reform of domestic markets – the results of carious models ( per cent change)
Effect on WorldAuthor Model Simulation Sugar Price
Modelling changes in OECD economies’ policies
Roningen and SWOPSIM Removal of all agricultural assistance in +53Dixit (1989) industrial market economies
ABARE (1989) SUGABARE Partial liberalisation, reduction of domestic +4 sugar prices by 10 percent in the United States, EC Japan and Australia
Partial liberalisation, OECD consumers forced +8 to pay world prices, some liberalisation of marginal production of major exporters
Reduction in domestic sugar and grains prices -1 in the US, EC, Japan and Australia
Borrell and SUGABARE partial liberalisation in US, Japan and EC +33Duncan (1990)
OECD (1989) Ministerial Trade Reform measures in EC countries only 10% +2 Mandate Model reduction in consumer subsidy equivalents
Modelling changes in both OECD and non-OECD countries
Anderson and Removal of all agricultural support in -10Tyers (1986) Western European Countries and East Asia
Horridge, Pearce, WFT model Removal of all agricultural trade distortions in -1Walker (1990) GATT member countries
Borrell (1992a) SUGABARE 8.3 percent increase in Brazilian exports1 -2.4 32.6 percent increase in Brazilian exports1 -9.8 96.1 percent increase in Brazilian exports1
Borrell (1991b) SUGABARE move to free trade in Mexico -14
1 The simulations concern sustained increases in exports from 1985 onwards.
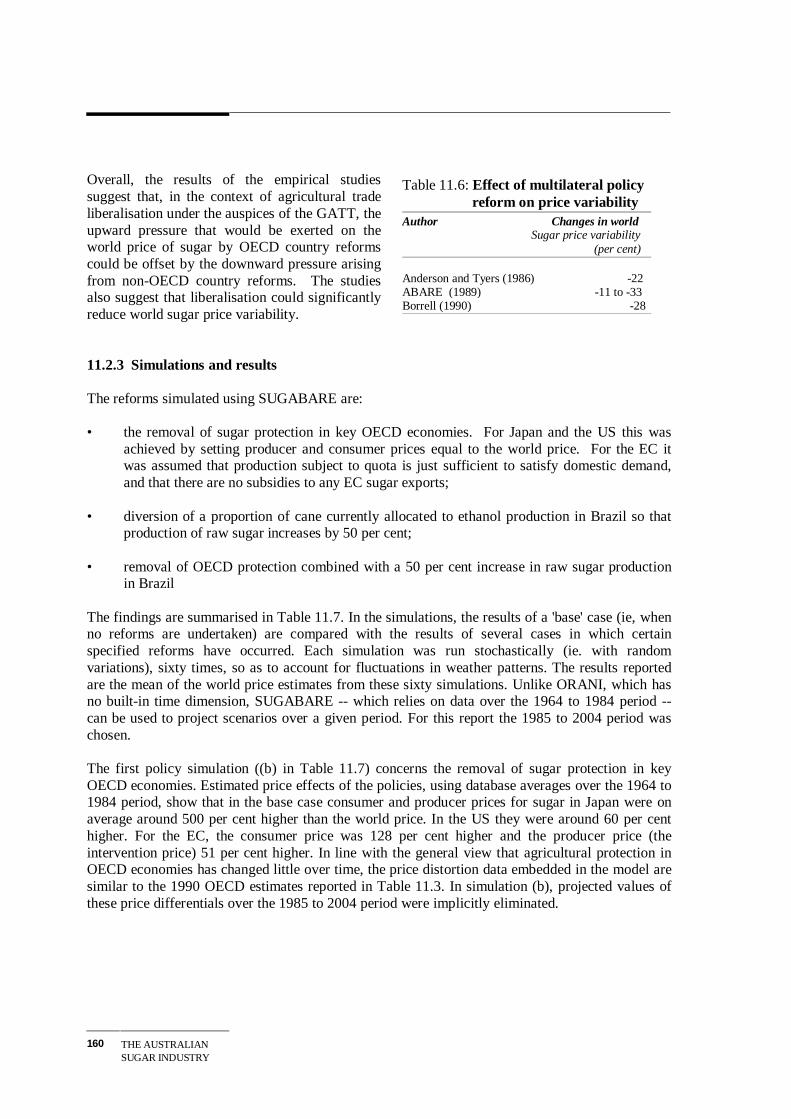
THE AUSTRALIANSUGAR INDUSTRY
160
Overall, the results of the empirical studiessuggest that, in the context of agricultural tradeliberalisation under the auspices of the GATT, theupward pressure that would be exerted on theworld price of sugar by OECD country reformscould be offset by the downward pressure arisingfrom non-OECD country reforms. The studiesalso suggest that liberalisation could significantlyreduce world sugar price variability.
11.2.3 Simulations and results
The reforms simulated using SUGABARE are:
• the removal of sugar protection in key OECD economies. For Japan and the US this wasachieved by setting producer and consumer prices equal to the world price. For the EC itwas assumed that production subject to quota is just sufficient to satisfy domestic demand,and that there are no subsidies to any EC sugar exports;
• diversion of a proportion of cane currently allocated to ethanol production in Brazil so thatproduction of raw sugar increases by 50 per cent;
• removal of OECD protection combined with a 50 per cent increase in raw sugar productionin Brazil
The findings are summarised in Table 11.7. In the simulations, the results of a 'base' case (ie, whenno reforms are undertaken) are compared with the results of several cases in which certainspecified reforms have occurred. Each simulation was run stochastically (ie. with randomvariations), sixty times, so as to account for fluctuations in weather patterns. The results reportedare the mean of the world price estimates from these sixty simulations. Unlike ORANI, which hasno built-in time dimension, SUGABARE -- which relies on data over the 1964 to 1984 period --can be used to project scenarios over a given period. For this report the 1985 to 2004 period waschosen.
The first policy simulation ((b) in Table 11.7) concerns the removal of sugar protection in keyOECD economies. Estimated price effects of the policies, using database averages over the 1964 to1984 period, show that in the base case consumer and producer prices for sugar in Japan were onaverage around 500 per cent higher than the world price. In the US they were around 60 per centhigher. For the EC, the consumer price was 128 per cent higher and the producer price (theintervention price) 51 per cent higher. In line with the general view that agricultural protection inOECD economies has changed little over time, the price distortion data embedded in the model aresimilar to the 1990 OECD estimates reported in Table 11.3. In simulation (b), projected values ofthese price differentials over the 1985 to 2004 period were implicitly eliminated.
Table 11.6: Effect of multilateral policy reform on price variabilityAuthor Changes in world Sugar price variability (per cent)
Anderson and Tyers (1986) -22ABARE (1989) -11 to -33Borrell (1990) -28
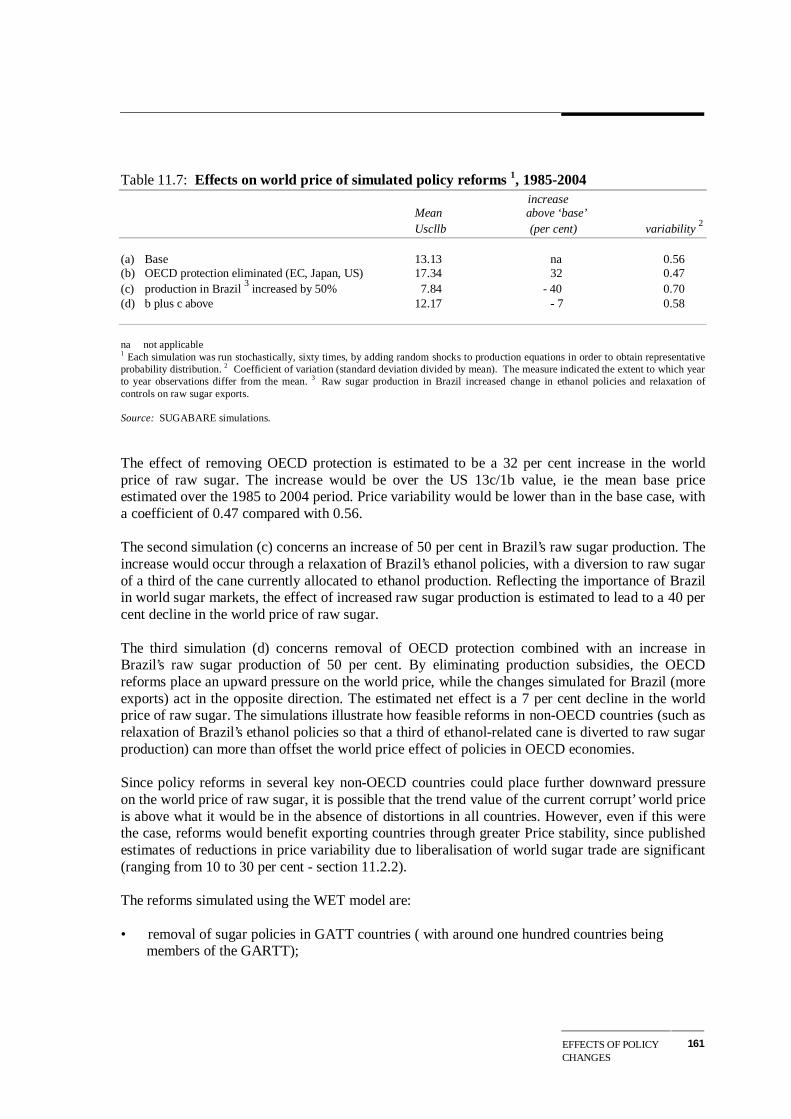
EFFECTS OF POLICYCHANGES
161
Table 11.7: Effects on world price of simulated policy reforms 1, 1985-2004 increase
Mean above ‘base’ Uscllb (per cent) variability
2
(a) Base 13.13 na 0.56(b) OECD protection eliminated (EC, Japan, US) 17.34 32 0.47(c) production in Brazil 3 increased by 50% 7.84 - 40 0.70(d) b plus c above 12.17 - 7 0.58
na not applicable1 Each simulation was run stochastically, sixty times, by adding random shocks to production equations in order to obtain representativeprobability distribution. 2 Coefficient of variation (standard deviation divided by mean). The measure indicated the extent to which yearto year observations differ from the mean. 3 Raw sugar production in Brazil increased change in ethanol policies and relaxation ofcontrols on raw sugar exports.
Source: SUGABARE simulations.
The effect of removing OECD protection is estimated to be a 32 per cent increase in the worldprice of raw sugar. The increase would be over the US 13c/1b value, ie the mean base priceestimated over the 1985 to 2004 period. Price variability would be lower than in the base case, witha coefficient of 0.47 compared with 0.56.
The second simulation (c) concerns an increase of 50 per cent in Brazil’s raw sugar production. Theincrease would occur through a relaxation of Brazil’s ethanol policies, with a diversion to raw sugarof a third of the cane currently allocated to ethanol production. Reflecting the importance of Brazilin world sugar markets, the effect of increased raw sugar production is estimated to lead to a 40 percent decline in the world price of raw sugar.
The third simulation (d) concerns removal of OECD protection combined with an increase inBrazil’s raw sugar production of 50 per cent. By eliminating production subsidies, the OECDreforms place an upward pressure on the world price, while the changes simulated for Brazil (moreexports) act in the opposite direction. The estimated net effect is a 7 per cent decline in the worldprice of raw sugar. The simulations illustrate how feasible reforms in non-OECD countries (such asrelaxation of Brazil’s ethanol policies so that a third of ethanol-related cane is diverted to raw sugarproduction) can more than offset the world price effect of policies in OECD economies.
Since policy reforms in several key non-OECD countries could place further downward pressureon the world price of raw sugar, it is possible that the trend value of the current corrupt’ world priceis above what it would be in the absence of distortions in all countries. However, even if this werethe case, reforms would benefit exporting countries through greater Price stability, since publishedestimates of reductions in price variability due to liberalisation of world sugar trade are significant(ranging from 10 to 30 per cent - section 11.2.2).
The reforms simulated using the WET model are:
• removal of sugar policies in GATT countries ( with around one hundred countries being members of the GARTT);
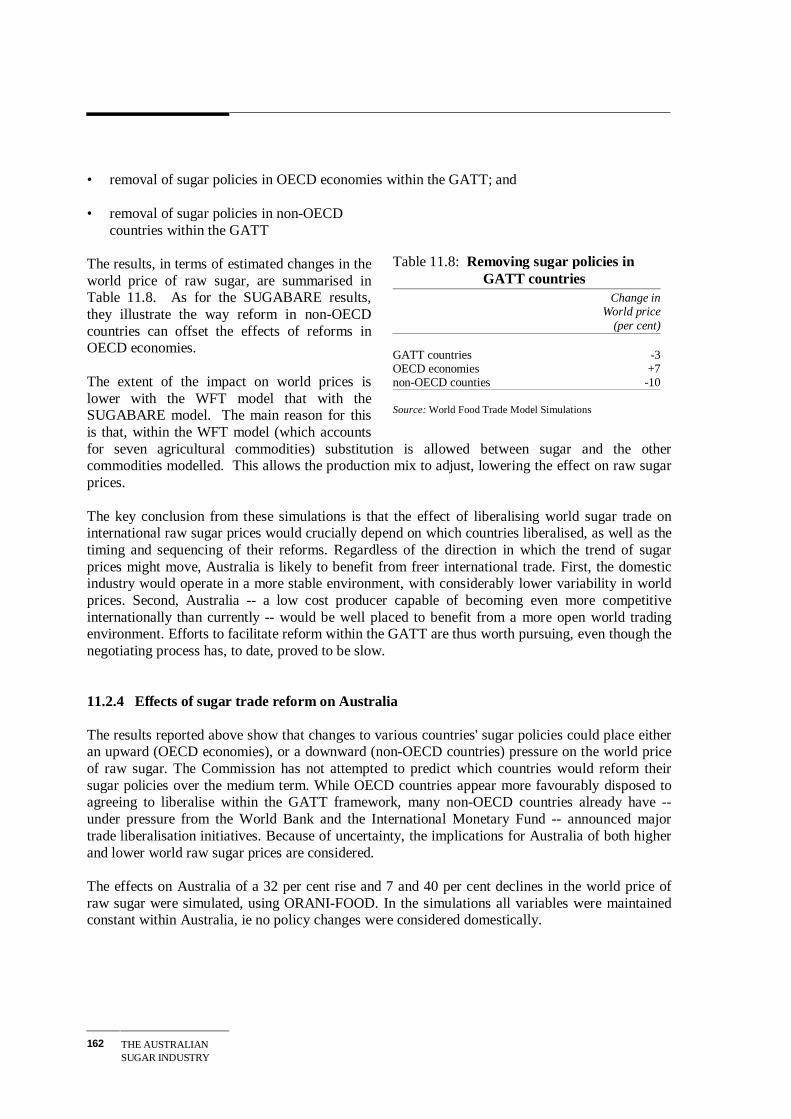
THE AUSTRALIANSUGAR INDUSTRY
162
• removal of sugar policies in OECD economies within the GATT; and
• removal of sugar policies in non-OECDcountries within the GATT
The results, in terms of estimated changes in theworld price of raw sugar, are summarised inTable 11.8. As for the SUGABARE results,they illustrate the way reform in non-OECDcountries can offset the effects of reforms inOECD economies.
The extent of the impact on world prices islower with the WFT model that with theSUGABARE model. The main reason for thisis that, within the WFT model (which accountsfor seven agricultural commodities) substitution is allowed between sugar and the othercommodities modelled. This allows the production mix to adjust, lowering the effect on raw sugarprices.
The key conclusion from these simulations is that the effect of liberalising world sugar trade oninternational raw sugar prices would crucially depend on which countries liberalised, as well as thetiming and sequencing of their reforms. Regardless of the direction in which the trend of sugarprices might move, Australia is likely to benefit from freer international trade. First, the domesticindustry would operate in a more stable environment, with considerably lower variability in worldprices. Second, Australia -- a low cost producer capable of becoming even more competitiveinternationally than currently -- would be well placed to benefit from a more open world tradingenvironment. Efforts to facilitate reform within the GATT are thus worth pursuing, even though thenegotiating process has, to date, proved to be slow.
11.2.4 Effects of sugar trade reform on Australia
The results reported above show that changes to various countries' sugar policies could place eitheran upward (OECD economies), or a downward (non-OECD countries) pressure on the world priceof raw sugar. The Commission has not attempted to predict which countries would reform theirsugar policies over the medium term. While OECD countries appear more favourably disposed toagreeing to liberalise within the GATT framework, many non-OECD countries already have --under pressure from the World Bank and the International Monetary Fund -- announced majortrade liberalisation initiatives. Because of uncertainty, the implications for Australia of both higherand lower world raw sugar prices are considered.
The effects on Australia of a 32 per cent rise and 7 and 40 per cent declines in the world price ofraw sugar were simulated, using ORANI-FOOD. In the simulations all variables were maintainedconstant within Australia, ie no policy changes were considered domestically.
Table 11.8: Removing sugar policies in GATT countries
Change inWorld price
(per cent)
GATT countries -3OECD economies +7non-OECD counties -10
Source: World Food Trade Model Simulations
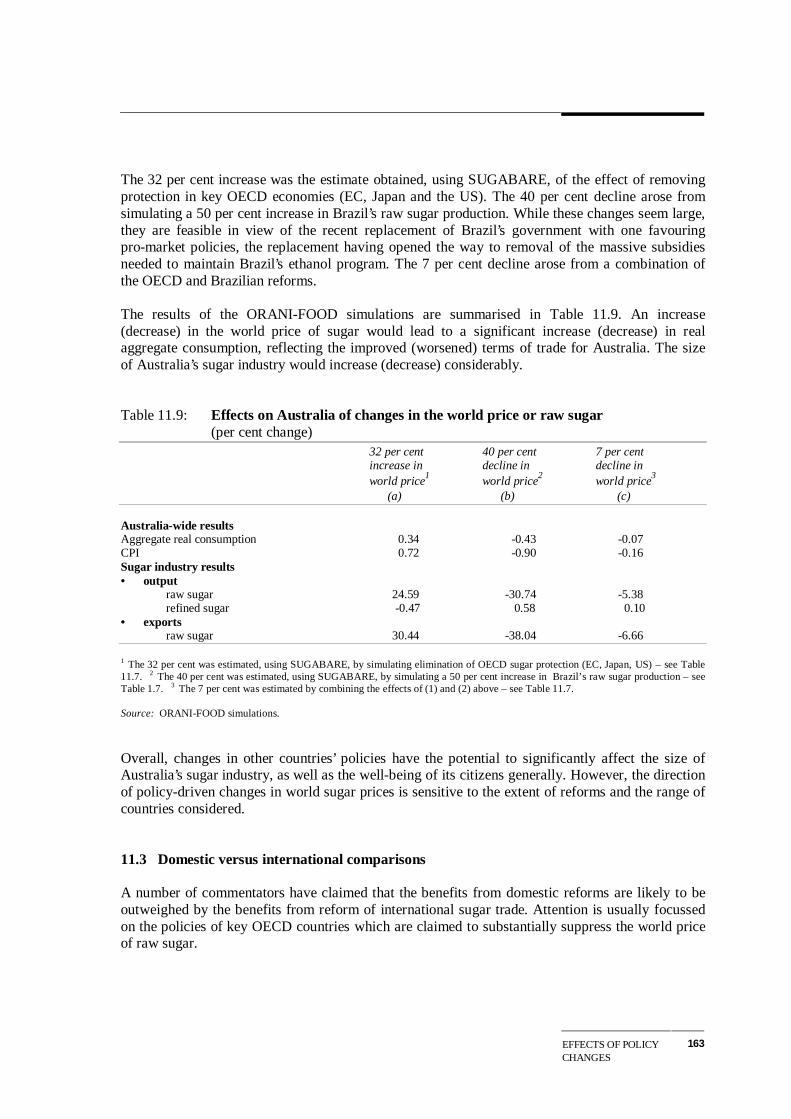
EFFECTS OF POLICYCHANGES
163
The 32 per cent increase was the estimate obtained, using SUGABARE, of the effect of removingprotection in key OECD economies (EC, Japan and the US). The 40 per cent decline arose fromsimulating a 50 per cent increase in Brazil’s raw sugar production. While these changes seem large,they are feasible in view of the recent replacement of Brazil’s government with one favouringpro-market policies, the replacement having opened the way to removal of the massive subsidiesneeded to maintain Brazil’s ethanol program. The 7 per cent decline arose from a combination ofthe OECD and Brazilian reforms.
The results of the ORANI-FOOD simulations are summarised in Table 11.9. An increase(decrease) in the world price of sugar would lead to a significant increase (decrease) in realaggregate consumption, reflecting the improved (worsened) terms of trade for Australia. The sizeof Australia’s sugar industry would increase (decrease) considerably.
Table 11.9: Effects on Australia of changes in the world price or raw sugar(per cent change)
32 per cent 40 per cent 7 per centincrease in decline in decline inworld price
1world price
2world price
3
(a) (b) (c)
Australia-wide resultsAggregate real consumption 0.34 -0.43 -0.07CPI 0.72 -0.90 -0.16Sugar industry results• output
raw sugar 24.59 -30.74 -5.38refined sugar -0.47 0.58 0.10
• exportsraw sugar 30.44 -38.04 -6.66
1 The 32 per cent was estimated, using SUGABARE, by simulating elimination of OECD sugar protection (EC, Japan, US) – see Table11.7. 2 The 40 per cent was estimated, using SUGABARE, by simulating a 50 per cent increase in Brazil’s raw sugar production – seeTable 1.7. 3 The 7 per cent was estimated by combining the effects of (1) and (2) above – see Table 11.7.
Source: ORANI-FOOD simulations.
Overall, changes in other countries’ policies have the potential to significantly affect the size ofAustralia’s sugar industry, as well as the well-being of its citizens generally. However, the directionof policy-driven changes in world sugar prices is sensitive to the extent of reforms and the range ofcountries considered.
11.3 Domestic versus international comparisons
A number of commentators have claimed that the benefits from domestic reforms are likely to beoutweighed by the benefits from reform of international sugar trade. Attention is usually focussedon the policies of key OECD countries which are claimed to substantially suppress the world priceof raw sugar.

THE AUSTRALIANSUGAR INDUSTRY
164
For purposes of comparison, the results of the sugar industry simulations are presented in Table11.10 together with estimates of the effects of international reform and domestic microeconomicreform.
Table 11.10: Comparison of International and Domestic Reforms
Reductions inassistance
7 per cent in Australia reforms inin the world price (March 91 Australiaof raw sugar
1statement)
2sugar industry
3
(a) (b) (c)
Economy-wide results
Real GDP 0.0 0.7 0.1Aggregate real consumption -0.1 0.1 0.1CPI -0.2 -2.6 0.3
Sugar industry results
• outputraw sugar -5.4 0.6 33.5refined sugar 0.1 0.3 0.2
• exportsraw sugar -6.7 0.7 41.2
1 OECD protection eliminated plus diversion of some 33 per cent of the cane allocated to ethanol production in Brazil, so that raw sugarproduction increases by 50 per cent. 2 Reductions from levels prevailing in 1988-89 to those expected to prevail once reforms announcedin 1988 and 1991 are implemented. 3 Refers to the simulation (c) described in Table 11.2: 30 per cent land expansion coupled with a 9per cent improvement in on-farm productivity, combined with removal of price distortions.
Source: ORANI-FOOD simulations.
Of the economy-wide micro-economic reforms recently considered by the Commission, reductionsin manufacturing assistance are likely to be the most significant for the sugar industry.ORANI-FOOD was again used to separately identify the effects of this reform on the sugarindustry. The Commission has modelled the effect of reducing assistance from levels prevailing in1988-89 to those expected to prevail once the reforms announced in 1988 and March 1991 are fullyimplemented.
Although not modelled, reforms of the waterfront and coastal shipping would also benefit the sugarindustry. To date, the raw sugar industry has managed to by-pass the cost-penalties imposed by thework practices adopted on the waterfront, because of the use of bulk handling facilities. However,efficiency in bulk-handling and in loading at ports is very important for major exporting industries,such as sugar.
The industry uses coastal shipping for the transport of raw sugar between mills and refinerieswithin Australia. The Queensland Sugar Corporation and CSR provided the Commission withinformation on freight rates which suggests that the cost of shipping raw sugar between Queensland
EFFECTS OF POLICYCHANGES
165
and Thailand is around a third lower than the cost of transporting a similar sized load over a similardistance around Australia - for example from Queensland to Fremantle. Thus, reforms to coastalshipping would reduce the cost of refining sugar within Australia.
To illustrate the effects of reform within the sugar industry, results of the simulation concerning aland expansion, improved on-farm productivity and price reform, are also presented in Table 11.10. The results reported suggest that most reforms considered would lead to an expansion of sugarproduction and exports. They also lead to the conclusion that the benefits to the sugar industry fromreforms within the industry itself are likely to be larger than the benefits from international anddomestic reforms which are outside the industry’s control.
In summary, the key findings of the analyses presented in this Chapter are that:
• the Australian sugar industry could gain significant benefits from reform of its regulatoryarrangements. Initiation of such reforms is within the industry's control. International reformsare more uncertain since Australia has little influence on the policies adopted by othercountries;
• the sugar industry is likely to benefit more from within-industry reforms than frominternational sugar reforms or general economy-wide reforms within Australia;
• the benefits arising from lower domestic prices as a result of removing the tariff and theassociated acquisition powers are small relative to the benefits achievable from removing theproduction controls and other measures that are in place largely to support the current pricingarrangements; and
• productivity improvements made possible by removal of these supporting measures have thepotential to provide greatest gains to the industry -- leading to over $375 million additionalsugar export earnings annually -- and to the economy generally through higher GDP, worthbetween $200 and $400 million annually.

PARTICIPANTS WHOMADE WRITTENSUBMISSIONS
167
APPENDIX A: PARTICIPANTS WHO MADE
WRITTEN SUBMISSIONS
THE ORGANISATIONS LISTED BELOW PROVIDED THE COMMISSION WITH ONE ORMORE WRITTEN SUBMISSIONS:
Australian Bureau of Agricultural and Resource EconomicsAustralian Cane Farmers AssociationAustralian National UniversityAustralian Raw Sugar Industry (QSI), joint submission by the Sugar Board,
Canegrowers, and the Australian Sugar Milling CouncilAustralian Soft Drink AssociationAustralian Sugar Milling CouncilBundaberg Sugar Company LimitedBureau of Sugar Experiment StationsCanegrowersCanegrowers, BundabergCanegrowers, Burdekin DistrictCanegrowers, Herbert RiverCanegrowers, Mourilyan AreaCanegrowers, Proserpine districtCanegrowers, South Johnstone AreaCentre for International EconomicsCoca - Cola Amatil LtdConfectionery Manufacturers of Australia LtdCSIROCSR Limited’s Sugar Mills GroupCSR Refined Sugars GroupDawo FarmingDepartment of Foreign Affairs & TradeDepartment of Primary Industries - Queensland GovernmentEdgerton, EGreat Barrier Reef Marine Park Authority
THE AUSTRALIANSUGAR INDUSTRY
168
Kerry (New Zealand) LtdMackay District Canegrowers’Mackay Sugar Co-Operative Association LtdManildra Harwood SugarsMaryborough Sugar Factory, TheMossman Central Mill Company LimitedMossman District Canegrowers’ ExecutiveNew South Wales Canegrowers’ AssociationNew South Wales Government - The TreasuryNew South Wales Sugar Milling Co-operative LimitedProserpine Co-operative Sugar Milling Association LtdProserpine District Canegrowers’ ExecutiveQueensland GovernmentQueensland Sugar CorporationSouth Johnstone Mill LimitedSugar Research & Development CorporationSugar Users Group Australia (SUGA), joint submission by the Australian Soft Drink
Association Ltd and the Confectionery Manufacturers of Australasia LtdTooheys LimitedTully Sugar IndustryUnicorn International IncWilkinson, J

SUGAR POLICIES INMAJOR SUGARPRODUCING NATIONS
169
APPENDIX B: SUGAR POLICIES IN MAJOR
SUGAR PRODUCING NATIONS
B1 Characteristics of the world sugar market
Sugar is produced in about 100 countries in both temperate and tropical regions. It is one of theworld’s most regulated food commodities. The world sugar market is influenced by the domesticpolicies of many countries. The aims of the sugar policies in developed countries are usually themaintenance of farm incomes, industry expansion, and protection from the volatile price cycle. InEurope and Japan, self-sufficiency has been a consideration. Intervention is also widespread indeveloping countries, where a primary aim is to earn or conserve foreign exchange.
The impact of policies in OECD countries is to reduce the world price and increase its variability.However, some policies of non-OECD countries serve to increase the world price. For example,Brazil directs some two-thirds of its cane to the production of ethanol.
B2 Major OECD countries
B2.1 The European Community1
The European Community (EC) beet sugar industry is highly supported under the Common SugarPolicy (CSP). The support provided by the CSP has transformed the Community from a net sugarimporter in the early 1970s into the world’s second largest exporter with net exports of about 3.2million tonnes in 1989.
Prices
The EC uses two sets of measures to support internal sugar market prices at levels well aboveworld market prices and to control the amount of sugar subject to support. The pricing provisionsinsulate the EC sugar industry from import competition. They are also designed to ensure a returnto growers and millers which is related to industry costs.
The CSP price support arrangements involve setting annual ’target’ and ’intervention’ prices forrefined sugar. The target price is, on average, the price at which the EC authorities considergrowers should obtain for sugar. The objective is for the support system to maintain sugar prices ataround the target price. The intervention price is the price at which the intervention agencies of the
1 For a more detailed discussion see ABARE, Domestic and world market effects of EC sugar policies,
Discussion Paper 91.1, 1991, Canberra.
THE AUSTRALIASUGAR INDUSTRY
170
EC members are required to purchase sugar. It provides a ’floor’, below which domestic sugarprices are prevented frorn falling. Intervention prices, which are set in relation to the target price,differ between regions as they take into account production conditions and transport costs.Intervention prices have been substantially above world market prices throughout most of theperiod for which the CSP has applied.
Production quotas
The quantities supported under CSP are limited by a three-tier pricing system. Each EC membercountry is allocated a base quantity of refined sugar, the ’A’ quota, on which the full interventionprice is paid. This quota is subject to levies. Additional production, termed S’ quota sugar, is alsosupported at the full intervention price. However, B quota sugar is subject to higher levies than Aquota sugar. Together, the A and B quotas make up what is termed the ’maximum’ quota. TheCommunity’s production of A and B quota sugar exceeds domestic consumption and this excessproduction is exported. When world prices are less than EC support prices, an export subsidy isgiven to cover the difference between the world price and the EC domestic price. When the targetprice is lower than the world prices, EC exports of quota sugar are subject to a tax on thedifference. However, in most years, the EC intervention price has exceeded the world price.
Any sugar produced above the maximum quota, referred to as ’C’ sugar, is exported without CSPsupport. No limits apply to the production of C sugar. Growers may elect to carry forward somequantities of B and C quota sugar to be treated as part of their next year’s A quota. The quantitiesare normally limited to 20 per cent of the A quota. Quota A and B sugar is allocated amongmember countries through negotiation and in turn the country quotas are allocated amongprocessors. Processors in turn allocate quotas to growers in the form of contracts.
Levies
Levies apply to A and B quota sugar and are designed to cover the costs of export subsidies.However, in some years the cost of export subsidies has exceeded the receipts from levies. In theseyears support was basically funded from EC budget revenue. The levies applying to A and B quotasugar include:
• a 'basic' levy of up to 2 per cent of the intervention price applying to A and B quota sugar
• a B quota levy of up to 30 per cent of the intervention price. If this is insufficient an additional levy of up to 7.5 per cent is imposed; and
SUGAR POLICIES INMAJOR SUGARPRODUCING NATIONS
171
• an 'additional' levy on both A and B quota sugar to cover any shortfall between the cost ofrunning the CSP in any one specific year and the various levies mentioned above. The cost ofthe levies is split 60:40 between growers and processors.
The application of these levies results in the effective domestic producer prices of B quota sugarbeing some 37.5 per cent of the intervention price below the A quota price.
The EC sugar support arrangements are normally reviewed every five years. The currentarrangements expire in 1990-91. However, the EC Commission has recommended that currentpolicies and quota levels be continued to June 1993 before being reviewed again.
The EC sugar support arrangements also apply to starch based sweeteners for each membercountry.
Import controls
Protection against imports is provided through a system of import levies and 'threshold' prices. Thethreshold price is based on the target price plus transport charges between the area of greatestsurplus and the area of greatest deficit. When the world sugar price is lower than the thresholdprice, imports are subject to a levy equal to the difference. When world prices are above thethreshold price, import subsidies are paid.
Under the Lome Convention, African, Caribbean and Pacific (ACP) countries are guaranteedaccess to the EC market for up to 1.3 million tonnes of refined sugar a year at cif prices which areequivalent to EC internal support prices. As the Community's production of A and B quota sugaralready exceeds domestic consumption, these imports result in an increase in the quantity of ECquota sugar that is exported with the aid of export subsidies. Subsidies to enable the export of thisamount are provided entirely from the Community funds.
Consequences
The EC sugar policy excludes free entry of imports, raises domestic producer and consumer pricesabove the world price, raises production, lowers consumption and increases exports. For example,the OECD estimated that in 1990, the EC sugar growers received prices that were 99 per centhigher than the world price. Consumers were estimated to pay prices 99 per cent higher than worldprices.2
2 OECD, Agricultural Policies, Markets and Trade, Monitoring and Outlook, 1991.
THE AUSTRALIASUGAR INDUSTRY
172
B2.2 Japan3
Japan is the world’s second largest importer of sugar, with estimated imports of 1.9 million tonnes(raw value) in 1989-90. The importance of sugar imports relative to domestic production hasdeclined, mainly as a result of rising sugar production and falling sugar consumption. Japan’sconsumption of sugar per person is the lowest of all developed countries. It has generally beendeclining since 1975, when corn syrup began to make inroads into the sugar market.
Most of the increase in Japanese sugar production in recent years has been due to increase in beetsugar production. Production of beet sugar is much more variable than that of cane sugar becausealternative enterprises are available to beet growers (grains, soybeans and fodder crops); there areno major alternatives to cane production.
Prices
The Sugar Price Stabilisation Law came into effect in 1965, and the Sugar Price StabilisationAgency (now the Raw Silk and Sugar Price Stabilisation Corporation) was established toimplement this law. The aims were to stabilise the domestic sugar price, to protect the markets ofdomestic beet and cane growers and related industries from import competition, and to provideincome support to farmers.
The stabilisation Corporation trades in both domestically produced and imported sugar. Japaneseconsumer and producer prices have been maintained well above the world prices. Consumer pricesare kept above the world price by subjecting imported raw sugar to high tariffs and a complexsystem of variable levies, surcharge and rebates. In addition, subsidies are paid to producers so thatproducer prices exceed the prices paid for raw sugar by refiners. The high level of sugar pricesupport has allowed a high fructose corn syrup industry to develop resulting in a decrease in rawsugar imports and a surplus in domestic sugar refining capacity.
The prices growers receive for their cane and beet comprise the ’Minimum producer prices’ (whichmillers and beet processors are required to pay to growers, as a condition of obtaining supportedprices themselves), plus a production incentive from the Corporation (per tonne of cane or beet).
The minimum prices are promulgated by the Corporation through a process of simultaneous buyingand selling. The Corporation guarantees to buy domestically produced sugar from cane millers andbeet processors at specified prices provided the miller or processor has paid at least the specifiedminimum producer prices to farmers. The Corporation simultaneously sells the sugar back to thesame millers and processors at a resale price which allows them to compete with imported sugarand which is usually less than the purchase price. The difference, which is incurred by the Agency,is met from government budget allocations, and an adjustment fund which is financed through asurcharge on raw sugar imports.
3 For a more detailed discussion see ABARE, Japanese Sugar Policy: Its Effects on the World Markets, Occasional Paper No. 104, 1988, Canberra.
SUGAR POLICIES INMAJOR SUGARPRODUCING NATIONS
173
Imported sugar is virtually all raw sugar and is subject to an import duty and a system of variablecharges and rebates. In addition, an excise tax is imposed on all refined sugar at the point of sale.
Consequences
High stable sugar producer prices have induced a steady increase in sugar production. The OECDestimated that in 1990, Japanese sugar growers received prices that were around 400 per centhigher than the world price. Consumers were estimated to pay prices 142 per cent higher thanworld prices.4
Decreased consumption and increased production have increased the degree of self-sufficiency byreducing sugar imports. Because import demand is lowered by Japanese sugar policy, the worldsugar price is lower than it would otherwise be. Japanese sugar prices are insulated from worldprice fluctuations, and neither producers nor consumers are able to respond to changes in worldsupply and demand conditions causing a more volatile world price.
The very high consumer price for sugar not only reduces sugar demand but allows high fructosecorn syrup to be priced below sugar. Consumption of high fructose corn syrup is subject to a smalltax, but maize, its major raw material, can be imported duty free. This unequal treatment of sugarand corn syrup has encouraged production and use of the syrup in place of sugar.
B2.3 The United States 5
The major aim of US sugar and sweetener policy is to support returns to US sugar producers. Thetwo major elements of the sugar policy are the provision of a basic support price to sugar producers(the loan rate) and a total quota for imports.
The loan rate
The loan rate is paid to sugar millers and processors who meet the requirement of paying growers afixed minimum price for cane and beet. It is a rate at which the sugar processor can obtain financefrom the Commodity Credit Corporation (CCC) by committing raw sugar or its equivalent ascollateral. There are generally no purchases of sugar by CCC, as the domestic market is supportedat or above the loan rate by alterations to the total amount that may be imported by quota.Variations in sugar imports are used to control sweetener supply and allow the market price to besupported at a level equivalent to the loan rate.
4 OECD, op. cit.5 For a more detailed discussion see ABARE, 1990 and US Sugar Policy Reform, Discussion Paper No. 90.4, 1990, Canberra.

THE AUSTRALIASUGAR INDUSTRY
174
Import Quotas
Import quotas have been the main element of protection for the US sugar industry, ensuring that thedomestic market price does not fall below wholesale equivalent of the loan rate. Quotas have beenused to support US domestic sugar prices at levels above world market prices.
The share of sugar imports in the total US sweetener market was only 6 per cent in 1988 comparedwith 35 per cent in 1970. Over the same period the imports’ share of the total sugar marketdeclined from 45 per cent to 14 per cent. The total import quota is at present distributed amongsome 39 sugar exporting countries. The US currently provides a market for 3 per cent ofAustralian sugar exports. In 1990, the US announced a new quota system (the tariff-rate quotasystem) to replace the old strict system. Under the new arrangements, the US allows sugar importsup to the quota level, but places a 16 cent per pound tariff on additional imports. Table B1 showsthe distribution of the US import quota to the major sugar producing countries.
Table B 1: Distribution of the US sugar import quota(per cent)
Year DominicanRepublic Brazil Philippines Australia Arizentina
1983 16.9 14.0 13.0 8.0 4.11984 16.9 13.8 12.9 7.9 4.01985 16.7 13.8 12.8 7.9 4.11986 16.3 13.4 13.4 7.7 4.01987 16.0 13.2 15.0 7.5 4.01988 16.7 13.8 14.8 7.9 4.11989 16.8 13.8 15.0 7.9 4.11990 16.7 14.0 15.3 8.0 4.2
Source: ABARE, 1990 and US sugar policy reform, Discussion Paper No. 90.4.
Consequences
One major consequence of the US policy has been the rapid technological progress in thedevelopment of alternative sweeteners such as high fructose corn syrup and non-caloric sweetenerssuch as aspartame. Sugar has been almost completely substituted by alternative sweeteners incanned and bottled beverages and partly substituted for in fruit canning. Substitution continues togrow in baking and confectionery industries.
SUGAR POLICIES INMAJOR SUGARPRODUCING NATIONS
175
Second major consequence has been an expansion in US sugar production -particularly from beet,which grew by 38 per cent from 1984 to 1987. This has occurred because of attractive sugar pricesas a result of US domestic support policies for sugar and has attracted production activities on landwhich can grow beet. The OECD estimated that in 1990, US sugar growers received prices whichwere 32 per cent higher than world prices while consumers were estimated to pay 5 per cent higherthan world prices.6
B3 Policies of key non-OECD economies
B3.1 Brazil
Brazil is the fourth largest sugar producer after the EC, India and the (former) USSR, withsugarcane production of over 200 million tonnes annually. Raw sugar production is mainly for thedomestic market. In 1989, Brazil’s raw sugar production was 7.33 million tonnes, consumption7.40 million tonnes, stocks 2.33 million tonnes and exports 0.97 million tonnes.
Brazil has a policy of diverting around two-thirds of its cane to the production of ethanol so as tosave foreign exchange on imported oil. It achieves this diversion by the Government controllingraw sugar exports and by subsidising ethanol production. If all cane grown were used to producesugar, Brazilian raw sugar output would increase from 8 to 20 million tonnes annually.
Brazil’s cane-growing industry is highly regulated. The Government establishes a crop plan andassigns production quotas for sugar and fuel alcohol. It also specifies consumer and producerprices, setting domestic sugarcane, sugar and ethanol prices at high enough levels relative to coststo ensure that all production quotas are filled7. The Government assigns export quotas to individualmills. The export quotas can be exercised once sugar and alcohol targets have been met. Theprivate sector negotiates contracts, which are then reviewed by the Government. Export licencesare granted if the contract price is in line with international futures prices.
Although heavily regulated, the sugar industry in Brazil is cost-efficient by world standards. In the1986-87 Landell Mills survey, Brazil’s cane growing and milling regions ranked 7th and 13th
6 OECD, op. cit.7 B Borrell, How a Change in Brazil’s Sugar Policies Would Affect the World Sugar Market, PolicyResearch and Extension Affairs, Working Papers, International Trade, International Economics Department,The World Bank, April 1991, VYTS 522, Washington D.C. US Department of Agriculture, World SugarSituation and Outlook, May 1991.

THE AUSTRALIASUGAR INDUSTRY
176
lowest in terms of production costs among the 61 countries covered.8 Also, recent estimates by theUS Department of Agriculture suggest that, in 1990-91, the government-determined grower andconsumer prices in Brazil were among the lowest in the world.
The extent to which tight regulations in Brazil distort domestic sugar costs and prices is thereforeunclear. The key question seems to be: by how much do the regulations, which divert cane toethanol production, limit Brazilian raw sugar exports?
B3.2 China
China is one of the major sugar importers among developing countries. However, as governmentpolicies encourage self-sufficiency in an attempt to ’save’ foreign exchange, the country maybecome self-sufficient in sugar in the near future.9
During the 1980s rapid development of the Chinese economy led to high growth in sugarconsumption. Between 1977 and 1986, consumption of refined sugar increased from 3.7 to 6.3 kgsper person (Table B2).
Table B2: Per capita consumption of sugar for selected countries,1977 and 1986 (kg raw value)
1977 1986
Australia 55.8 51.2EEC 37.7 37.6Japan 29.0 22.5United States 46.8 30.6Brazil 44.7 47.6Cuba 53.9 66.0India 6.8 11.4Thailand 13.6 14.1Mexico 41.5 44.2China 3.7 6.3USSR 45.8 47.7
World average 20.2 20.4
Source: Sugar Yearbook (1986 and earlier issues).
Since sugar consumption in China is still well below the world average of 20 kgs per person, highgrowth is likely to continue in the medium term. The question is how this would affect importsgiven the government’s self sufficiency policies. F.O. Licht (1991) Notes that China’s pricingsystem in the past had led to reduced acreage being devoted to sugar crops. This occurred because
8 Landell Mills, 1989, ’Commodity Studies, A World Survey of Sugar and H17CS Production, 1979/80 to
1986/87.9 F.O. Licht, International Sugar and Sweetener Report, September 1991.

SUGAR POLICIES INMAJOR SUGARPRODUCING NATIONS
177
the Government eased control over production and pricing of many crops, but not of sugar. In fact,from 1963 to 1988 the Government kept sugar prices unchanged, at a time when prices for othercrops were allowed to rise. As a result, farmers were reluctant to grow cane and beet.
To redress the situation, the Government in 1988 raised the wholesale price of cane sugar by 65 percent and that of beet sugar by 54 per cent. It raised prices again in 1990 by 45 and 41 per cent forsugar of cane and beet origin respectively. At the same time, the Government raised the purchasingprices for cane and beet. This resulted in increases in the land used for sugar crops.
The recent increases in production, backed by China’s comprehensive refining industry, areexpected to make self-sufficiency possible within the next two to three years. However, in view ofthe likelihood of continued rapid increases in per capita sugar consumption, China may not be ableto maintain self-sufficiency over the longer term.
B3.3 India
India, a major sugar producer, is pursuing ’self sufficiency’ policies similar to those in China. In the1970s the country was an exporter of sugar, but has since been virtually self sufficient. Since thelate 1970s, consumption of refined sugar in India has grown very rapidly, increasing from 6.8 to11.4 kgs per person between 1977 and 1986. However, India’s 1986 consumption level was stillwell below the world average of 20 kgs per person (Table B.2). Over the 1977 to 1986 period,production in India expanded roughly in line with consumption, maintaining the country’s selfsufficiency status.
Sugar is one of the most regulated sectors in India. The broad regulatory framework, which hasbeen in place since the 1970s, includes a split of the domestic market into two sectors: levy sugar(sold through the public distribution system at low prices to low income earners) and ’free-market’sugar (sold on the open market).
The minimum price at which mills can buy cane is specified by the central government. However,the actual price paid is generally higher since State governments tend to set their own minimumprices above national prices.10 In 1990-91, the minimum prices set by the States were 50 to 80 percent above national minimum prices.11
Mills must sell 45 per cent of their production to the government. The remaining 55 per cent is soldon the open market, although the government controls the quantity which is released. In 1990-91,the Government imposed excise taxes of US26c per kg on free-market’ sugar and US2c per kg onlevy sugar.
10 S Baru, The Political Economy of Indian Sugar- State Intervention and Structural Change, Oxford
University Press, 1990.11 US Department of Agriculture, World Sugar Situation and Outlook, May 1991.

THE AUSTRALIASUGAR INDUSTRY
178
The Government is the sole importer. Currently an ad valorem duty of 35 per cent applies. In1990-91, there were no sugar imports. The Government is also the sole exporter. In 1990-91, itsubsidised exports with shipments receiving 20 per cent ’cash compensatory support’. In that year,around 2 per cent of India’s sugar production was exported.
As with most other major industries, sugar milling in India is subject to the Industries Act whichregulates the licensing of new units, as well as the sanctioning of their location and size. Wagespaid to workers and the rate of return on sugar (and its by-products) are also subject to governmentregulation and monitoring.
Baru describes how government-backed ’co-operative’ sugar mills, owned by growers andlandowners, emerged after Independence.12 At that time co-operative mills were seen as institutionsfrom which rural development could proceed. Co-operative mills still receive significantgovernment support.
Currently the milling sector has a complex structure, comprising a large co-operative sector, asizeable private sector (the modernisation of which was partly financed by government) and apublic sector (consisting mostly of ’sick’ mills taken over by State governments). The effects ofpolicies that maintain mills through government subsidies is that, unlike the growing sector, India’smilling industry is inefficient by world standards. During most of the past decade milling costs’ inIndia were about twice as high as in Australia (See Table F1.2 in Appendix H).
Recently the Indian government announced major structural reforms in its foreign trade policy witha view to eliminate the complicated web of controls on imports and exports of most goods. Thereforms aim to help India secure substantial foreign loans, so as to enable the country to tackle itsbalance of payments problem. The Government of India indicates that from July 1991, exportsubsidies have been abolished and the exchange rate adjusted.13 The subsidy on refined sugar toconsumers - arising from the gap
between the levy price paid to producers and the issue price set for consumers in the publicdistribution system - has been abolished. The issue price of sugar under the public distributionsystem has been increased by 16 per cent. At the same time, the provision for general foodsubsidies in the budget has been stepped up.
By September 1991, the effect of the July exchange rate reforms resulted in a 19 per centdevaluation of the rupee against the US dollar. This made India’s sugar industry more competitiveon world markets, despite the withdrawal of export subsidies. Early in 1991, India returned as an
12 S Baru, The Political Economy of Indian Sugar- State Intervention and Structural Change, oxford
University Press, 1990.13 Government of India, Budget for 1991-92, part A, pp 13 and 15.

SUGAR POLICIES INMAJOR SUGARPRODUCING NATIONS
179
exporter with sales of around 350 000 tonnes of white sugar on world markets and with plans toexport a further 325 000 tonnes early in 1992. 14
Over the medium term it is unclear whether India would continue to be a sugar exporter. Sinceexcess supplies appear to have mainly arisen from four consecutive seasons of good rains, currentevents are unlikely to point to a medium-term trend. Also, future increases in production may notbe sufficient to match increases in sugar consumption as India’s consumption moves closer to theworld average.
B3.4 Thailand
Thailand is a major exporter of both raw and refined sugar. Domestic prices are set by theGovernment, imports are banned and exports controlled. The US Department of Agriculture reportsthat grower-guaranteed prices are set through negotiations between the private sector and theGovernment, although mills can pay more than the guaranteed price.15 The Government determinesconsumer prices. These are usually set above the world price with a view to supporting growersand millers.
The Government regulates the land available for sugar production and offers growers subsidisedcredit. It specifies production quotas for individual mills and obliges them to allocate setproportions of their output to the domestic and export markets. The Government also sets exportquotas and offers rebates for exports of sugar and sugar-containing products. Millers arrange theirown export contracts and sell through four licensed exporters.
Although government involvement in Thailand is extensive, the extent to which it distortssugar-related activities is unclear. The country is heavily exposed to international markets and theindustry is efficient by world standards. In terms of production costs, it ranked sixth lowest amongthe 61 countries surveyed in 1986-87 (See Table H.2 in Appendix 11).
At present domestic prices do not seem to be distorted to a significant extent. Estimates by the USDepartment of Agriculture suggest that the grower price in Thailand in 199091 was similar to thatin Australia, and the consumer price for refined sugar around a third lower than in Australia (SeeTable H. 1 in Appendix H).
Overall, the institutional arrangements in Thailand have the potential to lead to significantproduction, price and trade distortions. However, the available evidence suggests that theregulations have been, at least in recent years, administered in a market-conforming fashion.
14 F.O. Licht, International Sugar and Sweetener Report, September 1991. 15 US Department of Agriculture,
World Sugar Situation and Outlook, May 1991.15 US Department of Agriculture, World sugar Situation and Outlook, May 1991.
THE AUSTRALIASUGAR INDUSTRY
180
B3.5 Mexico
Mexico is an important producer of sugar, with levels of production close to that of Thailand.During the 1960s and early 1970s production grew more rapidly than consumption. Around onequarter of Mexico’s production was destined for export markets. Borrell notes that during the highoil price years of the late 1970s, sugar production in Mexico stagnated.16 As a consequence, thecountry - which was virtually self sufficient in sugar in the latter part of the 1970s - switched toimporting in the early 1980s. It is only since 1987 that Mexico started exporting again.
Tle government-run sugar board, AZUCAR, controls most aspects of sugar production, pricing andmarketing. Grower prices, processor prices and consumer prices are all set by Government andexports can only take place once export permits have been obtained. Currently the Governmentonly allows shipments under the US tariff-rate quota.17
Borrell describes how AZUCAR’s acquisition and marketing powers affect the patterns ofdistribution, exporting and importing; how price fixing, price discrimination and trade barriersaffect production, consumption and trade; and how legal restrictions on land sales influencemethods of production and the scale of operations.
Recently, certain aspects of the regulations have been relaxed. F.O. Licht reports that since 1990private companies have been allowed to import alongside AZUCAR and that sugar millspreviously owned by the Government have been privatised.
The juxtaposition of stringent regulation, central control by AZUCAR and freer operations byprivate-sector importers and the privatised mills has, at least initially, led to problems. Theexplosion of imports by private companies at a time when AZUCAR itself imported largequantities resulted in oversupply on the domestic market. This, combined with high debt levels,rigid labour contracts and the inability to export, appears to have caused problems for the (nowprivatised) sugar mills. F.O. Licht reports that in 1991 AZUCAR was forced to re-export some ofMexico’s surplus sugar to China.
B3.6 Cuba/USSR
Cuba is the world’s largest sugar exporter. In 1988, its exports accounted for 25 per cent of worldsugar trade. Until recently, around half of Cuba’s exports were destined for the former USSR undera bilateral trade agreement, representing around three quarters of the imports of the Soviet Union.
16 B Borrell, The Mexican Sugar Industry, Problems and Prospects, Working Papers, International Trade,
International Economics Department, the World Bank, February, 1991, WPS 522, Washington D.C.17 US Department of Agriculture, World Sugar Situation and Outlook, May 1991.

SUGAR POLICIES INMAJOR SUGARPRODUCING NATIONS
181
Despite attempts to diversify the Cuban economy, sugar is still the major commodity produced andexported by the country.18
Under the bilateral agreement, the USSR provided implicit subsidies to the Cuban economy.
With the breakup of the USSR and the formation of the Commonwealth of Independent States(CIS) and the economic problems that have resulted, Cuba faces a shrinking of its largest market.The CIS is expected to reduce the subsidies paid to Cuba through sugar purchases, and is expectedto extend barter deals for Cuban sugar because of shortages of foreign exchange. The impact onCuban production if it must sell at the significantly lower world price, or faces competition in theformer USSR market, is unclear.
18 J. F. Perez-Lopez, ’Sugar and Structural Change in the Cuban Economy’, World Development, Vol 17, No
10, 1989.

KEY FEATURES OFTHE QUEENSLANDSUGAR INDUSTRYACT 1991
183
APPENDIX C: KEY FEATURES OF THE
QUEENSLAND SUGAR INDUSTRY
ACT 1991
In response to the recommendations of the Sugar Industry Working Party, the QueenslandGovernment introduced the Sugar Industry Bill 1991 into Parliament during April 1991. The Billwas passed in late April and received Royal Assent on 1 May 1991.
The Act repealed and replaced Acts dating back to the early 1900s, the most significant of whichwere the Sugar Acquisition Act and the Regulation of Sugar Cane Prices Act.
One of the major changes as a result of the Sugar Industry Act 1991 is the abolition of the CentralSugar Cane Prices Board (CSCPB) and the Sugar Board. The marketing and administrativefunctions of these boards have been amalgamated and are now carried out by the newly formedQueensland Sugar Corporation. The judicial activities of the former CSCPB are performed by thenew body called the Sugar Industry Tribunal.
Cl Sugar Industry Policy Council
A Sugar Industry Policy Council has been established to undertake the role of advising theQueensland Government on the sugar industry, with particular regard to advising the Minister andthe Sugar Corporation on how much assignment should be increased each year. The membership ofthe Council is determined by the Minister.
C2 Queensland Sugar Corporation
The Corporation consists of a chief executive officer and 8 other members appointed by theGovernor, one of whom is the Chairperson. At least two of the members must have experience ingrowing sugar cane and two must have experience in milling.
The objectives of the Corporation are:
• to enhance the efficiency, competitiveness and access to markets of the Queensland sugarindustry;
• to enhance the long-term economy of the Queensland sugar industry;
• to enhance the benefits to the Queensland economy generally; and
• to encourage initiative and innovation among growers and millers.
The major functions of the Corporation are:
THE AUSTRALIANSUGAR INDUSTRY
184
• to manage the regulation of the quantity and quality of sugar cane and raw sugar produced inQueensland;
• to determine issues relating to the size of the Queensland sugar industry; to manage theacquisition and marketing of raw sugar by the Corporation; and
• to distribute to mill owners the net proceeds resulting from the marketing of raw sugar.
The Corporation may also acquire, construct, manage and maintain bulk sugar terminals and otherfacilities for the processing, storage and handling of products of the Queensland sugar industry orthe sugar industry elsewhere.
The Corporation may make guidelines for the purpose of providing standards for contracts relatingto the harvesting of sugar cane by mechanical cane harvesters. These guidelines are, however, onlyadvisory and are not binding on participants.
The Corporation has the power to purchase, sell or participate in trade or commerce concerning anyproducts of, or connected with, the sugar industry in Queensland.
The costs of the Corporation are funded from the proceeds of raw sugar sales.
C3 Sugar Industry Tribunal
The Tribunal consists of 3 members appointed by the Governor in Council. The chairperson is alegal practitioner. One member is a person who has no pecuniary interest in the industry, but has agood working knowledge of the industry. The third member is a person nominated by the Ministerwho has special qualifications considered by the Minister to be relevant and appropriate to theTribunal's functions.
The Sugar Industry Tribunal is established to act as an avenue of review of decisions of theCorporation and local boards. An application may be made to the Tribunal for review of manyissues (eg, the adjustment, transfer or cancellation of assignment and/or peaks by either the localboard or the Corporation). The Corporation is required to fund the operations of the Tribunal.
C4 Acquisition
All raw sugar manufactured in Queensland by specified mills is acquired and vested in theCorporation. The ownership of raw sugar is acquired in exchanged for a right to receive paymentfor that sugar. An owner of a mill may retain for local consumption, and not deliver to theCorporation, a quantity of not more than one percentum of the sugar manufactured at the mill (ie,'miller's sugar').

KEY FEATURES OFTHE QUEENSLANDSUGAR INDUSTRYACT 1991
185
All sugar vested in the Corporation is to be delivered to the Corporation by mills. The Corporationmay direct a mill to manufacture a specified type of raw sugar.
C5 Payment for sugar
Payment for sugar retains many features of the former system. Payment to mill owners is in poolscalled No. 1 Sugar Pool (Pool 1), No. 2 Sugar Pool (Pool 2) and penalty sugar.
Pool 1 consists of sugar produced from adjusted areas of assignment up to mill peak, plus sugardelivered by the Director of Sugar Experiment Stations. Pool 2 consists of sugar grown on assignedland in excess of the mill peak. All other sugar is penalty sugar and its price is set by regulation(which traditionally - but not always - has been set at $1 per tonne).
The net value per tonne of Pool 1 sugar is deemed to be 12 per cent greater than the net value pertonne of sugar included in Pool 2.
The payments system is to be reviewed by the Corporation within 5 years of the date ofcommencement of the legislation.
C6 Local boards
A local board may be constituted for one mill or for adjacent mills. Local boards consist of achairperson, two representatives of the local mill and two representatives of the local mill suppliers’committee - a total of 5 members.
The functions of a local board are: to make awards; to provide a convenient local forum formediation or settling of disputes and issues within the Queensland sugar industry; to advise theCorporation concerning any matter relating to the local sugar industry; and to take all such actionwithin the powers conferred upon it by the Act as may be necessary to achieve its objectives.
C7 Awards
The role and general conditions of awards have not changed with the new legislation, except that itis now the Corporation that may make guidelines regulating the form of awards rather than theCSCPB.
Local boards are required to make an award each year in relation to their mill area and for thatcrushing season.
An award is to provide for;
• all matters relating to harvesting and delivery of sugar cane to mills by assignment holders onlands assigned to the mill;

THE AUSTRALIANSUGAR INDUSTRY
186
• all matters relating to transport, handling and crushing of sugar cane by the mill owner; and
• all matters relating to the payment of sugar cane by the mill owner.
Awards determine cane crushing times and the price and payment of cane to assignment holders.The price payable is to be the same for every assignment holder bound by the award for cane of thesame quality. The Act also outlines the current method of paying growers during the harvestingseason, with payments being based on the season average level of ecs. However, the Act does notspecify that this formula must be used, only that it may be used.
Disputes over awards are to be heard by the Sugar Industry Tribunal.
C8 Contracts outside awards (mill supply contracts)
Contracts between the mills and individual assignment holders, or groups of assignment holders,outside the award are permitted. This has the effect of varying or operating in place of the award.Such agreements were possible under the previous Act, but there were many more impediments tothem. Current agreements for continuous crushing are of this type. To be valid, a contract must belodged with, and approved by, the Corporation.
A mill supply contract can be made binding on all assignment holders if 85 per cent of assignmentholders agree. This provision seems to be directed at allowing only a significant number ofgrowers, or all growers as a group, to negotiate a mill supply contract outside the traditional awardrather than for individual growers to negotiate separate agreements with the mill. The provision(allowing a mill supply contract to be made binding on all growers with the approval of 85 per centof growers) can be used to override any individual contracts between a grower and the mill unlessthe grower can muster support from more than 15 per cent of growers.
C9 Assignments
The new Act allows for greater flexibility in the assignment system.
An assignment confers upon the holder an entitlement to deliver sugar cane (grown on the numberof hectares situated within the boundaries of the farm assigned to the mill) to a mill for payment.The mill is obliged to accept cane grown on land assigned to that mill and the grower is obliged todeliver sugar cane to the mill assigned the land.
This differs from the previous situation where sugar cane had to be grown on clearly specified plotsof land, except for the roaming provision which permitted 15 per cent of assignment to be grownon any part of the grower's land.
KEY FEATURES OFTHE QUEENSLANDSUGAR INDUSTRYACT 1991
187
The holder of an assignment may only dispose of sugar cane grown on that assignment to the millto which that land is assigned.
C10 Transfer of assignment
An assignment may be disposed of, wholly or partially, by the holder by way of sale, sublease orother form of transfer. However, the person to whom the assignment is transferred must have landon which that assignment can be used.
The transfer of, or variation to, an assignment within a mill area requires the approval of the localboard. This is through the issuing of an order by the local board to the Corporation. The local boardmay refuse to issue an order, but must give reasons. why it does not grant an application.
An application to transfer to another mill area (ie, an application involving more than one localboard) requires the unanimous decision of the members of both local boards. Approval for transferwithin a mill area requires the majority approval of the local board only. The unanimous decisionsof the local boards are not subject to appeal to the Tribunal, but a right of appeal does apply in thecase of majority decisions.
An assignment holder may make application directly to the Corporation for transfer of assignmentto another mill area. This provision, however, does not cover the sale or transfer of assignmentbetween two growers, but is directed at a grower transferring his own farming operation to anothermill area.
C11 Expansion of assignment
Assignments are to be expanded by 2.5 per cent (approximately 10 000 hectares) each year for fiveyears beginning in 1991. Larger expansions may be approved by the Minister (after consultationwith the industry). The distribution of new assignment between existing and new growers is to bedetermined by the Corporation. The Commission understands that the initial expansion will bedivided equally between established and new farms.
Among the powers available to the Corporation is that it may, out of future expansion, grant to anassignment holder in one mill area an equivalent assignment in a different mill area for the purposeof improving the viability of that farmer’s enterprise.
The power to cancel assignment has been retained. The Act states that the Corporation may cancelassignment ’upon wilful failure of the holder to grow sugar cane...’.
The Corporation also has the power to reduce all assignments in any year. This is called the’adjusted area of assignment’. There is also provision for the Minister (after consultation with theSugar Industry Policy Council) to adjust the area of assignment to greater than 100 per cent of thearea of assignment.

THE AUSTRALIANSUGAR INDUSTRY
188
C12 Farm peak
Farm peak is the quantity of sugar cane harvested from the assignment holder’s land which isdelivered within the mill peak of the sugar mill, and for which growers are entitled to receive thehigher Pool 1 sugar price.
Farm peak is regarded as a property which may be disposed of separately from assignment. Thepurchaser must, however, have an assignment to which that farm peak is applied.
Regulations governing transfers are the same as those for assignments, ie, farm peak may betransferred between mill areas subject to the unanimous agreement of the respective local boards.
There are no provisions for changes to the level of farm peaks. They remain effectively frozen.
C13 Mill peak
Mill peaks are essentially the sum of farm peaks in the mill area. The Corporation has the power toadjust mill peaks to take into account variations in farm peaks.
C14 General provisions relating to management of sugar harvesting
Mill owners are required to carry on the business of manufacturing sugar. If the mill owner fails tomanufacture sugar, the Minister may appoint an administrator to run the mill. The Corporationmay, however, grant an exemption.
The Corporation may redirect cane to another mill.

PAYMENTARRANGEMENT FORSUGAR
189
APPENDIX D: PAYMENT ARRANGEMENT FOR
SUGAR
Under the Queensland Sugar Industry Act 1991, all raw sugar produced in Queensland becomes theproperty of the Queensland Sugar Corporation. Ownership of raw sugar is exchanged for a right toreceive payments in accordance with the Act.
payments to mills are made from the net revenue from domestic and international sales. of rawsugar and any other activities of the Corporation. Net revenue is the proceeds of raw sugar salesand from other Corporation activities, excluding all costs of the Corporation (including marketingand promotion costs, transport costs, bulk handling and storage costs, waterfront and shipping costsand some costs associated with operation of Local Boards) and any such reserves as may benecessary to fund the Corporation’s operation.
Sales revenue for the 1990 season totalled some $1280 million compared with $1520 million forthe 1989 season. As all sugar is sold c&f and cif, sales revenue includes a component for freightand insurance. Costs incurred by the then Sugar Board represented approximately 10.2 per cent ofrevenue. Of the costs incurred freight, selling brokerage, insurance etc represented about 66.8 percent ($87.1 million), bulk terminal receiving, storage, out-loading and financing about 12.7 per cent($16.5 million), marketing about 10.1 per cent ($13.2 million), communication, public relationsabout 2.4 per cent ($3.1 million), sugar rebates about 3.9 per cent ($5.1 million), quantity andquality assurance about 4.0 per cent ($5.2 million) and finance for advances and stocks about 0.2per cent ($0.2 million).
D1 Current sugar pools
Net revenue is divided into two pools. Since the beginning of the 1990 season, the net value pertonne of raw sugar included in Pool 1 has been calculated, in relation to each crushing season, as 12per cent greater than the net value per tonne of Pool 2.
In the 1990 season, Pool 1 comprised 3.07 million tonnes of raw sugar while Pool 2 comprised 283000 tonnes (see Table D1). As Pool 1 comprised nearly 92 per cent of sales by volume in the 1990season, the per tonne return for Pool 1 was only 0.9 per cent higher than the average return from allsales, while the Pool 2 price was 9.9 per cent lower than average returns.
One of the perverse effects of the price differential between Pool 1 and Pool 2 is that while theindustry is expanding, the per unit returns for Pool 1 will become higher and higher above averagereturns while per unit returns for Pool 2 will become closer to the average. Thus, it would beexpected that there would be increasing resistance from pool 1 producers to the removal of theprice differential.
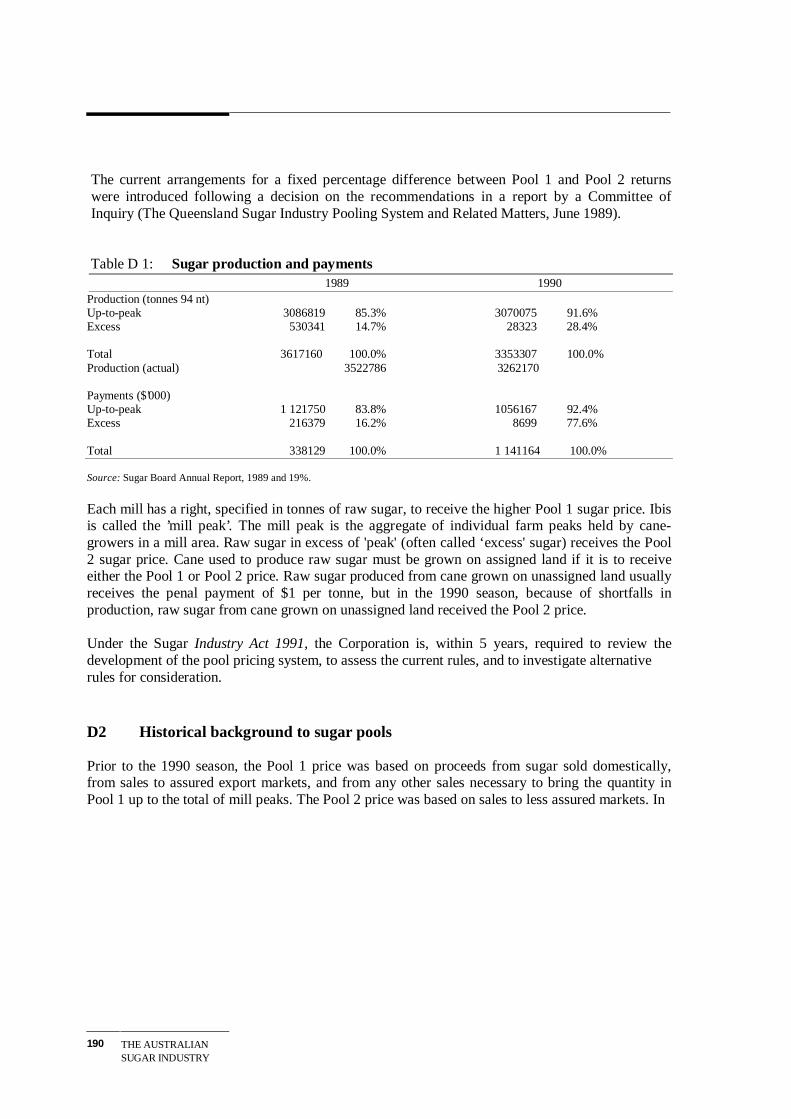
THE AUSTRALIANSUGAR INDUSTRY
190
The current arrangements for a fixed percentage difference between Pool 1 and Pool 2 returnswere introduced following a decision on the recommendations in a report by a Committee ofInquiry (The Queensland Sugar Industry Pooling System and Related Matters, June 1989).
Table D 1: Sugar production and payments 1989 1990
Production (tonnes 94 nt)Up-to-peak 3086819 85.3% 3070075 91.6%Excess 530341 14.7% 28323 28.4%
Total 3617160 100.0% 3353307 100.0%Production (actual) 3522786 3262170
Payments ($’000)Up-to-peak 1 121750 83.8% 1056167 92.4%Excess 216379 16.2% 8699 77.6%
Total 338129 100.0% 1 141164 100.0%
Source: Sugar Board Annual Report, 1989 and 19%.
Each mill has a right, specified in tonnes of raw sugar, to receive the higher Pool 1 sugar price. Ibisis called the ’mill peak’. The mill peak is the aggregate of individual farm peaks held by cane-growers in a mill area. Raw sugar in excess of 'peak' (often called ‘excess' sugar) receives the Pool2 sugar price. Cane used to produce raw sugar must be grown on assigned land if it is to receiveeither the Pool 1 or Pool 2 price. Raw sugar produced from cane grown on unassigned land usuallyreceives the penal payment of $1 per tonne, but in the 1990 season, because of shortfalls inproduction, raw sugar from cane grown on unassigned land received the Pool 2 price.
Under the Sugar Industry Act 1991, the Corporation is, within 5 years, required to review thedevelopment of the pool pricing system, to assess the current rules, and to investigate alternativerules for consideration.
D2 Historical background to sugar pools
Prior to the 1990 season, the Pool 1 price was based on proceeds from sugar sold domestically,from sales to assured export markets, and from any other sales necessary to bring the quantity inPool 1 up to the total of mill peaks. The Pool 2 price was based on sales to less assured markets. In

PAYMENTARRANGEMENT FORSUGAR
191
some years, the returns for Pool 2 have been higher those for Pool 1 because the more stablereturns from long-term contracts and the previously regulated domestic market are included in Pool1 (see Table D2). However, because Pool 1 includes sales on the domestic market and to quotaprotected markets such as the US where a price premium can be obtained, the Pool 1 price tends,the longer term, to be higher than the Pool 2 price.
D2: Queensland production and payments for sugar: 1980 to 1990
Season Production Prices
Up-to-peak Excess Up-to-peak Excess (No. 1 pool) (No. 2 Pool) (No. 1 Pool) (No. 2 Pool)
’000 tonnes 94 net titre $ per tonne 94 net titre
19M 2872.1 275.9 372.44 407.601981 2942.1 307.3 278.94 240.301982 3115.6 208.5 224.05 201.101983 2906.9 103.9 262.91 142.80MIA 3131.3 216.9 234.57 99.901985 3099.2 108.5 223.28 216.801986 2929.9 278.6 282.18 201.901987 3099.2 144.7 289.12 251.101988 3081.8 400.4 334.27 327.401989 3086.8 530.3 363.40 408.001990 3070.1 283.2 344.02 307.16
Notes: Excluded from the above Table is the production and payment for penal excess sugar (sugar produced from cane grown onunassigned land). A total of 145 tonnes of penal excess sugar was produced over the period 1980 to 1990. Payment forpenal excess sugar is set at a rate of $1.00 per tonne, however, for the 1990 season the Pool 2 price was paid.
Source: Submission by the Sugar Board, Cane-growers and Australian Sugar Milling Council.
D3 Schedule of payments
At the beginning of a season, the Corporation estimates a ’base price’ for raw sugar on the bestinformation available at the time. This base price is used to provide advance payment to mills andgrowers over the season. An initial advance, called an ’interim price’, is paid to mills at thebeginning of the season. For Pool 1 sugar, the interim price is 90 per cent of the estimated baseprice. For Pool 2 sugar, the interim price is 70 per cent of the interim price for Pool 1 sugar.
The schedule of payments for the two pools has also differed. Sugar sold for the Pool 1 wasdeemed to be sold before sugar for Pool 2. As a consequence, increases on the initial payments tomills arrived earlier for ’peak’ sugar than for ’over peak’ sugar (see Figure D1). As a consequencethe effective difference between the Pool 1 and Pool 2 price was greater than 12 per cent. TheCommission estimates that this was equivalent to an additional 4 per cent price difference for the1990 season.

THE AUSTRALIANSUGAR INDUSTRY
192
Figure D 1: Progress payments: 1989 and 1990 seasons
Source.. Derived from data contained in Sugar Board Annual Reports, 1989 and 1990.Note: The graph is indicative only because the initial payments and progress payments are made only when the sugar cane has
been delivered and raw sugar has been produced. This occurs throughout the milling season, beginning in June andextending through to December.
Prior to the 1990 season, the difference in the scheduling of payments for the two pools wasgreater. The schedule for the 1989 and 1990 seasons is shown in Figure D 1.
Under the new Act, the schedule of payments is at the discretion of the Sugar Corporation.Recently, the Corporation decided that, for the 1992 season, the interim payment for Pool 2 sugarwill be 12 per cent less than that for Pool 1, and that further advance payments will be at the samerate for both pools while maintaining the 12 per cent differential.
D4 Financing of advance payments
The nature of the advance payments may create a timing mismatch between receipt of salesrevenue and payments to mill owners which may necessitate the borrowing of funds. Under thenew Act, the Corporation is able to borrow money to assist in the marketing of sugar. Such
PAYMENTARRANGEMENT FORSUGAR
193
borrowings are subject to the approval of the Queensland Government and as appropriate, theAustralian Loan Council. As raw sugar is acquired by the Corporation rather than the State, theCorporation can use the sugar as security for any borrowings whereas in the past, the Sugar Boardcould not. However, as sugar is sold for cash and considerable reserves are held, there has beenlittle need for borrowings.
The Sugar Corporation under The Statutory Authorities Act, is approved to employ a number offinancial mechanisms as adjuncts to its marketing function. These include the use of options,swaps, futures and forward exchange contracts and agreements.
D5 Payments to growers
Millers make delivery payments to growers based on the declared delivery price for sugar in eachof the pools and on the terms stated in their Local Board Awards. Awards generally specify thatdelivery payments to growers should be made within 30 days of mills receiving delivery paymentsfrom the Corporation. Section 8.5 of the Sugar Industry Act 1991 directs local boards to specify abase price or base prices for sugar cane of different qualities. The Act nominates ccs as one aspectof quality which must be taken into account when determining a base price for sugar cane. Inaddition, local awards also provide for deductions from base prices in respect of diseased, damagedor ill-prepared cane and in some cases for the delivery of cane off unassigned land. Historically, thesame price formula has been set in all Awards in Queensland.
The cane rice formula, which determines the price growers receive for cane according pto sugar content and the pool to which it belongs in each mill area, is:
Pc =0.009*Ps*(ccs-4)+0.328)Pc is the average price of green cane paid to farmers in a season in a mill area.Ps is the pool price of raw sugar.ccs is the average commercial content of sugar.
The average commercial content of sugar is determined from the formula:
ccs = 3p/2*(1-[5+fl/100)-b/2(1-[3+fl/100)
p is pol per cent first express juice (measure of sucrose) f is fibre per cent b isbrix per cent first express juice (measure of soluble solids).
The cane payment formula was introduced in 1916. Since then, it has been modified on numerousoccasions. In recent cars however, it has remained broadly unchanged, although growers havesought changes on a number of occasions.
The original aim of the formula was to share the net proceeds equitably between growers andmillers by allowing each to cover their costs with any surplus split on the basis of asset values. The
THE AUSTRALIANSUGAR INDUSTRY
194
division has traditionally approximated two-thirds to growers and one-third to millers. However,the proportion has varied in practice as the proceeds are allocated to reward the growers for qualityof cane (in terms ccs) and reward the millers for the efficiency of the mill (ability to extract sugarfrom cane). For example, if a mill was extracting at close to 100 per cent efficiency, the growers’share Of sugar revenue would be about 51 per cent at a ccs of 9, and would be about 68 per cent ata ccs of 16. The mill would also benefit from an increase in revenue and through a reduction incosts by transporting and crushing less cane per tonne of sugar produced. While growers’ shareincreases at higher ccs, returns to the mills are not reduced in absolute terms. On the other hand, ata constant ccs of 14, if mills increased efficiency, say, from 90 per cent to 100 per cent, theirreturns per tonne of cane crushed would increase by about 10.6 per cent, or from 28 per cent to 35per cent of the sugar revenue. While growers’ share of revenue declines, there is no decline ingrowers’ returns in absolute terms.
Over the last 20 years average ccs has varied considerably. However, it has been trendingdownwards slightly. Over the same period mill efficiency has been increasing. As a consequence,growers share of sugar proceeds has been declining (see Figure D2).
In recent years there has been an increasing tendency for growers and millers to enter into directnegotiations on a wide range of payments (for example, for continuous crushing) or incentives (forPool 2 cane) which are outside the formulated price for sugar cane. Such negotiations take intoaccount local factors. The Sugar Industry Working Party (1990) recognised this and recommendedthat, where changes to industry practices are contemplated, local areas should negotiate anytransfers of revenues deemed necessary and that the existing cane price formula should be regardedas a ’bottom line’ base in such negotiations.
The Commission understands that CSR has paid special allowances which are outside theformulated prices to growers for sugar cane to enable them to maximise the yearly throughput ofmills without having to undertake capital expenditure. One such allowance is a ’supervisingharvesting allowance’ for cane which is delivered to mills which are continuously crushing. Wheremills extend the crushing season to maximise yearly throughput, a ’ccs underwriting’ allowance hasbeen paid to compensate growers for the lower sugar content of cane delivered in the extendedperiod.

PAYMENTARRANGEMENT FORSUGAR
195
Figure D2: Growers’ share of sugar proceeds
Source: Canegrowers
60
61
62
63
64
65
66
67
68
69
1960 1965 1970 1975 1980 1985 1990
Year
Grower’s Share %
SUGAR INDUSTRYRESEARCH
197
APPENDIX E: SUGAR INDUSTRY RESEARCH
Sugar industry research in Australia is conducted by a number of organisations at both theCommonwealth and State level. This appendix discusses some aspects of sugar industry researchactivities and the research bodies involved. Commonwealth involvement in sugar research is part ofa broader government policy for funding agricultural research and, as a consequence, needs to beconsidered in this wider context. No attempt is made in this appendix to assess this broaderquestion of the funding of rural research.
E1 The Bureau of Sugar Experiment Stations
The major research and development work relating to cane growing is undertaken by the Bureau ofSugar Experiment Stations (BSES). The BSES was set up by the Queensland Government in 1900and has operated under the Sugar Experiment Stations Act 1900-1983. This Act has beenconsolidated and incorporated into the Sugar Industry Act 1991. The Bureau is administered by aBoard which includes the Director-General of Primary Industries and industry personnel.
The Board is required to establish, maintain and administer the BSES, with the purpose of assistingin the improvement and development of the Queensland sugar industry in all matters relating toproductivity, profitability and sustainability of the sugar industry.
The major functions of the BSES are:
• to conduct research into cane growing (including the development of new varieties) and sugarmilling, with the aim of improving the efficiency of sugar production;
• to communicate the results of research to cane growers and sugar millers; and
• to administer regulations concerning plant quarantine, pests and disease control.
The BSES has research stations in the main Queensland cane growing districts, advisers in otherareas, and maintains central laboratories and administration in Brisbane.
The BSES is primarily funded from a levy per tonne of sugar cane produced in Queensland paidjointly by millers and growers. In 1990-91, the levy was $0.24 per tonne of cane. This provided anannual income of about $6 million. The Queensland Government also contributes to BSES. In1990-91, the Queensland Government contribution was $0.9 million.
The New South Wales sugar industry does not contribute levy funds to the BSES. Any servicesprovided by the BSES to the New South Wales industry are on a commercial basis.
THE AUSTRALIASUGAR INDUSTRY
198
E2 The Sugar Research Institute
The Sugar Research Institute (SRI), which is located in Mackay, is a private research organisationwhich was formed in 1949 to undertake research into technology related to cane sugar mills. It wasinitially formed by 26 Queensland sugar mills which were later joined by the remainingQueensland mills and, finally, by the three New South Wales mills in 1981. Currently all mills inthe Australian sugar industry belong to the SRI.
The SRI’s research activities include basic and applied research projects directed towardsimprovements in the processes, methods and equipment of the Australian raw sugar mills. TheInstitute also provides assistance to mills in the purchase and installation of new equipment and onproblems arising during the season. Research activities cover the areas of cane harvesting andtransport, cane preparation, milling and diffusion, juice clarification, heating and evaporation, sugarcrystallisation, separation, drying and transport, steam generation and energy systems, and effluenttreatment.
The SRI has also contributed to the improvement in milling techniques through its work oncomputerisation and automation in the milling sector. ’The results of research are communicated tomills, and many research projects are undertaken in conjunction with mills.
The work of the SRI is financed largely by an annual levy from the member mills. In 1990-91 thelevy from member mills was set at 11.5 cents per tonne of cane crushed. Some income is receivedfrom research grants. The SRI also undertakes contract work. In 1990-91, the SRI’s research andextension budget was about $4 million.
A Board of Directors, comprising five members elected by the member mills and three AssociateDirectors appointed by the Board, has overall responsibility for SRI.
E3 Sugar Research and Development Corporation
The Sugar Research and Development Corporation (SRDC), a Commonwealth statutory authorityestablished in 1990, has taken over the research and development activities of the former SugarResearch Council (SRC) which was established in 1985 under the Rural Industries Research Act(RIR Act).
The SRDC is not structured to undertake a direct role in research. Rather it distributes funds toresearch organisations and commissions research it considers desirable.
The long term objectives of SRDC are:
• to improve efficiency in the growing, processing, manufacture and refining of raw sugar;
• to ensure a sustainable industry;

SUGAR INDUSTRYRESEARCH
199
• to attract increased and new resources into the industry's research and development programs;
• to improve training in sugar research and development; and to establish effective lines of communication with and between industry bodies and research and academic institutions;
The SRDC has adopted the basic structure identified by the former SRC to address these long termobjectives. Currently, the main focus of research and development is in the following areas, withparticular emphasis on the first three items:
• the cane plant;
• the crop and its environment;
• harvesting and cane transport;
• cane quality and assessment;
• processing and manufacture of raw sugar;
• sugar handling;
• storage and product specification;
• alternative products and by-products;
• refining;
• farm extension services and decision support; and
• human resource development.
The SRDC argues that the emphasis on the first three items is warranted as many of the issuesbeing addressed influence subsequent processing.
SRDC administers research funds collected from the industry and granted by the CommonwealthGovernment. In 1990-91, the industry contributed $0.06 per tonne of cane crushed (half frommillers and half from growers). The funds collected from the industry were matched by theCommonwealth on a dollar-for-dollar basis (up to a maximum of 0.5 per cent of the gross value ofAustralian cane production), giving an annual income of $3.6 million. The New South Wales SugarMilling Co-operative contributed to the SRDC on an identical levy basis to the Queenslandindustry.
The distribution of SRDC funds to research organisations in 1991-92 was expected to be asfollows:
$ MillionBSES 1.90SRI 0.30CSIRO 0.16CSR 0.12Others 0.50

THE AUSTRALIASUGAR INDUSTRY
200
E4 Productivity Boards
Productivity Boards were incorporated into the Queensland’s Sugar Industry Act 1991 to take overthe functions and activities of the Cane Pest and Disease Control Boards which carried out pest anddisease control in mill areas.
Although not research bodies, Productivity Boards do have peripheral research function. Onefunction is to assist and co-operate with the BSES in research related to the production, harvesting,transport and processing of sugar cane or to the production of sugar cane related products. Theprincipal role of Productivity Boards is to enhance the productivity of the sugar industry byincreasing the quantity and improving the quality of sugar cane produced by providing advice onmatters related to the production and harvesting, and prevention, control and eradication of pestinfestation of sugar cane.
Productivity Boards are funded by a levy per tonne of sugar cane received at every mill within thearea of a Productivity Board. The levy varies between mill areas and ranges from 1 to 5 cents pertonne of cane.
E5 Other research bodies
The Commonwealth Scientific and Industrial Research Organisation (CSIRO) also has someresearch input into the sugar industry. In the 1980s, CSIRO undertook research into problems ofsugar production, mainly on the ratooning of sugar cane, the nitrogen nutrition of cane and severalaspects of genetics and breeding. The availability of SRDC funds and some redirection of researchpriorities has led to a substantial CSIRO involvement in strategic research for the sugar industry in1990-91. CSIRO’s Division of Tropical Crops and Pastures proposes to increase its expenditure onsugar research from its present level of $1.1 million to $1.8 million by 1996.1
Sugar research is also undertaken by the Queensland Department of Primary Industries, the NewSouth Wales Department of Agriculture and Forestry and CSR. Economic research is undertakenby the Australian Bureau of Agricultural and Resource Economics (ABARE).
E6 Participants’ comments
The BSES said that research and development should be industry driven, funded as much aspossible by users, and directly responsible to the needs of users. The BSES also supported theconcept of government incentives for industry to carry out research a,-,d development. In theirsubmission to this inquiry they said that:
1 CSIRO Institute of Plant Production and Processing, submission to the IC sugar inquiry, 1991, p. 4.

SUGAR INDUSTRYRESEARCH
201
The 150 per cent research and development tax concession scheme has proved to be very effective as a means forgovernment to support sugar industry research programmes ... With the tax concession scheme, the industrycontrols the setting of research priorities, and the conduct of research is directly accountable to the industry.
The Tully Sugar Industry said that there was need for a more cost effective research program to bedeveloped with a much faster response to sugar industry needs. They went on to say that:
This involves integration of the SRDC with the Boards of BSES and SRI. The Board should be drawn frommembers of the BSES and SRI Boards.
Similarly, the Australian Cane Farmers Association, while recognising the overlap in the millingresearch undertaken by BSES and SRI, recommends the continuation of the BSES milling researchunit because:
... this unit is seen as a bridge between milling and cane supply ... It provides the miller with an input into theneeds for suitable varieties for milling which are compatible with industry quality requirements, and for growers,it provides an impartial observance of the need for quality of cane supply for the mutual benefit of both parties.
The BSES recognised that there was some overlap between the functions of the BSES and theSRDC which highlighted a need for a special relationship between the two organisations to providethe most efficient service to the industry. However, the SRDC believes that the role and functionsof both organisations are quite distinct. The BSES charter is narrower in focus than the SRDCcharter. SRDC also believes that a special relationship already exists with BSES in that BSES hasreceived more than 50 per cent of SRC/SR13IC funds allocated.
E7 Commission’s assessment
E7.1 Funding
A number of participants (eg. Cane-growers and SRDC) commented that the sugar industry isunder researched. They went on to say that the expansion of the sugar industry advocated by theCommission in its draft report cannot be supported by the existing research and development base.
It is difficult to establish the optimal level of funding of industry research. Returns from researchare inherently uncertain and, to the extent that they generate benefits that cannot be easily identifiedor recouped from users, the benefits are difficult to judge. Comparisons with other industries orother countries are of little help as it is not clear that their level of funding is optimal. In thissituation funding derived principally from the industry itself has the merit that those most likely tobenefit from the research pay the cost, and are thus most likely to make an accurate judgement on

THE AUSTRALIASUGAR INDUSTRY
202
whether the level is optimal. They are also more likely to have the necessary information to judgewhether additional funds would be worth directing to research compared to other incomegenerating activities.
It is not immediately apparent that research activity needs to increase with an increase in the size ofthe sugar industry. Much, even most research would be the same irrespective of the industry size.In addition, because research funding is by levy on industry production, expansion will result inadditional funds for research. This additional revenue could be used to fund additional research inthe industry.
While it is frequently difficult to identify and charge individuals who benefit from research, thebenefits often accrue to clearly identifiable groups in society (such as a particular industry). This iswidely considered to justify the conclusion that such research should be funded by that group ratherthan by society as a whole.
Cane-growers believe that sugar research benefits the wider community through export returns andflow-on effects of industry activity to the community. However, the Commission considers thatthese flow-on effects could also be obtained if funds are invested in other activities. It is not clearthat such flow-on effects would be any higher if invested in sugar research than other research orfor that matter, left in the hands of taxpayers to be spent or invested depending on their ownjudgement of benefits.
While it is not clear that there are benefits from sugar industry research that are not primarilyinternalised in higher industry returns or lower costs, the availability of information is limited.Also, there is currently a general mechanism for funding rural industry research, and on the basis ofinformation available to the Commission it is not possible to justify differential treatment for thesugar industry. The Commission considers that a review of the level of funding and the extent ofCommonwealth contribution would more appropriately be undertaken in the context of a morecomprehensive review into the funding of rural research generally.
E7.2 Amalgamation of SRDC and BSES
A number of industry participants criticised the overlap and duplication of research carried out byvarious bodies and suggested the amalgamation of the BSES and SRDC. There appears to be somedissatisfaction in the industry about. SRDC’s role in controlling research funds. This appears tostem from a perception in the industry that when the Commonwealth funding was introduced in1985, this was to be a replacement of industry funding for the BSES. Under this view, the industrywas prepared to levy itself and set up the SRDC to attract the federal money on dollar-for-dollarbasis in the belief that this money would be passed on back to the BSES for their operation.
The South Johnstone Milling Company said that:
SUGAR INDUSTRYRESEARCH
203
There are some concerns about the direct contribution from the industry to the SRDC. We have grave misgivingsabout the siphoning off of the current BSES levy to the SRDC to bridge a perceived gap in research funds thatmay be available from the industry.
Flowever, the SRDC sees itself as having a wider charter and hence responsible for providing abalance between research priorities of several organisations. At present BSES has to apply forfunds from the SRDC along with other research organisation and receives about half the fundsdistributed by the SRDC.
There is certainly a degree of overlap and duplication in the administration of research funding inthe sugar industry. Indeed, a comment was made to the Commission that a total of some 50 peopleare on various bodies involved in deciding research priorities in the sugar industry. However, it isreasonable to expect that if the Commonwealth is to provide funding, it should have somemechanism for ensuring that the money is well spent. In addition, the Commonwealth Governmenthas a wider responsibility than simply the Queensland part of the sugar industry, particularly giventhat the New South Wales industry contributes to SRDC funds.
If amalgamation of the SRDC and the Sugar Experiment Stations Board were to occur, it would bereasonable for the amalgamated body to include representation from the Commonwealth and theNew South Wales industry. This could bring about savings by reducing the bodies involved inadministering research.

THE ENVIRONMENT 205
APPENDIX F: THE ENVIRONMENT
F1 Background and participants’ comments
Cane-growing has the potential to cause significant environmental damage through soil erosion andnutrient and pesticide run-off. Eroded soil, together with harmful nutrients (mainly nitrate andphosphate), are dumped in mangrove estuaries and flushed into the ocean during storms andcyclones. These nutrients and run-off fertilisers act as nurseries for algae blooms that grow at arapid rate squeezing out the slower-growing coral polyps (that build reefs).1 Furthermore,unnaturally high concentrations of nutrients can kill marine organisms.
Of particular concern in Queensland is the potential for damage to the Great Barrier Reef throughsedimentation from erosion and from nutrient run-off upsetting the ecological balance of the reef.The Great Barrier Reef Marine Park Authority (GBRMPA) said it has been postulated for sometime that run-off from cane cultivation may be having a deleterious effect on the reef. It noted thatthere have been a relatively large increase in the use of fertilisers on cane - levels in use at presentbeing over three times the levels of the early 1950s. GBRMPA also said that sugar cane accountsfor most (74 per cent) of the fertiliser used in the area.
The land assignment system has contributed to the potential for environmental damage. Pro-rataallocations with limited scope for transfers have encouraged land-locked growers to expand ontomore marginal land. As a result, 16 080 hectares of land, or about 5 per cent of assigned land, isfarmed in marginal and unsuitable areas.2
In addition, because there are restrictions on bringing additional land under cane production, thereis an incentive for the more intensive use of fertilisers and pesticides to increase output. Thecombination of increasing fertiliser usage and increasing soil erosion in recent years havecompounded the potential for adverse environmental impacts.
The new Sugar Industry Act 1991 (Section 9.10 (2.c)) includes provisions for the refusal to allowtransfer of assignment between growers unless the land has been prepared and utilised for thegrowing of sugar cane without undue damage to the environment. However, pro-rata increases ofassignment will continue under the new legislation together with continued restrictions on thetransfer of assignment to more suitable areas.
1 The Grenadine’s World’s End Reef, at the far eastern end of the Caribbean, is showing signs of pollution.
Scientists suspect that the Headwaters of the Orinoco River that flow through logged and eroded southernVenezuela - hundreds of kilometres away - are providing the nutrients creating a devastating algal plumesighted 120 kilometres out to sea. Eailliwatcli Magazine, p15, February, 1991.
2 Sugar Industry Working Party, Report to the Queensland Minister for Primary Industries, 1990, Appendix9.

THE AUSTRALIANSUGAR INDUSTRY
206
Members of the Australian sugar industry are uncertain about the environmental impact of theirindustry but acknowledge that careful monitoring is necessary. The Cane-growers of the SouthJohnstone Mill Area said that:
The Cane-growers South Johnstone Mill Area Committee acknowledges the need to examine further thepossibility that fertiliser run-off causes damage to the reef. However, actual research data has not concluded thecause-effect relationship of this question nor how other developments such as increased urbanization and roadwork practices contribute to the problem.
Similarly, Cane-growers - Mourilyan Area said that:
Environmental management of existing lands, rivers and ocean reefs is important and should be effectivelyapplied to prevent soil erosion, land degradation, flooding and damage to the Barrier Reef, commercial fisheries,and productivity.
Responsibility for managing the Great Barrier Reef Marine Park resides with GBRMPA. The GreatBarrier Reef Marine Park Act provides the power for the Governor General to make regulations"regulating or prohibiting acts (whether in the Marine Park or elsewhere) that may pollute water ina manner harmful to animals and plants in the Marine Park". The regulations which exist at presentunder this section of the Act relate primarily to the discharge of waste in the Marine Park.GBRMPA said that, where impacts on the Great Barrier Reef appear to be coming from outside theMarine Park, the Authority prefers to act in co-operation with other local, state and industry bodies.
The GBRMPA commented that evidence that run-off from cane cultivation is causing damage toreefs is not yet available but that initial results from postgraduate work in progress at James CookUniversity suggest that there may be problems in selected locations. Two projects, now beingwritten up, were centred in the Cairns and Proserpine areas respectively. Press coverage of initialresults from the James Cook study reported that pollutants from farming are flowing into the innersections of the Great Barrier Reef, but have failed to reach coral further out to sea. Results of thestudy are due at the end of 1991.3
The GBRMPA. said that soil erosion could be contained by sound farm management practices.Cutting cane green, which results in a trash blanket left on the ground, along with zero tillage aretwo major improvements in reducing soil erosion rates. The trend towards more ratoon crops alsoreduces soil disturbance and subsequent erosion. The GBRMPA referred to studies which showedthat soil losses are reduced by up to approximately 100 tonnes per hectare per year due to theseimprovements but said that these improvements have very little impact on soluble nutrient run-off.
3 The Australian, 3 July, 1991.
THE ENVIRONMENT 207
The Australian Cane-grower 28 January 1991 reported that after heavy rain and flooding due toCyclone Joy, farms that had implemented conservation farming techniques had suffered the leastdamage:
Ratoon paddocks contoured and minimum tilled had only minor damage providing that banks and waterwayswere built and maintained to specifications. Plant cane suffered the greatest damage where rows went straight upand down slopes. Contoured plant cane paddocks sustained some damage but to a significantly lesser degree.
The GBRMPA concluded in its submission by saying that it has applied for a special budget itemfor the 1991-92 financial year and subsequent years for water quality research monitoring. It saidthat if successful, a considerable proportion of this would be spent on attempting to answerquestions related to sources of nutrient and sediment run-off on coral reefs and establishing anyconnection with adjacent land use.
F2 The Commission’s assessment
A greater effort is required in understanding the respective roles of run-off and leaching inremoving nutrients from farm lands, including ways of limiting these losses by appropriate landmanagement practices such as trash blanketing, zero tillage, buffer zones, etc. The role ofgroundwater as a sink for nutrients and the quality of surface water is largely unknown. The need todesign and manufacture farm equipment to operate more efficiently in conjunction with green canetrash blanketing is also required. Educating farmers about minimising environmental damage isalso important.
Any action to restrict or ’tax’ cane-growing activity in response to environmental concerns shouldnot be initiated without adequate information on whether any significant detrimental environmentalimpact is occurring. Studies should include investigations of both the extent of any damage and thecost of reducing such damage. Such studies could be undertaken by an independent body, such asCSIRO. Only with good information could a reasonable judgement be made on the cost andbenefits of any government action.
MODELLING THEEFFECTS OFDOMESTIC REFORMS
209
APPENDIX G: MODELLING THE EFFECTS
OF DOMESTIC REFORMS
G 1 Description of ORANI-FOOD
The simulations carried out for this report are an extension of the work reported in theCommission’s Statutory Marketing Arrangements (SMA) report (Industry Commission 1991). Bothin the SMA report and in this Appendix the Commission used a version of the ORANI model of theAustralian economy, known as ORANI-FOOD. In this model cane-growing, raw sugar productionand refined sugar production are each separately identified. The basic format of the SMA analyseshas been retained. However, the impact of more extensive reforms have been considered and thepotential for improving on-farm productivity has been significantly revised.
G1.1 ORANI-FOOD
ORANI is a multisectoral model embodying both direct relationships between industries and finalusers of goods and services, and economy-wide constraints on the availability of resources and onspending and saving by Australian households and governments. In these simulations an extendedversion of the model was used, called F11-ORANI, which includes a full accounting of governmentrevenue and expenditure, and a stylised accounting of foreign ownership of Australian assets andincome payments by Australians to foreigners.
The model is solved in percentage change form. The resulting solution is a linear approximation tothe true solution. The linearisation errors arising from this procedure are negligible for simulationsinvolving only small shocks, but can become more serious as the magnitude of the shocksincreases. Because the solution procedure is linear, the results from a complex simulationconsisting of several components can in general be expressed as the sum of the results from eachcomponent.
Several agricultural commodities and food processing industries were separated out in preparing aspecial purpose ORANI database, known as ORANI-FOOD. Comparisons of the commoditiescovered in standard ORANI and the ORANI-FOOD database (both constructed from 1980-81input-output statistics) are presented in Tables G l and G2.
A key parameter affecting the simulations is the sensitivity of cane supply to changes in the pricereceived for cane. The long run elasticity of supply for cane-growing in ORANI-FOOD has a valueof 0.5.

THE AUSTRALIANSUGAR INDUSTRY
210
Table G1: Additional agricultural commodities in ORANI-FOOD
ORANI commodity ORANI-FOOD commodity
Milk cattle and pigs Milk for market milkMilk for manufacturing milkPigs
Agriculture nec, export-oriented SugarcaneAgriculture nec, export
Other cereal grains Unprocessed riceOther cereal grains necOilseeds
Source: Standard ORANI and ORANI-FOOD databases.
Table G2: Food processing industries in ORANI-FOOD
ORANI industry ORANI-FOOD industry Status
Meat products Export meat products Export-orientedOther meat products Import-competing
Milk products Market milk Non-tradedManufactured milk Export-oriented
Fruit and vegetables Preserved fruit and jams Export-orientedFruit and vegetables Import-competing
Margarines, oils and fats Margarines, oils and fats Import-competingFlour and cereal products Rice Export-oriented
Flour and cereal products Import-competingBread, cakes and biscuits Bread, cakes and biscuits Import-competingConfectionery and cocoa Confectionery and cocoa Export-orientedOther food products Raw sugar Export-oriented
Processed seafood Export-orientedRefined sugar Import-competingOther food products Import-competing
Soft drinks and cordials Soft drinks and cordials Import-competingBear and malt Beer Import-competing
Malt Export-oriented
Source: Standard ORANI and ORANI-FOOD databases.
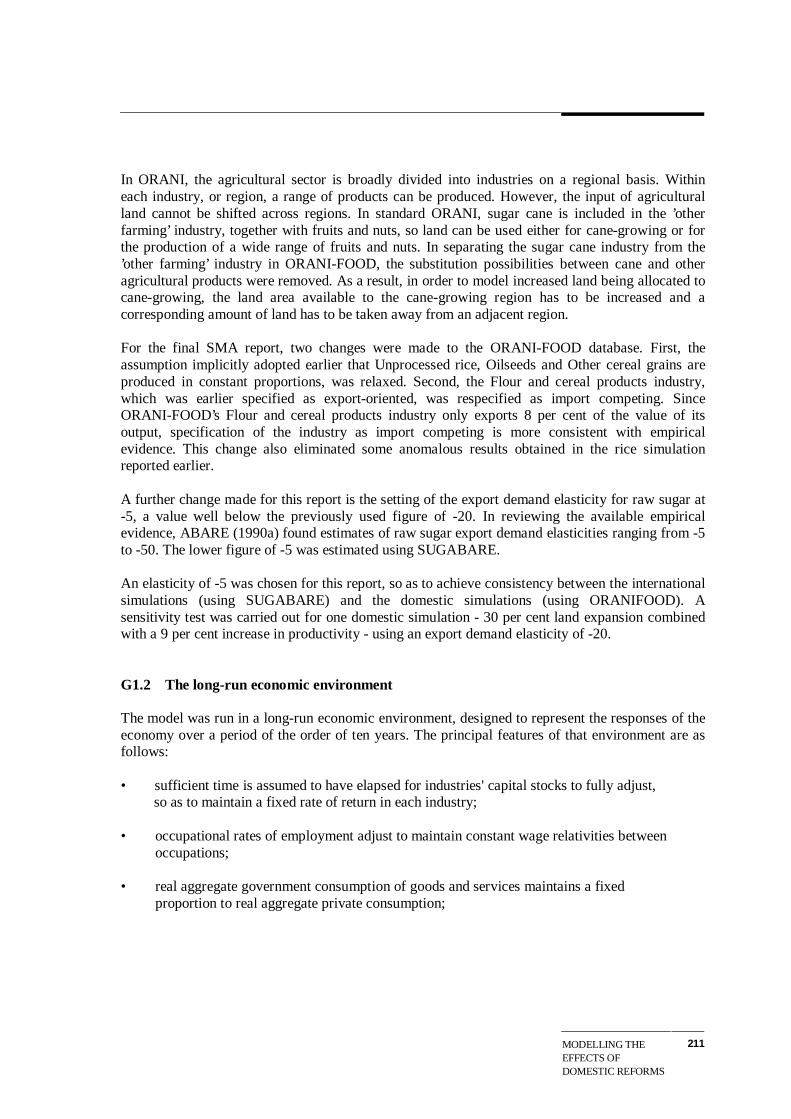
MODELLING THEEFFECTS OFDOMESTIC REFORMS
211
In ORANI, the agricultural sector is broadly divided into industries on a regional basis. Withineach industry, or region, a range of products can be produced. However, the input of agriculturalland cannot be shifted across regions. In standard ORANI, sugar cane is included in the ’otherfarming’ industry, together with fruits and nuts, so land can be used either for cane-growing or forthe production of a wide range of fruits and nuts. In separating the sugar cane industry from the’other farming’ industry in ORANI-FOOD, the substitution possibilities between cane and otheragricultural products were removed. As a result, in order to model increased land being allocated tocane-growing, the land area available to the cane-growing region has to be increased and acorresponding amount of land has to be taken away from an adjacent region.
For the final SMA report, two changes were made to the ORANI-FOOD database. First, theassumption implicitly adopted earlier that Unprocessed rice, Oilseeds and Other cereal grains areproduced in constant proportions, was relaxed. Second, the Flour and cereal products industry,which was earlier specified as export-oriented, was respecified as import competing. SinceORANI-FOOD’s Flour and cereal products industry only exports 8 per cent of the value of itsoutput, specification of the industry as import competing is more consistent with empiricalevidence. This change also eliminated some anomalous results obtained in the rice simulationreported earlier.
A further change made for this report is the setting of the export demand elasticity for raw sugar at-5, a value well below the previously used figure of -20. In reviewing the available empiricalevidence, ABARE (1990a) found estimates of raw sugar export demand elasticities ranging from -5to -50. The lower figure of -5 was estimated using SUGABARE.
An elasticity of -5 was chosen for this report, so as to achieve consistency between the internationalsimulations (using SUGABARE) and the domestic simulations (using ORANIFOOD). Asensitivity test was carried out for one domestic simulation - 30 per cent land expansion combinedwith a 9 per cent increase in productivity - using an export demand elasticity of -20.
G1.2 The long-run economic environment
The model was run in a long-run economic environment, designed to represent the responses of theeconomy over a period of the order of ten years. The principal features of that environment are asfollows:
• sufficient time is assumed to have elapsed for industries' capital stocks to fully adjust, so as to maintain a fixed rate of return in each industry;
• occupational rates of employment adjust to maintain constant wage relativities betweenoccupations;
• real aggregate government consumption of goods and services maintains a fixedproportion to real aggregate private consumption;

THE AUSTRALIANSUGAR INDUSTRY
212
• benefit rates for transfer payments are fixed in real terms;
• income tax brackets are indexed to the consumer price index;
• direct tax rates on personal and company income vary equiproportionately so as tomaintain a fixed real government sector borrowing requirement;
• the exchange rate is fixed; and
• fixed ratios are maintained between private consumption spending and national saving, andbetween investment and capital usage within each industry. The relation between investmentand saving determines the balance on current account which, together with net incomepayments to foreigners, determines the balance of trade.
G2 Detailed results
Detailed results for the simulations reported in Table 10.2 are presented in Table G3.
In simulation (a) - 30 per cent land expansion combined with 9 per cent on-farm productivityimprovements resulting from increased flexibility within the industry - the sugar industry's outputand exports are estimated to increase by 36 and 44 per cent, respectively. GDP and aggregateconsumption are estimated to increase by 0. 1 per cent each, annually.
Increasing the supply of raw sugar results in a decline in its price (around 10 per cent). Also, cane-growing being a more labour intensive activity than grazing in the region from where land wastaken away, employment of rural workers increases by 1 per cent. This puts upward pressure onwages, with nominal wages economy-wide increasing more rapidly than the CPI (0.6 per centcompared with 0.4 per cent).
The main sugar-using industries specified in ORANI-FOOD as exporting (Preserved fruits andjams and Confectionery and cocoa) would obtain their sugar inputs at a lower price. However, theywould also face higher labour costs. Since the raw sugar contents of their outputs are low (0.6 and0.4 per cent, respectively, in value terms), and labour's share of their total costs is relatively high(around 25 per cent), the effect of higher labour costs outweighs the effect of lower raw sugarprices. Overall, the industries would become less competitive internationally, their exportsdeclining by 8 and 7 per cent, respectively. This contrasts with the results of the price reformsimulation - simulation (b) - where gains in competitiveness through lower prices for sugar inputswere not eroded through higher inflation and higher real wages.
Industries other than sugar benefiting from the reforms simulated in (a) are in the rural andmanufacturing sectors which are estimated to expand by 1.0 and 0.2 per cent respectively. Due tothe exchange rate effects of increased sugar exports, certain exporting industries become lesscompetitive. These mainly fall within the mining sector, the output of which is estimated to declineby close to 2 per cent.
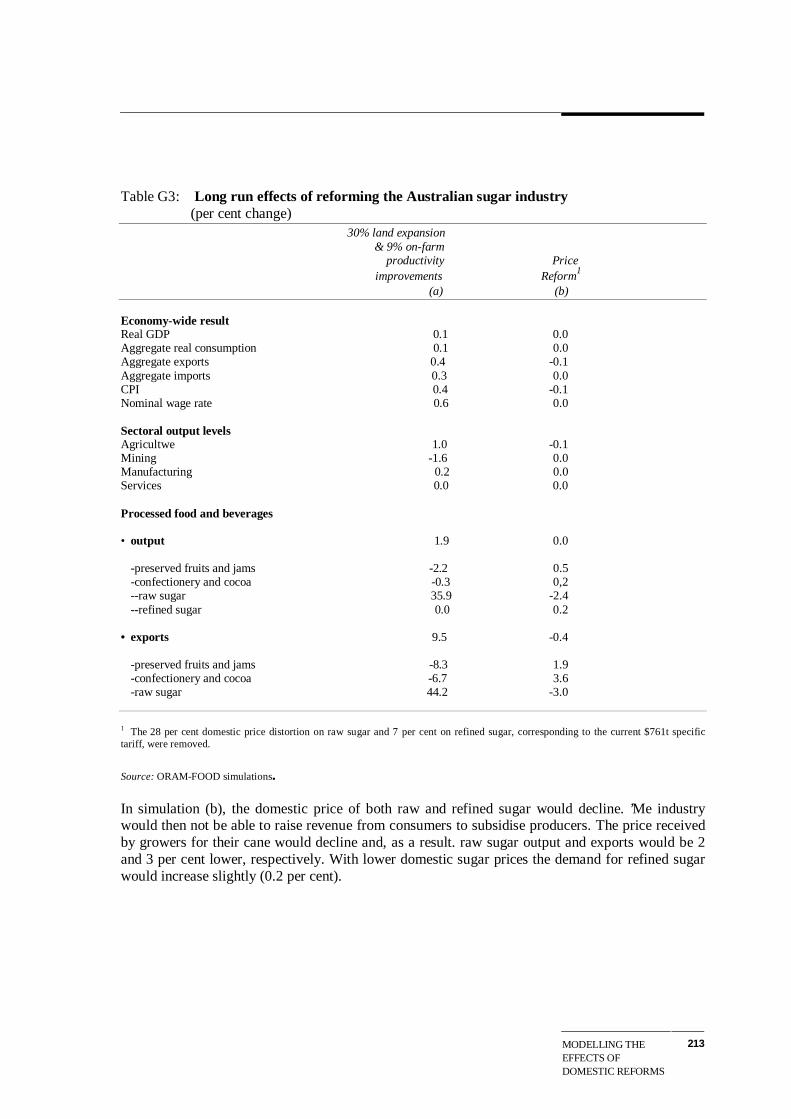
MODELLING THEEFFECTS OFDOMESTIC REFORMS
213
Table G3: Long run effects of reforming the Australian sugar industry (per cent change) 30% land expansion
& 9% on-farm productivity Price
improvements Reform1
(a) (b)
Economy-wide resultReal GDP 0.1 0.0Aggregate real consumption 0.1 0.0Aggregate exports 0.4 -0.1Aggregate imports 0.3 0.0CPI 0.4 -0.1Nominal wage rate 0.6 0.0
Sectoral output levelsAgricultwe 1.0 -0.1Mining -1.6 0.0Manufacturing 0.2 0.0Services 0.0 0.0
Processed food and beverages
• output 1.9 0.0
-preserved fruits and jams -2.2 0.5-confectionery and cocoa -0.3 0,2--raw sugar 35.9 -2.4--refined sugar 0.0 0.2
• exports 9.5 -0.4
-preserved fruits and jams -8.3 1.9-confectionery and cocoa -6.7 3.6-raw sugar 44.2 -3.0
1 The 28 per cent domestic price distortion on raw sugar and 7 per cent on refined sugar, corresponding to the current $761t specifictariff, were removed.
Source: ORAM-FOOD simulations.
In simulation (b), the domestic price of both raw and refined sugar would decline. ’Me industrywould then not be able to raise revenue from consumers to subsidise producers. The price receivedby growers for their cane would decline and, as a result. raw sugar output and exports would be 2and 3 per cent lower, respectively. With lower domestic sugar prices the demand for refined sugarwould increase slightly (0.2 per cent).
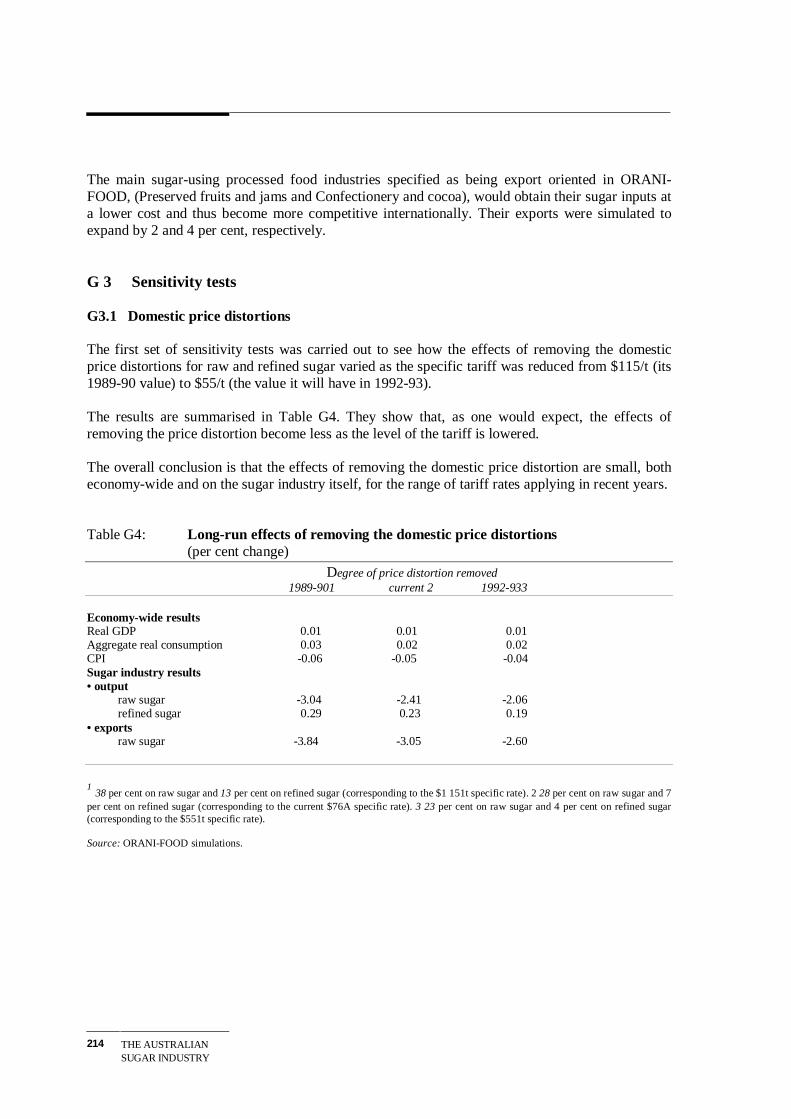
THE AUSTRALIANSUGAR INDUSTRY
214
The main sugar-using processed food industries specified as being export oriented in ORANI-FOOD, (Preserved fruits and jams and Confectionery and cocoa), would obtain their sugar inputs ata lower cost and thus become more competitive internationally. Their exports were simulated toexpand by 2 and 4 per cent, respectively.
G 3 Sensitivity tests
G3.1 Domestic price distortions
The first set of sensitivity tests was carried out to see how the effects of removing the domesticprice distortions for raw and refined sugar varied as the specific tariff was reduced from $115/t (its1989-90 value) to $55/t (the value it will have in 1992-93).
The results are summarised in Table G4. They show that, as one would expect, the effects ofremoving the price distortion become less as the level of the tariff is lowered.
The overall conclusion is that the effects of removing the domestic price distortion are small, botheconomy-wide and on the sugar industry itself, for the range of tariff rates applying in recent years.
Table G4: Long-run effects of removing the domestic price distortions(per cent change)
Degree of price distortion removed 1989-901 current 2 1992-933
Economy-wide resultsReal GDP 0.01 0.01 0.01Aggregate real consumption 0.03 0.02 0.02CPI -0.06 -0.05 -0.04Sugar industry results• output
raw sugar -3.04 -2.41 -2.06refined sugar 0.29 0.23 0.19
• exportsraw sugar -3.84 -3.05 -2.60
1 38 per cent on raw sugar and 13 per cent on refined sugar (corresponding to the $1 151t specific rate). 2 28 per cent on raw sugar and 7per cent on refined sugar (corresponding to the current $76A specific rate). 3 23 per cent on raw sugar and 4 per cent on refined sugar(corresponding to the $551t specific rate).
Source: ORANI-FOOD simulations.

MODELLING THEEFFECTS OFDOMESTIC REFORMS
215
G3.2 Land expansion and productivity improvements
A sensitivity test was carried out regarding the extent of expansions in sugar land and theassociated productivity improvements. For this purpose the assumed expansion was halved from 30per cent to 15 per cent.
The proportion of sugar land on which the improvements have been assumed to applyAustralia-wide is: (0.15+0.05)/1.20 = 17 per cent. The 1.20 figure for total sugar land includes the15 per cent expansion and accounts for the 5 per cent of cane-growing located in NSW. The costsavings arising from economies of size amount to 6 per cent, simulated as an improvement inon-farn productivity.
The results are summarised in Table G5. The estimated benefits of the on-farm improvementsarising from a 15 per cent land expansion are significant - a 0.05 per cent improvement in CDP,worth close to $200 million in 1990-91 dollars. Raw sugar production was simulated to expand by20 per cent leading to a 24 per cent increase in raw sugar exports.
G3.3 Higher export demand elasticity
A sensitivity test was also carried out for the 30 per cent land expansion combined with a 9 per centproductivity improvement simulation, setting the export demand elasticity for raw sugar at -20. Theresults are reported in Table G6. They show that, with the higher export demand elasticity, theestimated increases in raw sugar output and exports are also higher (41 and 50 per cent,respectively).
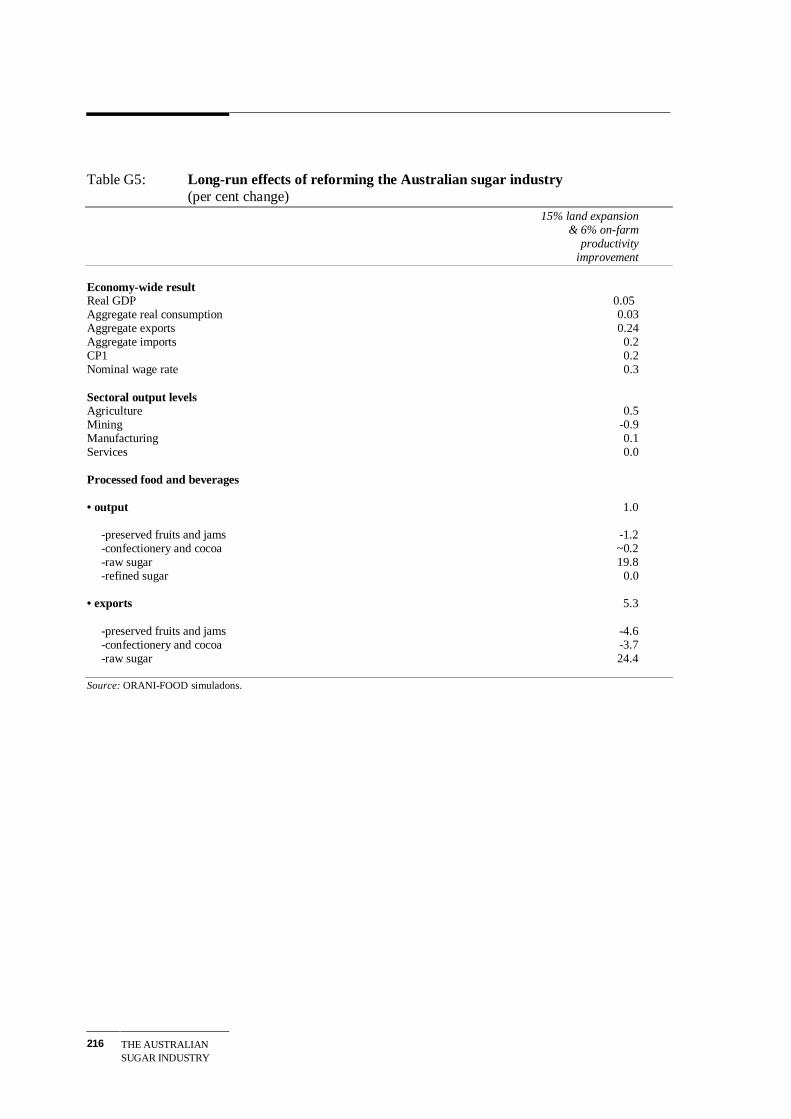
THE AUSTRALIANSUGAR INDUSTRY
216
Table G5: Long-run effects of reforming the Australian sugar industry(per cent change)
15% land expansion& 6% on-farm
productivityimprovement
Economy-wide resultReal GDP 0.05Aggregate real consumption 0.03Aggregate exports 0.24Aggregate imports 0.2CP1 0.2Nominal wage rate 0.3
Sectoral output levelsAgriculture 0.5Mining -0.9Manufacturing 0.1Services 0.0
Processed food and beverages
• output 1.0
-preserved fruits and jams -1.2-confectionery and cocoa ~0.2-raw sugar 19.8-refined sugar 0.0
• exports 5.3
-preserved fruits and jams -4.6-confectionery and cocoa -3.7-raw sugar 24.4
Source: ORANI-FOOD simuladons.

MODELLING THEEFFECTS OFDOMESTIC REFORMS
217
Table G6: Effect of setting the raw sugar export demand elasticity to - 20 (per cent change)
30% land expansionwith 9% productivity
Economy-wide resultReal GDP 0.1Aggregate real consumption 0.1Aggregate exports 0.2Aggregate imports 0.4CP1 0.5Nominal wage rate 0.8
Sectoral output levelsAgriculture 1.1Mining ~2.1Manufacturing 0.1Services 0.1
Processed food and beverages
• output 2.0
-preserved fruits and jams -3.1-confectionery and cocoa -0.5-raw sugar 40,8-refined sugar -0.1
• exports 10.3
-preserved fruits and jams -11.8-confectionery and cocoa -10.5-raw sugar 50.3
Source: ORANI-FOOD simulations.
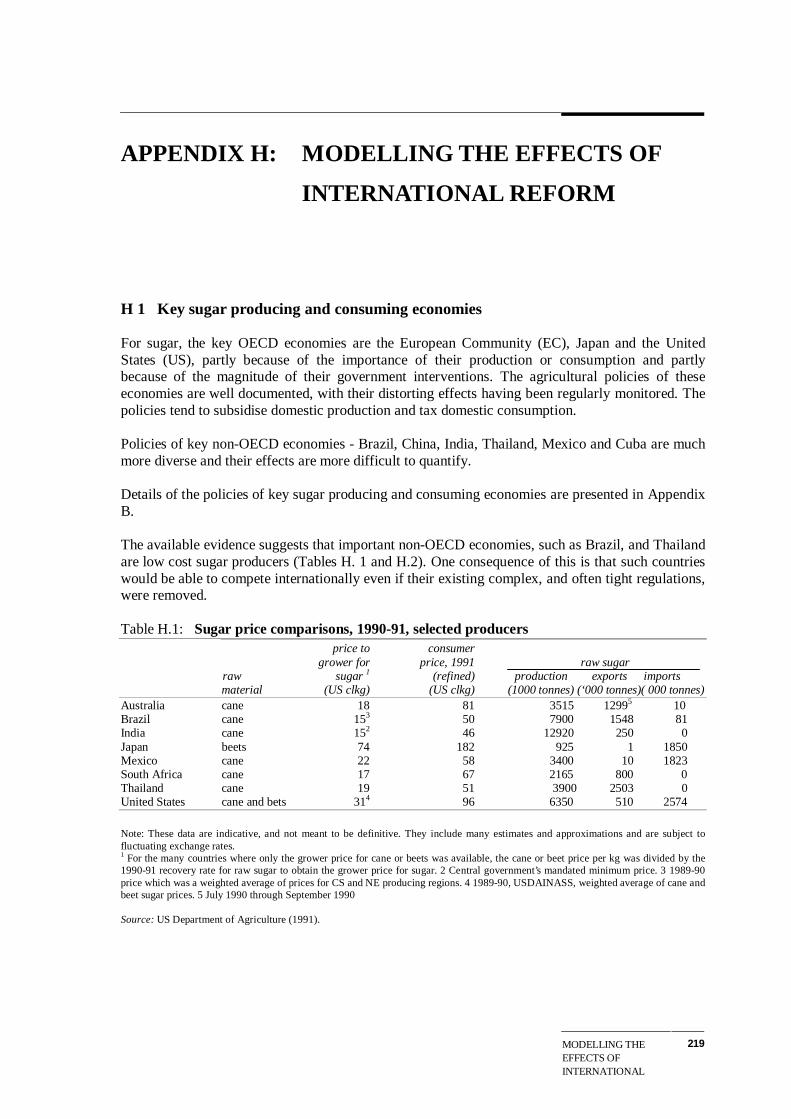
MODELLING THEEFFECTS OFINTERNATIONALREFORM
219
APPENDIX H: MODELLING THE EFFECTS OF
INTERNATIONAL REFORM
H 1 Key sugar producing and consuming economies
For sugar, the key OECD economies are the European Community (EC), Japan and the UnitedStates (US), partly because of the importance of their production or consumption and partlybecause of the magnitude of their government interventions. The agricultural policies of theseeconomies are well documented, with their distorting effects having been regularly monitored. Thepolicies tend to subsidise domestic production and tax domestic consumption.
Policies of key non-OECD economies - Brazil, China, India, Thailand, Mexico and Cuba are muchmore diverse and their effects are more difficult to quantify.
Details of the policies of key sugar producing and consuming economies are presented in AppendixB.
The available evidence suggests that important non-OECD economies, such as Brazil, and Thailandare low cost sugar producers (Tables H. 1 and H.2). One consequence of this is that such countrieswould be able to compete internationally even if their existing complex, and often tight regulations,were removed.
Table H.1: Sugar price comparisons, 1990-91, selected producersprice to consumer
grower for price, 1991 raw sugarraw sugar 1 (refined) production exports importsmaterial (US clkg) (US clkg) (1000 tonnes) (‘000 tonnes)( 000 tonnes)
Australia cane 18 81 3515 12995 10Brazil cane 153 50 7900 1548 81India cane 152 46 12920 250 0Japan beets 74 182 925 1 1850Mexico cane 22 58 3400 10 1823South Africa cane 17 67 2165 800 0Thailand cane 19 51 3900 2503 0United States cane and bets 314 96 6350 510 2574
Note: These data are indicative, and not meant to be definitive. They include many estimates and approximations and are subject tofluctuating exchange rates.1 For the many countries where only the grower price for cane or beets was available, the cane or beet price per kg was divided by the1990-91 recovery rate for raw sugar to obtain the grower price for sugar. 2 Central government’s mandated minimum price. 3 1989-90price which was a weighted average of prices for CS and NE producing regions. 4 1989-90, USDAINASS, weighted average of cane andbeet sugar prices. 5 July 1990 through September 1990
Source: US Department of Agriculture (1991).

THE AUSTRALIANSUGAR INDUSTRY
220
Table H.1: Cane sugar production costs, selected countries, 1979-80 to 1986.87($US per tonne of sugar, raw value, ex mill)
1979-80 1980-81 1981-82 1982-83 1983-84 1984-85 1985-96 1986-87
Australia field cost 126 145 163 160 172 139 140 144factory cost 66 57 59 63 81 67 75 73rank* 9 9 9 7 17 6 7 8
Brazil (CS) field cost 114 122 152 160 135 112 113 121factory cost 69 65 73 88 79 85 89 91rank* 7 4 11 18 5 5 6 7
Brazil (NE) field cost 160 172 202 205 172 142 151 150factory cost 109 105 116 122 114 102 102 99rank*
China field cost 176 192 192 199 216 238 270 227factory cost 177 189 190 224 242 214 196 162rank* 44 39 41 45 48 49 48 42
India field cost 143 197 199 159 164 141 148 152factory cost 113 189 110 76 83 169 158 132rank* 25 40 24 13 12 31 27 24
Japan field cost 461 469 599 502 493 478 522 561factory cost 196 182 262 248 215 207 213 246rank* 52 52 54 57 57 59 59 60
Mexico field cost 156 188 202 162 151 172 166 175factory cost 96 133 108 112 103 99 97 81rank* 24 27 29 23 16 20 16 15
South Africa field cost 112 127 136 148 181 146 117 142factory cost 36 46 50 59 99 65 57 56rank* 1 3 2 4 22 7 3 5
Thailand field cost 148 201 171 206 204 125 136 113factory cost 81 219 93 59 67 89 100 85rank* 21 45 20 20 19 9 8 6
USA field cost 214 234 236 234 269 257 254 235(main land) factory cost 53 60 87 98 105 93 93 84
rank* 29 25 39 34 39 36 36 29
USA field cost 242 273 291 293 294 262 246 249(Hawaii) factory cost 66 89 92 106 105 115 106 95
rank* 37 37 42 43 44 40 38 35
Rank relative to total cost (field plus factory) out of all countries surveyed (61 in 1986-87).Source: Landell Mills (1989).

MODELLING THEEFFECTS OFINTERNATIONALREFORM
221
Two models were used to assess the extent to which other countries’ protection raises or lowers theworld price of raw sugar: SUGABARE developed by ABARE and the Commission’s World FoodTrade Model. Results of the simulations are detailed in Chapter 11. A description of the modelsthemselves is provided below.
H2 SUGABARE
H2.1 Model description
Country coverage
SUGABARE is designed to analyse economic issues that relate to world sugar trade. It consists ofnine sectors: Australia, Brazil and the EC (the key exporters); US and Japan (the main OECDimporters); Soviet Union and Cuba (to account for their special trade agreement); China (one of themost important non-OECD importer); and the Rest of the World, ROW (a net importer, containingmainly developing countries).
The version of the model used in this report is the one described in ABARE (1989). The modelequations have generally been estimated using data over the 1964 to 1984 period. The world priceused in the database is the International Sugar Agreement (ISA) daily bulk raw sugar price.
The equations
The model comprises a series of econometrically estimated equations concerning production,consumption, stocks and trade for each country or country grouping. The world sugar price issolved by the equality between world demand and world supply. That is, world sugar price adjustsin the model so as to ensure that the world market clears.
Interactions
Commodities other than sugar are considered by the model if, historically, they have had aninfluence on sugar markets. The commodities considered are wheat (a substitute for sugar beet inproduction in the US and the EC); high fructose corn syrup (a substitute for refined sugar inconsumption in the US and Japan); ethanol, which can be used to power motor vehicles and can beproduced from sugar cane (Brazil); and crude oil, the prices of which are modelled to affectadministratively set domestic sugar prices in China. In countries like China, high internationalsugar prices pose a threat to foreign exchange objectives. In the model, producer prices in Chinaincrease more rapidly than world prices in order to reflect the government’s desire for increased selfsufficiency as world prices rise. Through foreign exchange considerations, the oil price also

THE AUSTRALIANSUGAR INDUSTRY
222
Influences the setting of sugar cane prices since, in 1984, 16 per cent of China’s foreign exchangeearnings were from crude oil exports. In the model, the domestic price of cane in China variesinversely with the world price of crude oil.
Policies affect prices
A characteristic of the world sugar market isthat in many countries’ domestic sugarprices are held, by policy, above the worldprice (Figure H.1). As suggested buyprevious studies, the net effect of variouscountries’ sugar policies is a lower and lesstable world price.
Demand
World sugar consumption doubled over thepast two decades (Figure H.2). this wasmainly due to large increases in demand inthose developing countries with experiencedrapidly rising living standards. For examplein the seven years between 1980 and 1987,per person consumption of refined sugar inChina increased from 3.82 kg to over 7 kg –an average growth rate of close to 12 percent a year. China’s relatively high incomeelasticity of demand is reflected in themodel’s econometric estimates, withconsumption elasticity for sugar relative toincome having been estimated at 1.4,compared with around 0.3 for OECDeconomies ( Table H.3). Table H.3 alsoshows that consumption is relativelyinsensitive to changes in sugar prices.Consumption is generally modelled as afunction of income per head and thedomestic price.

MODELLING THEEFFECTS OFINTERNATIONALREFORM
223
Table H.1 Consumption elasticities (in 1985 unless otherwise specified) Sugar consumption with respect to Domestic World Income price priceAustralia 0.364 -0.076 -0.0241
European Community 0.264 -0.320 0.005United States2 0.287 -0.048 -0.0483
Japan2 0.241 -0.119 -0.1704
Brazil 0.484 -0.009China 1.362 -0.005Cuba 0.847 0USSR 0.401 -0.003Rest of World 0.510 -0.007
1 Assuming operation of a system of fixed duties (introduced July 1989).
2 ElasLiciLies of total caloric sweetener consumption.
3
Respectively, when an import quota is and is not in force. 4 Respectively, when the world price is below the minimum stabilisation price,
and midway between the latter and the target price.
Source: ABARE (1999).
Supply
Over the past 20 years, world supply grew broadly in line with demand. However, in several yearsgrowth in production was ahead of consumption. This is thought to have arisen from asymmetricalresponses in supply due to production quotas in several key countries expanding when sugar pricesrose, but not declining when prices slumped. In years of oversupply there were large increases instocks, placing downward pressure on world sugar prices.
In some years, world production did not fully match consumption, generally due to adverse weatherconditions. Overall, the effects of government policies, combined with variable weather conditions,resulted in a less steady trend in production than in consumption.
The above characteristics, which have led to instability in world prices, are embedded in the modelas:
• an exponential formulation of production to account for the asymmetrical response toworld price changes in key countries;
• a full account of stock behaviour.,
• the modelling of weather patterns, with projected patterns assumed to follow thoseobserved in the past;
• addition of a stochastic facility allowing for averaging the results of 60 simulations(production equations subject to random disturbances with the same variance as theestimated residuals). The stochastic simulations aim to capture the effects of randomfluctuations in the price cycle; and
• availability of a 'deterministic' mode. Deterministic simulations show the effect of theunderlying economic variables on prices.

THE AUSTRALIANSUGAR INDUSTRY
224
Model solution
The model is first run in ’base’ mode over a specified time period (that is without changes to policyvariables), so as to obtain the baseline mean and variance of the world sugar price. Then the modelis rerun with the desired policy changes and the results are compared with those of the baseline.
H2.2 Model validation and sensitivity testing
To validate its model, ABARE used the Kolmogorov-Smirnov non-parametric test, Theil’s U2 testand sensitivity analysis. The Kolmogorov-Smirnov test showed that the model was capable ofreplicating the historical distribution of world sugar prices; the Theil test indicated that the modelwas capable of tracking recent price movements; and the sensitivity tests showed that the resultswere not unduly sensitive to changes in parameter values.
ABARE concluded that there were no misspecification errors in the model and that it could beconfidently used to simulate the market and to asses the likely effects of policy changes.
However, ABARE noted that, because of the exponential terms in the production equations, themodel tended to show unrealistically large production responses to price jumps outside thehistorical range - the biggest historical jump having been US20c/Ib.
H2.3 Assumptions about the external environment in forward simulations
The model projects into the future, using data over the 1964 to 1984 period. For the simulations inthis report, the projection period chosen is from 1985 to 2004. The following assumptions weremade for the forward simulations:
• annual population growth rates: 1 per cent for OECD countries and USSR and 2 per centfor China, Cuba, Brazil and ROW;
• annual income growth rates: 5 per cent for China and 2.5 per cent for all other countries orgroupings;
• exchange rates projected by use of ARINIA models;
• US average farm price for wheat and EC farm price index for wheat were held constant attheir 1985 levels - US$3.5 per bushel and 76.95 (1970=100) respectively;
• weather dummy replicated the historical weather pattern. Since in the estimation periodhad the value 1 in 1966, 1968, 1971, 1972 and 1979, in the forward simulations it hadbeen set at 1 for 1987, 1989, 1992, 1993 and 2000;
• for the USSR, the yield of beets per ha was increased b 2 per cent a year and was subjectedto random shocks in accordance with observed variance;

MODELLING THEEFFECTS OFINTERNATIONALREFORM
225
• Japanese policies remained at their 1989 settings: import duty Y413/kg, refining cost Y56/kg,excise tax Y16/kg; and
• Australian sugar import tariff remained at 15 per cent.
The assumptions are the same as those listed in ABARE (1989).
H 3 The World Food Trade model (WFT)
The WFT model was developed by the Commission, based on Tyers (1984 to 1986). Like the Tyersmodel, the WFT model recognises 30 regions and seven agricultural commodity groups. Itdisplays, however, some important differences.
First, the WFT is a general equilibrium model in that it accounts for production and consumption ofall goods markets, rather than in the seven food commodity markets only. Second, the WET modeladopts a comparative static frame-work, with its equations being a linear approximation of theoriginal Tyers equations. While sacrificing the dynamic capabilities of the original model, theadvantage of such a formulation is its relative simplicity and ease of interpretation -- a featureespecially useful in policy analyses.
Third, while in the Tyers model production and consumption behaviour are mostly described byunrestricted estimates of demand and supply elasticities, the WFT model imposes the requirementthat the own and cross-price elasticities be consistent with underlying utility and productionfunctions. That is, standard neoclassical optimisation behaviour provides the basis for the WFTmodel's demand and supply equations.
Finally, the ORANI model has been made an integral part of the world model. This provides adetailed picture of the effects of world food trade liberalisation on Australia. More detail on theWTF model and on the way the WFT and ORANI models are linked is described in Horridge,Pearce and Walker (1990).
THE GROWER - MILLRELATIONSHIP
227
APPENDIX I: THE GROWER – MILL
RELATIONSHIP
In this report, the Commission has proposed that the more or less uniform delivery arrangementsembedded in the existing local awards no longer be obligatory. This would provide growers andmills with greater flexibility to negotiate arrangements that are mutually agreeable to the individualparties concerned and would facilitate efficient growing and milling practices in each region.
After this proposal was made in the draft report, it resulted in considerable comment at the draftreport hearing and in additional submissions to the Commission. As a consequence, theCommission has examined more closely the economic relationship between growers and mills, andat aspects of likely contractual arrangements.
I1 The economic relationship between mills and growers
The principal concern of cane-growers is the potential economic power of mills as the single buyerof cane in a region (accentuated by the prevalence of common ownership of adjacent mills),compared with the limited power possessed by a large number of cane-growers. In its submission,Cane-growers said that;
Abuse of the mills’ monopsonistic power in the early years of this century led to the introduction of the generalform of regulation which remains in place today. There is nothing to indicate that those who now own the millshave become any more altruistic.
While much has changed in the ensuing 80 years, some changes have served to strengthen theposition of mills, while others have served to weaken that position. The market power of mills hasbeen strengthened by:
• the introduction of mechanical harvesters to cut cane into billets which has reduced the timeavailable between when the cane is cut and when it is crushed. This has significantly reducedthe effective distance that harvested cane can be transported; the development of tram linesdedicated to a particular mill; the rationalisation the mills' operations over the years;
• the increase in the common ownership of groups of mills in the major geographical sugar caneregions; and
• the increased capital cost of mill construction which limits new entrants into milling.
The market power of mills has been weakened by;
• the growth of organised grower representation;

THE AUSTRALIANSUGAR INDUSTRY
228
• greater access by growers to information; and the development of legislation governing tradepractices and the provision of opportunities for external arbitration.
Despite changes in mill ownership which may have reduced the potential for competition betweenmills, it is clear that, as a result of the development of legislation over time, groups in societywhose members have little individual power (such as farmers and consumers) are better protectedfrom the abuses of economic power than they were at the beginning of the century. Nonetheless,there is clearly concern that, without the existing regulations, mills could exercise market power.
In principle, there are two forms of behaviour that mills could engage in to the detriment ofgrowers. These involve what can be termed 'opportunistic' behaviour and discriminatory pricing toappropriate land 'rent'.
I1.1 Opportunistic behaviour
Opportunistic behaviour could be aimed at exploiting 'quasi-rents' generated by the capitalcommitted to an activity. Quasi-rents result from the investment of dedicated capital which, onceinvested, cannot be used for other activities and the output of which is dedicated to a single or verylimited number of buyers. In this situation, the single buyer (mill) can bargain the price (of cane)down below the level necessary to provide a return on the capital invested (in cane growing). Thebuyer is essentially only contributing to operating and maintenance costs and not to the cost ofcapital. Because of the limited opportunity to shift the capital once committed, the supplier is stillbetter off continuing to supply rather than closing down.1 The benefit to the buyer from this 9action is regarded as a 'rent' in economic terms as its appropriation does not change the level ofeconomic activity (that is, the supplier continues to supply) but, because in the longer term thisaction will discourage future investment by suppliers, it is essentially a short-term or quasi rent.
The possibility of this behaviour is often avoided by the use of long-term contractual arrangementsprior to the investment being committed and, if necessary, vertical integration between suppliers ofraw materials and processors to overcome the costs of this potential behaviour. Vertical integration
1 Benjamin Klein, Robert Crawford and Armen Alchian, ’Vertical Integration, Appropriable Rents and the
Competitive Contracting Process’, Journal of Law and Economics, October 1978, Oliver Williamson,’Transaction-Cost Economics: the Governance of Contractual Relations’, Journal of Law and Economics,October 1979. Glen Hubbard and Robert Weiner, ’Efficient Contracting and Market Power: Evidence Fromthe U.S. Natural Gas Industry’, Journal of Law and Economics, April 1991.
THE GROWER - MILLRELATIONSHIP
229
becomes more attractive as the assets become more specific and the quasi-rents increase.2
The likelihood of this sort of behaviour in the Queensland sugar industry would appear to be small,despite the existence of specific capital in cane-growing and limited buyers. At best, it is ashort-term strategy that would seriously discourage long-term investment in cane-growing.
CSR commented that;
Millers have to ensure cane supplies over many years, not year to year. They cannot afford to alienate growers inthe short, medium or the long term.
and;
The economics of milling are highly sensitive to the throughput of cane. If growers were to constrain theiraggregate production by, say, 10 per cent it would have a calamitous effect on the mills’ profitability. We haveexperienced this effect this year in that the fall in crop alone, which in our mills has been of the order of 25 percent, has reduced CSR’s sugar milling profits by at least 75 per cent.
Indeed, it can be argued that growers, once organised, are in a better position to engage in this sortof opportunistic behaviour because, in some regions, it is easier for growers to find alternative usesfor their land than it is for a miller to find an alternative use for the considerable capital invested ina sugar mill.
The representative of the South Johnstone Cane-growers said;
... there is a fear amongst growers that if all the regulations were taken away, the mill owner would use some bigstick over the growers... I think 1 would be far more fearful in a deregulated industry of being a mill owner than agrower because a mill owner can do one thing with his mill and that is crush cane and nothing else.
One possible reason for a mill to engage in this otherwise destructive long-term behaviour wouldbe if it were part of a strategy to displace private cane-growers and acquire land for a verticallyintegrated cane-growing and milling operation. While this is a conceivable scenario, it is unlikely,as there would be the strong possibility that such action would precipitate intervention bygovernment.
11.2 Appropriation of land rent
The second form of behaviour that mills could engage in is discriminatory pricing to appropriatesome of the additional value that is generated by using land for cane-growing compared withlower-return alternative uses. This value would normally appear as a higher land value reflectingthe higher return from cane-growing. At the margin, land under cane would have the same value asalternative land uses, but there will exist considerable areas of land where the return from cane-growers will be appreciably higher than any alternative use, either because of agronomic and /orlocational characteristics.
If the cane-grower had many mills to deliver cane to, a single market price for at any one timewould be expected to expected to exist for all growers, with the additional returns to more suitable
2 R. H. Coase, ’The Nature of the Firm: Influence’, in, 771e Nature of the Firm Edited by Otiver E
Williamson and Sidney G Winter, Oxford University Press, 1991.

THE AUSTRALIANSUGAR INDUSTRY
230
land accruing to the landholder in the form of higher land prices. However, if there is only on e milthat growers can sell to, the potential exists for the mill to discriminate in prices between growers,offering a lower price to those whose alternative land use is significantly less profitable than cane-growing. The land would remain under cane, so long as the price was not low enough to make thealternative land use a viable alternative, with the higher returns generated from land’scharacteristics being appropriated by the mill rather than the landholder.
Because such opportunistic behaviour, if undertaken effectively, would not change the choice onwhether to grow cane, it would not represent a decline in economic efficiency. It would simplyrepresent a wealth transfer from landholders to the mill. Whether action needs to be undertaken tolimit such potential transfers is a question of equity rather than economic efficiency.
I2 Options
Where there is a difference in organisational structure - many small growers and a few largemillers – a rational economic response would be for growers to join forces to balance the mill’smarket power, or for farms to become fewer and larger enterprises. An example of this behaviour
THE GROWER - MILLRELATIONSHIP
231
was the formation of a grower organisation for the negotiation of sales of a particular quality ofwheat direct to a flour miller to increase returns over what would have been obtained if the wheathad been sold through the then existing channels (Australia Wheat Board).3 Under deregulation,sugar growers would have an additional incentive to become larger, or to organise themselves intogroups to negotiate conditions with the local mill.
Grower organisations would, however, be subject to the provisions of the Trade Practices Actwhich limit collusive arrangements to reduce competition between suppliers. However, the Actprovides for the exemption of pricing agreements if 50 or more parties are involved, provided thatthe arrangement is judged to be in the national interest and that participation is voluntary.
I2.2 Contracting
Contracting is a means of coordinating successive stages in a commodity systems. Contracts canreduce uncertainty for both parties. The assurance of an outlet for sugar cane, the assurance of asupply to process, and the increased efficiency from harmonising stages from production toprocessing operate to the advantage of both contracting parties. Another benefit of contracting isthat it offers an alternative to government refulation.
CSR commented;
It does not seem to be widely recognised that a commercial contract system would have to replace the existinglegislative system comprising awards, and that these contracts will clearly specify the benefits and obligations toboth parties. Both growers and millers need the certainty of a contract and they need a contract which may last atleast 3 to 5 years. The growers need to have the confidence that they will be able to supply cane on reasonableterms and the mills need to know they are going to obtain cane supplies on reasonable terms.
Contracts do not cover all contingencies. Appropriate adaptations will not be evident for manycontingencies until circumstances materialise. A range of processes and techniques, includingarbitration as a final measure if others cannot resolve the problem, could be used to maintain theneeded flexibility. Rational contracting could also encompass an adjustment process. The referencepoint is not only the original agreement, but the entire relationship between the parties over time.
Characteristics of private contracts
It is difficult for the Commission to specify what should, or even what is likely to be, included inany contract between growers and millers. These matters are best left to negotiation between theseparties who are far more familiar with the industry and the particular situation they face in theirregions. Nevertheless, there are some features that could reasonably characterise a private contractsystem.
3 Walgett Special Pool’s Evidence, Industry Assistance Commission’s Inquiry – The Wheat Industry,- Report
No. 411, February 1988, AGPS.
THE AUSTRALIANSUGAR INDUSTRY
232
. Interim arrangements
It is unlikely that deregulation would mean the immediate move to a system of private contracts. Itwill take time for contracts to be negotiated and agreed. In the short term, mills have an incentive tomaintain supplies and, in the longer term, encourage growers to stay in the industry and newgrowers to enter. Therefore, it is likely that the current local awards would continue to govern therelationship between growers and mill as the conditions of private contracts are developed bynegotiation. However, with deregulation, the conditions could be modified over time.
. Length of contract and price variability
Given the extent of investment needed to establish a cane farm and the four to five year cycle forcane-growing, contracts are likely to be for an extended period of time, rather than on a year to yearbasis. CSR commented that contracts of three to five years are likely to be necessary to ensuresupplies for mills and markets for growers. They could also include roll-over provisions, that is,include options to extend on an annual basis, but with the negotiation conducted well before thecontract period expires.
Such long-term contracts would be primarily aimed at ensuring continuity of supply for the milland access to milling capacity for the grower. Given the variability in the sugar price in theinternational market, contracts are likely to need to include provision for regular adjustment toprices. This could be either automatic adjustment subject to an appropriate index, perhaps based onthe spot or futures price for sugar, or, depending on the risk preferences of each party, the contractcould include greater or lesser price stability for cane.
. Development of a standard contract
Given the large number of small growers in each mill area, it is unlikely that each grower wouldnegotiate a unique contract with the local mill. The costs of negotiating hundreds of separatecontracts with unique conditions is likely to be far too high, both for the grower and the mill. It islikely that a standard contract would be developed following consultations between growers andtheir mill. This could be used by the majority of the smaller suppliers to the mill.
However, individual contracts could be negotiated between the mill and some growers (such asvery large farms or harvesting groups) whose circumstances may differ from the majority ofgrowers in the mill area. In these circumstances, it could be worthwhile for them to negotiateclauses specific to their situation.
THE GROWER - MILLRELATIONSHIP
233
. Scheduling of milt supply and price variation over the season
One of the principal features of cane supply to mills is the need to schedule delivery of canethroughout the season. Under a system of a single price for ccs over the season, there is anincentive for growers to deliver at the time of peak ccs. The mill, however, has limited capacity anda capital investment which it would maximise by operating for as long a period as possible. Thisscheduling problem is currently handled by the organisation of harvesting schedules under the localaward, with rotating harvesting programs operating over a number of years.
The problem of seasonal processing scheduling is not unique to sugar, it is a feature of manyagricultural products. In many cases an agreed scheduling of deliveries to a processing plant is afeature of a contract, but intra-seasonal price differences essentially control the harvesting andprocessing schedule.
By way of illustration, the price of cane per unit of ccs could vary over the season, in an inverserelationship to the level of ccs. At the period of high ccs, the price would be low, discouragingsupply in excess of mill capacity, with higher prices per unit of ccs at the beginning and end of theseason to encourage sufficient cane to maintain the mill at optimal crushing rates. At the extremeends of the season, the price the mill was prepared to offer would not be sufficient to encouragegrowers to grow and supply and this would determine the economic limits of the harvesting andcrushing season. Some price differences throughout the season already exist through harvestingallowances towards the ends of the season.
Transport costs
Given the ownership of much of the transport infrastructure by the mills, notably dedicated tramlines, transport arrangements could be negotiated in two ways. One form would be based ondelivery ’at the mill gate’ for situations where trucking of cane is the norm and growers or privatecontractors can more efficiently transport cane than the mill. Another form would be for delivery atthe loading facilities on the tram network operated by the mills. In comparison with the currentsituation, where transport costs are effectively averaged across all growers, a more flexible systemcould result in higher prices for growers closer to the mill and lower prices for more distantgrowers, reflecting the different transport costs. The extent to which this would occur woulddepend, to some extent, on the need for the mill to maintain throughput, and in some cases, millsmay need to absorb transport costs to encourage sufficient production from more distant areas.
Arbitration of disputes
CSR commented at the draft report hearings that arbitration of disputes is likely to be a feature ofcontracts. CSR said;

THE AUSTRALIANSUGAR INDUSTRY
234
We believe that an arbitration process should be and would be included in the contract for the determination ofany matters which are unable to be settled by agreement. By this, we mean local arbitration, not the perpetuationof a central arbitration authority.
CSR also said that there is an Arbitration Act in Queensland [as there is in every State] which isoften included in contracts as a means of resolving disputes. The Commission understands that,subject to the agreement of both parties, the Act can still apply, even if the relevant clause is notincluded in a contract. However, arbitration under the Act can be as expensive as litigation.Alternative arrangements involving agreed mediation procedures could be included withincontracts. This is becoming more common in other industries in response to the cost of establishedlitigation and arbitration procedures.
In its investigations, the Commission received mixed comment on the usefulness of externalarbitration, with criticism of the encouragement of ambit claims and the disincentive it provided forthe parties to resolve differences themselves. The Commission is aware of a system of arbitration inoperation in the province of Ontario in Canada known as ’final offer selection’. This is used inCanadian tomato contracts. Under this system, written submissions are obtained from both partiesand an arbitrator selects one submission or the other. This discourages unrealistic ambit claims,which would stand little chance of acceptance, and encourages the two parties to submit claimscloser to the middle ground.
Increased flexibility
One of the principal benefits of a system of private contracts would be the scope for greaterflexibility than is currently possible. The Commission received some criticisms and heard muchanecdotal comment on the current ’formula’ system, particularly the difficulties of introducing anychanges to the established procedures. Private contracts would make it easier to negotiate differentmixes of prices and penalties for such things as quality, which would be better able to reflect thedifferent growing and harvesting conditions that individual growers face. They would also make iteasier to introduce new technology without having to be concerned that this would threaten thecurrent measurement system in a way that would require fundamental alteration -- something thathas proved to be almost impossible to achieve. An example that has been mentioned is the use ofdiffusers to supplement the crushing of cane which, while efficient, cause problems with thecurrent system of measuring ccs from the first crush. There are likely to be other changes to milltechnology that are difficult to introduce because of the inflexible system currently in use.
I2.3 Negotiating committees
In Victoria, Negotiating Committees have been set up under State legislation in response to aperceived need to provide primary producers of three commodities (processing tomatoes, broilersand wine grapes) with a countervailing bargaining position to that of food processing enterprises.
THE GROWER - MILLRELATIONSHIP
235
These Committees seek to equalise the bargaining positions of the processors and primaryproducers. The intention is to establish a formal environment in which the two groups attempt tonegotiate the terms, conditions, specifications and prices at which producers and processors tradeproduce.
In circumstances where there is failure to reach agreement, the legislation provides for recourse toan arbitrator who adjudicates on the issue in question and makes a decision which is binding onboth parties.
The Public Bodies Review Committee (Victoria) appraised these Negotiating Committees in 1987and stated that:
Negotiating Committees appear to be relatively efficient structures for intervening in the marketing of specificagricultural commodities in that they represent less intervention than is generally involved with statutorymarketing authorities.... Voluntary agreements have predominated and more stable business interrelations havebeen fostered between primary producers and food and beverage processing companies.4
The Review Committee recommended the continuation of the negotiating committees for tomatoesand broilers, and the abolition of the committee for wine grapes because the characteristics of thatmarket did not warrant such regulation.
In other States, some statutory marketing authorities and committees have been set up principallyfor the purpose of negotiation of prices between producers and processors, for example, the WineGrape Processing Industry Negotiating Committee in New South Wales.
If private contracts were not acceptable in Queensland, the use of negotiating committees along thelines of those in Victoria could be a useful alternative to the current controls, or could even act as atransitional arrangement between the current system and complete deregulation.
4 Public Bodies Review Committee, Nineteenth and Twentieth Report to the Victorian Parliament, 1987.
REFERENCES 237
REFERENCES
Abbott, G. (1990), Sugar, Routledge, New York.
Anderson, K. and Tyers, R. (1986), Agricultural Policies of industrial countries and their effects ontraditional food exporters, Economic Record 179 (December), 385-99.
Australian Bureau of Agricultural and Resource Economics (1989), ’The Economic Consequencesof International Sugar Trade Reform’, Discussion Paper 89.7, AGPS, Canberra.
_(1982), ’EEC sugar support policies and world market prices: a comparative static analysis’,Working Paper 82-13, ABARE.
_(1988), ’Japanese Sugar Policy and its Effects on World Markets’, ABARE Occasional Paper No.104, Canberra.
_(1990a), ’Australia’s Influence on World Sugar Prices’, Agriculture and Resources Quarterly,March.
_(1990b), ’1990 and US Sugar Policy Reform, ABARE Discussion Paper No, 90.4., AGPSCanberra.
_(1991 a), ’An Analysis Of The Effects Of Government Intervention On The International Price OfSugar’, ABARE Conference Paper 91.40, project 8226.101 presented at Industry CommissionSugar Modelling Workshop.
_(1991b), ’Domestic and World Market Effects Of EC Sugar Policies’, ABARE Discussion Paper 91. 1, AGPS Canberra.
Australian Canegrower, (1991), 23 September.
Australian Sugar Yearbook (199 1)
Baru, S. (1990), The Political Economy of Indian Sugar - State Intervention and StructuralChange, Oxford University Press.
Borrell, B. (1990), ’An Overview of World Sugar Policies and Prospects’, ABARE paper presentedto the ACP Third Special Ministerial Conference on Sugar, 9-11 May.
Borrell, B. (199 1 a), ’How a Change in Brazil’s Sugar Policies Would Affect The World SugarMarket’, Policy Research and Extension Affairs, Working Papers, International Trade,International Economics Department, The World Bank, April, WPS 522, Washington D.C.
Borrell, B. (199 1 b), ’The Mexica ’ n Sugar Industry’, Problems and Prospects, Working Papers,International Trade, International Economics Department, The World Bank, February,WPS 522, Washington D.C.
THE AUSTRALIANSUGAR INDUSTRY
238
Borrell, B. and Duncan, R.C. (1990), ’A survey of the costs of world sugar policies, PolicyResearch and Extension Affairs’, Working Papers, International Trade, InternationalEconomics Department, The World Bank, October, WPS 522, Washington D.C.
Centre for International Economics (199 1), Sugar Winning in a Corrupt World Market, reportcommissioned by CSR Limited.
F.O. Licht, (1991), International Sugar and Sweetener Report, September.
Fry, J. (1985), ’Sugar: Aspects of a Complex Commodity’, World Bank Working Paper No. 1985-1.
Government of India (199 1), Budgetfor 1991-92, part A, pp 13 and 15.
Horridge M., Pearce D., Walker A. (1990), ’World Agricultural Trade Reform: Implications forAustralia’, The Economic Record, September.
Industry Commission (199 1), Statutory Marketing Arrangements for Primary Products, ReportNo. 10, AGPS, Canberra.
Landell Mills Commodity Studies (1989), ’A World Survey of Sugar and HFCS Production Costs,1979/80 to 1986/87’.
O’Sullivan, M. K(1990), ’Sugar Cane: Biological and Environmental Considerations, AlternativeUses and Economies of Scale’, Contributed paper presented to Agricultural Economics SocietyConference, Brisbane, 12- 15 February.
OEC7D (1989), Agricultural Policies, Market’s and Trade, 1989.
OECD (199 1), Agricultural Policies, Markets and Trade, 1991.
Perez-Lopez, LF.(1989), ’Sugar and Structural Change in the Cuban Economy’, WorldDevelopment, Vol 17, No 10.
Roningen, V.0 and Dixit, P.M (1989), ’How Level is the Playing Field? An Econometric Analysisof Agricultural Policy Reform In Industrial Markets Economies’, Economic Research Service,US Department of Agriculture, Washington D.C.
Sedgwick, K.N. (1987) ’Estimates of Profitability of Burdekin Irrigation Farms’, QueenslandDepartment of Primary Industries, Information Series QI 87011, Brisbane.
Sturgiss, R., Tobler, P., and Connell, P. (1990), ’Australia’s influence’ on world sugar prices’,Agricultural and Resources Quarterly, 2(1), 47-55, AGPS Canberra.
Sugar Industry Working Party (1990), Report to the Queensland Minister for Primary Industries,Brisbane.
Tyers, R. (1984), ’Agricultural Protection and Market Insulation: Analysis of International Impactsby Stochastic Simulation’, Pacific Economics Papers, No. 111, Australian Japan ResearchCentre, ANU, Canberra.

REFERENCES 239
_(1985), ’International Impacts of Protection: Model Structure and Results for EC AgriculturalPolicy’, Journal of Policy Modelling, 7 (2), 219-5 1.
_and Anderson, K. (1986), ’Distortions in World Food Markets: A Quantitative Assessment’, Back-round Paper for World Bank, World Development Report 1986, Washington D.C.
US Department of Agriculture (199 1), World Sugar Situation and Outlook, May.
Webb, A.T., Roningen, V.0. and Dixit, P. (1987), ’Analysing agricultural trade liberalisation for thePacific Basin’, Paper presented at the Livestock and Feedgrains Working Group of the PacificEconomic Cooperation Conference, Napier, New Zealand, 20-22 October.