the balanced scorecard as a performance...
TRANSCRIPT

THE BALANCED SCORECARD AS A PERFORMANCE MEASUREMENT
TOOL FOR THE SOUTH AFRICAN GOVERNMENT’S UPGRADING OF
INFORMAL SETTLEMENTS PROGRAMME
by
LEONI JULYAN
submitted in accordance with the requirements
for the degree of
DOCTOR OF COMMERCE
in the subject
ACCOUNTING
at the
UNIVERSITY OF SOUTH AFRICA
SUPERVISOR: PROF PC DU PLESSIS
June 2011

ACKNOWLEDGEMENTS
I would like to express my sincere gratitude to all who have helped me to
complete this study. Specific thanks to:
My Lord and Saviour, for daily perseverance, insight and grace.
My supervisor, Prof Piet du Plessis, for his commitment, patience and
guidance.
My husband Edgar and children Lorissa and Brendan for their sacrifices,
understanding and unending support.
Sandra Mills for the editing.
My family and friends for their encouragement.
My friends and colleagues in the Department of Management Accounting
and the College of Economic and Management Sciences at the University of
South Africa for their interest.

SUMMARY
The perceived lack of progress by the Department of Human Settlements
(“Department”) in meeting the increased demand for subsidised housing post-
1994 is a ticking time bomb, given the repeated promises without any prospect
of meeting the commitment to eradicate or upgrade all informal settlements by
2014. Despite ongoing delivery of subsidised housing, the backlog remained at
2,4 million households from 2005 to 2009, the indicator being the number of
informal settlement households. The “Department” has acknowledged the
existence of bureaucratic blockages throughout the housing delivery chain.
Despite the urgency of the situation, there appears to be no research on the
departmental factors hampering delivery under the Upgrading of Informal
Settlements Programme (“programme”) and finding a solution that would
maximise delivery within budgetary constraints. This research assesses the
suitability of the Balanced Scorecard (BSC), a Strategic Management
Accounting performance measurement and management tool, for addressing
the departmental factors hampering delivery (“factors”) under the “programme”
and develops a conceptual framework to guide any future application of the
BSC to the “programme”.
The complexity of housing delivery and the proposed integration of the BSC call
for a detailed literature study of the post-1994 national housing and
“programme” documentation and that of the public sector BSC. The theoretical
study will establish how and by whom housing delivery should be done, the
“factors” and the BSC framework and translation process. This will serve as the
basis for the assessment of the suitability of the BSC for addressing the
“factors” and the development of the conceptual framework.

This study revealed that the BSC is suitable for addressing seven of the eight
departmental factors hampering delivery under the “programme” and partially
suitable for addressing the remaining factor. The recommendation is that the
BSC be applied to the “programme” according to the conceptual framework
provided. This study has contributed to knowledge by: producing an overall
picture of the national framework for the delivery of subsidised housing,
presenting the BSC as a suitable performance measurement tool for addressing
the departmental factors hampering delivery under the “programme”, and
developing a conceptual framework for any future BSC application to the
“programme”.
Key terms:
Subsidised housing delivery, governmental facilitators, departmental factors
hampering delivery, Balanced Scorecard in the public sector, performance
measurement, mission, strategy execution, National Department of Human
Settlements, South African Government’s Upgrading of Informal Settlements
Programme

1
CHAPTER 1
INTRODUCTION
1.1 BACKGROUND
In 1996, the basic right to housing was formalised in the new Constitution. In
terms of section 26(1) of the Constitution, every person has the right of access
to adequate housing. Section 26(2) of the Constitution squarely lays the
responsibility on the state to realise this embedded right, subject to available
resources (Constitution of the Republic of South Africa, 1996). The above
sections of the Constitution place huge demands on the state to deliver
housing. The government department tasked with providing housing was known
as the National Department of Housing until mid-2009, after which the name
was changed to the National Department of Human Settlements (National
Department of Human Settlements 2009c:1).
The provision of housing is not a straightforward endeavour. This statement by
Ms Sankie Mthembi-Mahanyele, a former Minister of Housing, in Cohen
(1997:137) sheds some light on the complexity involved:
Housing is, as I have found out during the past two years, about
everything but houses! It is about the availability of land, about access to
credit, about affordability, about basic services, about economic growth,
about social development, about the environment. Some elements of all
these have to be in place before the first brick of a house is even laid.
The complexity of housing delivery is further illustrated by an opinion expressed
by the same housing minister, who stated that no single formula exists to meet
the housing challenge, but that policy should continually evolve to effect the

2
positive changes required (National Department of Housing 2000a:1). Since the
advent of democracy in 1994, this evolving process has been visible through
multiple documents which have been put in place by the National Department of
Housing/Human Settlements as part of its mandate to frame national housing
policy in terms of the Housing Act of 1997 (Housing Act 107 of 1997, s 3(2)).
Housing is delivered by multiple facilitators, nongovernmental organisations and
housing institutions – within and outside government – which have various roles
to play (South African Government Information 2008:10−13).
In addition to the complexity of delivery discussed previously, many sources
within and outside government report that the rate of growth in housing demand
exceeds delivery (National Department of Housing 1994:8; Cohen 1997:149;
National Department of Housing 2004:3–4; Hutchinson 2006:30; Chenwi
2007:21; National Department of Human Settlements 2010c:1). The Submission
for the Division of Revenue 2010/11 sheds light on the rate of growth in the
demand for subsidised housing, attributing the growth to declining household
sizes, migration, unemployment and an increase in the population (Financial
and Fiscal Commission 2009:58). Where subsidised housing delivery is not
accelerated in line with the growth in housing demand, the subsidised housing
backlog will increase. An example of a backlog in an area is provided by
Hutchinson (2006:29), quoting Mr Amos Masondo, the executive mayor of
Johannesburg, who acknowledged in February 2006 that the city and province
were aware of the need to fast-track housing in Alexandra and that the 1996–
1997 housing list would be adhered to. Although the housing backlog still exists,
statistically, it appears that progress is being made. According to Statistics
South Africa (2007:9), 70,5% of households lived in formal dwellings in 2007,
compared with 64,4% in 1996; the comparative figures for informal settlements
were 14,5% in 2007 and 16% in 1996.

3
While the above statistics show an improvement, there is general consensus
that there is a long way to go, as is illustrated in the report, Current and future
building activity in South Africa: 2006–2015 (2006:61), which states that
affordable housing represents 49% of the total investment in housing – or 91%
of the need expressed in numbers – and would require 36% of the available
mortgage finance. According to the report, 80,55% of the affordable housing
market is made up of people earning a household income of up to R3500 per
month and looking at an average house price of R110 000 (2006:59). These
homeowners would rely on a combination of individual credit from financial
institutions and governmental project-linked subsidies. Of the people who make
up 80,55% of the affordable housing market, 59,96% represent households who
would rely on subsidies, being people with a household income of up to R1999
per month and who are looking at an average house price of R50 000 to
R70 000 (2006:59).
Regarding individual credit from financial institutions, banks are cautious about
re-entering the low-income housing market as a result of past experiences
where loans were made to low-income earners, but banks were unable to
repossess the properties when lenders defaulted on payments (Housing
Finance 2000:4). Hohendorff (2006:20) reports that banks are holding
discussions with government – and between themselves – on finding ways of
limiting the risk of lending money to low-income earners. Cokayne (2009:1)
quantifies the risk, stating that the National Housing Finance Corporation, a
state-owned development finance institution, experiences a default level of just
below 5% of the total loans granted, whereas major banks work on a 2,5%
default level.
Another factor implicated in the failure of the delivery of housing to keep up with
the rate of growth in demand is quality issues and fraud by developers and
government officials. It has been widely reported that many problems have
4
been encountered with the poor quality of the subsidised houses delivered,
mainly due to incompetent or dishonest contractors (Parliamentary Monitoring
Group 2004:2&4; samaYende 2005:1; Mail and Guardian Online 2008:1;
Maleke 2008:1; Masinga 2008:1; Sidumo 2008:1; Smuts 2006:1–2). According
to Mabaya (2007:1), a lack of project management skills in the early 1990s and
fraud and corruption by developers – some in collusion with Government
officials – affected contracts worth R2 billion. In 2002, government blocked the
contracts, declaring that it would not accept substandard work. From 2002 to
March 2008, the problems posed by these contracts were investigated by
auditing each project; determining what monies were recoverable from
developers; charging corrupt officials and making the completion of the projects
a priority. In April 2008, Ms Damane-Mkhosana, the head of the anti-corruption
unit at the National Department of Housing, stated that 7363 cases involving
government officials who had fraudulently acquired RDP houses were being
investigated (7000+ in RDP scam 2008:1). In May 2008, former Housing
Minister Sisulu disclosed to Parliament that more than 31 000 housing subsidy
cases involving government employees had been uncovered and that the
Department intended charging persons who had acted illegally (Ngalwa
2008:2). In April 2010, Minister Sexwale (National Department of Human
Settlements 2010a:7) stated that since November 2009, the Special
Investigations Unit had uncovered corruption, malpractices and abuse and that
1570 officials had already been arrested, of whom 1189 had been convicted,
with R38 million having been recovered and five lawyers struck off the roll.
The Ministry of Housing indicated in 2004 that “drastic and paradigm shifting
measures” were needed to address the delivery of housing to the 2,4 million
households living in informal settlements, failing which housing backlogs would
reach an estimated total of 2,378 million by 2010 and 2,5 million by 2014
(Current and future building activity in South Africa: 2006–2015 2006:62).
5
In view of this, in September 2004, the then Minister of Housing, Lindiwe Sisulu,
announced a new plan, which was published as Breaking New Ground: a
comprehensive plan for the development of sustainable human settlements and
commonly known as the Breaking New Ground (BNG) plan (Current and future
building activity in South Africa: 2006–2015 2006:62; National Department of
Human Settlements 2010c:1). At the time, the BNG plan was hailed as a crucial
part of national policy for the delivery of subsidised housing because it changed
the emphasis from the delivery of numbers of houses, schools and roads, to a
more holistic qualitative and quantitative drive to build communities (Lombard
2004:2). The strategy of the BNG plan emphasises the “development of
sustainable settlements and quality housing” to bring dignity to the recipients
(Dyantyi 2007:1). As envisioned in the BNG plan, the housing subsidy is to be
increased annually so that it is aligned with increased costs. The subsidy
provides for a 40 m2 house (National Department of Housing 2008e:1) with an
open plan living room and kitchen, two bedrooms and a bathroom with a toilet
and shower (Maleke 2008:1) and with electricity (Dyantyi 2007:1). The quality of
building materials used for the BNG houses is substantially better than before
and the houses are larger than the previous houses, some of which were only
24 m2, with no running water and no partitions (Maleke 2008:1).
At the time of the launching of the BNG plan in 2004, former Housing Minister
Sisulu believed that the new plan would eradicate all informal settlements within
10 years, that is by 2014. According to the Accounting Officer’s Overview
(National Department of Human Settlements 2010c:1), the prime objective of
the BNG plan is the “eradication and upgrading of all informal settlements by
2014/15”. Yet, even though the greater part of the housing policy framework has
been in place by 2004, along with facilitators, and the BNG plan has been
applied since September 2004, delivery has not accelerated as anticipated. It
appears that the BNG plan merely halted the growth in the number of informal
settlement households, but made no inroads in the backlog, as is borne out by

6
the delivery statistics discussed in chapter 2 and the number of informal
settlement households quoted next. Hutchinson (2006:30) quotes Lindiwe
Sisulu, a former Housing Minister, as saying that by 2005, 2,4 million families
were living in informal housing structures, a figure quoted again in 2007
(Chenwi 2007:21) and 2009 (SabinetLaw 2009:2).
On the basis of these figures, it appears that the launching of the BNG plan has
not resulted in “drastic and paradigm shifting measures” in the delivery of
housing, as was initially intended when it was launched in 2004. Despite all the
actions described above to ensure that housing delivery is accelerated, the
National Housing Goal for delivery, which was set in 2000 at 350 000 units per
annum until the housing backlog has been overcome (National Department of
Housing 2000c:3), has not yet been reached.
In 2004, it was acknowledged that the wide gap had to be bridged in that South
African government performance had to be measured through clear governance
and development indicators (Department of Public Service and Administration
2004:1). The decision was taken to implement a Government-wide Monitoring
and Evaluation (GWM&E) System in all government departments across all
levels of government. Monitoring and Evaluation forms part of the GWM&E
System, the intention being to increase effectiveness so that a greater
developmental impact is achieved (The Presidency 2007:5). The Presidency
(2007:2) indicates that the object of Monitoring and Evaluation is to evaluate
performance, identify factors which contribute to service delivery outcomes and
to draw causal connections between the choice of policy priorities, resourcing of
policy objectives, programmes designed to implement them, services actually
being delivered and the ultimate impact on communities. While the principle and
intention of implementing Monitoring and Evaluation across government is
sound, there is no evidence that it is actually contributing to service delivery
outcomes.
7
While there have been various interventions that have attempted to address the
housing backlog, the situation should not be underestimated. Cohen (1997:137)
argues that the fundamental problem is that there will never be sufficient funds
to address the housing needs of the country. Cohen (1997:143) states that the
housing budget for 1997/98 was R4,7 billion and the individual subsidy was
R15 000 per beneficiary. For 2009/10, the allocation to provinces was just over
R12,4 billion (Division of Revenue Bill 2009:49) and the cost of providing
housing in eThekwini was approximately R80 000 per household (Misselhorn
2008:21). When the 1997/98 housing budget is compared with that of 2009/10
and the comparative subsidies of R15 000 and approximately R80 000 per
household are noted, it is obvious that fewer beneficiaries can be assisted than
in 1997/98. It is therefore imperative that the money spent on housing is
effectively utilised in order to benefit as many people as possible.
According to Minister Sexwale, studies have shown that if the current trend in
the funding of the housing budget continues, there will be a housing funding
shortfall of R102 billion by 2012, which could increase to R253 billion by 2016
(National Department of Human Settlements 2009d:1–2). The above discussion
confirms the statement by MEC Ndou that the government is faced with the
“mammoth task” of providing houses for the poorest of the poor (Tshikudo
2008:1) and the opinion of Hutchinson (2006:28) that the housing crisis has
been “seriously underestimated”. In spite of the need, it is unlikely that the
funding trend for the housing budget is going to change, because housing has
to compete with other national priorities like health, water and education – while
the State fiscus has limited funds (National Department of Housing 1994:15–
16). In this situation, the opinion expressed by Mr Johan Minnie of the National
Department of Human Settlements appears to be very apt. After emphasising
the complexity of the housing issue in the presentation of the Budget and
Strategic Plan 2009/10, Minnie stated that in the end it was about money and
the best use of every rand (Parliamentary Monitoring Group 2009a:1–2).

8
The above paragraphs have outlined the complexity of subsidised housing
delivery and the inability of the Department of Housing/Human Settlements to
reach the delivery targets set by them, in spite of various interventions. It is
argued that a tool must be found to assist the Department of Human
Settlements to address the constraints encountered and to enable the best use
to be made of every rand so that delivery targets can be reached.
According to Drury (2008:576), new developments in Strategic Management
Accounting, such as the Balanced Scorecard (BSC), provide for an integrated
framework of performance measurement and management, focused on
financial and non-financial performance measures. The BSC was initially
developed by Kaplan and Norton as a tool for performance measurement
(Kaplan & Norton 2001:vii) because businesses in the information age are
operating in complex, competitive environments and the BSC provides
managers with the instrumentation they need to be successful in that
environment (Kaplan & Norton 1996b:2). The BSC has a holistic perspective,
translating the mission and strategies into objectives, performance measures
and targets which make strategy executable (Niven 2003:32). As executives in
organisations adopted the BSC for performance measurement, they found that
the BSC could also be used as a performance management system (Kaplan &
Norton 1996a:85). The BSC as a performance management system has a wider
application, aligning the various management processes and focusing the
attention of everyone in the organisation on implementing long-term strategy
and enabling the alignment of the various management processes (Kaplan &
Norton 1996a:85). Weinstein (2009:46) contends that the focus of the
management control system should be on the strategic goals of the
organisation and that of the performance measurement system should be on
evaluating the progress in achieving these goals. As public sector entities
searched for tools to manage complex environments, the BSC was adapted for

9
public sector use. The public sector BSC uses the following four interrelated
perspectives, namely: Customer, Financial, Internal Processes and Employee
Learning and Growth (Niven 2003:32).
1.2 RESEARCH FOCUS
In 2005, former Housing Minister Lindiwe Sisulu stated that in spite of a R29,5
billion investment by the public sector in housing over ten years, informal
settlements “continue to mushroom” (Hutchinson 2006:30). It is argued that this
statement points towards confusion as to why the investment in housing has not
had the desired effect of reducing the number of informal settlement
households.
In paragraph 1.1, the complex housing delivery environment was found to have
multiple facets. Even though the greater part of the housing policy framework
and multiple facilitators has been in place for many years, delivery has not
accelerated as anticipated. According to Sisulu, a former Housing Minister
(National Department of Housing 2008b:1–2), investigations into housing
delivery constraints subsequent to the launching of the BNG plan pointed to
weaknesses in intergovernmental relations which were hampering development
efforts. This is confirmed by Minister Sexwale, who cited “bureaucratic
blockages which affect every step of the human settlement delivery chain” and
the existence of “bureaucratic service delivery log-jams” (National Department
of Human Settlements 2009k:2). For ease of reference in this study, the term
“national framework for the delivery of subsidised housing” has been used to
refer collectively to present South African national housing principles,
legislation, policies, plans, mission, core values, vision, strategies, national
housing programmes and governmental facilitators, based on developments
since the advent of democracy in 1994.
10
It is argued that, in an environment where budget allocations are limited and
increases in the subsidies per household have outstripped the increase in total
budget allocations, the best use of every rand as proposed by Minnie above
would be to maximise delivery within budget allocations. Minnie’s opinion is
interpreted as a shift in emphasis away from seeing the budget as a constraint
to seeing it as an enabler instead and asking how it can best be utilised. This
appears to direct attention inwards, towards an internal or departmental
perspective. The presence of internal or departmental weaknesses or
blockages that hamper development efforts as discussed above would clearly
not maximise delivery and facilitate the best use of every rand, but would more
likely be a constraint that would hamper delivery.
Because there is a widespread belief that the BSC represents one of the most
significant management accounting developments and because the BSC has
become known as an important management tool for improving operational
performance (Hendriks, Menor & Wiedman 2004:1–2), this study aims to
assess the suitability of the BSC for the Upgrading of Informal Settlements
Programme. The BSC is the least criticised, most widely accepted
(Amaratunga, Baldry & Sarshar 2001:179) and used performance measurement
system (Paranjape, Rossiter & Pantano 2006:5) in organisations of all sizes and
types – in both the private and the public sectors (Bible, Kerr & Zanini 2006:23).
More specifically, the success of the BSC in managing quality in a major
infrastructure project, namely the Heathrow Terminal 5 project, where other
quality plans had failed, has established and proved the applicability of the BSC
for major construction projects (Basu, Little & Millard 2009:22, 32).
As discussed in paragraph 1.1, the Department of Human Settlements is
currently making use of Monitoring and Evaluation for performance
management. Nair (2004:2–3) contends that the BSC attempts to move
organisations from “monitoring” to “measurement“ to “management” to
11
“direction-setting”. On the basis of Nair’s (2004:2–3) insights, the use of the
BSC as a performance measurement system by the Department of Human
Settlements would be a more sophisticated performance management
application than the present system of Monitoring and Evaluation. This is in line
with the viewpoint of Mooraj, Oyon and Hostettler (1999:487) that the BSC is
seldom initially introduced into an organisation as a performance management
system, but rather as a performance measurement system. Past experience
has shown that as executives notice the benefits of the BSC, the application of
the BSC initiates a change process that becomes much wider than the
performance measurement application initially intended (Kaplan & Norton
1996a:77). Because the needs of organisations are continually evolving in
response to changes in the environment, the fact that a performance
measurement system has the potential to be used for performance
management is a good reason for choosing the system. A case in point is the
change in Strategy 9 of the BNG plan, which was initially performance
measurement but was changed in 2010 to performance management (National
Department of Human Settlements 2009b:33–34). After this change in 2010,
consideration was given to changing the scope of this study from the BSC as a
performance measurement tool to the BSC as a performance management
system. It was decided that performance management is too wide and
multidisciplinary for a study of this nature and that the scope of the study should
be limited to performance measurement. Srimai, Radford and Wright (2011:668)
argue that a performance measurement system is a central part of a
performance management system.
It was therefore decided that the focus of the research would be the
departmental factors that hamper delivery under the Upgrading of Informal
Settlements Programme and that have to be addressed to maximise delivery
within budgetary constraints; assessing the suitability of the BSC, a Strategic
Management Accounting tool, to do so; and the development of a conceptual

12
framework to guide any possible future BSC application to the Upgrading of
Informal Settlements Programme provided that the BSC is found to be a
suitable tool.
1.3 OVERALL RESEARCH AIM AND INDIVIDUAL RESEARCH
OBJECTIVES
The overall aim of this research is twofold, firstly to critically assess whether the
Balanced Scorecard (BSC) as a performance measurement tool is suitable for
addressing the departmental factors hampering delivery under the Upgrading of
Informal Settlements Programme. Secondly, where the BSC is found to be
suitable, the aim is to develop a conceptual framework which could guide any
possible future application of the BSC to the Upgrading of Informal Settlements
Programme.
Specifically, within the context of the Upgrading of Informal Settlements
Programme (“programme”), the objectives of this research are to:
Produce an overall picture of the national framework for the delivery of
subsidised housing and indicate where the “programme” fits into the
framework.
Investigate the complexity of the upgrading of informal settlements scenario,
including the provisions of the “programme”.
Identify the multiple departmental factors hampering delivery under the
“programme” and organise and combine them under relevant headings.
Clarify the use of the BSC as a performance measurement tool for the public
sector and do a preliminary appraisal of whether the present Monitoring and
Evaluation or the BSC has the potential to collectively address the factors
hampering delivery under the ”programme”.

13
Critically assess the suitability of the BSC as a performance measurement
tool for addressing the departmental factors hampering delivery under the
“programme”.
Develop a conceptual framework to guide a possible future application of the
BSC to the “programme”.
1.4 DELIMITATION OF RESEARCH
While the discussion has indicated that the BSC has various possible levels of
use, this study is limited to the use of the BSC as a performance measurement
tool. The use of the BSC for performance management or for direction-setting is
therefore excluded. Performance measurement will only be discussed against
the backdrop of the changes in the business environment which triggered the
development of recent performance measurement systems like the BSC. The
wider discipline of performance measurement is excluded.
As will be understood from paragraphs 1.2 and 1.3, the study focuses on the
delivery of subsidised housing in South Africa, at the national level under a
national housing programme, namely the Upgrading of Informal Settlements
Programme. The discussion will be limited to the Upgrading of Informal
Settlements Programme and an overview of the framework for the delivery of
subsidised housing. The other national housing programmes are therefore
excluded. The advent of democracy in South Africa in 1994 triggered the
development of new national housing principles, legislation, policies, plans, a
mission, core values, a vision, strategies, national housing programmes and
governmental facilitators. The discussion will therefore be confined to
developments post-1994 and the present situation. The study is restricted to
housing/human settlements at the national level and therefore laws that apply to
the public service in general, such as the Public Finance Management Act
(PFMA) of 1999, are excluded, as is provincial and municipal housing

14
legislation. Because of the internal or departmental perspective, only
governmental facilitators are included. These are the three tiers of government
and the housing institutions that report to the National Department of Human
Settlements.
1.5 NEED FOR THIS RESEARCH
There is a need for this research, because, in 2004, government made a
commitment to eradicate or upgrade all informal settlements by 2014, an
undertaking which was reiterated on many occasions (South African
Government Information 2005a:5; National Department of Housing: 2006a:1;
2006b:2; 2006c:1; 2006d:1). In 2010, there was an unannounced shift away
from that commitment to one of upgrading a limited number of informal
settlements (Parliamentary Monitoring Group 2010a). The initial and revised
commitments are discussed in more detail in chapter 3. It is argued that where
a delivery commitment of this nature is made to very poor people living in dire
poverty in informal settlements, hopes are raised. Where delivery does not
progress accordingly, the affected people lose hope and the scene is set for
protests and violence, as has become common in South Africa. In 2008,
Misselhorn (2008:3) was already of the opinion that the situation “constitutes a
political and developmental powder-keg”. He based this opinion on the fact that
the promises of housing and other developments which had been made from
various platforms, especially before elections, were only partially kept because
of limited delivery of these promises.
The acceleration of the upgrading of informal settlements remains a delivery
priority because it is the first of the five delivery priorities set for 2010 to 2014 by
the Department of Human Settlements, subject to further directives from the
Presidency (Parliamentary Monitoring Group 2010b:1–2).

15
Misselhorn (2008:3) is of the opinion that there is a growing awareness that the
present approaches to the complex informal settlement issue are rather
inadequate. In the Housing Budget Vote Speech Minister Sexwale states that in
order to provide human settlements, “a new approach, a paradigm shift beyond
housing . . . a change of mindset” is required. Minister Sexwale envisages a
focus on holistic and integrated planning and improved cooperation and
coordination with other departments in the “brand new” Ministry (National
Department of Human Settlements 2009d:1–2). In April 2010, Minister Sexwale
stated that the department should: “make our work simpler, reduce compliance
work that adds no value and focus our energies on a few deliverables and do
them well” (National Department of Human Settlements 2010a:7). After this,
President Zuma, speaking at a Presidential Coordinating Council meeting on
Human Settlements, stated that government needs to be “quicker, smarter, use
money wisely and prioritise services that would better the lives of ordinary
citizens” (Cities Alliance 2010:1).
It is argued that the upgrading of informal settlements is a delivery priority and
calls have been made by the most senior persons in government for a new,
smarter approach, one that will use money wisely. It was argued earlier in this
chapter that where factors are hampering delivery, delivery will not accelerate
as anticipated and the best use will not be made of every rand. A tool therefore
has to be found which is suitable for addressing the departmental factors
hampering delivery under the Upgrading of Informal Settlements Programme.
While it has been shown in the background section that human
settlement/housing delivery is complex, the BSC is an integrated framework
which was developed and is widely used as a performance measurement and
management tool to address complex challenges. Where the BSC is found to
be suitable, it could be central in a new approach to delivery so that future
spending on housing will achieve the maximum results, so that the prophetic

16
words of Billy Cobett are not realised. He said, “the Housing Ministry is making
great progress and now has a splendid housing policy. But just no houses” (The
Helen Suzman Foundation 1996:7).
This research is distinctive in that it investigates delivery from a Strategic
Management Accounting perspective, which no research to date has attempted.
This research aims to fill certain gaps in our knowledge by doing the following:
producing an overall picture of the national framework for the delivery of
subsidised housing; organising and combining departmental factors hampering
delivery under the Upgrading of Informal Settlements Programme under
headings selected as most suitable; doing a preliminary appraisal of Monitoring
and Evaluation versus the BSC to collectively address the departmental factors
hampering delivery under the Upgrading of Informal Settlements Programme;
and assessing the suitability of the BSC in addressing each of the departmental
factors hampering delivery under the Upgrading of Informal Settlements
Programme, all of which have not previously been attempted. Lastly, this study
intends developing a conceptual framework to guide any possible future
application of the BSC to the Upgrading of Informal Settlements Programme,
something which has not been attempted before either.
Where, through this study, the BSC is found to be a suitable tool for addressing
the departmental factors hampering delivery under the Upgrading of Informal
Settlements Programme, wider application to the other national subsidised
housing programmes – and any other government priority programmes – could
be investigated as further research.

17
1.6 RESEARCH METHODOLOGY
Before a decision can be made on a suitable research methodology, the
method of classifying the primary sources of data needs to be determined.
Crowther and Lancaster (2009:74) argue that primary data does not exist until it
is generated from the research process as part of the study. In contrast,
Trafford and Leshem (2008:73–74) distinguish between three sources of data,
namely primary, secondary and supporting sources. Trafford and Leshem
(2008:73–74) cite primary sources as being those pieces of original work which
have added significantly to knowledge so that they have brought about a
paradigm shift in understanding.
The available data pertaining to informal settlements and the BSC should be
discussed before a decision can be made on a suitable methodology. The
national framework for the delivery of subsidised housing includes a huge
volume of very lengthy documents published by the National Department of
Housing/Human Settlements. The documents mentioned and minutes of
discussions of and presentations to the Parliamentary Portfolio Committee on
Housing/Human Settlements and reports published by various government
commissions have naturally been subjected to scrutiny and discussion before
publication, and have proved to be reliable secondary sources of information.
Outside government, a great deal is being published on subsidised housing and
informal settlements in South Africa, the majority being short newspaper items.
There are a few peer-reviewed articles, but they tend to be written from a town
planning, social or legal perspective. One thesis was found that examines the
relationship between housing policy and practice in an informal settlement from
the perspective of sociology and social anthropology (Burgoyne 2008).
18
The Balanced Scorecard is actively researched in the private sector and is the
subject of numerous publications in the form of theses, books and international
journals, most of which are peer reviewed. Using the BSC as a keyword in
searching, four articles were found in local accredited journals. In comparison
with the volume published in the private sector, there are very few in-depth
accredited articles that have been published about the BSC for non-profit
organisations (Greiling 2010:535–536) and even fewer for public sector BSCs
(Greatbanks & Tapp 2007:846; Farnetti & Guthrie 2008:4). Very often articles
focus on success stories, and then add a few pointers on a “how-to-do-level”
(Greiling 2010:535–536). This considerably limits the public sector BSC
concepts and arguments that can be applied to studies. No evidence has been
found of the use of the BSC in subsidised housing development, in the
upgrading of informal settlements or in the broader South African public sector.
According to the classification by Trafford and Leshem (2008:73–74) discussed
above, the BSC publications by Kaplan and Norton (1992, 1993, 1996a, 1996b,
1996c, 1996d, 2001a, 2001b, 2001c, 2004, 2006) would qualify as primary
sources of data, because they developed the BSC.
Because of the complexity of the informal settlements scenario and delivery
under the Upgrading of Informal Settlements Programme, with the proposed
integration of the BSC, the study calls for a detailed literature study in which it is
proposed to do the following:
Examine South African national housing documentation and publications
post-1994 to extract information relevant to producing an overview of the
national framework for the delivery of subsidised housing and indicate where
the Upgrading of Informal Settlements Programme fits into this framework.
Scrutinise informal settlements documentation and publications post-1994 to
investigate the concept, background and development of informal
settlements as well as the provisions of the Upgrading of Informal
Settlements Programme.

19
Examine South African informal settlement documentation and publications
post-1994 to identify the departmental factors hampering delivery under the
Upgrading of Informal Settlements Programme.
Review the body of scholarship, consisting of primary and secondary data,
relating to the BSC as a performance measurement tool in the public sector
and discover the source of the performance indicators for the Upgrading of
Informal Settlements Programme.
Consideration was given to confirming the departmental factors hampering
delivery under the Upgrading of Informal Settlements Programme through an
empirical study. The decision was taken not to do the empirical study because:
it is not a core part of the study and the information would be of limited value
because the various provinces and municipalities are at different stages of the
process of devolving powers to municipal level. It is argued that this process of
devolving powers effectively means that staff in similar positions in different
provincial or municipal human settlement/housing departments would have had
different exposure to and involvement in housing delivery and that this would
influence their opinions, making the information obtained of limited value.
On the basis of the information gathered from the detailed literature review it is
proposed to do the following:
Organise the departmental factors hampering delivery under the Upgrading
of Informal Settlements Programme and combine them under headings
selected as the most appropriate in view of the complexity of the subject.
Carry out a preliminary appraisal of the suitability of Monitoring and
Evaluation versus the BSC to address the collective departmental factors
hampering delivery under the Upgrading of Informal Settlements
Programme.

20
Measure the compatibility of the BSC with the principles for housing policy
development and core values of the National Department of Human
Settlements as a precursor to the detailed assessment referred to under the
next bullet.
Carry out a detailed assessment of suitability of the public sector BSC to
address each factor hampering delivery under the Upgrading of Informal
Settlements Programme.
Once the suitability of the BSC has been assessed, a conceptual framework
study, in line with Mouton (2003:175–176), will be conducted to develop a
conceptual framework which could guide the application of the BSC to the
Upgrading of Informal Settlements Programme.
1.7 OUTLINE STRUCTURE
Chapter 1: Introduction
In line with the approach of Biggam (2011:15–17, 52–67), the discussion in
chapter 1 commenced with the background and focus to the research. This was
followed by the overall research aim and individual research objectives. The
need for the research was explained after the delimitations. Lastly, the research
methodology was discussed, and the chapter was concluded with this outline of
the structure.
Chapter 2: The national framework for the delivery of subsidised housing
Chapter 2 will concentrate on how delivery should proceed according to the
“national framework for the delivery of subsidised housing”, with specific
reference to the Upgrading of Informal Settlements Programme, which is one of
sixteen national housing programmes.
21
Chapter 3: The upgrading of informal settlements
Chapter 3 will initially focus on the concept of informal settlements. This is
followed by a discussion of the background to and development of informal
settlements in post-1994 South Africa, including developments in legislation,
documents and government commitments. The next topic dealt with is the
provisions of the Upgrading of Informal Settlements Programme, including
performance measurement indicators. This is followed by a description of
interrelated national housing programmes. Lastly, the emphasis falls on the
departmental factors hampering delivery under the Upgrading of Informal
Settlements Programme.
Chapter 4: The Balanced Scorecard as a performance measurement tool
for the Upgrading of Informal Settlements Programme
Chapter 4 will commence with an account of the changes in performance
measurement systems necessitated by the change from the industrial age to
the information age. Reasons why the BSC is being used extensively follows a
description of the background and development of the BSC. The BSC concept,
framework, adaptation for public sector use and the translation process are
included. Before concluding this chapter, the research will focus on Monitoring
and Evaluation, used to draw up the performance indicators for the Upgrading
of Informal Settlements Programme. In conclusion, a preliminary appraisal of
Monitoring and Evaluation versus the BSC as a means to collectively address
the departmental factors hampering delivery under the Upgrading of Informal
Settlements Programme is carried out.
Chapter 5: The BSC framework for the Upgrading of Informal Settlements
Programme
Chapter 5 commences with the measurement of the compatibility of the BSC
with the housing principles and core values of the National Department of
Human Settlements. After this, the suitability of the BSC for addressing each of
the factors hampering delivery under the Upgrading of Informal Settlements
22
Programme is discussed. Lastly, the focus moves to a conceptual framework
which could guide any future possible BSC application to the Upgrading of
Informal Settlements Programme.
Chapter 6: Conclusions and recommendation
Chapter 6 concentrates on the conclusions, which are structured by using every
individual objective of the research and focusing on whether the objective has
been met. This is followed by a recommendation and suggestions for further
research.
23
CHAPTER 2
THE NATIONAL FRAMEWORK FOR THE DELIVERY OF SUBSIDISED
HOUSING
2.1 INTRODUCTION
The focus of this study is the Upgrading of Informal Settlements Programme,
one of sixteen national housing programmes which are subsidised at present.
Before the Upgrading of Informal Settlements Programme can be discussed, it
is necessary to study the overall picture of subsidised housing. Although
housing is now referred to as human settlements, the terms will be used
interchangeably because housing is a widely recognised concept and is the
most frequently documented.
In producing the overall picture of the delivery of subsidised housing, this
chapter commences with the origin of subsidised housing in post-1994 South
Africa. This is followed by definitions of housing terminology. The relationship
between the new Constitution and the provision of housing and the fundamental
principles of housing policy development are also discussed. The current
national housing legislation and directives are then discussed in sequence, from
those first legislated to the latest additions.
The starting point of delivery is to know the fundamental purpose, the desired
end result and the approach to arriving at the end result. The national housing
vision, mission, core values and strategies are therefore explored. A
diagrammatic overview of the sixteen national housing programmes that have
been developed in terms of the present policy is provided. The major facilitators
of housing and their functions are then determined.

24
2.2 ORIGIN OF SUBSIDISED HOUSING
In the run-up to the first democratic elections held in South Africa on 27 April
1994, the African National Congress (ANC) made various preelection promises
to the electorate. One of the preelection promises was “Housing and Services
for All”, which stated that, if elected, the new ANC-led government would focus,
among others, on the following with regard to housing:
the basic human right of a roof over one’s head and reasonable living
conditions
housing 7 million squatters, the homeless and the upgrading of townships
future planning that would recognise the need for
o residents to live close to their workplaces
o the provision of recreational and other basic facilities
ensuring an open local government that would work closely with community
structures to provide affordable houses and services
within five years, the new government could:
o build 1 million homes
o provide running water and flushing toilets to 2 million households
o electrify 2,5 million homes
(African National Congress 1994:4–5).
After coming into power, A New Housing Policy and Strategy for South Africa,
commonly known as the 1994 Housing White Paper, was the first national
housing policy framework published by the ANC-led government (National
Department of Housing 2008c:1). The following projected information for 1995,
contained in the 1994 Housing White Paper, gives some indication of the
challenges that were faced by the ANC-led government with regard to housing
at the time:
Population size 42,8 million, expected to grow to 47,4 million by 2000.
Approximately 2 million single people.

25
Approximately 200 000 new households would be formed annually between
1995 and 2000, 150 000 of these were expected to be squatter households.
Approximately 1,06 million households or 13,5% of households live in
squatter dwellings.
Approximately 58% of households have secure tenure of accommodation.
Urban housing backlog stands at approximately 1,5 million houses.
Number of households: 8,3 million, at an average of 4,97 people per
household, with a monthly household income distribution as shown in table
2.1 below:
Table 2.1 Projected monthly household income distribution for
1995
Income category per
month
Percentage of
households
Number of
households
R % Millions
0–800 39,7 3,30
801–1500 29,0 2,41
1501–2500 11,8 0,98
2501–3500 5,6 0,46
>3500 13,9 1,15
Total 100,0 8,30
Source: National Department of Housing 1994:6–10.
Table 2.1 shows that 86,1% (ranging from 100% to 13,9%) of households fell
into the low-income bracket, earning R3500 per month or less. These
households were unable to afford adequate housing and needed some form of
government assistance (National Department of Housing 1994:6–11).
In spite of the scale of the challenges reflected in the above statistics, the 1994
Housing White Paper reiterated the preelection housing delivery promises, as it
26
set a National Housing Goal of increasing housing expenditure to 5% of the
State budget and delivering one million houses in five years (National
Department of Housing 1994:21). Cohen (1997:143) was of the opinion,
however, that the promise of one million houses in five years was unrealistic,
while The Helen Suzman Foundation (1996:6) also considered it an
unbelievable target. There must have been some merit in their viewpoints, as
the 1994 housing budget was only 1% of the State budget (National Department
of Housing 1994:20). In his budget speech on 17 February 1999, Mr Trevor
Manuel, the Minister of Finance, quoted a figure of 629 449 new homes built
since 1994 (National Treasury 1999:28). While this was a substantial number, it
was by no means in line with initial promises and goals. Because of funding
constraints government has to focus the scarce housing funding on the poorest
of the poor (National Department of Housing 1994:15–16).
2.3 SUBSIDISED HOUSING TERMINOLOGY
Minister Tokyo Sexwale announced in May 2009 that the mandate of the
National Department of Housing had been broadened and the department
renamed the National Department of Human Settlements (National Department
of Human Settlements 2009c:1). It was stated in the Report of the Portfolio
Committee on Human Settlements (Parliamentary Monitoring Group 2010b:1)
that the broadening of the mandate pertains to sanitation, which was transferred
from the Department of Water Affairs to the Department of Human Settlements.
According to a Draft Analysis by the Research Unit of Parliament (Parliament
2010:1), the name change and the inclusion of sanitation, defined as the
provision of sewerage and water supply infrastructure, is a critical component of
the provision of sustainable human settlements.
Sustainable human settlements are defined as “well-managed entities in which
economic growth and social development are in balance with the carrying
27
capacity of the natural systems on which they depend for their existence and
result in sustainable development, wealth creation, poverty alleviation and
equity” (National Department of Housing 2004:11–12). The plan outlined in
Breaking New Ground (National Department of Housing 2004) indicates that
subsidised housing aims to alleviate asset poverty, but sustainable human
settlements go beyond asset value as their goal is to create communities with
access to job opportunities and infrastructure (National Department of Housing
2004:11). According to Minister Sexwale, the term “sustainable human
settlements” originated from UN Habitat programmes, and was adopted at the
United Nations’ global Habitat Summit held in Vancouver, Canada, in 1976
(National Department of Human Settlements 2009d:1).
The difference between providing housing and creating sustainable settlements
becomes clearer when expressed in practical terms. Lombard (2004:2)
observes that in the first decade after democracy the urban development
strategy appeared to be preoccupied with targets – the number of houses built,
jobs created, households with sanitation, water etc. Lombard (2004:2) is of the
opinion that, at least in theory, a shift took place after the first decade towards a
more holistic quantitative and qualitative drive to build communities, rather than
simply building houses. The Department of Human Settlements is examining
the implications of the broader definition of “human settlements” versus
“housing” for their mandate, policies, procedures, programmes and capacity
(National Department of Human Settlements 2009d:2).
In order to elucidate the housing documentation and the provisions of the
Housing Act 107 of 1997 which are discussed in this study, the following section
1 definitions of this Act are provided:
- “housing development” means the creation and maintenance of
“habitable, stable and sustainable public and private residential
environments” in areas within reach of economic, health, educational and
28
social opportunities and facilities. On an increasing scale, citizens and
permanent residents will have access to secure tenure in permanent
residential structures with potable water, sanitary facilities and a supply
of energy.
- “MEC” means the member of the Executive Council of the province who
is responsible for housing
- “national housing policy” includes national norms and standards for
housing
- “national housing programme” means any national policy framework
facilitating housing development, or the upgrading of existing housing
stock, or the provision of municipal services and infrastructure, to aid
people who cannot meet their own housing needs
(Housing Act 107 of 1997).
2.4 THE NEW CONSTITUTION AND SUBSIDISED HOUSING
The new Constitution of the Republic of South Africa was passed in 1996. While
the Constitution covers a broad spectrum of issues, most of which are not
related to housing at all, it has been included in this study because it is the
supreme law of the land, and any legislation or action that does not comply with
the Constitution is invalid. Under the Housing Code all housing legislation and
practices must comply with the Constitution and it is essential that all obligations
imposed by the Constitution are fulfilled (National Department of Housing
2000c:4–5).
The Constitution defines the cornerstone values, such as equality, human
dignity and freedom of movement and residence. Chapter 2 of the Constitution,
the Bill of Rights, includes section 26, which relates specifically to housing
(National Department of Housing 2000c:5).
29
As discussed in paragraph 1.1, section 26(1) of the Constitution embeds the
right of access to adequate housing for every person and section 26(2) of the
Constitution lays the responsibility on the state to realise this right, subject to
available resources. Section 26(3) of the Constitution stipulates that a court
order is required before a home may be demolished or anyone may be evicted
from his/her home (Constitution of the Republic of South Africa, 1996).
Before the present national housing legislation and directives are dealt with, the
principles which housing policies should comply with are discussed.
2.5 FUNDAMENTAL PRINCIPLES FOR HOUSING POLICY
DEVELOPMENT AND IMPLEMENTATION
The 1994 Housing White Paper, A new housing policy and strategy for South
Africa – 1994 (National Department of Housing 1994:21–27), identifies fourteen
points in total under “Basic Points of Departure” and “Underlying Policy
Approaches and Considerations”, which appear to be the principles for housing
development applied at the time. In addition to this, the general principles
applicable to housing development which national, provincial and local
government must comply with are legislated in section 2 of the Housing Act.
These principles have been condensed and revised into six fundamental
principles for housing policy development and implementation in the 2009
National Housing Code (National Department of Human Settlements 2009b:12–
14), which are briefly explained below.
2.5.1 People-centred development and partnerships
Government alone cannot meet the country’s housing needs, but acts as a
facilitator by creating institutional frameworks and support structures – and
providing subsidies. The environment created enables a housing process to

30
function where all parties acknowledge the role of government. The resultant
housing process is one which is people-centred, in which partnerships thrive,
and in which adequate housing can be delivered via the following essential
activities:
broad-based support and involvement of all key players to mobilise
resources
all role players share in the risks of housing development and in the
rewards of improved housing options and a more vibrant housing market
a housing process decentralised to local government level and
participation by all role players
(National Department of Human Settlements 2009b:12–13).
2.5.2 Development of skills (skills transfer) and economic empowerment
Housing policies and strategies must support community participation, leading
to the development of skills (skills transfer) and economic empowerment. This
will require consumer education and the development of private institutions
which commit to providing training and support (National Department of Human
Settlements 2009b:13).
2.5.3 Fairness and equity
Housing policies must allow for equal and equitable access to housing and
goods and services in urban and rural contexts. At the same time, housing
policies should accommodate the disabled, single-parent families, hostel
dwellers, the youth and all persons with special needs (National Department of
Human Settlements 2009b:13).
31
2.5.4 Choice
Policies should allow for individual choice and should encourage collective
efforts by people to improve their housing situation (National Department of
Human Settlements 2009b:13–14).
2.5.5 Transparency, accountability and monitoring
Transparency guards against inequitable systems where certain people or
groups benefit more than others. In addition, systems which monitor progress
and ensure accountability are of equal importance. In view of this, a single
national policy and an administration which is accountable for delivering on
broad-based targets in a measurable manner are essential. A quantifiable
division of these functions and targets between national, provincial and local
government is required to enable obligations to be met and conflict over
demands on scarce resources to be minimised (National Department of Human
Settlements 2009b:14).
2.5.6 Sustainability and fiscal affordability
A policy which attracts outside investment in housing – including private sector
and NGO investment – and one which promotes a vibrant and competitive
housing market is crucial to sustainability. The housing process must be
sustainable in the long term – economically, fiscally, socially, financially and
politically. This requires a balance between fiscal allocations, the number of
units required, the standard of housing, end-user affordability and the
environmental impact (National Department of Human Settlements 2009b:14).
32
Following the identification of the fundamental housing policy principles above,
the present national housing legislation and directives are discussed in the next
paragraph.
2.6 PRESENT NATIONAL HOUSING LEGISLATION AND DIRECTIVES
A former Minister of Housing, Sankie Mtembi-Mahanyele, argues that no single
formula exists to meet the housing challenge, but that policy should continually
evolve to effect the positive changes required (National Department of Housing
2000a:1). The evolution of policy referred to above is confirmed by the
voluminous policies, legislation, frameworks, plans and agreements which
relate to the formulation and development of subsidised housing after 1994. For
the purposes of this study, only the present national legislation and directives
will be discussed in this chapter. The national developments which are deemed
relevant to informal settlements are discussed in chapter 3.
2.6.1 Housing Act 1997
The provisions of the 1994 Housing White Paper were extended and legislated
in the Housing Act 107 of 1997 (National Department of Housing 2008c:1). The
importance of the Housing Act is confirmed by a remark made by a former
Housing Minister, Sankie Mthembi-Mahanyele, to the effect that the Housing
Act is the “supreme housing law in the land” (National Department of Housing
2000a:1). Cohen (1997:138) notes that the Housing Act creates a framework for
housing development that will guide future sustainable housing development
and allow access to reasonable houses with an acceptable infrastructure.
The Housing Act 1997 aligns the National Housing Policy with the Constitution.
The Act also clarifies the functions of the three tiers of government, namely,
national, provincial and local government (National Department of Housing

33
2008c:1). Local government is interchangeably referred to as municipalities in
the documentation. The success of the Act will depend on the ability of
provincial and local governments to rise to the challenge of meeting an ever-
increasing demand for housing on limited budgets (Cohen 1997:139).
In 2001, an important amendment to the Housing Act inserted sections 10A and
10B, which deal with the voluntary and involuntary sale of state-subsidised
houses. In terms of section 10A, no person who has received a housing subsidy
under a national housing programme for the construction or purchase of a
house/serviced site may sell or dispose of the house/site within eight years of
acquisition – unless the property has first been offered to the provincial housing
department (Housing Act 107 of 1997: s 10A(1)). Section 10A(2) and 10A(4)
state that where the property is offered to the provincial housing department,
the records will indicate that the person wishes to vacate the property and
relocate. No compensation will be paid to the person vacating the property, but
the person is entitled to be entered on the waiting list of beneficiaries for
another subsidised housing property – provided that he/she still qualifies for
subsidised housing (Housing Act 107 of 1997: s 10A(2) & (4)). Section 10B of
the Housing Act prohibits a successor or creditor of a beneficiary from disposing
of a subsidised property, unless the property has been offered to the provincial
housing department at an amount less than the subsidy value – and has been
rejected (Housing Act 107 of 1997: s 10B).
According to a former Housing Minister, Ms Sankie Mthembi-Mahanyele, the
insertion of section 10A and 10B was intended to prevent beneficiaries from
losing their state-subsidised houses because they were being sold voluntarily,
at a fraction of their cost, to buyers who were not poor people. As a result of this
practice, the number of houses available to the poor in the state pool decreased
despite the fact that government had invested billions of Rands in low-cost
housing (South African Government Information 2001:3–4). Wessels (2010:1)
34
reports that an Urban Landmark survey found that 11% of all subsidised houses
had been “unofficially traded” over the past five years, contrary to the lock-in
period of eight years. In over half of the houses “traded”, the “trading value”
ranged from a mere R5750 to R17 000 per house. When this “value” is
compared with the present cost of building a house on a serviced stand of
approximately R88 000 (chapter 3), it becomes clear that solutions urgently
need to be brainstormed. In addition, involuntary sales of houses have taken
place, where houses have been sold by municipalities or other creditors to
cover debts owed by the poor (South African Government Information 2001:3–
4). Ngalwa (2008:3) argues that in both cases the effect has been that the poor
have moved back to shacks, thereby contributing to the unregulated
mushrooming of informal settlements and counteracting the progress made with
housing delivery as a result of the continuously “shifting target” (Parliamentary
Monitoring Group 2009c:3), a term explained in paragraph 3.2.
Ndaba (2008:2) reports that former Housing Minister Sisulu informed Parliament
that occupancy audits were being implemented to confirm that the rightful
beneficiaries were still living in the houses. According to Sisulu (Ngalwa
2008:1), recipients of houses who had sold them or let them would be criminally
charged – and forced to reverse the sale or lease of the house, while occupiers
who were not entitled to live in these houses would be evicted. Reports on
occupancy audits completed in seven of the provinces reveal that the rightful
beneficiaries were occupying the houses in about 70% of the cases checked
(Parliamentary Monitoring Group 2009h:4).
2.6.2 Prevention of Illegal Eviction and Unlawful Occupation of Land Act 1998
According to the Annual report for the financial year ended 31 March 2009
(National Department of Housing 2009b:11), the Prevention of Illegal Eviction
and Unlawful Occupation of Land Act 19 of 1998 makes provision for a process
35
which has to be followed to evict persons who have unlawfully invaded land.
This Act relates largely to residents in informal settlements and is discussed in
chapter 3.
2.6.3 Housing Consumers Protection Measures Act 1998
According to South African Government Information (2008:5), the Housing
Consumers Protection Measures Act 95 of 1998 creates a regulatory framework
to ensure that all housing, including that of the poor, complies with minimum
technical norms and standards. Before this Act was passed, properties of the
poor did not qualify for protection against shoddy workmanship.
In chapter 1 of this study, various references were quoted regarding
dissatisfaction with state-subsidised houses, many of which had structural and
other quality defects. Cohen (1997:139–140) argues that it is essential that
builders be held accountable for the quality of their work, that technical
standards be laid down and that consumers be protected from unscrupulous or
inexperienced builders. A more detailed discussion of this Act will be conducted
in paragraph 2.10.2.6, where the NHBRC is dealt with as a facilitator of
subsidised housing.
2.6.4 Rental Housing Act 1999
Following on the Housing Consumers Protection Measures Act, the next
important piece of housing legislation dealt with rental housing. Cohen
(1997:142) quotes Billy Cobbett, the former Director-General of Housing, as
saying in the August 1998 edition of Housing in Southern Africa, “There is a real
demand for tenure from people who want access to the city for a period, but not
forever. Rent then becomes a very obvious form of tenure that can be used.”
36
The Rental Housing Act 50 of 1999 has been effective since August 2001
(South African Government Information 2008:4). The Act identifies rental
housing as a key component in the housing sector and defines the responsibility
of government to promote rental housing. The Act provides for the rights of
tenants and landlords and section 7 makes provision for the establishment of
provincial Rental Housing Tribunals to assist in disputes between parties and to
ensure that minimal costs are borne by the parties (Rental Housing Act 50 of
1999).
2.6.5 Housing Code 2000
Section 4 of the Housing Act 107 of 1997 requires the Minister to publish a
National Housing Code, which must contain national housing policy and may
include administrative or procedural guidelines in respect of the implementation
or other matters relevant to housing. The first version of the Housing Code was
published in March 2000 (National Department of Housing 2000b:1).
The intention with the publication of the Housing Code is to have a single
document setting out the overall vision of housing in South Africa and how this
vision should be implemented (National Department of Housing 2000a:1). In
terms of section 4(3) of the Housing Act, the Minister must provide a copy of the
National Housing Code to every provincial government and municipality and
section 4(6) stipulates that the Code is binding (Housing Act 107 of 1997: s 4). It
should be noted that the Housing Code is an overview of, but does not replace,
the existing legislation and policy (National Department of Housing 2000b:1).
Details will not be discussed, as that would be a duplication of acts and policies
already discussed. The publication of the 2009 Housing Code (National
Department of Housing 2009a:10) has not replaced the 2000 Housing Code
because it remains valid for rules of programmes which are not covered in the
2009 Housing Code.

37
2.6.6 Home Loan and Mortgage Disclosure Act 2000
The Home Loan and Mortgage Disclosure Act 63 of 2000 provides for the
establishment of the Office of Disclosure and the monitoring of financial
institutions by requiring them to disclose certain information that will identify
discriminatory lending patterns (South African Government Information 2008:4).
2.6.7 Breaking New Ground: a comprehensive plan for the development
of sustainable human settlements (BNG plan), 2004
At the time of launching the BNG plan, which was discussed in chapter 1, it was
believed that a “new plan was required to redirect and enhance existing
mechanisms towards a more responsive and effective delivery” (National
Department of Housing 2004:7). According to the 2009 Housing Code (National
Department of Human Settlements 2009b:7), the BNG plan is a “broad policy
framework for the medium to longer term, paving the way for significant policy
and strategy shifts”. This statement confirms the importance of the BNG plan.
The detailed strategies contained in the BNG plan, which are illustrated in
figures 2.1 to 2.10 of this study, have guided the National Department of Human
Settlements from 2004 to date.
The BNG plan has set the following objectives:
Accelerating the delivery of housing as a key strategy for poverty alleviation.
Utilising provision of housing as a major job creation strategy.
Ensuring property can be accessed by all as an asset for wealth creation
and empowerment.
Leveraging growth in the economy.
Combating crime, promoting social cohesion and improving quality of life for
the poor.

38
Supporting the functioning of the entire single residential property
market to reduce duality within the sector by breaking the barriers between
the first economy residential property boom and the second economy
slump.
Utilising housing as an instrument for the development of sustainable
human settlements, in support of spatial restructuring.
(National Department of Housing: Breaking New Ground 2004:7)
The National Department of Human Settlements (2010c:1) indicates that the
BNG plan builds on the 1994 Housing White Paper, whereas Chenwi (2007:22)
argues that the BNG plan was introduced in accordance with the Grootboom
case (Government of the Republic of South Africa and Others v Grootboom and
Others 2001 (1) SA 46 (CC)). The decision in this case was that housing is not
just “bricks and mortar”, but incorporates factors such as access to land,
appropriate services, financing, etc – all of which are dependent on social and
economic realities.
Although the BNG plan appeared to be very ambitious when it was launched, it
does appear to be helping to meet the first objective of accelerating housing
delivery. Contradictory subsidised housing delivery figures from 1994 to 2009
have, however, been quoted. A case in point is a media release in March 2009,
where the Director-General stated in March 2009 that 2,7 million houses had
been delivered since 1994 (National Department of Housing 2009a:1), whereas
former Minister Sisulu quoted a figure of 2,8 million at the same time (National
Department of Housing 2009h:1). In June 2009, however, Human Settlements
Minister Sexwale gave a figure of 2,3 million subsidised houses delivered by
government since 1994 (National Department of Human Settlements 2009d:2).
The website of the National Department of Human Settlements sheds no light
on the matter as the figures quoted are for houses “completed and in the
process of completion”, therefore providing data – mere facts or figures that

39
cannot be used for decision-making – but not information, because information
can be used to inform decisions (Niven 2003:41). Whatever the delivery figures,
the initial estimate that all of the 2,4 million informal settlements would be
eradicated within 10 years of the launching of the BNG plan, therefore by 2014,
as discussed in paragraph 1.1 of this study, has not materialised. Mabaya
(2009:1) quotes the Director-General of the National Department of Housing as
saying that, of the 2,7 million houses built since 1994, 1,2 million were built after
the launching of the BNG plan. These figures equate to the building of 1,5
million houses in the first 10 years of democracy and 1,2 million houses in the
4,5 years after the launching of the BNG plan. This claim is, however, not
supported by delivery figures provided in a presentation by Mr Johan Minnie,
Chief Director: Management Information Services of the National Department of
Human Settlements, and illustrated in table 2.2 below. While the delivery figures
of 2,8 million since 1994 are quite close to the 2,7 million quoted, the figure of
1,2 million houses delivered since the launching of the BNG plan in the middle
of the 2004/05 financial year is not supported by the figures provided in table
2.2. In fact, the sum of annual housing delivery figures for the financial years
2004/05 to 2008/09 is less than the 1,2 million claimed above from mid-2004 to
2008/09.
In agreement with delivery figures quoted for previous years, the 2009/10
delivery figures given on the website are for houses completed and in the
process of completion. A distinction has, however, been made between
completed serviced sites and houses, indicated as 64 362 and 161 854
respectively (National Department of Human Settlements 2011b:1). Total
delivery of 226 216 units for the year is claimed on the website. It should be
noted that this figure was arrived at by adding incomparable figures, that is: the
figure for completed serviced sites has been added to the figure for completed
houses. It is also notable that the housing delivery figure of 161 854 is much
lower than that of previous years, as indicated in table 2.2.
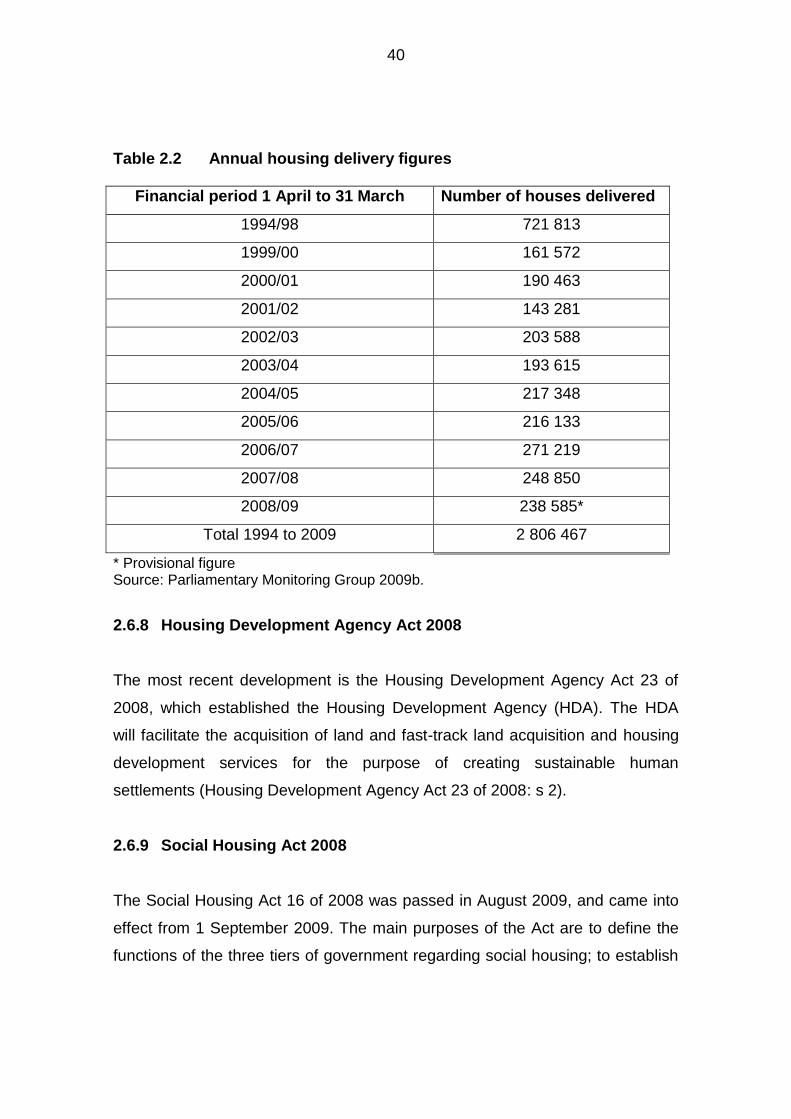
40
Table 2.2 Annual housing delivery figures
Financial period 1 April to 31 March Number of houses delivered
1994/98 721 813
1999/00 161 572
2000/01 190 463
2001/02 143 281
2002/03 203 588
2003/04 193 615
2004/05 217 348
2005/06 216 133
2006/07 271 219
2007/08 248 850
2008/09 238 585*
Total 1994 to 2009 2 806 467
* Provisional figure Source: Parliamentary Monitoring Group 2009b.
2.6.8 Housing Development Agency Act 2008
The most recent development is the Housing Development Agency Act 23 of
2008, which established the Housing Development Agency (HDA). The HDA
will facilitate the acquisition of land and fast-track land acquisition and housing
development services for the purpose of creating sustainable human
settlements (Housing Development Agency Act 23 of 2008: s 2).
2.6.9 Social Housing Act 2008
The Social Housing Act 16 of 2008 was passed in August 2009, and came into
effect from 1 September 2009. The main purposes of the Act are to define the
functions of the three tiers of government regarding social housing; to establish

41
the Social Housing Regulatory Authority (SHRA), which will regulate the use of
public funds by social housing institutions; to allow approved projects to be
undertaken with public money by other delivery agents and to give statutory
recognition to social housing institutions (Social Housing Act 16 of 2008).
2.6.10 National Housing Code 2009
The 2009 National Housing Code was published on the website of the National
Department of Human Settlements between the end of February and April
2010. Contrary to the requirements of section 4(4)(b) of the Housing Act, which
provides for a revised Housing Code to be published within three months of the
end of the year in which policy was amended (Housing Act 107 of 1997: s
4(4)(b)), this is the first Housing Code to have been published since the 2000
Housing Code, which was discussed in paragraph 2.6.5.
The 2009 National Housing Code is a lengthy document of almost 1400 pages
which is divided into three parts, with most parts being divided into various
volumes. In essence, this document comprises: Part 1: Simplified Guide; Part 2:
The Policy Context; and Part 3: Technical and General Guidelines. Part 3 also
includes a whole volume for each of the four national housing intervention
categories, namely Financial, Incremental, Rural and Social and Rental. Each
volume comprises various sections, each of which contains detailed discussions
of the requirements of each of the National Housing Programmes, as well as
the present subsidy guidelines.
According to the 2009 National Housing Code (National Department of Human
Settlements 2009a:10), this document aims to simplify the implementation of
housing projects by providing clear guidelines, and is less prescriptive than the
2000 Housing Code. The sections of the 2009 Housing Code which are relevant

42
to this study are referred to extensively throughout this and the following
chapter, and are therefore not discussed in detail here.
2.7 NATIONAL HOUSING VISION, MISSION AND CORE VALUES
The website of the National Department of Human Settlements (2010b:1) gives
the following information on the department:
Vision:
A nation housed in sustainable Human Settlements
Mission:
To facilitate an environment that provides sustainable Human Settlements
Core values, based on the Constitution:
1) Accountability
2) Fairness and Equity
3) Choice, Quality and Affordability
4) Sustainability
5) Innovation
6) Adherence to Batho Pele principles
It is noted that these core values are similar but not identical to the fundamental
principles discussed in paragraph 2.5 of this study.
2.8 NATIONAL HOUSING STRATEGIES
Since 2004 the strategies included in the BNG plan have guided, and continue
to guide, the national government interventions in progressively meeting the
objectives for the supply of subsidised housing. Because the strategies in the
BNG plan are very comprehensive and lengthy textual discussions spanning 20

43
pages, they have been illustrated diagrammatically in figures 2.1 to 2.10 below
to facilitate understanding. The decision to illustrate the strategies in diagrams
and the design of the diagrams in figures 2.1 to 2.10 are an own initiative. The
content of figures 2.1 to 2.10 reflects the researcher’s understanding of the
strategies and strategic themes taken from textual discussions in the sources
acknowledged below every diagram.
Relatively minor changes in emphasis or wording of the strategies have
occurred in the course of the progression from the BNG plan to the subsequent
2009 Housing Code (National Department of Human Settlements 2009b:19). As
the 2009 Housing Code was published in 2010, it is assumed that it contains
the latest strategies. The strategies in the BNG plan were therefore retained in
figures 2.1 to 2.10, but the changes in emphasis and/or wording contained in
the 2009 Housing Code have been added in italics to facilitate understanding.
The nine main strategies are listed in figure 2.1. Each strategy has been
referenced to a supporting diagram. For ease of reference, the supporting
diagrams have been done in the colour corresponding to that of the strategy in
figure 2.1. Strategies solely involving the upgrading of informal settlements, the
main focus of this study, have been highlighted in bright red and will be
discussed in chapter 3 of this study, whereas those that merely refer to the
upgrading of informal settlements have been highlighted in a light shade of red
and will be referred to in that chapter.
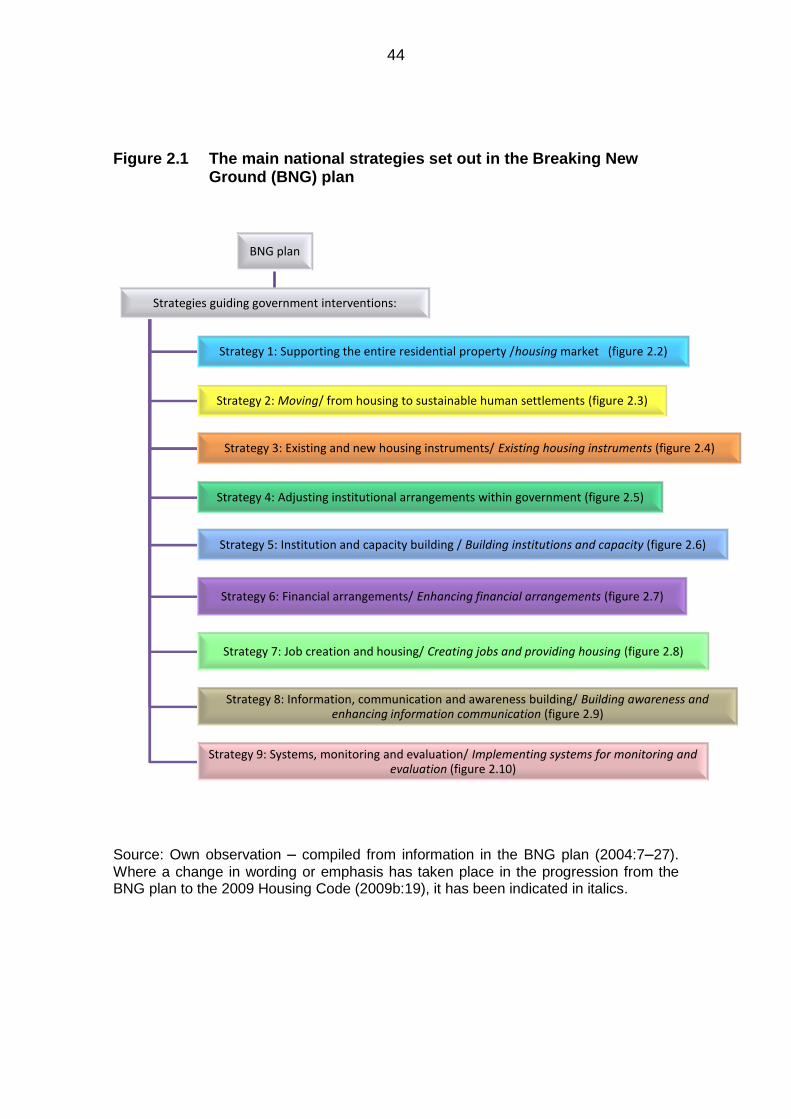
44
Figure 2.1 The main national strategies set out in the Breaking New Ground (BNG) plan
Source: Own observation – compiled from information in the BNG plan (2004:7–27).
Where a change in wording or emphasis has taken place in the progression from the BNG plan to the 2009 Housing Code (2009b:19), it has been indicated in italics.
BNG plan
Strategies guiding government interventions:
Strategy 1: Supporting the entire residential property /housing market (figure 2.2)
Strategy 2: Moving/ from housing to sustainable human settlements (figure 2.3)
Strategy 3: Existing and new housing instruments/ Existing housing instruments (figure 2.4)
Strategy 4: Adjusting institutional arrangements within government (figure 2.5)
Strategy 5: Institution and capacity building / Building institutions and capacity (figure 2.6)
Strategy 6: Financial arrangements/ Enhancing financial arrangements (figure 2.7)
Strategy 7: Job creation and housing/ Creating jobs and providing housing (figure 2.8)
Strategy 8: Information, communication and awareness building/ Building awareness and enhancing information communication (figure 2.9)
Strategy 9: Systems, monitoring and evaluation/ Implementing systems for monitoring and evaluation (figure 2.10)
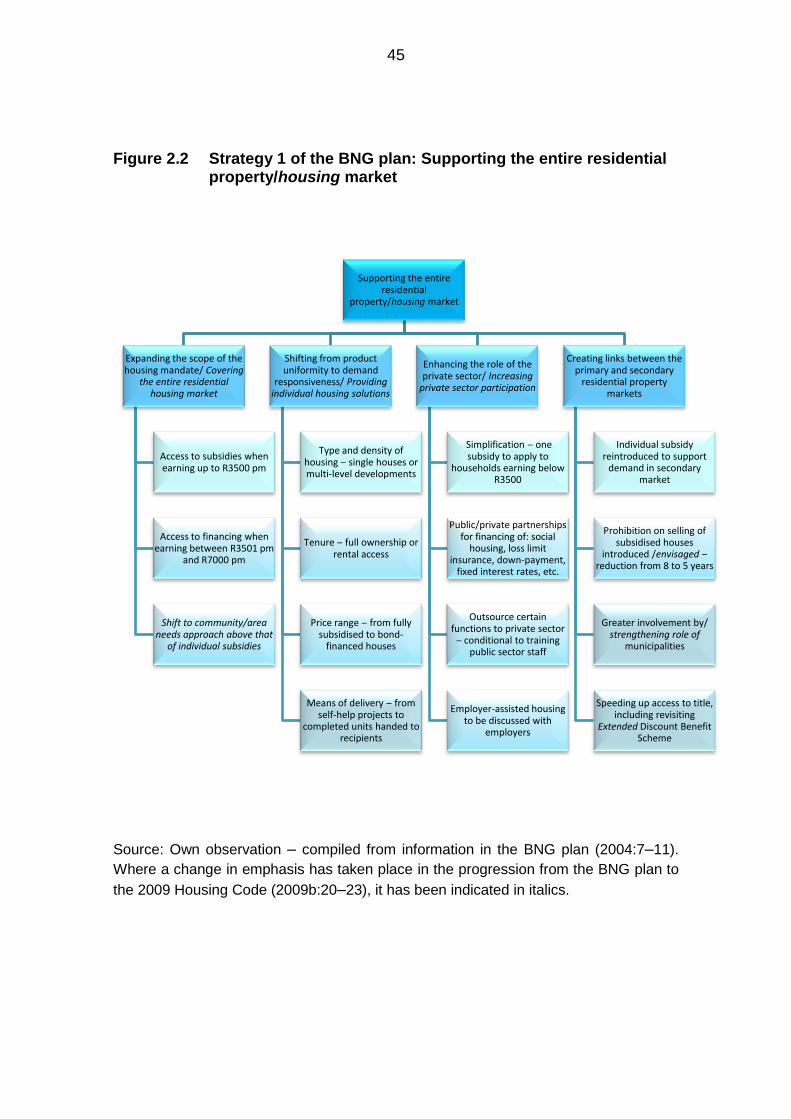
45
Figure 2.2 Strategy 1 of the BNG plan: Supporting the entire residential property/housing market
Source: Own observation – compiled from information in the BNG plan (2004:7–11).
Where a change in emphasis has taken place in the progression from the BNG plan to
the 2009 Housing Code (2009b:20–23), it has been indicated in italics.
Supporting the entire residential
property/housing market
Expanding the scope of the housing mandate/ Covering
the entire residential housing market
Access to subsidies when earning up to R3500 pm
Access to financing when earning between R3501 pm
and R7000 pm
Shift to community/area needs approach above that
of individual subsidies
Shifting from product uniformity to demand
responsiveness/ Providing individual housing solutions
Type and density of housing ‒ single houses or multi-level developments
Tenure ‒ full ownership or rental access
Price range ‒ from fully subsidised to bond-
financed houses
Means of delivery ‒ from self-help projects to
completed units handed to recipients
Enhancing the role of the private sector/ Increasing
private sector participation
Simplification ‒ one subsidy to apply to
households earning below R3500
Public/private partnerships for financing of: social
housing, loss limit insurance, down-payment,
fixed interest rates, etc.
Outsource certain functions to private sector ‒ conditional to training
public sector staff
Employer-assisted housing to be discussed with
employers
Creating links between the primary and secondary
residential property markets
Individual subsidy reintroduced to support
demand in secondary market
Prohibition on selling of subsidised houses
introduced /envisaged ‒ reduction from 8 to 5 years
Greater involvement by/ strengthening role of
municipalities
Speeding up access to title, including revisiting
Extended Discount Benefit Scheme
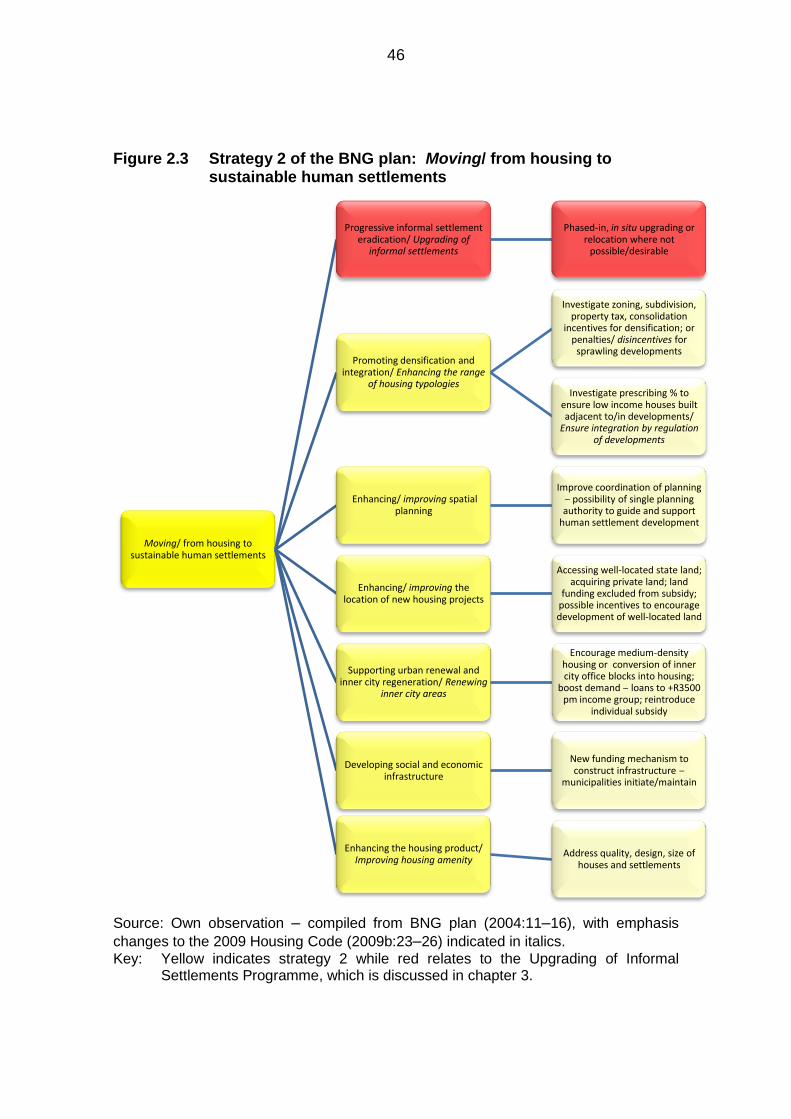
46
Figure 2.3 Strategy 2 of the BNG plan: Moving/ from housing to sustainable human settlements
Source: Own observation – compiled from BNG plan (2004:11–16), with emphasis
changes to the 2009 Housing Code (2009b:23–26) indicated in italics. Key: Yellow indicates strategy 2 while red relates to the Upgrading of Informal
Settlements Programme, which is discussed in chapter 3.
Moving/ from housing to sustainable human settlements
Progressive informal settlement eradication/ Upgrading of
informal settlements
Phased-in, in situ upgrading or relocation where not
possible/desirable
Promoting densification and integration/ Enhancing the range
of housing typologies
Investigate zoning, subdivision, property tax, consolidation
incentives for densification; or penalties/ disincentives for
sprawling developments
Investigate prescribing % to ensure low income houses built adjacent to/in developments/
Ensure integration by regulation of developments
Enhancing/ improving spatial planning
Improve coordination of planning ‒ possibility of single planning authority to guide and support
human settlement development
Enhancing/ improving the location of new housing projects
Accessing well-located state land; acquiring private land; land
funding excluded from subsidy; possible incentives to encourage development of well-located land
Supporting urban renewal and inner city regeneration/ Renewing
inner city areas
Encourage medium-density housing or conversion of inner city office blocks into housing;
boost demand ‒ loans to +R3500 pm income group; reintroduce
individual subsidy
Developing social and economic infrastructure
New funding mechanism to construct infrastructure ‒
municipalities initiate/maintain
Enhancing the housing product/ Improving housing amenity
Address quality, design, size of houses and settlements
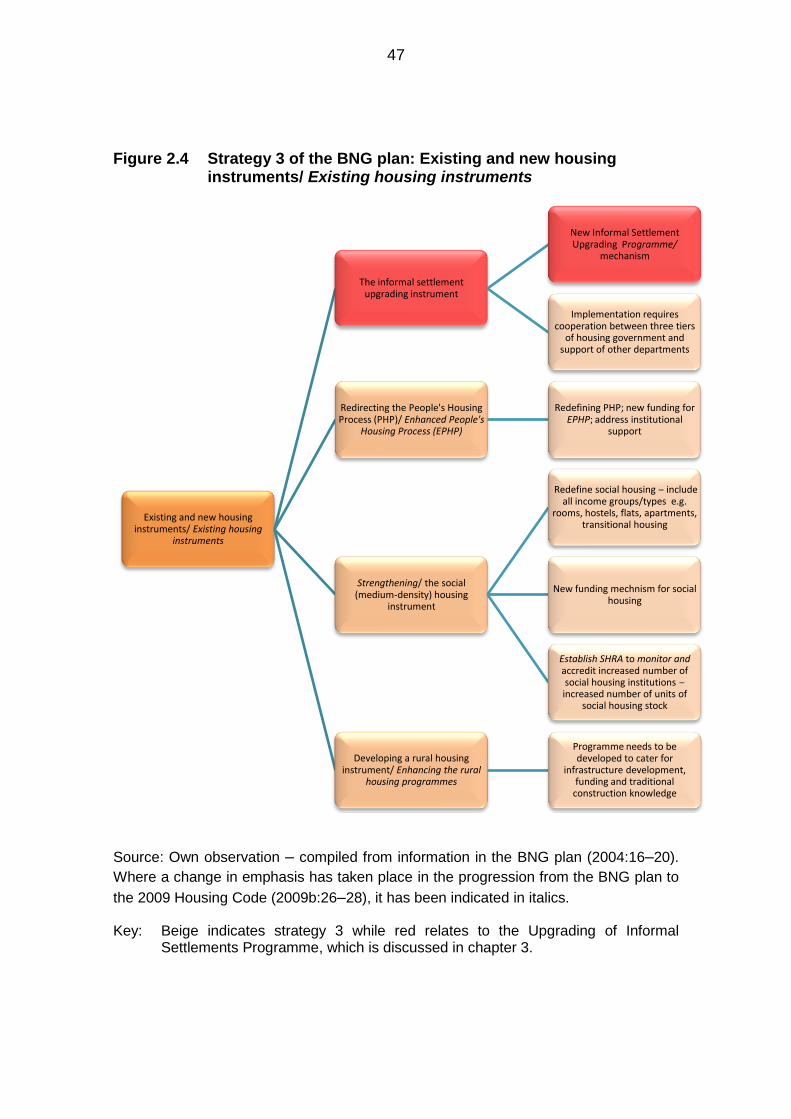
47
Figure 2.4 Strategy 3 of the BNG plan: Existing and new housing instruments/ Existing housing instruments
Source: Own observation – compiled from information in the BNG plan (2004:16–20).
Where a change in emphasis has taken place in the progression from the BNG plan to
the 2009 Housing Code (2009b:26–28), it has been indicated in italics.
Key: Beige indicates strategy 3 while red relates to the Upgrading of Informal Settlements Programme, which is discussed in chapter 3.
Existing and new housing instruments/ Existing housing
instruments
The informal settlement upgrading instrument
New Informal Settlement Upgrading Programme/
mechanism
Implementation requires cooperation between three tiers
of housing government and support of other departments
Redirecting the People's Housing Process (PHP)/ Enhanced People's
Housing Process (EPHP)
Redefining PHP; new funding for EPHP; address institutional
support
Strengthening/ the social (medium-density) housing
instrument
Redefine social housing ‒ include all income groups/types e.g.
rooms, hostels, flats, apartments, transitional housing
New funding mechnism for social housing
Establish SHRA to monitor and accredit increased number of social housing institutions ‒ increased number of units of
social housing stock
Developing a rural housing instrument/ Enhancing the rural
housing programmes
Programme needs to be developed to cater for
infrastructure development, funding and traditional
construction knowledge

48
Figure 2.5 Strategy 4 of the BNG plan: Adjusting institutional arrangements within government
Source: Own observation – compiled from information in the BNG plan (2004:20–22).
Where a change in emphasis has taken place in the progression from the BNG plan to
the 2009 Housing Code (2009b:28–29), it has been indicated in italics.
Key: Green indicates strategy 4 while light red relates to the Upgrading of Informal Settlements Programme, which is discussed in chapter 3.
Adjusting institutional arrangements within
government
Redefinition of roles, responsibilities and processes in
government ‒ omitted from 2009 document
Consensus on roles, responsibilities of three tiers of
government ‒ omitted from 2009 document
Expanding the role of local government/ Building capacity and
expanding the role of municipalities
Develop/ Advocate accreditation process which would allow
municipalities to plan, implement and maintain projects/
programmes
Establish housing units in accredited municipalities to build
capacity
Improve/ Advocate housing chapters of Integrated
Development Plans (IDPs) to cover a broad range of functions/ and to
ensure informal settlements are included in all IDPs
National and provincial institutional reforms/
Transforming national and provincial institutions
As municipalities are accredited, the delivery responsibility shifts to
them, allowing national and provincial government to focus on policy formation, monitoring and
facilitation
Review of national institutions ‒ improve efficiency and oversight
Promoting inter-and intra-governmental coordination and alignment/ Strengthening inter-
and intra-governmental coordination
Envisage integrated development and budget planning,
intergovernmental coordination and bilateral cooperation

49
Figure 2.6 Strategy 5 of the BNG plan: Institution and capacity building/ Building institutions and capacity
Source: Own observation – compiled from information in the BNG plan (2004:22–23).
Where a change in emphasis has taken place in the progression from the BNG plan to
the 2009 Housing Code (2009b:29–30), it has been indicated in italics.
Institution and capacity building/ Building institutions
and capacity
Municipalities Target metropolitan
municipalities for accreditation process
Social Housing Institutions
Establish the Social Housing Accreditation Institution/ Social Housing Regulatory
Authority (SHRA) to facilitate a new grant scheme
PHP Institutions Institutional support for PHP inadequate ‒ redefine and
enhance
Financial Institutions Build financial literacy of low
income earners through consumer education
Communities
Empower communities to contructively engage with
municipalities in fulfilling their housing needs

50
Figure 2.7 Strategy 6 of the BNG plan: Enhancing/ financial arrangements
Source: Own observation – compiled from information in the BNG plan (2004:20–22).
Where a change in emphasis has taken place in the progression from the BNG plan to
the 2009 Housing Code (2009b:30–31), it has been indicated in italics.
Key: Purple indicates strategy 6 while light red relates to the Upgrading of Informal
Settlements Programme, which is discussed in chapter 3.
Enhancing/ financial arrangements
Restructuring the subsidy instrument
Three subsidy bands collapse into one applying to
households earning up to R3500 pm
Extend subsidy to include households with an income of
R3501 to R7000 for credit- and savings-linked subsidies
Link future subsidies automatically to inflation to
prevent delay in delivery due to lack of profitability
Adjusting beneficiary contributions and criteria
Review beneficiary ownership contribution of R2479/ Persons earning up to R1500, aged, sick and
disabled ‒ no contribution
Ajust qualification criteria to be more flexible for social
housing, informal settlements and emergency circumstances
Enhancing funding flows/ Improving the flow of funding
Funds flow directly from the National Department to the
accredited municipalities
Operational costs of municipal housing units will be provided to accredited
municipalities by the National Department
Review the existing payment cycles to pay private
developers in line with progress
Provide improved access to bridging finance for emerging contractors through NURCHA
or financial institutions
Eradicating/ Addressing fraud, corruption and
maladministration
Form a Special Investigations unit to deal with fraud,
corruption/ and maladministration
Establish a toll-free whistle-blowing hotline
Draft risk and fraud management strategies/ and
adapt the legislative framework

51
Figure 2.8 Strategy 7 of the BNG plan: Job creation and housing/ Creating jobs and providing housing
Source: Own observation – compiled from information in the BNG plan (2004:25–26).
Where a change in emphasis has taken place in the progression from the BNG plan to
the 2009 Housing Code (2009b:32), it has been indicated in italics.
Job creation and housing/ Creating jobs and providing
housing
Job creation strategy
Installation of infrastructure, construction of houses, and
social/economic facilities
Management and maintenance of housing stock
Labour intensive guidelines
Identification, design and construction of projects
required to use Extended Public Works Programme
(EPWP) guidelines
Suitability assessments and targets
Assess work activities for labour-intensive construction
70% labour-intensity target set
On-site materials production/ Create employment
opportunities
Forms part of chain of labour-intensive construction
Capacity building for job creation
Develop required capacity in provincial and municipal government by planning,
implementing and managing labour intensive programmes
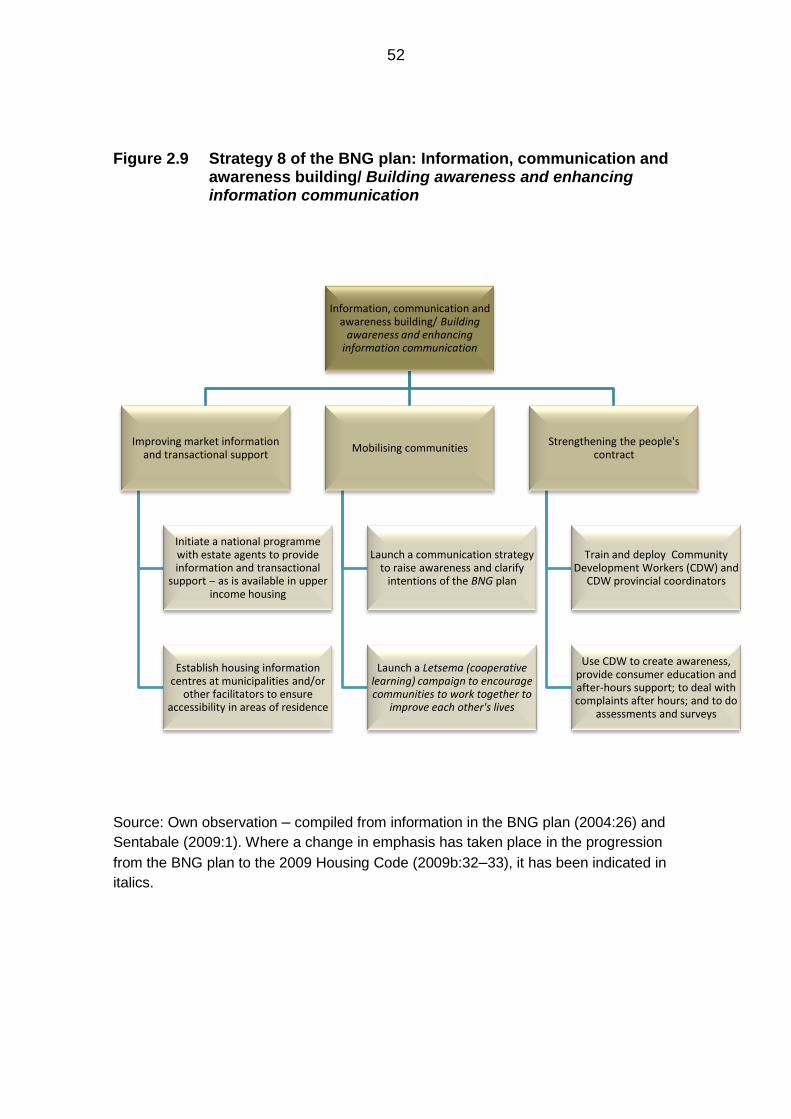
52
Figure 2.9 Strategy 8 of the BNG plan: Information, communication and awareness building/ Building awareness and enhancing information communication
Source: Own observation – compiled from information in the BNG plan (2004:26) and
Sentabale (2009:1). Where a change in emphasis has taken place in the progression
from the BNG plan to the 2009 Housing Code (2009b:32–33), it has been indicated in
italics.
Information, communication and awareness building/ Building
awareness and enhancing information communication
Improving market information and transactional support
Initiate a national programme with estate agents to provide information and transactional
support ‒ as is available in upper income housing
Establish housing information centres at municipalities and/or
other facilitators to ensure accessibility in areas of residence
Mobilising communities
Launch a communication strategy to raise awareness and clarify
intentions of the BNG plan
Launch a Letsema (cooperative learning) campaign to encourage communities to work together to
improve each other's lives
Strengthening the people's contract
Train and deploy Community Development Workers (CDW) and
CDW provincial coordinators
Use CDW to create awareness, provide consumer education and after-hours support; to deal with complaints after hours; and to do
assessments and surveys
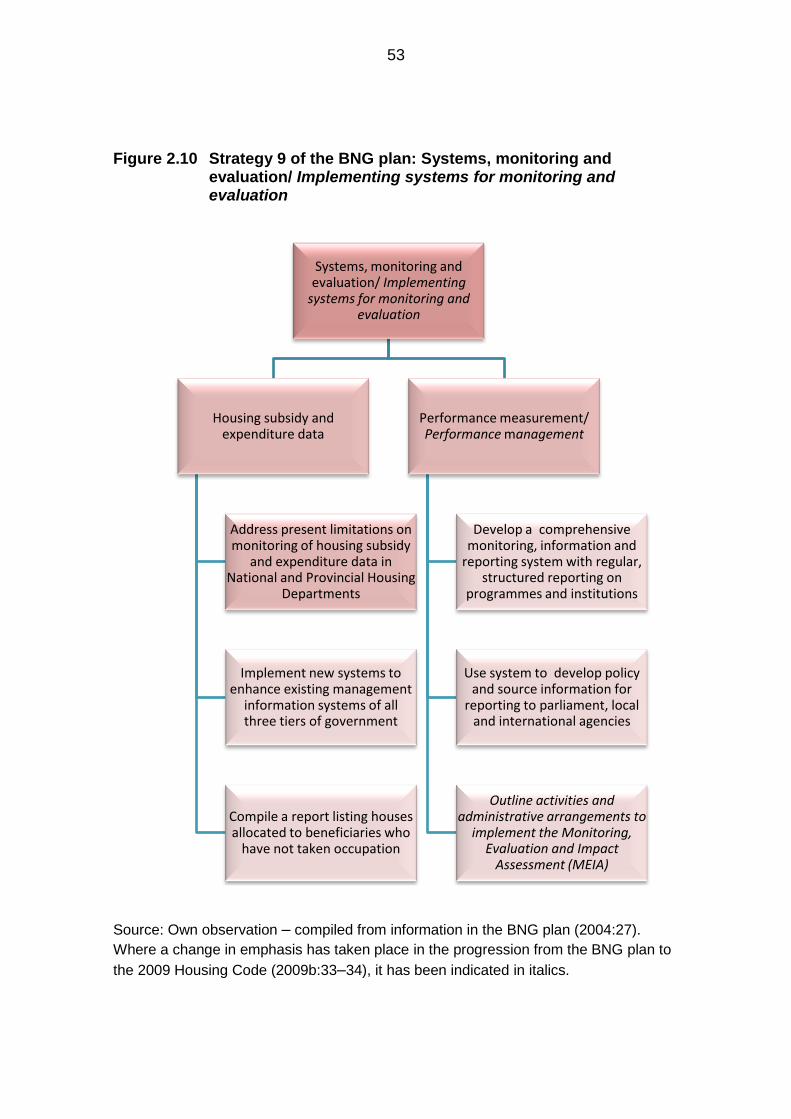
53
Figure 2.10 Strategy 9 of the BNG plan: Systems, monitoring and evaluation/ Implementing systems for monitoring and evaluation
Source: Own observation – compiled from information in the BNG plan (2004:27).
Where a change in emphasis has taken place in the progression from the BNG plan to
the 2009 Housing Code (2009b:33–34), it has been indicated in italics.
Systems, monitoring and evaluation/ Implementing
systems for monitoring and evaluation
Housing subsidy and expenditure data
Address present limitations on monitoring of housing subsidy
and expenditure data in National and Provincial Housing
Departments
Implement new systems to enhance existing management
information systems of all three tiers of government
Compile a report listing houses allocated to beneficiaries who
have not taken occupation
Performance measurement/ Performance management
Develop a comprehensive monitoring, information and
reporting system with regular, structured reporting on
programmes and institutions
Use system to develop policy and source information for
reporting to parliament, local and international agencies
Outline activities and administrative arrangements to
implement the Monitoring, Evaluation and Impact
Assessment (MEIA)

54
2.9 NATIONAL HOUSING PROGRAMMES
Figure 2.11 below provides an overview of the national housing programmes.
The design of figure 2.11 is an own initiative based on an own understanding of
the textual discussion of the intervention categories and the available
subsidised housing programmes. As indicated in figure 2.11 below, there are
sixteen national housing programmes, which fall into the following four
intervention categories:
Financial Intervention. As explained in Sustainable human settlement
planning, this category facilitates immediate access to housing goods
and services and provides implementation support (National Department
of Housing 2008a:95).
Incremental Intervention. Incremental housing programmes facilitate
access to housing opportunities through a phased process (National
Department of Housing 2008d:2).
Social and Rental Intervention. This category focuses on rental housing,
urban restructuring and integration (National Department of Housing
2008d:2).
Rural Intervention. It is difficult to define urban and rural areas with
precision, as areas range from the dense metropolitan areas to towns of
various sizes, right down to scattered houses in remote areas. The Rural
Subsidy Programme covers cases which have not been dealt with in the
first three intervention categories, namely where the Minister of Land
Affairs holds land in trust for certain communities, a system known as
communal tenure. Traditional leaders allocate land to households or
persons for settlement, but freehold tenure cannot be secured (National
Department of Housing 2008a:110). In terms of the Rural Intervention:
Rural Housing Subsidy: Communal Land Rights section of the 2009
Housing Code (2009h:7), land is held by community members subject to
the rules or customs of the specific community.

55
Figure 2.11 Diagrammatic representation of the national housing programmes
Source: Own observation – compiled from information in Sustainable human
settlement planning (2008a:95–110) and the 2009 Housing Code.
National housing programmes
Financial Intervention Category
Individual Subsidy
Enhanced Extended Discount
Benefit Scheme
Provision of Social and Economic
Facilities
Operational Capital Budget
Housing Chapters of IDP
Rectification of Pre-1994 Stock
Incremental Intervention Category
Integrated Residential
Development
Enhanced Peoples' Housing Process
Upgrading of Informal
Settlements
Consolidation Subsidy
Emergency Housing
Social and rental Intervention Category
Institutional Subsidies
Social Housing
Community Residential Units
Rural Intervention Category
Communal Land Rights
Farm Resident Subsidy

56
As will be noted from figure 2.11, the Upgrading of Informal Settlements
Programme is one of five housing programmes in the Incremental Intervention
category and has been highlighted in red to distinguish it from the other
incremental housing programmes. The specifics of this programme are
discussed in chapter 3.
2.10 FACILITATORS AND FUNDING
2.10.1 Three tiers of government
A substantial part of the Housing Act is dedicated to the functions of and the
interrelationship between the three tiers of government as facilitators of
subsidised housing (National Department of Housing 2000c:7). The principle
behind the allocation of roles is that government functions should be performed
at the lowest possible level, closest to the people. To ensure sustainable
national housing development, the devolution of functions and powers will be
carried out subject to national processes and policies being in place (National
Department of Housing 2000c:7). One of the processes that must be in place
before the devolution of housing functions can take place is that the municipality
must apply for and be granted accreditation, which is provided for under section
10(1) to (3) of the Housing Act 107 of 1997.
The envisioned functions of and interrelationship between the three tiers of
government, namely national, provincial and local government, once the
processes and policies referred to above are in place, are illustrated in figure
2.12. The decision to illustrate the functions of the three tiers of government in a
diagram and the design of figure 2.12 are an own initiative. The content of the
diagram is an own observation and understanding and is based on textual
information contained in the Housing Act.

57
Figure 2.12 Department of Human Settlements (Housing): main functions of the three tiers of government
Source: Own observation – compiled from sections 3(2), 7(2) and 9(1) of the Housing
Act 107 of 1997.
Local (3rd tier)
Ensure that residents progressively have access
to sufficient housing
Set municipal housing delivery goals
Single out land for development ‒ plan,
provide bulk services, use and manage
Commence planning, coordination, promotion and enabling of housing
developments
Establish an environment conducive to housing development, resolve
conflict
Provincial (2nd tier)
Determine provincial policy
Adopt legislation to ensure effective
delivery
Support and strengthen capacity of
municipalities
Coordinate housing development in
province
Intervene when municipality cannot or does not perform
duties
Draft multi-year plan in respect of every
housing programme
National (1st tier)
Determine national housing policy
Set national housing delivery goals
Monitor performance of three tiers against
delivery and budgetary goals
Determine housing development
procurement policy
Assist 2nd & 3rd tier in establishing
housing development administrative
capacity
Promote communication
between three tiers, suppliers, society &
housing development stakeholders

58
In figure 2.12, it appears that the National Department of Human Settlements is
responsible for the determination of the procurement policy. Magoro and
Brynard (2010:7–8) state, however, that different provincial housing
departments have different policies for awarding contracts, an observation
which appears to deviate from the provisions of the Housing Act.
In order to be accredited, municipalities have to “demonstrate their capacity to
plan, implement and maintain both projects and program[me]s in terms of the
Municipal Finance Management Act (MFMA)” (USAID 2006:6). There are four
different accreditation scenarios (USAID 2006:22) which are summarised in
table 2.3. The content of table 2.3 is an own observation based on information
in a complex diagram and a textual discussion of the levels of accreditation in
the source literature.
Table 2.3 Role of the municipality and province, based on accreditation
status
Municipality
accreditation
level
Institutional and funding role per project
Identify project,
draft and submit
application to
province
Prioritise
projects
Approve
and register
or reject
project
Funding
administration
Non-accredited ▲ ◘ ◘ ◘
Level 1 ▲ ▲ ◘ ◘
Level 2 ▲ ▲ ▲ ◘
Level 3 ▲ ▲ ▲ ▲
▲indicates the role of the municipality, while ◘ denotes the role of the province
Source: Own observation from USAID. 2006. Accreditation framework for municipalities to administer national housing programmes.
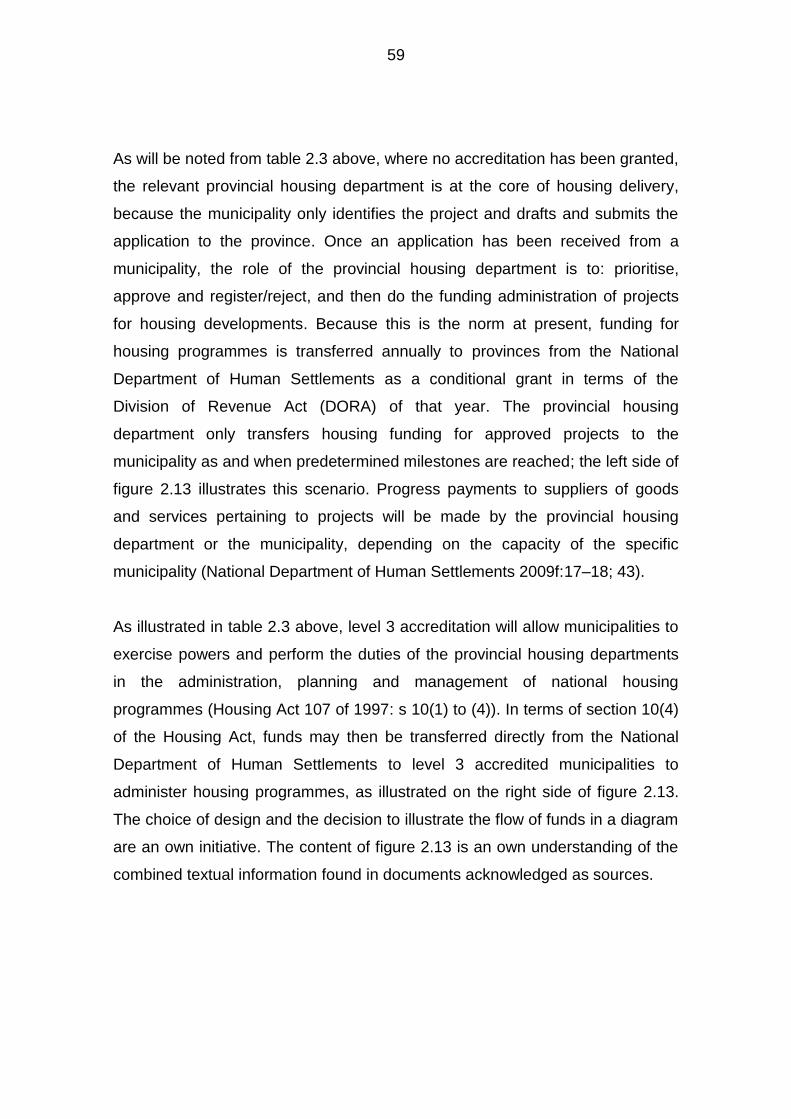
59
As will be noted from table 2.3 above, where no accreditation has been granted,
the relevant provincial housing department is at the core of housing delivery,
because the municipality only identifies the project and drafts and submits the
application to the province. Once an application has been received from a
municipality, the role of the provincial housing department is to: prioritise,
approve and register/reject, and then do the funding administration of projects
for housing developments. Because this is the norm at present, funding for
housing programmes is transferred annually to provinces from the National
Department of Human Settlements as a conditional grant in terms of the
Division of Revenue Act (DORA) of that year. The provincial housing
department only transfers housing funding for approved projects to the
municipality as and when predetermined milestones are reached; the left side of
figure 2.13 illustrates this scenario. Progress payments to suppliers of goods
and services pertaining to projects will be made by the provincial housing
department or the municipality, depending on the capacity of the specific
municipality (National Department of Human Settlements 2009f:17–18; 43).
As illustrated in table 2.3 above, level 3 accreditation will allow municipalities to
exercise powers and perform the duties of the provincial housing departments
in the administration, planning and management of national housing
programmes (Housing Act 107 of 1997: s 10(1) to (4)). In terms of section 10(4)
of the Housing Act, funds may then be transferred directly from the National
Department of Human Settlements to level 3 accredited municipalities to
administer housing programmes, as illustrated on the right side of figure 2.13.
The choice of design and the decision to illustrate the flow of funds in a diagram
are an own initiative. The content of figure 2.13 is an own understanding of the
combined textual information found in documents acknowledged as sources.
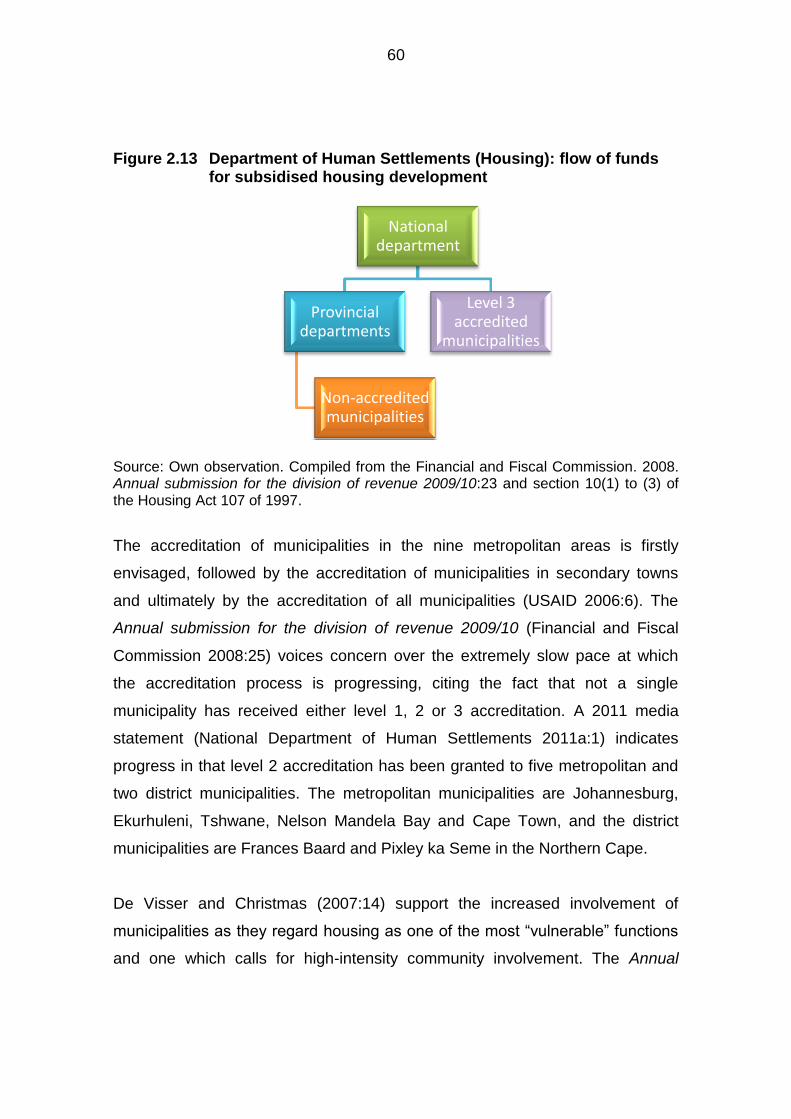
60
Figure 2.13 Department of Human Settlements (Housing): flow of funds for subsidised housing development
Source: Own observation. Compiled from the Financial and Fiscal Commission. 2008. Annual submission for the division of revenue 2009/10:23 and section 10(1) to (3) of the Housing Act 107 of 1997.
The accreditation of municipalities in the nine metropolitan areas is firstly
envisaged, followed by the accreditation of municipalities in secondary towns
and ultimately by the accreditation of all municipalities (USAID 2006:6). The
Annual submission for the division of revenue 2009/10 (Financial and Fiscal
Commission 2008:25) voices concern over the extremely slow pace at which
the accreditation process is progressing, citing the fact that not a single
municipality has received either level 1, 2 or 3 accreditation. A 2011 media
statement (National Department of Human Settlements 2011a:1) indicates
progress in that level 2 accreditation has been granted to five metropolitan and
two district municipalities. The metropolitan municipalities are Johannesburg,
Ekurhuleni, Tshwane, Nelson Mandela Bay and Cape Town, and the district
municipalities are Frances Baard and Pixley ka Seme in the Northern Cape.
De Visser and Christmas (2007:14) support the increased involvement of
municipalities as they regard housing as one of the most “vulnerable” functions
and one which calls for high-intensity community involvement. The Annual
National department
Provincial departments
Non-accredited municipalities
Level 3 accredited
municipalities
61
submission for the division of revenue 2009/10 (Financial and Fiscal
Commission 2008:20, 23) supports the transfer of the housing function to
municipalities which have the capacity, claiming that the transfer of funds
between provincial and local spheres “adds an unnecessary bureaucratic layer”.
2.10.2 Governmental housing institutions
As reflected in the summary in figure 2.14 below, various governmental housing
institutions have been established since 1994 to assist the three tiers of
government to deliver subsidised housing. The content of figure 2.14 is an own
understanding of textual information obtained from the various sources
acknowledged. The layout and design of figure 2.14 are an own initiative. The
housing institutions which have been established by and report to the National
Department of Housing/Human Settlements are listed in chronological order,
ranging from those established earlier to the most recent. Where institutions
have recently been closed, they have been retained in the discussion so that a
complete picture is provided, but the closure date has been indicated next to the
date of establishment. Figure 2.14 is followed by a brief discussion of each
institution. Where the National Department of Human Settlements is not the
sole source of funding of these institutions, any additional source of funding is
mentioned, which in certain cases includes external donors.

62
Figure 2.14 Summary of governmental housing institutions and intended
purpose
Source: Own observation from various sources as acknowledged in paragraphs 2.10.2.1 to 2.10.2.9, which include the full names of the institutions.
NURCHA 1995
•Bridging finance to emerging, mostly black-owned contractors/developers
Servcon 1995–2009
•Management services in respect of identified properties in possession and non-performing loans from 1998 to 2006
•Confirm accuracy of occupants of RDP houses and transfer title deeds
NHFC 1996
•Facilitate access to financing for low and moderate income households ‒ initially wholesale, now also retail
RHLF 1996 •Faciliate access to housing finance by low income households in non-metropolitan areas
SHF 1997
•Develop a sector policy framework
•Develop and build capacity for social housing institutions
NHBRC 1998
•Establish technical standards, monitor compliance
•Protect rights of housing consumers; provide warranties against defects
•Uplift developers through training
Thubelisha Homes
1998–2009
•Initially established to create housing stock for Servcon
•Technical assistance to unblock stalled projects and upgrade informal settlements
HDA 2009
•Acquire land for housing development
•Ensure government subsidies and funds flow
SHRA 2010 •Regulate all social housing institutions which obtain public funds

63
2.10.2.1 National Urban Reconstruction and Housing Agency (NURCHA) –
1995
NURCHA is a section 21 company which was established in 1995 and provides
bridging finance to contractors and developers for the construction of subsidy
housing, affordable housing, community facilities and infrastructure. NURCHA
specialises in financing contractors/developers who cannot easily access
finance from banks, therefore the smaller, mainly black-owned businesses.
Where these are emerging contractors/developers, NURCHA also provides
support and project management via intermediaries (NURCHA 2009:1).
NURCHA is mainly financed by the South African government in partnership
with the Open Society Institute of New York, a Soros Foundations Network.
Finance has also been raised from the Swedish, United States and Norwegian
governments as well as through the Futuregrowth Fund, Overseas Private
Investors Corporation, Shared Interest and Rand Merchant Bank and other
South African financial institutions (National Department of Housing 2009d:1).
2.10.2.2 Servcon Housing Solutions (Servcon) – 1995–2009
Servcon was established in 1995 after the signing of a record of understanding
between the Department of Housing, the Banking Association of South Africa
(BASA) and participating banks to address the problems banks were
experiencing with defaults by low-income households. Servcon’s mandate was
to provide management services in respect of a portfolio comprising 33 506
identified properties in possession and non-performing loans of R1,277 billion
from April 1998 until March 2006 (South African Government Information
2008:11). During the period of the mandate, two-thirds of the affected
households either signed new agreements based on revised payment
schedules or interim rentals, or were moved to more affordable accommodation.
64
However, two-thirds of the households that signed new agreements broke them
immediately after signing them (Housing Finance 2000:4). In the remaining one-
third of the households initially affected, the properties were transferred to the
occupiers through a combination of relocation subsidies provided by the
Department of Housing and the writing off of the remainder of the debt by the
participating banks. In May 2006, the shares of the Banking Association of
South Africa and the participating banks’ claims in Servcon were sold to the
National Department of Housing (South African Government Information
2008:11). Since then, Servcon has been involved in service-level agreements
with the four provincial housing departments to clean up the housing database
by confirming the accuracy of their particulars with occupiers, rectifying defects
in houses, confirming whether the original owners of RDP houses are
occupying them and transferring title deeds (South African Government
Information 2008:11).
It was stated in a briefing by the National Department of Housing, recorded by
the Parliamentary Monitoring Group (2008a:2) that Servcon’s mandate had
matured and would be terminated in view of the establishment of the Housing
Development Agency (HDA). It was expected that the last remaining properties
would have been transferred by the end of March 2009 and Servcon would
have handed a portfolio over to the HDA. The minutes of the Parliamentary
Monitoring Group (2009f:11) reflect that Servcon was to cease operations on 30
September 2009 and the administrative closure was to be completed by 31
March 2010.
2.10.2.3 National Housing Finance Corporation (NHFC) – 1996
The NHFC is a state-owned development finance institution which was founded
by the National Department of Housing in 1996 to ensure that every low and
middle income household has access to finance. The NHFC earns its revenue

65
from interest and service charges on its wholesale lending and financial
services (South African Government Information 2008:10). The NHFC was
established to deliver on the following specific functions:
initiate and manage programmes aimed at increased involvement of the
banking sector in housing finance for low and middle income households
fund or underwrite alternative lenders who are equipped to function in the
market the banks are having difficulties with
fund or underwrite the institutions providing housing other than individual
freehold
manage programmes building financial capacity at retail level to broaden
access to housing finance and funds for the housing process in the low to
medium income market (NHFC 2008a:1).
Initially, the NHFC did not lend directly to individuals, but only to social housing
institutions and approved lenders (NHFC 2008b:1). Hamlyn (2006:1) and South
African Government Information (2008:10) report that the NHFC has become a
home loan bank for middle and lower income earners. Hamlyn also reports that
this facility has made it possible for low income earners to buy a house in a
commercially driven development which would create integrated and diverse
mixed-income communities.
2.10.2.4 Rural Housing Loan Fund (RHLF) – 1996
The RHLF was established by the South African government as a section 21
company in 1996, after receiving a grant of R150 million from the German
government. The purpose of the fund is to facilitate access to housing finance in
nonmetropolitan areas by low-income households. The RHLF operates as a
wholesale financial institution by lending to intermediary housing lenders, who in
turn lend to individuals (South African Government Information 2008:12). The

66
loans are for incremental purposes, and enable people to build or improve their
housing over a period of time (National Department of Housing 2009e:1).
2.10.2.5 Social Housing Foundation (SHF) – 1997
The SHF is a section 21 company which was established by the National
Department of Housing in 1997 to develop a policy framework for the sector and
to develop and build capacity for social housing institutions (South African
Government Information 2008:11; National Department of Housing 2009f:1).
According to the SHF website (2009a:1), their mission and mandate is to
“develop a vibrant and sustainable social housing sector for South Africa”.
Social housing is defined as follows: “High quality and well-located subsidised
housing managed by viable, sustainable, independent institutions on
participatory management principles.” Social housing provides for various
tenure options, excluding full ownership, and is aimed at the low to middle
income households (The Social Housing Foundation 2009c:1).
Since 2001, the work of the SHF has been assisted by continued financial and
technical support from the following donors: United States Agency for
International Development (USAID); the Royal Netherlands Embassy; the Dutch
Ministry of Housing (VROM); Rooftops Canada; Norwegian Agency for
Development Co-operation (Norad); the Dutch umbrella body of SHIs (Aedes)
and the European Union (EU) (The Social Housing Foundation 2009b:1). The
grants received from the EU for the past seven years have now ceased
(Parliamentary Monitoring Group 2009g:4). According to the Social Housing
Foundation Annual Report for 2008/09, with the passing of the Social Housing
Act 2008 the operations of the SHF will “wind-down” and some of these
functions will be transferred to the Social Housing Regulatory Authority (SHRA)
(Parliamentary Monitoring Group 2009g:9).

67
2.10.2.6 National Home Builders Registration Council (NHBRC) – 1998
The NHBRC is a section 21 company established in terms of the Housing
Consumers Protection Measures Act 95 of 1998. The purpose of the NHBRC is
to provide housing consumers with warranty protection against defects and to
protect them from builders who have defaulted or who have not complied with
the required standards. As from 1 April 2002, the Housing Consumers
Protection Measures Act 95 of 1998 affords protection to all new subsidised
houses constructed as part of projects. Sections 2 and 10(1) of the Housing
Consumers Protection Measures Act require that all persons building houses
should be registered with the NHBRC. Consequently, the NHBRC generates
most of its funds from registration fees (National Department of Housing
2009c:1).
Section 3 of the Housing Consumers Protection Measures Act sets out the
following main objectives of the NHBRC:
serve the interests of consumers by providing warranties against defects in
new houses, including state-subsidised houses
“regulate the home building industry”
protect consumers by ensuring compliance by home builders with the Act
establish technical standards and monitor compliance
improve structural quality of houses
do training and inspections to assist home builders to reach technical
standards
promote housing consumer rights and provide information
(Housing Consumers Protection Measures Act 95 of 1998: s 3)
Section 13(2)(b) of the Housing Consumers Protection Measures Act lays down
the following minimum warranties that homebuilders need to provide to housing
68
consumers, failing which the NHBRC will provide assistance to home owners
for that purpose:
major structural defects – 5 years
noncompliance with: agreement; plans; deficient workmanship or material –
3 months
roof leaks – 12 months
The warranties are automatically transferred with a change of ownership
(Housing Consumers Protection Measures Act 95 of 1998: s 5(4)(d), s 13(2), s
13(4) –(5)).
2.10.2.7 Thubelisha Homes – 1998–2009
Thubelisha Homes is a section 21 company which was established in June
1998 with a mandate to create housing stock for Servcon; this mandate was
revised once the former properties in possession had been dealt with (National
Department of Housing 2009g:1). The revised mandate of Thubelisha Homes
was formulated in line with the BNG plan and included the provision of technical
assistance to provinces and municipalities to unblock stalled projects and
upgrade informal settlements (South African Government Information 2008:12).
According to a briefing by the National Department of Housing, recorded by the
Parliamentary Monitoring Group (2008a:2), the mandate of Thubelisha Homes
had matured and would be terminated in 2009 in view of the establishment of
the Housing Development Agency (HDA). It was noted that Thubelisha Homes
was technically insolvent, had not reached any of its targets, had multiple
resignations at top management level, had a lack of capital and was facing
numerous challenges as a result of the N2 Gateway project for the upgrading of
informal settlements. The closure of Thubelisha Homes was to take effect on 31
July 2009 (Parliamentary Monitoring Group 2009j:1).
69
2.10.2.8 Housing Development Agency (HDA) – 2009
The Housing Development Agency (HDA) was officially launched on 2 March
2009 (Mabaya 2009:1; SabinetLaw 2009:1). The HDA was established in terms
of the Housing Development Agency Act 23 of 2008. The HDA’s main role is to
acquire land for housing development (Engineering News 2009:1). According to
Housing in Southern Africa (2009a:1), former Minister Sisulu identified access
to land as a major bottleneck in housing delivery which was compounded by
“intergovernmental weaknesses”. Further, the former Minister explained that as
soon as a project had been approved and the land or land and buildings
identified, the HDA would undertake the sourcing, negotiating, acquisition,
planning and proclamation process and it would add to government capacity by
ensuring that government subsidies and funds flowed. During the planning
process, the HDA would coordinate and facilitate feasibility studies,
environmental impact assessments and geotechnical studies for township
proclamation. Once all processes had been completed, the HDA would hand
the land over to the owner for development. Former Minister Sisulu is quoted in
Housing in Southern Africa (2009a:1) as saying that the HDA would be project-
driven, with five projects allocated to it, including an Upgrading of Informal
Settlements Programme.
2.10.2.9 Social Housing Regulatory Authority (SHRA) – 2010
In terms of section 7 of the Social Housing Act 16 of 2008, the SHRA has been
established as a legal entity. The SHRA was inaugurated on 26 August 2010
(South African Government Information 2010:1), so it is in its infancy
(Parliamentary Monitoring Group 2009g:5). In terms of Notice 1199, the
purpose of the SHRA is to regulate all social housing institutions which obtain
public funds (Social Housing Act 16 of 2008, Notice 1199). According to the
Social Housing Foundation Annual Report for 2008/09, upon the closure of the

70
SHF, which is expected to take place in 2010, most of its operations will be
transferred to the SHRA (Parliamentary Monitoring Group 2009g:7; 53).
2.11 SUMMARY
This chapter firstly dealt with the origin of subsidised housing in post-1994
South Africa. The origin was found to lie in the 1994 Election Manifesto, which
undertook to provide and prioritise housing for the poor. Next, the various
definitions of housing terminology as determined by the Housing Act 107 of
1997 and other sources were studied. This discussion included the extension of
the mandate of the Department of Human Settlements which accompanied the
name change discussed in chapter 1. The extension of the mandate entailed
transferring sanitation from the Department of Water Affairs to the Department
of Human Settlements.
It was then established that the Constitution, the supreme law of the land,
legislates access to adequate housing as a right (see s 26). The government is
responsible for providing housing, subject to fiscal constraints. Thereafter the
six principles which all housing policies have to comply with were briefly
discussed. It was found from the number of documents – and the volume of
every one – that a great deal of attention has been given to developing a post-
1994 housing framework. The discussion was therefore limited to the present
national legislation and directives, which form the mandate within which the
Department of Human Settlements functions.
The vision, mission, core values and strategies of the National Department of
Human Settlements were then studied. The nine strategies as set out in the
BNG plan and the 2009 Housing Code were illustrated in ten diagrams to
ensure that an overall picture is presented, without going into exhaustive detail.
It was found that the diagrams have the added benefit of facilitating the

71
identification of information pertaining to the Upgrading of Informal Settlements
Programme. It was noted that Strategy 2 of the 2009 Housing Code contains a
change in emphasis, namely from “progressive eradication” to “upgrading” of
informal settlements.
A diagrammatic overview found that the sixteen subsidised national housing
programmes were classified into four intervention categories, namely Financial,
Incremental, Social and Rental and Rural. The diagrammatic representation of
the housing programmes provides a clear indication of where the Upgrading of
Informal Settlements Programme fits into the big picture.
The facilitators and funding of these programmes were then established. The
three tiers of government, namely national, provincial and local government, are
all tasked in terms of the Housing Act to collectively ensure the delivery of
sustainable human settlements. In addition, certain functions are assigned to
certain levels. It was found that the roles and functions were in a transition
phase, as responsibility for human settlement delivery would be transferred to
certain municipalities as soon as certain criteria for accreditation had been met.
In addition to the three tiers of government, nine government-owned housing
institutions are facilitating various aspects of human settlement delivery. Two of
these institutions are in the process of being terminated and one new facilitator,
the Social Housing Regulatory Authority, has recently been inaugurated.
This chapter has provided an overview of the national framework for the
delivery of subsidised housing. Chapter 3 will focus on the upgrading of informal
settlements scenario.
72
CHAPTER 3
THE UPGRADING OF INFORMAL SETTLEMENTS
3.1 INTRODUCTION
In the previous chapter, an overall picture of the national framework for the
delivery of subsidised housing was provided. In this chapter, the complexity of
the informal settlements scenario is investigated. The investigation commences
with the concept of informal settlements. This is followed by a brief study of the
background to and development of informal settlements to throw light on the
historical roots and complexity of the present situation.
The focus then shifts to the detailed provisions of the Upgrading of Informal
Settlements Programme, one of sixteen national housing programmes
illustrated in figure 2.11 of this study. This is followed by a brief discussion of
the two other housing programmes that could be used to provide economic,
social and community facilities in the process of progressively creating
sustainable human settlements from former informal settlements. Lastly,
departmental factors hampering delivery are organised and combined into
various sections, each of which commences with overall housing delivery and
then provides examples pertaining to the Upgrading of Informal Settlements
Programme.
3.2 CONCEPT OF INFORMAL SETTLEMENTS (ALSO KNOWN AS
SLUMS OR SQUATTER CAMPS)
As in most developing countries with limited resources, in South Africa informal
settlements have arisen as a result of a process of rapid urbanisation of the
poor, who have flocked to the cities in search of work and a better life (National

73
Department of Housing 2008a:104). Lombard (2004:2) concurs, stating that
poverty, social disorder, deprivation and environmental degradation have been
the stark consequences of urbanisation. Despite decisions to tackle the
problem, Housing in Southern Africa (2009b:1) refers to a recent UN-Habitat
report which estimates that three out of ten households in South Africa are slum
dwellings.
The BNG plan (2004:3–4) indicates that despite the delivery of 1,6 million
houses between 1994 and 2004, the significant change in the demand and the
pace of urbanisation have resulted in an increased housing delivery backlog.
The statistics indicating the changes between 1996 and 2001 are as follows:
The number of households living in shacks in informal settlements or
backyards increased from 1,45 million to 1,84 million.
The population increased by 11%.
The number of households increased by 30% as a result of the drop in
average household size from 4,5 people per household in 1996 to 3,8 in
2001.
Urban populations increased – in fact 20% of urban residents were first-
generation residents – and housing and service provision did not keep up
with household formation (National Department of Housing 2004:3–4).
The trend indicated in the above statistics has continued because, according to
a National Department of Human Settlements workshop held at the end of 2009
(Parliamentary Monitoring Group 2009c:1; 3), the South African context at large
is distinguished by:
population growth
rapid and irreversible urbanisation coupled with migration from rural to
urban areas

74
smaller households resulting in an increased number of households, and
“dual residence” where households temporarily stay in urban areas while
retaining a rural base
The effect of the above factors on human settlements is an increase in informal
settlements, lack of access to basic services, unbalanced property markets and
unsustainable development choices (Parliamentary Monitoring Group 2009c:1,
3).
The rapid migration of people from rural to urban areas is seen as creating a
“shifting target” in the delivery of services, which may partly explain the dramatic
increase in informal settlements, because housing delivery cannot keep up with
unplanned and increased demand. In fact, most of the informal settlements are
concentrated in the larger cities and their outskirts. Cape Town, Johannesburg,
Pretoria and Durban are specifically mentioned (Parliamentary Monitoring
Group 2009c:1, 3). The Development Action Group (2007:1) suggests a reason
for this state of affairs. In their opinion, economic growth in cities has
contributed to the rapid urbanisation, which in turn has led to an increase in the
number of informal settlements. The Development Action Group (2007:1)
quotes as follows from the 2006 State of the Cities Report:
44,1% of the national number of jobs were provided by five of the major
cities, namely Johannesburg, Cape Town, Tshwane (Pretoria and
surrounds), eThekwini (Durban area) and Ekurhuleni (Germiston and
surrounds).
The economic growth in cities has not provided enough jobs because:
o 46,5% of national unemployment and
o 77,31% of people “living under the minimum living line” live within
60 km of these cities.
75
According to Minister Sexwale (National Department of Human Settlements
2009d:2), people living in shacks make up the “lion’s share” of the housing
backlog, therefore the housing backlog will be used in this study as the gauge of
the number of informal settlement households which need some form of
upgrading. As was found to be the case with housing backlog and delivery
figures quoted in chapters 1 and 2 respectively of this study, the estimated
informal settlement figures often contradict one another.
3.3 BACKGROUND TO AND DEVELOPMENT OF INFORMAL
SETTLEMENTS
The challenge of housing people living in informal settlements was identified as
early as in the 1994 Election Manifesto, where one of the promises made by the
ANC, as discussed in paragraph 2.2, was to house 7 million squatters (African
National Congress 1994:4). At the projected average household size in 1995 of
4,97 people per household (National Department of Housing 1994:8),
approximately 1,4 million houses would have had to be provided to house the
squatters.
The post-1994 developments in policy, legislation, procedures, practice and
commitments pertaining to informal settlements are briefly discussed in order of
occurrence, from the oldest to the most recent.
3.3.1 A New Housing Policy and Strategy for South Africa (1994 Housing
White Paper)
The 1994 Housing White Paper attributed the massive growth in informal
settlements to high rates of household formation and low rates of housing
delivery. It also indicated that the increase in land invasions would have to be
addressed in future policy at all levels of government. As stated in paragraph
76
2.2, the 1994 Housing White Paper refers to projected figures for 1995 of 1,06
million households living in squatter housing on the outskirts of towns and cities
and in the backyards of formal houses (National Department of Housing
1994:8).
3.3.2 Development Facilitation Act 1995
To give effect to the RDP White Paper (South Africa 1994:67), the Development
Facilitation Act 67 of 1995 was passed (Enviro Leg CC 2009:1). One of the
aims of the Act was to introduce exceptional measures to speed up the
implementation of RDP projects for land. Section 3 of the Development
Facilitation Act deals with general principles for land development, which
include the following provisions pertaining to informal settlements, namely that
policy, practice and legislation should:
facilitate the development of land for informal settlements
discourage the illegal occupation of land
(Development Facilitation Act 67 of 1995: s 3).
3.3.3 Housing Act 1997
In terms of section 2(1)(e) of the Housing Act, the following provision pertaining
to informal settlement development must be promoted by the three tiers of
government in respect of housing development, namely:
the creation, development and maintenance of socially and economically
viable communities and of safe and healthy living conditions to prevent
slums
(Housing Act 107 of 1997: s 2(1)(e))
77
3.3.4 Prevention of Illegal Eviction and Unlawful Occupation of Land Act
1998
The next major development in informal settlements was the Prevention of
Illegal Eviction and Unlawful Occupation of Land Act 19 of 1998. According to
the minutes of the Parliamentary Monitoring Group (1999:2), landlords were
evicting tenants unlawfully and intervention was required. The Act strikes a
balance between the needs of landowners who are faced with illegal
occupations and those of the landless, who are often victims of wrongful
evictions. The Act sets out the procedures that must be followed to evict
unlawful occupiers of land while at the same time prohibiting the arbitrary or
illegal eviction of occupiers (South African Government Information 2008:5).
3.3.5 United Nations Millennium Development Goals (2000)
It appears that the first step in attempting to upgrade or eradicate informal
settlements in South Africa was taken as a result of a United Nations initiative.
The United Nations Millennium Development Goals were signed in 2000 by
numerous countries and leading development institutions in the world – all
committing to a global partnership. There are eight Millennium Development
Goals, ranging from halving extreme poverty to preventing the spread of
HIV/AIDS and providing universal primary education – all by 2015 (United
Nations Millennium Development Goals 2009a:1). In terms of United Nations
Millennium Development Goal 7, “Ensure Environmental Sustainability", Target
4 (2009b:1), a significant improvement must be achieved worldwide in the lives
of 100 million slum dwellers by 2020. According to Macgregor and Smit
(2007:1), this would mean halving the number of people living in slums.
The indicators for the Millennium Development Goals are the proportion of
people who have access to secure tenure and improved sanitation (Chenwi

78
2007:25). Government’s response to the Millennium Development Goals was to
include specific strategies pertaining to informal settlements in the BNG plan, as
discussed in paragraph 3.3.7 of this study, as well as to make an extremely
ambitious commitment, which is discussed in the next paragraph.
3.3.6 South African government commitment (2004)
At the Public Policy Forum Meeting of Cities Alliance (South African
Government Information 2004:1–3), the then Minister of Housing, Lindiwe
Sisulu, stated that government had decided to contribute to the Millennium
Development Goals by committing itself to achievable targets for the eradication
of informal settlements. The targets set at the time were to upgrade or eradicate
informal settlements within a period of ten years from the launch of the BNG
plan, therefore by 2014.
Government has on many occasions reiterated its commitment to the
eradication or upgrading of informal settlements by 2014 (South African
Government Information 2005:5; National Department of Housing 2006a:1;
2006c:1; 2006d:1; 2007a:31; 2009a:1). Examples of commitment statements
are: seeing it as a priority; “there is no issue more urgent and critical”; we are
committed even though it will be a “rocky climb”; and, on introducing the new
Director-General, saying that his task was to eradicate informal settlements by
2014 (National Department of Housing: 2006c:1; 2006a:1). In fact, while the
BNG plan sets out various strategies, according to the strategic statement on
the website (National Department of Human Settlements 2010c:1), the BNG’s
prime objective is the eradication or upgrading of all informal settlements by
2014/15.
While Millennium Development Goal 7 aims for a target date of 2020 and aims
to halve the number of slum dwellings, the earlier date of 2014 appears to come

79
from former Minister Sisulu’s statement that, as African ministers, government
would like to see the world making an increased commitment to the target date
of 2020 for Target 4 of Millennium Development Goal 7 (South African
Government Information 2005:3). In addition to the earlier target date,
upgrading appears to have been abandoned at some point and the commitment
changed to the eradication of all informal settlements by 2014.
From a delivery perspective, Huchzermeyer (2009:1) argues that the campaign
to upgrade or eradicate informal settlements by 2014 is a misinterpretation of
the Millennium Development Goals and is unrealistic. She supports her opinion
by referring to the Informal Settlements Upgrading Programme pilot projects,
which should have been completed by 2007/08. Long after the target date for
completion, not one of them has been completed.
From a financial perspective, Misselhorn (2008:21–22) projects that, even
without taking all cost variables into account, a minimum amount of R27 billion
per annum would be required from 2008 to 2014 to eradicate 1,2 million
informal settlement households. Based on the backlog figure of 2,4 million
informal settlement households provided by the National Department of
Housing (SabinetLaw 2009:2), the minimum amount required annually to
eradicate all informal settlements by 2014 would be at least R54 billion.
Misselhorn (2008:7) argues that informal settlement residents make “conscious
choices” about where to live, usually linked to the cost of living, transport and
proximity to jobs. In further motivation of his point, Misselhorn (2008:8) quotes
from a 2007 Urban LandMark survey which found that in 47% of the cases the
respondents’ situation had improved because of moving to an informal
settlement; in 30% it had stayed the same and in only 20% of cases had it
worsened, according to the respondents.
80
3.3.7 Breaking New Ground (BNG plan) (2004)
Before the launching of the BNG plan, no policy provision was specifically made
for informal settlements, other than in section 3 of the Development Facilitation
Act, which appears to have encouraged the formation of informal settlements,
as it provided for the facilitation of the development of land for formal and
informal settlements (Development Facilitation Act 67 of 1995: s 3).
3.3.7.1 Progressive informal settlement eradication
“Progressive informal settlement eradication”, which is represented by the area
shaded in red in figure 2.3 of this study, forms part of Strategy 2 of the BNG
plan, namely “From housing to sustainable human settlements”. The broader
intention of Strategy 2 of the BNG plan is to address part of the poverty
scenario, which comprises three elements, namely: income, human capital
(services and opportunity) and assets (National Department of Housing:
Breaking New Ground 2004:11).
Regarding “Progressive informal settlement eradication” in terms of the BNG
plan (National Department of Housing 2004:17), the time had come to
acknowledge the existence of informal settlements and to shift official policy on
informal settlements from one of conflict or neglect to one of cooperation – and
to integrate these areas into the urban structure. When the BNG plan was
launched, there were no existing housing programmes that made specific
provision for the upgrading of informal settlements. It was decided to take
vigorous measures to upgrade informal settlements and implement a subsidised
housing programme that would deliver sufficient houses to progressively
decrease the formation of informal settlements (Breaking New Ground
2004:17).
81
3.3.7.2 [Developing and implementing] [t]he Informal Settlement
Upgrading Programme
“The informal settlement upgrading instrument”, which is represented by the
area shaded in red in figure 2.4 of this study, forms part of Strategy 3 of the
BNG plan, namely “Existing and new housing instruments”. This strategy
indicates that a “New Informal Settlement Upgrading Programme/ mechanism”
should be developed and that implementation requires cooperation between the
three tiers of government (National Department of Housing 2008a:103).
Macgregor and Smit (2007:1) are of the opinion that, from 1994 to 2004, the
government’s response to informal settlements was characterised by disaster
management strategies, but since 2004 when the BNG plan was launched,
programmes have been put in place to eradicate informal settlements through
large capital-intensive interventions. However, Smit (2005:1) expresses the
concern that the approach appears to be top-down, focused on targets, and that
this has resulted in insufficient community participation.
3.3.7.3 More flexible qualification criteria
In figure 2.7, which depicts Strategy 6 of the BNG plan, under “Adjusting
beneficiary contributions and criteria”, informal settlements have been identified
as one of the three areas which should have more flexible qualification criteria
than those of other housing programmes. This forms part of Strategy 6, namely
“Financial arrangements”, which aims to address increased demand for housing
and improve response to this demand (National Department of Housing:
Breaking New Ground 2004:19–20).
82
3.3.8 Housing Consumer Education Framework (2007)
The next development was the Housing Consumer Education Framework,
which identifies the invasion of land and the creation of unsustainable
settlements and shacks with a lack of security of tenure as a problem which has
developed owing to a lack of knowledge of the choices available to the
invaders, as well as the rights and responsibilities that are attached to home
ownership. The purpose of the Housing Consumer Education Framework is to
establish a comprehensive, uniform and integrated document which creates
awareness and educates consumers and other key role players regarding
housing matters (National Department of Housing: Housing Consumer
Education Framework 2007b:6–7).
3.3.9 Sustainable human settlement planning: a resource book on
housing chapters (2008)
Sustainable human settlement planning: a resource book on housing chapters
provides municipalities with a practical resource to strengthen their planning for
housing delivery in terms of the BNG plan. More specifically, the resource book
provides information, guidance and direction to municipal officials in preparing a
housing chapter that sets out the housing sector plan as part of the municipal
Integrated Development Plan (National Department of Housing: Sustainable
human settlement planning 2008a:1; Mpumalanga Department of Housing
2010:9). This book, Sustainable human settlement planning (National
Department of Housing 2008a:104), is an important development in relation to
informal settlements because it contains details, albeit in the form of a
summary, of what was then known as the Informal Settlement Upgrading
Programme, the first publication to do so subsequent to the strategy included in
the BNG plan of 2004.
83
3.3.10 Housing Code (2009)
Under the 2009 Housing Code, what was previously known as the Informal
Settlement Upgrading Programme became known as the National Housing
Programme: Upgrading of Informal Settlements, generally referred to as the
Upgrading of Informal Settlements Programme (National Department of Human
Settlements 2009f:9).
As discussed in paragraph 2.6.10, a revised Housing Code should have been
published by June 2005 incorporating the major changes to policy included in
the BNG plan. No housing code was published between the 2000 version and
the 2009 Housing Code, which was minuted as having been approved on 5
March 2010 (Parliamentary Monitoring Group 2010c:3) and subsequently
published. Because this is the first Housing Code published since the launch of
the BNG plan in 2004, it is also the first official document providing detailed
information on the Upgrading of Informal Settlements Programme, the concept
of which was initiated in terms of the BNG plan.
The Upgrading of Informal Settlements Programme is dealt with in Part 3,
Volume 4, of the 2009 Housing Code. According to the 2009 Housing Code
(2009f:9), the purpose of the informal settlements chapter is to deal with the
procedures and processes for the upgrading of informal settlements, specifically
relating to the grants provided to municipalities to do informal settlement
upgrading in a structured manner.
As indicated in italics in the red shaded areas of figures 2.3, 2.4 and 2.5, there
has been a change in emphasis and/or wording applicable to informal
settlements between the publication of the BNG plan and the 2009 Housing
Code. It was decided to summarise an own observation of the changes
between the textual documents referred to above, in table 3.1.

84
Table 3.1 Summary of changes affecting informal settlements, from the
BNG plan to the 2009 Housing Code
Strategy
number
Figure
number
BNG plan 2004 2009 Housing Code
2 2.3 From housing to
sustainable human
settlements
“Moving from housing to
sustainable human
settlements”
2 2.3 Progressive informal
settlement eradication
“Upgrading of informal
settlements”
3 2.4 Existing and new
housing instruments
“Existing housing instruments”
3 2.4 Informal Settlement
Upgrading mechanism
Informal Settlement Upgrading
“Programme”
4 2.5 - Informal settlements are to be
included in all IDPs
Source: Own observation from figures 2.3, 2.4 & 2.5, compared with the 2009 Housing Code (2009b:23; 26; 28)
IDPs are Integrated Development Plans.
The only change in emphasis pertaining to informal settlements is the second
one listed in table 3.1. No media releases reflecting the change in emphasis
from progressive “eradication” to “upgrading” only have been found, but a
revised government commitment is discussed in paragraph 3.3.11. The change
in emphasis will no doubt be welcomed by Misselhorn (2008:16), who argues
that the concept of “slums eradication” or “slums clearance” is perceived to be
an anti-poor action which creates the impression that informal settlements are
illegal and need to be removed with immediate effect – by any means possible.
85
3.3.11 Revised government commitment (2010)
The Parliamentary Monitoring Group (2010a:1, 3) noted a discussion on an
unannounced shift away from the 2004 commitment of government to eradicate
all informal settlements by 2014. During the discussion, Mr Dlabantu, the Acting
Director-General of the National Department of Human Settlements
(Parliamentary Monitoring Group 2010a:3), justified the shift in commitment by
stating that the Department “needed to focus on issues in a realistic and
pragmatic manner, dealing with issues one by one and paying adequate
attention to each”.
The focus for 2014 will be on upgrading 500 000 dwellings (National
Department of Human Settlements 2010a:2) in well-located informal
settlements and will include the provision and upgrading of bulk infrastructure
networks to informal settlements which have been identified for upgrading
(Parliamentary Monitoring Group 2010c:1, 3). According to the address by
Minister Sexwale to the National Assembly (National Department of Human
Settlements 2010a:2), the upgrading target set for 2014 does not detract from
the eradication of informal settlements, which has now become a long-term
objective.
3.4 THE UPGRADING OF INFORMAL SETTLEMENTS PROGRAMME
3.4.1 Concept and objectives
As discussed above, the concept of the Upgrading of Informal Settlements
Programme was introduced in 2004 as part of Strategies 2 and 3 of the BNG
plan (National Department of Housing 2004:17–18), as illustrated in figures 2.3
and 2.4 of this study. The Upgrading of Informal Settlements Programme was
instituted in terms of section 3(4)(g) of the Housing Act 1997 (National

86
Department of Human Settlements 2009f:9), which authorises the Minister to
implement and finance new national housing programmes (Housing Act 1997:
s3(4)(g)).
According to the 2009 Housing Code (National Department of Human
Settlements 2009f:9, 13), the “primary” objective of the Upgrading of Informal
Settlements Programme is to cater for the unique development requirements of
informal settlements. The “key” objective is intended to achieve the following
interrelated and complex policy objectives:
tenure security – to acknowledge and formalise the tenure rights of
informal settlement residents as a means of strengthening the broader
concept of citizenship, which includes the rights and responsibilities of
citizens
health and security – to advance the development of healthy and secure
living environments in formal settlements by providing affordable and
sustainable municipal engineering infrastructure which allows for future
upgrading
empowerment – to promote the social and economic integration of
communities by addressing broader social needs and building social
capital though participative processes
As initially envisaged in the BNG plan (National Department of Housing
2004:12) and identified in the 2009 Housing Code (National Department of
Human Settlements 2009f:9; 13) as a key objective, the Upgrading of Informal
Settlements Programme supports a phased, in situ upgrading of informal
settlements in line with international best practice. The Concise Oxford
Dictionary (Fowler 1976:559), defines the term in situ as: “In its (original) place”.
Therefore in situ upgrading takes place on the site of the informal settlement. In
situ upgrading has the advantages of: enhancing community participation in all
facets of the development, maintaining fragile community networks, and

87
minimising disruption (National Department of Housing: Breaking New Ground
2004:17; Sustainable human settlement planning 2008a:104; National
Department of Human Settlements: Housing Code 2009f:13). The relocation of
communities will be carried out where in situ upgrading is not possible or
desirable (National Department of Housing 2004:12), for example where
flooding occurs or other factors are present which necessitate relocation
(National Department of Housing 2008d:2). The 2009 Housing Code stipulates
that before any relocation can be carried out, approval must be obtained from
the affected community and the area to which the relocation is to be done must
be a designated area which is included in an approved municipal Integrated
Development Plan (National Department of Human Settlements 2009f:14). The
Upgrading of Informal Settlements Programme has been designed to be flexible
enough to allow for specific local development needs and to become a
specialised funding mechanism (National Department of Human Settlements
2009f:25).
Since the implementation of the Informal Settlement Upgrading Programme,
government has taken a hard line on the Millennium Development Goal of
eradicating informal settlements – by evictions or infrastructure development
(Macgregor & Smit 2007:1).
3.4.2 Informal settlement prioritisation and qualification criteria
According to the 2009 Housing Code (National Department of Human
Settlements 2009f:25), the following broad principles should be applied when
deciding the upgrading priority of each potential informal settlements project:
reach as many households as possible to achieve the national goal of
upgrading all informal settlements by 2014 (unchanged in spite of revised
commitment)
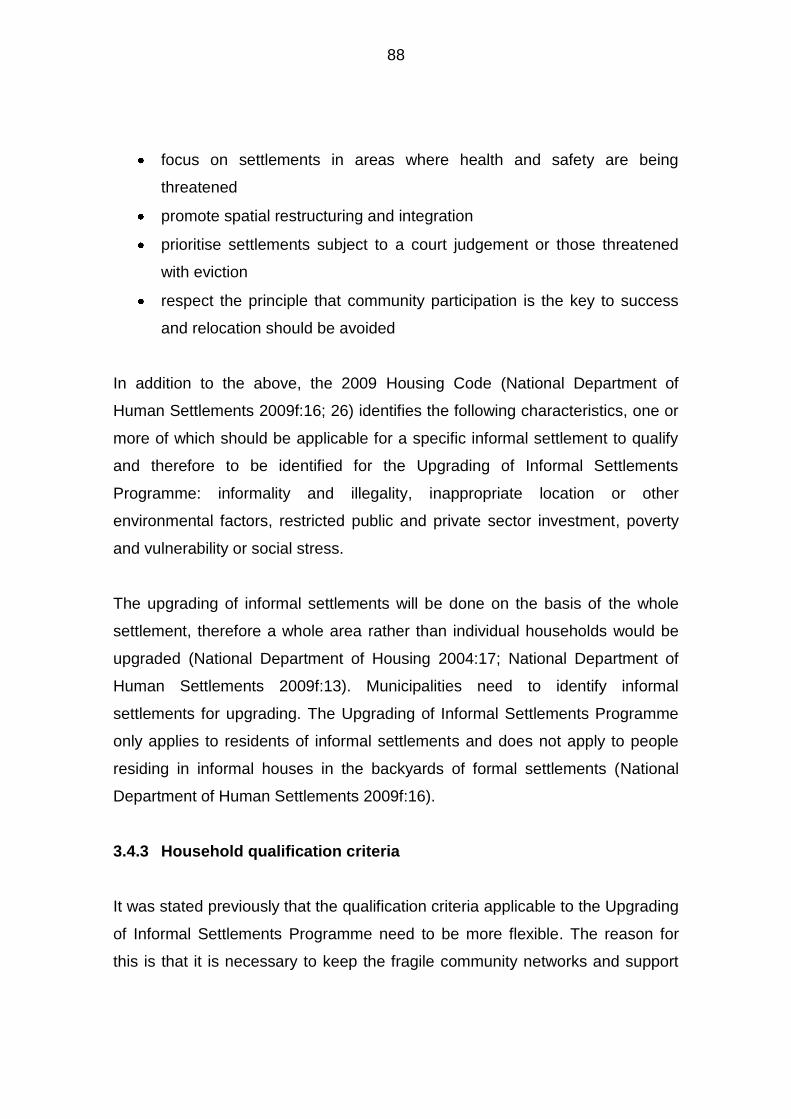
88
focus on settlements in areas where health and safety are being
threatened
promote spatial restructuring and integration
prioritise settlements subject to a court judgement or those threatened
with eviction
respect the principle that community participation is the key to success
and relocation should be avoided
In addition to the above, the 2009 Housing Code (National Department of
Human Settlements 2009f:16; 26) identifies the following characteristics, one or
more of which should be applicable for a specific informal settlement to qualify
and therefore to be identified for the Upgrading of Informal Settlements
Programme: informality and illegality, inappropriate location or other
environmental factors, restricted public and private sector investment, poverty
and vulnerability or social stress.
The upgrading of informal settlements will be done on the basis of the whole
settlement, therefore a whole area rather than individual households would be
upgraded (National Department of Housing 2004:17; National Department of
Human Settlements 2009f:13). Municipalities need to identify informal
settlements for upgrading. The Upgrading of Informal Settlements Programme
only applies to residents of informal settlements and does not apply to people
residing in informal houses in the backyards of formal settlements (National
Department of Human Settlements 2009f:16).
3.4.3 Household qualification criteria
It was stated previously that the qualification criteria applicable to the Upgrading
of Informal Settlements Programme need to be more flexible. The reason for
this is that it is necessary to keep the fragile community networks and support
89
structures intact (National Department of Human Settlements 2009f:13). As a
result, certain benefits are available to residents of informal settlements who are
excluded from the Housing Subsidy Scheme (National Department of Human
Settlements 2009f:14), as illustrated in figure 3.1.
Provided that the municipality identifies the area for upgrading (National
Department of Human Settlements 2009f:13), persons living in informal
settlements who meet the criteria illustrated in figure 3.1 will generally benefit
from the Upgrading of Informal Settlements Programme. The benefit the
household or person qualifies for is determined by the specific situation of the
household, as indicated in figure 3.2, which follows directly on figure 3.1. The
decision to use diagrams and the specific design of figures 3.1 and 3.2 are an
own choice. The content of figures 3.1 and 3.2 are an own understanding of the
textual stipulations found in the sources acknowledged below the figures.

90
Figure 3.1 Criteria to be met by households/persons in order to qualify for benefits
Source: Own observation from National Department of Housing (2008e:1); National Department of Housing: Sustainable human settlement planning (2008a:104);
National Department of Human Settlements: 2009 Housing Code (2009a:16–17;
2009f:16–17).
Households that qualify for the Housing Subsidy Scheme, namely those meeting the following criteria:
•The gross monthly household income of the applicant may not exceed R3500.
•The applicant must be a citizen of South Africa or a person in possession of a permanent residence permit.
•The applicant must be legally competent to contract, that is over 18 years, married or divorced and of sound mind.
•An applicant or anyone else in the household must not have received previous government assistance for housing, except for disabled persons and applicants who qualify for a consolidation subsidy. This applies to applicants who were beneficiaries of serviced stands under the previous housing dispensation. The consolidation subsidy is equivalent to the individual subsidy and is intended to enable the applicant to construct a house.
Households that qualify for the Housing Subsidy Scheme, except for the monthly income exceeding the limit (presently R3500)
Households headed by minors, therefore persons who are not legally competent to contract, assisted by the Department of Social Development
The following persons will be considered on a case-by-case basis:
•Previous/existing owners of residential property and previous beneficiaries of state-assisted housing schemes
•Illegal immigrants, subject to the conditions laid down by the Department of Home Affairs
Single persons without financial dependants, including persons of pensionable age qualifying for government old age social grants
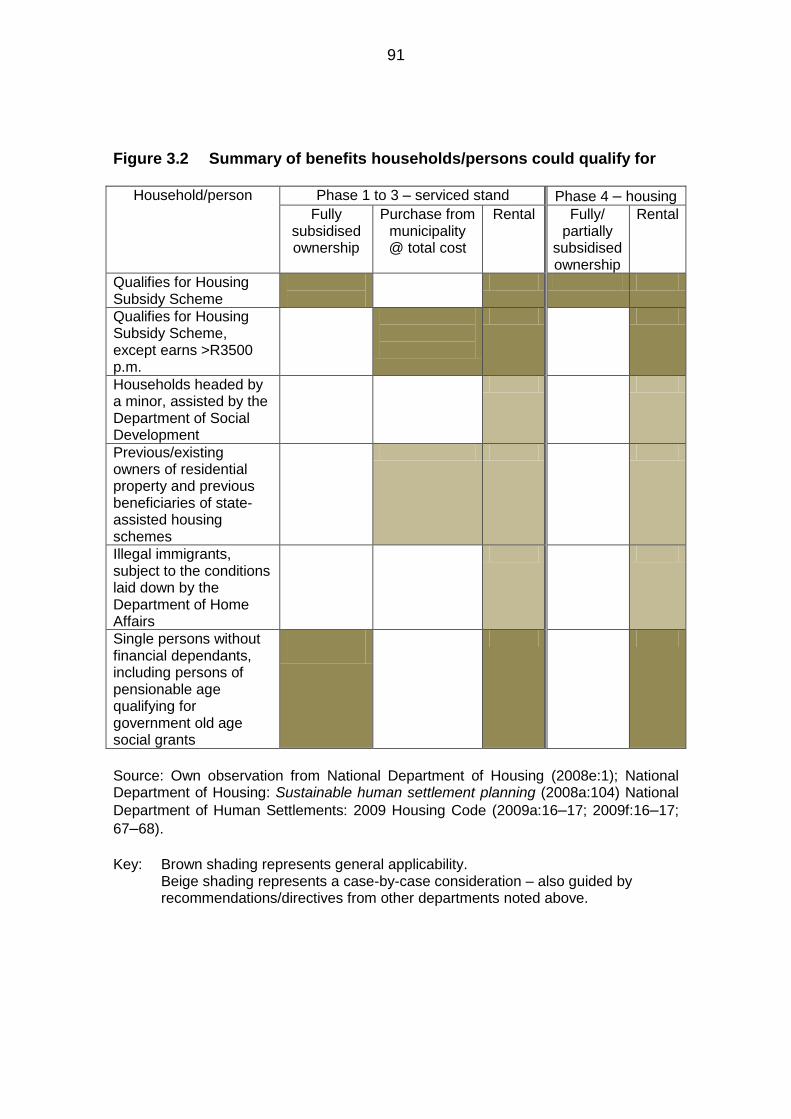
91
Figure 3.2 Summary of benefits households/persons could qualify for
Household/person Phase 1 to 3 – serviced stand Phase 4 – housing
Fully subsidised ownership
Purchase from municipality @ total cost
Rental Fully/ partially
subsidised ownership
Rental
Qualifies for Housing Subsidy Scheme
Qualifies for Housing Subsidy Scheme, except earns >R3500 p.m.
Households headed by a minor, assisted by the Department of Social Development
Previous/existing owners of residential property and previous beneficiaries of state-assisted housing schemes
Illegal immigrants, subject to the conditions laid down by the Department of Home Affairs
Single persons without financial dependants, including persons of pensionable age qualifying for government old age social grants
Source: Own observation from National Department of Housing (2008e:1); National Department of Housing: Sustainable human settlement planning (2008a:104) National
Department of Human Settlements: 2009 Housing Code (2009a:16–17; 2009f:16–17;
67–68).
Key: Brown shading represents general applicability.
Beige shading represents a case-by-case consideration – also guided by recommendations/directives from other departments noted above.

92
It will be noted from figure 3.2 that people falling into certain beneficiary
categories qualify to purchase a stand for ownership. If they choose to do so,
they may purchase it from the municipality. The purchase price is defined as the
cost of acquiring the land and all development costs to provide services etc
(National Department of Human Settlements 2009f:67–68). It is also clear that
all households/persons qualify for more than one possible benefit. The actual
benefit will then be determined by the choice exercised by the
household/person, as illustrated in figure 3.3, provided that the chosen option is
available in that specific area.
Figure 3.3 Choices available to qualifying households
Source: Own observation – compiled from the 2009 Housing Code (National
Department of Human Settlements 2009f:28; 38; 44; 58; 67–68).
Choices available to qualifying households/persons
Ownership of serviced stand and/or housing unit
Serviced stand (Phases 1 to 3)
Housing unit on serviced stand/ medium-density
housing unit (Phases 1 to 4). Apply for a housing unit from one the following:
National Housing Programmes:Individual
Housing Subsidy; Integrated Residential Development;
Enhanced Peoples' Housing Process; Consolidation
Subsidy
Rental of serviced stand and/or housing unit
Serviced stand (Phases 1 to 3)
Housing rental from/ if options available in
specific area

93
Figure 3.2 shows that households complying with all the Housing Subsidy
Scheme qualification criteria are the only ones that qualify for benefits in terms
of ownership or rental of all four phases of the Upgrading of Informal
Settlements Programme. As illustrated in figure 3.3, the first choice available to
these households is between ownership and rental. Where rental is chosen, a
stand or housing unit can be rented. Where ownership of a serviced stand is
chosen, it is fully subsidised, regardless of household income. The next choice
is whether the household wishes to apply to one of the National Housing
Programmes indicated in figure 3.3 for a housing unit. Where the household
income is less than or equal to R1500 per month, the housing unit is fully
subsidised. Where the monthly household income is between R1501 and
R3500 per month, the general rule is that a beneficiary contribution of R2479 is
payable and the remainder of the cost of the housing unit is subsidised.
(National Department of Human Settlements 2009e:3; 2009g:3). The two
household income levels are disregarded, however, resulting in the housing unit
being fully subsidised, in the following circumstances:
If the unit is for the indigent as envisaged in Strategy 6 of the BNG plan,
illustrated in figure 2.7 of this study. The indigent are the poor/needy,
defined as the aged, disabled and health stricken.
If the beneficiary decides to apply to the Enhanced Peoples’ Housing
Process Programme. This exemption also flows from the BNG plan – in
fact from Strategy 3 as illustrated in figure 2.4 of this study (National
Department of Human Settlements 2009e:3; 2009g:3).
3.4.4 Various phases
The Upgrading of Informal Settlements Programme comprises three or four
phases, depending on the specifics of the beneficiary, as discussed above.
Phases 1 to 3 involve community participation in the supply of basic services
and tenure security for all residents, regardless of rental or ownership choices.

94
In Phase 4, housing is provided to qualifying beneficiaries, as illustrated in
figure 3.2 above (National Department of Human Settlements 2009f:27).
Figure 3.4 summarises the four phases of the Upgrading of Informal
Settlements Programme. Phases 1 to 3 have been referenced to supporting
diagrams which have been shaded in the corresponding colour, for ease of
reference. Figures 3.4 to 3.7 are own designs and insights gained on studying
the textual discussions in the sources acknowledged below each of the
diagrams.

95
Figure 3.4 Phases of the Upgrading of Informal Settlements Programme
Source: Own observation – compiled from information in the 2009 Housing Code
(National Department of Human Settlements 2009f:17; 21; 43–44; 51; 68).
Phase 4 – Housing consolidation, where applicable
Phases 1 to 3 – Serviced stand
Phase 3 – Project implementation (figure 3.7)
Phase 2 – Project initiation (figure 3.6)
Phase 1 – Application (figure 3.5)
On approval of the application, the project will be registered and funding will be reserved by the province

96
Figure 3.5 Phase 1 – Application
Source: Own observation – compiled from information in the 2009 Housing Code
(National Department of Human Settlements 2009f:20; 43; 47–48).
Phase 1 – Application – municipalities
apply to provincial
government for project
approval and funding
Municipality drafts and submits Interim Business Plans to the Provincial Housing Department, containing:
•Relevant details from the Integrated Development Plan (IDP) and the Housing Development Plan which include:
•the number of informal settlements
•the basis of prioritisation for upgrading
•a plan for the release of land in the future
•measures to ensure no new informal settlements are established
Municipality extracts pre-feasibility details of informal settlement, including:
•age
•history
•ownership status of land
•number of households
•desktop environmental survey
•desktop geotechnical survey done in collaboration with NHBRC
•location vs transportation
•employment and social amenities
•illegal immigrants
•preliminary work plan and budget for project, including municipal counter-funding and funds required for social and economic amenities
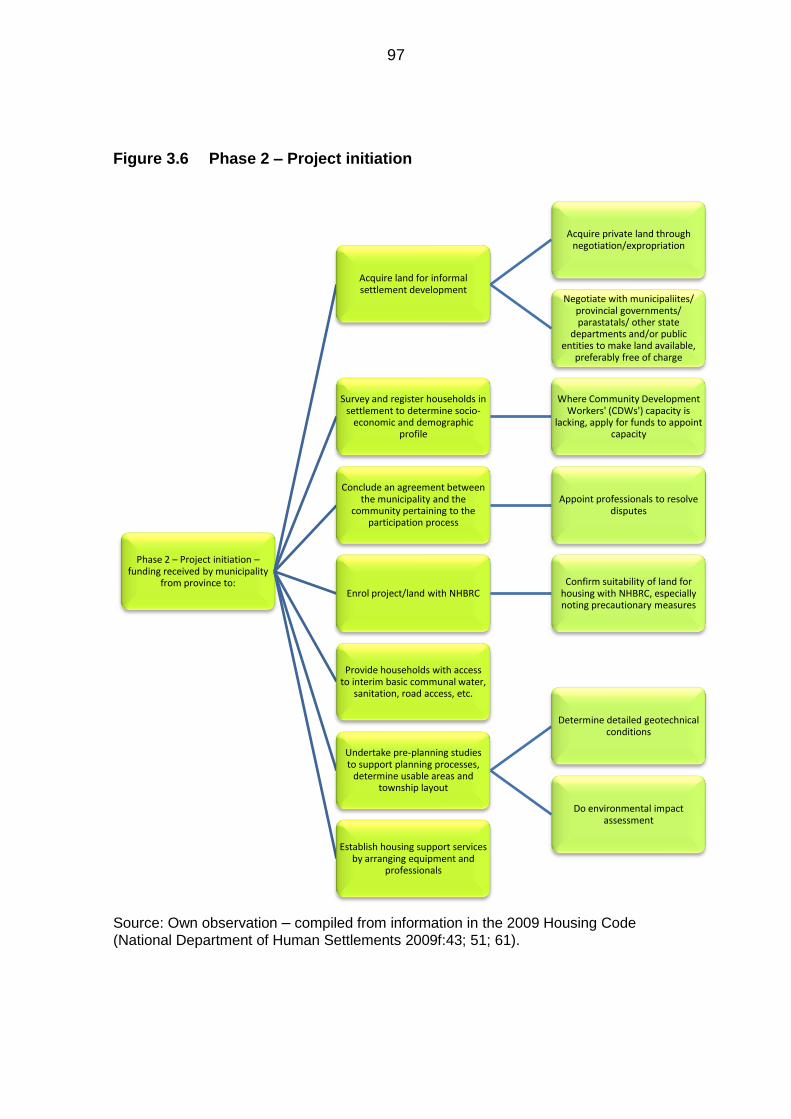
97
Figure 3.6 Phase 2 – Project initiation
Source: Own observation – compiled from information in the 2009 Housing Code
(National Department of Human Settlements 2009f:43; 51; 61).
Phase 2 – Project initiation – funding received by municipality
from province to:
Acquire land for informal settlement development
Acquire private land through negotiation/expropriation
Negotiate with municipaliites/ provincial governments/ parastatals/ other state
departments and/or public entities to make land available,
preferably free of charge
Survey and register households in settlement to determine socio-
economic and demographic profile
Where Community Development Workers' (CDWs') capacity is
lacking, apply for funds to appoint capacity
Conclude an agreement between the municipality and the
community pertaining to the participation process
Appoint professionals to resolve disputes
Enrol project/land with NHBRC Confirm suitability of land for
housing with NHBRC, especially noting precautionary measures
Provide households with access to interim basic communal water,
sanitation, road access, etc.
Undertake pre-planning studies to support planning processes,
determine usable areas and township layout
Determine detailed geotechnical conditions
Do environmental impact assessment
Establish housing support services by arranging equipment and
professionals

98
Figure 3.7 Phase 3 – Project implementation
Source: Own observation – compiled from information in the 2009 Housing Code
(National Department of Human Settlements 2009f: 21; 43–44; 55–63).
•Content is an extended version of Phase 1 Application
•Various criteria considered, including: funding, technical feasibility, national priorities, national and provincial targets, value for money, etc.
Municipality compiles Final Business Plan
and submits it to the province for
consideration
•Municipality notified by province on whether project approved, approved with conditions, partially approved or declined
Approval of application
•Establish project management capacity
•Resolve disputes and finalise land acquisition
•Establish housing support centres
•Finalise planning and land surveying process and NHBRC enrolment
•Provide permanent municipal enginering infrastructure, such as water, sanitation, toilet, roads, storm water, street lights ‒ funded separately through Municipal Infrastructure Grant, not by province
•Construct social amenities, economic and community facilities after consultation with community
Activities municipality
undertakes with funding received
from province include:
•Includes details in approved Business Plan, approved funding, rental/occupational compensation to be charged in Phases 1 to 3, etc.
Agreement between provincial
department and municipality
•Provincial department manages project budget. Where municipality runs project, it validates, approves and submits claims to Province for payment.
Progress payments

99
Figures 3.5 to 3.7 above illustrate an own understanding of the main steps in
Phases 1 to 3, the complex and lengthy process required to gain approval and
to apply the Upgrading of Informal Settlements Programme. In addition to the
steps in each phase, the responsibilities of the municipalities and provincial
housing departments are set out in the illustrations in figures 3.4 to 3.7. It is
notable that social and economic amenities are regularly mentioned in the
above steps. This element is crucial to the concept of sustainable human
settlements and two specific National Housing Programmes that provide for
facilities of this nature are briefly discussed in paragraph 3.5 of this study.
Phase 4, the housing consolidation phase, comprises the finalisation of
township establishment, the registration of ownership (where relevant) and the
construction of houses. Any outstanding social amenities will also be
constructed during this final phase (National Department of Human Settlements
2009f:44). Figure 3.3 lists an own understanding of the National Housing
Programmes which qualifying persons may apply to for Phase 4 top structures
(houses/multilevel apartments), which are not discussed further in this study.
Once a formal house is ready for occupation, the developer must demolish the
informal settlement structure and secure the vacated land to ensure that the
land is not invaded or reoccupied (National Department of Human Settlements
2009f:16; 68–69).
3.4.5 Facilitators and funding
3.4.5.1 Three tiers of government
Overall, the duties of the three tiers of government for the Upgrading of Informal
Settlements Programme correspond to those in the Housing Act, which are
illustrated in figure 2.12 of this study. A more detailed illustration of the
responsibilities of the second and third tiers of government specifically relating

100
to the Upgrading of Informal Settlements Programme is included in figures 3.4
to 3.7. It is clear from all these figures that municipalities must take the initiative
in and bear the responsibility for the Upgrading of Informal Settlements
Programme. The pivotal role of the provincial housing departments indicated in
these figures is also very clear. The basis for this role is that municipalities may
lack accreditation. As municipalities gain accreditation, the role of provincial
housing departments in housing development projects will decrease, as is
illustrated in table 2.3. The 2009 Housing Code (National Department of Human
Settlements 2009f:24) states very clearly that provincial governments must only
assume the responsibility of the municipality where the municipality is not able
to meet its obligations.
The Upgrading of Informal Settlements Programme is funded by the National
Department of Human Settlements from the Integrated Housing and Human
Settlement Redevelopment Grant (National Department of Human Settlements
2009f:27). As discussed in paragraph 2.10.1 and illustrated in figure 2.13, at
present funds are allocated annually and transferred to the provincial
departments. However, once a municipality has earned a level 3 accreditation,
the funds are transferred directly from the national department to the
municipality. Only the establishment of serviced stands (Phases 1 to 3) will be
financed from the Upgrading of Informal Settlements Programme. Applicants
need to apply to other housing programmes for the construction of houses
(Phase 4) (National Department of Housing 2008a:104; National Department of
Human Settlements 2009f:14–15).
Municipalities are required to fund a minimum capital contribution of 10% of the
total cost of projects under the Upgrading of Informal Settlement Programme
from own funds before funding can be accessed from the provincial human
settlement department. Municipalities will be allowed to use the Municipal
Infrastructure Grant to finance this capital contribution (National Department of

101
Human Settlements 2009f:19). After completion of the projects, municipalities
are responsible for funding the operational and maintenance costs of social,
community and economic facilities as well as those of engineering services
established in terms of the Upgrading of Informal Settlements Programme
(National Department of Human Settlements 2009f:19–20).
3.4.5.2 Governmental housing institutions
Because the purposes of the various housing institutions discussed in chapter 2
differ, the specific housing projects within the Upgrading of Informal Settlements
Programme will determine which institution(s) will be used. As discussed in
paragraph 2.10.2.8, the Housing Development Agency will be used in many of
the projects to acquire the land and carry out the planning and proclamation
processes. The NHBRC (paragraph 2.10.2.6) would, however, be involved in
Phase 1 to 3 projects carried out in terms of the Upgrading of Informal
Settlements Programme, as indicated in figures 3.5 to 3.7. In addition,
regardless of the National Housing Programme chosen for the provision of the
top structure, the enrolment of the Phase 4 houses at the NHBRC (National
Department of Human Settlements 2009f:15) is essential to ensure that they
carry the intended warranties.
3.4.6 Subsidy guideline
Table 3.2 is an own understanding and calculation which gives the 2008/09 and
2009/10 subsidy guidelines for the Upgrading of Informal Settlements
Programme. While the unit costs may come as a surprise to the uninformed,
they do not appear to be overstated. According to Misselhorn (2008:21), a total
cost of approximately R70 000 per unit for Phases 1 to 4 is optimistic, because,
as noted in chapter 1, the cost in eThekwini was approximately R80 000 at the
time he made this comment.

102
It will be noted from the own calculation done in table 3.2 below that a serviced
stand in terms of the Upgrading of Informal Settlements Programme costs
R30 466 for 2009/10, whereas the guideline amount for most of the other
programmes is R22 162 (National Department of Human Settlements 2009g:7,
16; 2009h:7; 2009i:6). Part of the difference appears to be that the Upgrading of
Informal Settlements Programme seems to be the only programme where the
approved project funding allows for the provision of internal municipal
engineering services. In the case of the other programmes, alternative funding
sources must be found by the municipality (National Department of Human
Settlements 2009g:6, 12; 2009h:6; 2009i:5).
Table 3.2 Subsidy guidelines – 2008/09 and 2009/10
Phase Subsidy guideline per household
2008/09 2009/10
R R
Phase 1 5 830 7 289 ◘
Phases 2 & 3 18 580 23 177 ♦
Cost of a serviced stand 24 410 30 466
Relocation grants 938 1 178
Cost of serviced stand and residents
relocated
25 348 31 644
Phase 4 (40 m2 house) 43 506 55 706 ♣
Norm value per household 68 854 87 350
Source: Own observation from Misselhorn (2008:17) and 2009 Housing Code (National
Department of Human Settlements 2009e:3; 2009g:3, 10–11, 39).
◘ R6465,18 + approximated survey, etc. costs @ 3% of project cost,
assumed to be Phase 1–3 costs. ♦ R20 980,96 + approximated project management costs @ 8% of Phase
1–3 costs. ♣ Maximum – differs from R54 650 to R55 706 per housing unit, depending
on the National Housing Programme chosen for Phase 4.
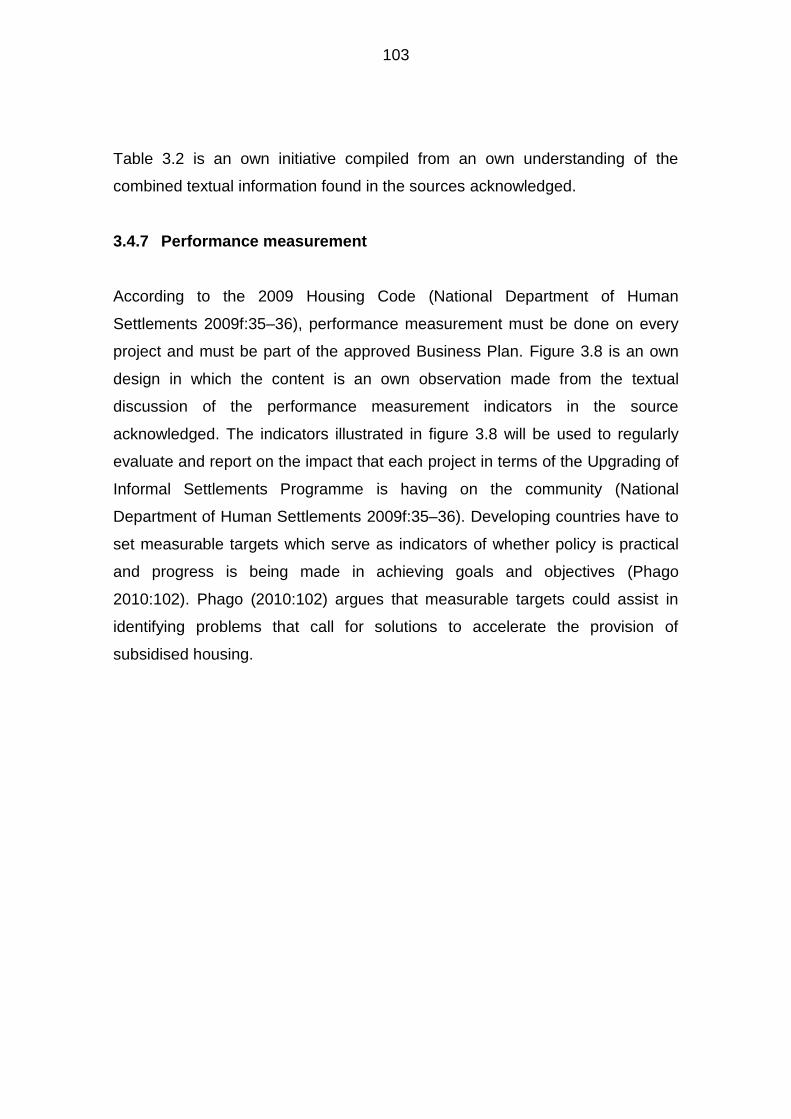
103
Table 3.2 is an own initiative compiled from an own understanding of the
combined textual information found in the sources acknowledged.
3.4.7 Performance measurement
According to the 2009 Housing Code (National Department of Human
Settlements 2009f:35–36), performance measurement must be done on every
project and must be part of the approved Business Plan. Figure 3.8 is an own
design in which the content is an own observation made from the textual
discussion of the performance measurement indicators in the source
acknowledged. The indicators illustrated in figure 3.8 will be used to regularly
evaluate and report on the impact that each project in terms of the Upgrading of
Informal Settlements Programme is having on the community (National
Department of Human Settlements 2009f:35–36). Developing countries have to
set measurable targets which serve as indicators of whether policy is practical
and progress is being made in achieving goals and objectives (Phago
2010:102). Phago (2010:102) argues that measurable targets could assist in
identifying problems that call for solutions to accelerate the provision of
subsidised housing.
104
Figure 3.8 Upgrading of Informal Settlements Programme performance indicators
Source: Own observation – compiled from the 2009 Housing Code (National
Department of Human Settlements 2009f:35–36).
Performance against the work plan and expenditure targets
per the Final Business Plan
•health ‒ especially decline in waterborne diseases and infant mortality rates
•access to "improved" drinking water and sanitation
•number of households with secure tenure
•increased number of business opportunities and jobs created
•increased number and affordability of social and recreational facilities
•family stability and community cohesion
•decrease in crime
Improvement in living conditions measured
through:
•the ability and willingness of residents to pay for services, reflected in increased local government revenue
•the ability and willingness of government agencies to operate and maintain public infrastructure which was developed as part of upgrading projects
•the environmental impact of upgrading projects
•progress with Phase 4, the housing consolidation phase as well as the options chosen by beneficiaries
•densification after upgrading – is it taking place and if so, at what rate?
•a beneficiary satisfaction survey to determine the impact of the upgrading on the lives of beneficiaries
Sustainability of upgrading projects measured through :
105
3.5 OTHER INTERRELATED NATIONAL HOUSING PROGRAMMES
As indicated in figures 3.5 to 3.7 and the discussion following these figures, two
other national housing programmes are available as part of the drive to create
sustainable communities, as briefly discussed below.
3.5.1 Provision of Primary Social and Economic Facilities Programme
As discussed earlier in this chapter, the reworded Strategy 2 of the BNG plan is
“Moving from housing to sustainable human settlements”, illustrated in figure
2.3. Part of this strategy is the development of primary social and economic
facilities to help to create a sustainable community. The Provision of Primary
Social and Economic Facilities Programme has been implemented because
backlogs exist in this area in most new housing projects, which now have to be
prioritised (National Department of Housing 2008a:98). There is a need for
social and economic facilities in existing and new housing areas as well as in
upgrading projects in informal settlements (National Department of Housing
2008d:1). Where no other funds can be sourced by the municipality for facilities
needed by residents, funds may be provided through the Primary Social and
Economic Facilities Programme (National Department of Human Settlements
2009i:13).
The primary social and economic facilities include:
schools and crèches
medical care facilities, including municipal clinics
community halls
community parks/playgrounds
taxi ranks and transportation hubs
sports fields and facilities

106
informal trading and small business facilities
basic ablution facilities for the above, where needed
(National Department of Housing 2008a:98; National Department of Human
Settlements 2009i:13).
3.5.2 Operational Capital Budget Programme
The Operational Capital Budget Programme has been implemented with the
specific purpose of providing funds to provincial housing departments to appoint
external expertise to extend the existing capacity of housing delivery in order to
achieve the housing development goals of the province (National Department of
Housing 2008a:99; National Department of Human Settlements 2009j:7). The
Operational Capital Budget Programme deals mainly, but not exclusively, with
the following:
the Upgrading of Informal Settlements Programme
the provision of primary social and economic facilities
the unblocking of stalled projects
(National Department of Housing 2008a:99; National Department of Human
Settlements 2009j:7).
3.6 DEPARTMENTAL FACTORS HAMPERING DELIVERY UNDER THE
UPGRADING OF INFORMAL SETTLEMENTS PROGRAMME
This study has shown that, from 1994 to date, the National Department of
Housing/Human Settlements has delivered on its responsibility to establish a
national framework for the delivery of subsidised housing. Although the
“national framework” is in place, it appears that delivery challenges remain. It is
documented in paragraph 1.2 that a former Housing Minister disclosed in 2008
that delivery is being hampered by intergovernmental weaknesses; in 2010,

107
Minister Sexwale confirmed the existence of bottlenecks affecting every step of
housing delivery.
Various parties concur with these opinions, as discussed in paragraphs 3.6.1 to
3.6.8. More than twenty departmental factors hampering delivery were identified
from the literature study, some being specific arguments ‒ and others general
opinions, for example: “coordination should be improved between government
departments”. To assess the suitability of the BSC against twenty different
departmental factors hampering delivery would result in repetitive discussions.
Another problem faced was that the general opinions given could relate to
various factors hampering delivery because of various underlying causes. The
decision was therefore taken to link general opinions with more detailed
arguments and to reduce the number of factors to fewer than ten. The
departmental factors hampering delivery were therefore organised and
classified under eight chosen headings. Even though personal bias could have
partly influenced the choice of headings, the focus of the suitability assessment
will be on the detailed arguments rather than purely on the chosen headings.
This will limit the effect that the choice of headings could have on the outcome
of the suitability assessment. Each of these paragraphs begins by discussing
departmental factors pertaining to the overall delivery of subsidised housing
which are perceived to be hampering delivery; this is followed by an example
relating to the Upgrading of Informal Settlements Programme. To provide an
overview of the factors perceived to be hampering delivery, the headings of
paragraphs 3.6.1 to 3.6.8 are summarised in figure 3.9.
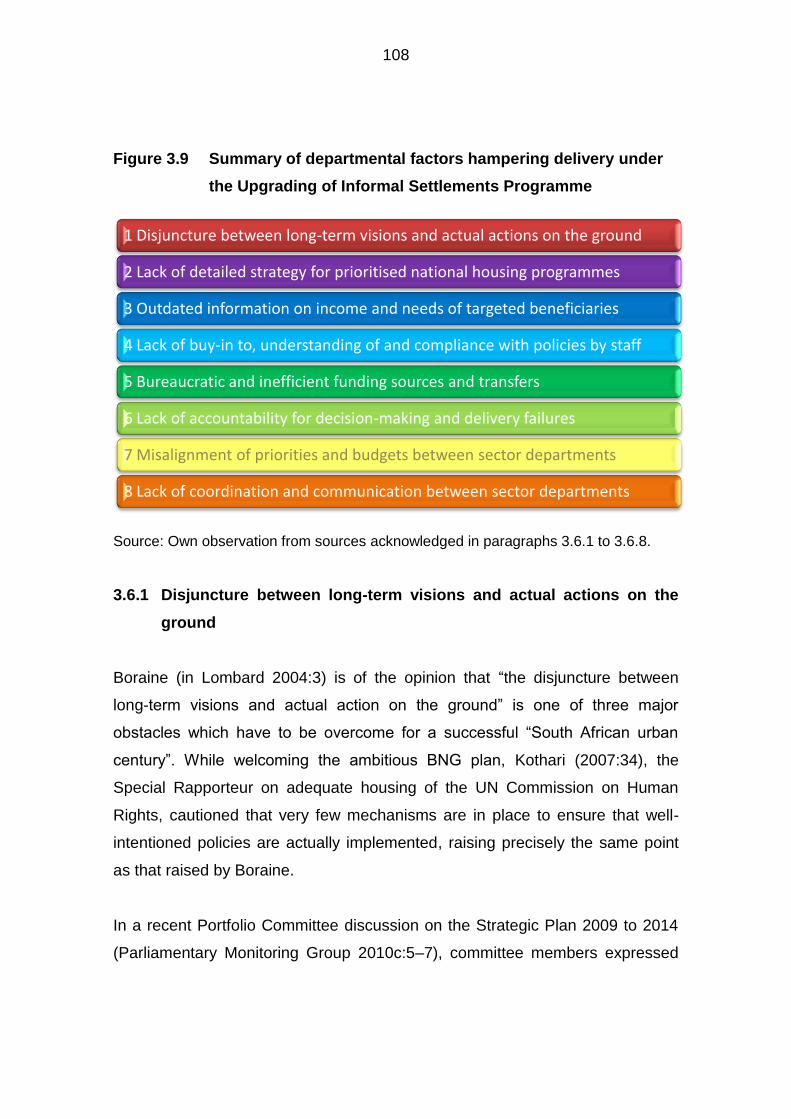
108
Figure 3.9 Summary of departmental factors hampering delivery under
the Upgrading of Informal Settlements Programme
Source: Own observation from sources acknowledged in paragraphs 3.6.1 to 3.6.8.
3.6.1 Disjuncture between long-term visions and actual actions on the
ground
Boraine (in Lombard 2004:3) is of the opinion that “the disjuncture between
long-term visions and actual action on the ground” is one of three major
obstacles which have to be overcome for a successful “South African urban
century”. While welcoming the ambitious BNG plan, Kothari (2007:34), the
Special Rapporteur on adequate housing of the UN Commission on Human
Rights, cautioned that very few mechanisms are in place to ensure that well-
intentioned policies are actually implemented, raising precisely the same point
as that raised by Boraine.
In a recent Portfolio Committee discussion on the Strategic Plan 2009 to 2014
(Parliamentary Monitoring Group 2010c:5–7), committee members expressed
1 Disjuncture between long-term visions and actual actions on the ground
2 Lack of detailed strategy for prioritised national housing programmes
3 Outdated information on income and needs of targeted beneficiaries
4 Lack of buy-in to, understanding of and compliance with policies by staff
5 Bureaucratic and inefficient funding sources and transfers
6 Lack of accountability for decision-making and delivery failures
7 Misalignment of priorities and budgets between sector departments
8 Lack of coordination and communication between sector departments
109
concern that provincial and municipal structures were not aligned and that often
what was actually being done on the ground did not agree with what was
documented or with legislated roles. It is noted that this situation occurs
because national government has to intervene where provinces or
municipalities are unable to perform the documented roles. Even the
Chairperson of the Portfolio Committee is of the opinion that various problem
areas on the ground are not being dealt with by the Department and that
consequently committee members are being approached for solutions, whereas
it is the duty of the department to sit down and strategise on how to resolve the
issues.
Misselhorn (2008:3, 16, 19–20, 23–24) is of the opinion that, while the National
Department of Housing had the best intentions in formulating the BNG plan,
which is innovative, “flexible, participative, and integrated”, the policy shifts have
not been applied and translated into changed delivery on the ground, nor have
systems, mechanisms and regulations been adapted accordingly. Misselhorn
(2008:29) argues that the concept of a house with a title is still being pursued on
the ground while the BNG plan is much wider than that, aiming to create an
integrated and sustainable environment with access to education, transport,
health care, etc.
In spite of the detailed strategies included in the BNG plan of 2004, the actions
on the ground still do not appear to have been adapted accordingly. In 2006,
the then Housing Minister stated that the only way to address the challenge of
creating a South Africa free of slums was by means of targeted, major projects,
with immediate impact (National Department of Housing 2006c:3). Yet
Misselhorn (2008:19–20) argues that it is clear from draft provincial business
plans and medium-term expenditure frameworks that there is a reluctance by
provincial housing departments to deal with informal settlement issues. Some
provincial housing departments openly indicate that they will not address the
110
informal settlement issue, while others state an intention to do so, but do not
allocate any funds for this purpose.
At municipal level, Venter (2008:11) claims that municipalities are reluctant to
apply the Upgrading of Informal Settlements Programme, allegedly preferring
individual subsidy programmes, which Misselhorn (2008:19) concurs with.
Huchzermeyer (2009:1) is of the opinion that most provinces and municipalities
do not even know that the informal settlement programme exists, but have
nevertheless been brainwashed by the campaign to eradicate informal
settlements by 2014.
When considering the above discussion, it appears that there is validity in
Misselhorn’s (2008:23) claim that while the best of intentions are present at
national level, there is an “acute disjuncture” when it comes to activating and
implementing the new thinking as contained in the BNG plan at provincial
levels. Misselhorn (2008:19) adds that there is an acute disjuncture between
what national government believes is being done and the actual actions of the
second and third levels of government. In a study focused on the
implementation of the procurement policy in subsidised housing, a significant
disjuncture was noted between official policy and actual practice in departments
(Mogoro & Brynard 2010:6).
3.6.2 Lack of detailed strategy for prioritised national housing
programmes
According to Kotsoane, a former Director-General of the National Department of
Housing (Parliamentary Monitoring Group 2008b:6), the department needs to
explore and adopt alternative approaches to improve the management of
priority housing projects. Trouble-shooting mechanisms should also be in place
for priority projects. It has been shown in this study that the Upgrading of

111
Informal Settlements Programme is a priority. Despite this and the government
eradication and upgrading commitments of 2004 and 2010 respectively, this
matter does not appear to have received the required attention.
In the presentation of the Department of Housing’s Updated Strategic Plan
2008/11 (Parliamentary Monitoring Group 2008b:5, 7, 10, 38) to the Select
Committee on Public Services, the following are mentioned as considerations,
priorities and planned activities for the progressive eradication of informal
settlements (the implication being that they were not being followed at the time
of the presentation): have an improved understanding of the demand and
backlog; develop an enhanced informal settlement upgrading strategy, linked to
targets.
3.6.3 Outdated information on income and needs of targeted
beneficiaries
As recently noted by the Parliamentary Monitoring Group (2009i:3),
beneficiaries must qualify for a subsidised house at the time of application, not
the time of delivery. In the period it takes for delivery, the applicant’s financial
status or income may have improved drastically and he/she may no longer
qualify, yet a subsidised housing unit would be allocated, based on the initial
application. Wessels (2010:1) quotes Kecia Rust of FinMark as follows: “[The
black market] is an indication of failure on the part of the delivery system –
they’re either targeting the wrong people or building houses in the wrong areas.”
According to Rust, people accept a house, let it and continue to live in an
informal settlement closer to work. S’bu Zikode, chairman of the KwaZulu-Natal
shack dwellers’ association Abahlali Basemjondolo, confirms Rust’s opinion that
one of the reasons people sell their houses and move back to shacks is that
houses are built far away from the city centres and people need to be closer to
work (Ngalwa 2008:2). Radebe of Soweto’s Anti Privatisation Forum, quoted in

112
Ngalwa (2008:2), expresses a different view: “Even though they get houses,
poor people cannot afford to pay for electricity and for rates and are trying to
find ways to survive.”
3.6.4 Lack of buy-in to, understanding of and compliance with policies by
staff
Boraine, quoted in Lombard (2004:3), warns that “complacency amongst all
stakeholders; the near-sightedness of policy makers and civil servants” needs
to be overcome for a successful “South African urban century”.
Kotsoane (Parliamentary Monitoring Group 2008b:5–6, 8) states that the
department needs to do the following:
Clarify housing development regulations, ensuring compliance with minimum
norms and standards and focusing on expediting delivery.
Find ways to work smarter; closely manage progress.
Improve the understanding of all staff in all spheres of government (but
especially at provincial and municipal level) pertaining to the policies and
changes to policies applicable to housing.
Although the provisions of the Upgrading of Informal Settlements Programme
require funding to be reserved once the application is approved, as illustrated in
figure 3.4, Campbell (2010:1–2) reports on a case where four projects have
been halted because the province cannot pay the contractor the R65 million due
to him. A spokesperson for the specific Provincial Department of Human
Settlements acknowledged that there were financial problems and that they had
consequently asked contractors to slow down the pace of building. This is not
only contrary to policy, but actually retards delivery, despite the fact that
accelerating delivery is one of the national priorities.
113
According to the Report of the Portfolio Committee on Human Settlements
(Parliamentary Monitoring Group 2010b:5, 8), provincial departments and
municipalities are not complying with legislation and policy dictating the
enrolment of land/houses with the NHBRC. In fact, a startling figure is
mentioned: only 7000 of the 2 700 000 subsidised houses built to date have
been enrolled with the NHBRC. Pertaining to the Upgrading of Informal
Settlements Programme, the various phases illustrated in figures 3.5 to 3.7, as
well as the Phase 4 discussion, clearly prescribe the level of NHBRC
involvement in every phase, culminating in the enrolment of all
projects/land/stands/houses with the NHBRC. Obviously, where this
requirement has not been complied with, the envisaged monitoring of
compliance with technical standards as well as warranty protection will not be
provided by the NHBRC.
According to the Report by the Public Service Commission (2007:44–45), many
of the beneficiaries appear to be dissatisfied, with 89% of the respondents
complaining about the poor quality of houses and 50% indicating that the issue
has not been resolved. Logically, in a subsidised housing situation, any losses
surrounding failure to register stands/houses would ultimately result in the
various housing departments carrying the risk in the event of any quality
problems. The risk could be one of non-delivery/delayed delivery and financial
loss. Pertaining to the delivery risk, where structural and other quality problems
are experienced which prevent or delay delivery, there is obviously no recourse
to the NHBRC structures or guarantees to address the problem. This could
substantially delay housing delivery, thereby adding to the housing backlog
(Parliamentary Monitoring Group 2010c:5). Regarding the risk of financial loss,
the Financial and Fiscal Commission cautions that improved monitoring of
compliance is required because repairs/reconstruction would result in additional
funding or costs (Parliamentary Monitoring Group 2010b:8), money which could
have been spent on housing delivery.
114
In a recent Portfolio Committee discussion on the Strategic Plan 2009–2014
(Parliamentary Monitoring Group 2010c:7), it was noted that there have been
cases where provincial officials ignore national government directives.
Misselhorn (2008:24–25) is of the opinion that while there are very dedicated,
skilled and hard-working employees, in general low levels of staff motivation
and a lack of work ethic to the point of dereliction of duty are more prevalent.
Misselhorn (2008:24–25) explains that staff are more concerned with
procurement and other regulations or with the pursuit of personal advantage,
rather than having a passion to assist the poor. The personal advantage could
take the form of positioning themselves for promotion, direct kick-backs or
pursuing parallel business interests. Mogoro and Brynard (2010:4, 6–7) believe
that slow progress by provincial and local departments of human settlement in
reducing the housing backlog can largely be attributed to the “incompetent
implementation of the procurement policy”.
Misselhorn (2008:25) argues that corruption is widespread and includes
undeclared conflicts of interest or vested interests, bribes and procurement
corruption. Mogoro and Brynard (2010:15) concur. Misselhorn (2008:25) is of
the opinion that because of corruption, “competence and performance are
seriously compromised” on projects, and that this is counterproductive to
delivery.
3.6.5 Bureaucratic and inefficient funding sources and transfers
The Submission for the Division of Revenue 2009/10 (Financial and Fiscal
Commission 2008:20) indicates that there are bottlenecks in the process of
transferring housing funds between provincial and local spheres, citing that the
process is bureaucratic and inefficient. This results in municipalities’ not
receiving funds timeously, or “fiscal dumping”, where large amounts are
115
transferred close to financial year-end, leaving no time to spend the funds
(Financial and Fiscal Commission 2008:21).
Misselhorn (2008:27) is of the opinion that the coordination required between
multiple government departments and sources of funding is hampering delivery
under the Upgrading of Informal Settlements Programme. A case in point is the
Cottonlands project, where it took over eight years to secure funding from the
Department of Land Affairs. In a period of over eight years, land costs had risen
steeply and the informal settlement density increased substantially, making
upgrading extremely difficult. Misselhorn (2008:22) also found that
municipalities are being advised by provincial housing departments to obtain
funds from the Department of Land Affairs for the acquisition of land, which
causes long delays. According to Misselhorn, this is in direct contrast to the
intention of the BNG plan that funding from the Department of Human
Settlements should cover land acquisition, servicing and top structure costs.
3.6.6 Lack of accountability for decision-making and delivery failures
In his report to the Presidency on informal settlements, Misselhorn (2008:24)
identifies various constraints in the functioning of top and senior management,
including: tendencies to overcentralise decision-making; failure to respond to
written correspondence, including major funding applications; failure to hold
regular committee meetings; and extremely slow turnaround times on decision-
making. In addition, there is a lack of skills in general management, project
management and technical spheres. According to Misselhorn (2008:25, 28),
capacity and employees are affected by a continual change in staff, especially
senior staff, coupled with a lack of standardised approval and decision-making
processes. The problem with changes in the senior staff complement is that
they barely get to understand the particular challenges and functions of a job
before they are redeployed, or the department is restructured. In addition, the

116
processes are often based on the personal preferences of managers rather
than on best practice and tend to change with management changes. Decision-
making is often overcentralised as a result of personal preferences, but there is
no accountability for failures in delivery or decision-making. The continual
changes create difficulties for staff as well as for other stakeholders pertaining
to partnerships and cooperation with other tiers of government and facilitators.
Even in 1997, Cohen (1997:147) was citing a lack of provincial accountability
and the need for more “checks and balances”. It appears that Kotsoane
(Parliamentary Monitoring Group 2008b:7) concurs with Cohen, when calling for
the improved use of and reporting on the resources and budget in the housing
sector and increased project tracking in the provinces. The basis for Kotsoane’s
call is understood in the context of Misselhorn’s argument. Misselhorn
(2008:27–28) argues that it is not uncommon for assessment and decision-
making processes by the provincial housing departments to take between a
year and two years. Generally, no acknowledgement of receipt of the
application is sent by the provincial housing department and there is no way of
tracking progress other than through personal follow-up.
3.6.7 Misalignment of priorities and budgets between sector departments
In the BNG plan it was stated that the poor alignment in budgets and priorities
between line function departments and municipalities remained a challenge and
that municipalities lacked the capacity to streamline funding sources and apply
progressive planning (National Department of Housing 2004:4, 6). Although six
years have passed since then, when looking at the discussion below, this still
appears to be the case. Kotsoane (Parliamentary Monitoring Group 2008b:5–6),
argues that planning processes must be improved and streamlined for effective
delivery and that a more inclusive approach to carrying out the departmental
mandate must be developed. Dlabantu contends that the present mandate must

117
be “fine-tuned” to enable the inclusion of all the sectors in a stream-lined
process to enhance delivery (Parliamentary Monitoring Group 2009d:3).
At the end of 2009, Dlabantu (Parliamentary Monitoring Group 2009d:2) argues
that the delivery of human settlements has been hampered by the “lack of ...
alignment and the prioritisation of funds and projects between sector
departments”. According to the Report of the Portfolio Committee on Human
Settlements (Parliamentary Monitoring Group 2010b:9–11), there is a
misalignment between national and provincial priorities. The strategic plans of
provincial departments have to be aligned to national plans, which is not the
case at present. One of the points noted is that in the Strategic Plan, “on
percentage terms, the budget allocated for the eradication of informal
settlements and the rental stock does not match the target pronounced in the
State of the Nation Address”. The budgetary allocations in the Western Cape,
Gauteng and KwaZulu-Natal were of special concern, because these provinces
have the biggest concentration of slums.
According to the presentation by the Department of Housing on the Updated
Strategic Plan, 2008/11 (Parliamentary Monitoring Group 2008b: 54 & 78–79),
the estimated funds specifically allocated to the Upgrading of Informal
Settlements Programme (serviced stands) and Phase 4 of the programme (top
structure construction) for 2008/09 are estimated at 25% (or R2,68 billion) out of
the total allocated funding of R10,59 billion. This is stated as representing an
output target in units of 104 000 for the Upgrading of Informal Settlements
Programme and 15 000 units for the Phase 4 top structure construction, out of a
total output target of 302 000 units. Delivery of 104 000 serviced stands and
15 000 houses is clearly not going to enable the eradication of approximately
2,4 million informal settlement households by 2014. This deduction has been
found to be true and a revised commitment was made in 2010. It appears that
this trend will continue in future, because, according to Misselhorn (2008:20), in
118
the 2008 Estimates of National Expenditure, only 15% of the total national
housing subsidy was earmarked for the upgrading of informal settlements in the
years 2008/9; 2009/10 and 2010/11.
In paragraph 2.10.2.8, the main role of the Housing Development Agency was
identified as being the acquisition of land for housing development. At the 2009
launch of the Housing Development Agency, Kotsoane stated that, in order to
eradicate informal settlements by 2014, the Housing Development Agency
would work with all stakeholders in the housing sector to fast-track housing
delivery and build integrated communities in terms of the BNG plan (South
African Government Information 2009:1). Yet, according to the Report of the
Portfolio Committee on Human Settlements (Parliamentary Monitoring Group
2010b:7), no capital funding has been allocated to the Housing Development
Agency to carry out its mandate.
3.6.8 Lack of coordination and communication between sector
departments
In 2004, Lombard (2004:2) expressed concern that a lack of coordination and
communication existed between the affected parties, which often resulted in
duplication or counterproductive actions. Kothari (2007:36), the Special
Rapporteur on adequate housing of the UN Commission on Human Rights,
recommends that coordination be improved between government departments
regarding housing and Chenwi (2007:24) concurs. Chenwi elaborates, stating
that a lack of adequate interdepartmental and intergovernmental relations exists
and that monitoring the progress of these complex processes in providing
housing is crucial (Chenwi 2007:21, 24).
Kotsoane (Parliamentary Monitoring Group 2008b:6, 8) is of the opinion that
closer collaboration must be fostered between the provincial and municipal tiers
119
and that communication between these parties must be improved. At the end of
2009, approximately eighteen months after the presentation by Kotsoane,
Dlabantu argued that the delivery of human settlements had been hampered by
the “lack of coordination . . . between the sector departments” (Parliamentary
Monitoring Group 2009d:2). It is clear from this that the same problems that
were identified in 2008 still persist. The lack of coordination is confirmed by the
Bosberaad Submission document, in which it was stated that micro-coordination
requires that the “silo mentality” be changed (Parliamentary Monitoring Group
2009e:2–3).
3.7 SUMMARY
In this chapter, it was firstly found that informal settlements tend to form in
developing countries, where resources are limited and the poor rapidly move to
urban areas, especially large cities, in search of work. In South Africa, people
living in shacks represent the largest part of the housing backlog, therefore this
number is used as a measure of the number of informal settlement dwellings to
be upgraded or eradicated. Whereas the number of informal settlement
households increased from 1,4 million in 1994 to 2,4 million in 2005, it was
found that the number remained constant at 2,4 million between 2005 and
2009, despite a quoted delivery figure of 2,7 million houses delivered between
1994 and 2009.
Secondly, the discussion revolved around the background to and development
of informal settlements in post-1994 South Africa. Numerous lengthy documents
and acts were found to be relevant. The initiative to upgrade or eradicate
informal settlements came from the 2000 United Nations Millennium
Development Goals, one of the aims of which is to improve the lives of slum
dwellers worldwide by 2020. Government made an initial commitment in 2004 to
upgrade or eradicate all informal settlements within ten years, by 2014 – six

120
years before the MDG target date. This initial target was later changed to the
eradication of informal settlements by 2014. The discussion found that the BNG
plan, which was launched in 2004, was the first step taken by government
towards achieving the Millennium Development Goals. In 2010, there was an
unannounced shift in the government commitment from the eradication of all
informal settlements by 2014 to the upgrading of 500 000 dwellings in well-
located informal settlements, as well the upgrading of bulk infrastructure and
services to these settlements by 2014.
The most recent document to be published, the lengthy 2009 Housing Code,
was published in 2010 and is the first publication containing detailed provisions
of what is presently known as the Upgrading of Informal Settlements
Programme. The discussion then focused on detailed provisions of the
Upgrading of Informal Settlements Programme, a programme found to have
been initiated in terms of Strategies 2 and 3 of the BNG plan, adapted under the
2009 Housing Code. The Programme was found to focus on phased in situ
upgrading of whole areas, identified by the local municipalities for upgrading. It
was found that criteria which households/persons must comply with to secure
rental tenure of a serviced stand or housing unit are very flexible, as envisaged
in Strategy 6 of the BNG plan. Much stricter criteria are applied to secure
subsidised ownership of a stand and even stricter ones for ownership of a
housing unit. The four phases of the Upgrading of Informal Settlements
Programme were found to be very complex, with Phases 1 to 3 involving the
delivery of a serviced stand, and Phase 4 that of a housing unit. Many detailed
procedures are required in each phase – from consulting communities, to finally
dismantling and removing existing shacks once houses have been handed over
to beneficiaries – and preventing the erection of new informal structures
afterwards.
121
The discussion then focused on housing facilitators and funding. It was
established that, over and above the three tiers of government, the Housing
Development Agency would be involved in most projects and the NHBRC would
be involved in all phases of all projects. Pertaining to funding, Phases 1 to 3
would be financed from the Upgrading of Informal Settlements Programme,
whereas beneficiaries qualifying for Phase 4 housing units had to apply to one
of many other national housing programmes for funding. Also, the municipalities
had to secure a minimum of 10% of the total cost of projects, before central
housing funds would be allocated to them, via provincial structures. The
2009/10 subsidy guideline was found to be R30 466 per serviced stand and
approximately R55 706 for a housing unit. The points included in the Upgrading
of Informal Settlements Programme for performance measurement were
illustrated diagrammatically and focus on the impact each project has on the
community.
Next, the discussion moved to other interrelated housing programmes which
could be used for the provision of primary social and economic facilities as part
of the creation of sustainable communities. Lastly, the numerous departmental
factors that are hampering delivery under the Upgrading of Informal Settlements
Programme were identified, organised and combined under eight chosen
headings, with a brief explanation of how they are hampering delivery.
The next chapter will clarify the use of the Balanced Scorecard as a
performance measurement tool in the public sector and do a preliminary
appraisal of whether the BSC or Monitoring and Evaluation is better suited to
addressing the departmental factors hampering delivery under the Upgrading of
Informal Settlements Programme.

122
CHAPTER 4
THE BALANCED SCORECARD AS A PERFORMANCE MEASUREMENT
TOOL FOR THE UPGRADING OF INFORMAL SETTLEMENTS
PROGRAMME
4.1 INTRODUCTION
As a contribution to the critical assessment of the suitability of the Balanced
Scorecard (BSC) as a tool for addressing the factors hampering delivery under
the Upgrading of Informal Settlements Programme, chapter 2 of this study
produced the overall picture of the national framework for the delivery of
subsidised housing in South Africa. This was followed by chapter 3, which
investigated various aspects surrounding the upgrading of informal settlements,
ending with a discussion of eight departmental factors hampering delivery under
the Upgrading of Informal Settlements Programme.
In this chapter, traditional and recent performance measurement systems are
clarified in the context of the change in the business environment. The
background to and development of the BSC are then outlined. A discussion of
why the BSC is used for performance measurement in both the private and
public sectors is provided and the various terms used in the discussion are
defined. An explanation of the BSC concept and framework, which were initially
developed for performance measurement in the private sector are also given.
The manner in which the BSC has been adapted for use in the public sector is
described. This is followed by a discussion of the four BSC perspectives
adapted for public sector use. The process suggested for translating the
mission and strategy of a public sector entity into objectives and measures, via
the BSC, is explained; this includes a discussion of the interrelationship
between the four perspectives. The chapter concludes with a preliminary
123
appraisal of the suitability of the BSC versus the present Monitoring and
Evaluation for addressing the collective departmental factors hampering
delivery under the Upgrading of Informal Settlements Programme.
The general discussion in this chapter commences with an analysis of the
situation in the private sector and then proceeds to identify aspects or
developments pertaining to the public sector. This is because performance
measurement and the BSC were initially developed for challenges faced by the
private sector, but when the non-profit and public sectors were faced with
similar challenges, the BSC was adapted for their use. During the adaptation
process, basic common ground remained between the private sector and public
sector applications and therefore both are discussed.
4.2 CHANGES IN PERFORMANCE MEASUREMENT SYSTEMS
The focus of this study is on the BSC as a performance measurement tool, not
on the broader discipline of performance measurement. The discussion in this
section will therefore focus on the changes in the business environment which
triggered the change from traditional performance measurement systems to
more recent systems. Paragraphs 1.2 and 1.4 substantiated why the BSC was
chosen for this study and limited the study to the BSC as a performance
measurement tool. For this reason other recent performance measurement
systems will not be discussed. The shortcomings of traditional performance
measurement because of changes in the business environment and the
characteristics of recent performance measurement systems will, however, be
discussed.
In 1991, Eccles (1991:131) predicted that within five years every company
would have to redesign the way it measures its business performance. He
based the prediction on observations that executives were reconsidering how to

124
measure performance in their businesses after realising that changes in
competition and strategies required new performance measurement systems.
Before the 1990s, most of the performance measurement innovations originated
from attempts by practitioners to close the performance gap created by the
changing needs of managers in response to changes in the business
environment (Srimai, Radford & Wright 2011:662, 664, 676). The 1991
prediction by Eccles (1991:131) came true, because between 1994 and 1996,
an astounding 3 615 articles on performance measurement were published and
listed on the ABI Inform Database (Neely 1999:207).
Academics and business managers from different disciplines continue to
publish articles on performance measurement (Paranjape, Rossiter & Pantano
2006:11) in which accountants, business strategists, human resource managers
and marketers are mentioned (Neely 1999:224–225). In a more recent
publication, strategy management, operations management, human resources,
organisational behaviour, information systems, marketing and management
accounting and control are identified as contributing to research in the field of
performance measurement (Franco-Santos, Kennerley, Micheli, Martinez,
Mason, Marr, Gray & Neely 2007:784). Academics in different disciplines base
their research on the frameworks familiar to them. Therefore the approaches
they follow differ and they also tend to confine themselves to references from
authors within their own discipline (Neely 1999:225). Researchers from the
different disciplines have not even been able to agree on a definition for
performance measurement which limits generalisability and comparability of
research in this area (Franco-Santos et al. 2007:785). From an accounting
perspective, the focus on performance measurement is seen as an admission
that financial information is no longer sufficient for management and control
purposes (Amaratunga, Baldry & Sarshar 2001:179). While business
performance measurement was referred to above, a survey showed that
125
performance measurement in the non-profit sector was consistently rated as
one of the top three concerns (Kaplan 2001:357).
4.2.1 Changes in the business environment
Kaplan and Norton (1996b:2) say that the industrial age extended from 1850 to
1975 and has been followed by the information age. During the industrial age,
competition was limited, one reason being that many industries were protected
by government regulations. Companies that used new technology for the
efficient mass production of standard products, while effectively managing
financial assets and liabilities, were successful. During that period, financial
control systems were developed to allocate and monitor efficient allocations of
financial and physical capital (Kaplan & Norton 1996b:2–3).
Smith (2007:2–5) expresses agreement with Kaplan and Norton (1996b:2–3)
and expands at length on the business environment of the 1970s. At the time,
employees were not mobile, but tended to spend entire careers working for the
same organisation. Process knowledge was not documented, but was
transferred from one employee to his or her successors. The managers in
senior positions had spent a considerable amount of time working their way up
the ranks to reach those positions and therefore they relied on their extensive
experience to deal with process difficulties as these emerged. Employees only
had knowledge of their direct area of responsibility and were rewarded on how
well they performed in their own specific area. Communication across sections
was not essential, resulting in silos being created, where one section had no
idea what impact their actions were having on other sections – or on the
organisation. The BSC which was subsequently developed by Kaplan and
Norton called for a balance between silo and organisation-wide measures (Nair
2004:17–19; Niven 2003:8).

126
In the information age which originated around 1975 and has continued to date,
the emphasis has shifted from an organisation using tangible assets for
competitive success to the ability of an organisation to mobilise and manage its
intangible assets (Kaplan & Norton 1996b:2–3; Nair 2004:18). Nair (2004:18) is
concerned that tangible assets are being measured in traditional financial
statements – but that the future of the organisation is sustained by the
intangible assets which presently account for 85% of the assets. Kaplan and
Norton (1996b:2–3) contend that the mobilisation and management of intangible
assets empower an organisation to develop customer relationships that retain
loyalty; introduce new products and services; produce high quality, customised
products at low cost with short lead times; mobilise employee skills and
motivation to continuously improve processes, quality and response time; and
utilise information technology, databases and systems.
In 1978, the late leader of China (The Economist 2008:1), Deng Xiaoping,
stated that China’s closed-door policy to the West was being reversed (Lusk,
Halperin & Zhang 2006:101). Multinational corporations could not resist the
urge to invest in China, with its enormous pool of highly skilled labour available
at a low cost. Multinational corporations clambered to be the first to invest in
China, with all companies having to reconsider global cost competition (Lusk et
al. 2006:101). This explains why a new global competitive environment
emerged in the 1980s with new key competitive variables such as product
quality, delivery, after-sales service and customer satisfaction (Drury 2008:576).
In the 1990s, the development of the internet set the scene for another change
in the business environment, the emergence of “dot-com” companies (Lusk et
al. 2006:101). A dot-com company is defined as one whose operations are
primarily or even entirely internet-based, a company which would not be able to
operate without the existence of the internet (InvestorWords.com 2012:1). At
the time, dot-com companies were characterised by a limited asset base, no
127
foreseeable profit prospects and negative cash flows, yet the possibility of high
returns lured the usually conservative investment bankers into investing in them
(Lusk et al. 2006:101). While the bankers recognised the risks, they also
realised that the share prices would rise and they could not afford to lose out, so
they invested. This set a process in motion where the “dot-coms” attracted so
much investment capital that the results of other companies were being
manipulated to compete for capital in the rising market (Lusk et al. 2006:101).
The trading operations of Enron, the seventh largest company in the United
States in 2000 and the company named by Fortune magazine for six
consecutive years from 1996 to 2001 as “America’s Most Innovative Company”,
relied heavily on complicated transactions (BBC News 2006:3). Cunningham
and Harris (2006:29, 31) argue that as Enron grew, the focus for many top
executives was not on selling goods and services, but on managing the
earnings and the reported cash flow, which gave rise to a situation where
outsiders were being misled and the financial situation was being
misrepresented. Enron was started in 1985, after the merger of two companies
which sold and transported natural gas. As Enron grew, it began to trade in gas
commodities, contracting to sell gas at a future date at an agreed price and
hedging the transaction by contracting to purchase gas at the same future date.
Enron’s assets shifted from pipelines (fixed assets) to contractual rights
(intangible assets). The trading in gas commodities soon expanded to trading in
electricity, internet broadband and other goods and services in transactions
which became more and more complicated. After a letter from an employee to
the CEO in which it was claimed that the financial reporting had become too
misleading and that action needed to be taken, Enron and its auditors, Arthur
Andersen, announced in October 2001 that Enron’s financial results in previous
years would be restated to show lower profits and a less favourable financial
position. After the restated results were released, the share price declined and
Enron filed for bankruptcy (Cunningham & Harris 2006:31–32, 34). After the

128
Enron disclosure, government and the legal and financial worlds stepped in to
tighten regulations to restore confidence in the markets (Lusk et al. 2006:101).
Smith (2007:8) adds that since the beginning of the 21st century, global
competition has become the norm. Murphy (2003:4) says that
internationalisation and globalisation have made the physical location of a
business irrelevant. Smith (2007:8–12) observes that mergers and acquisitions
have resulted in fewer, larger, and better capitalised companies. New
technology like cellular telephones and the internet is being used to access
customers – even globally – at minimum cost. Customers have become less
loyal to brands and have ever-increasing expectations, placing pressure on
organisations to do everything faster, better and more cheaply. Technology has
also resulted in the workforce becoming more mobile, so many members of
staff are no longer working from the office, but from remote locations. In addition
to mobility within organisations, the mobility of all levels of employees between
organisations has increased to the point where job-hopping has become the
norm and staying in one company is seen as a sign of stagnation. As a result of
this, the knowledge and experience of existing staff can no longer be relied on
as before, and it has therefore become crucial that all processes should be
documented and followed, to ensure consistency with an ever-changing
workforce and management team (Smith 2007:8–12). Rapid technological
changes, global expansion and worldwide economic uncertainty highlight the
unique role of people in the organisation (Whitaker & Wilson 2007:59), Smith
(2007:1) also says that in the past organisations identified and corrected
process weaknesses, whereas in today’s marketplace they must be able to
leverage process strengths for strategic advantage.
When compared with organisations in the private sector, public sector
organisations tend to show less awareness of the changing environments
(Srimai, Damsaman & Bangchokdee 2011:60). Constituents and donors are

129
better informed than ever before and they are demanding accountability and
transparency (Niven 2003:4). A global public management reform movement
known as the “new public management” (NPM) is developing, focused on
instilling private sector financial practices into public decision-making (Jones &
Kettl 2003:2–3). While there are critics, NPM practices in financial management
and accounting are well-established and have been proven to be successful
(Jones & Kettl 2003:2–3, 14). Non-profit organisations are facing increased
competition because more institutions are competing for scarce donor and
government funding (Kaplan 2001:353). Chan (2004:204) posits that slow
economic growth and reduced federal funding have resulted in local
governments in the United States of America having limited resources for years.
In addition to having limited resources, taxpayers and the provincial and state
governments are demanding greater accountability and results for their tax
dollars. As a result, municipal administrators are adopting management tools
from the private sector – and operating more like a business than ever before
(Chan 2004:204).
4.2.2 Criticism of traditional performance measurement
Traditional performance measures focus on financial measures – mainly on
profit – and then on costs and revenues as they result in the profit (Correia,
Langfield-Smith, Thorne & Hilton 2008:662). Kaplan and Norton (1996b:6–7)
express disappointment that a financial reporting process that is anchored to an
accounting model developed centuries ago is being used by modern
organisations which are operating in the information age. Olve, Roy and Wetter
(2000:12–13) concur, adding that traditional management control has not
changed since 1925, while industry has undergone massive technological
changes since World War II. Drury (2008:576) argues that traditional
management accounting performance measurement systems have not taken
the new global competitive environment that emerged in the 1980s into account.

130
Traditional measurement ignores people, innovation, leadership and service
excellence, core elements of a competitive advantage (Whitaker & Wilson
2007:59). The profit measurement process is seen as an imperfect measure of
corporate performance because it was not designed to be used to measure the
performance of the entire business (Curtis 1985:59, 62). Financial results are
lagging metrics; they are the results of past decisions which are too old to use
for operational purposes (Ghalayini & Noble 1996:65) and are not suitable for
decision-making purposes (Weinstein 2009:46). The traditional practice of
directing close attention to financial measures is progressively being faulted
because of major changes in the environment in which organisations operate
(Olve et al. 2000:12–13). Another criticism of conventional performance
measurement systems is that systems based essentially on financial
performance measures are not sufficiently focused and vigorous for internal
management and control (Atkinson, Waterhouse & Wells 1997:25). According
to Meyer (2002:xi–xii), until recently organisations could use profit to measure
performance, but that simplicity no longer exists. Meyer (2002:xi–xii) says that
Enron was earning pre-tax profits of $1,5 billion from the third quarter of 2000 to
the third quarter of 2001, but filed for bankruptcy in the fourth quarter of 2001,
which clearly indicates that performance measurement has become complex
and is no longer simply about measuring profit. The realisation that a largely
financially based performance measurement system undercut its strategy
served as a catalyst for change (Eccles 1991:131).
Traditional performance measurement based on financial measures is not
always suitable for non-profit organisations, because the emphasis usually falls
on social factors and costs rather than on profit (Correia et al. 2008:664). This
opinion applies equally to the public sector. Niven (2003:31) posits that,
traditionally, non-profit organisations have been misdirected in focusing their
attention on reporting the proportion of funds being spent on administration.
This practice evolved because large donors do not tolerate funds being used for
131
administration, rather than the main purpose they were intended for. Niven
(2003:31) quotes Jeffrey Bradagh, a consultant to non-profit organisations, as
saying that: “Generally, they (nonprofits) are vastly undercapitalised,
understaffed, and poorly managed ... There’s little, if any investment in
organizational infrastructure or staff development. Compared to the for-profit
sector, the non-profit world is back in the late 1970s and early 1980s ... It’s only
beginning to understand that if you want good outcomes, you have to invest in
building strong organisations.” Ironically, governments were the first to identify
and respond to the shortcomings of the financial measurement system,
investing substantial amounts in performance measurement systems in the
hope of improving on decision-making and efficiency (Atkinson et al. 1997:26).
4.2.3 Recent performance measurement systems
The origin of the recent performance measurement systems could most likely
be traced back to the 1980s, when many managers started realising that
financial measures were failing to provide long-term strategic guidance, and that
reporting on various aspects of a business was essential to remain competitive
(Olve et al. 2000:13; Smith 2007:6–8). Various performance measurement
innovations have sprung from the shortcomings of profit-based performance
measurement, ranging from improved financial metrics such as economic value
measures to BSCs which integrate financial and non-financial measures (Ittner
& Larcker 1998:205). The shift from financial figures to a broader set of
measures was viewed as a “radical decision”, part of a performance
measurement “revolution” (Eccles 1991:131).
Recent Strategic Management Accounting developments have emphasised the
role of Management Accounting in supporting the overall competitive strategy of
an organisation. Before the BSC was conceived, various performance
measures were available, but they were of an ad hoc nature and did not

132
integrate financial and non-financial measures (Drury 2008:576). Examples of
new concepts and tools which emerged are Kaizen Costing, Total Quality
Management (TQM) and Business Process Redesign (BPR) (Olve et al.
2000:13). Kaizen implies small, continuous improvements as a result of
constant efforts, rather than major improvement programmes (Davies & Boczko
2005:348). TQM became popular as it relied on good processes to reduce costs
and a greater focus on BPR focuses on the complete redesign of business
processes to improve critical performance areas such as costs, quality and
delivery. Common processes in BPR include acquiring customer orders and
customers and worker involvement in improving processes and output (Smith
2007:6–8) developing both human resources and new products (Correia et al.
2008:715).
Nonfinancial performance indicators provide more timely information which is
less susceptible to manipulation and interpretation than financial performance
indicators (Davies & Boczko 2005:355). Many organisations recently began
using nonfinancial performance measures as they found that staff performance
improved because they were being measured on criteria that are within their
control, rather than on profit, which they are not able to identify with (Weil &
Maher 2005:657–658; Garrison, Noreen & Seal 2003:696–697). There is a gap
between what we would like to measure and what we can measure, largely due
to the multiplicity of present-day organisations (Meyer 2002:xii). It is human
nature to exploit this predicament by delivering what can be measured, rather
than the performance sought, but which cannot be measured (Meyer 2002:xii).
The difference in approaches between Weil and Maher and Garrison et al.
appear to lie in the fact that Meyer (2002:81) links performance measurement
directly to monetary compensation for performance whereas Kaplan and Norton
(1996a:81) caution on using performance measures for financial compensation
before certain challenges have been addressed.
133
Weil and Maher (2005:658) identify the following two parts to recent
performance measurement systems:
The attention of all employees is drawn to the objectives of the organisation
and their contribution to the objectives, either individually, or as part of a
unit.
The degree to which each level in the organisation can affect results
becomes visible.
Smith (2007:1) is of the opinion that process performance has become the most
critical driver of organisational success. Niven (2006:xii) argues, however, that
intangible assets such as employee knowledge, customer/supplier relationships
and innovative cultures are the present drivers of economic success. Niven
(2003:9) states that the change in value creation from physical to intangible
assets demands more from measurement systems, which must be equipped to
“identify, describe, monitor and provide feedback on the intangible assets
driving organisational success”. He believes that for this reason large numbers
of organisations are turning to the BSC to measure and manage intangible
assets.
In the past 30 years criticisms of government performance have been levelled
from all over the world – and all parts of the political spectrum (Jones & Kettl
2003:1). Government performance has been seen to be failing to meet
expectations. Some of the criticisms levelled against governments include
accusations that they are inefficient, ineffective, self-serving, unresponsive to
public wants and needs and failing in the provision of the quality and the
quantity of services deserved by the taxpaying public (Jones & Kettl 2003:1).
The calls for greater accountability and transparency are being seen as a
request for performance measurement and reporting – to ease fiscal stress
(Halachmi 2005:502–503). Despite government investments in performance
measurement systems, limited results are evident (Atkinson et al. 1997:26). The
134
conclusion has been reached that government performance measurement
systems have lacked strategic focus and have been measuring too many things
– and the wrong things at that (Atkinson et al. 1997:26).
4.3 BACKGROUND TO AND DEVELOPMENT OF THE BSC
The changes in the business environment which were discussed in paragraph
4.2.1 serve as part of the background to the development of the BSC. Even
though many scholars have offered opinions on the BSC since the initial
development, Kaplan and Norton developed the initial BSC, continued
publishing changes as the BSC evolved and are still deemed to be the
authorities on the BSC. Because of this, the discussion in this paragraph will
focus on Kaplan and Norton’s publications, while the opinions of other scholars
will be included in the remainder of the chapter. The discussion in this section
will be brief because the concepts are dealt with in the discussion which follows.
The Nolan Norton Institute, the research arm of KPMG, sponsored a one-year
multicompany study in 1990, entitled “Measuring Performance in the
Organization of the Future”. The study was led by David Norton, the CEO of the
Nolan Norton Institute. Robert Kaplan was an academic consultant and there
were representatives from twelve companies (Kaplan & Norton 1996b:vii) at the
cutting edge of performance measurement (Kaplan & Norton 1992:71). The
motivation for the study was the belief that performance measurement systems
relying only on financial measures were obsolete and were limiting opportunities
to create future economic value (Kaplan & Norton 1996b:vii).
The first innovative performance measurement system examined by the
participants was the “Corporate Scorecard” used by Analog Devices. The
Corporate Scorecard used traditional financial measures, as well as customer
delivery times, quality and cycle times of manufacturing and effectiveness of

135
new product development as performance measures. The multidimensional
nature of the scorecard appealed to the participants and after other measures
had been added, the findings of the study were published in the Harvard
Business Review (January–February 1992), under the title “The Balanced
Scorecard – measures that drive performance” (Kaplan & Norton 1996b:vii–viii).
In this article, Kaplan and Norton (1992:72) compared the complexity of
managing an organisation to the task of navigating and flying an airplane. When
flying an airplane, pilots need various instruments to provide them with
information on the environment, bearing, altitude, destination, air speed and
fuel. If pilots relied on only one of these instruments, the outcome would be
fatal. The same principle applies to organisations where managers rely on only
one instrument to gauge performance. It was therefore argued that performance
should be viewed from several perspectives simultaneously (Kaplan & Norton
1992:72). The first version of the BSC (Kaplan & Norton 1992:72) included four
perspectives, where each perspective posed a question, the answer to which
was a goal that was translated into a performance measure. All four
perspectives were linked to each other. The four perspectives and questions
were:
Financial (How do we look to our shareholders?)
Customer (How do customers see us?)
Internal business (What must we excel at?)
Innovation and learning perspectives (Can we continue to improve and
create value?) (Kaplan & Norton 1992:72).
After the publication of the 1992 article, many senior executives requested
Kaplan and Norton to help them to implement Balanced Scorecards in their
organisations (Kaplan & Norton 1996b:viii). During the implementation of the
first version of the BSC, many developments took place, the first of which was
the realisation of the importance of linking the measures in the BSC to the
strategy of the organisation (Kaplan & Norton 1992:79). While this concept

136
appears obvious, at the time, most companies were attempting to improve the
performance of existing processes – by improving quality, lowering cost and
shortening response times – but were not determining which processes were
strategic. Strategic processes have to be performed exceptionally well for the
organisation to succeed (Kaplan & Norton 1996b:viii–ix). Further BSC
implementations showed that the BSC represented a fundamental change in
the underlying assumptions about performance measurement. Previously, as
was typical of traditional performance measurement systems, control of
employee behaviour was central, a practice also in line with Industrial Age
thinking. With the BSC, strategy is central, goals are established from this and
employees decide what actions are necessary to achieve these goals. The
focus is therefore the achievement of strategy rather than control (Kaplan &
Norton 1992:79).
In 1993, an article which highlighted the importance of choosing strategic
measures entitled “Putting the Balanced Scorecard to work” was published in
the Harvard Business Review (September–October 1993) (Kaplan & Norton
1996b:viii–ix). The article provides corporate examples which illustrate how the
BSC uniquely combines management and measurement (Kaplan & Norton
1993:135–142) and also includes comments from managers on challenges and
triumphs experienced with BSC implementation in their specific organisations.
In this article, the BSC is found to be most successful as a means of driving
change in an organisation (Kaplan & Norton 1993:135–142).
Further advice and applications led to the BSC evolving from an improved
measurement system to a core management system. These developments
were summarised in a third article entitled “Using the Balanced Scorecard as a
strategic management system”, which was published in the January–February
1996 edition of the Harvard Business Review (Kaplan & Norton 1996b:ix). In the
article, the vision and strategy have been inserted into the centre of the BSC
137
illustration and linked to the four BSC perspectives (Kaplan & Norton 1996a:76),
as illustrated in figure 4.6 of this study. Further, the article introduces four
management processes that contribute to linking long-term strategic objectives
with short-term actions. The four processes are shown in a circular movement,
indicative of a continual process. The first process – translating the vision –
involves managers’ finding consensus around the vision and strategy of the
organisation. The second process – communicating and linking – requires
managers to communicate the strategy up and down in the organisation by
linking the strategy to departmental and individual objectives. The third process
– business planning – allows companies to integrate their business and
financial plans. The fourth process – feedback and learning – provides the
opportunity for companies to learn from the whole process, which is referred to
as strategic learning (Kaplan & Norton 1996a:75–77). The BSC creation
process is identified as integrating the strategic planning and budgeting
processes, ensuring that budgets support strategy (Kaplan & Norton 1996a:82).
Kaplan and Norton published the fourth and fifth articles in 1996. Because the
publication of these articles followed on the publication of the 1996 book, The
balanced scorecard: translating strategy into action (Kaplan & Norton
1996c:53), only a brief discussion will be included here, the remainder being
discussed in paragraphs 4.4 and 4.6. The fourth article, entitled “Linking the
Balanced Scorecard to strategy”, was published in the Fall 1996 edition of the
California Management Review. In this article, it is stressed that a mixture of
financial and non-financial measures is not a BSC. For a measurement system
to qualify as a BSC, the financial and non-financial measures must be derived
from the specific strategic objectives and developed through the cause-and-
effect relationship between the four perspectives (Kaplan & Norton 1996c:55,
64).

138
The fifth article, entitled “Strategic learning and the balanced scorecard”, was
published in the September–October edition of Leadership (Kaplan & Norton
1996d:18). In the article, the feedback and learning aspect, the fourth process
introduced in the third article is discussed in more depth, and it is concluded
that this is the most important part of the BSC (Kaplan & Norton 1996d:24). The
article points out that the execution of strategy in today’s turbulent business
environment is no easy feat. Because the external conditions are constantly
changing, the present strategy must continually be questioned to assess
suitability for the changed circumstances, referred to as double-loop learning
(Kaplan & Norton 1996d:19, 23).
The next development in the application of the BSC took place with the
publication of Kaplan and Norton’s 2001 book, The strategy-focused
organisation. The book is divided into five parts as follows: translating the
strategy into operational terms; aligning the organisation to create synergies;
making strategy everyone’s everyday job; making strategy a continual process;
and mobilising change through executive leadership (Kaplan & Norton 2001a:v–
vi). The publication of the sixth and seventh articles entitled “Transforming the
balanced scorecard from performance measurement to strategic management”,
distinguished as “Part I” and “Part II”, followed in the March 2001 and June
2001 editions of Accounting Horizons (Kaplan & Norton 2001b:87–104;
2001c:147–160). The Part II article follows the same sequence as the five
sections of the book, showing how the BSC can be used by management to
align the key management systems and processes to the strategy (Kaplan &
Norton 2001c:147). The Part I article documents the role of strategy maps in the
BSC alignment process (Kaplan & Norton 2001b:87–94). The article also
introduces the application of the BSC to nonprofits (NPOs) and government
organisations, suggesting that the BSC be adapted for public sector use
(Kaplan & Norton 2001b:97–99, 100–101). Lastly, the concept of integrating the
performance measures into a strategic management system is introduced
139
(Kaplan & Norton 2001b:99, 102). The publication of the third book, namely,
Strategy maps: converting intangible assets into tangible outcomes, followed in
2003. This book focuses on how to translate strategy into operational-level
objectives (Kaplan & Norton 2006:vii–viii). The fourth book, Alignment: using the
balanced scorecard to create corporate synergies, was published in 2006 and is
devoted to aligning the organisation to the strategy (Kaplan & Norton 2006:vii–
viii).
Credit must go to Prof Robert Kaplan and David Norton for the astounding
number of companies that have adopted the BSC in a relatively short time (Nair
2004:xi). Other analytic applications like activity-based cost/management
(ABC/M), budgeting, planning, customer relationship management (CRM) and
supply-chain management (SCM) have taken years along the “normal paths of
recognition and adoption” before being used extensively. A Bain & Co study in
2004 showed that more than 50% of Fortune 1000 companies and 40% of
companies in Europe were using some form of the BSC (Nair 2004:4). Two
years later, estimates suggested that 60% of Fortune 1000 companies had a
BSC in place and 96% of the global companies surveyed by the Hackett Group
either had or planned to implement a BSC (Niven 2006:2).
Whereas the preceding discussion involved the background to and
development of the private sector BSC, in the discussion which follows the
emphasis is on the public sector BSC. As early as 2000, Brown (2000:v) argues
that the measurement of performance and the BSC is not limited to the private
sector, but has spread to government. As mentioned above, Kaplan and Norton
suggested adapting the private sector BSC for governmental organisations
(Kaplan & Norton 2001b:97–98, 101). The adapted BSC had the mission at the
top, with the perspectives of cost, value/benefit of services and support from
taxpayers flowing into the mission. The learning and growth perspective was at
the bottom of the BSC, flowing into the internal processes perspective, which in
140
turn flows into the other three proposed perspectives (Kaplan & Norton
2001b:101). When President Bill Clinton assumed office in 1993, he made it a
priority to transform the way government was managed (Niven 2003:28).
President Clinton envisaged a government focusing on what was being
accomplished, rather than on what was being spent, thereby improving
government performance. President Clinton appointed Vice-President Al Gore
to head a team for a six-month study on what had to be done to improve
government performance. The subsequent report Creating a government that
works better and costs less, led to the development of a National Partnership
for Reinventing Government and culminated in the passing of the Government
Performance Results Act (GPRA) in August 1993 (Niven 2003:28). Whittaker
(2001:1–3) concurs that the GPRA of 1993 changed the approach and thinking
in the federal government of the United States of America and he argues that
the GPRA set the scene for the implementation of the BSC in the public sector.
Estis (1998:3) proposed a public sector BSC which replaced the internal
perspective with a mission perspective, asking the question: “Are we
accomplishing our mission?” A further development took place when Kaplan
(2001:357–358) launched a research study in 1996 with the intention of
determining the applicability of the BSC through implementation in selected
non-profit organisations. This implementation of the BSC produced a BSC that
was adapted for the non-profit sector, with the mission and customer
perspective elevated above the financial perspective (Kaplan 2001:361). There
are many examples that illustrate the successful implementation of the BSC in
the public sector with the City of Charlotte in North Carolina widely considered
to be the best example of the application of the BSC in the public sector (Niven
2003:271). In fact, Niven (2003:271–285) devotes a whole chapter to the BSC
success story in the City of Charlotte. The first BSC was applied there in 1996
and it has been refined and adapted since then to maximise the benefits of the
BSC as a measurement system, strategic management system and

141
communication tool. Whittaker (2001:vii–viii) devotes approximately 200 pages
to the application of the BSC in eleven entities in the public sector, including the
Federal Aviation Administration and Logistics Centre, the Internal Revenue
Service, the Department of Energy and the Department of Transportation. The
Balanced Scorecard hall of fame report 2005 (2005:4; 17–18; 33–34 & 35–36;
39–40) includes one Australian, one Canadian and two U.S. public sector
entities that have not merely applied the BSC but serve as an example in that
they successfully use their BSCs to execute their strategy. They are: Western
Water in Australia, the Royal Canadian Mounted Police, the US Economic
Development Administration of the US Department of Commerce and the Texas
State Auditor’s Office. The City of Frankfurt and the City of Stuttgart use the
BSC as a steering instrument and all products are defined in terms of the BSC
perspectives (Greiling 2005:560).
4.4 WHY THE BSC FOR PERFORMANCE MEASUREMENT?
4.4.1 Arguments in favour of using the BSC
Just as large ships chart their position before commencing a voyage,
organisations should measure their present position before determining their
future direction (Nair 2004:2). Kaplan and Norton (1996b:21) argue that an
organisation’s measurement system greatly affects the actions of people inside
and outside the organisation. They go as far as to say: “If you can’t measure it,
you can’t manage it.” Business performance measurement is a basic
management technique; it would therefore be expected that most organisations
would have an established performance measurement system by now (Neely
1999:206). However, performance measurement and management are
generally problematic, with 80% of organisations surveyed reporting that they
had made changes to their performance management system during the past
three years, 33% of which were major overhauls (Niven 2003:38). Meyer
142
(2002:1) quotes an article in a 1995 edition of the Chief Financial Officer as
follows: “According to a recent survey, 80 percent of large American companies
want to change their performance measurement systems ...” Results of a 1996
survey by Towers Perrin, a consulting firm, show that 64% of the respondents
were more satisfied with or gained more value from the BSC than from other
performance measurement approaches (Ittner & Larcker 1998:221, 223).
Before focusing on the BSC, it is necessary to consider the following insight on
the role of performance measurement by Amaratunga et al. (2001:179):
One of the hallmarks of leading-edge organisations – be they public or
private – has been the successful application of performance measurement
to gain insight into, and make judgements about the organisation, and the
effectiveness and efficiency of its programmes, processes and people.
The BSC succeeds very well in establishing a realistic norm and a standard
approach to strategic performance measurement (Srimai, Radford & Wright
2011:668–669). The BSC adds value because it provides relevant and
balanced information for managers in a concise way (Mooraj et al. 1999:481).
Niven (2003:4–5) identifies the following three factors that have fanned the
need for improved performance reporting and management and for the BSC:
Recent corporate accounting scandals like Enron (discussed in paragraph
4.2.1).
Long-term reliance on financial measures as the gauge of success
(discussed in paragraph 4.2.2).
The inability of many organisations to execute their strategy, which Nair
(2004:6–7) concurs with, and which is discussed later in this paragraph.
Drury (2008:576) is of the opinion that the BSC concept was conceived from the
need for an integrated framework which could clarify, communicate and
manage the implementation of the strategies of the organisation. Kaplan and

143
Norton (1996:7) argue that the BSC came into being because of the conflict
between the need to build long-term competitive capabilities and the entrenched
“historical-cost financial accounting model”. While the historical financial
measures were sufficient for industrial-age organisations, the information age
calls for measures that create future value. According to Kaplan and Norton
(1996b:8), the beauty of the BSC is that it retains financial measures of past
performance, but adds measures which create future value. Through the
application of the BSC, a complete framework is created where all aspects are
integrated. This leads executives of information-age organisations to measure:
how value is created for current and future customers, how they should
enhance internal capabilities and how to invest in employees, processes,
technology and innovation. This could improve future organisational
performance towards attaining the mission and meeting the strategic goals of
the organisation (Kaplan & Norton 1996b:8).
While many people think of measurement as a tool to control behaviour, the
measures on the BSC are being used to express and communicate the strategy
of the organisation and then to align individual, cross-departmental and
organisational initiatives to achieve a common goal (Kaplan & Norton
1996c:56). Some scholars suggest that an organisation should base its
performance measures on its responsibilities, goals and strategies (Weil &
Maher 2005:664). Others scholars argue that in the information age it is
essential that the mission, strategies and capabilities are used as the basis for
the measurement systems of organisations where all aspects need to be
measured and not just financial measures (Kaplan & Norton 1996b:21). The
BSC meets this need as it links measures from various perspectives covering
the financial and more general measures such as customers, employees and
internal processes and systems (Kaplan & Norton 1996b:25). While the
importance of linking performance measurement to strategic planning has been
well documented, no tools of this nature existed previously, but the BSC is a

144
formally documented strategic performance measurement model (Atkinson et
al. 1997:26). The BSC is able to measure the present position of the
organisation and provide balanced action plans which cover the main financial
and nonfinancial drivers that give direction in both good and poor economic
times (Nair 2004:2–5). The flexibility of the BSC is illustrated by its ability to
evolve (Bible et al. 2006:23).
Strategic planning exercises often promote the alignment of the vision, mission,
core values and strategy (Nair 2004:5–6). Analysis of strengths, weaknesses,
opportunities and threats, generally known as SWOT analysis, is also done.
SWOT analysis is generally used by organisations to ensure that all elements
are incorporated into the strategic plan (Nair 2004:5–6). Many organisations are
experiencing problems, not with strategy formulation, but rather with strategy
execution (Kaplan & Norton 2001a:viii).
Non-profit and government organisations experience problems in defining their
strategy, sometimes producing “strategy” documents of up to 50 pages which
do not even state the outcomes they are trying to achieve (Kaplan & Norton
2001b:97–98). Instead, these documents tend to list programmes and initiatives
(Kaplan & Norton 2001b:98). Non-profit and government organisations are
especially at risk of having a strategy that is too broad. They also need to
decide what they are not going to do (Kaplan & Norton 2001b:98).
Nair (2004:6) argues that a major challenge arises when senior management
wish to drive new strategies in an organisation which is operating in a certain
manner, making the greatest challenge that of bridging the gap between
strategy and the execution of strategy (Nair 2004:7). This is confirmed by the
Balanced Scorecard hall of fame report 2005 (2005:2), which emphasises that
having a good strategy will not result in success – good execution of the
strategy is crucial to success. In a survey done to ascertain whether the BSC
145
adds value to companies and if so, how it contributes to organisational
performance, responses were received from 76 business unit managers from
24 different organisations who had attended BSC conferences in Zurich,
Lausanne, London and Brussels in 1999/2000 (De Geuser, Mooraj & Oyon
2009:93, 102). The results indicate that the BSC improves the integration of
management processes, empowers people and has a positive impact on
organisational performance. Performance derived from the use of the BSC had
the following benefits: firstly, improved translation of the strategy into
operational terms, secondly, strategising became a continual process and
thirdly, units experienced improved alignment between “processes, services,
competencies and units of an organisation” (De Geuser et al. 2009:93, 102). By
translating the vision and strategy of an organisation into operational terms, the
BSC communicates the strategic intent and inspires performance against set
goals (Ittner & Larcker 1998:217). In the application of the BSC in a local
government setting in Italy, the use of the BSC improved the ability of managers
and other employees to focus on strategy and targets, resulting in improved
service to citizens (Farnetti & Guthrie 2008:8). The BSC provides an operational
framework for aligning strategies with operational level actions, thereby bridging
the gap between strategy and execution of strategy, as is illustrated in figure
4.1.

146
Figure 4.1 Where the BSC fits in
Source: Nair 2004:5.
It is clear from figure 4.1 that the BSC can align objectives, measures, targets
and initiatives to the strategies. The BSC can therefore solve the problem of
misalignment between the strategy that top management believe is being
executed and the actions being performed at various levels in the organisation
(Niven 2003:38–39; Nair 2004:10–11). A 2000/01 study of the major companies
traded on the stock exchanges of Germany, Austria and Switzerland showed
that the greatest benefit experienced from using the BSC was the improvement
of the alignment of strategic objectives with the actual actions of staff
(Speckbacher, Bischof & Pfeiffer 2003:362). Aligning current operations to
strategic goals is key to the long-term success of organisations (Weinstein
2009:46) and is also being used for that purpose in the public sector in
Singapore (Kon 2005:51). Nair (2004:6–7) identifies two forms of what he terms
“strategic paradox” in strategy formulation and execution, namely:
Mistakenly believing that strategy results in operational effectiveness.
-
Purpose
Strategic themes
Competencies
Mission, vision, values
Balanced Scorecard
GAP?
-
Objectives
Measures
Targets
Initiatives
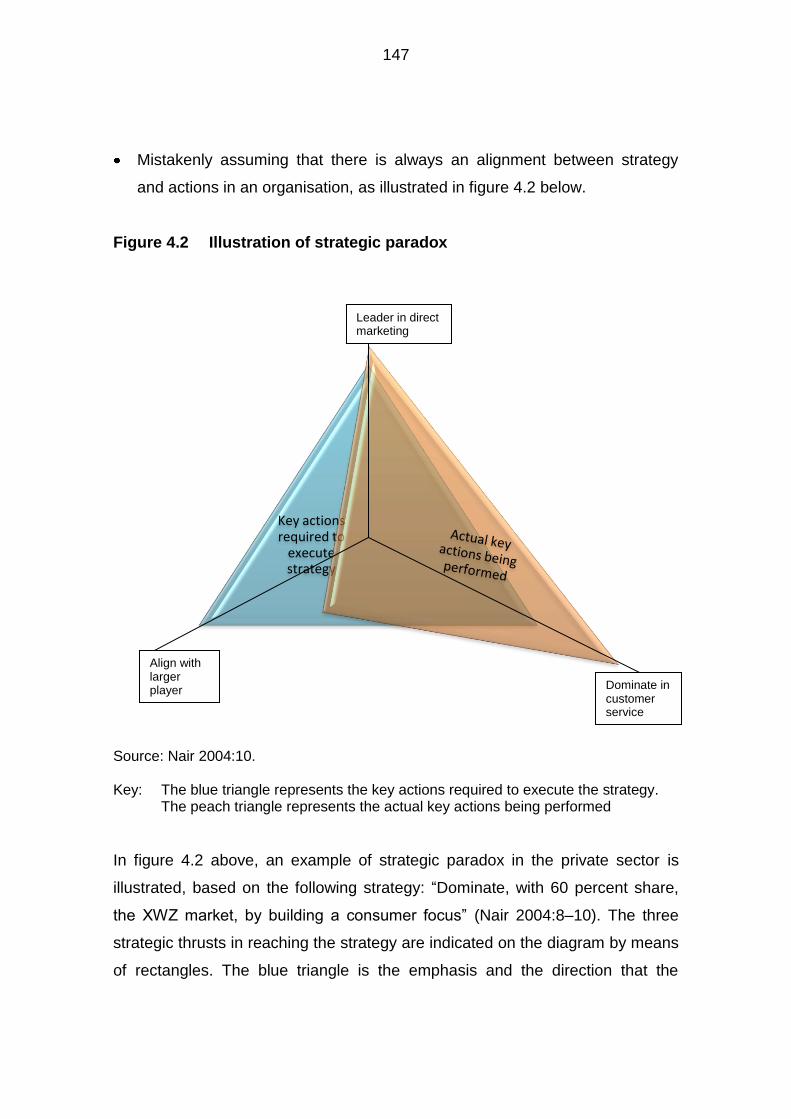
147
Mistakenly assuming that there is always an alignment between strategy
and actions in an organisation, as illustrated in figure 4.2 below.
Figure 4.2 Illustration of strategic paradox
Source: Nair 2004:10. Key: The blue triangle represents the key actions required to execute the strategy. The peach triangle represents the actual key actions being performed
In figure 4.2 above, an example of strategic paradox in the private sector is
illustrated, based on the following strategy: “Dominate, with 60 percent share,
the XWZ market, by building a consumer focus” (Nair 2004:8–10). The three
strategic thrusts in reaching the strategy are indicated on the diagram by means
of rectangles. The blue triangle is the emphasis and the direction that the
Key actions required to
execute strategy
Align with larger player
Leader in direct marketing
Dominate in customer service
148
executive leadership of the organisation believe is being used to execute the
documented strategy. The peach triangle represents the actual key actions
being taken collectively by staff, or in other words the place where the
resources of the organisation are being applied. The overlap between the blue
and peach triangles represents the area where there is alignment between the
strategy and the actual key actions. The BSC attempts to remove the strategic
paradox to ensure that all actions being performed on the ground are aligned to
the strategy of the organisation (Nair 2004:10–11). By identifying clear
performance targets at all levels in the organisation and involving all employees
in the discussion of strategic priorities, the BSC can create a link between
strategic objectives and operational goals, provided that the BSC can be
integrated successfully into the management control systems (Atkinson
2006:1453).
While it is shown above that the BSC was developed from the need for an
integrated performance measurement system, which can convert strategy into
operational terms, it developed into a management system. As discussed in
paragraph 1.2, Nair (2004:2–3) contends that the BSC attempts to move
organisations from “monitoring” to “measurement” to “management” to
“direction-setting”, as is illustrated in figure 4.3, which also defines the above
terms. Braam and Nijssen (2008:5) limit their discussion to two levels of BSC
adoption, namely that of a performance measurement system and that of a
strategic management system. When studying innovations such as the BSC it is
important to take the level of adoption into account (Braam & Nijssen 2008:5).
When the components and functions of seventeen different performance
measurement systems are compared, the BSC is one of only three systems that
meet all the set criteria to qualify as a performance measurement and
management system (Srimai, Radford & Wright 2011:669).

149
Figure 4.3 Possible levels of BSC use
Source: Own observation, compiled from Nair (2004:2–3).
The definitions in figure 4.3 are quoted from a textual discussion of the different
levels of BSC use in Nair (2004:2–3). Quotes were used in preference to
providing an own understanding of the meaning because there is no consensus
on definitions between the various disciplines in which articles are published on
the area of study, as discussed in paragraph 4.2. Figure 4.3 shows that the
BSC could be used for the basic purpose of monitoring, but it could also be
used for wider applications such as measurement, management and direction-
setting. Each progressive BSC application would offer the organisation benefits
in line with the level of use and an organisation could progress from one level of
application to the next.
Monitoring
•the "art and science of observing employee behaviour and coaching"
Measurement
•the "art and science of gauging, using numbers and metrics, performance to a task"
Management
•the "art and science of motivating, coaching, and enabling individuals and teams in the achievement of an objective"
Direction-setting
•the "art and science of discovering strategic directions ..., communicating this to all levels in the organisation in the form that they can identify with and co-relate their day-to-day actions to the goals"
150
Estis (1998:1) argues that measuring government performance is difficult. In the
private sector, organisations receive a clear market signal when consumer
demand has changed because the change shows in the sales report of the next
quarter. In the public sector, market signals are more subtle and come
infrequently and therefore they cannot be used to measure government
performance. As in the private sector, government customers consider
timeliness, quality and cost to be important, but the effect of dissatisfaction
among government customers is not visible in the short term. Reliance on other
parties for certain aspects complicates the measurement of government
performance even further. For example, to reduce poverty governments rely
partly on the private sector to generate jobs (Estis 1998:1, 5). Public and non-
profit sector organisations have however plunged into measurement – and they
have all experienced the benefits of measurement – but at various levels of
effort and with varying degrees of success (Niven 2003:31–32). The following
question should be asked: “Is what we’re doing (both in the public and non-profit
sectors) making a difference – is anyone better off as a result of our efforts?”
Niven (2003:32) answers that performance needs to be measured from a
broader perspective: A system is required which not only measures inputs and
outputs but also assesses progress in the achievement of the organisation’s
mission, which Estis (1998:7) views as moving from outputs to outcomes.
Institutional theories sketch a negative scenario, claiming that where survival
primarily depends on constituents and not on performance, as is the case in
government, systems are implemented to impress, but are not actually used to
improve performance (Ittner & Larcker 1998:233). Nevertheless, a study of the
adoption of BSCs in municipal governments in the United States of America and
Canada appears to indicate that the opposite is the case when the BSC is
considered. In the municipalities that have adopted the BSC, the study shows
that the administrators strongly believe that the benefits of the BSC outweigh its
costs (Chan 2004:219).

151
Results matter more to government and non-profit organisations than ever
before (Niven 2003:39). In order to satisfy constituents, performance has to be
measured accurately and progress in achieving mission-based objectives has to
be proven at an advanced level, which the BSC is able to do (Niven 2003:39).
This may explain why the performance measurement and management
emphasis in Singapore is moving towards implementing the BSC (Kon 2005:5).
President George W Bush said the following: “Government likes to begin things
– to declare grand new programs and causes. But good beginnings are not the
measure of success. What matters in the end is completion. Performance.
Results. Not just making promises, but making good on promises” (Executive
Office of the President 2002:3).
Whittaker (2001:143–144) and Niven (2003:x) raise the question whether public
organisations are sufficiently similar to private sector organisations to use the
BSC for measurement. They answer this by stating that the challenges between
public and private organisations are very similar. While the BSC was originally
designed for the private sector, it would appear that it would offer even greater
benefits to the public sector (Kaplan & Norton 1996b:179; Estis 1998:1) and to
non-profit organisations (Kaplan & Norton 1996b:179; Kaplan 2001:354). The
BSC has “risen to the performance measurement challenge” of the private
sector and is equally suited to transforming the public sector organisations of
the 21st century because it has emerged as an established tool which provides
meaningful performance information (Niven 2003:32, 38).
While not only the funds allocated but also the environment, politics and other
issues could affect the efficiency of the public sector, the extended use of the
BSC could make a contribution (Whittaker 2001:3). The BSC has been
successfully translated for – and implemented in – the non-profit and public
sectors with 70% of respondents in a public sector research study agreeing that
their entity was better off since implementing performance measures (Niven
152
2003:14). The BSC will be used more and more in the public sector as it
provides an exact view of what should be done to ensure successful operations
(Whittaker 2001:231).
The participants in non-profit organisations that were in the process of
implementing BSCs ranked the following benefits of the BSC as high: strategy
implementation, the chance to build up a performance measurement system,
and supporting organisational change processes (Greiling 2010:549). Estis
(1998:2) identifies the following public sector benefits of using the BSC: assists
managers in choosing those measures that are the most important; minimises
the information that managers have to collect, review and report on; minimises
paper overload; avoids the periodic addition of new measures without the
consideration of the effect on the other measures; and brings together
competing constituencies, for example customers who want better service and
taxpayers who want more efficient government. In addition to the benefits
applicable to the private and public sectors discussed above, Niven (2003:39–
42) identifies numerous benefits which non-profit or public sector organisations
or departments have derived from using the BSC, as illustrated in figure 4.4.
The decision to use a diagram and the specific design of the diagram is an own
choice. The headings used in figure 4.4 are based on those in the source
acknowledged below the figure, but have been adapted.

153
Figure 4.4 Public sector benefits of using the BSC
Source: Own observation, compiled from Niven (2003: 39–42).
1. Demonstrates accountability and generates results
•The BSC measures true performance and demonstrates progress in reaching mission-based objectives as required by the constituents, by taking a broad view of performance which focuses on the mission and strategy. Niven cites the highly effective New York City Mayor Rudi Giuliani as understanding the bond between measurement and accountability and quotes him from Leadership in 2002: “Objective, measurable indicators of success allow governments to be accountable, and I relentlessly pursued that idea.” (Niven 2003:39).
2. Attracts scarce resources , namely funding and employees
•In this fiercely competetive time, the BSC enables organisations to prove efficiency and effectiveness in reaching the strategic objectives set. This places it in a position to source scarce funds and attract staff. Niven quotes John A. Byrne in an article on philanthropists in BusinessWeek as saying that: “Recipients are often required to meet milestone goals ..... and to produce measurable results, or risk losing their funding” (Niven 2003:39).
3. Creates a focus on strategy
•Various aspects of performance are constantly being measured to report to various departments or bodies, but the performance measurement systems do not correspond to the actual values, objectives, goals and social mission of the organisation. In essence, measurement should not be about counting beans, but should revolve around achieving the strategy, which the BSC does in a systematic manner (Niven 2003:40).
4. Produces information, not data by identifying critical drivers of success
•Technology has resulted in a huge gap between data and information, with people drowning in huge volumes of data. Niven quotes James Lifton, a health care consultant, as referring to the thick agendas provided for board meetings, making preparation almost impossible because of the amount of data provided - but at the same time lacking information. A BSC provides information, as it measures only the critical drivers of organisational success (Niven 2003:41).
5. Prevents outsourcing by producing quality results at efficient prices
•Outsourcing is a real threat as almost half of the duties performed by public sector employees are available in the private sector, therefore they can readily be outsourced. The BSC identifies the few crucial processes that drive customer outcomes, placing the public sector body in a position to produce quality results at efficient prices. In this scenario, outsourcing becomes less of a threat because the desired results are reached via internal means in a cost effective manner (Niven 2003:41).
6. Drives change to reach desired outcomes
•In this context, Niven (2003:42) quotes Charles Darwin very aptly as having recorded that: “The survivors of any species are not necessarily the strongest. And they are not necessarily the most intelligent. They are those most responsive to change.” The measures of the BSC can direct the change required to reach the desired outcomes.
7. Inspires trust by proving accountability
•Once the BSC has proven accountability and attracted scarce resources, trust from the community, employees and funders follows (Niven 2003:42).
154
4.4.2 Aspects to consider before committing to using the BSC
Many arguments have been advanced in favour of using the BSC, but it is
nevertheless necessary to utter a few words of warning. National, occupational
and organisational culture can affect the successful implementation of the BSC
(Mooraj et al. 1999:487–488), as can local ideology (Bourguignon, Malleret &
Nørreklit 2004:107, 129). When performance measurement frameworks which
have originated in developed western countries are implemented in developing,
eastern countries like Thailand, which has a different culture, awareness of the
differences is essential to manage the implementation process (Srimai,
Damsaman & Bangchokdee 2011:66). Warnings of many practical difficulties
and a high rate of failure have been associated with the implementation of the
BSC (Paranjape et al. 2006:5).
There are two distinct streams of literature on the use of the BSC, with one
stream advocating its use and the other calling for more scientific evidence that
BSC implementation does in fact deliver improved organisational performance
(Paranjape et al. 2006:6). Different interpretations of the BSC exist (Braam &
Nijssen 2008:3), yet there is an assumption that firms that have implemented
BSCs have done so in similar ways (Soderberg, Kalagnanam, Sheehan &
Vaidyanathan 2011:704). A precondition for research to evaluate whether the
BSC is delivering improved organisational performance is that the BSC should
be designed and implemented in a manner that is true to the construct
proposed by the developers (Soderberg et al. 2011:689). The results of the
survey measured against the five-level taxonomy developed indirectly support
the conclusion that firms that have fully compliant BSCs are more likely to
experience the benefits as envisioned by Kaplan and Norton (Soderberg et al.
2011:704).

155
Regardless of the debate surrounding its success, the BSC remains an
influential and widely accepted performance measurement tool (Paranjape et al.
2006:8). The importance of the BSC is confirmed by Smith (2007:167–168),
who contends that the BSC should not be an item on the agenda, but rather that
it should drive the agenda and that where a target is missed, the focus should
not be on punishment but rather on why it was missed (Nair 2004:3). In spite of
its limitations, debates on performance measurement have been dominated by
the BSC for the past ten years (Meyer 2002:2).
4.5 DEFINING TERMINOLOGY
Before discussing the BSC concept and framework, the meaning of the terms
used, namely mission, values, vision, strategy, objectives and measures need
to be clarified.
4.5.1 Mission
A mission statement describes the core aspiration or purpose of the
organisation (Senge 1998:17; Brown 2000:30) – or – its reason for existence or
raison d’être (Niven 2003:102; 296). Senge (1998:17) contends that a mission
“defines a direction, not a destination" and “provides an orientation, not a
checklist of accomplishments”. Brown (2000:4) argues that a mission statement
focuses on the present and would not match the mission of any other
organisation, because it describes the unique products, services, customers
and key processes, while Correia et al. (2008:1187) add that it also defines the
boundaries of the organisation.
Even though a mission is never accomplished, Niven (2003:102) posits that the
success of public enterprises is often dependent on a clear mission statement.
Niven (2003:102) is of the opinion that where all parties have provided input for
156
– and agreed on – a mission statement, it can drive an organisation. Whittaker
(2001:143) argues that the mission cannot be achieved by managing in a
vacuum, but this becomes possible when the roles of customers, stakeholders
and employees are merged into the daily operations of an organisation and
balance is aimed for between the needs and opinions of all parties. The
importance of the mission for public and non-profit organisations is emphasised
in figure 4.8 of this study, where the mission is placed at the top of the BSC for
public and non-profit organisations.
4.5.2 Core values
While the mission sets out the reasons why an organisation exists, core values
revolve around how the organisation will function in reaching the mission or
target, therefore the means to the end (Nair 2004:70–71; 73). Niven (2003:297)
contends that core values are the deeply held beliefs in an organisation and an
open proclamation about how everyone is expected to behave which should be
evident through the day-to-day behaviour of employees.
4.5.3 Vision
Brown (2000:3) is of the opinion that the vision statement focuses on the future
and defines what the organisation wants to become, while Kaplan and Norton
(2004:34–35) are more specific in stating that the vision defines the mid- to
long-term goals and should be market-oriented and external – expressing how
the organisation wants to be seen by the world. Olve et al. (2000:54) define a
vision as: “A challenging and imaginative picture of the future role and
objectives of an organization, significantly going beyond its current environment
and competitive position.” Senge (1998:19), an organisational expert, says:
“Vision translates mission into truly meaningful intended results – and guides
the allocation of time, energy, and resources.”
157
4.5.4 Strategy
While the mission, values and vision are the “why” and “who”, they represent
nothing unless accompanied by the “how”, namely the strategy (Niven
2003:130). Niven (2003:130) argues that a well-formulated and executed
strategy indicates the specific priorities to which the organisational resources
will be allocated and to which energy will be directed, while Nair (2004:60) is of
the opinion that strategy is the starting point of planning and is the “science and
art of devising plans to win over customers and other stakeholders”. Nair
(2004:68, 74) contends that strategy in the public sector is the unique way an
organisation goes to market and summarises the key elements of strategy as
being: know yourself, know your enemies and know your customers.
4.5.5 Objectives
An objective is a concise statement commencing with a verb which describes
specific acts an organisation must do well in order to execute its strategy (Niven
2003:296).
4.5.6 Measures
A measure is a standard used to evaluate and communicate performance
against expected results. Measures are usually quantitative, expressed in terms
of numbers, monetary value or percentages. The monitoring and reporting of
measures helps organisations to gauge the progress being made toward the
effective implementation of the strategy (Niven 2003:295). Kaplan and Norton
(1996b:149–150) distinguish between two types of measures, namely core
outcome measures, also known as lag indicators and performance drivers, also
known as lead indicators, which are included in the illustration in figure 4.7 of
this study.

158
4.6 THE BSC CONCEPT AND FRAMEWORK
Smith (2007:166) defines the BSC as a “management tool that provides senior
executives with a comprehensive set of measures to assess how the
organisation is progressing towards meeting its strategic goals.” Nair (2004:xi–
xii, 3, 13) identifies the BSC as a “methodology to solve challenges in balancing
the theories of a strategy with its execution.” The essence of the BSC is making
strategy actionable at all levels – by translating it into day-to-day action plans
and initiatives. Drury (2008:577) adds that the BSC is a strategic management
technique used not only for communicating and evaluating the achievement of
not only strategy but also the mission of the organisation. The BSC is a tool of
overview and balance, not primarily about many separate measurements (Olve,
Petri, Roy & Roy 2004:3), making it very widely used as a tool to track progress
towards reaching strategic objectives (Meyer 2002:xii). For this reason, a
strategic approach to the selection of measures is adopted after taking multiple
criteria into account (Valiris, Chytas & Glykas 2005:160).
The BSC should be used to express and communicate the strategy of the
business and to help to align the initiatives at an individual, organisational and
cross-departmental level towards achieving common long-term goals (Kaplan &
Norton 1996b:25). It should be emphasised that the BSC should be used as a
system of communicating, informing and learning – not as a means to control
behaviour or evaluate past performance (Kaplan & Norton 1996b:25). Niven
(2003:15) contends, however, that the BSC is a tool with three elements,
namely, a: measurement system, a management system and a communication
tool, as is illustrated in figure 4.5. As a communication tool, the BSC is a
platform for exchanging ideas and gaining a better understanding in both the
private and the public sectors (Olve et al. 2004:7).

159
Figure 4.5 Elements of the BSC
Source: Niven 2003:15.
While various definitions and strategy frameworks are used by various scholars
and practitioners, Kaplan and Norton (2004:35) base their BSC approach on the
general framework of Michael Porter, a founder and leader in the strategy field.
According to Porter, strategy is about selecting the set of activities in which an
organisation aims to excel in order to make a sustainable difference in the
marketplace. An example of a sustainable difference is to deliver similar value
to that of competitors at a lower cost or to provide greater value to customers at
the same price charged by competitors (Kaplan & Norton 2004:35). Most
organisations have too many performance measures and the result is
information overload (Kaplan & Norton 1992:72–73). The BSC limits the number
of measures used because it forces managers to select only a handful of the
most critical measures (Kaplan & Norton 1992:72–73), helping to focus
attention and actions on the strategic vision (Kaplan & Norton 1993:134).
Figure 4.6 illustrates the BSC framework which Kaplan and Norton developed
for the private sector and which documents the results of the translation of the
strategy of an organisation into operational terms. The framework indicates that
the vision and the strategy are translated into objectives and measures viewed
from four perspectives, namely the Financial, Customer, Internal Business
Process and lastly the Learning and Growth Perspectives (Kaplan & Norton
1996b:8).
Measurement system?
Strategic Management System?
Communication Tool?

160
Figure 4.6 The Balanced Scorecard framework to translate strategy into operational terms
“To succeed financially, how should we appear to our shareholders?”
Financial perspective
Objectives Measures Tar-gets
Initiatives
“To achieve our vision, how should we appear to our cust-omers?”
Customer perspective Vision
and Strategy
“To satisfy our shareholders and customers, what business processes must we excel at?”
Internal Business Process perspective
Objectives Measures Tar-gets
Initiatives Objectives Measures Tar-gets
Initiatives
“To achieve our vision, how will we sustain our ability to change and improve?”
Learning and Growth perspective
Objectives Measures Tar-gets
Initiatives
Source: Kaplan & Norton 1996b:76. (reprinted from “Using the Balanced Scorecard as a Strategic Management System,” Harvard Business Review,
(January – February 1996))
161
Kaplan and Norton (1996b:8; 10) emphasise the need for the financial and
nonfinancial measures of the BSC to be applied to employees at all levels of the
organisation – not just top management. Employees need to grasp that the
vision and strategy of the organisation have, via the BSC, been translated into
tangible measures and objectives that have been pitched at the level at which
they are operating in the organisation. Employees also need to know that their
actions and decisions have an effect on the profitability of the organisation.
After viewing the BSC framework above, Kaplan and Norton (1996b:10) and
Nair (2004:15–19) argue that a BSC must achieve balance between various
seemingly opposing key performance measures and indicators. Without
balance, strategy is not actionable and this causes organisations to fail (Nair
2004:2–5). A good BSC must have a balance between outcome measures
(lagging indicators) and performance drivers (leading indicators) that are
customised to the strategy of the unit within the organisation (Kaplan & Norton
1996b:31–32, 150). On the one hand, outcome measures without performance
drivers do not communicate the way the outcomes will be achieved (Kaplan &
Norton 1996d:21–22). On the other hand, performance drivers without outcome
measures will not indicate whether operational improvements are having the
desired effect, namely strategy execution. In consequence, two opportunities
will be lost: firstly to pinpoint why strategy is not being executed and, secondly,
to adapt the strategy (Kaplan & Norton 1996d:22–23). The choice of
performance measures is a major challenge faced by managers in
organisations (Ittner & Larcker 1998:205). Because the BSC forces managers
to consider all the important operational measures together, they can identify
whether an improvement in one area will detrimentally affect another area
(Kaplan & Norton 1992:73). The balanced set of measures reflects the “trade-
offs” which managers have made between possible measures (Kaplan & Norton
1993:135) and provides insight (Nair 2004:19), as illustrated in figure 4.7.

162
Figure 4.7 Insight through balance between key performance measures
Source: Nair 2004: 19; own observations from Nair 2004:14–19; Kaplan & Norton
1996b:10, 22; Correia et al. 2008:663.
The shape of the diagram and the identification of the four sets of measures in
balance, illustrated in figure 4.7, are from Nair (2004:19). The meaning of each
Balance
Organisational silo – focus on unit
goal only Internal measures –
focus on innovation,
critical processes,
learning and growth
Non-financial measures –
includes operational and
less tangible measures
Lagging indicators –
focus on outcomes of past action
Organisation-wide – focus on
overarching framework of
goals
External measures – focus on customers
and stakeholders
Financial measures – focus on
achieving and maintaining short
term financial results
Leading indicators – focus on drivers
of future performance
163
of the measures has been added to the original diagram and is an own
interpretation from sources acknowledged above.
4.7 ADAPTING THE BSC FRAMEWORK FOR PUBLIC SECTOR USE
Figure 4.6 of this study illustrates the BSC framework which Kaplan and Norton
developed and which was initially intended for the private sector. The BSC can
be used in the public sector, but it needs to be adapted to ensure best practice
in the specific area where it will be applied (Estis 1998:2–3; Kaplan 2001:360–
367; Whittaker 2001:143–144; Niven 2003:32; Braam & Nijssen: 2008:5).
Figure 4.8 reflects the adapted public sector BSC framework developed by
Niven (2003:32), chosen because it is the most recent. This BSC framework
was also chosen by Botes (2006:114) for application in a non-profit scenario.
Unlike in figure 4.6 of this study, where the detailed outline of the end product is
provided, figure 4.8 only provides the general BSC outline, so that the change in
emphasis from the private sector to the public sector BSC is clearly visible.
As illustrated in figure 4.8 below, the mission of the public or non-profit entity
should be at the top of the BSC (Kaplan 2001:361; Whittaker 2001:143–144;
Kaplan & Norton 2001a:135), because that is the core aspiration that the entity
is striving towards (Estis 1998:3; Kaplan 2001:361; Whittaker 2001:143–144;
Kaplan & Norton 2001a:135). Adapting the BSC by moving the mission to the
top of the BSC, and moving the Financial Perspective down, has become a
common practice for a public sector BSC (Kaplan 2001:368–369; Balanced
Scorecard hall of fame report 2005 2005:35). As will be noted from the outline
of the adapted public sector BSC in figure 4.8 below, the adapted BSC retains
the strategy at the core of the BSC. It is suggested that the four perspectives
used for the private sector BSC be retained, but the focus be adapted to make
them more applicable to the public or non-profit sector.

164
Figure 4.8 BSC framework for the public and non-profit sectors
Mission
Source: Niven 2003:32.
Strategy
Customer
"Whom do we define as our customer? How do we create value for our
customer?"
Internal Processes
"To satisfy customers, while meeting
budgetary constraints, at which business
processes must we excel?"
Employee Learning and Growth
"How do we enable ourselves to grow and
change, meeting ongoing demands?"
Financial
"How do we add value for customers while controlling costs?"
165
4.8 ADAPTING THE BSC PERSPECTIVES FOR PUBLIC SECTOR USE
After having clarified the public sector BSC framework, the four perspectives of
the BSC need to be discussed in more detail. In the private sector, the four
perspectives are usually: Financial, Customer, Internal-Business-Process and
Learning and Growth (Kaplan & Norton 1996c:54). Niven (2003:32–36)
suggests ways of adapting the sequence and terminology of the four
perspectives for use in the public sector BSC, as illustrated in figure 4.8. The
discussion of each perspective commences with the private sector concept,
which is then converted to the corresponding public sector concept.
4.8.1 Customer Perspective
The Customer Perspective of the BSC developed for the private sector shows
how the strategy and operations contribute to customer value (Weil & Maher
2005:659). Kaplan and Norton (1996b:26) however argue that managers
identify the customer and the market segments in which the business will
compete, as well as the generic and specific performance measures. Generic
measures include customer satisfaction, retention, acquisition, profitability and
market share in the targeted segment (Kaplan & Norton 1996b:26; 1996c:58).
Specific measures include measures which are deemed critical in determining
whether customers will switch to, or remain loyal to, the supplier, for example
short lead times, on-time delivery, a constant supply of innovative products and
services, or new products developed to meet emerging needs (Kaplan & Norton
1992:73; 1996b:26).
As mentioned previously and illustrated in figure 4.8, the public sector BSC has
the Customer Perspective flowing from and into the mission, which is at the top
of the framework. To achieve its mission, the public sector entity must
determine which group of customers it aims to serve and how the needs of this
group can best be met. In the public sector, the legislative body providing

166
finance and the group that are to be served are logical choices when identifying
the customer (Niven 2003:33–34), with the taxpayer being the ultimate
customer (Estis 1998:7).
4.8.2 Financial Perspective
In private organisations geared for profit-earning, financial performance
measures generally indicate whether the strategy, the implementation and the
execution are contributing to increased profitability. Operating income, return-
on-capital-employed (ROCE) and lately economic value-added (EVA®) are
generally used as measures of financial objectives (Kaplan & Norton 1996b:25–
26). Kaplan and Norton (1996b:22, 25–26) argue that financial measures should
be included in the BSC as the Financial Perspective because they are helpful in
summarising the economic consequences of past actions. Niven (2003:34)
contends that companies are accountable to their capital providers – the
shareholders – and that accountability is primarily monitored through the
Financial Perspective of the BSC.
In organisations that do not have shareholders, the Financial Perspective of the
BSC indicates whether the strategy and operations contribute to improving the
financial health of the organisation (Weil & Maher 2005:659). Whereas the
financial perspective provides a long-term objective in the private sector, it is a
constraint in the public sector (Kaplan 2001:354), with the mission, and not the
financial goal, being the overruling target of the Financial Perspective (Nair
2004:21). By referring to the limited and decreasing funding of the present era,
where the prudent management of resources is critical to achieve the mission of
the organisation and render the necessary services to the public or other
intended parties, Niven (2003:5–6; 10) emphasises the importance of including
the Financial Perspective as part of the BSC – especially for the public and non-
profit sectors. Kaplan (2001:353) concurs. The Financial Perspective could
167
primarily be seen as an enabler to service customers as set out in the Customer
Perspective, or as a constraint within which the entity must operate. This ties in
with the discussion in chapter 1 on two levels: firstly, there are limited budgets
for housing delivery, and secondly, it was suggested that the budget should be
viewed as an enabler, rather than a constraint.
4.8.3 Internal Processes Perspective
Weil and Maher (2005:659) contend that the Internal-Business-Process
Perspective in the private sector BSC shows the ability of internal-business-
processes to add value for customers and shareholders. Kaplan and Norton
(1996b:26–28; 1996c:62–63) are more specific, arguing that executives of
profit-oriented organisations identify the critical internal processes that the
organisation must excel at to enable the business unit to deliver the projects
which will attract and retain customers – and satisfy shareholder forecasts of
good returns. The BSC differs from traditional approaches in that instead of
attempting to improve on existing processes, the BSC is more likely to identify
entirely new processes which the organisation must excel at to meet financial
and customer objectives. Figure 4.9 below illustrates the process that would be
followed in the private sector to incorporate innovation processes into the
Internal-Business-Process Perspective:

168
Figure 4.9 The Internal-Business-Process value-chain Perspective
I______________I I_________________________I
Innovation Operations
I______________I I_________________________I
Time-to-market Supply chain
Source: Kaplan & Norton 1996b:27
The Internal-Business-Process Perspective is rephrased as the Internal
Processes Perspective for the public sector BSC (Niven 2003:35). In developing
the Internal Processes Perspective, the key internal processes at which the
entity must excel in order to drive value for the customers must be determined.
While all organisations will have documented processes, only the processes
that could lead to improved outcomes for customers should be selected and
measured for the BSC (Kaplan & Norton 1996c:62–63). The processes chosen
would usually flow directly from the objectives and measures of the customer
perspective and would be working towards the mission of the entity (Niven
2003:35).
4.8.4 Employee Learning and Growth Perspective
The Learning and Growth Perspective of the BSC for the private sector has
three elements – namely: people, systems and organisational procedures –
which must be determined and built on in order to generate long-term growth
and improvement (Kaplan & Norton 1996b:28–29). Regarding people, generic
outcome measures such as staff satisfaction, retention, training and skills
should be weighed against the business-specific indexes required for the new
competitive environment. It is necessary to establish the gaps between the
present systems, procedures and skills of staff, and those required to attain the
Customer need identified
Design Develop Make Market Service Customer need
satisfied

169
desired performance. In order to remedy such shortcomings, staff have to be re-
skilled, information technology and systems improved and organisational
procedures aligned (Kaplan & Norton 1996b:28–29; 1996c:64). Weil and Maher
(2005:661) add that staff productivity could be measured in terms of physical or
financial output. Examples of physical output might be miles driven, pages
produced or lawns mowed. Financial output could be measured in terms of
revenue per employee. An example of a measure of productivity for a loan
officer at a bank could be the number of loans processed per loan officer per
month.
The Learning and Growth Perspective of the private sector BSC is rephrased to
the Employee Learning and Growth Perspective for the public sector BSC
(Niven 2003:35–36, 164), an overall view of which is provided in figure 4.10
below. The organisational structure and the skills, dedication and alignment of
the staff are the main drivers of process improvements, operating in a fiscally
responsible manner and meeting the needs of customer groups (Niven
2003:35–36). Governments should continually invest for the future but are
known to underfund the maintenance of capital, labour and processes, all
elements which continually need to be updated and upgraded (Estis 1998:9).
This perspective emphasises that the development of successful new
programmes is dependent on skilled professionals with the time available to
create the programmes (Estis 1998:10).

170
Figure 4.10 Overall view of Employee Learning and Growth Perspective
Source: Own observation from figure 4.8 of this study; Kaplan & Norton 1996b:28–29;
Niven 2003:35–36, 164. The layout and interpretation of the relationship between the various elements
which form part of the Employee Learning and Growth perspective are an own
observation. The question posed in the central green circle was taken from
figure 4.8, the public sector BSC framework. In the smaller surrounding circles,
an own interpretation of the headings is shown, based on the combination of
text from Kaplan and Norton (1996b:28–29) and Niven (2003:35–36). The
questions posed in the smaller circles are from text in Niven (2003: 35–36, 164).
"How do we enable ourselves
to grow and change, meeting
ongoing demands?"
Organisational procedures /climate
•Does the entity have the proper culture, alignment and motivation required
for success?
Employee skills and competencies
•Does the entity have the correct mix of skills to meet
the challenges?
Systems (Information technology and others)
•Do employees have the information and tools they require to effect successful
outcomes for the customers? [applicants/beneficiaries/
taxpayers]
171
4.9 PUBLIC SECTOR TRANSLATION PROCESS VIA THE BSC
4.9.1 Overall approach
Kaplan and Norton (2001b:97) contend that non-profit organisations and the
public sector have difficulty in clearly defining strategy, with strategy documents
often running to 50 or more pages. Lists of intended programmes or initiatives
are often presented as strategy, not the desired outcomes. It should be
understood that strategy is not only what the organisation intends to do, but also
what it decides not to do (Porter 1996:77 in Kaplan & Norton 2001b:98). Figure
4.11 illustrates the BSC development process, with a summary of the
terminology that Niven (2003:171) suggests in translating the mission of a
public sector entity into objectives and measures. The BSC translation process
proposed by Kaplan and Norton in their third article (1996a:77–79) was outlined
in paragraph 4.3. While the BSC is not intended to be a strategy formulation
tool, different interpretations of strategy by different managers are often
highlighted during the first process of clarifying the vision and strategy (Kaplan
& Norton 1996c:77). The translation of the BSC to concrete action is a
problematic area (Paranjape et al. 2006:4). In figure 4.11, the arrows indicate a
top-down and a bottom-up approach. The top-down approach is one in which
consensus is reached on the mission, core values, vision and strategy, which
are then translated into objectives and measures via the BSC. The bottom-up
approach is one in which learning takes place through the use of the BSC. Both
approaches are of equal importance (Niven 2003:170). The feedback and
learning process, referred to as double-loop learning, is considered to be the
most innovative and far-reaching facet of the whole BSC process because it
enables executives to monitor and manage the implementation of their strategy,
and therefore change the strategy if necessary (Kaplan & Norton 1996d:18, 20).

172
Figure 4.11 Public sector translation of the mission into objectives and
measures via the BSC
Mission (why we exist) and Core values (what we believe in)
Source: Niven 2003:171, adapted with 151, 296.
In figure 4.11, the pyramid shape, the four steps within the pyramid and all the
text in, next to and above the pyramid, excluding the text in brackets, are from
• Desired future state (word picture of the future)
Vision
• Broad, directional priorities (specific activities/game plan)
Strategy
• What you must do well in order to implement your strategy (precise statement)
Objectives (Customer; Financial; Internal
Processes; Employee Learning and Growth)
• How strategic success is measured and tracked (standard vs expected)
Measures (Customer; Financial; Internal Processes;
Employee Learning and Growth)

173
Niven (2003:171). The text in brackets was added to the original diagram to
clarify the concepts from Niven (2003:151, 296). Nair (2004:195) does not
differentiate between public and private sector organisations. His approach to
creating a BSC is similar, yet different from that of Niven, as is illustrated in
figure 4.12 below.
Figure 4.12 Creation of a BSC
Source: Nair 2004: 195 supplemented with 196.
• Identify purpose of organisation with Mission, Vision and Values (MVV)
MVV
• Value propositions, strategic positioning, competencies
Strategy
• Breaking strategy into key themes that organisation can absorb
Strategic themes
• Customer; Financial; Internal Processes; Learning and Growth
BSC perspectives
• Drawing on strategy maps to understand cause-and-effect relationships between perspectives
Strategy mapping
• Developing performance measures in each perspective and between perpectives; balance between measures
Objectives, performance measures, targets, initiatives
• Build BSC around each key objective, sub-objective and initiative
Build BSC
• Cascade BSC objectives to all levels – regularly shared and evaluated
Scorecards cascaded
174
The outline of the pyramid shape in figure 4.12 and the text in the pyramid, with
the exception of “Build BSC”, is from Nair (2004:195). The placement of the text
in the pyramid in eight steps was the result of own observation. The addition of
the text to the left of the pyramid and the addition of the “Build BSC” step is an
own observation, based on Nair (2004:195–196).
4.9.2 Interrelationship between the four BSC perspectives
After having worked through BSC literature, one should not to be tempted to
take stock of a mixture of financial and nonfinancial measures that are being
used in a public sector organisation and then think that the measures used
resemble a BSC (Kaplan & Norton 1996c:55–56; Niven 2003:36–38). To qualify
as a BSC, the measures have to be derived from strategy, through the BSC
translation process (Kaplan & Norton 1996c:55–56). It is crucial that the
measures should serve to link the perspectives in a cause-and-effect
relationship through all four BSC perspectives. In meeting this challenge, the
aim is to ask “if-then” questions, thereby identifying distinct relationships
between measures under the four BSC perspectives (Kaplan & Norton
1996b:149; 1996d:20–21). This allows for the monitoring, management and
validation of measures. The result is that the “strategic story” of the entity is told
via a chain of linked objectives which run through the BSC (Kaplan & Norton
1996b:149). While Nørreklit (2000:76) has questioned the existence of the
cause-and effect relationship between the various perspectives claimed by
Kaplan and Norton (1996b:149; 1996d:20–21), the findings of a recent study
done in Malaysia suggest that the cause-and-effect relationship could lead to
improved business efficiency and profitability (Ong, Teh, Lau & Wong 2010:33).
The BSC helps managers to determine whether an improvement in one
important operational measure will have a detrimental effect on another
measure (Kaplan & Norton 1992:73; Drury 2008:584).
175
While it was argued earlier in this chapter that “You cannot manage what you
cannot measure”, it is equally true that: “You cannot measure what you cannot
describe” (Kaplan & Norton 2004:xiii). The strategy map describes and
visualises the strategy of the organisation through explicit cause-and-effect
relationships between the objectives in the four BSC perspectives (Kaplan &
Norton 2004:xii–xiii). Nair (2004:27–28) contends that strategy mapping
provides a visual framework for the conversion of strategic intentions to
operational actions with the added bonus of illustrating the cause-and-effect
relationships. Niven (2003:169) argues that a strategy map is a clear and
concise one-page document outlining what is believed to be the most critical
landmarks in executing the strategy of the organisation and that performance
objectives serve as these landmarks. The destination, the strategic vision, is the
starting point; therefore the strategy map is built from the top down, with the
routes required to arrive at the destination entered afterwards (Kaplan & Norton
2001b:90). The test of a good strategy map is the point at which the strategy
can be understood by looking only at the BSC and the strategy map (Kaplan &
Norton 2001b:97). The strategy map can be adjusted or updated as the need
arises, bearing in mind that the aim is to keep it simple, but accurate (Nair
2004:26). Strategy mapping is generally carried out by all BSC team members
in a strategy mapping session. It is crucial that all BSC team members are
provided with the latest mission, values, vision and strategy, that they are well-
prepared and that they are ready to share possible BSC objectives (Niven
2003:170–173).
4.10 MONITORING AND EVALUATION VERSUS THE BSC
As argued in paragraph 1.5 of this study, it is crucial to respond to calls by the
Minister of Human Settlements and President to find a new approach or
undergo a change of mindset and work “smarter, use money wisely and
prioritise services that that would better the lives of ordinary citizens”. It was
176
also argued that ways had to be found to help the Department of Human
Settlements to address the departmental factors hampering delivery under the
Upgrading of Informal Settlements Programme (chapter 1). Many of the
opinions relating to departmental factors hampering delivery were formed
between 2008 and 2010 when the BNG plan, which includes national strategies
to eradicate or upgrade informal settlements, had been in place for four to five
years.
Before considering the BSC as a new approach or change of mindset that
motivates people to work smarter, it is essential to determine the source of what
has been termed performance measurement in the Upgrading of Informal
Settlements Programme (paragraph 3.4.7). The performance indicators for the
Upgrading of Informal Settlements Programme focus on measuring the long-
term impact of delivery on the community (figure 3.8). This is known as
“evidence-based outcome measurement and impact assessment”, which forms
part of Monitoring and Evaluation (PricewaterhouseCoopers 2010:1). This is not
in agreement with the performance measurement concept discussed earlier in
this chapter, where it was stated that performance measurement involves
measuring performance in relation to a task and the progress in achieving the
mission of the organisation (figure 4.3 and paragraph 4.4). Niven’s (2003:145)
opinion appears to be relevant here because he argues that performance
management comes in “many guises and goes by a multitude of names”, with
each term having a different meaning for different people. The same would
apply to performance measurement.
4.10.1 The Monitoring and Evaluation concept
In paragraph 1.1, Monitoring and Evaluation was described as part of the
Government-wide Monitoring and Evaluation System which was introduced in
all government departments. In the Department of Human Settlements, the

177
2009 National Housing Code added Monitoring, Evaluation and Impact
Assessment (MEIA) as a strategic theme to Strategy 9 of the BNG plan,
presently known as “Implementing systems for monitoring and evaluation”
(figure 2.10). The 2009 Housing Code also changed “performance
measurement” indicated in the BNG plan to “performance management”
(National Department of Human Settlements 2009b:33–34). Figure 4.13 below
contains an outline of the Monitoring and Evaluation framework.
Figure 4.13 Monitoring and Evaluation framework
Source: Own observation compiled from Monitoring and Evaluation (PricewaterhouseCoopers 2010).
The choice of the design and flow of the diagram in figure 4.13 is an own
observation, drawn from text found on the website acknowledged below the
diagram. In figure 4.13, the concept “evidence-based outcome measurement
and impact assessment” is indicated in a rectangle as the “missing link”
between the strategy and the impact on the community.
Objective ‒ more responsive to needs of public/communities,
dependent on:
1. Understanding of public/community
needs
2. Degree to which policy shift informed by
community needs
3. Adapted strategies, aligned with policy shift
4. How strategies translate policy into
action
5. How action yields desired results in
community
6. Desired results ‒ impact on community
Outcome measurement
and impact assessment are identified
as the” missing link” between strategy and
impact
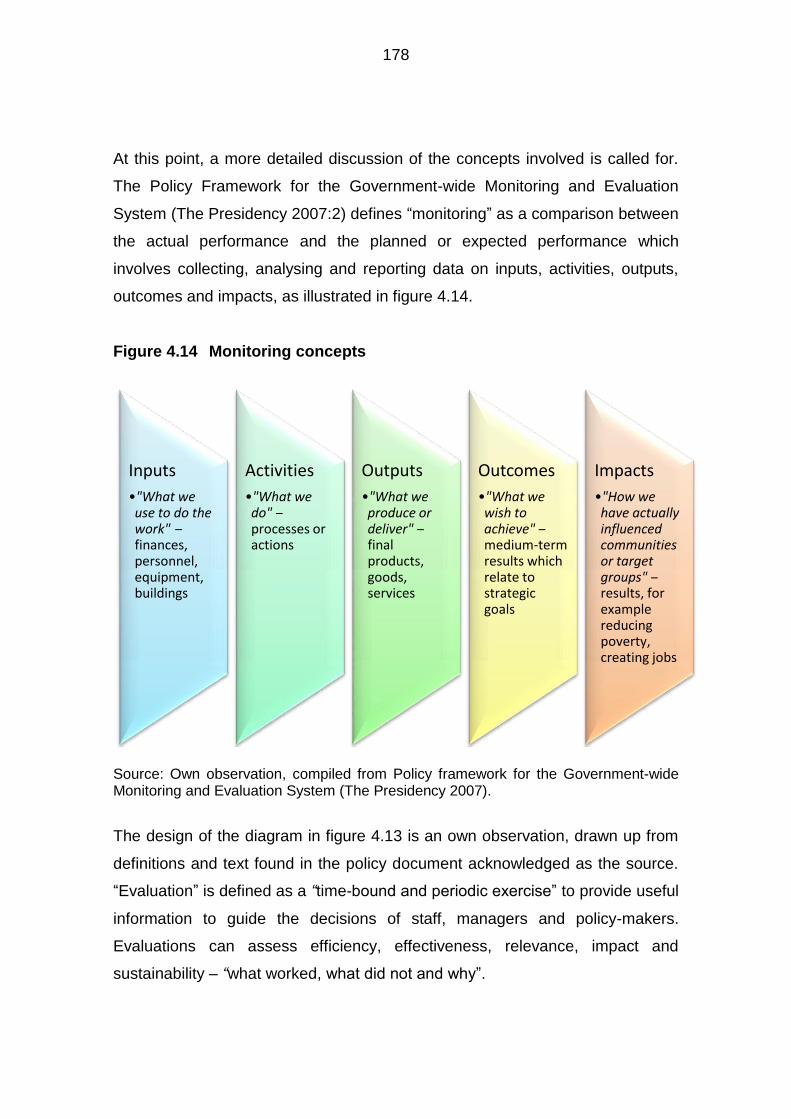
178
At this point, a more detailed discussion of the concepts involved is called for.
The Policy Framework for the Government-wide Monitoring and Evaluation
System (The Presidency 2007:2) defines “monitoring” as a comparison between
the actual performance and the planned or expected performance which
involves collecting, analysing and reporting data on inputs, activities, outputs,
outcomes and impacts, as illustrated in figure 4.14.
Figure 4.14 Monitoring concepts
Source: Own observation, compiled from Policy framework for the Government-wide Monitoring and Evaluation System (The Presidency 2007).
The design of the diagram in figure 4.13 is an own observation, drawn up from
definitions and text found in the policy document acknowledged as the source.
“Evaluation” is defined as a “time-bound and periodic exercise” to provide useful
information to guide the decisions of staff, managers and policy-makers.
Evaluations can assess efficiency, effectiveness, relevance, impact and
sustainability – “what worked, what did not and why”.
Inputs
•"What we use to do the work" ‒ finances, personnel, equipment, buildings
Activities
•"What we do" ‒ processes or actions
Outputs
•"What we produce or deliver" ‒ final products, goods, services
Outcomes
•"What we wish to achieve" ‒ medium-term results which relate to strategic goals
Impacts
•"How we have actually influenced communities or target groups" ‒ results, for example reducing poverty, creating jobs
179
Government’s commitment to ensuring that its performance makes a
meaningful impact on the lives of the people was confirmed by the
establishment of the Department of Performance Monitoring and Evaluation on
1 January 2010 (The Presidency 2010a:1–2). Housing/human settlements is
receiving attention because “Sustainable Human Settlements and improved
quality of household life” was adopted as one of twelve outcomes at a Cabinet
Legotla held in January 2010. Following on the Legotla, at the end of April 2010
the President signed performance agreements with all 34 Cabinet Ministers
(The Presidency 2010b:1–2).
4.10.2 Preliminary appraisal of the suitability of the BSC for addressing
the departmental factors hampering delivery under the Upgrading
of Informal Settlements Programme
It is argued that for any performance measurement system to be suitable for
use in the Upgrading of Informal Settlements Programme, it should have the
potential to address the departmental factors hampering delivery. These factors
were identified in chapter 3 as: disjuncture between long-term visions and
actual actions on the ground; lack of detailed strategy for prioritised national
housing programmes; outdated information on income and needs of targeted
beneficiaries; lack of buy-in to, understanding of and compliance with policies
by staff; bureaucratic and inefficient funding sources and transfers; lack of
accountability for decision-making and delivery failures; misalignment of
priorities and budgets between sector departments; and lack of coordination
and communication between sector departments. The arguments advanced
below are for a preliminary appraisal of suitability, therefore they will be based
on the collective rather than the individual departmental factors hampering
delivery. Where this discussion reveals that a specific system could be suitable
for performance measurement for the Upgrading of Informal Settlements
Programme, critical assessment of the individual departmental factors

180
hampering delivery under the Upgrading of Informal Settlements Programme
will be discussed in the next chapter of this study.
4.10.2.1 Preliminary appraisal of the suitability of Monitoring and
Evaluation
In the discussion of “monitoring” it was found that the focus is on past actions.
This finding is borne out by the performance indicators of the Upgrading of
Informal Settlements Programme, which measure the performance against the
work plan, improvement in living conditions and sustainability of upgrading
projects (figure 3.8). This is in line with Nair’s (2004:2–3) definition of
“monitoring”, namely “observing employee behaviour and coaching” (figure 4.3).
Based on this, it is argued firstly that Monitoring and Evaluation is not suited to
addressing the departmental factors hampering delivery under the Upgrading of
Informal Settlements Programme because the departmental factors indicated
above would require measures that drive future performance in addition to
those that measure past action, which Monitoring and Evaluation is not geared
for.
It is also argued that all the departmental factors mentioned above are complex
and call for an integrated performance measurement system to address them.
This bears out Estis (1998:7) and Niven’s (2003:32) arguments as stated
previously in this chapter that performance needs to be measured from a
broader perspective than merely measuring inputs and outputs. Performance
measurement should also assess progress in achieving the organisation’s
mission. It is clear from the discussion that Monitoring and Evaluation is not
integrated and it cannot measure the progress that the human settlements
departments at the three tiers of government are making in reaching their
mission or ensuring that their strategy is executed. The objective of the
Monitoring and Evaluation framework is stated as being more responsive to the

181
needs of the public/communities (figure 4.13), which is a much narrower focus
than aiming to achieve the mission. Furthermore, because there is no integrated
approach involved, there is a very real risk that Monitoring and Evaluation will
be reduced to just another report that has to be submitted by the Accounting
Officer – while to everyone else it is “business as usual”. Lastly, the fact that
although Monitoring and Evaluation has been in place for a number of years the
departmental factors hampering delivery persist and delivery is still not
progressing as intended, is in itself confirmation that the present Monitoring and
Evaluation is not suited to addressing this issue.
4.10.2.2 Preliminary appraisal of the suitability of the BSC
The discussion of the BSC shows that the BSC balances the outcome
measures of past performance with the drivers of future performance therefore
having the potential to address the departmental factors hampering delivery. As
an integrated framework, it is also ideally positioned to address complex
delivery situations. The factors hampering delivery under the Upgrading of
Informal Settlements Programme have been found to be complex. Nair
(2004:2–3) argues that the BSC can be used for “monitoring”, “measurement”,
“management” and “direction-setting” (figure 4.3). According to Niven (2003:15),
the BSC is a Measurement System, Strategic Management System and a
Communication Tool (figure 4.5). Whatever the intended level of use of the
BSC, the BSC can bridge the gap between the strategy and the execution of the
strategy by aligning operational actions at all levels in the human settlements
departments with the strategy, thereby ensuring execution (figure 4.1).
Lastly, using the BSC has the following public sector benefits: strategy
implementation; it demonstrates accountability and generates results; it attracts
scarce resources, namely funding and employees; it creates a focus on
strategy; it produces information, not data, by identifying critical drivers of
182
success; the use of the BSC avoids outsourcing by producing quality results at
efficient prices; it drives change to reach desired outcomes; and it inspires trust
by proving accountability (paragraph 4.4.1 and figure 4.4). Where the collective
public sector benefits of using the BSC are compared with the collective
departmental factors hampering delivery under the Upgrading of Informal
Settlements Programme, it appears that the benefits of the public sector BSC
match many of the departmental factors hampering delivery (figures 4.4 and
3.9).
4.11 SUMMARY
This chapter clarified that organisations need performance measurement to
chart their present position before determining a future direction and that this
study deals with the BSC as a performance measurement tool, not the wider
discipline of performance measurement. It was found that before the present
position can be measured, an organisation must be aware of the business
environment in which it operates. In the progression from the industrial age to
the information age, dramatic changes have taken place in the business
environment. In the industrial age organisations that effectively managed assets
and liabilities and used new technology for mass production of products were
successful. In the information age, the emphasis has shifted to the way the
organisation mobilises and manages its intangible assets (eg employee
knowledge, customer/supplier relationships and innovative cultures). Customers
now have higher expectations than before, requiring everything to be done
faster, better and cheaper, with product delivery, quality, after-sales service and
customer satisfaction being key variables. In the public sector, reduced funding
and demands for accountability and transparency have contributed to the “new
public management” (NPM) movement which introduces private sector financial
management practices into the public sector. The effect of this is that the public
sector is operating more like a business than ever before.
183
Traditional performance measures were found to be outdated because they
tend to focus only on profit and costs. In the public sector, the past practice of
focusing reporting on the funds spent on administrative costs was being faulted
and that the following questions were being asked: What difference is being
made? What results are being achieved? What progress is being made in
achieving the mission of the organisation? Recent Strategic Management
Accounting developments have emphasised the role of Management
Accounting in supporting the overall competitive strategy of organisations.
There was a realisation that if the organisation was to remain competitive,
reporting had to cover various business aspects, not just financial measures.
Further, organisations have realised that having a good strategy will not
necessarily result in success; execution of the strategy is crucial to success. In
the public sector, constituents are criticising government for being inefficient,
ineffective, self-serving, unresponsive to public wants and needs and failing to
deliver the quantity and quality of services deserved by the taxpaying public.
The launching by government of new programmes and causes is no longer
being accepted, but results and “making good on promises” are being
demanded. Government performance measurement systems have been found
to be ineffective, the reasons advanced being a lack of strategic focus and the
fact that too many things – and the wrong things – are measured.
Kaplan and Norton developed the BSC for the private sector and published their
findings in an article in 1992, followed by developments which they published in
six subsequent articles between 1993 and 2001. Four books on the BSC were
also published by Kaplan and Norton between 1996 and 2006. The present-day
BSC developed from there and is now widely used, with more than 60% of
Fortune 1000 companies and 40% of companies in Europe using some form of
BSC. The development of the BSC extended to the public sector, where the
successful execution of strategy has been attributed to its use, with the City of
Charlotte, North Carolina, widely considered to be the best example.
184
The use of the BSC was found to meet the performance measurement needs of
organisations operating in the information age. These needs include a system
that is integrated, ensures strategy execution by aligning current operations to
strategic goals, assesses progress in achieving the mission rather than simply
measuring inputs and outputs, strikes a balance between intangible assets
which are the drivers of success and the integrity of financial numbers, retains
measures of past performance and adds measures to create future value. It
was found that the measurement of government performance is difficult. Even
though timeliness, quality and cost are just as important in the public as in the
private sector, the effect of unhappy constituents is only felt in the long term, not
the short term. Eight public sector benefits of using the BSC were determined,
namely: strategy execution; it demonstrates accountability and generates
results; it attracts scarce resources, namely funding and employees; it creates a
focus on strategy; it produces information, not data, by identifying critical drivers
of success; the use of the BSC avoids outsourcing by producing quality results
at efficient prices; it drives change to reach desired outcomes; and it inspires
trust by proving accountability.
After arguments in favour of the BSC, the author expressed the warning that the
BSC has been variously interpreted. However, implementation according to the
construct of Kaplan and Norton seems to be positively linked to more successful
outcomes. Practical difficulties in BSC implementation could arise and culture
and ideology need to be taken into account during implementation. Despite
these warnings, the BSC was found to be influential and widely accepted. The
BSC was found to make strategy actionable, therefore executable at all levels
by translating strategy into day-to-day action plans and initiatives at all levels of
the organisation. The BSC also provides an exact view of what should be done
to ensure successful operations. The BSC framework, which has been adapted
for the public sector, elevates the mission to the top of the BSC, with the
customer perspective flowing from and into the mission. The strategy remains at

185
the core and the perspectives are: Customer, Financial, Internal Processes and
Employee Learning and Growth. Collectively these show how value is created
for customers while costs are controlled, how to enhance internal capabilities
and how to invest in employees, processes, technology and innovation.
Two different opinions on the BSC translation process were illustrated
diagrammatically which, when combined, commence with clarifying the mission
and end with the cascading of the BSC to all levels of the organisation. It was
argued in this chapter that “You cannot manage what you cannot measure”, and
equally that: “You cannot measure what you cannot describe”. Strategy
mapping was found to be a one-page diagram used to describe and visualise
the strategy of the organisation through explicit cause-and-effect relationships
between the objectives in the four BSC perspectives. The objectives were
identified as critical landmarks in the process of achieving the strategy.
The chapter concluded with a preliminary appraisal of the suitability of
Monitoring and Evaluation versus the BSC for addressing the departmental
factors hampering delivery. It was argued that the preliminary appraisal of the
suitability of a performance measurement system should hinge on the potential
of the system to address the collective departmental factors hampering delivery
under the Upgrading of Informal Settlements Programme. Based on this,
Monitoring and Evaluation was not found to be suitable, but the BSC was.
Chapter 5 will apply the BSC framework to the Upgrading of Informal
Settlements Programme to determine whether the BSC is a suitable tool for
addressing each of the departmental factors hampering delivery. Where the
BSC is found to be suitable, a conceptual framework will be developed to guide
the application of the BSC to the Upgrading of Informal Settlements
Programme.

186
CHAPTER 5
THE BSC FRAMEWORK FOR THE UPGRADING OF INFORMAL
SETTLEMENTS PROGRAMME
5.1 INTRODUCTION
In chapter 4, the BSC as a performance measurement tool in the public sector
was analysed to gain insight into the contribution that the BSC, which is an
integrated framework, could make. This was followed by a preliminary appraisal
which indicated that Monitoring and Evaluation, part of the Government-wide
Monitoring and Evaluation System, is not a suitable tool for addressing the
collective departmental factors hampering delivery under the Upgrading of
Informal Settlements Programme, whereas the BSC has the potential to do so.
This chapter begins by measuring whether the BSC is compatible with the
fundamental principles for housing policy development and the core values of
the National Department of Human Settlements. The reasoning behind this is
that any concepts which could become part of policy have to be compatible with
the principles for housing policy development and the core values that are part
of the national framework for the delivery of subsidised housing. Secondly, the
suitability of the BSC for addressing each of the departmental factors
hampering delivery under the Upgrading of Informal Settlements Programme
will be critically assessed. Lastly, a BSC framework approach will be applied to
the Upgrading of Informal Settlements Programme to serve as a basic point of
departure should a BSC approach be considered for future use. For this reason,
a conceptual framework for the implementation of the BSC to the Upgrading of
Informal Settlements Programme will be developed. The framework begins with
a discussion of common pitfalls in BSC implementation and includes elements
that must be present for successful BSC implementation as well as elements
187
that could prevent successful BSC implementation. Lastly, a possible BSC
approach to the Upgrading of Informal Settlements Programme is developed.
This approach follows the BSC translation process clarified earlier in the study.
5.2 COMPATIBILITY OF THE BSC WITH THE PRINCIPLES FOR
HOUSING POLICY DEVELOPMENT AND CORE VALUES
In earlier discussions, core values are defined as deeply held beliefs about and
a codification of how everyone is expected to behave in an organisation, which
should be evident from the day-to-day behaviour of employees. Core values
can also be seen as the way the organisation will function in attempting to
achieve its mission (paragraph 4.5.2). In chapter 2, six principles with which all
housing/human settlements policies must comply were discussed (paragraph
2.5) and six core values of the National Department of Human Settlements were
identified (paragraph 2.7). The observation was made at the time that the core
values are similar to but not identical with the fundamental principles.
Adherence to Batho Pele principles, meaning people first, is a core value which
needs to be identified and discussed here because it was not dealt with earlier
in the study. Figure 5.1 therefore identifies the eight Batho Pele principles and
the discussion following directly after the illustration briefly explains each
principle. In order to avoid duplication where the BSC is measured for
compatibility against the fundamental principles and then against the core
values, similar concepts have been grouped for ease of discussion. Figure 5.1
is an own initiative and design that links the fundamental principles, the core
values and the Batho Pele Principles deemed to be similar, retaining the
numbering used earlier in the study.
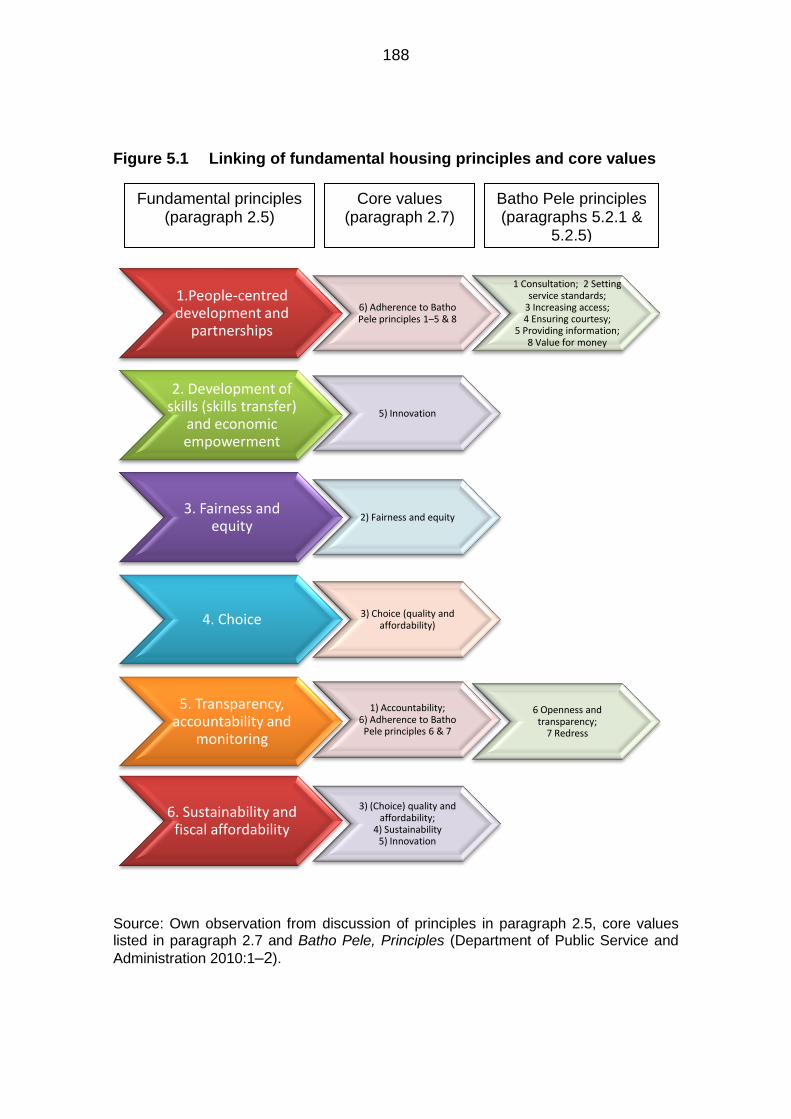
188
Figure 5.1 Linking of fundamental housing principles and core values
Source: Own observation from discussion of principles in paragraph 2.5, core values listed in paragraph 2.7 and Batho Pele, Principles (Department of Public Service and
Administration 2010:1–2).
1.People-centred development and
partnerships
6) Adherence to Batho Pele principles 1–5 & 8
1 Consultation; 2 Setting service standards;
3 Increasing access; 4 Ensuring courtesy;
5 Providing information; 8 Value for money
2. Development of skills (skills transfer)
and economic empowerment
5) Innovation
3. Fairness and equity
2) Fairness and equity
4. Choice 3) Choice (quality and affordability)
5. Transparency, accountability and
monitoring
1) Accountability; 6) Adherence to Batho Pele principles 6 & 7
6 Openness and transparency;
7 Redress
6. Sustainability and fiscal affordability
3) (Choice) quality and affordability;
4) Sustainability 5) Innovation
Fundamental principles (paragraph 2.5)
Core values (paragraph 2.7)
Batho Pele principles (paragraphs 5.2.1 &
5.2.5)
189
As mentioned with the linking of the concepts, the design of figure 5.1 is an own
observation. The information in figure 5.1 has been drawn from textual
discussions in acknowledged sources. In the headings to paragraphs 5.2.1 to
5.2.6, the principle is stated first and the linked core value is stated after the
backslash. Where the terms coincide, the core value has not been repeated. In
the discussion, the fundamental principle is briefly discussed first, then the core
value/Batho Pele principle(s) where relevant, followed by the measurement of
the BSC against each principle to determine compatibility.
5.2.1 People-centred development and partnerships/ Batho Pele
principles 1–5 & 8
According to this principle, government acts as a facilitator by creating
institutional frameworks and support structures. Adequate housing can then be
delivered through participation by all role players in mobilising resources, which
includes decentralisation of the housing process to local government level
(paragraph 2.5.1).
The Batho Pele principles 1–5 and 8 appear to link up with this concept, as
illustrated in figure 5.1 above and briefly sketched below, with corresponding
numerical references:
1 Consultation – comprehensive and representative consultation with users of
services, including surveys, interviews, consultation with groups, meetings
with representative bodies.
2 Setting service standards – citizens should be involved in the development
of service delivery standards, which should be benchmarked against
international standards, with due regard for South Africa’s level of
development.

190
3 Increasing access – a prime aim of Batho Pele is to provide a framework for
making decisions about the delivery of services to the public, including
improving access.
4 Ensuring courtesy – requires treating citizens with empathy and respect and
communicating services as well as the problems experienced.
5 Providing information – managers and employees should make service
delivery matters available to fellow staff, especially at the point of delivery.
8 Value for money – service/improvements the public would like to see could
often reduce costs, for example a satisfactory explanation in response to a
query could prevent the costly processing of a form which has been
completed incorrectly.
(Department of Public Service and Administration 2010:1–2)
The focus of the customer perspective of the BSC is on who the customer is
and how value can be created for the customer (figure 4.8). The customer could
be any potential beneficiary, supplier, developer or taxpayer. While focusing on
identifying the customer, and searching for ways of adding value for the
customer, the scene will be set for people-centred developments and
partnerships to flourish. In addition, while identifying ways of creating value for
the customer, the opportunity is created to include the Batho Pele principles 1–5
and 8 in the BSC framework to best serve the customer.
The BSC aims for balance between leading indicators, namely present drivers
of future economic success and lagging indicators, namely results of past
action, resulting in a framework which can measure and/or manage intangible
assets (figure 4.7). Customer/supplier relationships are identified as intangible
assets which are present drivers of future economic success (paragraph 4.2.3).

191
From the above discussion, it appears that the BSC will support and enhance
the integration of the principle of people-centred development and Batho Pele
principles 1–5 and 8, which form part of the core values adopted by the National
Department of Human Settlements.
5.2.2 Development of skills (skills transfer) and economic empowerment/
innovation
This principle requires that housing policies support community participation,
leading to the development of skills and economic empowerment (paragraph
2.5.2). In figure 5.1, the fifth core value, namely “Innovation” was linked to this
principle.
“Creating jobs and providing housing” and “Building awareness and enhancing
information communication” are national strategies which support the
development of skills and economic empowerment (figures 2.8 and 2.9). As part
of the BSC translation process, the BSC at national level will be cascaded down
to provincial and municipal levels. While cascading the BSC, consensus will be
gained on the mission and strategies appropriate to the provincial and municipal
levels of housing/human settlements departments, which would obviously have
to be aligned to national-level strategies in support of the development of skills
and economic empowerment.
Employee knowledge and innovative cultures are identified as intangible assets
which are the present drivers of economic success (paragraph 4.2.3). The BSC
is able to measure/manage intangible assets, thereby contributing to skills
development and innovation. It is claimed that the application of the BSC
creates a complete and integrated framework which also measures how to
invest in employees, processes, technology and innovation (paragraph 4.4.1).
The essence of the BSC is identified as translating strategy into day-to-day
192
actions plans which are aligned at individual, organisational and cross-
departmental levels. It is also noted that the BSC should be used as a system of
communicating, informing and learning (paragraph 4.6). The BSC is shown to
create a balance between various measures, notably a balance between
internal and external measures and organisation-wide and organisational silo
measures (figure 4.7). Through the BSC, staff are guided to focus on
innovation, identifying critical processes and learning and growth, while
balancing this against a focus on customers and stakeholders, thereby adding
to skills development and innovation. A broadening of focus by staff from a silo
mentality, namely focusing only on the goals of the operational unit or personal
goals, to the desire to create a balance between silo goals and the goals of the
organisation as a whole, will contribute to the skills development of staff.
5.2.3 Fairness and equity
In terms of this principle, housing policies must allow for equal and equitable
access to housing and goods and services in urban and rural contexts, as well
as accommodating the disabled, single parent families, the youth and all
persons with special needs (paragraph 2.5.3).
Because the BSC takes the mission, clarifies the strategy and creates a
framework to make strategy actionable, there is ample scope to build equal
access to housing by rural and urban communities into strategies. In defining
the first question posed in the customer perspective of the BSC, namely who
the customer is, special needs persons and those who are disabled, single
parent families and the youth can be taken into account.

193
5.2.4 Choice
This principle dictates that policies should encourage collective efforts by
people to improve their housing situation and allow for individual choice
(paragraph 2.5.4). The BSC appears to support the principle/value of choice
because it could form part of the response to the second question posed in the
customer perspective, namely how value can be created for the customer.
5.2.5 Transparency, accountability and monitoring/ Batho Pele principles
6 & 7
Transparency guards against certain people or groups benefitting more than
others, while systems should be in place to ensure accountability and monitor
progress (paragraph 2.5.5). As illustrated in figure 5.1, this appears to be
directly linked to the Batho Pele principles 6 and 7, “Openness and
transparency” and “Redress”, respectively. According to the Department of
Public Service and Administration (2010:1), a key aspect of openness and
transparency is that the public should know how the three tiers of government
operate, who is in charge and how well they utilise the resources they consume.
Armed with this knowledge, it is anticipated that the public will make
suggestions for the improvement of service delivery mechanisms and will help
to make public service employees accountable and responsible by raising
queries with them. The Batho Pele principle of Redress (Department of Public
Service and Administration 2010:1) is defined as the need to be quick to identify
when services are falling below the promised standard and to have procedures
in place to remedy the situation.
As an integrated framework, the BSC appears to support “Accountability,
openness and transparency” by being able to convert strategies into
measurable action plans (paragraph 4.6). These measurable action plans are

194
cascaded down to all levels within the organisation, including the individual level
(figure 4.12). Because the BSC does not merely focus on past action, but
balances this against a focus on the drivers of future performance (figure 4.7),
the parts of the action plans which are not being achieved are identifiable at an
early stage and corrective action can be taken without delay, thereby supporting
transparency, accountability and monitoring.
5.2.6 Sustainability and fiscal affordability/ quality and affordability
In terms of principle 6, the housing process must be sustainable in the long term
– economically, fiscally, socially, financially and politically. This requires a
balance between fiscal allocations, the number of units required, the standard of
housing, end-user affordability and the environmental impact (paragraph 2.5.6).
As illustrated in figure 5.1, the core values of “quality and affordability” appear to
be linked to this principle.
The BSC translation process goes through multiple steps and calls for the
discussion and sharing of various opinions among the BSC team members
(paragraph 4.3, figures 4.11 and 4.12). If the four BSC perspectives are applied
to the strategy, followed by strategy maps showing cause-and-effect
relationships between the perspectives, this should result in the scrutiny of
sustainability, quality and affordability aspects by the BSC team members
(paragraph 4.9).
5.3 SUITABILITY OF THE BSC FOR ADDRESSING THE
DEPARTMENTAL FACTORS HAMPERING DELIVERY UNDER THE
UPGRADING OF INFORMAL SETTLEMENTS PROGRAMME
The compatibility of the BSC having been measured above, the discussion can
proceed to the application of the BSC to determine its suitability for addressing

195
each of the factors hampering delivery under the Upgrading of Informal
Settlements Programme, as opposed to the preliminary appraisal based on the
collective factors in the latter part of chapter 4.
The departmental factors hampering delivery under the Upgrading of Informal
Settlements Programme are illustrated in figure 3.9 and discussed in
paragraphs 3.6.1 to 3.6.8 of this study. The BSC as a performance
measurement tool is discussed in chapter 4 of this study. In paragraph 4.4.2,
warnings were expressed regarding factors that could affect the success of the
BSC. These include culture, the need to implement a BSC that is true to the
construct of Kaplan and Norton (1992, 1993, 1996a, 1996b, 1996c, 1996d,
2001a, 2001b, 2001c, 2004, 2006) and the need for caution with the
implementation process. In the assessment of the suitability of the BSC which
follows in figures 5.2 to 5.9, the assumption is made that these warnings have
been heeded.
The use of diagrams as well as the choice of the design and content of figures
5.2 to 5.9 are an own observation. In each of figures 5.2 to 5.9, a diagrammatic
illustration is done which indicates a departmental factor perceived to be
hampering delivery on the left hand side of the diagram. On the right hand side
of each diagram, an own understanding of the BSC is applied to the specific
factor to assess whether the BSC is a suitable tool for addressing this factor.
For ease of reference, corresponding colours are used in figure 3.9 and figures
5.2 to 5.9.
196
Figure 5.2 Suitability of the BSC for addressing disjuncture between
long-term visions and actual actions on the ground
Factor hampering delivery:
Suitability of the BSC for addressing the factor hampering delivery:
Source: Own application from discussions and illustrations in this study, as referenced above.
•The public sector BSC framework starts by clarifying the mission, followed by the vision, while taking the core values into account. In the process, these concepts tend to move from being merely words on paper to acquiring actual meaning for staff within the organisation (figures 4.8, 4.11 & 4.12).
• During the translation/creation process of the BSC, the mission and vision are translated into strategies and strategic themes, in a process which takes core values and competencies into account. The process ensures the alignment of the mission, core values, vision, competencies and strategies (figures 4.11 & 4.12).
•Through the translation process, the BSC can ensure that actual actions on the ground correspond to actions required to execute the strategy, avoiding strategic paradox, which occurs when actions on the ground differ from those required to execute the strategy (figures 4.11, 4.12, 4.2 & paragraph 4.4).
•The BSC is an operational framework which guides the translation of the mission and aligned strategies into measurable actions required at an operational level, thereby avoiding the disjuncture between visions and actual actions on the ground (figure 4.1 & paragraph 4.4).
•The BSC is cascaded down to all operational levels, including to the individual level, ensuring that measurable actions at all levels are aligned to the mission (figures 4.11 & 4.12).
•Based on the above discussion, the BSC is suitable for addressing this factor.
1. Disjuncture
between long-term
visions and actual
actions on the ground
– paragraph
3.6.1 of this study
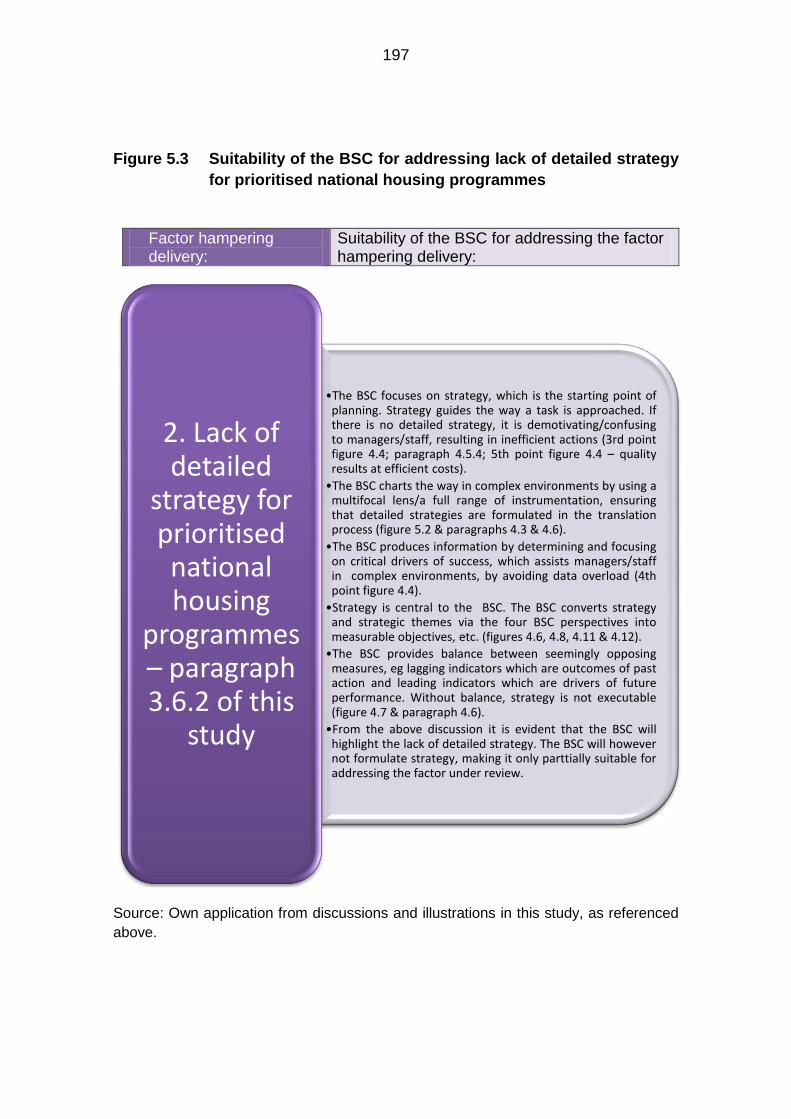
197
Figure 5.3 Suitability of the BSC for addressing lack of detailed strategy
for prioritised national housing programmes
Factor hampering delivery:
Suitability of the BSC for addressing the factor hampering delivery:
Source: Own application from discussions and illustrations in this study, as referenced
above.
•The BSC focuses on strategy, which is the starting point of planning. Strategy guides the way a task is approached. If there is no detailed strategy, it is demotivating/confusing to managers/staff, resulting in inefficient actions (3rd point figure 4.4; paragraph 4.5.4; 5th point figure 4.4 – quality results at efficient costs).
•The BSC charts the way in complex environments by using a multifocal lens/a full range of instrumentation, ensuring that detailed strategies are formulated in the translation process (figure 5.2 & paragraphs 4.3 & 4.6).
•The BSC produces information by determining and focusing on critical drivers of success, which assists managers/staff in complex environments, by avoiding data overload (4th point figure 4.4).
•Strategy is central to the BSC. The BSC converts strategy and strategic themes via the four BSC perspectives into measurable objectives, etc. (figures 4.6, 4.8, 4.11 & 4.12).
•The BSC provides balance between seemingly opposing measures, eg lagging indicators which are outcomes of past action and leading indicators which are drivers of future performance. Without balance, strategy is not executable (figure 4.7 & paragraph 4.6).
•From the above discussion it is evident that the BSC will highlight the lack of detailed strategy. The BSC will however not formulate strategy, making it only parttially suitable for addressing the factor under review.
2. Lack of detailed
strategy for prioritised national housing
programmes – paragraph 3.6.2 of this
study

198
Figure 5.4 Suitability of the BSC for addressing outdated information on
income and needs of targeted beneficiaries
Factor hampering delivery:
Suitability of the BSC for addressing the factor hampering delivery:
Source: Own application from discussions and illustrations in this study, as referenced above.
•In the BSC customer perspective, the focus is on the customer, and two questions are posed, namely: "Whom do we define as our customer? How do we add value for our customer? " While brainstorming answers in the BSC translation process, it becomes obvious that updated information is needed to define, add value to and serve the targeted customers (beneficiaries) (figures 4.8, 4.11, 4.12 & paragraph 4.8.1).
•The BSC focuses on various aspects that include both generic measures, (eg customer satisfaction) and specific measures (eg short lead times, on-time delivery, new products and services) which in turn supplement information on targeted beneficiaries for the Upgrading of Informal Settlements Programme (paragraph 4.8.1).
•The BSC promotes balance between external measures which focus on customers and stakeholders vs internal measures. This should result in an updated overall picture of who the targeted beneficiaries should be and which of their needs should be prioritised (figure 4.7).
•From the discussion above, the BSC would be suitable for addressing this factor.
3. Outdated information on income
and needs of targeted
beneficiaries – paragraph 3.6.3 of this
study

199
Figure 5.5 Suitability of the BSC for addressing lack of buy-in to,
understanding of and compliance with policies by staff
Factor hampering delivery:
Suitability of the BSC for addressing the factor hampering delivery:
Source: Own application from discussions and illustrations in this study, as referenced above.
•The whole process followed in the BSC implementation helps to drive change in order to reach desired outcomes. As a result of the process, buy-in by staff is probably the result of their seeing the logic followed and their involvement in the process (6th point, figure 4.4).
•The BSC promotes understanding because it is also a communication tool for informing and learning (figure 4.5 & paragraph 4.6).
•The BSC Employee Learning and Growth Perspective focuses on employees, organisational procedures and systems. This perpective revolves around determining whether the entity has the correct mix of skills, organisational climate, alignment and motivation required for success. As a result, shortcomings will be addressed which include the reskilling of staff and improved, aligned organisational procedures (figures 4.8, 4.10 & paragraph 4.8.4).
•The BSC promotes buy-in and understanding of staff by aiming for a balance between organisation-wide and unit only goals (silo); as well as between external and internal measures (innovation, critical processes and learning and growth) (figure 4.7).
•As an integrated framework, the BSC assists with compliance of policies by staff by guiding the formulation of measurable action plans which are cascaded all the way down the organisation to the individual level (paragraph 4.6 & figure 4.12).
•During the BSC translation process, a one-page strategy map will be drafted, which will provide the overall picture, promoting understanding by staff (figure 4.12 & paragraph 4.9).
•The discussion above indicates that the BSC is suitable for addressing this factor. Avoiding implementation pitfalls and ensuring that the BSC is implemented true to the construct of Kaplan and Norton is however very important.
4. Lack of buy-in to,
understanding of and
compliance with policies
by staff – paragraph
3.6.4 of this study

200
Figure 5.6 Suitability of the BSC for addressing bureaucratic and inefficient funding sources and transfers
Factor hampering delivery:
Suitability of the BSC for addressing the factor hampering delivery:
Source: Own application from discussions and illustrations in this study, as referenced above
• The BSC promotes a focus on systems and organisational procedures through the Employee Learning and Growth Perspective. According to this perspective, shortcomings will be identified and addressed through improved systems and aligned organisational procedures (figures 4.8, 4.10 & paragraph 4.8.4).
• If funding sources and transfers are determined as internal processes which are critical to success or improved outcomes, this factor could be addressed under the Internal Processes Perspective, where the BSC would probably determine new processes for addressing the factor hampering delivery (figure 4.8 & paragraph 4.8.3).
• Based on the discussion above, the BSC is suitable for addressing this factor.
5. Bureaucratic
and inefficient
funding sources and transfers – paragraph
3.6.5 of this study

201
Figure 5.7 Suitability of the BSC for addressing lack of accountability
for decision-making and delivery failures
Factor hampering delivery:
Suitability of the BSC for addressing the factor hampering delivery:
Source: Own application from discussions and illustrations in this study, as referenced above.
•By measuring progress in achieving mission-based objectives, the BSC demonstrates accountability. Once the BSC has proven accountability, trust from the community, employees and funders follow (1st & 7th point figure 4.4).
•The BSC promotes accountablilty by staff by translating the mission, strategies etc. into measurable objectives and measures, which are cascaded down to every level, including the individual level (figure 4.12).
•The BSC can address accountability through the adaptation of systems or organisational procedures which are part of the Employee Learning and Growth Perspective (figures 4.8 & 4.10).
•If identified as critical to successful outcomes, the BSC can address accountability through the Internal Processes Perspective (figure 4.8)
•The BSC provides balance between Leading indicators (drivers of future performance) and lagging indicators (outcomes of past action) to assist in accelerating delivery (figure 4.7).
•From the discussion above, the BSC is suitable for addressing this factor.
6. Lack of accountability for decision-making and
delivery failures – paragraph
3.6.6 of this study
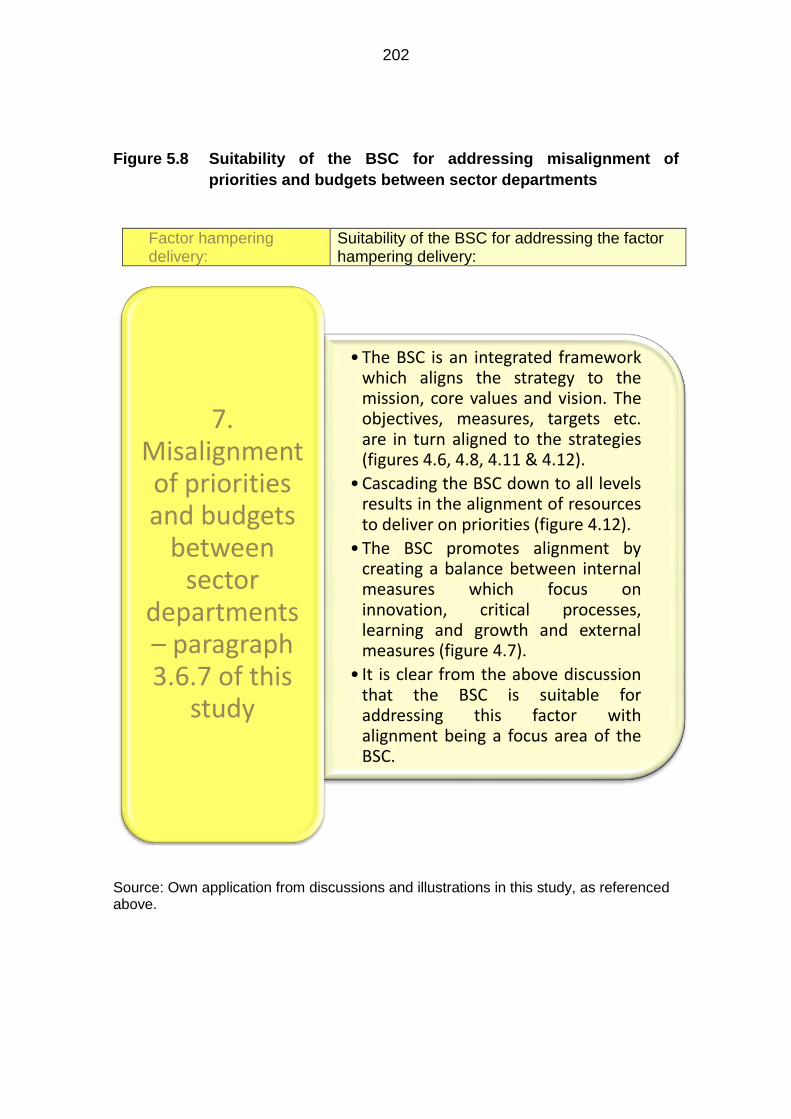
202
Figure 5.8 Suitability of the BSC for addressing misalignment of
priorities and budgets between sector departments
Factor hampering delivery:
Suitability of the BSC for addressing the factor hampering delivery:
Source: Own application from discussions and illustrations in this study, as referenced above.
•The BSC is an integrated framework which aligns the strategy to the mission, core values and vision. The objectives, measures, targets etc. are in turn aligned to the strategies (figures 4.6, 4.8, 4.11 & 4.12).
•Cascading the BSC down to all levels results in the alignment of resources to deliver on priorities (figure 4.12).
•The BSC promotes alignment by creating a balance between internal measures which focus on innovation, critical processes, learning and growth and external measures (figure 4.7).
• It is clear from the above discussion that the BSC is suitable for addressing this factor with alignment being a focus area of the BSC.
7. Misalignment of priorities and budgets
between sector
departments – paragraph 3.6.7 of this
study

203
Figure 5.9 Suitability of the BSC for addressing lack of
coordination and communication between sector
departments
Factor hampering delivery:
Suitability of the BSC for addressing the factor hampering delivery:
Source: Own application from discussions and illustrations in this study, as referenced above.
• The BSC promotes communication as it is a tool for informing and learning (figure 4.5 & paragraph 4.6).
• In the translation process of the BSC, strategy mapping sessions are held where "if-then" questions are asked to determine cause-and-effect relationships between the various BSC perspectives. These sessions call for input from all teams, contributing to coordination and communication (figure 4.12 & paragraph 4.9)
• The BSC Employee Learning and Growth Perspective focuses on employees, organisational procedures and systems, where coordination will receive due attention (figures 4.8 & 4.10).
• The BSC provides for a balance between organisation-wide and unit only goals (silo) that will contribute to addressing coordination issues (figure 4.7).
• Based on the discussion, the BSC is suitable for addressing this factor.
8. Lack of coordination
and communication between sector departments – paragraph 3.6.8
of this study

204
In each of figures 5.2 to 5.9, the suitability of the BSC for addressing the factors
hampering delivery was assessed. The BSC was found to be suitable for
addressing the first and the third to the eighth factors that hamper delivery. The
BSC was found to be partially suitable for addressing the second factor
hampering delivery. After having discussed the suitability of the BSC for
addressing the departmental factors hampering delivery, the most critical pitfalls
for successful BSC implementation should be considered.
5.4 AVOIDING THE PITFALLS IN BSC IMPLEMENTATION
Soderberg et al. (2011:705) have developed a five-level taxonomy which can be
used to guide the BSC implementation process. Based on the taxonomy, the
results of the study show that BSCs implemented in a manner that is true to
Kaplan and Norton’s framework (1992, 1993, 1996a, 1996b, 1996c, 1996d,
2001a, 2001b, 2001c, 2004, 2006) offer the most benefits. The transformation
of the BSC from a concept to a tool is seen as a major challenge (Soderberg et
al. 2011:689, 704) and therefore organisation-wide implementation may be
difficult (Weistein & Bukovinsky 2009:53). The implementation process relies on
formal and informal processes and requires that written and unwritten rules be
taken into account (Mooraj et al. 1999:489), but the respondents in a study of
14 municipal governments that had implemented the BSC believed that the
benefits outweigh the costs (Chan 2004:219).
5.4.1 Crucial elements without which BSC implementation cannot be
considered
5.4.1.1 Leadership and support of senior executives
Kaplan and Norton (1996b:285) argue that the leadership and support of senior
executives is crucial for the successful implementation of a BSC framework.

205
Kaplan and Norton (2001a:361), Braam and Nijssen (2008:16) and Weinstein
and Bukovinsky (2009:53) concur. Organisations that complied with the criteria
for a fully developed (level 5) and structurally complete (levels 3 and 4) BSC
were found to have had greater senior management involvement during the
BSC implementation process. These firms also reported fewer BSCs that were
cluttered with inappropriate measures or measures not linked to cause-and-
effect relationships (Soderberg et al. 2011:704).
5.4.1.2 Burning platform for change
In addition to senior executive support, Niven (2003:47–48) is of the opinion that
before the “powerful benefits” of the BSC framework can be mobilised in an
organisation, a burning need, also referred to as a “burning platform”, for
change has to be determined. This is supported by a case study of seven
private sector financial companies which found that the initial reasons given for
the implementation of the BSC affect the benefits which can be gained from
BSC use (Agostino & Arnaboldi 2011:99, 109–111). Niven (2003:47–48)
explains that the “burning platform” for change to the BSC includes
understanding:
why this is being done
the need to get involved with this
the value of this to the organisation
Resistance to change is natural (Mooraj et al. 1999:490). Learning anxieties are
central to the resistance, consequently, people will only adapt to change when
“survival anxiety is greater than learning anxiety” (Niven 2003:48). The
implementation of the BSC helps to encourage change by placing the focus of
employees on long-term objectives (Mooraj et al. 1999:490). The objectives that
will be developed by the BSC team will communicate the survival anxieties of
206
the organisation to the staff and why change is required for success. The BSC
reduces learning anxiety by providing a safe environment for learning (Niven
2003:48).
5.4.1.3 BSC team and leader
Kaplan and Norton (1996b:64) posit that a BSC cannot be drawn up by one
person, because no single person has the requisite knowledge to tell the
strategic story of the organisation. Kaplan and Norton (1996b:64) contend that
collective know-how, experience and input have to be provided by all well-
prepared staff members who are part of the BSC team, a position with which
Niven (2003:51) concurs. This approach enables the BSC team to own and
drive the BSC concept under the guidance of the BSC team
leader/driver/architect (Kaplan & Norton 1996b:64; 2001a:362–363). Kaplan
and Norton (2001a:363) argue that a broader set of people could be involved in
smaller subgroups, possibly focusing on one perspective. The work of the
subgroups would then be integrated at a bigger meeting.
5.4.2 Reasons why the BSC may not work
5.4.2.1 BSCs which are not reviewed periodically
A BSC should not be built once and then left unchanged (Niven 2003:287), but
should be maintained (Weinstein & Bukovinsky 2009:54). In fact, best practices
studies have shown that most practitioners do an annual critical examination of
the BSC to ensure that the strategic story is still being told accurately (Niven
2003:287–288).

207
5.4.2.2 BSC development labelled a short-term or systems project
Niven (2003:289) is of the opinion that the development of a BSC which is seen
as a “project” is doomed to failure. He argues that a project is a short-term
endeavour and the BSC should become a fixture in management processes. To
reach this level, it should be used continually in every facet of the operation,
including decision-making and resource allocation. On the other hand, Nair
(2004:157) believes that BSC development should be treated as a project. This
reflects a different viewpoint in that Nair does not see a project as short term,
but rather focuses on the strict and controlled sequencing that flows from the
planning and implementation of projects. According to Kaplan and Norton
(2001a:365), the BSC should be seen as a management project, and certainly
not as a systems project. Kaplan and Norton (2001a:365) argue that where
consultants are appointed to develop and implement a BSC management
system, engagement with managers on strategic dialogue rarely occurs.
Consultants are more likely to design a system which gives managers desktop
access to masses of data, but which does not contribute to the organisation’s
being managed differently – and is never used. Kaplan and Norton (2001a:365–
366) suggest that all the steps as set out in figure 4.12 should be followed.
Once the BSC is cascaded down to all levels, the appointment of consultants to
design systems may be considered.
5.4.2.3 Lack of disciplined management and leadership
Nair (2004:157) sees disciplined management and leadership as crucial to
successful BSC implementation. Nair believes that without disciplined
management and leadership, projects tend to be “overcommitted, understaffed
and miscalculated”.

208
5.4.2.4 Keeping the BSC at the top
According to Kaplan and Norton (2001a:364), while the senior executives
should support BSC implementation, the mistake of involving them only should
be avoided. In order to be effective, eventually BSC implementation should
involve everyone in the organisation. The aim is for all staff to have an
understanding of the strategy and contribute to implementing it, therefore
making strategy “everyone’s everyday job”.
5.4.2.5 Drawn-out development process
Kaplan and Norton (2001a:364) caution that the BSC is a building process and
that a limited amount of time should be invested in the initial development and
implementation. Even though there may not be data for all measures on the
BSC at first, implementation should proceed. Delaying implementation to design
the “perfect” BSC will inevitably lead to its being ineffective or even not being
implemented at all. Once the implementation of the initial BSC is embedded in
the management system, developments and refinements are done on a
continual basis.
5.4.2.6 Appointing inexperienced consultants
Kaplan and Norton (2001a:366) argue that the appointment of consultants who
do not specialise on the BSC and have not implemented multiple successful
BSCs will most likely doom it to failure. An inexperienced consultant generally
proceeds with the implementation of a measurement or information system that
he/she is familiar with, makes minor changes and calls it a BSC, even though it
is not.
209
5.4.2.7 Only introducing the BSC for compensation
While BSC implementation can effectively be used as a tool to gain the
attention and commitment of individuals, Kaplan and Norton (2001a:366–367)
are of the opinion that great care should be taken when a BSC is implemented
mainly for compensation, because there is a tendency to skip the conversion of
the strategy into measures. When strategy is skipped, a collection of financial
and nonfinancial measures that resemble a stakeholder or strategy scorecard
are grouped. Kaplan and Norton (2001a:367) argue that this type of scorecard
includes indicators for environmental performance, employee diversity and
community ratings. This is not a BSC, however, and it will not contribute to
making strategy actionable.
5.5 POSSIBLE BSC FRAMEWORK APPROACH TO DELIVERY UNDER
THE UPGRADING OF INFORMAL SETTLEMENTS PROGRAMME
After having discussed the necessity for the successful implementation of the
BSC as well as possible pitfalls, a BSC framework approach to delivery under
the Upgrading of Informal Settlements Programme will be discussed and
illustrated. As mentioned earlier in this chapter, the BSC cannot be drawn up by
one person; therefore this study does not propose to develop a BSC for the
Upgrading of Informal Settlements Programme, but focuses on the approach
and considerations which could be taken into account by a BSC team should
implementation be decided on. The discussion is centred round the translation
process, more specifically the rectangle above the pyramid and the top three
triangles of the pyramid illustrated in figure 4.11 and the top four triangles of the
pyramid in figure 4.12.

210
5.5.1 Gain consensus on the mission, core values, vision and strategy
The meanings of the terms as defined in paragraph 4.5 have been used as a
basis for the discussion which follows. To be able to follow the BSC translation
process, therefore to gain consensus on the above concepts, all provincial and
municipal housing/human settlements departments must have a mission and
vision of their own which should be related to their reason for existence (Why do
we exist?) and envisaged future (What is our desired future state?). This would
obviously have to be in line with that of the National Department of Human
Settlements, but would be adapted to the functions/role at their level of
government. All provincial human settlements departments are likely to have
the same mission and vision because they all use the same national framework
for the delivery of subsidised housing and are faced with similar challenges,
which would translate to similar mission and vision statements. Similarly,
municipalities with the same level of accreditation would probably have the
same mission and vision. The core values should correspond to those chosen
by the National Department of Human Settlements, discussed earlier in this
chapter, because staff at all three tiers of government should comply with the
open proclamation of expected behaviour in achieving the mission.
Next, consensus must be reached on the “how”, therefore on the strategies.
Strategies reflect the broad directional priorities and indicate where the
available resources should be allocated to (What is the game plan/which
specific activities would have to be put in place?). This would be in line with
national strategies contained in the BNG plan illustrated in figures 2.1 to 2.10 of
this study, but, as mentioned above, adapted to the functions/roles at that level
of government. The strategy would focus largely on delivery issues and would
probably include specific strategies to ensure delivery under all housing
programmes as well as making provision for priority programmes, or areas in
which government has made specific commitments, like the Upgrading of

211
Informal Settlements Programme. Niven (2003:53–54) emphasises the
importance of strategy, because primarily the BSC is a tool for converting
strategy into action. Strategy is therefore key to the BSC and if no strategy is
formulated, actions within the organisation will be based on an ad hoc collection
of financial and nonfinancial measures that are not linked to one another. In
fact, without strategy and the linkage of the cause-and-effect relationships,
there is no indication of whether an improvement in one area is having the
desired effect on other key indicators or whether conflicting initiatives are being
pursued.
Because no strategies found in the literature review relate to the provincial and
municipal levels of government, nor specifically to the Upgrading of Informal
Settlements Programme, this discussion cannot make suggestions on an
approach to convert the strategy into objectives and measures through the four
BSC perspectives indicated in figures 4.11 and 4.12. In the absence of a
provincial and municipal level strategy, it is argued that a strategy would have to
include a game plan on how delivery under the national framework for the
delivery of subsidised housing would be approached at both provincial and
municipal levels. The decision was therefore taken to base the application of the
four BSC perspectives on the Upgrading of Informal Settlements Programme,
which is part of the national framework and a key part of this study. Once
strategy has been formulated and consensus gained, the approach used in
formulating the considerations discussed in paragraph 5.5.2 would have to be
applied to the strategy in order to translate the strategy into objectives and
measures.
5.5.2 Considerations in formulating objectives and measures using the
four BSC perspectives
In this paragraph, a more specific approach than that described in paragraph
5.5.1 and considerations based on the four perspectives of the BSC, as applied

212
to the Upgrading of Informal Settlements Programme, are applied. Because the
application is limited because no strategy is available and a BSC team effort is
required, it cannot illustrate the full power of the BSC. However, simply viewing
the Upgrading of Informal Settlements Programme and the challenges
documented in the literature from the four different BSC perspectives, provides
a glimpse of the potential of applying the BSC. Because this is a conceptual
framework intended to guide a possible future application, the lack of a strategy
is not deemed to be a major obstacle. It should be emphasised that the
application of the four BSC perspectives documented in figures 5.10 to 5.12 and
5.14 to 5.16 cannot be viewed as a solution, but rather as a possible approach
and seen as considerations which could be taken into account by a BSC team
once they have documented the strategy and begin formulating the objectives in
the development of a BSC.
Earlier in this study, the term “objective” was defined as a concise statement
commencing with a verb which describes specific acts which must be performed
in an organisation to execute its strategy (paragraph 4.5.5). The term “measure”
was defined as a standard used to evaluate and communicate performance
against expected results and two types of measures were identified, namely
core outcome measures and performance drivers (paragraph 4.5.6). According
to Kaplan and Norton (1996b:149–150), all BSCs use certain generic measures
which tend to be common across industries and organisations. These measures
are generally results of past action, also referred to as core outcome measures
or lag indicators, for example employee skills, customer satisfaction etc. On the
other hand, the lead indicators are the drivers of future performance which will
deliver the intended value to the customers. Lead indicators tend to be the
measures unique to the specific unit within the organisation, those reflecting the
strategy, for example specific internal processes and employee learning and
growth objectives.
213
The present performance indicators for the Upgrading of Informal Settlements
Programme were found to include outcome measures only, that is to say only
the results of past action (paragraph 4.10.2.1). For strategy to be executable,
balance needs to be achieved between various seemingly opposing key
performance measures and indicators, which include the results of past action
and the drivers of future performance (paragraph 4.6). The BSC can create
balance between lagging and leading indicators, namely results of past action
and drivers of future performance, which are customised to the strategy of the
unit (paragraph 4.6 and figure 4.7). The considerations included in paragraphs
5.5.2.1 to 5.5.2.4 focus more on the drivers of future performance to suggest
specific actions to ensure that balance is created between outcomes of past
action and drivers of future performance, which could contribute to improved
value delivered to customers through strategy execution.
5.5.2.1 The BSC Customer Perspective
In the public sector BSC framework, the Customer Perspective is directly below
the mission and flows from and into it, emphasising the importance of this
perspective in striving towards the mission. The Customer Perspective focuses
on two questions, namely who the customer is and how value can be created
for the customer (figure 4.8). The discussion of the BSC Customer Perspective
shows that the public sector “customer” includes the body providing finance and
the group to be served (paragraph 4.8.1). The body providing finance would be
the National Treasury, but ultimately the taxpayer. The group to be served
would be the very poor citizens who qualify for subsidised housing, therefore
housing applicants or potential beneficiaries. The BSC Customer Perspective
shows how the strategy and operations contribute to customer value.
The provisional results of the occupancy audit which were discussed earlier in
the study show that only 70% of subsidised housing occupants are the rightful
beneficiaries (paragraph 2.6.1). It therefore appears that approximately 30% of
214
subsidised houses may be occupied by illicit occupiers, namely persons who
would not meet the qualification criteria to receive a subsidised house. Based
on this, it could be argued that 30% of the annual budget of the National
Department of Human Settlements since 1994, a substantial figure, is not
presently assisting the poorest of the poor and reducing the housing backlog
figures, as intended. This indicates that the present strategy and operations are
failing to identify the “customer” and are therefore not contributing to customer
value.
The insight which could be gained by applying the two BSC Customer
Perspective questions to the provisions of the Upgrading of Informal
Settlements Programme is identified in figure 5.10 below. An example of an
insight which could be gained is that a high-value asset such as a subsidised
house cannot merely be handed over to a potential beneficiary based on an
application completed years before. Before delivery, an updated assessment
should be done, not only of the present household income and ownership of
assets, but also of the individual needs of the household. The individual needs
include the type of house, tenure, location in relation to employment, schools,
transport etc, all of which would help to determine whether poor people would
be willing to live in an allocated dwelling. This could provide a new approach to
and perspective on the present delivery process. Figure 5.10 is an own initiative
and design, reflecting an own understanding of the integration of the public
sector BSC Customer Perspective as applied to the Upgrading of Informal
Settlements Programme.
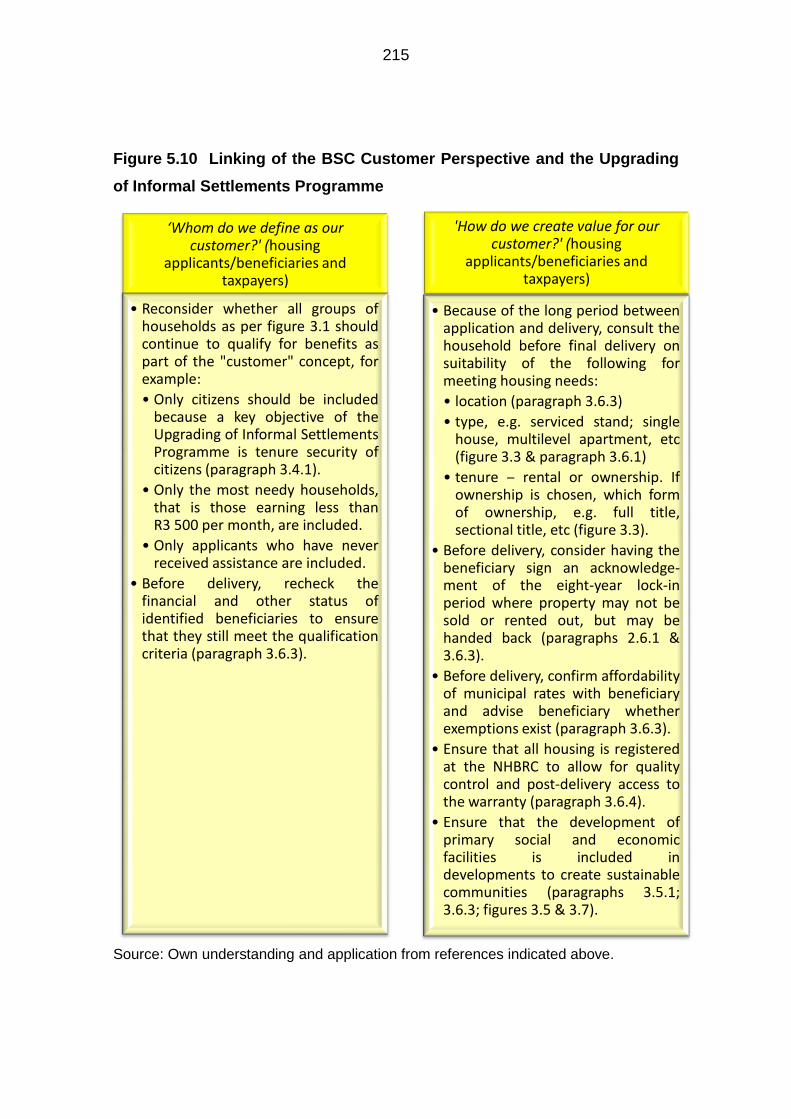
215
Figure 5.10 Linking of the BSC Customer Perspective and the Upgrading
of Informal Settlements Programme
Source: Own understanding and application from references indicated above.
‘Whom do we define as our customer?' (housing
applicants/beneficiaries and taxpayers)
• Reconsider whether all groups of households as per figure 3.1 should continue to qualify for benefits as part of the "customer" concept, for example:
• Only citizens should be included because a key objective of the Upgrading of Informal Settlements Programme is tenure security of citizens (paragraph 3.4.1).
• Only the most needy households, that is those earning less than R3 500 per month, are included.
• Only applicants who have never received assistance are included.
• Before delivery, recheck the financial and other status of identified beneficiaries to ensure that they still meet the qualification criteria (paragraph 3.6.3).
'How do we create value for our customer?' (housing
applicants/beneficiaries and taxpayers)
• Because of the long period between application and delivery, consult the household before final delivery on suitability of the following for meeting housing needs:
• location (paragraph 3.6.3)
• type, e.g. serviced stand; single house, multilevel apartment, etc (figure 3.3 & paragraph 3.6.1)
• tenure ‒ rental or ownership. If ownership is chosen, which form of ownership, e.g. full title, sectional title, etc (figure 3.3).
• Before delivery, consider having the beneficiary sign an acknowledge-ment of the eight-year lock-in period where property may not be sold or rented out, but may be handed back (paragraphs 2.6.1 & 3.6.3).
• Before delivery, confirm affordability of municipal rates with beneficiary and advise beneficiary whether exemptions exist (paragraph 3.6.3).
• Ensure that all housing is registered at the NHBRC to allow for quality control and post-delivery access to the warranty (paragraph 3.6.4).
• Ensure that the development of primary social and economic facilities is included in developments to create sustainable communities (paragraphs 3.5.1; 3.6.3; figures 3.5 & 3.7).
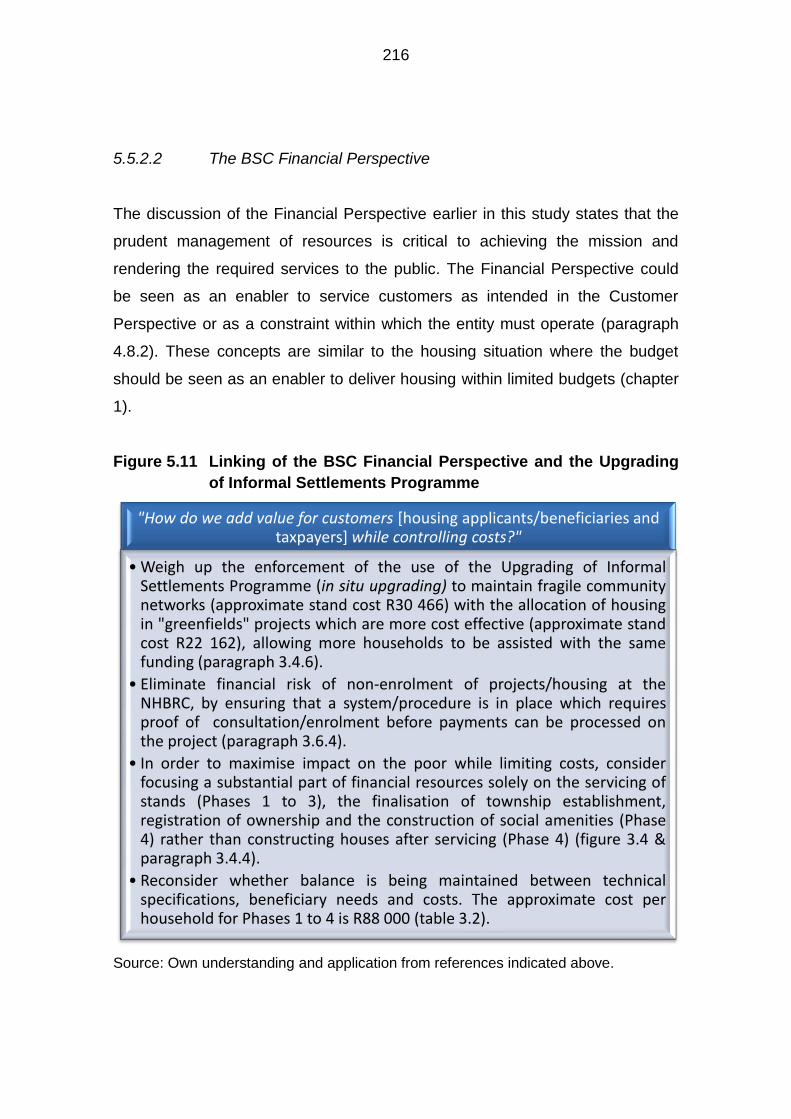
216
5.5.2.2 The BSC Financial Perspective
The discussion of the Financial Perspective earlier in this study states that the
prudent management of resources is critical to achieving the mission and
rendering the required services to the public. The Financial Perspective could
be seen as an enabler to service customers as intended in the Customer
Perspective or as a constraint within which the entity must operate (paragraph
4.8.2). These concepts are similar to the housing situation where the budget
should be seen as an enabler to deliver housing within limited budgets (chapter
1).
Figure 5.11 Linking of the BSC Financial Perspective and the Upgrading
of Informal Settlements Programme
Source: Own understanding and application from references indicated above.
"How do we add value for customers [housing applicants/beneficiaries and taxpayers] while controlling costs?"
• Weigh up the enforcement of the use of the Upgrading of Informal Settlements Programme (in situ upgrading) to maintain fragile community networks (approximate stand cost R30 466) with the allocation of housing in "greenfields" projects which are more cost effective (approximate stand cost R22 162), allowing more households to be assisted with the same funding (paragraph 3.4.6).
• Eliminate financial risk of non-enrolment of projects/housing at the NHBRC, by ensuring that a system/procedure is in place which requires proof of consultation/enrolment before payments can be processed on the project (paragraph 3.6.4).
• In order to maximise impact on the poor while limiting costs, consider focusing a substantial part of financial resources solely on the servicing of stands (Phases 1 to 3), the finalisation of township establishment, registration of ownership and the construction of social amenities (Phase 4) rather than constructing houses after servicing (Phase 4) (figure 3.4 & paragraph 3.4.4).
• Reconsider whether balance is being maintained between technical specifications, beneficiary needs and costs. The approximate cost per household for Phases 1 to 4 is R88 000 (table 3.2).

217
Figure 5.11 is an own design reflecting an own understanding of the integration
of the public sector BSC Financial Perspective as applied to the Upgrading of
Informal Settlements Programme.
5.5.2.3 The BSC Internal Processes Perspective
Only the processes which could lead to improved outcomes for customers,
therefore critical processes, are dealt with under the Internal Processes
Perspective (paragraph 4.8.3). While only the BSC team members are in a
position to decide which processes are critical, the discussion in figure 5.12
should be seen as indicating possible critical processes for consideration,
selected on the basis of the discussion in chapter 3. The processes not deemed
critical to improved outcomes would form part of the Learning and Growth
Perspective dealt with in paragraph 5.5.2.4. Figure 5.12 is an own design
reflecting an own understanding of the integration of the public sector BSC
Internal Processes Perspective as applied to the Upgrading of Informal
Settlements Programme.

218
Figure 5.12 Linking of the BSC Internal Processes Perspective and the
Upgrading of Informal Settlements Programme
Source: Own understanding and application from references indicated above.
5.5.2.4 The BSC Employee Learning and Growth Perspective
The Employee Learning and Growth Perspective is divided into three elements,
namely: Organisational procedures/climate, Systems (information technology
and others) and Employee skills and competencies. In this perspective, four
questions are asked, one general and one on each of the three elements. The
general question is ”How do we enable ourselves to grow and change, meeting
ongoing demands?” (paragraph 4.8.4). Figures 5.14 to 5.16 below apply the
three elements of the Employee Learning and Growth Perspective to the
Upgrading of Informal Settlements Programme. Figures 5.14 to 5.16 are an own
design reflecting an own understanding of the integration of the public sector
"To satisfy customers (applicants/beneficiaries/taxpayers), while meeting budgetary constraints, at which business processes must we excel?"
• Consider developing a national IT-based system(s) which allows for all steps/functions required for projects/housing under the Upgrading of Informal Settlements Programme (figures 3.4 to 3.7) to be signed off electronically to:
• enable authorised staff to assess and monitor the progress on all projects and determine when and where projects are being held up (paragraphs 3.6.4 to 3.6.6)
• ensure that all steps in each of the phases have been followed, e.g. required NHBRC consultation and registration are rigidly followed to avert quality and financial risk (figures 3.5 to 3.7; paragraphs 2.10.2.6 & 3.6.4)
• facilitate accountability because the responsibility is linked to the person authorised by the manager to sign off each step, therefore ultimately the manager of the section (paragraph 3.6.6)
• provide an overall picture of the functions required that would help staff to develop an understanding of the requirements of and their role in using the Upgrading of Informal Settlements Programme (paragraph 3.6.4)
• ensure that steps are consistently followed, regardless of changing staff and/or managers (paragraph 3.6.6)
• ensure steps/functions are linked to benchmarked timeframes for actions, failing which they would be flagged for follow-ups (paragraph 3.6.6)

219
BSC Employee Learning and Growth Perspective as applied to the Upgrading
of Informal Settlements Programme.
Before applying the questions in the Employee Learning and Growth
Perspective to the Upgrading of Informal Settlements Programme, the link
between the three elements and results needs to be discussed. Kaplan and
Norton’s Employee Learning and Growth Measurement Framework (1996:129),
illustrated in figure 5.13, indicates how the elements of the Employee Learning
and Growth Perspective feed into employee satisfaction, which in turn feeds
into employee productivity and retention, culminating in results.
Figure 5.13 Employee Learning and Growth Measurement Framework
Source: Kaplan & Norton 1996b:129, adapted.
Results
Employee productivity
Employee satisfaction
Employee retention
Employee skills (figure
5.14)
Technology infrastructure (figure 5.15)
Organisational procedures /climate
for action (alignment, motivation,
empowerment) (figure 5.16)

220
In figure 5.13, the diagram by Kaplan and Norton (1996b:129) has been
adapted by the own addition of colour and cross-referencing to figures 5.14 to
5.16 in the three rectangles at the bottom of the diagram. The wording in the
rectangle at the bottom right-hand side of the diagram has been expanded from
the original “Climate for action” to the full description provided, to reflect the
broader meaning indicated in figure 5.16. It will be noted from figure 5.13 that
the three elements of the Employee Learning and Growth Perspective are
indicated at the bottom of the illustration and are cross-referenced and colour-
coded to supporting figures.

221
Figure 5.14 Linking of the BSC Employee Learning and Growth
Perspective (Employee skills and competencies) and the
Upgrading of Informal Settlements Programme
Source: Own understanding and application from references indicated above.
Employee skills and competencies Does the entity have the correct mix of skills to meet the
challenges? (figures 4.10 & 5.13)
•Consider whether all the provincial and municipal human settlements departments have staff with competencies to advise on and apply the unique aspects of the Upgrading of Informal Settlements Programme, or will reskilling have to be done/other options considered (figure 5.10). The unique aspects include:
•who qualifies for benefits (figure 3.1)
•which benefits each qualify for (figure 3.2)
•which choices are available to qualifying households (figure 3.3)
•Consider whether the potential exists for all municipal human settlement departments to have the professional staff (e.g. surveyors, township planners, etc.) to perform the various specialised functions required for Phases 1‒4 of the Upgrading of Informal Settlements Programme (figures 3.4‒ 3.7 & paragraph 3.4.4). Alternatively, should certain functions:
•be contracted out to consultants by municipailities which do not have the professional capacity and if so, will all municipalities have the managerial capacity to effectively manage the consultants?
•not be devolved to municipal level?
•be dealt with by specialised housing institutions formed for that purpose?
•be performed at provincial level, provided that provincial departments have the professional capacity?
•be contracted out to consultants by provinces which do not have sufficient professional capacity? If so, would the provinces have the managerial capacity to effectively manage the consultants for such a large number of projects?
•Consider whether staff have an overall understanding of and insight into the voluminous policies and pieces of legislation which have been implemented over the past years or whether training should be done. It is crucial that staff understand why there was a need for the changes as well as the manner in which these changes called for the adaptation of their functions and actions to contribute to the desired outcomes (paragraphs 3.6.1, 3.6.4 & 3.6.6).
•Consider whether the managers have the required management knowledge and skills and whether shortcomings can be addressed through mentoring and/or training (paragraph 3.6.6).
Employee Learning and Growth Perspective: “How do we enable ourselves to grow and change, meeting ongoing demands?” (figure 4.10)
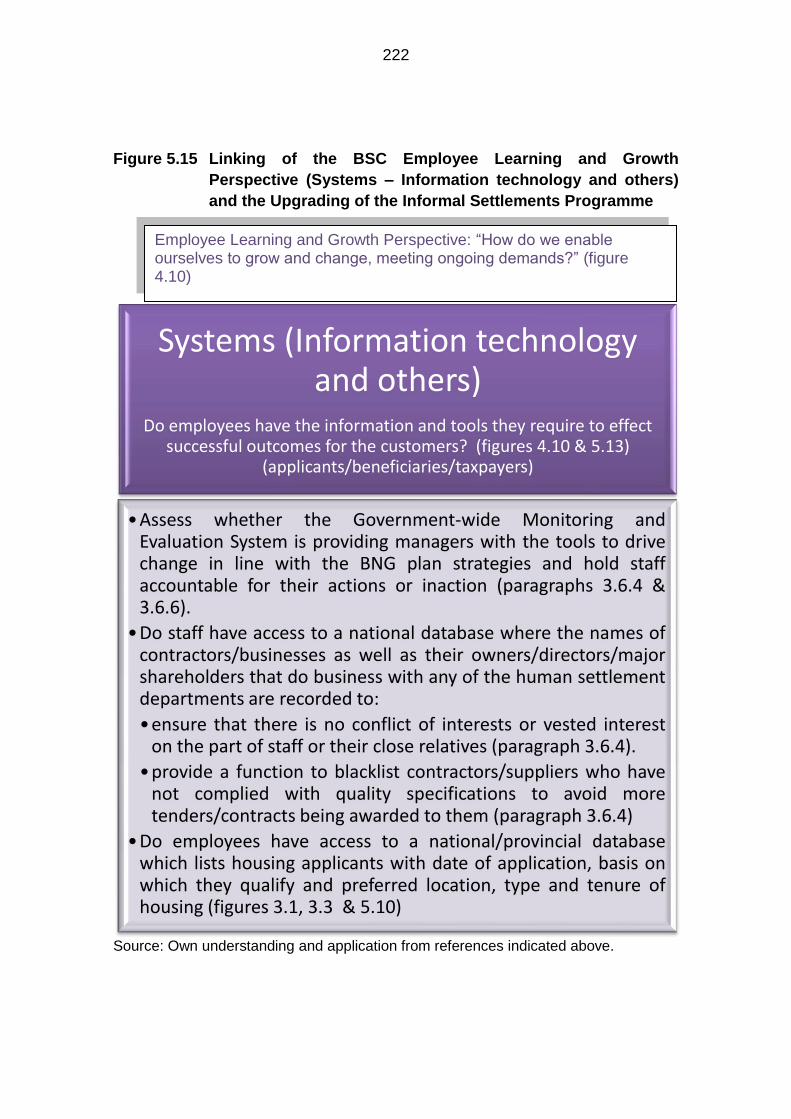
222
Figure 5.15 Linking of the BSC Employee Learning and Growth
Perspective (Systems – Information technology and others)
and the Upgrading of the Informal Settlements Programme
Source: Own understanding and application from references indicated above.
Systems (Information technology and others)
Do employees have the information and tools they require to effect successful outcomes for the customers? (figures 4.10 & 5.13)
(applicants/beneficiaries/taxpayers)
•Assess whether the Government-wide Monitoring and Evaluation System is providing managers with the tools to drive change in line with the BNG plan strategies and hold staff accountable for their actions or inaction (paragraphs 3.6.4 & 3.6.6).
•Do staff have access to a national database where the names of contractors/businesses as well as their owners/directors/major shareholders that do business with any of the human settlement departments are recorded to:
•ensure that there is no conflict of interests or vested interest on the part of staff or their close relatives (paragraph 3.6.4).
•provide a function to blacklist contractors/suppliers who have not complied with quality specifications to avoid more tenders/contracts being awarded to them (paragraph 3.6.4)
•Do employees have access to a national/provincial database which lists housing applicants with date of application, basis on which they qualify and preferred location, type and tenure of housing (figures 3.1, 3.3 & 5.10)
Employee Learning and Growth Perspective: “How do we enable ourselves to grow and change, meeting ongoing demands?” (figure 4.10)

223
Figure 5.16 Linking of the BSC Employee Learning and Growth Perspective (Organisational procedures/climate) and the Upgrading of Informal Settlements Programme
Source: Own understanding and application from references indicated above.
Organisational procedures/climate Does the entity have the proper culture, alignment and motivation
required for success? (figures 4.10 & 5.13) •Consider whether mechanisms are in place to establish a culture of serving the "customer', that is the very
poor, and delivering what is being expected by providers of funding, which are ultimately the taxpayers (paragraph 3.6.4 & figure 5.10).
•Consider whether a culture of compliance with legislation and policies has been established and whether procedures have been put in place to ensure compliance (paragraphs 2.6 & 3.6.4).
•Consider whether mechanisms are in place to monitor and address staff satisfaction, which directly feeds into motivation and retention, which in turn feeds into the attaining of results ‒ which is serving the customer and enabling delivery (figure 5.13, paragraphs 3.6 & 4.10).
•Consider whether balance exists between nurturing the initiative of staff to perform their duties in a manner of their choice and certain documented and compulsory standard operating procedures where actions have to be performed as prescribed, e.g. funds reserved once the application is approved (figures 3.4‒3.7, paragraphs 3.4.4 & 3.6.4).
•Reconsider the present procedure/process of transferring funds from provinces to municipalities which is resulting in municipalities receiving funds too late to plan spending (paragraph 3.6.5).
•Weigh up the present benefits of the separation of funding sources with the resultant delays which are affecting delivery (e.g. land acquisition funding to be sourced and approved by Department of Land Affairs) (paragraph 3.6.5 & figure 3.6).
•Assess whether the present transitional process to devolve functions to the third tier of government as and when capacity is established is resulting in uncertainty and inaction by staff (paragraph 2.10.1).
•The department is presently in a transitional phase to devolve housing functions to the second and third tiers of government. The provisions of the Housing Act focus on functions once transition is complete, but the situation at present reflects a limited municipal role until level 3 accreditation has been reached (figure 2.12, table 2.3 & paragraph 2.10.1). In this transitional phase:
•Are measures in place to avoid uncertainty by staff which could be a cause of inaction? (paragraph 3.6.4)
•Is the division of functions between every province and municipality agreed on and documented to ensure that no duplications, ommissions or counterproductive actions are taking place? (paragraphs 3.6.1, 3.6.4, 3.6.7 & 3.6.8)
•Assess whether the uncertainty in the mandates of the governmental housing institutions have been clarified to avoid duplications, ommissions or counterproductive actions between them and the three tiers of government (paragraphs 2.10.2, 3.6.4 & figure 2.14).
•Consider procedures/systems to link priority programmes/projects with the budget required to ensure the prioritisation and delivery of such programmes/projects (paragraph 3.6.7).
Employee Learning and Growth Perspective: “How do we enable ourselves to grow and change, meeting ongoing demands?” (figure 4.10)

224
5.6 SUMMARY
Firstly, in this chapter, the compatibility of the BSC was measured against the
principles for housing policy development and the core values of the National
Department of Human Settlements. To simplify the measurement of
compatibility, similar fundamental housing principles and core values were
linked. It was found that the last core value, namely Batho Pele principles,
consists of eight principles, which were included in the linking referred to above
and discussed briefly.
Next, the suitability of the BSC for addressing the departmental factors
hampering delivery under the Upgrading of Informal Settlements Programme
was critically assessed. The departmental factors hampering delivery from
chapter 3 were indicated in eight diagrams and the understanding gained of the
BSC, as presented in chapter 4, was applied to each of the factors hampering
delivery to assess suitability.
The remainder of the chapter was devoted to the development of a conceptual
framework to guide the application of the BSC to the Upgrading of Informal
Settlements Programme. The first part of the conceptual framework discussed
the pitfalls which should be avoided for successful BSC implementation. Three
crucial elements were identified that had to be in place for successful BSC
implementation and seven elements which could prevent successful BSC
implementation were mentioned.
The second part of the conceptual framework applied the BSC translation
process to the Upgrading of Informal Settlements Programme. The discussion
firstly centred around gaining consensus on the mission, core values, vision and
strategy. The suggestion was made that consensus should be gained on a
separate mission and vision statement, not just at national level, but also at

225
provincial and municipal level for the human settlements departments of the
three tiers. The mission and vision statements would be aligned, but would
reflect the different contributions to housing delivery at each of the three tiers of
government. It was argued that the core values would apply to human
settlements departments at all three tiers of government because all staff
should comply with the open proclamation of expected behaviour in achieving
the mission. The next step in the translation process was to reach consensus
on the strategy of the human settlements departments at each of the three tiers.
It was argued that the strategy of the human settlements departments at the
provincial and municipal levels would differ, but would have to be aligned to
each other and to the eight national strategies in the BNG plan, adapted by the
2009 Housing Code. The discussion found that without strategy at each level,
actions would be based on an ad hoc collection of financial and nonfinancial
measures that are not linked to each other, often resulting in conflicting
initiatives being pursued or improvements in one area having a detrimental
effect on other areas.
In continuing with the BSC translation process, the next step would be to apply
the four BSC perspectives to the strategy to formulate objectives and measures.
This was not done for three reasons: this is a conceptual framework and not the
actual BSC development process; the discussion earlier in the chapter found
that the BSC cannot be developed by one person, but has to be a combined
effort by the BSC team; no delivery strategies were found in the literature review
relating to human settlements departments at provincial and municipal levels,
nor were strategies found for the Upgrading of Informal Settlements
Programme. In view of the above, it was decided to apply the BSC to the
provisions of the Upgrading of Informal Settlements Programme to provide a
glimpse of the potential of the BSC should a decision be taken to proceed with
BSC implementation. It was found that this BSC application identifies an
approach and considerations which could be taken into account by the BSC

226
team once consensus has been reached on the strategy and strategy mapping
is about to commence. The considerations were illustrated in a diagram for
each of the Customer, Financial and Internal Processes Perspectives and three
diagrams for the Employee Learning and Growth Perspective.
Chapter 6 will focus on the conclusions reached from this study and will make a
recommendation.

227
CHAPTER 6
CONCLUSIONS AND RECOMMENDATION
6.1 INTRODUCTION
In the course of this study, multiple opinions and arguments have been
reviewed. The content of this chapter will be devoted to the arguments or
insights gained which are deemed to be of particular importance. Conclusions
will be drawn and a recommendation will be made relating to the study. The
study concludes with suggestions for future research. Before commencing with
the conclusions and recommendation, a brief overview of the background to
and focus of the research included in chapter 1 needs to be provided.
6.2 OVERVIEW OF THE BACKGROUND TO AND FOCUS OF THE
RESEARCH
In chapter 1 of this study, the complexity of the subsidised housing environment
was outlined. Further, it was indicated that various actions have been taken by
the National Department of Human Settlements since the advent of democracy
in 1994 in the belief that these would address the challenges faced and
accelerate the delivery of subsidised housing so that all informal settlements
could be eradicated by 2014. One of the actions taken was the creation of a
national framework for the delivery of subsidised housing, the greatest part of
which has been in place for a number of years. In spite of this, housing delivery
has not accelerated as anticipated. Most arguments centred around the housing
budget, which was seen as the main constraint. A new approach that involved
viewing the budget as an enabler rather than a constraint was proposed, with
the focus on finding a way to ensure the best value for every rand spent on
housing. This was seen as an indication that internal or departmental
228
weaknesses that could be affecting delivery should be addressed. In searching
for a solution, a new development in Strategic Management Accounting, the
Balanced Scorecard (BSC), is discussed. This is an integrated framework of
performance measurement and management. While the BSC was developed
for businesses operating in complex environments, it has been successfully
adapted for use in the public sector to execute strategy by converting strategy
into measurable actions at the various operational levels.
As noted in paragraph 1.3, the overall research aim was to critically assess
whether the BSC as a performance measurement tool is suitable for addressing
the departmental factors hampering delivery under the Upgrading of Informal
Settlements Programme and, where it is found to be suitable, to develop a
conceptual framework to guide any possible future application of the BSC to the
Upgrading of Informal Settlements Programme.
6.3 CONCLUSIONS
In paragraph 1.3, research objectives were formulated from the overall research
aim. This paragraph reviews the findings of this study on the basis of the
original, individual research objectives which provide a framework for the
discussion. Certain challenges faced during the research process, along with
the decisions taken, have also been included. In order to structure the
discussion, each individual research objective from paragraph 1.3 has been
indicated in a rectangle, with the related findings shown below the rectangle. As
in paragraph 1.3, “programme” indicates the Upgrading of Informal Settlements
Programme.

229
1) Produce an overall picture of the national framework for the delivery of subsidised
housing and indicate where the “programme” fits into the framework.
A great deal of detailed research was required to locate and confirm the
currency of all information presented in chapter 2, which has, for ease of
reference in this study, been termed “the national framework for the delivery of
subsidised housing”. The framework was found to include: principles,
legislation, policies, plans, a national housing mission, core values, vision,
strategies, housing programmes, facilitators and funding structures. During the
research process, the complexity of housing delivery referred to before became
even more evident. Ways had to be found to deal with the data overload
experienced because of the large number of very lengthy publications. In an
attempt to limit the volume and retain the focus, information deemed to be core
was extracted from the data, grouped and set out in brief discussions and in
multiple diagrams. The policy documents and pieces of legislation selected
were limited to national housing legislation and therefore laws that apply to the
public service in general such as the Public Finance Management Act (PFMA)
were excluded from the discussion. Provincial and municipal legislation was
also excluded because the aim was to centre the discussion at national level,
for a national housing programme (paragraph 1.4).
Arguably, the most important policy document that forms part of the national
framework is the BNG plan of 2004. While it was anticipated that the BNG plan
would result in “drastic and paradigm shifting measures” in housing delivery,
enabling the eradication of the 2,4 million informal settlement dwellings by 2014,
it appears to have accelerated housing delivery only slightly, to the point of
halting the growth in informal settlement dwellings, but making no inroads
towards eradication.

230
The nine strategies contained in the BNG plan were deemed significant
because they contain the game plan of the National Department of Human
Settlements. The strategies were identified and illustrated in figures, which also
reflect the changes in strategy from the 2004 BNG plan to the 2009 Housing
Code. This technique highlighted an important change in emphasis in Strategy
2, namely, a change from the “progressive eradication of informal settlements”
to the “upgrading of informal settlements”.
The detailed literature review revealed that the delivery of housing is being
facilitated by the three tiers of government and housing institutions that report
directly to the National Department of Human Settlements. A diagram was
compiled to illustrate the roles of the nine governmental housing institutions, as
well as give an indication of the institutions where operations have been or are
being terminated. Relating to the three tiers of government, research revealed
the intention to devolve responsibility for housing delivery from roles presently
performed mainly by provincial human settlement departments down to the third
tier of government, namely the municipal level. The functions of the three tiers
of government are therefore in a transitional phase. An overview of the housing
functions of the three tiers of government based on the Housing Act of 1997
was compiled in a diagram. This appears to reflect the functions once the
devolution of housing delivery to municipal level has been completed. Further
research indicated that municipalities have to earn a level 3 accreditation before
they can perform all the housing delivery functions. Accreditation levels aim to
ensure that capacity is established before functions are devolved, as assessed
against the Accreditation Framework for Municipalities to Administer National
Housing Programmes.
A diagrammatic overview was compiled of the sixteen national housing
programmes, which are divided into four intervention categories, namely:
Financial, Incremental, Social and Rental and lastly, Rural. The Upgrading of

231
Informal Settlements Programme, a programme in the Incremental Intervention
category, was identified in red on the diagram to draw attention to this core part
of the study and to indicate where it fits into the national framework.
From the above conclusions, it is clear that objective 1) was met in that the
national framework for the delivery of subsidised housing that includes
principles, legislation, policies, plans, a national housing mission, core values,
vision, strategies, housing programmes, facilitators and funding structures was
produced. Further, it was found that the Upgrading of Informal Settlements
Programme is one of sixteen national housing programmes. The presentation in
chapter 2 of the national framework for the delivery of subsidised housing, with
special reference to the figures that were compiled, produced an overall picture
of the national framework for the delivery of subsidised housing which had not
been available before chapter 2 was presented.
2) Investigate the complexity of the upgrading of informal settlements scenario,
including the provisions of the “programme”.
In meeting objective 2), the literature review revealed that informal settlements
form round large cities because housing delivery cannot keep up with the
unplanned and increased demand due to the rapid urbanisation of the poor
searching for work. The greatest part of the housing backlog was found to be
represented by households living in informal settlements. An investigation of the
documentation since 1994 shows that in spite of the continual delivery of
subsidised housing, informal settlement households increased from 1,4 million
in 1994 to 2,4 million in 2005, but remained constant at 2,4 million until 2009. A
review of the literature revealed that government’s 2004 commitment to
eradicating all of the 2,4 million informal settlements by 2014 originated in
response to the 2000 United Nations Millennium Development Goals. In 2010,

232
this commitment was revised to the upgrading of 500 000 well-located informal
settlement dwellings by 2014.
Further, the research revealed that the Upgrading of Informal Settlements
Programme applies to a whole area identified by the municipality rather than to
individual households; that it is in situ, meaning that it takes place on the site of
the informal settlement, usually while the households are still living there; and
that the municipality has to provide 10% of the funding for the project up front.
Even though the Upgrading of Informal Settlements Programme was introduced
in terms of Strategies 2 and 3 of the BNG plan of 2004, very little was published
relating to the Upgrading of Informal Settlements Programme prior to 2010. The
publication of the very lengthy 2009 Housing Code in 2010 served as an
invaluable source of information and confirmation of the very detailed provisions
of the Upgrading of Informal Settlements Programme, most of which were not
available before. The Upgrading of Informal Settlements Programme contains a
range of unique provisions relating to the qualification criteria for benefits,
various possible benefits and the decision route that households/persons who
qualify for more than one benefit would follow in choosing a benefit best suited
to their specific needs, the essence of which was extracted and illustrated
diagrammatically. Further, it was found that there are four phases in the
Upgrading of Informal Settlements Programme, each of which requires very
specific and detailed procedures to be performed. As previously, diagrams were
used to unpack and clarify the detailed procedures as well as the roles of the
facilitators. In essence, the outcome of Phases 1 to 3 is a serviced stand which
is funded from the Upgrading of Informal Settlements Programme, subsidised to
approximately R30 466 per household. The outcomes of Phase 4 are: the
completion of social amenities which form part of the drive to create sustainable
communities, funded from the Provision of Primary Social and Economic
Facilities Programme and various other sources; where applicable, housing

233
units funded from the chosen housing programme subsidised to approximately
R55 706 per household; and the registration of ownership. Investigations
revealed that the Upgrading of Informal Settlements Programme makes
provision for performance measures which were found to centre around the
long-term impact that each development has had on the community.
In the discussion above, objective 2) was met, in that informal settlements form
because housing delivery cannot keep up with the unplanned and increased
demand for housing. Further, it was found that the Upgrading of Informal
Settlements Programme was launched in response to the 2000 United Nations
Millennium Development Goals, while upgrading is done in situ and applies to a
whole area rather than to individual households. The Upgrading of Informal
Settlements Programme takes place in four phases and should include the
provision of social amenities as part of building sustainable communities. The
detailed figures that were compiled on the provisions of the Upgrading of
Informal Settlements Programme contributed to an understanding of the
programme by providing an overview which was not previously available, and
which is presented in greater detail in paragraphs 3.1 to 3.5.
3) Identify the multiple departmental factors hampering delivery under the
“programme” and organise and combine them under relevant headings.
In meeting objective 3), a very detailed literature review revealed various
opinions and arguments on departmental factors hampering delivery, as well as
specific examples linked to the Upgrading of Informal Settlements Programme.
The arguments presented by the parties from various perspectives totalled
more than twenty possible factors hampering delivery. Because such a large
number of factors would result in repetitive discussions when suitability is
assessed, it was deemed crucial to reduce the number of factors to fewer than
ten. Added to this challenge, multiple sources were found where the opinions

234
given could relate to various factors hampering delivery because of various
possible underlying causes, for example: “coordination should be improved
between government departments”. The approach was therefore followed
where general opinions were taken and linked to more detailed arguments.
After this process, arguments which were deemed to relate directly to one
another were organised and combined under the headings deemed to be most
suitable, resulting in eight factors. The factors are identified in table 6.2 in the
discussion of objective 5), so they will not be repeated here. While it is
acknowledged that personal bias partly influenced the choice of headings, the
assessment of the suitability of the BSC for addressing factors hampering
delivery countered this by placing the focus on the detailed arguments, rather
than on the headings. The choice of headings therefore had little influence on
the outcome of the suitability assessment.
In the earlier part of the study, the use of an empirical study was considered to
confirm the departmental factors hampering delivery under the Upgrading of
Informal Settlements Programme. It was decided, however, that an empirical
study of this kind was not a core part of the research and that the information
would be of limited value to the study given the present differences in the
functions and powers of the various provincial and municipal human
settlement/housing departments, as a result of the process of devolving
responsibility to the lowest level of government. It is argued that this process of
devolution means that at present staff in similar positions in different
provinces/municipalities have different levels of exposure to and involvement in
housing delivery and that this influences their opinions, so that the information
obtained is of limited value. The decision was therefore taken to use the factors
hampering delivery as determined via the detailed literature review and apply
the BSC to these factors to assess suitability.

235
In meeting objective 3), the organisation and combination of factors identified
resulted in eight departmental factors hampering delivery under the Upgrading
of Informal Settlements Programme, namely: Disjuncture between long-term
visions and actual actions on the ground; Lack of detailed strategy for prioritised
national housing programmes; Outdated information on income and needs of
targeted beneficiaries; Lack of buy-in to, understanding of and compliance with
policies by staff; Bureaucratic and inefficient funding sources and transfers;
Lack of accountability for decision-making and delivery failures; Misalignment of
priorities and budgets between sector departments; and Lack of coordination
and communication between sector departments. The identification,
organisation and combination of departmental factors hampering delivery have
contributed to knowledge in that an element of the complex delivery process
has been isolated which the human settlements departments and governmental
housing institutions at the three tiers of government would be able, collectively,
to correct. The factors determined also confirm the suggestion in chapter 1 that
delivery is being hampered not just by limited annual housing budget
allocations, but also by internal constraints. This realisation could become the
first step in addressing these constraints. A more detailed discussion of these
factors is presented in paragraph 3.6.
4) Clarify the use of the BSC as a performance measurement tool for the public
sector and do a preliminary appraisal of whether the present Monitoring and
Evaluation or the BSC has the potential to collectively address the factors
hampering delivery under the “programme”.
In meeting objective 4), the literature review revealed that dramatic changes
have taken place in the business environment over the past 35 years which
have necessitated improved performance measurement in the private and
public sectors. It is argued that “if you can’t measure it, you can’t manage it” and
that organisations must measure their present position before determining their
future direction. Because of these changes and increased pressure on the
236
fiscus, results for every tax dollar spent and greater transparency and
accountability are being called for by constituents, taxpayers and even national
governments. The concept of results for every tax dollar spent is clearly related
to the housing scenario, where it was argued that an approach of the best value
for every rand spent should be considered and money should be used more
wisely.
Completion, results and “making good on promises” are being demanded by the
constituents, who are no longer simply accepting the launching of yet another
new programme or cause. It was found that governments in general are being
criticised for being: inefficient, ineffective, self-serving, and unresponsive to
public needs and for failing in the provision of the quality and quantity of
services being demanded. The change discussed above is directly related to
the South African situation, where it was argued that there is a growing
awareness that the present approach to informal settlements is inadequate and
that the situation “constitutes a political and developmental powder-keg”
(paragraph 1.5). Further, the government commitment to eradicating or
upgrading all informal settlements by 2014 had to be reduced to the upgrading
of a limited number of informal settlement dwellings because delivery did not
accelerate as anticipated after the launching of the BNG plan (chapters 1, 2 and
3).
Stakeholders are requiring not simply that performance should be measured,
but that it should be measured at an advanced level. Consequently, it has
increasingly become the norm that the public sector is operating more like a
business than ever before, partly through the borrowing of management tools
from the private sector. The BSC is an integrated framework with a holistic
perspective that helps organisations to achieve their mission by making strategy
executable by translating the mission and strategies into objectives, measures
and targets. Because of this, it was found that the BSC has dominated the
237
performance measurement debate for at least a decade. It was found that the
BSC has been successfully adapted for use in the public sector by elevating the
mission to the top of the BSC with the customer perspective flowing from and
into it. The strategy remains at the core of the BSC and four perspectives are
used to convert the strategy into objectives and measures.
The four public sector BSC perspectives are: Customer; Financial; Internal
Processes and Employee Learning and Growth. Research found that through
the application of the BSC, a complete and integrated framework is created that
is able to measure: how value is created for current and future customers, how
internal capabilities must be enhanced, and how investment in employees,
processes, technology and innovation should be made. It is crucial that all the
measures should be linked between perspectives in a cause-and-effect
relationship, which is done through strategy mapping. The City of Charlotte,
North Carolina, is widely considered to be the best example of the BSC in the
public sector. Here the effective execution of the strategy has been attributed to
the use of the BSC. The first BSC was implemented there 15 years ago,
followed by refinements and adaptations, resulting in the present use of the
benefits of the BSC as a measurement system, strategic management system
and communication tool.
The following eight benefits of using the BSC in the public sector were
identified: Strategy execution; Demonstrates accountability and generates
results; Attracts scarce resources, namely funding and employees; Creates a
focus on strategy; Produces information, not data, by identifying critical drivers
of success; Prevents outsourcing by delivering quality results at efficient prices;
Drives change to reach desired outcomes; and Inspires trust by proving
accountability. When considering the above benefits of the BSC in relation to
the factors hampering delivery under the Upgrading of Informal Settlements

238
Programme, the BSC was found to have the potential to address all these
challenges.
The BSC supports the change in emphasis from the former practice in the
public sector of focusing reporting on the funds spent on administrative costs.
This perspective has been faulted in favour of the public sector increasingly
asking the following questions:
a) What difference is being made?
b) What results are being achieved?
c) What progress is being made in achieving the mission of the organisation?
It was established that Monitoring and Evaluation, part of a Government-wide
Monitoring and Evaluation (GWM&E) system is being used for performance
measurement. On investigation, it was determined that Monitoring and
Evaluation is centred around monitoring inputs and outputs, evaluation and
impact assessment which is identified as the link between strategy and the
impact on the community, a finding which supports questions a) and b) above.
Recent developments indicated that performance must be measured from a
broader perspective than merely that of inputs and outputs, but performance
measurement should make it possible to answer all three questions, something
for which the GWM&E system is not designed. The BSC supports the
answering of all three questions, especially question c), namely the extent to
which the mission is being achieved. The study found that the present
performance measurement indicators for the Upgrading of Informal Settlements
Programme, developed under the GWM&E system, only measure outcomes of
past performance, or what has happened, but would not drive actions to ensure
the achievement of future performance targets, which the BSC is able to do. In
the present complex delivery situation, drivers of future performance must be
included, which would ensure that delivery is driven as planned. Further, the
complexity of delivery and the departmental factors hampering delivery under

239
the Upgrading of Informal Settlements Programme call for an integrated
performance measurement framework, which the GWM&E is not able to
provide, although the BSC is.
Objective 4) was met in the preceding discussion, when it was established that
the BSC has successfully been adapted for use as a performance
measurement tool in the public sector by elevating the mission to the top of the
BSC, keeping the strategy at the core and using the following four perspectives,
namely: Customer Perspective; Financial Perspective; Internal Processes
Perspective and Employee Learning and Growth Perspective. Further, it was
found that there is a need for a new approach or tool because the present
Monitoring and Evaluation will not address the departmental factors hampering
delivery, because it is not: sufficiently comprehensive, integrated and balanced
between outcomes of past performance and drivers of future action; and it does
not measure the extent to which the mission is being achieved. On the other
hand, the BSC has the potential to address all of the above.
Because the BSC is an integrated framework designed for complex
environments, intensive research was required to gain clarity on this
development in Strategic Management Accounting as adapted for use in the
public sector. This aspect was discussed in chapter 4. As the potential of the
BSC gradually unfolded during the research process and more and more
benefits and possibilities of the BSC could be linked to the delivery challenges
faced by the Upgrading of Informal Settlements Programme, it was found to be
a very rewarding and exciting experience and one that has contributed to
improved personal understanding and growth in the discipline.
5) Critically assess the suitability of the BSC as a performance measurement tool for
addressing the departmental factors hampering delivery under the “programme”.
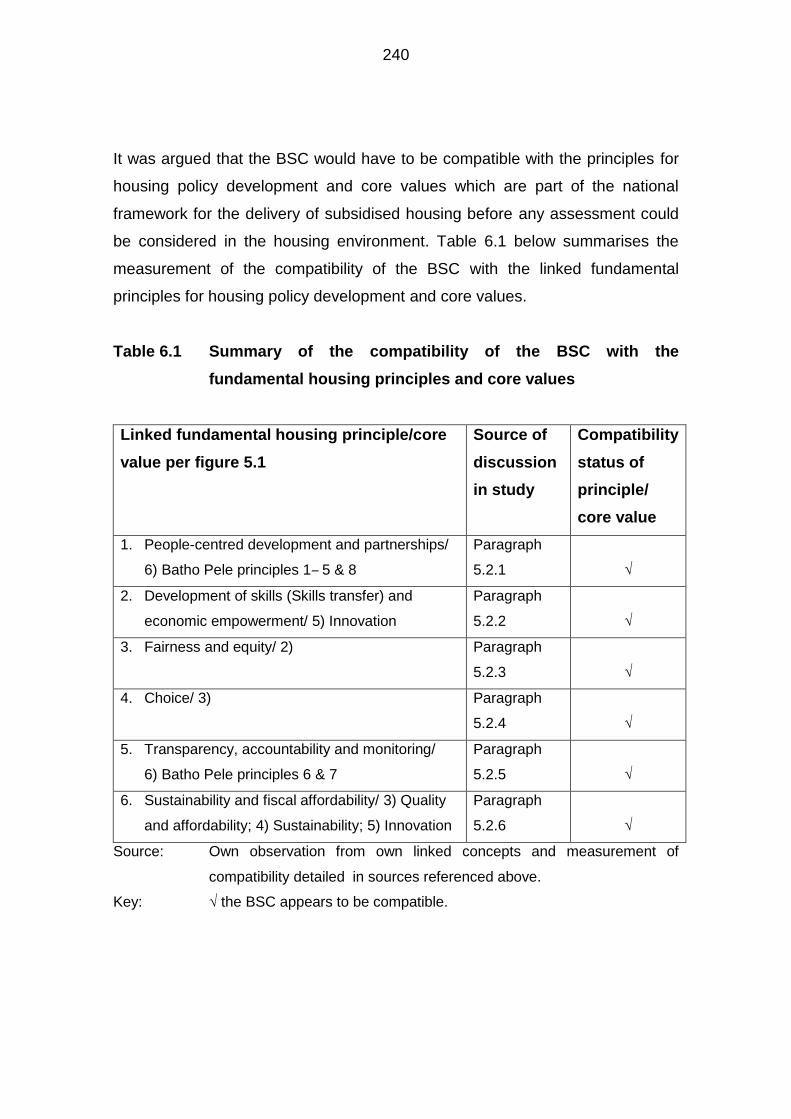
240
It was argued that the BSC would have to be compatible with the principles for
housing policy development and core values which are part of the national
framework for the delivery of subsidised housing before any assessment could
be considered in the housing environment. Table 6.1 below summarises the
measurement of the compatibility of the BSC with the linked fundamental
principles for housing policy development and core values.
Table 6.1 Summary of the compatibility of the BSC with the
fundamental housing principles and core values
Linked fundamental housing principle/core
value per figure 5.1
Source of
discussion
in study
Compatibility
status of
principle/
core value
1. People-centred development and partnerships/
6) Batho Pele principles 1‒ 5 & 8
Paragraph
5.2.1
√
2. Development of skills (Skills transfer) and
economic empowerment/ 5) Innovation
Paragraph
5.2.2
√
3. Fairness and equity/ 2) Paragraph
5.2.3
√
4. Choice/ 3) Paragraph
5.2.4
√
5. Transparency, accountability and monitoring/
6) Batho Pele principles 6 & 7
Paragraph
5.2.5
√
6. Sustainability and fiscal affordability/ 3) Quality
and affordability; 4) Sustainability; 5) Innovation
Paragraph
5.2.6
√
Source: Own observation from own linked concepts and measurement of
compatibility detailed in sources referenced above.
Key: √ the BSC appears to be compatible.
241
It appears from table 6.1 that the BSC is compatible with the principles for
housing policy development and core values of the Department of Human
Settlements. Because compatibility had been established, the discussion was
able to proceed to objective 5) to critically assess whether the BSC is a suitable
tool for addressing the departmental factors hampering delivery under the
Upgrading of Informal Settlements Programme. The assessment of the
suitability of the BSC for addressing the departmental factors hampering
delivery was done in eight figures. The overall assessment of the suitability of
the BSC is summarised in table 6.2.

242
Table 6.2 Summary of the suitability of the BSC for addressing the
departmental factors hampering delivery under the
Upgrading of Informal Settlements Programme
Factor hampering delivery (paragraph 3.6 of
the study)
Source of
observation
in study
Suitability
1. Disjuncture between long-term visions and actual
actions on the ground
Figure 5.2
√
2. Lack of detailed strategy for prioritised national
housing programmes
Figure 5.3
P
3. Outdated information on income and needs of
targeted beneficiaries
Figure 5.4
√
4. Lack of buy-in to, understanding of and compliance
with policies by staff
Figure 5.5
√
5. Bureaucratic and inefficient funding sources and
transfers
Figure 5.6
√
6. Lack of accountability for decision-making and
delivery failures
Figure 5.7
√
7. Misalignment of priorities and budgets between
sector departments
Figure 5.8
√
8. Lack of coordination and communication between
sector departments
Figure 5.9
√
Source: Own observation from own application detailed in sources referenced above
Key: √ the BSC is deemed to be a suitable tool
P the BSC is deemed to be a partially suitable tool
In table 6.2 above, it appears that the BSC is a suitable tool for addressing
seven of the eight departmental factors hampering delivery under the Upgrading
of Informal Settlements Programme. Further, it was found that the BSC is
partially suited to addressing the second departmental factor hampering
delivery. The partial suitability is due to the fact that although the BSC is not a

243
tool for formulating strategy, part of the BSC translation process requires that
the BSC team members should gain consensus on the strategy. By implication,
to gain consensus, a strategy has to exist, therefore the BSC emphasises the
need for a strategy and requires that consensus should be gained on a strategy
because it is central to the BSC.
In the discussion above, objective 5) was met in that a critical assessment of
the BSC found it to be a suitable tool because it was able to address seven of
the eight departmental factors hampering delivery under the Upgrading of
Informal Settlements Programme. Further, the BSC was able to partially
address the second factor, namely: Lack of detailed strategy for prioritised
national housing programmes, because the BSC translation process requires
that consensus be reached on the strategy. By implication, this calls for a
strategy to be formulated. The detailed discussions are presented in paragraphs
5.2 and 5.3.
In meeting objective 5), a contribution has been made to knowledge in that a
tool, namely the BSC, has been found to be suitable to assist the Department of
Human Settlements in addressing the departmental factors hampering delivery
under the Upgrading of Informal Settlements Programme. The BSC is a tool
which is also compatible with the housing principles and core values of the
department. Before this research, no possible solution existed for addressing
the departmental factors hampering delivery under the Upgrading of Informal
Settlements Programme.
6) Develop a conceptual framework to guide a possible future application of the BSC
to the “programme”.
In meeting objective 6), a conceptual framework was developed to guide a
possible future application of the BSC to the Upgrading of Informal Settlements
244
Programme. In the first part of the conceptual framework, pitfalls that should be
avoided in the implementation of the BSC were identified. Three points were
raised which were crucial to the successful implementation of the BSC, namely:
Leadership and support of senior executives; Burning platform for change; and
BSC team and leader. Seven situations in which the BSC may not work were
identified, namely: BSCs which are not reviewed periodically; BSC development
labelled a short-term or systems project; Lack of disciplined management and
leadership; Keeping the BSC at the top; Drawn out development process;
Appointing inexperienced consultants; and Only introducing the BSC for
compensation.
In the second part of the development of the conceptual framework, an
understanding of the BSC translation process was used to guide the application
of the BSC to the Upgrading of Informal Settlements Programme. The BSC
translation process began by gaining consensus on the mission, core values,
vision and strategy. The next step in the translation process was to apply the
four BSC perspectives to the strategy to convert it into objectives and
measures. This step was only partially applied because successful BSC
implementation calls for a BSC to be developed by a BSC team, and therefore a
study of this nature conducted by one person would not comply. In addition, the
strategy for the provincial and municipal levels was not found in the literature,
but only the national strategy in terms of the BNG plan. The argument was
made that the strategy would be the game plan for housing delivery at provincial
and municipal levels and that it would in principle be the same for all provincial
human settlement departments because they are all subject to the same
“national framework”. Similarly, municipalities with similar accreditation levels
would have the same strategy. The point was made that even though the
Upgrading of Informal Settlements Programme does not reflect a strategy, it
does include detailed provisions on certain elements of how delivery should
proceed. Because this is a conceptual framework, the decision was taken to
245
apply the BSC to the provisions of the Upgrading of Informal Settlements
Programme to present a glimpse of the potential of BSC implementation. This
part of the documented application of the BSC could therefore not be viewed as
a solution, but rather as an approach and a set of considerations to be taken
into account by the BSC team once they have gained consensus on the
strategy and start formulating the objectives.
The BSC framework for the public sector has been used as the outline for figure
6.1 below. On the diagram, references have been made to supporting
discussions and diagrams, which include a possible approach and
considerations that could be taken into account by the BSC team when starting
strategy mapping. These considerations are detailed and will not be repeated
here.
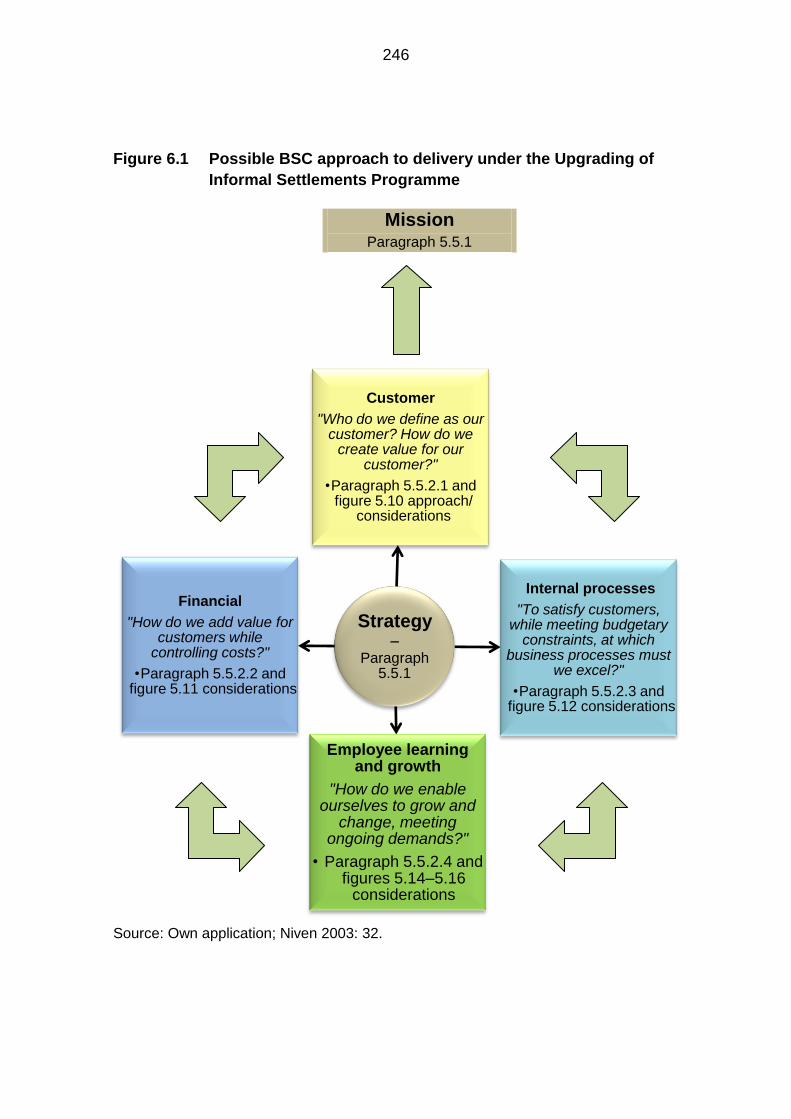
246
Figure 6.1 Possible BSC approach to delivery under the Upgrading of
Informal Settlements Programme
Mission Paragraph 5.5.1
Source: Own application; Niven 2003: 32.
Strategy ‒
Paragraph 5.5.1
Customer
"Who do we define as our customer? How do we
create value for our customer?"
•Paragraph 5.5.2.1 and figure 5.10 approach/
considerations
Internal processes
"To satisfy customers, while meeting budgetary
constraints, at which business processes must
we excel?"
•Paragraph 5.5.2.3 and figure 5.12 considerations
Employee learning and growth
"How do we enable ourselves to grow and
change, meeting ongoing demands?"
• Paragraph 5.5.2.4 and figures 5.14–5.16
considerations
Financial
"How do we add value for customers while
controlling costs?"
•Paragraph 5.5.2.2 and figure 5.11 considerations
247
Objective 6) was met, because a conceptual framework was developed and
presented which could guide a possible future application of the BSC to the
Upgrading of Informal Settlements Programme. The supporting discussions and
diagrams are reflected in chapter 5, paragraphs 5.4 and 5.5. In meeting
objective 6), a contribution has been made to knowledge in that a conceptual
framework has been developed that could guide the possible future application
of the BSC to the Upgrading of Informal Settlements Programme, something
which did not exist before.
The six objectives that have been met were originally formulated from the
overall research aim. The objectives have been met, which by implication
means that the overall research aim has been achieved.
In conclusion, this study has firstly contributed to knowledge by identifying
departmental factors hampering delivery under the Upgrading of Informal
Settlements Programme, factors the human settlements departments at the
three tiers of government collectively have control over addressing. Secondly,
this study has contributed to knowledge by showing that the BSC is a suitable
tool for addressing the departmental factors hampering delivery. Thirdly, the
conceptual framework which was developed to guide any possible future
application of the BSC to the Upgrading of Informal Settlements Programme
reflects a new approach in streamlining the delivery of housing under the
Upgrading of Informal Settlements Programme, a concept not previously
considered.
6.4 RECOMMENDATION
It is recommended that the BSC be applied to the Upgrading of Informal
Settlements Programme and that the conceptual framework in this study be
used to guide the application process.
248
6.5 SUGGESTIONS FOR FURTHER RESEARCH
During the course of this study, the following possible areas for future research
were identified:
Research could be done on whether departmental factors similar to
those of the Upgrading of Informal Settlements Programme could be
hampering delivery in other government departments and whether the
use of the BSC could assist in addressing these factors.
Research could be done on whether the application of the BSC could
assist with the delivery of government programmes which have been
identified as a priority.
Research on whether the transitional process of devolving housing
delivery down to municipal level is negatively affecting delivery by
causing inertia/paralysis/uncertainty in provincial and municipal housing
departments due to confusion of what roles should be performed.
i
TABLE OF CONTENTS
Page
LIST OF FIGURES IN TEXT
xi
LIST OF TABLES IN TEXT xv
CHAPTER 1: INTRODUCTION
1.1 BACKGROUND 1
1.2 RESEARCH FOCUS 9
1.3 OVERALL RESEARCH AIM AND INDIVIDUAL RESEARCH
OBJECTIVES
12
1.4 DELIMITATION OF RESEARCH 13
1.5 NEED FOR THIS RESEARCH 14
1.6 RESEARCH METHODOLOGY 17
1.7 OUTLINE STRUCTURE 20

ii
CHAPTER 2: THE NATIONAL FRAMEWORK FOR THE DELIVERY OF
SUBSIDISED HOUSING
2.1 INTRODUCTION 23
2.2 ORIGIN OF SUBSIDISED HOUSING 24
2.3 SUBSIDISED HOUSING TERMINOLOGY 26
2.4 THE NEW CONSTITUTION AND SUBSIDISED HOUSING 28
2.5 FUNDAMENTAL PRINCIPLES FOR HOUSING POLICY
DEVELOPMENT AND IMPLEMENTATION
29
2.5.1 People-centred development and partnerships 29
2.5.2 Development of skills (skills transfer) and economic
empowerment
30
2.5.3 Fairness and equity 30
2.5.4 Choice 31
2.5.5 Transparency, accountability and monitoring 31
2.5.6 Sustainability and fiscal affordability 31
2.6 PRESENT NATIONAL HOUSING LEGISLATION AND
DIRECTIVES
32
2.6.1 Housing Act 1997 32
2.6.2 Prevention of Illegal Eviction and Unlawful Occupation of Land
Act 1998
34
2.6.3 Housing Consumers Protection Measures Act 1998 35
2.6.4 Rental Housing Act 1999 35
2.6.5 Housing Code 2000 36
2.6.6 Home Loan and Mortgage Disclosure Act 2000 37
iii
2.6.7 Breaking New Ground: A Comprehensive Plan for the
Development of Sustainable Human Settlements (BNG plan),
2004
37
2.6.8 Housing Development Agency Act 2008 40
2.6.9 Social Housing Act 2008 40
2.6.10 National Housing Code 2009 41
2.7 NATIONAL HOUSING VISION, MISSION AND CORE VALUES 42
2.8 NATIONAL HOUSING STRATEGIES 42
2.9 NATIONAL HOUSING PROGRAMMES 54
2.10 FACILITATORS AND FUNDING 56
2.10.1 Three tiers of government 56
2.10.2 Governmental housing institutions 61
2.10.2.1 National Urban Reconstruction and Housing Agency
(NURCHA) – 1995
63
2.10.2.2 Servcon Housing Solutions (Servcon) – 1995–2009 63
2.10.2.3 National Housing Finance Corporation (NHFC) – 1996 64
2.10.2.4 Rural Housing Loan Fund (RHLF) – 1996 65
2.10.2.5 Social Housing Foundation (SHF) – 1997 66
2.10.2.6 National Home Builders Registration Council (NHBRC) –
1998
67
2.10.2.7 Thubelisha Homes – 1998–2009 68
2.10.2.8 Housing Development Agency (HDA) – 2009 69
2.10.2.9 Social Housing Regulatory Authority (SHRA) – 2010 69
2.11 SUMMARY 70

iv
CHAPTER 3: THE UPGRADING OF INFORMAL SETTLEMENTS
3.1 INTRODUCTION 72
3.2 CONCEPT OF INFORMAL SETTLEMENTS (ALSO KNOWN AS
SLUMS OR SQUATTER CAMPS)
72
3.3 BACKGROUND TO AND DEVELOPMENT OF INFORMAL
SETTLEMENTS
75
3.3.1 A New Housing Policy and Strategy for South Africa (1994
Housing White Paper)
75
3.3.2 Development Facilitation Act 1995 76
3.3.3 Housing Act 1997 76
3.3.4 Prevention of Illegal Eviction and Unlawful Occupation of Land Act
1998
77
3.3.5 United Nations Millennium Development Goals (2000) 77
3.3.6 South African Government commitment (2004) 78
3.3.7 Breaking New Ground (BNG plan) (2004) 80
3.3.7.1 Progressive informal settlement eradication 80
3.3.7.2
[Developing and implementing] [t]he Informal Settlement
Upgrading Programme
81
3.3.7.3
More flexible qualification criteria 81
3.3.8 Housing Consumer Education Framework (2007) 82
3.3.9 Sustainable human settlement planning: a resource book on
housing chapters (2008)
82
3.3.10 National Housing Code (2009) 83
3.3.11 Revised government commitment (2010) 85
v
3.4 THE UPGRADING OF INFORMAL SETTLEMENTS
PROGRAMME
85
3.4.1 Concept and objectives 85
3.4.2 Informal settlement prioritisation and qualification criteria 87
3.4.3 Household qualification criteria 88
3.4.4 Various phases 93
3.4.5 Facilitators and funding 99
3.4.5.1 Three tiers of government 99
3.4.5.2 Governmental housing institutions 101
3.4.6 Subsidy guideline 101
3.4.7 Performance measurement 103
3.5 OTHER INTERRELATED NATIONAL HOUSING PROGRAMMES 105
3.5.1 Provision of Primary Social and Economic Facilities Programme 105
3.5.2 Operational Capital Budget Programme 106
3.6 DEPARTMENTAL FACTORS HAMPERING DELIVERY UNDER
THE UPGRADING OF INFORMAL SETTLEMENTS
PROGRAMME
106
3.6.1 Disjuncture between long-term visions and actual actions on the
ground
108
3.6.2 Lack of detailed strategy for prioritised national housing
programmes
110
3.6.3 Outdated information on income and needs of targeted
beneficiaries
111
3.6.4 Lack of buy-in to, understanding of and compliance with policies
by staff
112
3.6.5 Bureaucratic and inefficient funding sources and transfers 114
3.6.6 Lack of accountability for decision-making and delivery failures 115
vi
3.6.7 Misalignment of priorities and budgets between sector
departments
116
3.6.8 Lack of coordination and communication between sector
departments
118
3.7 SUMMARY 119
CHAPTER 4:THE BALANCED SCORECARD AS A PERFORMANCE
MEASUREMENT TOOL FOR THE UPGRADING OF INFORMAL
SETTLEMENTS PROGRAMME
4.1 INTRODUCTION 122
4.2 CHANGES IN PERFORMANCE MEASUREMENT SYSTEMS 123
4.2.1 Changes in the business environment 125
4.2.2 Criticism of traditional performance measurement 129
4.2.3 Recent performance measurement systems 131
4.3 BACKGROUND TO AND DEVELOPMENT OF THE BSC 134
4.4 WHY THE BSC FOR PERFORMANCE MEASUREMENT? 141
4.4.1 Arguments in favour of using the BSC 141
4.4.2 Aspects to consider before committing to using the BSC 154
4.5 DEFINING TERMINOLOGY 155
4.5.1 Mission 155
4.5.2 Core values 156
4.5.3 Vision 156
4.5.4 Strategy 157
vii
4.5.5 Objectives 157
4.5.6 Measures 157
4.6 THE BSC CONCEPT AND FRAMEWORK 158
4.7 ADAPTING THE BSC FRAMEWORK FOR PUBLIC SECTOR
USE
163
4.8 ADAPTING THE BSC PERSPECTIVES FOR PUBLIC SECTOR
USE
165
4.8.1 Customer Perspective 165
4.8.2 Financial Perspective 166
4.8.3 Internal Processes Perspective 167
4.8.4 Employee Learning and Growth Perspective 168
4.9 PUBLIC SECTOR TRANSLATION PROCESS VIA THE BSC 171
4.9.1 Overall approach 171
4.9.2 Interrelationship between the four BSC perspectives 174
4.10 MONITORING AND EVALUATION VERSUS THE BSC 175
4.10.1 The Monitoring and Evaluation concept 176
4.10.2 Preliminary appraisal of the suitability of the BSC for addressing
the departmental factors hampering delivery under the Upgrading
of Informal Settlements Programme
179
4.10.2.1 Preliminary appraisal of the suitability of Monitoring and
Evaluation
180
4.10.2.2 Preliminary appraisal of the suitability of the BSC 181
4.11 SUMMARY 182
viii
CHAPTER 5:THE BSC FRAMEWORK FOR THE UPGRADING OF
INFORMAL SETTLEMENTS PROGRAMME
5.1 INTRODUCTION 186
5.2 COMPATIBILITY OF THE BSC WITH THE PRINCIPLES FOR
HOUSING POLICY DEVELOPMENT AND CORE VALUES
187
5.2.1 People-centred developments and partnerships/ Batho Pele
principles 1–5 & 8
189
5.2.2 Development of skills (skills transfer) and economic
empowerment/ innovation
191
5.2.3 Fairness and equity 192
5.2.4 Choice 193
5.2.5 Transparency, accountability and monitoring/ Batho Pele
principles 6 & 7
193
5.2.6 Sustainability and fiscal affordability/quality and affordability 194
5.3 SUITABILITY OF THE BSC FOR ADDRESSING THE
DEPARTMENTAL FACTORS HAMPERING DELIVERY UNDER
THE UPGRADING OF INFORMAL SETTLEMENTS
PROGRAMME
194
5.4 AVOIDING THE PITFALLS IN BSC IMPLEMENTATION 204
5.4.1 Crucial elements without which BSC implementation cannot be
considered
204
5.4.1.1 Leadership and support of senior executives 204
5.4.1.2 Burning platform for change 205
5.4.1.3 BSC team and leader 206
ix
5.4.2 Reasons why the BSC may not work 206
5.4.2.1 BSCs which are not reviewed periodically 206
5.4.2.2 BSC development labelled a short-term or systems
project
207
5.4.2.3 Lack of disciplined management and leadership 207
5.4.2.4 Keeping the BSC at the top 208
5.4.2.5 Drawn out development process 208
5.4.2.6 Appointing inexperienced consultants 208
5.4.2.7 Only introducing the BSC for compensation 209
5.5 POSSIBLE BSC FRAMEWORK APPROACH TO DELIVERY
UNDER THE UPGRADING OF INFORMAL SETTLEMENTS
PROGRAMME
209
5.5.1 Gain consensus on the mission, core values, vision and strategy 210
5.5.2 Considerations in formulating objectives and measures using the
four BSC perspectives
211
5.5.2.1 The BSC Customer Perspective 213
5.5.2.2 The BSC Financial Perspective 216
5.5.2.3 The BSC Internal Processes Perspective 217
5.5.2.4 The BSC Employee Learning and Growth Perspective 218
5.6 SUMMARY 224

x
CHAPTER 6: CONCLUSIONS AND RECOMMENDATION
6.1 INTRODUCTION 227
6.2 OVERVIEW OF THE BACKGROUND TO AND FOCUS OF THE
RESEARCH
227
6.3 CONCLUSIONS 228
6.4 RECOMMENDATION 247
6.5 SUGGESTIONS FOR FURTHER RESEARCH 248
REFERENCES 249

xi
LIST OF FIGURES IN TEXT
Page
CHAPTER 2
2.1 The main national strategies set out in the Breaking New
Ground (BNG) plan
44
2.2 Strategy 1 of the BNG plan: Supporting the entire residential
property/housing market
45
2.3 Strategy 2 of the BNG plan: Moving/ from housing to
sustainable human settlements
46
2.4 Strategy 3 of the BNG plan: Existing and new housing
instruments/ Existing housing instruments
47
2.5 Strategy 4 of the BNG plan: Adjusting institutional
arrangements within government
48
2.6 Strategy 5 of the BNG plan: Institutional and capacity building/
Building institutions and capacity
49
2.7 Strategy 6 of the BNG plan: Enhancing/ Financial
arrangements
50
2.8 Strategy 7 of the BNG plan: Job creation and housing/ Creating
jobs and providing housing
51
2.9 Strategy 8 of the BNG plan: Information, communication and
awareness building/ Building awareness and enhancing
information communication
52
2.10 Strategy 9 of the BNG plan: Systems, monitoring and
evaluation/ Implementing systems for monitoring and
evaluation
53
2.11 Diagrammatic representation of the national housing
programmes
55

xii
2.12 Department of Human Settlements (Housing): main functions
of the three tiers of government
57
2.13 Department of Human Settlements (Housing): flow of funds for
subsidised housing development
60
2.14 Summary of governmental housing institutions and intended
purpose
62
CHAPTER 3
3.1 Criteria to be met by households/persons in order to qualify for
benefits
90
3.2 Summary of benefits households/persons could qualify for
91
3.3 Choices available to qualifying households 92
3.4 Phases of the Upgrading of Informal Settlements Programme 95
3.5 Phase 1 – Application 96
3.6 Phase 2 – Project initiation 97
3.7 Phase 3 – Project implementation 98
3.8 Upgrading of Informal Settlements Programme performance
indicators
104
3.9 Summary of departmental factors hampering delivery under the
Upgrading of Informal Settlements Programme
108
CHAPTER 4
4.1 Where the BSC fits in 146
4.2 Illustration of strategic paradox 147
4.3 Possible levels of BSC use 149
4.4 Public sector benefits of using the BSC 153

xiii
4.5 Elements of the BSC 159
4.6 The Balanced Scorecard framework to translate strategy into
operational terms
160
4.7 Insight through balance between key performance measures 162
4.8 BSC framework for the public and nonprofit sectors 164
4.9 The Internal-business-process value-chain Perspective 168
4.10 Overall view of Employee Learning and Growth Perspective 170
4.11 Public sector translation of the mission into objectives and
measures via the BSC
172
4.12 Creation of a BSC 173
4.13 Monitoring and Evaluation framework 177
4.14 Monitoring concepts 178
CHAPTER 5
5.1 Linking of fundamental housing principles and core values 188
5.2 Suitability of the BSC for addressing disjuncture between long-
term visions and actual actions on the ground
196
5.3 Suitability of the BSC for addressing lack of detailed strategy
for prioritised national housing programmes
197
5.4 Suitability of the BSC for addressing outdated information on
income and needs of targeted beneficiaries
198
5.5 Suitability of the BSC for addressing lack of buy-in to,
understanding of and compliance with policies by staff
199
5.6 Suitability of the BSC for addressing bureaucratic and
inefficient funding sources and transfers
200
5.7 Suitability of the BSC for addressing lack of accountability for
decision-making and delivery failures
201
5.8 Suitability of the BSC for addressing misalignment of priorities
and budgets between sector departments
202

xiv
5.9 Suitability of the BSC for addressing lack of coordination and
communication between sector departments
203
5.10 Linking of the BSC Customer Perspective and the Upgrading of
Informal Settlements Programme
215
5.11 Linking of the BSC Financial Perspective and the Upgrading of
Informal Settlements Programme
216
5.12 Linking of the BSC Internal Processes Perspective and the
Upgrading of Informal Settlements Programme
218
5.13 Employee Learning and Growth Measurement Framework 219
5.14 Linking of the BSC Employee Learning and Growth
Perspective (Employee skills and competencies) and the
Upgrading of Informal Settlements Programme
221
5.15 Linking of the BSC Employee Learning and Growth
Perspective (Systems – Information technology and others)
and the Upgrading of Informal Settlements Programme
222
5.16 Linking of the BSC Employee Learning and Growth
Perspective (Organisational procedures/climates) and the
Upgrading of Informal Settlements Programme
223
CHAPTER 6
6.1 Possible BSC approach to delivery under the Upgrading of
Informal Settlements Programme
246
xv
LIST OF TABLES IN TEXT
Page
CHAPTER 2
2.1 Projected monthly household income distribution for 1995 25
2.2 Annual housing delivery figures 40
2.3 Role of the municipality and province, based on accreditation
status
58
CHAPTER 3
3.1 Summary of changes affecting informal settlements, from the
BNG plan to the 2009 Housing Code
84
3.2 Subsidy guidelines – 2008/09 and 2009/10 102
CHAPTER 6
6.1 Summary of the compatibility of the BSC with the fundamental
housing principles and core values
240
6.2 Summary of the suitability of the BSC for addressing the
departmental factors hampering delivery under the Upgrading
of Informal Settlements Programme
242
249
REFERENCES
Acts and Bills of Parliament of the Republic of South Africa
Constitution of the Republic of South Africa, 1996. Available at:
http://www.info.gov.za/documents/constitution/1996/index (accessed on 06
September 2008).
Development Facilitation Act 67 of 1995. Available at:
http://land.pwv.gov.za/documents&publications/publications/sis%20strategy/10/
10_36_29.htm (accessed on 27 March 2009).
Division of Revenue Bill 4 of 2009. Available at:
http://www.treasury.gov.za/legislation/bills/2009/Default.aspx (accessed on 25
June 2010).
Housing Act 107 of 1997. Available at:
http://www.housing.gov.za/content/Acts/Housing%20Act%2010%20of%201997
(accessed on 22 January 2009).
Housing Consumers Protection Measures Act 95 of 1998. Available at:
http://www.acts.co.za/housing_cpm/whtdhtml
(accessed on 05 March 2009, 10 March 2009 and 15 July 2010).
Housing Development Agency Act 23 of 2008. Available at:
http://www.acts.co.za/housing_development_agency_act_2008/whtdhtml.htm
(accessed on 24 March 2009).

250
Rental Housing Act 50 of 1999. Available at:
http://www.acts.co.za/rental_housing/rental_housing_act.htm (accessed on 24
March 2009).
Social Housing Act 16 of 2008. Available at:
http://www.acts.co.za/social_act_2008/social_housing_act_200$.htm (accessed
on 12 May 2010).
Case Law
Government of the Republic of South Africa and Others v Grootboom and
Others 2001(1) SA46 (CC).
Other references
“7000+ in RDP housing scam”. 2008. 24.com News, 2 April. Available at:
http://www.24.com/news/?p=pra&i=880406.html. (accessed on 29 August
2008).
African National Congress. 1994 Election Manifesto of the African National
Congress. Available at: http://anc.org.za/ancdocs/policy/manifesto.html
(accessed on 16 April 2009).
Agostino, D & Arnaboldi, M. 2011. How the BSC implementation process
shapes its outcome. The International Journal of Productivity and Performance
Management 60(2):99–114.
Amaratunga, D, Baldry, D & Sarshar, M. 2001. Process improvement through
measurement: the balanced scorecard methodology. MCB University Press
50(5):179–188.

251
Atkinson, H. 2006. Strategy implementation: a role for the balanced scorecard?
Management Decision 44(10):1441–1460.
Atkinson, AA, Waterhouse HJ & Wells BR. 1997. A stakeholder approach to
strategic performance management. Sloan Management Review 38(3):25–37.
Balanced Scorecard hall of fame report. 2005. Boston: Balanced Scorecard
Collaborative and Harvard Business School Publishing.
Basu, R, Little, C & Millard, C. 2009. Case study: a fresh approach of the
balanced scorecard in the Heathrow Terminal 5 project. Measuring Business
Excellence 13(4):22–33.
BBC News. 2006. Q&A: the Enron case. Available at:
http://news.bbc.co.uk/2/hi/business/3398913.stm
Bible, L, Kerr, S & Zanini, M. 2006. The balanced scorecard: here and back.
Management Accounting Quarterly 7(4):18–23.
Biggam, J. 2011. Succeeding with your Master’s Dissertation: a step by step
handbook. Berkshire: Open University Press.
Bolívar, MPR, Hernández, AML & Rodríguez, DO. 2010. Implementing the
balanced scorecard in public sector agencies: an experience in municipal sport
services. Academia, Revista Latinoamericana de Administración 45:116–139.
Botes, V. 2006. The perception of the skills required and displayed by
management accountants to meet future challenges. Doctor of Commerce,
University of South Africa, Pretoria.
252
Bourguignon, A, Malleret, V & Nørreklit, H. 2004. The American balanced
scorecard versus the French tableau de bord: the ideological dimension.
Management Accounting Research 15:107–134.
Braam, GJM & Nijssen, EJ. 2008. Exploring the antecedents of balanced
scorecard adoption as a performance measurement and strategic management
system. NiCE Working Paper 08–115, December:1–28. Available at:
http://hdl.handle.net/2066/74886 (accessed 10 October 2011).
Brown, MG. 2000. Winning score: How to design and implement organizational
scorecards. Portland: Productivity Press.
Burgoyne, ML. 2008. Factors affecting housing delivery in South Africa: a case
study of the Fisantekraal housing development project, Western Cape. Master’s
dissertation in Community and Development, University of Stellenbosch.
Campbell, A. 2010. Housing payment scandal. The Star, 02 June. Available at:
http://iol.co.za/index.php?set_id=1&click_id=124&art_id=vn201006020427283
(accessed on 02 June 2010).
Chan, YL. 2004. Performance measurement and the adoption of balanced
scorecards: a survey of municipal governments in the USA and Canada. The
International Journal of Public Sector Management 17(3):204–221.
Chenwi, L. 2007. The right to have access to adequate housing: monitoring
review. ESR Review: Economic and Social Rights in South Africa 8(2):21–25.
Cities Alliance. 2010. South African President pledges urgent action to mitigate
human settlements needs, Pretoria, 18 May. Available at:
http://www.citiesalliance.org/ca/print/2043. (accessed on 30 June 2010).

253
Cohen, T. 1997. Land and housing. South African Human Rights Yearbook
8:137–163.
Cokayne, R. 2009. NHFC to scale up operations. Business Report, 16
February. Available at:
http://www.busrep.co.za/general/print_article.php?fArticleId=4844939&fSectionI
d=5... (accessed on 17 March 2009).
Correia, C. Langfield-Smith, K. Thorne, H & Hilton, RW. 2008. Management
Accounting: information for managing and creating value. Berkshire: McGraw-
Hill.
Crowther, D. & Lancaster, G. 2009. Research Methods: a concise introduction
to research in management and business consultancy. Oxford: Elsevier.
Cunningham, GM & Harris, JE. 2006. Enron and Arthur Andersen: the case of
the crooked E and the fallen A. Global Perspectives on Accounting Education
3:27–48.
Current and future building activity in South Africa: 2006–2015. 2006. Available
at: http://www.gpf.org.za/housing.aspx. (accessed on 26 August 2008).
Curtis, D. 1985. The modern American accounting system: does it really
measure corporate performance? Financial Executive 1(1/2):58–62.
Davies, T & Boczko, T. 2005. Business accounting and finance. Berkshire: Mc
Graw-Hill.
254
De Geuser, F, Mooraj, S & Oyon, D. 2009. Does the balanced scorecard add
value? Empirical evidence on its effect on performance. European Accounting
Review 18(1):93–122.
Department of Public Service and Administration, South Africa. 2004.
Monitoring and Evaluation (M&E) Learning Workshop, Midrand, 15 September.
Available at: http://www.dpsa.gov.za/ln_mon_eval.asp. (accessed on 24 June
2010).
Department of Public Service and Administration, South Africa. 2010. Batho
Pele, Principles. Available at: http://www.dpsa.gov.za/batho-pele/Principles.asp
(accessed on 7 October 2010).
Development Action Group. 2007. Development Action Group’s Informal
Settlement Upgrading Programme, May. Available at:
http://www.dag.org.za/index.php?option=com_content&task=view&id=66&Itemi
d=1 (accessed on 22 April 2009).
De Visser, J & Christmas, A. 2007. Reviewing local government functions: the
housing dilemma. Local Government Bulletin 9(3), July:13–15.
Drury, C. 2008. Management and cost accounting. London: Cengage Learning.
Dyantyi, R. 2007. First of its kind: Breaking New Ground houses handed over to
beneficiaries, 13 June. Available at:
http://www.search.gov.za/info/prviewDocument.jsp?dk=%2Fdata%2Fstatic%2Fi
nfo... (accessed on 28 August 2008).
Eccles, RG. 1991. The performance measurement manifesto. Harvard Business
Review 69(1):131–137.
255
Engineering News Online. 2009. Cabinet appoints CEO for new Housing
Development Agency, 20 January. Available at:
http://www.engineeringnews.co.za/print-version/cabinet-appoints-ceo-for-new-
housing (accessed on 03 April 2009).
Enviro Leg CC. Available at:
www.enviroleg.co.za/acts/Development%20Faciliation/Development%20Facilita
tion%20Act.pdf (accessed on 27 March 2009).
Estis, AA. 1998. The balanced scorecard – applying a private sector technique
to the public sector. Paper presented at the 1998 conference of the Association
for Public Policy Analysis and Management , Grand Hyatt, New York City, 31
October:1–11.
Executive Office of the President, United States of America. 2002. The
President’s Management Agenda. Available at:
http://www.whitehouse.gov/.../budget_fy2002_pma_default (accessed on 26
November 2011).
Farnetti, F & Guthrie, J. 2008. Italian and Austrian local governments: balanced
scorecard practices. A research note. Journal of Human Resource Costing &
Accounting 12(1):4–13.
Financial and Fiscal Commission. 2008. Submission for the Division of Revenue
2009/10. Available at:
http://www.ffc.co.za/docs/submissions/dor/2008/part_a.pdf (accessed on 10
September 2008).

256
Financial and Fiscal Commission. 2009. Submission for the Division of Revenue
2010/11. Available at: http://www.ffc.co.za/index.php/submissions//commission-
submissions.html (accessed on 27 August 2010).
Fowler, HW & Fowler, FG (ed). 1976. The Concise Oxford Dictionary. Oxford
University Press.
Franco-Santos, M, Kennerley, M, Micheli, P, Martinez, V, Mason, S, Marr, B,
Gray, D & Neely, A. 2007. Towards a definition of a business performance
measurement system. International Journal of Operations and Production
Management 27(8):784–801.
Garrison, RH. Noreen, EW & Seal W. 2003. Management accounting.
European edition. Berkshire: McGraw-Hill.
Ghalayini, AM & Noble, JS. 1996. The changing basis of performance
measurement. International Journal of Operations and Production Management
16(8):63–80.
Greatbanks, R & Tapp, D. 2007. The impact of balanced scorecards in a public
sector environment. Empirical evidence from Dunedin City Council, New
Zealand. International Journal of Operations and Production Management
27(8):846–873.
Greiling, D. 2005. Performance measurement in the public sector: the German
experience. International Journal of Productivity and Performance Management
54(7):551–567.

257
Greiling, D. 2010. Balanced scorecard implementation in German non-profit
organisations. International Journal of Productivity and Performance
Management 59(6):534–554.
Halachmi, A. 2005. Performance measurement is only one way of managing
performance. International Journal of Productivity and Performance
Management 54(7):502–516.
Hamlyn, M. 2006. NHFC to become a home loan bank. Business Report, 12
May. Available at:
http://www.busrep.co.za/general/print_article.php?fArticleId=3242822&fSectionI
d=5 (accessed on 17 March 2009).
Hendriks, K, Menor, L & Wiedman, C. 2004. The balanced scorecard: to adopt
or not to adopt? Ivey Business Journal November/December:1–9.
Hohendorff, T. 2006. Corporate sector has role in alleviating housing crisis.
Professional Accountant, August:20–21.
Housing Finance: South Africa housing data and information. 2000. The
Banking Council. Available at:
http://www.auhf.co.za/housingreportsouthafrica.htm (accessed on 24 April
2010).
Housing in Southern Africa. 2009a. HDA ‒ fast tracking housing delivery,
February:1.
Housing in Southern Africa. 2009b. Taffy Adler ‒ HDA’s inner city visionary,
March:1.

258
Huchzermeyer, M. 2009. Reply to KZN slums judgement. The Witness, 02
March. Available at:
http://www.witness.co.za/index.php?showcontent&global%5B_id%%5D=20181.
Hutchinson, D. 2006. Housing prioritised for local government: housing. IMIESA
31(8), August: 28–30.
InvestorWords. 2012. Dot-com. Available at:
http://www.investorwords.com/1549/dot_com.html
Ittner, CD & Larcker, DF. 1998. Innovations in performance measurement:
trends and research implications. Journal of Management Accounting Research
10:205–238.
Jones, LR & Kettl, F. 2003. Assessing pubic management reform in an
international context. International Public Management Review 4(1). Available
at: www.ipmr.net (accessed 11 November 2011).
Kaplan, RS. 2001. Strategic performance measurement and management in
nonprofit organizations. Nonprofit Management & Leadership 11(3):353–370.
Kaplan, RS & Norton, DP. 1992. The balanced scorecard – measures that drive
performance. Harvard Business Review 70(1):71–79.
Kaplan, RS & Norton, DP. 1993. Putting the balanced scorecard to work.
Harvard Business Review 71(5):134–147.
Kaplan, RS & Norton, DP. 1996a. Using the balanced scorecard as a strategic
management system. Harvard Business Review 74(1):75–85.

259
Kaplan, RS & Norton, DP. 1996b. The balanced scorecard: translating strategy
into action. Boston: Harvard Business School Press.
Kaplan, RS & Norton, DP. 1996c. Linking the balanced scorecard to strategy.
California Management Review 39(1):53–79.
Kaplan, RS & Norton, DP. 1996d. Strategic learning & the balanced scorecard.
Strategy & Leadership 24(5):18–24.
Kaplan, RS & Norton, DP. 2001a. The strategy-focused organization. Boston:
Harvard Business School Press.
Kaplan, RS & Norton, DP. 2001b. Transforming the balanced scorecard from
performance measurement to strategic management, part I. Accounting
Horizons 15(1):87–104.
Kaplan, RS & Norton, DP. 2001c. Transforming the balanced scorecard from
performance measurement to strategic management, part II. Accounting
Horizons 15(2):147–160.
Kaplan, RS & Norton, DP. 2004. Strategy maps: converting intangible assets
into tangible outcomes. Boston: Harvard Business School Press.
Kaplan, RS & Norton, DP. 2006. Alignment: using the balanced scorecard to
create corporate synergies. Boston: Harvard Business School Press.
Kon, D. 2005. Performance measurement and management: a Singapore
perspective. Measuring Business Excellence 9(3):50–52.
260
Kothari, M. 2007. United Nations expert on adequate housing concludes visit to
South Africa. ESR Review: Economic and Social Rights in South Africa 8(2):
34–36.
Lombard, K. 2004. Can we avert an urban development crisis? Business Day,
21 September. Available at: http://www.ijr.org.za/publications/archive/media-
articles-and-programmes/urbdev/ (accessed on 29 August 2008).
Lusk, EJ, Halperin, M & Zhang, B. 2006. The balanced scorecard: suggestions
for rebalancing. Problems and Perspectives in Management 4(2):100–114.
Mabaya, N. 2007. Statement of the imaginary “R2 bn Housing Scandal”
reported by the City Press Newspaper on Sunday 22 July 2007, Head of Media
Services, Department of Housing, 23 July. Available at:
http://www.housing.gov.za/Content/Media%20Desk/Press%20Releases/2007/R
espon... (accessed on 08 September 2008).
Mabaya, N. 2009. The Housing Development Agency will fast track housing
delivery. Housing Media Services, 01 March. Available at:
http://www.housing.gov.za/Content/Media%20Desk/Press%20Releases/200902
%20. (accessed on 07 April 2009).
Macgregor, H & Smit, W. 2007. Development Action Group, Programmes,
Informal Settlement Upgrading. Available at:
http://www.dag.org.za/index.php?option=com_content&task=view&id=66&Item=
1 (accessed on 20 January 2009).

261
Mail and Guardian Online. 2008. Hundreds of RDP houses in Ekurhuleni to be
revamped, 4 August. Available at:
http://www.mg/co/za/printformat/single/2008-08-04-hundreds-of-rdp-houses-in-
ekurh... (accessed on 27 August 2008).
Maleke, D. 2008. New style houses, same old problems. The Herald, published
on Abahali.org website, 3 April. Available at: http://www.abahlali.org/node/3442,
(accessed on 27 August 2008).
Masinga, S. 2008. “Badly-built RDP houses collapse”. News24, 16 February.
Available at:
http://www.news24.com/News24v2/Components/Generic/News24v2_Print_Pop
Up_... (accessed on 27 August 2008).
Meyer, MW. 2002. Rethinking performance measurement. Cambridge:
Cambridge University Press.
Misselhorn, M. 2008. Draft position paper on informal settlements upgrading:
part of a strategy for the second economy for the Office of the South African
Presidency, Urban LandMark, April. Available at:
http://www.pptrust.co.za/Documents/Informal_Settlement_Paper.pdf
(accessed on 24 February 2010).
Mogoro, MJ & Brynard, PA. 2010. Difficulties associated with the
implementation of the preferential procurement policy in conjunction with a low-
cost housing programme: a South African contextualisation. Politeia 29(3):4–23.
Mooraj, S, Oyon, D & Hostettler, D. 1999. The balanced scorecard: a necessary
good or an unnecessary evil? European Management Journal 17(5):481–491.

262
Mouton, J. 2003. How to succeed in your Master’s and Doctoral studies.
Pretoria: Van Schaik.
Mpumalanga Department of Housing, South Africa. 2010. Housing chapter for
Pixley Ka Seme local municipality, 2010/2014. Available at:
pixleykaseme.local.gov.za/idp_files/housing%20Chapter.pdf (accessed on 22
March 2011.
Murphy, WD. 2003. Developing the role of the management accountant: a
review of practitioner-orientated sources. Available at: www-
staff.lboro.ac.uk/~bsiph/.../ManAcct-Paper-WM-28.7.03 (accessed on 27
November 2011).
Nair, M. 2004. Essentials of Balanced Scorecard. Hoboken: Wiley.
National Department of Housing, South Africa. 1994. A new housing policy and
strategy for South Africa (1994 Housing White Paper). Available at:
http://echousing.ecprov.gov.za/Policies.html (accessed on 24 March 2009).
National Department of Housing, South Africa. 2000a. Housing code, Minister’s
statement. Available at:
http://www.housing.gov.za/Content/The%20Housing%20Code/Index.htm
(accessed on 22 January 2009; 27 January 2010; 19 February 2010).
National Department of Housing, South Africa. 2000b. Housing code,
introduction. Available at:
http://www.housing.gov.za/Content/The%20Housing%20Code/Index.htm
(accessed on 22 January 2009; 27 January 2010; 19 February 2010).

263
National Department of Housing, South Africa. 2000c. Housing code, part 1,
chapter 2. Available at:
http://www.housing.gov.za/Content/The%20Housing%20Code/Index.htm
(accessed on 22 January 2009; 27 January 2010; 19 February 2010).
National Department of Housing, South Africa. 2004. Breaking New Ground: a
comprehensive plan for the development of sustainable human settlements.
Available at:
http://www.Abahlali.org/files/Breaking%20new%20ground%20New_Housing_Pl
an_Cabinet_approved_version.pdf (accessed on 27 March 2009).
National Department of Housing, South Africa, Media Desk. 2006a. Keynote
address by LN Sisulu, Minister of Housing, at the ceremony to launch the
Olievenhoutbosch Housing Project, Olievenhoutbosch, 20 February. Available
at:
http://www.housing.gov.za/Content/Media%20Desk/Speeches/2006/20%20Febr
uary (accessed on 08 September 2008).
National Department of Housing, South Africa. 2006b. Keynote address by LN
Sisulu, Minister of Housing, at the ceremony to launch the Solomon Mahlangu
Housing Project, 21 February. Available at:
http://www.housing.gov.za/Content/Media%20Desk/Speeches/2006/21%20Febr
uary (accessed on 08 September 2008).
National Department of Housing, South Africa, Media Desk. 2006c. Media
briefing remarks by Housing Minister Lindiwe Sisulu on the occasion of the
2006/2007 Budget Vote statement, Cape Town, 24 May. Available at:
http://www.housing.gov.za/content/Media%20Desk/Speeches/2006/24%20May
%202 (accessed on 15 September 2008).
264
National Department of Housing, South Africa. 2006d. Housing Budget Vote
debate 2006/07 in the National Council of Provinces. Speech by LN Sisulu,
Minister of Housing, 25 May. Available at:
http://www.housing.gov.za/Content/Media%20Desk/Speeches/2006/25%20May
%202 (accessed on 08 September 2008).
National Department of Housing. 2007a. Draft housing code, ch 13. Available
at: http://web.wits.ac.za/Academic/EBE/ArchPlan/Research/informla
settlements/ (accessed on 24 February 2010).
National Department of Housing, South Africa. 2007b. The housing consumer
education framework: breaking new ground in housing delivery. Available at:
http://www.housing.gov.za/main.htm (accessed on 07 September 2008).
National Department of Housing, South Africa. 2008a. Sustainable human
settlement planning: a resource book on housing chapters. Available at:
http://www.housing.gov.za/main.htm (accessed on 07 September 2008).
National Department of Housing, South Africa. 2008b. Speech by LN Sisulu
Minister of Housing on the introduction of the Housing Development Agency Bill
2007, 8 May. Available at:
http://www.housing.gov.za/content/Media%20Desk/Press%20Releases/2008/13
%20... (accessed on 03 April 2009).
National Department of Housing, South Africa. 2008c. About housing: History of
the department. Available at:
http://www.housing.gov.za/Content/The%20Department/History.htm. (accessed
on 30 August 2008).

265
National Department Housing, South Africa. 2008d. Housing programmes.
Available at:
http://www.housing.gov.za/Content/Housing%20Programmes/Programmes.htm
(accessed on 30 August 2008).
National Department Housing, South Africa. 2008e. Subsidy information.
Available at:
http://www.housing.gov.za/Content/Subsidy%20Information/Subsidies%20Hom
e.htm (accessed on 30 August 2008).
National Department of Housing, South Africa. 2009a. The Housing
Development Agency will fast track housing delivery. Media Release, 01 March.
Available at:
http://www.housing.gov.za/Content/Media%20Desk/Press%20Releases/2009/0
2%20 (accessed on 7 April 2009).
National Department of Housing, South Africa. 2009b. Annual report for the
financial year ended 31 March 2009. Available at:
http://www.housing.gov.za/Content/Documents/Annual%20Reports.htm
(accessed on 19 February 2010).
National Department of Housing, South Africa. 2009c. Housing institutions,
NHBRC. Available at:
http://www.housing.gov.za/Content/housing_institutions/nhbrc.htm (accessed
on 17 March 2009).
National Department of Housing, South Africa. 2009d. Housing institutions,
NURCHA. Available at:
http://www.housing.gov.za/Content/housing_institutions/nurcha.htm (accessed
on 17 March 2009).
266
National Department of Housing, South Africa. 2009e. Housing institutions,
RHLF. Available at:
http://www.housing.gov.za/Content/housing_institutions/Housing_Institutions%2
020 (accessed on 2 April 2009).
National Department of Housing, South Africa. 2009f. Housing institutions,
Social Housing Foundation. Available at:
http://www.housing.gov.za/Content/housing_institutions/shf.htm (accessed on
17 March 2009).
National Department of Housing, South Africa. 2009g. Housing institutions,
Thubelisha Homes. Available at:
http://www.housing.gov.za/Content/housing_institutions/thubelisha_homes.htm
(accessed on 17 March 2009).
National Department of Housing, South Africa. 2009h. Speech by LN Sisulu
Minister of Housing at the launch of the Housing Development Agency,
International convention centre, Durban, 2 March. Available at:
http://www.housing.gov.za/content/Media%20Desk/Speeches/2009/02%20Mar
%202... (accessed on 21 March 2009).
National Department of Human Settlements, South Africa. 2009a. Housing
Code 2009, part 1, vol 1. Available at:
http://www.housing.gov.za/Content/The%20Housing%20Code%202009/index.h
tm (accessed on 13 May 2010).
National Department of Human Settlements, South Africa. 2009b. Housing
Code 2009, part 2, vol 1. Available at:
http://www.housing.gov.za/Content/The%20Housing%20Code%202009/index.h
tm (accessed on 13 May 2010).
267
National Department of Human Settlements, South Africa, Media Release.
2009c. Post-MinMEC briefing by T Sexwale, Minister of Human Settlements,
Sandton, 25 May. Available at:
http://www.housing.gov.za/Content/Media%20Desk/Press%20Releases/2009/2
6%20 (accessed on 25 February 2010).
National Department of Human Settlements, South Africa, Media Desk. 2009d.
Housing Budget Vote Speech to the National Assembly by T Sexwale, Minister
of Human Settlements, Cape Town, 30 June. Available at:
http://www.housing.gov.za/Content/Media%20Desk/Speeches/2009/29%20Jun
e%200 (accessed on 27 January 2010).
National Department of Human Settlements, South Africa. 2009e. Housing
Code 2009, Part 3, vol 3, Subsidy quantum: financial intervention.
Available at:
http://www.housing.gov.za/Content/The%20Housing%20Code%202009/index.h
tm (accessed on 13 May 2010).
National Department of Human Settlements, South Africa. 2009f. Housing Code
2009, part 3, vol 4. Upgrading informal settlements. Available at:
http://www.housing.gov.za/Content/The%20Housing%20Code%202009/index.h
tm (accessed on13 May 2010).
National Department of Human Settlements, South Africa. 2009g. Housing
Code 2009, Part 3, vol 4, Subsidy quantum: incremental interventions. Available
at:
http://www.housing.gov.za/Content/The%20Housing%20Code%202009/index.h
tm (accessed on 13 May 2010).

268
National Department of Human Settlements, South Africa. 2009h. Housing
Code 2009, part 3, vol 5. Subsidy quantum: rural interventions. Available at:
http://www.housing.gov.za/Content/The%20Housing%20Code%202009/index.h
tm (accessed on 13 May 2010).
National Department of Human Settlements, South Africa. 2009i. Housing Code
2009, Part 3, vol 3, Provision of social and economic facilities. Available at:
http://www.housing.gov.za/Content/The%20Housing%20Code%202009/index.h
tm (accessed on 13 May 2010).
National Department of Human Settlements, South Africa. 2009j. Housing Code
2009, Part 3, vol 3, Operational capital budget. Available at:
http://www.housing.gov.za/Content/The%20Housing%20Code%202009/index.h
tm (accessed on 13 May 2010).
National Department of Human Settlements, South Africa, 2009k. The role of
local government in the national Human Settlements agenda. Address to
SALGA lekgotla by Tokyo Sexwale, Minister of Human Settlements, 28
September. Available at:
http://www.housing.gov.za/Content/Media%20Desk/Speeches/2009/28%20Sept
embe... (accessed on 5 February 2010).
National Department of Human Settlements, South Africa, 2010a. Human
Settlements Budget Vote. Speech to the National Assembly by T Sexwale,
Minister of Human Settlements, Cape Town, 21 April. Available at:
http://www.housing.gov.za/Content/Media%20Desk/Speeches/2010/Human%2
0settle (accessed on 6 May 2010).

269
National Department of Human Settlements, South Africa. 2010b. About us:
mandate, vision and mission. Available at:
http://www.dhs.gov.za/Content/The%20Department/The%20Department%20Ho
me.htm (accessed on 13 May 2010, 4 March 2011 and 15 April 2011).
National Department Human Settlements, South Africa. 2010c. Strategic
statement. Available at:
http://www.dhs.gov.za/Content/The%20Department/Strategic%20Statement.ht
m (accessed 02 June 2010 and 15 April 2011).
National Department of Human Settlements, South Africa, Media Statement.
2011a. Cities get new powers and funding for human settlements, 4 March.
Available at:
http://www.dhs.gov.za/Content/Media%20Desk/2011%20Media%20Statements
04%... (accessed on 22 March 2011).
National Department Human Settlements, South Africa. 2011b. Housing
delivery. Available at:
http://www.dhs.gov.za/Content/Stats/2009%2010%20Financial%20year.htm
(accessed 15 April 2011).
National Treasury. 1999. National Budget Speech. Available at:
http://www.treasury.gov.za/documents/national%20budget/1999/default.aspx
(accessed on 19 February 2010).
Ndaba, D. 2008. Affordable-housing programme is maturing, but the delivery
pressures are mounting. Engineering News Online, 11 July. Available at:
http://www.engineeringnews.co.za/print-version/affordablehousing-programme-
is-ma (accessed on 07 April 2009).
270
Neely, A. 1999. The performance measurement revolution: why now and what
next? International Journal of Operations and Production Management
19(2):205–228.
Ngalwa, S. 2008. Sisulu pledges mass RDP eviction. The Cape Argus, 01 June.
Available at:
http://www.iol.co.za/general/news/newsprint/php?art_id=vn2008060109261779
8C83 (accessed on 06 May 2010).
Niven, PR. 2003. Balanced Scorecard step-by-step for government and
nonprofit agencies. Hoboken: Wiley.
Niven, PR. 2006. Balanced Scorecard step-by-step: maximizing performance
and maintaining results. Hoboken: Wiley.
NHFC. 2008a. NHFC: Company Profile, Corporate Profile, Background.
Available at:
http://www/nhfc.co.za/content.asp?level1ID=1&level12ID=1&1level3ID=1
(accessed on 26 August 2008).
NHFC. 2008b. NHFC: Finance-Funding programs and Finance-Finance partner.
Available at:
http://www/nhfc.co.za/content.asp?level1ID=2&level12ID=9&level3ID=17
(accessed on 16 March 2009).
Nørreklit, H. 2000. The balance on the balanced scorecard – a critical analysis
of some of its assumptions. Management Accounting Research 11:65–88.
Northrup, CL. 2004. Dynamics of profit-focussed accounting. Boca Raton:
Ross.

271
NURCHA. 2009. NURCHA Profile. Available at:
http://www.nurcha.co.za/company-profile/nurcha-profile.html (accessed on 17
March 2009).
Olve, N. Roy, J & Wetter, M. 2000. Performance drivers: a practical guide to
using the balanced scorecard. Chichester: Wiley.
Olve, N, Petri, C, Roy, J & Roy, S. 2004. Twelve years later: understanding and
realizing the value of balanced scorecards. Ivey Business Journal May/June:1–
7.
Ong, TS, Teh, BH, Lau, CK & Wong, SLS. 2010. Adoption and implementation
of balanced scorecard in Malaysia. Asia-Pacific Management Accounting
Journal 5(1):21–40.
Paranjape, B, Rossiter, M & Pantano, V. 2006. Insights from the Balanced
Scorecard Performance measurement systems: successes, failures and future
– a review. Measuring Business Excellence 10(3):4–14.
Parliamentary Monitoring Group. 1999. Housing legislation briefing, 14
September. Available at:
http://www.pmg.org.za/print/3796 (accessed on 20 January 2009).
Parliamentary Monitoring Group. 2004. Trends in Intergovernmental finances:
Departments of Housing and Transport briefings, 9 December. Available at:
http://www.pmg.org.za/print/4598. (accessed on 27 August 2008).

272
Parliamentary Monitoring Group. 2008a. Thubelisha Homes and Servcon
Housing Solutions: Closure plans: Department of Housing and Institutions’
briefing, 20 May. Available at:
http://www.pmg.org.za/print/12048 (accessed on 25 April 2008).
Parliamentary Monitoring Group. 2008b. Department of Housing strategic plan
2008/2011; Social Housing Bill; Discussion around mandates, 21 May.
Available at: http://www.pmg.org.za/report/20080521-department-housing-
strategic-plan-2008201(accessed on 22 January 2009).
Parliamentary Monitoring Group. 2009a. Department of Human Settlements
Budget and strategic plan 2009/10, 10 June. Available at:
http://www.pmg.org.za/print/16508 (accessed on 18 February 2010).
Parliamentary Monitoring Group. 2009b. Department of Human Settlements
budget and strategic plan 2009/10: project information and statistics, 10 June.
Available at: http://www.pmg.org.za/print/16508 (accessed on 18 February
2010).
Parliamentary Monitoring Group. 2009c. Human Settlements December
Workshop: Day 1, 2 December. Available at:
http://www.pmg.org.za/print/19659 (accessed on 18 February 2010).
Parliamentary Monitoring Group. 2009d. Human Settlements December
Workshop: Day 1. Address by the Acting Director-General at the workshop for
the Portfolio Committee, 2 December. Available at:
http://www.pmg.org.za/print/19659 (accessed on 18 February 2010).
273
Parliamentary Monitoring Group. 2009e. Human Settlements December
Workshop: Day 2, Bosberaad submission, 3 December. Available at:
http://www.pmg.org.za/report/20091203-workshop-department-human-
settlements-% (accessed on 18 February 2010).
Parliamentary Monitoring Group. 2009f. Servcon: Transitional plans, strategies
to deal with repossessions and informal settlements, 10 July. Available at:
http://www.pmg.org.za/report/20090710-servcon-presentation-clarity-plans-
manage-tr (accessed on 22 July 2010).
Parliamentary Monitoring Group. 2009g. Social Housing Foundation, Rural
Housing Loan Foundation, National Home Builders Registration Council Annual
Reports 2008/09, 26 October. Available at:
http://www.pmg.org.za/print/18875 (accessed on 20 May 2010).
Parliamentary Monitoring Group. 2009h. Department of Human Settlements
Annual Report 2008/2009, briefing. 19 October. Available at:
http://www.pmg.org.za/print/18702 (accessed on 13 May 2010).
Parliamentary Monitoring Group. 2009i. Housing beneficiary list review plan.
Implementation of Joe Slovo Constitutional Court judgement: Progress report,
09 November. Available at:
http://www.pmg.org.za/print/19259 (accessed on 07 May 2010).
Parliamentary Monitoring Group. 2009j. Thubelisha Homes closure report, Joe
Slovo informal settlement briefings, management committee appointments. 8
July. Available at:
http://www.pmg.org.za/print/17233 (accessed on 22 July 2010).
274
Parliamentary Monitoring Group. 2010a. Department of Human Settlements on
Budget Vote 30; National Treasury on budget aspects relating to Human
Settlements, 10 March 2010. Available at:
http://www.pmg.org.za/print/20475 (accessed on 30 June 2010).
Parliamentary Monitoring Group. 2010b. Report of the Portfolio Committee on
Human Settlements on Budget Vote 30: Human Settlements and the strategic
plan of the Department of Human Settlements and its housing entities, 15 April
2010. Available at:
http://www.pmg.org.za/docs/2010/comreports/100420pcsettlereport.htm
(accessed on 13 May 2010).
Parliamentary Monitoring Group. 2010c. Department of Human Settlements
strategic plan 2009 to 2014, 5 March 2010. Available at:
http://www.pmg.org.za/print/20362 (accessed on 6 May 2010).
Parliament, Research Unit. 2010. Draft Analysis: Vote 30 Human Settlements,
April. Available at:
http://www.pmg.org.za/files/docs/100413settlement_0.pdf (accessed on 25
June 2010).
Phago, K. 2010. The development of housing policy in South Africa. Politeia
29(3):88–106.
PricewaterhouseCoopers. 2010. Monitoring and Evaluation. Available at:
http://www.pwc.com/za/en/monitoring-and-evaluation/index.jhtml (accessed on
01 May 2010).

275
Public Service Commission. 2007. Report of the evaluation of the Batho Pele
Principle of value for money in the public service. Available at:
http://www.search.gov.za/info/search.jsp?qa=1&qt=3&qt=Framework+for+mana
ging (accessed on 29 June 2010).
SabinetLaw. 2009. Housing Development Agency launched to speed up
housing delivery, 2 March. Available at:
http://www.sabinetlaw.co.za/housing/articles/housing-development-agency-
launched- (accessed on 03 April 2009).
samaYende, S. 2005. Mpumalanga to complete 8 000 abandoned RDP houses.
EProp, 4 October. Available at:
http://www.eprop.co.za/news/article.aspx?idArticle=6334. (accessed on 27
August 2008).
Senge, PM. 1998. The practice of innovation. Leader to Leader 9:16–22.
Sentebale. 2009. Letsema. Available at:
http://www.sentebale.org/home/Alliances.html
(accessed on 09 April 2009).
Sidumo, Z. 2008. Our RDP houses are falling apart. The Cape Argus, 13
August. Available at:
http://www.iol.co.za/general/news/newsprint.php?art_id=vn2008081313530337
4C16... (accessed on 27 August 2008).

276
Smit, W. 2005. 10 things to remember about informal settlement upgrading.
Presentation at the Friends of DAG Seminar on the N2 Gateway Project,
Observatory, 5 May. Available at:
http://www.dag.org.za/index.php?option=com_content&task=view&id=45&Itemi
d=1 (accessed on 20 January 2009).
Smith, RF. 2007. Business process management and the balanced scorecard:
using processes as strategic drivers. Hoboken: Wiley.
Smuts, J. 2006. Letter to municipal manager Mdlambe Municipality re: RDP
houses Harmony Park. Bushman’s River Mouth Ratepayers’ Association, 5
September. Available at:
http://www.brm.org.za/corrspondence/RDP%20Houses%202.pdf.
(accessed on 12 September 2008).
Social Housing Foundation. 2009a. About the Social Housing Foundation: who
we are. Available at: http://www.shf.org.za/about/index.html
(accessed on 02 April 2009).
Social Housing Foundation. 2009b. The Social Housing Foundation’s
contributors, funders and donors. Available at:
http://www.shf.org.za/contributors/funders.html
(accessed on 02 April 2009).
Social Housing Foundation. 2009c. The Social Housing Foundation’s products
and services, starting a SHI. Available at:
http://www.shf.org.za/products/shi_how_to.html
(accessed on 02 April 2009).

277
Soderberg, M, Kalagnanam, S, Sheehan, NT & Vaidyanathan, G. 2011. When
is a balanced scorecard a balanced scorecard? International Journal of
Productivity and Performance Management 60(7):688–708.
South Africa. 1994. White Paper on Reconstruction and Development. Available
at: http://www.info.gov.za/view/DownloadFileAction?id=70427 (accessed on 24
April 2009).
South African Government Information. 2001. Speech by Housing Minister Ms
Sankie Mthembi-Mahanyele on the Housing Amendment Bill, National Council
of Provinces, 27 March. Available at:
http://www.info.gov.za/speeches/2001010430945a1004.htm. (accessed on 25
February 2010).
South African Government Information. 2004. Speech by LN Sisulu, Minister of
Housing, at the public policy forum meeting of Cities Alliance, Elangeni Hotel,
Durban, 1 November 2004. Available at:
http://www.info.gov.za/speeches/2004/04111714451005.htm (accessed on 23
February 2010).
South African Government Information. 2005. Speech by LN Sisulu, Minister of
Housing, at the tabling of the Budget Vote for the 2005/06 financial year,
National Assembly, Cape Town, 17 May. Available at:
http://www.info.gov.za/speeches/2005/05051715451004.htm (accessed on 23
February 2010).
South African Government Information. 2008. About SA: housing. Available at:
http://www.info.gov.za/aboutsa/housing.htm (accessed on 08 September 2008).
278
South African Government Information. 2009. National Department of Housing.
The Housing Development Agency will fast track housing delivery, 1 March.
Available at: http://www.info.gov.za/speeches/2009/09030210151001.htm
(accessed on 03 April 2009).
South African Government Information. 2010. Human Settlements Minister
boosts low-cost rental projects, 26 August. Available at:
http://www.info.gov.za/speech/DynamicAction?pageid=461&sid=12509&tid=162
73 (accessed on 23 March 2011).
Speckbacher, G, Bischof, J & Pfeiffer, T. 2003. A descriptive analysis on the
implementation of balanced scorecards in German-speaking countries.
Management Accounting Research 14:361–387.
Srimai, S, Damsaman, N & Bangchokdee, S. 2011. Performance measurement,
organizational learning and strategic alignment: an exploratory study in Thai
public sector. Measuring Business Excellence 15(2):57–69.
Srimai, S, Radford, J & Wright, C. 2011. Evolutionary paths of performance
measurement. International Journal of Productivity and Performance
Management 60(7):662–687.
Statistics South Africa. 2007. Community survey 2007. The RDP commitment:
what South Africans say. Pretoria: Government Printer.
The Economist. 2008. The second Long March, 11 December. Available at:
http://www.economist.com/node/12758848 (accessed on 27 November 2011).
279
The Helen Suzman Foundation. 1996. The best and worst times: South Africa’s
government at half term. Issue 4, third quarter. Available at:
http://www.hsf.org.za/publications/focus-issues/issue-1-10 (accessed on 29
August 2008).
The Presidency, South Africa. 2007. Policy framework for the Government-wide
Monitoring and Evaluation System. Available at:
http://www.thepresidency.gov.za (accessed on 01 May 2010).
The Presidency, South Africa. 2010a. Department of Performance Monitoring
and Evaluation: mandate. Available at:
http://www.thepresidency.gov.za/dpme.asp (accessed on 19 June 2010).
The Presidency, South Africa. 2010b. Department of Performance Monitoring
and Evaluation: the outcomes approach. Available at:
http://www.thepresidency.gov.za/dpme.asp
(accessed on 19 June 2010).
Trafford, V & Leshem, S. 2008. Stepping stones to achieving your doctorate by
focussing on your viva from the start. Berkshire: Open University Press.
Tshikhudo, E. 2008. RDP house the first “decent shelter” for poor woman.
Zoutnet, 4 July, Available at:
http://www.zoutnet.co.za/format_article.asp?ID=6529. (accessed on 29 August
2008).
United Nations. 2009a. Millennium Development Goals, Background. Available
at: http://www.un.org/milleniumgoals/bkgd.shtml (accessed on 07 April 2009, 20
May 2010).

280
United Nations. 2009b. Millennium Development Goals, Environmental
Sustainability. Available at: http://www.un.org/milleniumgoals/environ.shtml
(accessed on 07 April 2009, 20 May 2010).
United States Agency for International Development (USAID). 2006.
Accreditation framework for municipalities to administer national housing
programmes. Available at: usaid.gov/pdf_docs/PNADH375.pdf (accessed on 22
July 2010).
Valiris, G, Chytas, P & Glykas, M. 2005. Making decisions using the balanced
scorecard and the simple multi-attribute rating technique. Performance
Measurement and Metrics 6(3):159–171.
Venter, A. 2008. “Breaking New Ground” housing plan: platform for critical
discourse in South Africa. Centre for Development Support, University of the
Free State. Available at:
http://www.sahf.org.za/Images/Docs/Papersadobe/ppt/Venter,%20Anita.pdf
(accessed on 23 March 2009).
Weil, RL & Maher, MW. 2005. Handbook of cost management. Hoboken: Wiley.
Weinstein, L. 2009. Achieving top quality. Strategic Finance 91(5):46–51.
Weinstein, L & Bukovinsky, D. 2009. Use of the balanced scorecard and
performance metrics to achieve operational and strategic alignment in arts and
culture not-for-profits. International Journal of Arts Management 11(2):42–55.
Wessels, L. 2010. Black market highlights RDP cracks. Fin24.com, 31 March.
Available at: http://www.fin24.com/Business/Black-market-highlights-RDP-
cracks-20100331 (accessed on 07 May 2010).

281
Whittaker, JB. 2001. Balanced Scorecard in the federal government. Vienna:
Management Concepts Inc.
Whitaker, D & Wilson, L. 2007. Human capital measurement: from insight to
action. Organization Development Journal 25(3):59–64.