the barclays real estate a.g.e.n.t. - the rob levy … may survey.pdf · may real estate a.g.e.n.t....
TRANSCRIPT
Equity Research
U.S. Homebuilding & Building
Products
Michael Dahl
+1 212 526 1341
BCI, US
Matthew Bouley
+1 212 526 9029
BCI, US
Anthony Trainor
+1 212 526 4634
BCI, US
Barclays Capital Inc. and/or one of its affiliates does and seeks to do business with companies covered in its research reports. As a result, investors should be
aware that the firm may have a conflict of interest that could affect the objectivity of this report.
Investors should consider this report as only a single factor in making their investment decision.
PLEASE SEE ANALYST CERTIFICATIONS AND IMPORTANT DISCLOSURES BEGINNING ON PAGE 46.
The Barclays Real Estate A.G.E.N.T. (Analyzing, Gauging, & Exploring Neighborhood Trends)
Homebuilding & Building Products June 5th, 2017
Source: Barclays Research
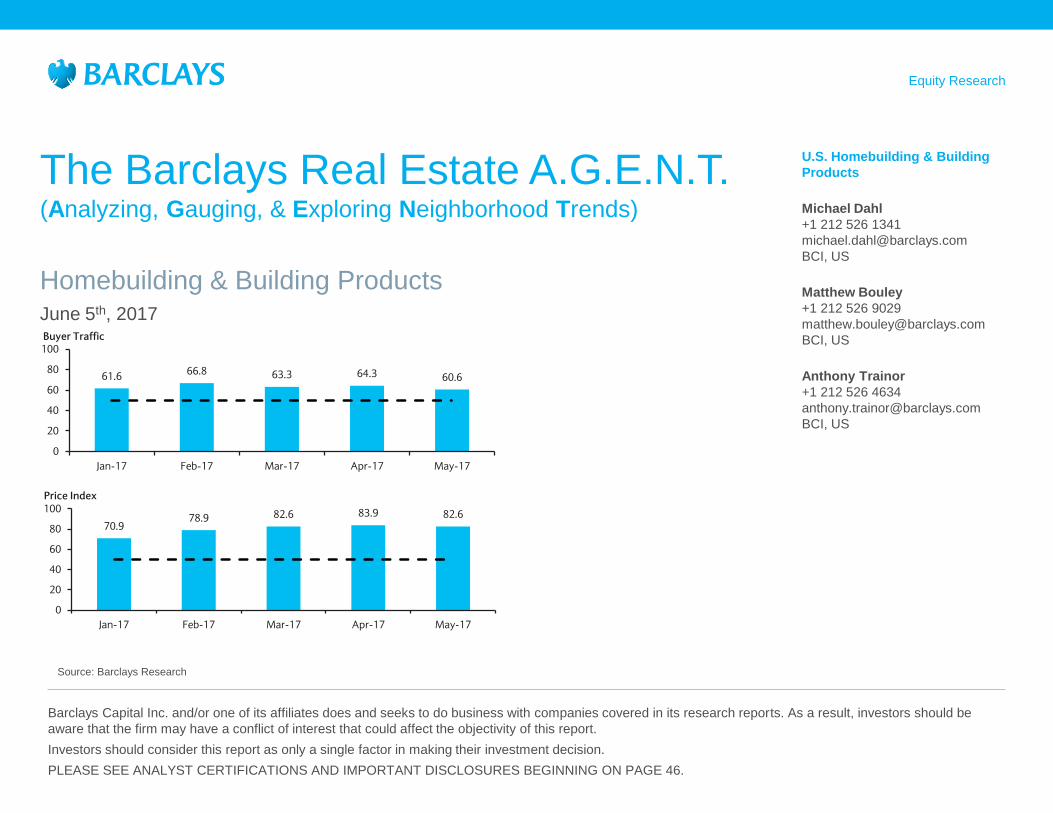
61.666.8 63.3 64.3 60.6
0
20
40
60
80
100
Jan-17 Feb-17 Mar-17 Apr-17 May-17
Buyer Traffic
70.978.9 82.6 83.9 82.6
0
20
40
60
80
100
Jan-17 Feb-17 Mar-17 Apr-17 May-17
Price Index

May Real Estate A.G.E.N.T. Survey Strength Erodes on Inventory and Affordability Headwinds
Source: Barclays Research
1
Traffic Still Solid, but Modestly Slower and with Widening Disparity
Across Markets: Our Buyer Traffic Index slipped to 61 in May from 64 in April
but held at levels indicating demand above agents’ expectations. Notably, we
saw a far greater dispersion of results across markets this month, whereas
prior months had shown unusually uniform strength. 9 markets indicated buyer
traffic trends below agents’ seasonal expectations, up from just 1 in April and
the January-April average of 3. Many of the larger markets underperformed,
with agents in these markets blaming a combination of lack of inventory and
worsening affordability. The former could create opportunities for homebuilders
to fill the supply gap in these markets, but the latter is likely to be an ongoing
constraint for overall demand for as long as the recent run up in home prices
continues. More broadly, agents continue to see support from healthy job
growth and favorable rates are still providing motivation. By price point, entry-
level trends improved, demand at the move-up segment was solid but
moderated vs. April, and luxury continues to face challenges.
Fewer Markets Exceed Expectations: In May, 27 of the 40 markets we
survey saw better than expected traffic (33 vs. April), 4 saw traffic in-line (6 in
April), and 9 pointed to lower than expected traffic (1 in April). The strongest
regions were the Midwest, Mid-Atlantic, and Northeast. Texas, Florida, and
California all worsened and came in below the average. Stronger individual
markets included KC, Minneapolis, Cincinnati, Philadelphia, Sacramento, Las
Vegas, and Boston. Meanwhile, San Diego, Houston, Atlanta, Denver, Miami,
Tampa, Orlando and the Inland Empire all fell short of expectations.
Supply Still Driving Prices Higher: Sellers continue to capitalize on the tight
inventory conditions. Our Home Price Index came in at 83 in May vs. 84 in
April, indicating broad price gains. Of the 40 markets we survey, 36 saw higher
prices m/m in May (39 in April), 3 markets were flat (0 in April), and 1 market
saw lower prices (same as last month). Particularly strong readings were seen
in Atlanta, Dallas, Detroit, Las Vegas, Nashville, Orlando, and Raleigh.
Buyer Traffic Home Price Incentive Home Listings Time to Sell
Month Index Index Index Index Index
Jan-17 61.6 70.9 43.5 64.8 54.9
Feb-17 66.8 78.9 44.7 55.1 63.1
Mar-17 63.3 82.6 49.5 57.0 65.7
Apr-17 64.3 83.9 48.6 60.1 68.0
May-17 60.6 82.6 47.5 56.9 66.5
Change (3.8) (1.2) (1.0) (3.2) (1.5)
44%
49%
17%
May Buyer Traffic Index of 60.6
Better than expected In-line with expectations Worse than expected

Buyer Segment Trends: Entry-Level Improves, Move-Up Solid, and Luxury Market Worsens
Source: Barclays Research
2
% of Respondents Seeing Improving Trends by Buyer Segment
% of Respondents Seeing Worsening Trends by Buyer Segment
51% 53%
19%
34%
57% 53%
19%
33%
0%
20%
40%
60%
80%
100%
Entry-level Move-up buyer Luxury buyer Active Adult buyer
April May
28%
15%
39%
7%
25%20%
41%
10%
0%
20%
40%
60%
80%
100%
Entry-level Move-up buyer Luxury buyer Active Adult buyer
April May

Table of Contents
Source: Barclays Research
3
Housing Markets:
4 Atlanta, Georgia
5 Austin, Texas
6 Baltimore, Maryland
7 Boston, Massachusetts
8 Charlotte, North Carolina
9 Chicago, Illinois
10 Cincinnati, Ohio
11 Columbus, Ohio
12 Dallas, Texas
13 Denver, Colorado
14 Detroit, Michigan
15 Fort Myers, Florida
16 Houston, Texas
17 Inland Empire, California
18 Jacksonville, Florida
19 Kansas City, Missouri
20 Las Vegas, Nevada
21 Los Angeles, California
22 Miami, Florida
23 Minneapolis, Minnesota
24 Nashville, Tennessee
25 New York, New York-Northern New Jersey
Housing Markets Continued
26 Orange County, California
27 Orlando, Florida
28 Philadelphia, Pennsylvania-Southern New Jersey
29 Phoenix, Arizona
30 Portland, Oregon
31 Raleigh, North Carolina
32 Richmond, Virginia
33 Sacramento, California
34 San Antonio, Texas
35 San Diego, California
36 San Francisco, California
37 Sarasota, Florida
38 Seattle, Washington
39 Tampa, Florida
40 Tucson, Arizona
41 Virginia Beach, Virginia
42 Washington, D.C.
43 Wilmington, North Carolina
Appendix:
44 Index Methodology
45 Summary Data
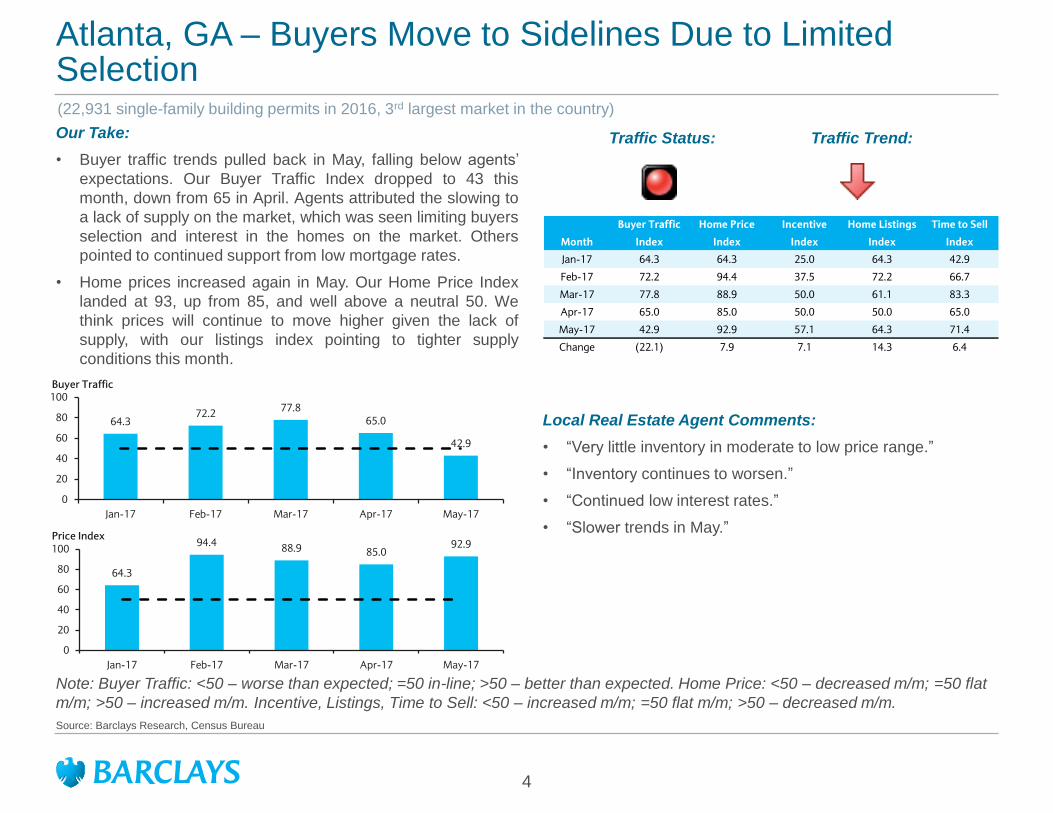
Atlanta, GA – Buyers Move to Sidelines Due to Limited Selection
4
Source: Barclays Research, Census Bureau
Traffic Status:
(22,931 single-family building permits in 2016, 3rd largest market in the country)
Our Take:
• Buyer traffic trends pulled back in May, falling below agents’
expectations. Our Buyer Traffic Index dropped to 43 this
month, down from 65 in April. Agents attributed the slowing to
a lack of supply on the market, which was seen limiting buyers
selection and interest in the homes on the market. Others
pointed to continued support from low mortgage rates.
• Home prices increased again in May. Our Home Price Index
landed at 93, up from 85, and well above a neutral 50. We
think prices will continue to move higher given the lack of
supply, with our listings index pointing to tighter supply
conditions this month.
Local Real Estate Agent Comments:
• “Very little inventory in moderate to low price range.”
• “Inventory continues to worsen.”
• “Continued low interest rates.”
• “Slower trends in May.”
Note: Buyer Traffic: <50 – worse than expected; =50 in-line; >50 – better than expected. Home Price: <50 – decreased m/m; =50 flat
m/m; >50 – increased m/m. Incentive, Listings, Time to Sell: <50 – increased m/m; =50 flat m/m; >50 – decreased m/m.
Traffic Trend:
64.3
94.488.9 85.0
92.9
0
20
40
60
80
100
Jan-17 Feb-17 Mar-17 Apr-17 May-17
Price Index
64.372.2
77.865.0
42.9
0
20
40
60
80
100
Jan-17 Feb-17 Mar-17 Apr-17 May-17
Buyer Traffic
Buyer Traffic Home Price Incentive Home Listings Time to Sell
Month Index Index Index Index Index
Jan-17 64.3 64.3 25.0 64.3 42.9
Feb-17 72.2 94.4 37.5 72.2 66.7
Mar-17 77.8 88.9 50.0 61.1 83.3
Apr-17 65.0 85.0 50.0 50.0 65.0
May-17 42.9 92.9 57.1 64.3 71.4
Change (22.1) 7.9 7.1 14.3 6.4
Note: Buyer Traffic: <50 – worse than expected; =50 in-line; >50 – better than expected. Home Price: <50 – decreased m/m; =50 flat
m/m; >50 – increased m/m. Incentive, Listings, Time to Sell: <50 – increased m/m; =50 flat m/m; >50 – decreased m/m.
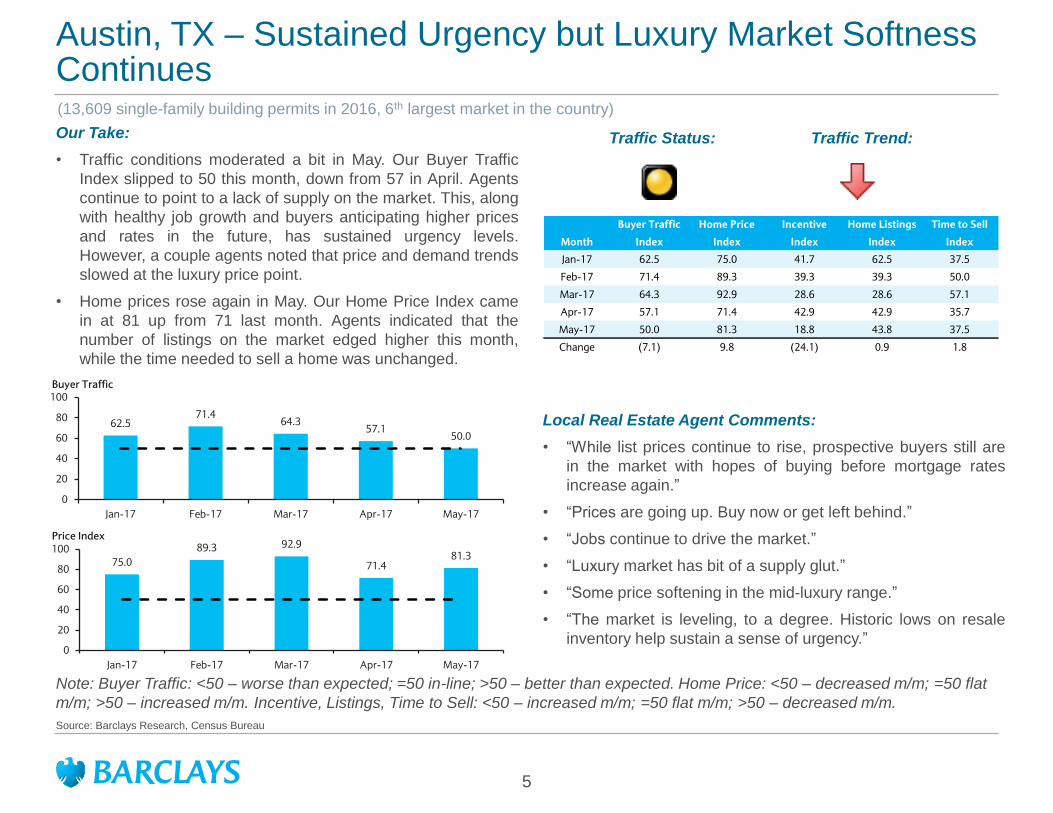
Austin, TX – Sustained Urgency but Luxury Market Softness Continues
5
Source: Barclays Research, Census Bureau
Traffic Status:
(13,609 single-family building permits in 2016, 6th largest market in the country)
Our Take:
• Traffic conditions moderated a bit in May. Our Buyer Traffic
Index slipped to 50 this month, down from 57 in April. Agents
continue to point to a lack of supply on the market. This, along
with healthy job growth and buyers anticipating higher prices
and rates in the future, has sustained urgency levels.
However, a couple agents noted that price and demand trends
slowed at the luxury price point.
• Home prices rose again in May. Our Home Price Index came
in at 81 up from 71 last month. Agents indicated that the
number of listings on the market edged higher this month,
while the time needed to sell a home was unchanged.
Local Real Estate Agent Comments:
• “While list prices continue to rise, prospective buyers still are
in the market with hopes of buying before mortgage rates
increase again.”
• “Prices are going up. Buy now or get left behind.”
• “Jobs continue to drive the market.”
• “Luxury market has bit of a supply glut.”
• “Some price softening in the mid-luxury range.”
• “The market is leveling, to a degree. Historic lows on resale
inventory help sustain a sense of urgency.”
Traffic Trend:
62.571.4
64.357.1
50.0
0
20
40
60
80
100
Jan-17 Feb-17 Mar-17 Apr-17 May-17
Buyer Traffic
75.0
89.3 92.9
71.481.3
0
20
40
60
80
100
Jan-17 Feb-17 Mar-17 Apr-17 May-17
Price Index
Buyer Traffic Home Price Incentive Home Listings Time to Sell
Month Index Index Index Index Index
Jan-17 62.5 75.0 41.7 62.5 37.5
Feb-17 71.4 89.3 39.3 39.3 50.0
Mar-17 64.3 92.9 28.6 28.6 57.1
Apr-17 57.1 71.4 42.9 42.9 35.7
May-17 50.0 81.3 18.8 43.8 37.5
Change (7.1) 9.8 (24.1) 0.9 1.8
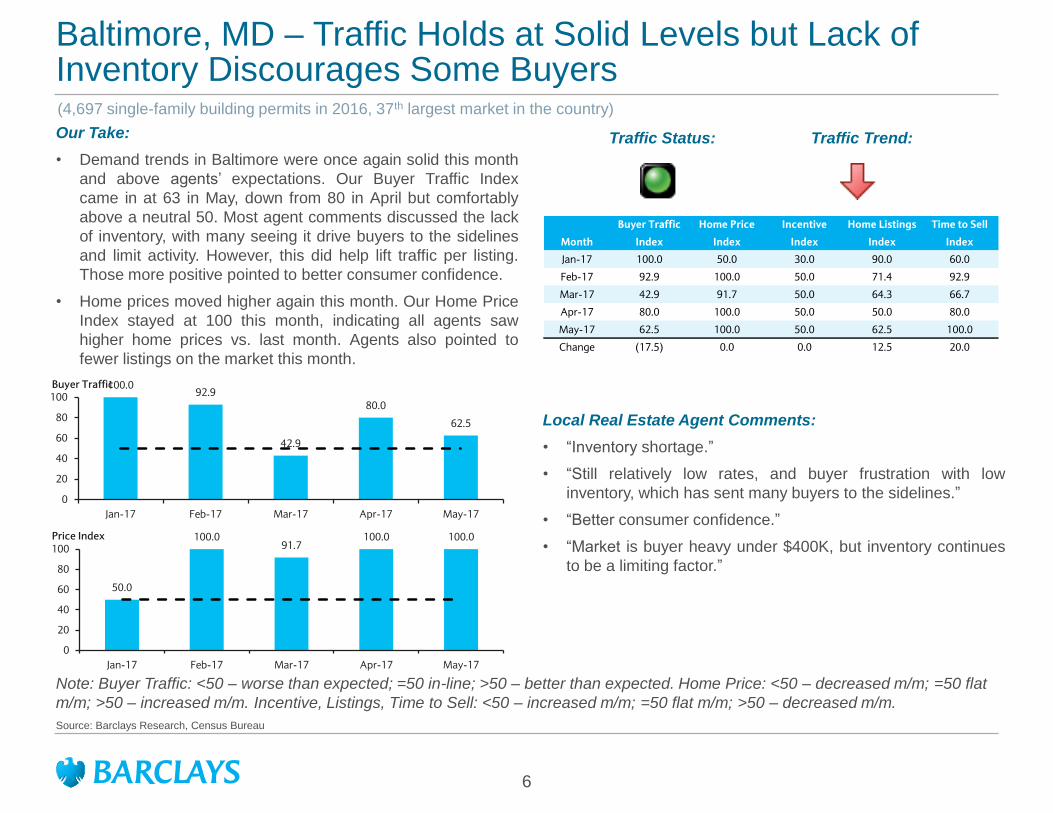
Baltimore, MD – Traffic Holds at Solid Levels but Lack of Inventory Discourages Some Buyers
6
Source: Barclays Research, Census Bureau
Traffic Status:
(4,697 single-family building permits in 2016, 37th largest market in the country)
Our Take:
• Demand trends in Baltimore were once again solid this month
and above agents’ expectations. Our Buyer Traffic Index
came in at 63 in May, down from 80 in April but comfortably
above a neutral 50. Most agent comments discussed the lack
of inventory, with many seeing it drive buyers to the sidelines
and limit activity. However, this did help lift traffic per listing.
Those more positive pointed to better consumer confidence.
• Home prices moved higher again this month. Our Home Price
Index stayed at 100 this month, indicating all agents saw
higher home prices vs. last month. Agents also pointed to
fewer listings on the market this month.
Local Real Estate Agent Comments:
• “Inventory shortage.”
• “Still relatively low rates, and buyer frustration with low
inventory, which has sent many buyers to the sidelines.”
• “Better consumer confidence.”
• “Market is buyer heavy under $400K, but inventory continues
to be a limiting factor.”
Note: Buyer Traffic: <50 – worse than expected; =50 in-line; >50 – better than expected. Home Price: <50 – decreased m/m; =50 flat
m/m; >50 – increased m/m. Incentive, Listings, Time to Sell: <50 – increased m/m; =50 flat m/m; >50 – decreased m/m.
Traffic Trend:
100.092.9
42.9
80.0
62.5
0
20
40
60
80
100
Jan-17 Feb-17 Mar-17 Apr-17 May-17
Buyer Traffic
50.0
100.091.7
100.0 100.0
0
20
40
60
80
100
Jan-17 Feb-17 Mar-17 Apr-17 May-17
Price Index
Buyer Traffic Home Price Incentive Home Listings Time to Sell
Month Index Index Index Index Index
Jan-17 100.0 50.0 30.0 90.0 60.0
Feb-17 92.9 100.0 50.0 71.4 92.9
Mar-17 42.9 91.7 50.0 64.3 66.7
Apr-17 80.0 100.0 50.0 50.0 80.0
May-17 62.5 100.0 50.0 62.5 100.0
Change (17.5) 0.0 0.0 12.5 20.0

Boston, MA – Traffic Trends Remain Strong, Despite the Lack of Selection
7
Source: Barclays Research, Census Bureau
Traffic Status:
(5,268 single-family building permits in 2016, 31st largest market in the country)
Our Take:
• Traffic conditions improved in May, moving above agents’
expectations. Our Buyer Traffic Index rose to 72 this month,
up from 56 in April. The lack of inventory across the market
was frequently cited in agent responses. This continues to
support urgency in the market, especially as buyers anticipate
higher prices and rates in the future. Others pointed to strong
consumer confidence.
• Home prices rose again in May. Our Home Price Index landed
at 84 this month, down from 91 in April. Agents indicated that
there were a few more listings on the market relative to April.
The time to sell contracted again this month.
Local Real Estate Agent Comments:
• “Low inventory.”
• “The limited inventory.”
• “Lack of inventory causing hysteria among buyers.”
• “Low rates helpful.”
• “Lack of inventory, greater competition, and low interest
rates.”
• “Low interest rates and fears that they will not stay. Consumer
confidence in general.”
Note: Buyer Traffic: <50 – worse than expected; =50 in-line; >50 – better than expected. Home Price: <50 – decreased m/m; =50 flat
m/m; >50 – increased m/m. Incentive, Listings, Time to Sell: <50 – increased m/m; =50 flat m/m; >50 – decreased m/m.
Traffic Trend:
61.555.9
77.8
56.3
71.9
0
20
40
60
80
100
Jan-17 Feb-17 Mar-17 Apr-17 May-17
Buyer Traffic
69.276.5
83.390.6
84.4
0
20
40
60
80
100
Jan-17 Feb-17 Mar-17 Apr-17 May-17
Price Index
Buyer Traffic Home Price Incentive Home Listings Time to Sell
Month Index Index Index Index Index
Jan-17 61.5 69.2 38.5 84.6 66.7
Feb-17 55.9 76.5 47.1 79.4 50.0
Mar-17 77.8 83.3 50.0 72.2 75.0
Apr-17 56.3 90.6 60.0 65.6 81.3
May-17 71.9 84.4 57.1 40.6 78.1
Change 15.6 (6.3) (2.9) (25.0) (3.1)
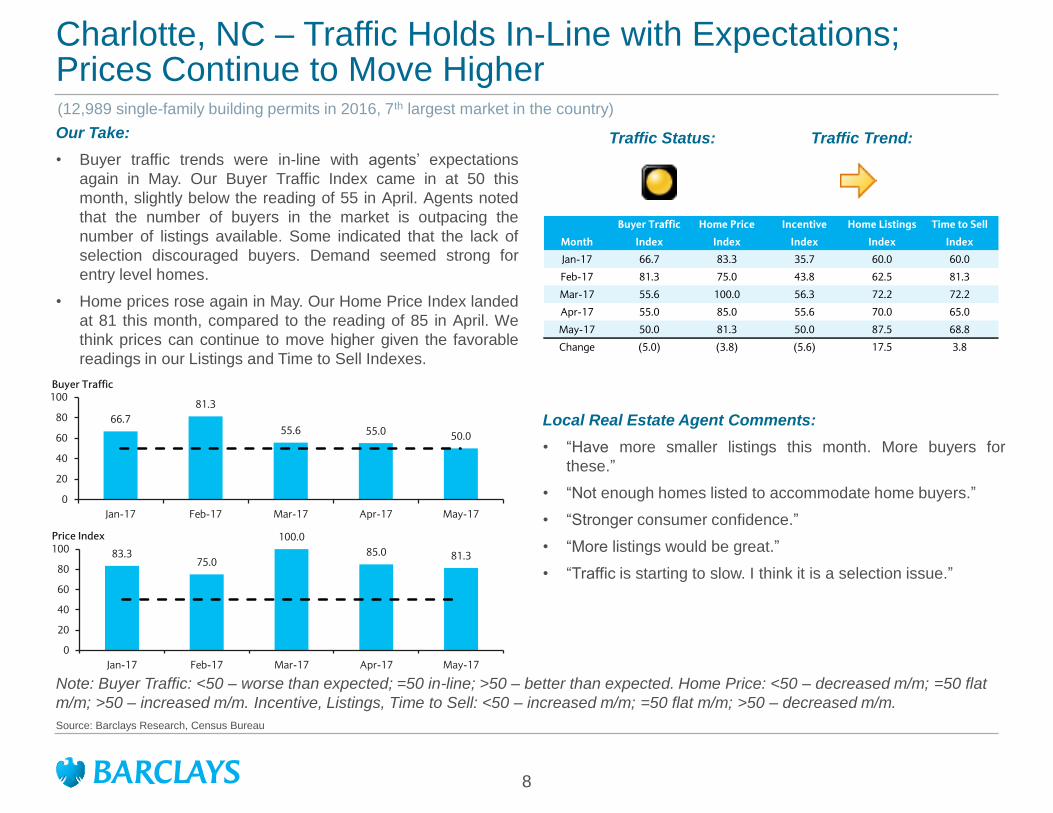
Charlotte, NC – Traffic Holds In-Line with Expectations; Prices Continue to Move Higher
8
Source: Barclays Research, Census Bureau
Traffic Status:
(12,989 single-family building permits in 2016, 7th largest market in the country)
Our Take:
• Buyer traffic trends were in-line with agents’ expectations
again in May. Our Buyer Traffic Index came in at 50 this
month, slightly below the reading of 55 in April. Agents noted
that the number of buyers in the market is outpacing the
number of listings available. Some indicated that the lack of
selection discouraged buyers. Demand seemed strong for
entry level homes.
• Home prices rose again in May. Our Home Price Index landed
at 81 this month, compared to the reading of 85 in April. We
think prices can continue to move higher given the favorable
readings in our Listings and Time to Sell Indexes.
Local Real Estate Agent Comments:
• “Have more smaller listings this month. More buyers for
these.”
• “Not enough homes listed to accommodate home buyers.”
• “Stronger consumer confidence.”
• “More listings would be great.”
• “Traffic is starting to slow. I think it is a selection issue.”
Note: Buyer Traffic: <50 – worse than expected; =50 in-line; >50 – better than expected. Home Price: <50 – decreased m/m; =50 flat
m/m; >50 – increased m/m. Incentive, Listings, Time to Sell: <50 – increased m/m; =50 flat m/m; >50 – decreased m/m.
Traffic Trend:
66.7
81.3
55.6 55.0 50.0
0
20
40
60
80
100
Jan-17 Feb-17 Mar-17 Apr-17 May-17
Buyer Traffic
83.375.0
100.0
85.0 81.3
0
20
40
60
80
100
Jan-17 Feb-17 Mar-17 Apr-17 May-17
Price Index
Buyer Traffic Home Price Incentive Home Listings Time to Sell
Month Index Index Index Index Index
Jan-17 66.7 83.3 35.7 60.0 60.0
Feb-17 81.3 75.0 43.8 62.5 81.3
Mar-17 55.6 100.0 56.3 72.2 72.2
Apr-17 55.0 85.0 55.6 70.0 65.0
May-17 50.0 81.3 50.0 87.5 68.8
Change (5.0) (3.8) (5.6) 17.5 3.8

Chicago, IL – Upward Climb Continues
9
Source: Barclays Research, Census Bureau
Traffic Status:
(8,118 single-family building permits in 2016, 17th largest market in the country)
Our Take:
• Buyers remained active this month in the Chicago area, with
traffic trends above agents’ expectations. Our Buyer Traffic
Index landed at 60 this month, down from 71 in April. Agents
attributed the strength to better consumer sentiment and
improving local economic conditions. Inventory levels remain
tight, especially at lower price points, and agents see this
contributing to more multiple bid situations.
• Home prices edged higher again in May. Our Home Price
Index landed at 78 this month, little changed from the reading
during April. Agents pointed to more listings on the market,
though it took less time to sell a home.
Local Real Estate Agent Comments:
• “Low inventory at low and middle prices in the market.”
• “Increased demand.”
• “There is simply a good number of qualified buyers out looking
to purchase, it seems.”
• “Lack of inventory and low interest rates that are slightly
rising.”
• “Consumer confidence better.”
• “The economy is improving slowly.”
• “Many, many, many multiple offers.”
Note: Buyer Traffic: <50 – worse than expected; =50 in-line; >50 – better than expected. Home Price: <50 – decreased m/m; =50 flat
m/m; >50 – increased m/m. Incentive, Listings, Time to Sell: <50 – increased m/m; =50 flat m/m; >50 – decreased m/m.
Traffic Trend:
48.160.4 63.0
70.860.4
0
20
40
60
80
100
Jan-17 Feb-17 Mar-17 Apr-17 May-17
Buyer Traffic
61.572.9 69.6
76.1 78.3
0
20
40
60
80
100
Jan-17 Feb-17 Mar-17 Apr-17 May-17
Price Index
Buyer Traffic Home Price Incentive Home Listings Time to Sell
Month Index Index Index Index Index
Jan-17 48.1 61.5 50.0 60.0 38.0
Feb-17 60.4 72.9 52.3 50.0 70.8
Mar-17 63.0 69.6 52.5 39.1 60.9
Apr-17 70.8 76.1 43.2 41.3 54.3
May-17 60.4 78.3 43.5 28.3 60.9
Change (10.4) 2.2 0.3 (13.0) 6.5

Cincinnati, OH – Traffic and Prices Move Higher
10
Source: Barclays Research, Census Bureau
Traffic Status:
(3,932 single-family building permits in 2016, 46th largest market in the country)
Our Take:
• Favorable traffic trends continued this month, remaining
above agents’ expectations. Our Buyer Traffic Index landed at
80 in May, up from 67 in April. Agents discussed that the
healthy activity was driven by buyers’ desire to take
advantage of the favorable mortgage rate environment at
current prices. However, others indicated that there is a lack
of supply on the market to support this activity.
• Home prices rose again in May. Our Home Price Index lifted
to 90 in May, up from 83 in April. Agents pointed to flat listing
levels relative to last month, while it took a bit less time to sell
a home.
Local Real Estate Agent Comments:
• “Buyers confident in the future. They desire to buy now while
prices and interest rates are so favorable.”
• “Low inventory.”
• “Listings are not keeping up with buyer demand.”
• “Buyer confidence and a desire to take advantage of today's
low interest rates and current prices.”
• “Lack of houses on the market.”
Note: Buyer Traffic: <50 – worse than expected; =50 in-line; >50 – better than expected. Home Price: <50 – decreased m/m; =50 flat
m/m; >50 – increased m/m. Incentive, Listings, Time to Sell: <50 – increased m/m; =50 flat m/m; >50 – decreased m/m.
Traffic Trend:
83.3
70.0
37.5
66.7
80.0
0
20
40
60
80
100
Jan-17 Feb-17 Mar-17 Apr-17 May-17
Buyer Traffic
77.890.0
75.083.3
90.0
0
20
40
60
80
100
Jan-17 Feb-17 Mar-17 Apr-17 May-17
Price Index
Buyer Traffic Home Price Incentive Home Listings Time to Sell
Month Index Index Index Index Index
Jan-17 83.3 77.8 57.1 77.8 88.9
Feb-17 70.0 90.0 50.0 60.0 70.0
Mar-17 37.5 75.0 50.0 66.7 83.3
Apr-17 66.7 83.3 33.3 100.0 100.0
May-17 80.0 90.0 37.5 50.0 62.5
Change 13.3 6.7 4.2 (50.0) (37.5)

Columbus, OH – Healthy Traffic Trends Continue, Aided by Tight Inventory, Drives Urgency
11
Source: Barclays Research, Census Bureau
Traffic Status:
(4,040 single-family building permits in 2016, 43rd largest market in the country)
Our Take:
• Traffic conditions were once again above agents’ expectations
in May. Our Buyer Traffic Index came in at 60, down from 71
in April. Agents noted broad urgency in the market, driven by
tight inventory conditions and rising home prices. This was
also seen contributing to more multiple offer situations.
• Home prices rose again May. Our Home Price Index came in
at 90 in May, little changed from the reading of 93 in April.
Agents indicated that more listings came to market this
month. If this continues, we think this could curb pricing gains.
Agents suggested it took less time to sell a home this month,
compared to April.
Local Real Estate Agent Comments:
• “Scarcity of inventory and escalating prices causing fence
sitters and move-up buyers to act.”
• “Lack of inventory.”
• “Continued low inventory. We are seeing low market time and
multi-offers become the norm.”
Note: Buyer Traffic: <50 – worse than expected; =50 in-line; >50 – better than expected. Home Price: <50 – decreased m/m; =50 flat
m/m; >50 – increased m/m. Incentive, Listings, Time to Sell: <50 – increased m/m; =50 flat m/m; >50 – decreased m/m.
Traffic Trend:
50.0
83.3
62.571.4
60.0
0
20
40
60
80
100
Jan-17 Feb-17 Mar-17 Apr-17 May-17
Buyer Traffic
87.5 91.7 87.592.9 90.0
0
20
40
60
80
100
Jan-17 Feb-17 Mar-17 Apr-17 May-17
Price Index
Buyer Traffic Home Price Incentive Home Listings Time to Sell
Month Index Index Index Index Index
Jan-17 50.0 87.5 50.0 87.5 75.0
Feb-17 83.3 91.7 41.7 50.0 75.0
Mar-17 62.5 87.5 50.0 62.5 100.0
Apr-17 71.4 92.9 50.0 57.1 78.6
May-17 60.0 90.0 60.0 20.0 80.0
Change (11.4) (2.9) 10.0 (37.1) 1.4

Dallas, TX – Jobs Still Helpful but Affordability Has its Limits
12
Source: Barclays Research, Census Bureau
Traffic Status:
(29,846 single-family building permits in 2016, 2nd largest market in the country)
Our Take:
• Traffic trends fell and were only in-line with agents’
expectations in May. Our Buyer Traffic Index came in at 50,
down from 64 in April. Agent comments were rather mixed.
Those positive focused on the strong local economy and
continued job growth. Those more negative highlighted the
lack of inventory and selection on the market as well as some
concerns that affordability has become too stretched.
• Home prices rose again. Our Home Price Index came in at 94
in May, slightly lower than the reading of 96 in April. Agents
pointed to generally stable inventory levels, while it took less
time to sell a home.
Local Real Estate Agent Comments:
• “Lack of supply and increased population have pushed the
market.”
• “Jobs in the area. Companies relocating to area.”
• “Very low inventory. Properties values have soared to record
levels.”
• “Continued influx of jobs.”
• “Good work prospects.”
• “Job growth.”
Note: Buyer Traffic: <50 – worse than expected; =50 in-line; >50 – better than expected. Home Price: <50 – decreased m/m; =50 flat
m/m; >50 – increased m/m. Incentive, Listings, Time to Sell: <50 – increased m/m; =50 flat m/m; >50 – decreased m/m.
Traffic Trend:
61.8 65.5 63.6 64.0
50.0
0
20
40
60
80
100
Jan-17 Feb-17 Mar-17 Apr-17 May-17
Buyer Traffic
82.489.7 86.4
96.0 94.4
0
20
40
60
80
100
Jan-17 Feb-17 Mar-17 Apr-17 May-17
Price Index
Buyer Traffic Home Price Incentive Home Listings Time to Sell
Month Index Index Index Index Index
Jan-17 61.8 82.4 37.5 70.3 63.5
Feb-17 65.5 89.7 51.8 60.7 64.3
Mar-17 63.6 86.4 38.6 61.4 63.6
Apr-17 64.0 96.0 35.4 46.0 72.0
May-17 50.0 94.4 56.3 55.6 85.7
Change (14.0) (1.6) 20.8 9.6 13.7

Denver, CO – Traffic Drops as High Home Prices Take a Toll
13
Source: Barclays Research, Census Bureau
Traffic Status:
(10,211 single-family building permits in 2016, 11th largest market in the country)
Our Take:
• Traffic conditions worsened this month, with our index falling
to levels indicating trends below agents’ expectations. Our
Buyer Traffic Index came in at 42 in May, down from 63 in
April. Agents continue to see strong economic and
employment trends in the market. However, most attributed
the softness to home prices running up too much for what
potential buyers can afford at this point.
• Home prices rose again in May. Our Home Price Index came
in at 83 this month, still strong but below the reading of 92 in
April. We think pricing gains could moderate given the soft
traffic trends and signs that inventory may be picking up.
Local Real Estate Agent Comments:
• “My leads are down. I think prices are a big factor.”
• “Low interest rates and buyers eager to find a house.”
• “Continuing strong employment.”
• “Few homes on the market under $300k.”
• “Favorable interest rates, lack of inventory.”
• “Home prices too high.”
Note: Buyer Traffic: <50 – worse than expected; =50 in-line; >50 – better than expected. Home Price: <50 – decreased m/m; =50 flat
m/m; >50 – increased m/m. Incentive, Listings, Time to Sell: <50 – increased m/m; =50 flat m/m; >50 – decreased m/m.
Traffic Trend:
53.362.5 63.3 62.5
41.7
0
20
40
60
80
100
Jan-17 Feb-17 Mar-17 Apr-17 May-17
Buyer Traffic
60.0
90.0 86.7 91.783.3
0
20
40
60
80
100
Jan-17 Feb-17 Mar-17 Apr-17 May-17
Price Index
Buyer Traffic Home Price Incentive Home Listings Time to Sell
Month Index Index Index Index Index
Jan-17 53.3 60.0 50.0 80.0 53.3
Feb-17 62.5 90.0 44.7 60.0 55.0
Mar-17 63.3 86.7 50.0 60.0 66.7
Apr-17 62.5 91.7 62.5 50.0 62.5
May-17 41.7 83.3 58.3 33.3 50.0
Change (20.8) (8.3) (4.2) (16.7) (12.5)
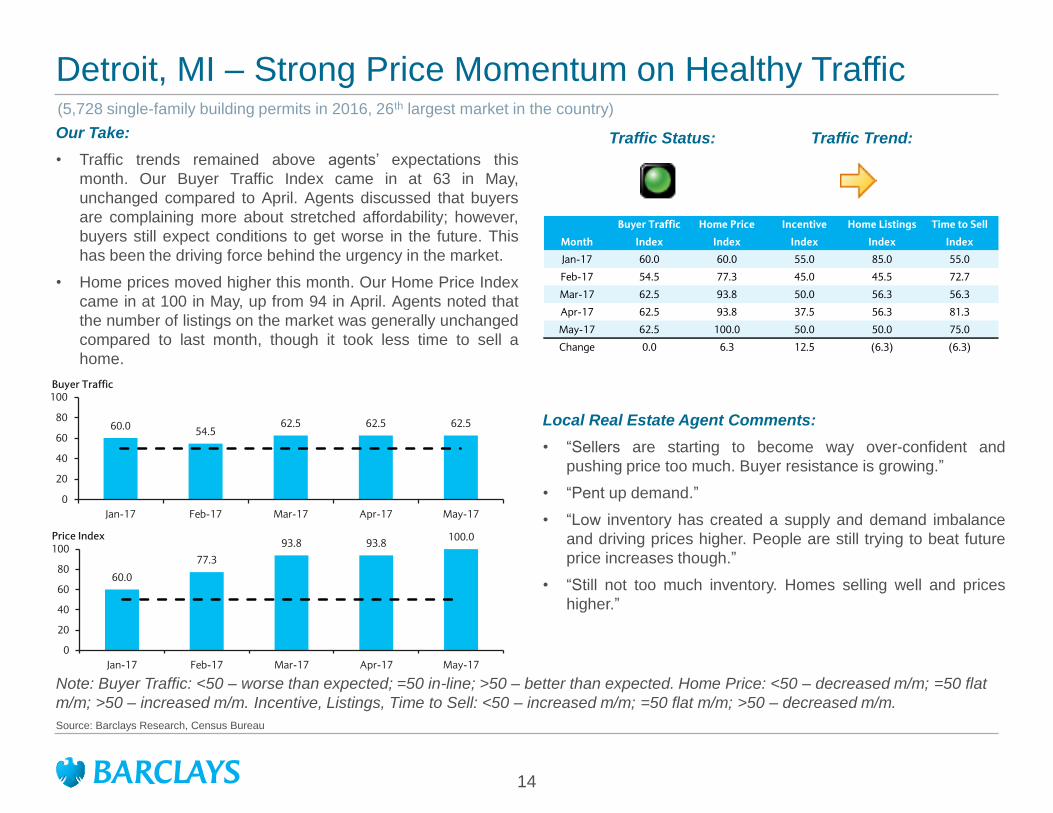
Detroit, MI – Strong Price Momentum on Healthy Traffic
14
Source: Barclays Research, Census Bureau
Traffic Status:
(5,728 single-family building permits in 2016, 26th largest market in the country)
Our Take:
• Traffic trends remained above agents’ expectations this
month. Our Buyer Traffic Index came in at 63 in May,
unchanged compared to April. Agents discussed that buyers
are complaining more about stretched affordability; however,
buyers still expect conditions to get worse in the future. This
has been the driving force behind the urgency in the market.
• Home prices moved higher this month. Our Home Price Index
came in at 100 in May, up from 94 in April. Agents noted that
the number of listings on the market was generally unchanged
compared to last month, though it took less time to sell a
home.
Local Real Estate Agent Comments:
• “Sellers are starting to become way over-confident and
pushing price too much. Buyer resistance is growing.”
• “Pent up demand.”
• “Low inventory has created a supply and demand imbalance
and driving prices higher. People are still trying to beat future
price increases though.”
• “Still not too much inventory. Homes selling well and prices
higher.”
Note: Buyer Traffic: <50 – worse than expected; =50 in-line; >50 – better than expected. Home Price: <50 – decreased m/m; =50 flat
m/m; >50 – increased m/m. Incentive, Listings, Time to Sell: <50 – increased m/m; =50 flat m/m; >50 – decreased m/m.
Traffic Trend:
60.054.5
62.5 62.5 62.5
0
20
40
60
80
100
Jan-17 Feb-17 Mar-17 Apr-17 May-17
Buyer Traffic
60.0
77.3
93.8 93.8100.0
0
20
40
60
80
100
Jan-17 Feb-17 Mar-17 Apr-17 May-17
Price Index
Buyer Traffic Home Price Incentive Home Listings Time to Sell
Month Index Index Index Index Index
Jan-17 60.0 60.0 55.0 85.0 55.0
Feb-17 54.5 77.3 45.0 45.5 72.7
Mar-17 62.5 93.8 50.0 56.3 56.3
Apr-17 62.5 93.8 37.5 56.3 81.3
May-17 62.5 100.0 50.0 50.0 75.0
Change 0.0 6.3 12.5 (6.3) (6.3)

Fort Myers, FL – Traffic Bounces Back; Pricing Flat
15
Source: Barclays Research, Census Bureau
Traffic Status:
(4,092 single-family building permits in 2016, 42nd largest market in the country)
Our Take:
• Traffic trends bounced back this month, reaching levels above
agents’ expectations. Our Buyer Traffic Index came in at 67 in
May, up from 43 in April. Agent expectations seemed to move
lower as they exited their busy selling season. Others
attributed the improvement to more interest from Canadian
buyers and healthy housing activity in other areas of the
country driving better demand from retiree buyers.
• Home prices were relatively flat this month. Our Home Price
Index landed at 50 in May, down from a reading of 64 in April.
Agents indicated that there were fewer listings on the market
this month, while it took a bit longer to sell a home.
Local Real Estate Agent Comments:
• “We are seeing a normal decrease in traffic as snowbirds
head back north.”
• “Canadians tired of waiting for exchange rate to improve.”
• “Higher prices in other areas of the country make retiring to
Florida easier.”
• “This season was great. Now things are slower as expected.”
Note: Buyer Traffic: <50 – worse than expected; =50 in-line; >50 – better than expected. Home Price: <50 – decreased m/m; =50 flat
m/m; >50 – increased m/m. Incentive, Listings, Time to Sell: <50 – increased m/m; =50 flat m/m; >50 – decreased m/m.
Traffic Trend:
36.4
62.5
42.9 42.9
66.7
0
20
40
60
80
100
Jan-17 Feb-17 Mar-17 Apr-17 May-17
Buyer Traffic
69.276.5
83.390.6
84.4
0
20
40
60
80
100
Jan-17 Feb-17 Mar-17 Apr-17 May-17
Price Index
Buyer Traffic Home Price Incentive Home Listings Time to Sell
Month Index Index Index Index Index
Jan-17 36.4 63.6 40.9 31.8 36.4
Feb-17 62.5 75.0 50.0 25.0 56.3
Mar-17 42.9 71.4 50.0 33.3 50.0
Apr-17 42.9 64.3 28.6 42.9 7.1
May-17 66.7 50.0 25.0 58.3 41.7
Change 23.8 (14.3) (3.6) 15.5 34.5

Houston, TX – Choppy Trends Resume As Confidence Wanes
16
Source: Barclays Research, Census Bureau
Traffic Status:
(35,397 single-family building permits in 2016, 1st largest market in the country)
Our Take:
• Traffic pulled back this month, falling to levels below agents’
expectations. Our Buyer Traffic Index dropped to 40 in May,
down from 63 in April. Agents mentioned that the recent
volatility in oil prices has driven a more cautious buyer
sentiment, even though there hasn‘t been an uptick in layoffs.
Others noted that rate-driven urgency moderated, though
homes at lower price points are still selling well.
• Home prices were relatively stable this month. Our Home
Price Index came in at 55, little changed from April’s reading.
We think pricing will remain choppy near-term, given the
unfavorable readings in our Listings and Time to Sell indexes.
Local Real Estate Agent Comments:
• “$45 oil prices are putting a wet blanket on the market.”
• “More inventory.”
• “Confidence in the local economy has improved as oil prices
have stabilized, albeit at lower levels than are necessary for
robust job growth.”
• “The prevailing feeling is that layoffs are over with for the
foreseeable future. The bump in demand we saw in the first
quarter, likely due to interest rate concerns, seems to have
evaporated.”
• “Entry level is in high demand.”
Note: Buyer Traffic: <50 – worse than expected; =50 in-line; >50 – better than expected. Home Price: <50 – decreased m/m; =50 flat
m/m; >50 – increased m/m. Incentive, Listings, Time to Sell: <50 – increased m/m; =50 flat m/m; >50 – decreased m/m.
Traffic Trend:
65.4
50.0 53.662.5
40.0
0
20
40
60
80
100
Jan-17 Feb-17 Mar-17 Apr-17 May-17
Buyer Traffic
42.3
62.567.9
56.3 55.0
0
20
40
60
80
100
Jan-17 Feb-17 Mar-17 Apr-17 May-17
Price Index
Buyer Traffic Home Price Incentive Home Listings Time to Sell
Month Index Index Index Index Index
Jan-17 65.4 42.3 23.1 34.6 38.5
Feb-17 50.0 62.5 26.7 34.4 40.6
Mar-17 53.6 67.9 46.4 32.1 38.5
Apr-17 62.5 56.3 37.5 25.0 43.8
May-17 40.0 55.0 20.0 20.0 20.0
Change (22.5) (1.3) (17.5) (5.0) (23.8)

Inland Empire, CA – Traffic Drops as Inventory Problems Build
17
Source: Barclays Research, Census Bureau
Traffic Status:
(7,930 single-family building permits in 2016, 18th largest market in the country)
Our Take:
• Conditions deteriorated in May, with traffic levels falling below
agents’ expectations following 4 months of stronger than
expected levels. Our Buyer Traffic Index came in at 44, down
from 72 in April. Agents attributed the softness to inventory
issues. There seems to be very little selection across the
market. Also, what is available is much larger and at a higher
price point relative to the potential buyers in the market.
• Home prices rose again in May. Our Home Price Index landed
at 75 this month, slightly lower than the reading of 89 in April.
Agents pointed to fewer listings on the market, while the time
needed to sell a home was generally unchanged.
Local Real Estate Agent Comments:
• “Inventory too big for the buyers most active.”
• “Interest rates.”
• “Rising stock market prices and people having more money.”
• “Still people looking but for the most part. No inventory.”
• “Interest rates.”
Note: Buyer Traffic: <50 – worse than expected; =50 in-line; >50 – better than expected. Home Price: <50 – decreased m/m; =50 flat
m/m; >50 – increased m/m. Incentive, Listings, Time to Sell: <50 – increased m/m; =50 flat m/m; >50 – decreased m/m.
Traffic Trend:
64.372.2 75.0 72.2
43.8
0
20
40
60
80
100
Jan-17 Feb-17 Mar-17 Apr-17 May-17
Buyer Traffic
66.772.2
90.0 88.9
75.0
0
20
40
60
80
100
Jan-17 Feb-17 Mar-17 Apr-17 May-17
Price Index
Buyer Traffic Home Price Incentive Home Listings Time to Sell
Month Index Index Index Index Index
Jan-17 64.3 66.7 45.0 66.7 50.0
Feb-17 72.2 72.2 43.8 50.0 50.0
Mar-17 75.0 90.0 50.0 66.7 61.1
Apr-17 72.2 88.9 42.9 66.7 77.8
May-17 43.8 75.0 57.1 62.5 56.3
Change (28.5) (13.9) 14.3 (4.2) (21.5)
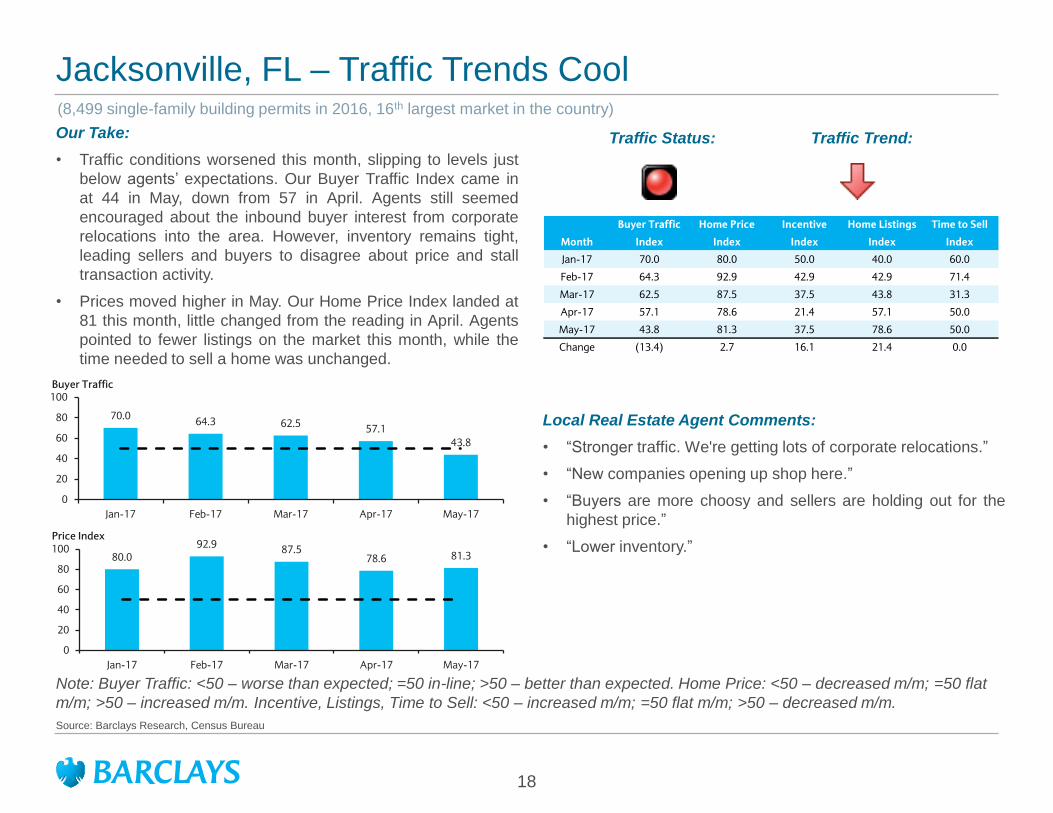
Jacksonville, FL – Traffic Trends Cool
18
Source: Barclays Research, Census Bureau
Traffic Status:
(8,499 single-family building permits in 2016, 16th largest market in the country)
Our Take:
• Traffic conditions worsened this month, slipping to levels just
below agents’ expectations. Our Buyer Traffic Index came in
at 44 in May, down from 57 in April. Agents still seemed
encouraged about the inbound buyer interest from corporate
relocations into the area. However, inventory remains tight,
leading sellers and buyers to disagree about price and stall
transaction activity.
• Prices moved higher in May. Our Home Price Index landed at
81 this month, little changed from the reading in April. Agents
pointed to fewer listings on the market this month, while the
time needed to sell a home was unchanged.
Local Real Estate Agent Comments:
• “Stronger traffic. We're getting lots of corporate relocations.”
• “New companies opening up shop here.”
• “Buyers are more choosy and sellers are holding out for the
highest price.”
• “Lower inventory.”
Note: Buyer Traffic: <50 – worse than expected; =50 in-line; >50 – better than expected. Home Price: <50 – decreased m/m; =50 flat
m/m; >50 – increased m/m. Incentive, Listings, Time to Sell: <50 – increased m/m; =50 flat m/m; >50 – decreased m/m.
Traffic Trend:
70.064.3 62.5
57.1
43.8
0
20
40
60
80
100
Jan-17 Feb-17 Mar-17 Apr-17 May-17
Buyer Traffic
80.092.9
87.578.6 81.3
0
20
40
60
80
100
Jan-17 Feb-17 Mar-17 Apr-17 May-17
Price Index
Buyer Traffic Home Price Incentive Home Listings Time to Sell
Month Index Index Index Index Index
Jan-17 70.0 80.0 50.0 40.0 60.0
Feb-17 64.3 92.9 42.9 42.9 71.4
Mar-17 62.5 87.5 37.5 43.8 31.3
Apr-17 57.1 78.6 21.4 57.1 50.0
May-17 43.8 81.3 37.5 78.6 50.0
Change (13.4) 2.7 16.1 21.4 0.0

Kansas City, MO – Traffic Index Bounces Back
19
Source: Barclays Research, Census Bureau
Traffic Status:
(5,248 single-family building permits in 2016, 32nd largest market in the country)
Our Take:
• Traffic conditions improved in May, returning to levels above
agents’ expectations. Our Buyer Traffic Index rose to a
reading of 88 this month, up from 50 in April. Agents noted
broad urgency in the market, as buyers desire to purchase a
home before rates or prices go up. At the same time, rising
rental rates have also been a motivating factor.
• Home prices increased again this month. Our Home Price
Index landed at 75 in May, slightly lower than the reading of
88 in April. We think prices can continue to grind higher given
the favorable readings in our Listings and Time to Sell
Indexes.
Local Real Estate Agent Comments:
• “Interest rates help.”
• “Urgency to own vs. rent before rates go up and buyers
trading up.”
• “Low inventory.”
• “Stable rates and rising rents.”
Note: Buyer Traffic: <50 – worse than expected; =50 in-line; >50 – better than expected. Home Price: <50 – decreased m/m; =50 flat
m/m; >50 – increased m/m. Incentive, Listings, Time to Sell: <50 – increased m/m; =50 flat m/m; >50 – decreased m/m.
Traffic Trend:
60.0
75.0 75.0
50.0
87.5
0
20
40
60
80
100
Jan-17 Feb-17 Mar-17 Apr-17 May-17
Buyer Traffic
80.0 81.3
100.087.5
75.0
0
20
40
60
80
100
Jan-17 Feb-17 Mar-17 Apr-17 May-17
Price Index
Buyer Traffic Home Price Incentive Home Listings Time to Sell
Month Index Index Index Index Index
Jan-17 60.0 80.0 50.0 75.0 40.0
Feb-17 75.0 81.3 42.9 75.0 81.3
Mar-17 75.0 100.0 58.3 50.0 83.3
Apr-17 50.0 87.5 60.0 80.0 80.0
May-17 87.5 75.0 62.5 75.0 100.0
Change 37.5 (12.5) 2.5 (5.0) 20.0

Las Vegas, NV – Buyers Look to Beat Future Cost Increases
20
Source: Barclays Research, Census Bureau
Traffic Status:
(8,805 single-family building permits in 2016, 15th largest market in the country)
Our Take:
• Strong traffic trends continued through May. Our Buyer traffic
Index came in at 70 this month, down a bit from the reading of
79 last month but still at levels indicating trends above agents’
expectations. Agents pointed to broad activity in the market,
driven by urgency given the concerns that price and costs will
continue to rise. Others highlighted that sentiment has
improved as well.
• Home prices rose in May. Our Home Price Index came in at
90 this month, up a bit from a reading of 88 in April. Both our
Listings and Time to Sell Index were favorable this month,
supportive for future pricing gains.
Local Real Estate Agent Comments:
• “Buyers are still concerned that interest rates and home prices
will continue to rise, effectively eliminating their ability to afford
a home.”
• “Sentiment has improved.”
• “New homes popping up everywhere.”
• “Low inventory and higher prices.”
Note: Buyer Traffic: <50 – worse than expected; =50 in-line; >50 – better than expected. Home Price: <50 – decreased m/m; =50 flat
m/m; >50 – increased m/m. Incentive, Listings, Time to Sell: <50 – increased m/m; =50 flat m/m; >50 – decreased m/m.
Traffic Trend:
72.766.7 70.6
79.270.0
0
20
40
60
80
100
Jan-17 Feb-17 Mar-17 Apr-17 May-17
Buyer Traffic
72.783.3
76.587.5 90.0
0
20
40
60
80
100
Jan-17 Feb-17 Mar-17 Apr-17 May-17
Price Index
Buyer Traffic Home Price Incentive Home Listings Time to Sell
Month Index Index Index Index Index
Jan-17 72.7 72.7 27.8 33.3 55.6
Feb-17 66.7 83.3 33.3 55.6 50.0
Mar-17 70.6 76.5 38.2 73.5 73.5
Apr-17 79.2 87.5 40.9 75.0 75.0
May-17 70.0 90.0 50.0 70.0 70.0
Change (9.2) 2.5 9.1 (5.0) (5.0)

Los Angeles, CA – Activity is Buzzing but Prices May be Getting Out of Hand
21
Source: Barclays Research, Census Bureau
Traffic Status:
(4,936 single-family building permits in 2016, 34th largest market in the country)
Our Take:
• Traffic trends ticked up this month, rising to levels above
agents’ expectations. Our Buyer Traffic Index came in at 65,
up from 57 in April. Agents attributed the pick up to local
economic growth. At the same time, inventories remain very
tight, driving more multiple offer situations and home prices
higher. Some indicated that affordability had become
incrementally more stretched.
• Home prices moved higher in May. Our Home Price Index
came in at 87 this month, up from 83 in April. Agents pointed
to flat listings this month, while the time to sell a home
declined.
Local Real Estate Agent Comments:
• “Low inventory.”
• “Rising interest rates and lack of inventory.”
• “The market has been very active with multiple offers on
properties that are priced competitively. The overbidding is
significant.”
• “The economy is stronger.”
• “Low inventory coupled with low interest rates.”
• “Limited inventory levels.”
• “Prices too high for many buyers.”
Note: Buyer Traffic: <50 – worse than expected; =50 in-line; >50 – better than expected. Home Price: <50 – decreased m/m; =50 flat
m/m; >50 – increased m/m. Incentive, Listings, Time to Sell: <50 – increased m/m; =50 flat m/m; >50 – decreased m/m.
Traffic Trend:
59.551.4
61.1 56.764.8
0
20
40
60
80
100
Jan-17 Feb-17 Mar-17 Apr-17 May-17
Buyer Traffic
60.867.1
74.183.3 87.0
0
20
40
60
80
100
Jan-17 Feb-17 Mar-17 Apr-17 May-17
Price Index
Buyer Traffic Home Price Incentive Home Listings Time to Sell
Month Index Index Index Index Index
Jan-17 59.5 60.8 48.2 64.5 37.8
Feb-17 51.4 67.1 53.4 58.3 52.9
Mar-17 61.1 74.1 47.8 48.1 55.6
Apr-17 56.7 83.3 46.2 56.7 61.7
May-17 64.8 87.0 47.5 48.0 64.0
Change 8.1 3.7 1.3 (8.7) 2.3

Miami, FL – Traffic Trends Worsen as Challenges Spread
22
Source: Barclays Research, Census Bureau
Traffic Status:
(6,688 single-family building permits in 2016, 22nd largest market in the country)
Our Take:
• Traffic conditions worsened this month, slipping to levels
below agents’ expectations. Our Buyer Traffic Index came in
at 42 in May, down from 50 in April. Comments this month
were rather negative. Agents focused on local economic
uncertainty, price levels being too high, and too much
inventory on the market. Some sellers were more willing to
negotiate on price, according to agents, which should start to
help transaction activity.
• Our Home Price Index came in at 55 this month, indicating
price trends were flat this month. Listings were flat this month,
while the time needed to sell a home edged lower.
Local Real Estate Agent Comments:
• “High pricing and uncertainty in the economy.”
• “Young professionals often do not have the down payment for
a single family house.”
• “Sellers are finally beginning to reduce prices.”
• “Market overpriced and inventory becoming saturated.”
• “More new homes.”
• “Price stabilization.”
Note: Buyer Traffic: <50 – worse than expected; =50 in-line; >50 – better than expected. Home Price: <50 – decreased m/m; =50 flat
m/m; >50 – increased m/m. Incentive, Listings, Time to Sell: <50 – increased m/m; =50 flat m/m; >50 – decreased m/m.
Traffic Trend:
34.8
40.7
59.450.0
41.7
0
20
40
60
80
100
Jan-17 Feb-17 Mar-17 Apr-17 May-17
Buyer Traffic
65.253.8
46.9
76.7
54.5
0
20
40
60
80
100
Jan-17 Feb-17 Mar-17 Apr-17 May-17
Price Index
Buyer Traffic Home Price Incentive Home Listings Time to Sell
Month Index Index Index Index Index
Jan-17 34.8 65.2 38.1 34.8 28.3
Feb-17 40.7 53.8 34.8 30.0 16.0
Mar-17 59.4 46.9 26.9 60.0 23.3
Apr-17 50.0 76.7 29.2 34.6 35.7
May-17 41.7 54.5 30.0 50.0 59.1
Change (8.3) (22.1) 0.8 15.4 23.4

Minneapolis, MN – Healthy Trends Continue; Traffic and Price Index Move Higher
23
Source: Barclays Research, Census Bureau
Traffic Status:
(7,761 single-family building permits in 2016, 19th largest market in the country)
Our Take:
• Robust traffic trends continued this month. Our Buyer Traffic
Index landed at 83 in May, up from 81 in April, indicating
activity was above agents’ expectations. Agents pointed to
broad demand strength, driven by buyers looking to lock in
favorable mortgage rates. At the same time inventory is still
tight across the market, driving better traffic per listing.
• Home prices moved higher in May. Our Home Price Index
came in at 88 compared to 89 in April. We think home prices
can continue to move higher, given the favorable readings in
our Listings and Time to Sell Indexes.
Local Real Estate Agent Comments:
• “Good inventory is selling quickly.”
• “Lack of inventory and rates.”
• “Low interest rates.”
• “Good demand and limited supply.”
• “Shortage of listings.”
Note: Buyer Traffic: <50 – worse than expected; =50 in-line; >50 – better than expected. Home Price: <50 – decreased m/m; =50 flat
m/m; >50 – increased m/m. Incentive, Listings, Time to Sell: <50 – increased m/m; =50 flat m/m; >50 – decreased m/m.
Traffic Trend:
65.4
80.072.2
80.8 83.3
0
20
40
60
80
100
Jan-17 Feb-17 Mar-17 Apr-17 May-17
Buyer Traffic
66.7
90.083.3 88.5 87.5
0
20
40
60
80
100
Jan-17 Feb-17 Mar-17 Apr-17 May-17
Price Index
Buyer Traffic Home Price Incentive Home Listings Time to Sell
Month Index Index Index Index Index
Jan-17 65.4 66.7 45.0 68.2 50.0
Feb-17 80.0 90.0 31.3 65.0 85.0
Mar-17 72.2 83.3 50.0 72.2 72.2
Apr-17 80.8 88.5 50.0 40.9 83.3
May-17 83.3 87.5 56.3 87.5 87.5
Change 2.6 (1.0) 6.3 46.6 4.2

Nashville, TN – Traffic Topping Expectations, Aided by Strong Local Economic Trends
24
Source: Barclays Research, Census Bureau
Traffic Status:
(12,014 single-family building permits in 2016, 9th largest market in the country)
Our Take:
• Demand activity remained solid this month. Our Buyer Traffic
Index came in at 60 in May, down slightly from 67 in April but
continuing to indicate levels above agents’ expectations.
Agents attributed the strength to improving local economic
trends, job growth and retirees moving to the area. Some
noted that activity had slowed at the luxury price point, as too
much inventory has come on the market in that segment.
• Home prices moved higher this month. Our Home Price Index
landed at 90 in May, compared to 92 in April. Agents noted
that the number of listings on the market was flat this month,
while it took less time to sell a home.
Local Real Estate Agent Comments:
• “Job transfer and inbound retirees helping.”
• “The lower the price the higher the traffic. Starting to see a bit
of slowdown in the upper end re-sale market. Too much
supply there.”
• “Improving economy.”
• “Lack of inventory.”
• “Rising prices.”
Note: Buyer Traffic: <50 – worse than expected; =50 in-line; >50 – better than expected. Home Price: <50 – decreased m/m; =50 flat
m/m; >50 – increased m/m. Incentive, Listings, Time to Sell: <50 – increased m/m; =50 flat m/m; >50 – decreased m/m.
Traffic Trend:
50.050.0
33.3
66.760.0
0
20
40
60
80
100
Jan-17 Feb-17 Mar-17 Apr-17 May-17
Buyer Traffic
75.0
94.483.3
91.7 90.0
0
20
40
60
80
100
Jan-17 Feb-17 Mar-17 Apr-17 May-17
Price Index
Buyer Traffic Home Price Incentive Home Listings Time to Sell
Month Index Index Index Index Index
Jan-17 50.0 75.0 60.0 65.0 45.0
Feb-17 50.0 94.4 77.8 61.1 66.7
Mar-17 33.3 83.3 66.7 66.7 66.7
Apr-17 66.7 91.7 58.3 91.7 83.3
May-17 60.0 90.0 60.0 50.0 70.0
Change (6.7) (1.7) 1.7 (41.7) (13.3)

New York-Northern NJ – Traffic Still Solid, but as Prices Run More Shoppers Move to the Sidelines
25
Source: Barclays Research, Census Bureau
Traffic Status:
(9,987 single-family building permits in 2016, 12th largest market in the country)
Our Take:
• Traffic trends held at levels above agents’ expectations this
month. Our Buyer Traffic Index came in at 62 in May,
unchanged compared with April. Most agents were
encouraged about the local demand levels, but inventory
remains tight. This was seen driving more multiple bid
situations. Some thought prices had pushed too high, pushing
some potential buyers to the sidelines.
• Home prices moved higher in May. Our Home Price Index
landed at 75, down from 86 in April. Agents noted that the
number of listings on the market was relatively flat compared
to April, while it took less time to sell a home.
Local Real Estate Agent Comments:
• “Low inventory.”
• “Multiple offers on few good values.”
• “Shortage of available inventory, coupled with near record
high demand.”
• “Still low inventory and some buyers have taken a step back.”
• “Price too high.”
• “Low interest rates and positive economic forecasts appear to
be key factors in current market conditions.”
• “Shortage of inventory.”
Note: Buyer Traffic: <50 – worse than expected; =50 in-line; >50 – better than expected. Home Price: <50 – decreased m/m; =50 flat
m/m; >50 – increased m/m. Incentive, Listings, Time to Sell: <50 – increased m/m; =50 flat m/m; >50 – decreased m/m.
Traffic Trend:
65.464.1
50.062.5 62.1
0
20
40
60
80
100
Jan-17 Feb-17 Mar-17 Apr-17 May-17
Buyer Traffic
67.573.3 73.2
86.175.0
0
20
40
60
80
100
Jan-17 Feb-17 Mar-17 Apr-17 May-17
Price Index
Buyer Traffic Home Price Incentive Home Listings Time to Sell
Month Index Index Index Index Index
Jan-17 65.4 67.5 47.0 58.7 50.8
Feb-17 64.1 73.3 48.5 65.6 58.9
Mar-17 50.0 73.2 54.2 62.5 61.1
Apr-17 62.5 86.1 56.3 60.0 72.1
May-17 62.1 75.0 53.8 51.6 58.1
Change (0.4) (11.1) (2.4) (8.4) (14.0)
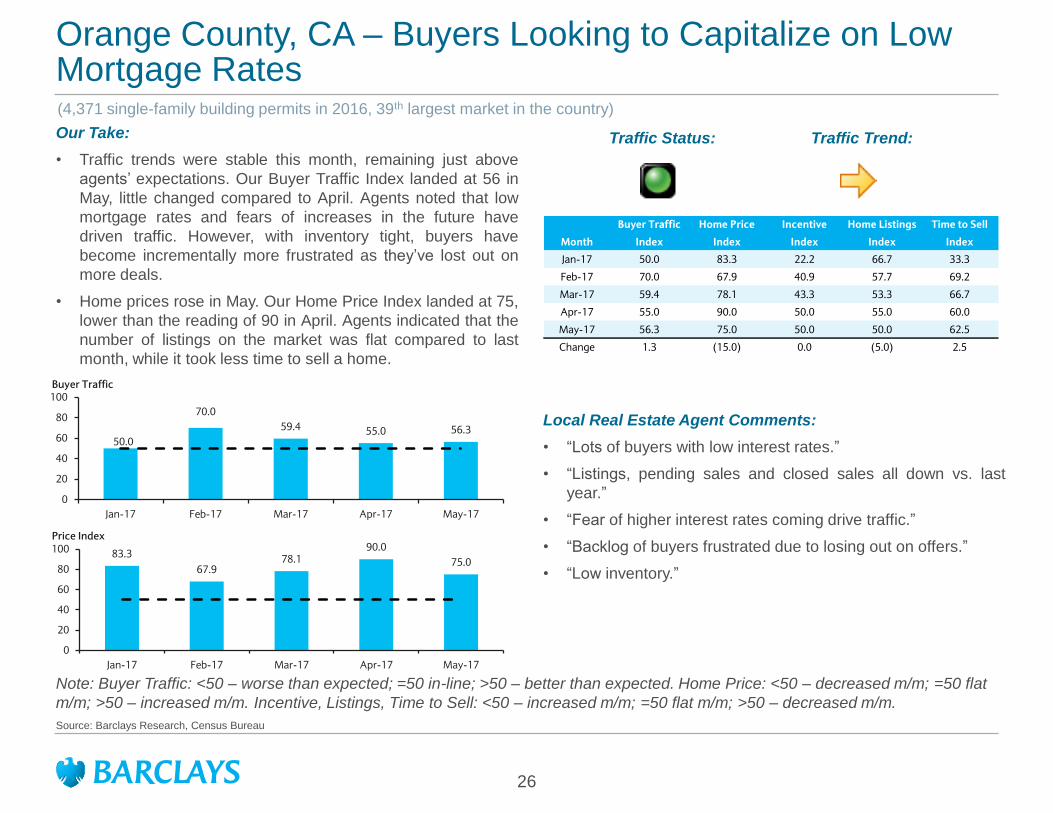
Orange County, CA – Buyers Looking to Capitalize on Low Mortgage Rates
26
Source: Barclays Research, Census Bureau
Traffic Status:
(4,371 single-family building permits in 2016, 39th largest market in the country)
Our Take:
• Traffic trends were stable this month, remaining just above
agents’ expectations. Our Buyer Traffic Index landed at 56 in
May, little changed compared to April. Agents noted that low
mortgage rates and fears of increases in the future have
driven traffic. However, with inventory tight, buyers have
become incrementally more frustrated as they’ve lost out on
more deals.
• Home prices rose in May. Our Home Price Index landed at 75,
lower than the reading of 90 in April. Agents indicated that the
number of listings on the market was flat compared to last
month, while it took less time to sell a home.
Local Real Estate Agent Comments:
• “Lots of buyers with low interest rates.”
• “Listings, pending sales and closed sales all down vs. last
year.”
• “Fear of higher interest rates coming drive traffic.”
• “Backlog of buyers frustrated due to losing out on offers.”
• “Low inventory.”
Note: Buyer Traffic: <50 – worse than expected; =50 in-line; >50 – better than expected. Home Price: <50 – decreased m/m; =50 flat
m/m; >50 – increased m/m. Incentive, Listings, Time to Sell: <50 – increased m/m; =50 flat m/m; >50 – decreased m/m.
Traffic Trend:
50.0
70.0
59.4 55.0 56.3
0
20
40
60
80
100
Jan-17 Feb-17 Mar-17 Apr-17 May-17
Buyer Traffic
83.3
67.978.1
90.0
75.0
0
20
40
60
80
100
Jan-17 Feb-17 Mar-17 Apr-17 May-17
Price Index
Buyer Traffic Home Price Incentive Home Listings Time to Sell
Month Index Index Index Index Index
Jan-17 50.0 83.3 22.2 66.7 33.3
Feb-17 70.0 67.9 40.9 57.7 69.2
Mar-17 59.4 78.1 43.3 53.3 66.7
Apr-17 55.0 90.0 50.0 55.0 60.0
May-17 56.3 75.0 50.0 50.0 62.5
Change 1.3 (15.0) 0.0 (5.0) 2.5

Orlando, FL – Higher Prices and Tight Inventories Discourage Buyers
27
Source: Barclays Research, Census Bureau
Traffic Status:
(14,208 single-family building permits in 2016, 5th largest market in the country)
Our Take:
• Buyer traffic trends took another step lower this month. Our
Buyer Traffic Index slipped to 44 in May, down from 50 in
April, indicating activity was slightly below agents’
expectations. Agents attributed the sluggishness to both
higher home prices and tight inventory discouraging potential
buyers. Those more positive highlighted that low mortgage
rates have helped.
• Home prices pushed higher again this month. Our Home Price
Index came in at 94, little changed from April. Agents noted
that listings and the time needed to sell a home both
contracted compared to April.
Local Real Estate Agent Comments:
• “High prices and limited inventory.”
• “Low inventory and rising prices.”
• “See pent up demand coming out, especially with rates low
again.”
• “Extremely low listing inventory.”
• “Due to low inventory we are not getting as much traffic.”
• “Low inventories have remained for two years. Demand is
very strong.”
Note: Buyer Traffic: <50 – worse than expected; =50 in-line; >50 – better than expected. Home Price: <50 – decreased m/m; =50 flat
m/m; >50 – increased m/m. Incentive, Listings, Time to Sell: <50 – increased m/m; =50 flat m/m; >50 – decreased m/m.
Traffic Trend:
46.2 46.757.1
50.044.4
0
20
40
60
80
100
Jan-17 Feb-17 Mar-17 Apr-17 May-17
Buyer Traffic
61.573.3
92.9 92.9 93.8
0
20
40
60
80
100
Jan-17 Feb-17 Mar-17 Apr-17 May-17
Price Index
Buyer Traffic Home Price Incentive Home Listings Time to Sell
Month Index Index Index Index Index
Jan-17 46.2 61.5 37.5 66.7 45.8
Feb-17 46.7 73.3 36.7 56.7 50.0
Mar-17 57.1 92.9 42.9 71.4 42.9
Apr-17 50.0 92.9 50.0 78.6 71.4
May-17 44.4 93.8 37.5 68.8 68.8
Change (5.6) 0.9 (12.5) (9.8) (2.7)

Philadelphia, PA-Southern NJ – Enthusiasm Continues
28
Source: Barclays Research, Census Bureau
Traffic Status:
(6,820 single-family building permits in 2016, 21st largest market in the country)
Our Take:
• Strong demand trends continued. Our Buyer Traffic Index
improved to 75 this month, up from 69 in April, indicating
activity was above agents’ expectations. Some agents
attributed the strength to improved buyer sentiment and
consumer confidence. Others were encouraged by trends for
entry level homes and retiree buyers. Low mortgage rates
were also helpful.
• Home prices increased in May. Our Home Price Index landed
at 75 this month, down from in 88 in April. Agents noted that
there were fewer listings on the market this month, while it
took less time to sell a home.
Local Real Estate Agent Comments:
• “Built up demand.”
• “Increase in consumer confidence.”
• “Low inventory and low priced mortgages.”
• “Prices still low and interest rates rising.”
• “First timers and some retirement buyers.”
Note: Buyer Traffic: <50 – worse than expected; =50 in-line; >50 – better than expected. Home Price: <50 – decreased m/m; =50 flat
m/m; >50 – increased m/m. Incentive, Listings, Time to Sell: <50 – increased m/m; =50 flat m/m; >50 – decreased m/m.
Traffic Trend:
58.3
76.768.2 68.8
75.0
0
20
40
60
80
100
Jan-17 Feb-17 Mar-17 Apr-17 May-17
Buyer Traffic
58.366.7
90.9 87.575.0
0
20
40
60
80
100
Jan-17 Feb-17 Mar-17 Apr-17 May-17
Price Index
Buyer Traffic Home Price Incentive Home Listings Time to Sell
Month Index Index Index Index Index
Jan-17 58.3 58.3 47.2 72.2 66.7
Feb-17 76.7 66.7 34.6 60.0 66.7
Mar-17 68.2 90.9 35.0 54.5 77.3
Apr-17 68.8 87.5 50.0 62.5 81.3
May-17 75.0 75.0 40.9 62.5 83.3
Change 6.3 (12.5) (9.1) 0.0 2.1

Phoenix, AZ – Strong Traffic and Prices Trends
29
Source: Barclays Research, Census Bureau
Traffic Status:
(18,577 single-family building permits in 2016, 4th largest market in the country)
Our Take:
• Buyers remain active in Phoenix, with traffic trends still
beating expectations through May. Our Buyer Traffic Index
landed at 64 this month, down from 68 in April. Agents see
demand being supported by steady economic growth and a
perception that rates will increase in the future. Some
comments noted incrementally more caution given buyers’
concern that home values were becoming too stretched.
• Home prices increased in May. Our Home Price Index hit 82
this month, down from 84 in April. Listings and the time
needed to sell a home contracted this month, supportive for
pricing near-term.
Local Real Estate Agent Comments:
• “Second home buyers starting to look again.”
• “Steady economy.”
• “Buyer feel very uncertain about the economy and if home
values are climbing too high.”
• “Population growth.”
• “Increase in buyer demand and lower inventory has spurred
builder starts. Also resulted in an increase in pricing.”
• “Fear of increasing interest rates.”
Note: Buyer Traffic: <50 – worse than expected; =50 in-line; >50 – better than expected. Home Price: <50 – decreased m/m; =50 flat
m/m; >50 – increased m/m. Incentive, Listings, Time to Sell: <50 – increased m/m; =50 flat m/m; >50 – decreased m/m.
Traffic Trend:
70.0 62.5 63.9 67.6 64.3
0
20
40
60
80
100
Jan-17 Feb-17 Mar-17 Apr-17 May-17
Buyer Traffic
70.0 75.0 77.884.4 82.1
0
20
40
60
80
100
Jan-17 Feb-17 Mar-17 Apr-17 May-17
Price Index
Buyer Traffic Home Price Incentive Home Listings Time to Sell
Month Index Index Index Index Index
Jan-17 70.0 70.0 50.0 46.7 46.7
Feb-17 62.5 75.0 50.0 77.1 64.6
Mar-17 63.9 77.8 47.1 72.2 66.7
Apr-17 67.6 84.4 43.8 75.0 75.0
May-17 64.3 82.1 46.4 75.0 60.7
Change (3.4) (2.2) 2.7 0.0 (14.3)

Portland, OR – Fears of Higher Future Costs Drive Urgency
30
Source: Barclays Research, Census Bureau
Traffic Status:
(7,344 single-family building permits in 2016, 20th largest market in the country)
Our Take:
• Traffic trends came in above agents’ expectations in May. Our
Buyer Traffic Index hit 58 this month, down from 64 in April.
Agents attributed the solid buyer activity to favorable
mortgage rates and fears that this won’t last forever. At the
same time inventory remains very tight, driving prices even
higher.
• Home prices pushed higher again this month. Our Home Price
Index landed at 82, little changed from the reading of 85 in
April. Agents noted that listings levels and the time needed to
sell a home both were generally stable this month compared
to trends in April.
Local Real Estate Agent Comments:
• “Low inventory is causing buyers to be very active and move
quickly on new listings.”
• “Buyers feel prices will continue upward a while longer.”
• “Fear of rising prices and interest rates.”
• “Lack of inventory, low rates.”
• “Tight inventory and rates.”
Note: Buyer Traffic: <50 – worse than expected; =50 in-line; >50 – better than expected. Home Price: <50 – decreased m/m; =50 flat
m/m; >50 – increased m/m. Incentive, Listings, Time to Sell: <50 – increased m/m; =50 flat m/m; >50 – decreased m/m.
Traffic Trend:
54.261.5 62.5 63.6
58.3
0
20
40
60
80
100
Jan-17 Feb-17 Mar-17 Apr-17 May-17
Buyer Traffic
70.880.8
87.5 85.0 81.8
0
20
40
60
80
100
Jan-17 Feb-17 Mar-17 Apr-17 May-17
Price Index
Buyer Traffic Home Price Incentive Home Listings Time to Sell
Month Index Index Index Index Index
Jan-17 54.2 70.8 45.8 62.5 33.3
Feb-17 61.5 80.8 50.0 37.5 54.2
Mar-17 62.5 87.5 50.0 43.8 68.8
Apr-17 63.6 85.0 45.0 65.0 60.0
May-17 58.3 81.8 50.0 50.0 54.5
Change (5.3) (3.2) 5.0 (15.0) (5.5)

Raleigh, NC – Healthy Trends Continue
31
Source: Barclays Research, Census Bureau
Traffic Status:
(9,435 single-family building permits in 2016, 13th largest market in the country)
Our Take:
• Traffic trends ticked higher this month, at levels above agents’
expectations. Our Buyer Traffic Index rose to 69 in May, up
from 57 in April. Agents attributed the strong demand trends to
low rates, solid economic activity and continued inbound
relocations. Low inventory continues to be a widespread
problem in the market.
• Home prices pushed higher again this month, and we think
this trend can continue in the coming months. Agents noted
that the number of listings on the market contracted in May
and that it took less time to sell a home relative to April.
Local Real Estate Agent Comments:
• “No inventory in Raleigh.”
• “Inbound relocation. Still reasonable prices but growing, low
rates, and good economy.”
• “Great place to live.”
• “Low inventory is the biggest problem for buyers.”
• “Low interest rates.”
Note: Buyer Traffic: <50 – worse than expected; =50 in-line; >50 – better than expected. Home Price: <50 – decreased m/m; =50 flat
m/m; >50 – increased m/m. Incentive, Listings, Time to Sell: <50 – increased m/m; =50 flat m/m; >50 – decreased m/m.
Traffic Trend:
65.655.0 62.5
57.168.8
0
20
40
60
80
100
Jan-17 Feb-17 Mar-17 Apr-17 May-17
Buyer Traffic
80.090.0 87.5
96.4 93.8
0
20
40
60
80
100
Jan-17 Feb-17 Mar-17 Apr-17 May-17
Price Index
Buyer Traffic Home Price Incentive Home Listings Time to Sell
Month Index Index Index Index Index
Jan-17 65.6 80.0 42.9 73.3 66.7
Feb-17 55.0 90.0 55.0 70.0 70.0
Mar-17 62.5 87.5 68.8 81.3 81.3
Apr-17 57.1 96.4 60.7 67.9 89.3
May-17 68.8 93.8 56.3 75.0 93.8
Change 11.6 (2.7) (4.5) 7.1 4.5

Richmond, VA – Traffic and Prices Move Higher
32
Source: Barclays Research, Census Bureau
Traffic Status:
(3,955 single-family building permits in 2016, 45th largest market in the country)
Our Take:
• Strong demand trends continued in May. Our Buyer Traffic
Index improved to 80 this month, up from 67 in April and
indicating trends were above agents’ expectations. Agents
were encouraged by the strong demand trends across the
market, which they attributed to better confidence in the
economy. Lack of inventory is still seen as a constraint to
closings levels.
• Home prices jumped higher again in May. Our Home Price
Index came in at 100 this month, unchanged vs. April’s
reading. Agents indicated that the number of listings and the
time needed to sell a home contracted this month.
Local Real Estate Agent Comments:
• “Lots of buyers and a lack of inventory.”
• “Low inventory.”
• “Confidence in the economy.”
Note: Buyer Traffic: <50 – worse than expected; =50 in-line; >50 – better than expected. Home Price: <50 – decreased m/m; =50 flat
m/m; >50 – increased m/m. Incentive, Listings, Time to Sell: <50 – increased m/m; =50 flat m/m; >50 – decreased m/m.
Traffic Trend:
75.0
91.7 100.0
66.7
80.0
0
20
40
60
80
100
Jan-17 Feb-17 Mar-17 Apr-17 May-17
Buyer Traffic
100.0
66.7
87.5100.0 100.0
0
20
40
60
80
100
Jan-17 Feb-17 Mar-17 Apr-17 May-17
Price Index
Buyer Traffic Home Price Incentive Home Listings Time to Sell
Month Index Index Index Index Index
Jan-17 75.0 100.0 75.0 100.0 100.0
Feb-17 91.7 66.7 25.0 66.7 83.3
Mar-17 100.0 87.5 62.5 50.0 66.7
Apr-17 66.7 100.0 100.0 100.0 100.0
May-17 80.0 100.0 50.0 62.5 87.5
Change 13.3 0.0 (50.0) (37.5) (12.5)

Sacramento, CA – Favorable Environment Continues
33
Source: Barclays Research, Census Bureau
Traffic Status:
(6,148 single-family building permits in 2016, 24th largest market in the country)
Our Take:
• Traffic trends came in above agents’ expectations again in
May. Our Buyer Traffic Index rose to 73 this month, up from
61 in April. Agents attributed the strength to favorable
mortgage rates, concerns that the low cost environment may
prove to be temporary, and steady employment growth. The
lack of inventory on the market continues to limit selection and
be a challenge for activity.
• Home prices pushed higher this month. Our Home Price Index
landed at 100 in May, up from 86 last month. Agents pointed
to more listings on the market this month, while the time
needed to sell a home contracted.
Local Real Estate Agent Comments:
• “Low interest rates, price appreciation, pent up buyer demand,
steady employment growth, and rising rental rates.”
• “Concern about interest rates rising.”
• “Limited supply of existing homes and limited supply of new
construction.”
• “No inventory.”
• “Expectations of higher interest rates. Limited inventory.”
Note: Buyer Traffic: <50 – worse than expected; =50 in-line; >50 – better than expected. Home Price: <50 – decreased m/m; =50 flat
m/m; >50 – increased m/m. Incentive, Listings, Time to Sell: <50 – increased m/m; =50 flat m/m; >50 – decreased m/m.
Traffic Trend:
56.763.3 70.0
61.172.7
0
20
40
60
80
100
Jan-17 Feb-17 Mar-17 Apr-17 May-17
Buyer Traffic
71.476.9
90.0 86.1
100.0
0
20
40
60
80
100
Jan-17 Feb-17 Mar-17 Apr-17 May-17
Price Index
Buyer Traffic Home Price Incentive Home Listings Time to Sell
Month Index Index Index Index Index
Jan-17 56.7 71.4 45.5 78.6 64.3
Feb-17 63.3 76.9 37.5 50.0 75.0
Mar-17 70.0 90.0 44.4 60.0 75.0
Apr-17 61.1 86.1 55.9 55.9 64.7
May-17 72.7 100.0 62.5 40.0 75.0
Change 11.6 13.9 6.6 (15.9) 10.3

San Antonio, TX – Job Growth Drives Traffic
34
Source: Barclays Research, Census Bureau
Traffic Status:
(6,441 single-family building permits in 2016, 23rd largest market in the country)
Our Take:
• Traffic trends took a step back this month but remained above
agents’ expectations. Our Buyer Traffic Index landed at 57 in
May, down a bit from a reading of 67 in April. Agents were
encouraged about local economic trends, noting that job
growth is bringing more buyers into the market. Others
highlighted that the favorable mortgage rate environment has
driven buyers to look, but selection is still limited.
• Home prices moved higher in May. Our home price index
landed at 78 this month down from 83 in April. Agents
indicated that the number of listings on the market and the
time needed to sell contracted this month.
Local Real Estate Agent Comments:
• “There is healthy demand here. Great economy and
affordable housing.”
• “Shortage of homes listed for sale.”
• “Active job market.”
• “Low interest rates, and good employment numbers.”
• “Great local economy.”
Note: Buyer Traffic: <50 – worse than expected; =50 in-line; >50 – better than expected. Home Price: <50 – decreased m/m; =50 flat
m/m; >50 – increased m/m. Incentive, Listings, Time to Sell: <50 – increased m/m; =50 flat m/m; >50 – decreased m/m.
Traffic Trend:
72.2 70.0 78.666.7
57.1
0
20
40
60
80
100
Jan-17 Feb-17 Mar-17 Apr-17 May-17
Buyer Traffic
61.1
75.085.7 83.3 78.6
0
20
40
60
80
100
Jan-17 Feb-17 Mar-17 Apr-17 May-17
Price Index
Buyer Traffic Home Price Incentive Home Listings Time to Sell
Month Index Index Index Index Index
Jan-17 72.2 61.1 22.2 61.1 72.2
Feb-17 70.0 75.0 55.0 65.0 45.0
Mar-17 78.6 85.7 42.9 50.0 71.4
Apr-17 66.7 83.3 43.8 50.0 68.8
May-17 57.1 78.6 35.7 64.3 64.3
Change (9.5) (4.8) (8.0) 14.3 (4.5)
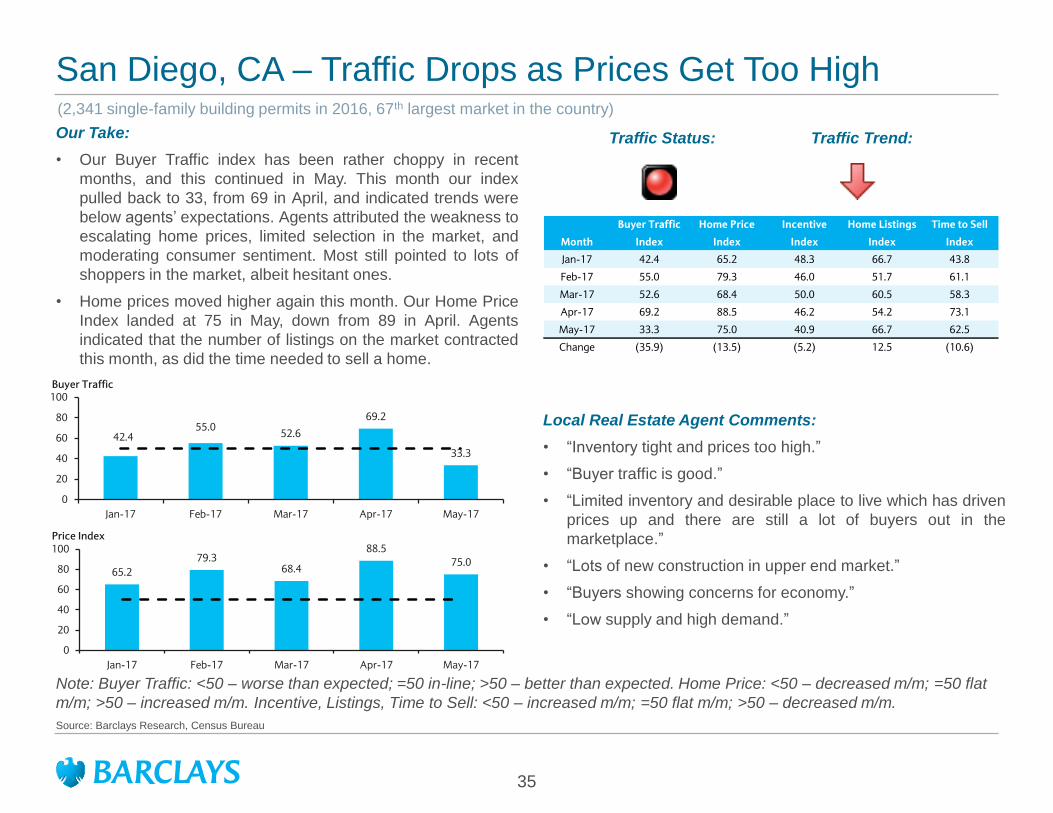
San Diego, CA – Traffic Drops as Prices Get Too High
35
Source: Barclays Research, Census Bureau
Traffic Status:
(2,341 single-family building permits in 2016, 67th largest market in the country)
Our Take:
• Our Buyer Traffic index has been rather choppy in recent
months, and this continued in May. This month our index
pulled back to 33, from 69 in April, and indicated trends were
below agents’ expectations. Agents attributed the weakness to
escalating home prices, limited selection in the market, and
moderating consumer sentiment. Most still pointed to lots of
shoppers in the market, albeit hesitant ones.
• Home prices moved higher again this month. Our Home Price
Index landed at 75 in May, down from 89 in April. Agents
indicated that the number of listings on the market contracted
this month, as did the time needed to sell a home.
Local Real Estate Agent Comments:
• “Inventory tight and prices too high.”
• “Buyer traffic is good.”
• “Limited inventory and desirable place to live which has driven
prices up and there are still a lot of buyers out in the
marketplace.”
• “Lots of new construction in upper end market.”
• “Buyers showing concerns for economy.”
• “Low supply and high demand.”
Note: Buyer Traffic: <50 – worse than expected; =50 in-line; >50 – better than expected. Home Price: <50 – decreased m/m; =50 flat
m/m; >50 – increased m/m. Incentive, Listings, Time to Sell: <50 – increased m/m; =50 flat m/m; >50 – decreased m/m.
Traffic Trend:
42.455.0
52.6
69.2
33.3
0
20
40
60
80
100
Jan-17 Feb-17 Mar-17 Apr-17 May-17
Buyer Traffic
65.2
79.368.4
88.5
75.0
0
20
40
60
80
100
Jan-17 Feb-17 Mar-17 Apr-17 May-17
Price Index
Buyer Traffic Home Price Incentive Home Listings Time to Sell
Month Index Index Index Index Index
Jan-17 42.4 65.2 48.3 66.7 43.8
Feb-17 55.0 79.3 46.0 51.7 61.1
Mar-17 52.6 68.4 50.0 60.5 58.3
Apr-17 69.2 88.5 46.2 54.2 73.1
May-17 33.3 75.0 40.9 66.7 62.5
Change (35.9) (13.5) (5.2) 12.5 (10.6)

San Francisco, CA – Traffic Cools as Buyer Fatigue Kicks In
36
Source: Barclays Research, Census Bureau
Traffic Status:
(4,927 single-family building permits in 2016, 35th largest market in the country)
Our Take:
• Traffic slipped a bit more this month, coming in at levels in-line
with agents’ expectations. Our Buyer Traffic Index landed at
52 in May vs. 57 in April. Agents suggested that buyers’ fears
of higher future mortgage rates helped to drive interest.
However, selection remains limited driving prices higher.
Some noted that buyer fatigue was starting to kick in as home
values continued to move higher.
• Nonetheless, home prices increased again this month. Our
Home Price Index landed at 80 in May. We think home price
trends could become more choppy, following the weak trends
in our Listings and Time to Sell Indexes.
Local Real Estate Agent Comments:
• “Lack of inventory.”
• “Potential for higher mortgage rates.”
• “Low inventory.”
• “Lower price points active.”
• “Low interest rates, and large demand.”
• “Buyer fatigue regarding rising prices.”
Note: Buyer Traffic: <50 – worse than expected; =50 in-line; >50 – better than expected. Home Price: <50 – decreased m/m; =50 flat
m/m; >50 – increased m/m. Incentive, Listings, Time to Sell: <50 – increased m/m; =50 flat m/m; >50 – decreased m/m.
Traffic Trend:
57.472.4
65.257.4
52.0
0
20
40
60
80
100
Jan-17 Feb-17 Mar-17 Apr-17 May-17
Buyer Traffic
63.3
79.3
92.4 90.780.0
0
20
40
60
80
100
Jan-17 Feb-17 Mar-17 Apr-17 May-17
Price Index
Buyer Traffic Home Price Incentive Home Listings Time to Sell
Month Index Index Index Index Index
Jan-17 57.4 63.3 42.1 76.7 45.5
Feb-17 72.4 79.3 61.4 50.0 55.6
Mar-17 65.2 92.4 53.7 45.3 65.6
Apr-17 57.4 90.7 60.4 46.2 57.7
May-17 52.0 80.0 56.8 36.0 36.0
Change (5.4) (10.7) (3.6) (10.2) (21.7)

Sarasota, FL – Sellers Lower Price to Drive Activity
37
Source: Barclays Research, Census Bureau
Traffic Status:
(5,821 single-family building permits in 2016, 25th largest market in the country)
Our Take:
• Traffic conditions improved this month, moving up to levels
just above agents’ expectations. Our Buyer Traffic Index hit 60
in May, up from 50 in April. Some agents were encouraged by
better demand trends for luxury and move-up price point.
Others noted that some sellers had been willing to reduce
price in order to drive activity. More new construction product
has come to the market, curbing resale activity.
• Home prices slipped this month. Our Home Price Index came
in at 40, little changed from April’s reading of 42. We expect
pricing to remain choppy given the weak readings in our
Listings and Time to Sell Indexes.
Local Real Estate Agent Comments:
• “Recent price adjustments at the end of our snowbird season.”
• “Competition with new home.”
• “Better trends from higher price points."
Note: Buyer Traffic: <50 – worse than expected; =50 in-line; >50 – better than expected. Home Price: <50 – decreased m/m; =50 flat
m/m; >50 – increased m/m. Incentive, Listings, Time to Sell: <50 – increased m/m; =50 flat m/m; >50 – decreased m/m.
Traffic Trend:
60.0 50.0
33.3
50.060.0
0
20
40
60
80
100
Jan-17 Feb-17 Mar-17 Apr-17 May-17
Buyer Traffic
70.0
50.0 50.041.7 40.0
0
20
40
60
80
100
Jan-17 Feb-17 Mar-17 Apr-17 May-17
Price Index
Buyer Traffic Home Price Incentive Home Listings Time to Sell
Month Index Index Index Index Index
Jan-17 60.0 70.0 40.0 10.0 50.0
Feb-17 50.0 50.0 25.0 0.0 0.0
Mar-17 33.3 50.0 33.3 0.0 16.7
Apr-17 50.0 41.7 33.3 8.3 33.3
May-17 60.0 40.0 40.0 10.0 20.0
Change 10.0 (1.7) 6.7 1.7 (13.3)

Seattle, WA – Demand Healthy but Lack of Inventory Limiting Closing Activity
38
Source: Barclays Research, Census Bureau
Traffic Status:
(9,396 single-family building permits in 2016, 14th largest market in the country)
Our Take:
• Seattle experienced solid traffic conditions again in May, with
trends coming in above agents’ expectations. Our Buyer
Traffic Index landed at 63 vs. 65 in April. Agents were positive
about the activity driven by a healthy local economy but
broadly cited the lack of inventory. This has caused elevated
urgency, higher home prices, and pushed more buyers further
away from the city center.
• Home prices rose again in May. Our Home Price Index landed
at 93 this month, indicating widespread price increases.
Agents pointed to slightly lower listing levels vs. April, while
the time needed to sell a home contracted.
Local Real Estate Agent Comments:
• “Little to no inventory, causing buyer frustration, home prices
are increasing rapidly. Rental rates are increasing pushing
renters to buy farther away from downtown.”
• “Lack of inventory.”
• “Panic over lack of inventory.”
• “Very low inventory. Fear of rising rates.”
• “Solid employment.”
• “Low inventory and strong job sector.”
Note: Buyer Traffic: <50 – worse than expected; =50 in-line; >50 – better than expected. Home Price: <50 – decreased m/m; =50 flat
m/m; >50 – increased m/m. Incentive, Listings, Time to Sell: <50 – increased m/m; =50 flat m/m; >50 – decreased m/m.
Traffic Trend:
54.2
71.4 80.0
65.4 62.5
0
20
40
60
80
100
Jan-17 Feb-17 Mar-17 Apr-17 May-17
Buyer Traffic
87.592.9 95.0 96.2 92.9
0
20
40
60
80
100
Jan-17 Feb-17 Mar-17 Apr-17 May-17
Price Index
Buyer Traffic Home Price Incentive Home Listings Time to Sell
Month Index Index Index Index Index
Jan-17 54.2 87.5 54.2 83.3 62.5
Feb-17 71.4 92.9 41.7 71.4 64.3
Mar-17 80.0 95.0 75.0 60.0 95.0
Apr-17 65.4 96.2 57.7 53.8 73.1
May-17 62.5 92.9 42.9 57.1 64.3
Change (2.9) (3.3) (14.8) 3.3 (8.8)
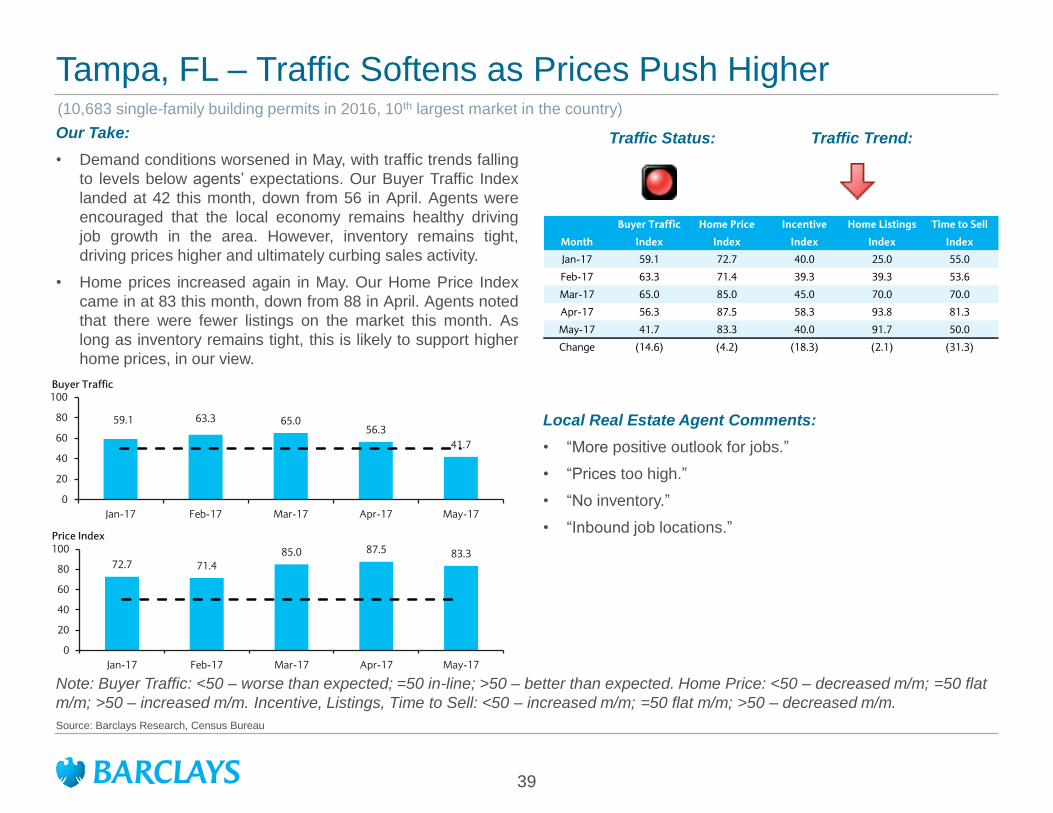
Tampa, FL – Traffic Softens as Prices Push Higher
39
Source: Barclays Research, Census Bureau
Traffic Status:
(10,683 single-family building permits in 2016, 10th largest market in the country)
Our Take:
• Demand conditions worsened in May, with traffic trends falling
to levels below agents’ expectations. Our Buyer Traffic Index
landed at 42 this month, down from 56 in April. Agents were
encouraged that the local economy remains healthy driving
job growth in the area. However, inventory remains tight,
driving prices higher and ultimately curbing sales activity.
• Home prices increased again in May. Our Home Price Index
came in at 83 this month, down from 88 in April. Agents noted
that there were fewer listings on the market this month. As
long as inventory remains tight, this is likely to support higher
home prices, in our view.
Local Real Estate Agent Comments:
• “More positive outlook for jobs.”
• “Prices too high.”
• “No inventory.”
• “Inbound job locations.”
Note: Buyer Traffic: <50 – worse than expected; =50 in-line; >50 – better than expected. Home Price: <50 – decreased m/m; =50 flat
m/m; >50 – increased m/m. Incentive, Listings, Time to Sell: <50 – increased m/m; =50 flat m/m; >50 – decreased m/m.
Traffic Trend:
59.1 63.3 65.056.3
41.7
0
20
40
60
80
100
Jan-17 Feb-17 Mar-17 Apr-17 May-17
Buyer Traffic
72.7 71.4
85.0 87.5 83.3
0
20
40
60
80
100
Jan-17 Feb-17 Mar-17 Apr-17 May-17
Price Index
Buyer Traffic Home Price Incentive Home Listings Time to Sell
Month Index Index Index Index Index
Jan-17 59.1 72.7 40.0 25.0 55.0
Feb-17 63.3 71.4 39.3 39.3 53.6
Mar-17 65.0 85.0 45.0 70.0 70.0
Apr-17 56.3 87.5 58.3 93.8 81.3
May-17 41.7 83.3 40.0 91.7 50.0
Change (14.6) (4.2) (18.3) (2.1) (31.3)

Tucson, AZ – Strong Traffic Trends Continues
40
Source: Barclays Research, Census Bureau
Traffic Status:
(2,164 single-family building permits in 2016, 72nd largest market in the country)
Our Take:
• Strong traffic trends continued in May, coming in well above
agents’ expectations. Our Buyer Traffic Index landed at 83 this
month, down from 90 in April. Agents continue to see buyers’
fears of higher mortgage rates in the future driving activity in
the market today. Others pointed to better trends in the active
adult segment.
• Home prices increased this month. Our Home Price Index
landed at 100 in May, up from 60 in April. We think home
prices can continue to move higher given the favorable
readings in our Listings and Time to Sell Indexes.
Local Real Estate Agent Comments:
• “Retirees coming into the market.”
• “More buyers for fewer homes.”
• “Higher rates in the future drive traffic.”
• “Sales are snowballing, as more homes sell more buyers are
motivated to get off the fence and buy.”
Note: Buyer Traffic: <50 – worse than expected; =50 in-line; >50 – better than expected. Home Price: <50 – decreased m/m; =50 flat
m/m; >50 – increased m/m. Incentive, Listings, Time to Sell: <50 – increased m/m; =50 flat m/m; >50 – decreased m/m.
Traffic Trend:
83.3 83.3 87.5 90.083.3
0
20
40
60
80
100
Jan-17 Feb-17 Mar-17 Apr-17 May-17
Buyer Traffic
83.391.7 87.5
60.0
100.0
0
20
40
60
80
100
Jan-17 Feb-17 Mar-17 Apr-17 May-17
Price Index
Buyer Traffic Home Price Incentive Home Listings Time to Sell
Month Index Index Index Index Index
Jan-17 83.3 83.3 40.0 83.3 91.7
Feb-17 83.3 91.7 50.0 66.7 91.7
Mar-17 87.5 87.5 50.0 62.5 87.5
Apr-17 90.0 60.0 25.0 75.0 50.0
May-17 83.3 100.0 50.0 83.3 91.7
Change (6.7) 40.0 25.0 8.3 41.7

Virginia Beach, VA – Traffic Solid, Led by Lower Price Points
41
Source: Barclays Research, Census Bureau
Traffic Status:
(4,011 single-family building permits in 2016, 44th largest market in the country)
Our Take:
• Traffic trends remained strong, at levels well above agents’
expectations. Our Buyer Traffic Index came in at 75 this
month, down a bit from 80 in April. Agents indicated demand
was better at lower price points. Some highlighted that the
lack of inventory was a challenge given the limited selection
but helped to drive better traffic per listing.
• Home prices moved higher again this month. Our Home Price
Index landed at 75 in May, up from 70 in April. Agents noted
that the number of listings on the market was flat relative to
last month. It also took less time to sell a home this month.
Local Real Estate Agent Comments:
• “Trends slowing down.”
• “Not yet strong. Maybe this summer will be better.”
• “Lower price points doing well.”
• “No inventory.”
Note: Buyer Traffic: <50 – worse than expected; =50 in-line; >50 – better than expected. Home Price: <50 – decreased m/m; =50 flat
m/m; >50 – increased m/m. Incentive, Listings, Time to Sell: <50 – increased m/m; =50 flat m/m; >50 – decreased m/m.
Traffic Trend:
57.1
81.3 87.580.0 75.0
0
20
40
60
80
100
Jan-17 Feb-17 Mar-17 Apr-17 May-17
Buyer Traffic
64.375.0 75.0 70.0 75.0
0
20
40
60
80
100
Jan-17 Feb-17 Mar-17 Apr-17 May-17
Price Index
Buyer Traffic Home Price Incentive Home Listings Time to Sell
Month Index Index Index Index Index
Jan-17 57.1 64.3 41.7 64.3 35.7
Feb-17 81.3 75.0 58.3 75.0 100.0
Mar-17 87.5 75.0 50.0 37.5 62.5
Apr-17 80.0 70.0 62.5 80.0 70.0
May-17 75.0 75.0 50.0 50.0 75.0
Change (5.0) 5.0 (12.5) (30.0) 5.0

Washington, D.C. – Traffic Remains Better than Expected
42
Source: Barclays Research, Census Bureau
Traffic Status:
(12,974 single-family building permits in 2016, 8th largest market in the country)
Our Take:
• Traffic cooled a bit this month but remained just above agents’
expectations. Our Buyer Traffic Index came in at 59 in May,
down from 66 in April. Agents attributed the solid activity to a
healthy local economy, favorable mortgage rates and solid
consumer confidence. Some felt the lack of inventory was a
challenge.
• Home prices increased this month. Our Home Price Index
rose to 82 in May, little changed from April’s reading of 79.
Agents indicated that the number of listings on the market
were relatively unchanged compared to April, while it took less
time to sell a home.
Local Real Estate Agent Comments:
• “Healthy local economy and low interest rates.”
• “Low inventory and sellers market.”
• “Anticipate increases in mortgage rates.”
• “Low quality inventory.”
• “Good local economy. Positive consumer confidence.”
• “People not moving up causing a shortage of inventory.”
• “Economic strength and confidence.”
Note: Buyer Traffic: <50 – worse than expected; =50 in-line; >50 – better than expected. Home Price: <50 – decreased m/m; =50 flat
m/m; >50 – increased m/m. Incentive, Listings, Time to Sell: <50 – increased m/m; =50 flat m/m; >50 – decreased m/m.
Traffic Trend:
66.0 72.7
60.7 65.858.8
0
20
40
60
80
100
Jan-17 Feb-17 Mar-17 Apr-17 May-17
Buyer Traffic
60.072.7 75.0 78.9 82.4
0
20
40
60
80
100
Jan-17 Feb-17 Mar-17 Apr-17 May-17
Price Index
Buyer Traffic Home Price Incentive Home Listings Time to Sell
Month Index Index Index Index Index
Jan-17 66.0 60.0 41.3 69.6 58.3
Feb-17 72.7 72.7 42.9 52.3 72.7
Mar-17 60.7 75.0 50.0 53.6 71.4
Apr-17 65.8 78.9 58.3 44.7 65.8
May-17 58.8 82.4 47.1 47.1 61.8
Change (7.0) 3.4 (11.3) 2.3 (4.0)

Wilmington, NC – Buyers Attempt to Lock in Favorable Rates
43
Source: Barclays Research, Census Bureau
Traffic Status:
(1,145 single-family building permits in 2016, 116th largest market in the country)
Our Take:
• Traffic trends were above expectations again in May. Our
Buyer Traffic Index came in at 83 this month, down from 90 in
April. Agents attributed the strength to the favorable mortgage
rate environment and buyers’ concerns that it wouldn’t last
forever. The lack of inventory on the market is also adding to
the urgency.
• Home prices rose again this month. Our Home Price Index
landed at 100 in May vs. 80 in April. We think home prices can
continue to trend higher in the near-term. Both the number of
listings on the market and the time needed to sell a home
contracted this month.
Local Real Estate Agent Comments:
• “Lack of properties in the mid ranges.”
• “Low interest rates.”
• “Low inventory driving buyers not to wait.”
• “Better demand.”
Note: Buyer Traffic: <50 – worse than expected; =50 in-line; >50 – better than expected. Home Price: <50 – decreased m/m; =50 flat
m/m; >50 – increased m/m. Incentive, Listings, Time to Sell: <50 – increased m/m; =50 flat m/m; >50 – decreased m/m.
Traffic Trend:
80.0 78.6
50.0
90.083.3
0
20
40
60
80
100
Jan-17 Feb-17 Mar-17 Apr-17 May-17
Buyer Traffic
100.0
78.687.5
80.0
100.0
0
20
40
60
80
100
Jan-17 Feb-17 Mar-17 Apr-17 May-17
Price Index
Buyer Traffic Home Price Incentive Home Listings Time to Sell
Month Index Index Index Index Index
Jan-17 80.0 100.0 60.0 90.0 90.0
Feb-17 78.6 78.6 50.0 42.9 71.4
Mar-17 50.0 87.5 83.3 100.0 83.3
Apr-17 90.0 80.0 50.0 80.0 100.0
May-17 83.3 100.0 66.7 100.0 100.0
Change (6.7) 20.0 16.7 20.0 0.0

Index Methodology
Source: Barclays Research
44
We survey real estate agents, as we believe agents provide an accurate assessment of local housing market trends in both the new
and existing home markets. We view trends in the existing home market as crucial to homebuilders as it represents over 90% of total
sales, and trends in the existing home market often dictate trends in the new home market.
Each month, we survey agents about trends in buyer traffic levels, home prices, incentives, inventory levels, and the length of time
needed to sell a home. In May, we received responses from 500 real estate agents across the country. We review responses and
calculate a diffusion index for each of the questions, with a level above 50 indicating positive trends, a level below 50 indicating
worsening trends, and a level of 50 indicating neutral trends.
1) Are traffic levels in-line, better, or worse than your expectations for this time of year? Traffic tends to be seasonal - generally
more traffic in Spring and less in Fall/Winter, so we ask about traffic relative to expectations for this time of year rather than vs. last
month. A Buyer Traffic Index above 50 means that traffic was better than agents’ expectations, a Buyer Traffic Index of 50 means that
traffic was in-line with expectations, and a Buyer Traffic Index below 50 means that traffic was worse than expectations.
2) Have prices remained the same, increased, or decreased over the past 30 days? A Home Price Index above 50 indicates that
prices increased over the past 30 days, a Home Price Index of 50 indicates that prices were flat, and a Home Price Index below 50
indicates that prices decreased.
3) Have incentives remained the same, increased, or decreased over the past 30 days? An incentive index above 50 indicates
that incentives decreased over the past 30 days, an incentive index of 50 indicates that incentives were unchanged, and an incentive
index below 50 indicates that incentives increased.
4) Do you see the same, more, or fewer listings as compared with 30 days ago? An inventory (listings) index above 50 indicates
that the inventory of homes for sale decreased over the past 30 days, an inventory index of 50 indicates that inventories were
unchanged, and an inventory index below 50 indicates that inventories increased.
5) Does it take the same, more, or less time to sell a house? A time to sell index above 50 indicates that the time needed to sell a
home decreased over the past 30 days, a time to sell index of 50 indicates that the time needed to sell a home was unchanged, and a
time to sell index below 50 indicates that the time needed to sell a home increased.

May A.G.E.N.T. Survey Data
Source: Barclays Research
45
May, 2017 Buyer Traffic Index Home Price Index Incentive Index Listings Index Time to Sell Index
Atlanta, GA 42.9 92.9 57.1 64.3 71.4
Austin, TX 50.0 81.3 18.8 43.8 37.5
Baltimore, MD 62.5 100.0 50.0 62.5 100.0
Boston, MA 71.9 84.4 57.1 40.6 78.1
Charlotte, NC 50.0 81.3 50.0 87.5 68.8
Chicago, IL 60.4 78.3 43.5 28.3 60.9
Cincinnati, OH 80.0 90.0 37.5 50.0 62.5
Columbus, OH 60.0 90.0 60.0 20.0 80.0
Dallas, TX 50.0 94.4 56.3 55.6 85.7
Denver, CO 41.7 83.3 58.3 33.3 50.0
Detroit, MI 62.5 100.0 50.0 50.0 75.0
Fort Myers, FL 66.7 50.0 25.0 58.3 41.7
Houston, TX 40.0 55.0 20.0 20.0 20.0
Inland Empire, CA 43.8 75.0 57.1 62.5 56.3
Jacksonville, FL 43.8 81.3 37.5 78.6 50.0
Kansas City, MO 87.5 75.0 62.5 75.0 100.0
Las Vegas, NV 70.0 90.0 50.0 70.0 70.0
Los Angeles, CA 64.8 87.0 47.5 48.0 64.0
Miami, FL 41.7 54.5 30.0 50.0 59.1
Minneapolis, MN 83.3 87.5 56.3 87.5 87.5
Nashville, TN 60.0 90.0 60.0 50.0 70.0
New York, NY 62.1 75.0 53.8 51.6 58.1
Orange County, CA 56.3 75.0 50.0 50.0 62.5
Orlando, FL 44.4 93.8 37.5 68.8 68.8
Philadelphia, PA 75.0 75.0 40.9 62.5 83.3
Phoenix, AZ 64.3 82.1 46.4 75.0 60.7
Portland, OR 58.3 81.8 50.0 50.0 54.5
Raleigh, NC 68.8 93.8 56.3 75.0 93.8
Richmond, VA 80.0 100.0 50.0 62.5 87.5
Sacramento, CA 72.7 100.0 62.5 40.0 75.0
San Antonio, TX 57.1 78.6 35.7 64.3 64.3
San Diego, CA 33.3 75.0 40.9 66.7 62.5
San Francisco, CA 52.0 80.0 56.8 36.0 36.0
Sarasota, FL 60.0 40.0 40.0 10.0 20.0
Seattle, WA 62.5 92.9 42.9 57.1 64.3
Tampa, FL 41.7 83.3 40.0 91.7 50.0
Tucson, AZ 83.3 100.0 50.0 83.3 91.7
Virginia Beach, VA 75.0 75.0 50.0 50.0 75.0
Washington, D.C. 58.8 82.4 47.1 47.1 61.8
Wilmington, NC 83.3 100.0 66.7 100.0 100.0
Total Index Level 60.6 82.6 47.5 56.9 66.5

Analyst Certifications and Important Disclosures
46
Analyst(s) Certification(s):
I, Michael Dahl, hereby certify (1) that the views expressed in this research report accurately reflect my personal views about any or all of the subject securities or
issuers referred to in this research report and (2) no part of my compensation was, is or will be directly or indirectly related to the specific recommendations or
views expressed in this research report.
Important Disclosures:
Barclays Capital Inc. and/or one of its affiliates does and seeks to do business with companies covered in its research reports. As a result, investors should be
aware that the firm may have a conflict of interest that could affect the objectivity of this report. Investors should consider this report as only a single factor in
making their investment decision.
Barclays Research is a part of the Investment Bank of Barclays Bank PLC and its affiliates (collectively and each individually, "Barclays").
Availability of Disclosures:
Where any companies are the subject of this research report, for current important disclosures regarding those companies please refer to
https://publicresearch.barclays.com or alternatively send a written request to: Barclays Research Compliance, 745 Seventh Avenue, 13th Floor, New York, NY
10019 or call +1-212-526-1072.
The analysts responsible for preparing this research report have received compensation based upon various factors including the firm's total revenues, a portion of
which is generated by investment banking activities, the profitability and revenues of the Markets business and the potential interest of the firm's investing clients
in research with respect to the asset class covered by the analyst.
All authors contributing to this research report are Research Analysts unless otherwise indicated.
The publication date at the top of the report reflects the local time where the report was produced and may differ from the release date provided in GMT.
Analysts regularly conduct site visits to view the material operations of covered companies, but Barclays policy prohibits them from accepting payment or
reimbursement by any covered company of their travel expenses for such visits.
In order to access Barclays Statement regarding Research Dissemination Policies and Procedures, please refer to
https://publicresearch.barcap.com/static/S_ResearchDissemination.html. In order to access Barclays Research Conflict Management Policy Statement, please
refer to: https://publicresearch.barcap.com/static/S_ConflictManagement.html.
The Investment Bank’s Research Department produces various types of research including, but not limited to, fundamental analysis, equity-linked analysis,
quantitative analysis, and trade ideas. Recommendations contained in one type of research product may differ from recommendations contained in other types of
research, whether as a result of differing time horizons, methodologies, or otherwise.
Risk Disclosure(s)
Master limited partnerships (MLPs) are pass-through entities structured as publicly listed partnerships. For tax purposes, distributions to MLP unit holders may
be treated as a return of principal. Investors should consult their own tax advisors before investing in MLP units.
Prices are sourced from Thomson Reuters as of the last available closing price in the relevant trading market.
Important Disclosures (cont’d)
47
Guide to the Barclays Fundamental Equity Research Rating System:
Our coverage analysts use a relative rating system in which they rate stocks as Overweight, Equal Weight or Underweight (see definitions below) relative to other
companies covered by the analyst or a team of analysts that are deemed to be in the same industry (“the industry coverage universe”). To see a list of companies
that comprise a particular industry coverage universe, please go to https://publicresearch.barclays.com.
In addition to the stock rating, we provide industry views which rate the outlook for the industry coverage universe as Positive, Neutral or Negative (see definitions
below). A rating system using terms such as buy, hold and sell is not the equivalent of our rating system. Investors should carefully read the entire research
report including the definitions of all ratings and not infer its contents from ratings alone.
Stock Rating
Overweight - The stock is expected to outperform the unweighted expected total return of the industry coverage universe over a 12-month investment horizon.
Equal Weight - The stock is expected to perform in line with the unweighted expected total return of the industry coverage universe over a 12-month investment
horizon.
Underweight - The stock is expected to underperform the unweighted expected total return of the industry coverage universe over a 12-month investment
horizon.
Rating Suspended - The rating and target price have been suspended temporarily due to market events that made coverage impracticable or to comply with
applicable regulations and/or firm policies in certain circumstances including where the Investment Bank of Barclays Bank PLC is acting in an advisory capacity
in a merger or strategic transaction involving the company.
Industry View
Positive - industry coverage universe fundamentals/valuations are improving.
Neutral - industry coverage universe fundamentals/valuations are steady, neither improving nor deteriorating.
Negative - industry coverage universe fundamentals/valuations are deteriorating.
Distribution of Ratings:
Barclays Equity Research has 1782 companies under coverage.
42% have been assigned an Overweight rating which, for purposes of mandatory regulatory disclosures, is classified as a Buy rating; 62% of companies with this
rating are investment banking clients of the Firm; 76% of the issuers with this rating have received financial services from the Firm.
40% have been assigned an Equal Weight rating which, for purposes of mandatory regulatory disclosures, is classified as a Hold rating; 52% of companies with
this rating are investment banking clients of the Firm; 74% of the issuers with this rating have received financial services from the Firm.
15% have been assigned an Underweight rating which, for purposes of mandatory regulatory disclosures, is classified as a Sell rating; 38% of companies with
this rating are investment banking clients of the Firm; 60% of the issuers with this rating have received financial services from the Firm.

Important Disclosures (cont’d)
48
Guide to the Barclays Research Price Target:
Each analyst has a single price target on the stocks that they cover. The price target represents that analyst's expectation of where the stock will trade in the
next 12 months. Upside/downside scenarios, where provided, represent potential upside/potential downside to each analyst's price target over the same 12-month
period.
Top Picks:
Barclays Equity Research's "Top Picks" represent the single best alpha-generating investment idea within each industry (as defined by the relevant "industry
coverage universe"), taken from among the Overweight-rated stocks within that industry. Barclays Equity Research publishes "Top Picks" reports every quarter
and analysts may also publish intra-quarter changes to their Top Picks, as necessary. While analysts may highlight other Overweight-rated stocks in their
published research in addition to their Top Pick, there can only be one "Top Pick" for each industry. To view the current list of Top Picks, go to the Top Picks
page on Barclays Live (https://live.barcap.com/go/keyword/TopPicks).
To see a list of companies that comprise a particular industry coverage universe, please go to https://publicresearch.barclays.com.
Explanation of other types of investment recommendations produced by Barclays Equity Research:
Trade ideas, thematic screens or portfolio recommendations contained herein that have been produced by analysts within Equity Research shall remain open
until they are subsequently amended or closed in a future research report.
Disclosure of previous investment recommendations produced by Barclays Equity Research:
Barclays Equity Research may have published other investment recommendations in respect of the same securities/instruments recommended in this research
report during the preceding 12 months. To view previous investment recommendations published by Barclays Equity Research in the preceding 12 months please
refer to https://live.barcap.com/go/research/ResearchInvestmentRecommendations.
Barclays legal entities involved in publishing research:
Barclays Bank PLC (Barclays, UK)
Barclays Capital Inc. (BCI, US)
Barclays Securities Japan Limited (BSJL, Japan)
Barclays Bank PLC, Hong Kong branch (Barclays Bank, Hong Kong)
Barclays Capital Canada Inc. (BCCI, Canada)
Absa Bank Limited (Absa, South Africa)
Barclays Bank Mexico, S.A. (BBMX, Mexico)
Barclays Securities (India) Private Limited (BSIPL, India)
Barclays Bank PLC, India branch (Barclays Bank, India)
Barclays Bank PLC, Singapore branch (Barclays Bank, Singapore)

Important Disclosures (cont’d)
49
Disclaimer:
This publication has been produced by the Investment Bank of Barclays Bank PLC and/or one or more of its affiliates (collectively and each individually,
"Barclays"). It has been distributed by one or more Barclays legal entities that are a part of the Investment Bank as provided below. It is provided to our clients for
information purposes only, and Barclays makes no express or implied warranties, and expressly disclaims all warranties of merchantability or fitness for a
particular purpose or use with respect to any data included in this publication. To the extent that this publication states on the front page that it is intended for
institutional investors and is not subject to all of the independence and disclosure standards applicable to debt research reports prepared for retail investors under
U.S. FINRA Rule 2242, it is an “institutional debt research report” and distribution to retail investors is strictly prohibited. Barclays also distributes such
institutional debt research reports to various issuers, regulatory and academic organisations for informational purposes and not for the purpose of making
investment decisions regarding any debt securities. Any such recipients that do not want to continue receiving Barclays institutional debt research reports should
Without limiting any of the foregoing and to the extent permitted by law, in no event shall Barclays, nor any affiliate, nor any of their respective officers, directors,
partners, or employees have any liability for (a) any special, punitive, indirect, or consequential damages; or (b) any lost profits, lost revenue, loss of anticipated
savings or loss of opportunity or other financial loss, even if notified of the possibility of such damages, arising from any use of this publication or its contents.
Other than disclosures relating to Barclays, the information contained in this publication has been obtained from sources that Barclays Research believes to be
reliable, but Barclays does not represent or warrant that it is accurate or complete. Barclays is not responsible for, and makes no warranties whatsoever as to,
the information or opinions contained in any written, electronic, audio or video presentations of third parties that are accessible via a direct hyperlink in this
publication or via a hyperlink to a third-party web site (‘Third-Party Content’). Any such Third-Party Content has not been adopted or endorsed by Barclays, does
not represent the views or opinions of Barclays, and is not incorporated by reference into this publication. Third-Party Content is provided for information purposes
only and Barclays has not independently verified its accuracy or completeness.
The views in this publication are those of the author(s) and are subject to change, and Barclays has no obligation to update its opinions or the information in this
publication. If this publication contains recommendations, those recommendations reflect solely and exclusively those of the authoring analyst(s), and such
opinions were prepared independently of any other interests, including those of Barclays and/or its affiliates. This publication does not constitute personal
investment advice or take into account the individual financial circumstances or objectives of the clients who receive it. The securities discussed herein may not
be suitable for all investors. Barclays recommends that investors independently evaluate each issuer, security or instrument discussed herein and consult any
independent advisors they believe necessary. The value of and income from any investment may fluctuate from day to day as a result of changes in relevant
economic markets (including changes in market liquidity). The information herein is not intended to predict actual results, which may differ substantially from
those reflected. Past performance is not necessarily indicative of future results.
This document is being distributed (1) only by or with the approval of an authorised person (Barclays Bank PLC) or (2) to, and is directed at (a) persons in the
United Kingdom having professional experience in matters relating to investments and who fall within the definition of "investment professionals" in Article 19(5) of
the Financial Services and Markets Act 2000 (Financial Promotion) Order 2005 (the "Order"); or (b) high net worth companies, unincorporated associations and
partnerships and trustees of high value trusts as described in Article 49(2) of the Order; or (c) other persons to whom it may otherwise lawfully be communicated
(all such persons being "Relevant Persons"). Any investment or investment activity to which this communication relates is only available to and will only be
engaged in with Relevant Persons. Any other persons who receive this communication should not rely on or act upon it. Barclays Bank PLC is authorised by the
Prudential Regulation Authority and regulated by the Financial Conduct Authority and the Prudential Regulation Authority and is a member of the London Stock
Exchange.
The Investment Bank of Barclays Bank PLC undertakes U.S. securities business in the name of its wholly owned subsidiary Barclays Capital Inc., a FINRA and
SIPC member. Barclays Capital Inc., a U.S. registered broker/dealer, is distributing this material in the United States and, in connection therewith accepts
responsibility for its contents. Any U.S. person wishing to effect a transaction in any security discussed herein should do so only by contacting a representative
of Barclays Capital Inc. in the U.S. at 745 Seventh Avenue, New York, New York 10019.

Important Disclosures (cont’d)
50
Non-U.S. persons should contact and execute transactions through a Barclays Bank PLC branch or affiliate in their home jurisdiction unless local regulations
permit otherwise.
Barclays Bank PLC, Paris Branch (registered in France under Paris RCS number 381 066 281) is regulated by the Autorité des marchés financiers and the
Autorité de contrôle prudentiel. Registered office 34/36 Avenue de Friedland 75008 Paris.
This material is distributed in Canada by Barclays Capital Canada Inc., a registered investment dealer, a Dealer Member of IIROC (www.iiroc.ca), and a Member
of the Canadian Investor Protection Fund (CIPF).
Subject to the conditions of this publication as set out above, the Corporate & Investment Banking Division of Absa Bank Limited, an authorised financial services
provider (Registration No.: 1986/004794/06. Registered Credit Provider Reg No NCRCP7), is distributing this material in South Africa. Absa Bank Limited is
regulated by the South African Reserve Bank. This publication is not, nor is it intended to be, advice as defined and/or contemplated in the (South African)
Financial Advisory and Intermediary Services Act, 37 of 2002, or any other financial, investment, trading, tax, legal, accounting, retirement, actuarial or other
professional advice or service whatsoever. Any South African person or entity wishing to effect a transaction in any security discussed herein should do so only
by contacting a representative of the Corporate & Investment Banking Division of Absa Bank Limited in South Africa, 15 Alice Lane, Sandton, Johannesburg,
Gauteng 2196. Absa Bank Limited is a member of the Barclays group.
All research reports are distributed to institutional investors in Japan by Barclays Securities Japan Limited. Barclays Securities Japan Limited is a joint-stock
company incorporated in Japan with registered office of 6-10-1 Roppongi, Minato-ku, Tokyo 106-6131, Japan. It is a subsidiary of Barclays Bank PLC and a
registered financial instruments firm regulated by the Financial Services Agency of Japan. Registered Number: Kanto Zaimukyokucho (kinsho) No. 143.
Barclays Bank PLC, Hong Kong Branch is distributing this material in Hong Kong as an authorised institution regulated by the Hong Kong Monetary Authority.
Registered Office: 41/F, Cheung Kong Center, 2 Queen's Road Central, Hong Kong.
All Indian securities-related research and other equity research produced by the Investment Bank are distributed in India by Barclays Securities (India) Private
Limited (BSIPL). BSIPL is a company incorporated under the Companies Act, 1956 having CIN U67120MH2006PTC161063. BSIPL is registered and regulated by
the Securities and Exchange Board of India (SEBI) as a Research Analyst: INH000001519; Portfolio Manager INP000002585; Stock Broker/Trading and Clearing
Member: National Stock Exchange of India Limited (NSE) Capital Market INB231292732, NSE Futures & Options INF231292732, NSE Currency derivatives
INE231450334, Bombay Stock Exchange Limited (BSE) Capital Market INB011292738, BSE Futures & Options INF011292738; Depository Participant (DP) with
the National Securities & Depositories Limited (NSDL): DP ID: IN-DP-NSDL-299-2008; Investment Adviser: INA000000391. The registered office of BSIPL is at
208, Ceejay House, Shivsagar Estate, Dr. A. Besant Road, Worli, Mumbai – 400 018, India. Telephone No: +91 2267196000. Fax number: +91 22 67196100.
Any other reports produced by the Investment Bank are distributed in India by Barclays Bank PLC, India Branch, an associate of BSIPL in India that is registered
with Reserve Bank of India (RBI) as a Banking Company under the provisions of The Banking Regulation Act, 1949 (Regn No BOM43) and registered with SEBI
Barclays Bank PLC Frankfurt Branch distributes this material in Germany under the supervision of Bundesanstalt für Finanzdienstleistungsaufsicht (BaFin).
This material is distributed in Brazil by Banco Barclays S.A.
This material is distributed in Mexico by Barclays Bank Mexico, S.A.
Nothing herein should be considered investment advice as defined in the Israeli Regulation of Investment Advisory, Investment Marketing and Portfolio
Management Law, 1995 (“Advisory Law”). This document is being made to eligible clients (as defined under the Advisory Law) only. Barclays Israeli branch
previously held an investment marketing license with the Israel Securities Authority but it cancelled such license on 30/11/2014 as it solely provides its services
to eligible clients pursuant to available exemptions under the Advisory Law, therefore a license with the Israel Securities Authority is not required. Accordingly,
Barclays does not maintain an insurance coverage pursuant to the Advisory Law.

Important Disclosures (cont’d)
51
Barclays Bank PLC in the Dubai International Financial Centre (Registered No. 0060) is regulated by the Dubai Financial Services Authority (DFSA). Principal
place of business in the Dubai International Financial Centre: The Gate Village, Building 4, Level 4, PO Box 506504, Dubai, United Arab Emirates. Barclays Bank
PLC-DIFC Branch, may only undertake the financial services activities that fall within the scope of its existing DFSA licence. Related financial products or
services are only available to Professional Clients, as defined by the Dubai Financial Services Authority.
Barclays Bank PLC in the UAE is regulated by the Central Bank of the UAE and is licensed to conduct business activities as a branch of a commercial bank
incorporated outside the UAE in Dubai (Licence No.: 13/1844/2008, Registered Office: Building No. 6, Burj Dubai Business Hub, Sheikh Zayed Road, Dubai City)
and Abu Dhabi (Licence No.: 13/952/2008, Registered Office: Al Jazira Towers, Hamdan Street, PO Box 2734, Abu Dhabi).
Barclays Bank PLC in the Qatar Financial Centre (Registered No. 00018) is authorised by the Qatar Financial Centre Regulatory Authority (QFCRA). Barclays
Bank PLC-QFC Branch may only undertake the regulated activities that fall within the scope of its existing QFCRA licence. Principal place of business in Qatar:
Qatar Financial Centre, Office 1002, 10th Floor, QFC Tower, Diplomatic Area, West Bay, PO Box 15891, Doha, Qatar. Related financial products or services are
only available to Business Customers as defined by the Qatar Financial Centre Regulatory Authority.
This material is distributed in the UAE (including the Dubai International Financial Centre) and Qatar by Barclays Bank PLC.
This material is not intended for investors who are not Qualified Investors according to the laws of the Russian Federation as it might contain information about or
description of the features of financial instruments not admitted for public offering and/or circulation in the Russian Federation and thus not eligible for non-
Qualified Investors. If you are not a Qualified Investor according to the laws of the Russian Federation, please dispose of any copy of this material in your
possession.
This material is distributed in Singapore by the Singapore branch of Barclays Bank PLC, a bank licensed in Singapore by the Monetary Authority of Singapore.
For matters in connection with this report, recipients in Singapore may contact the Singapore branch of Barclays Bank PLC, whose registered address is 10
Marina Boulevard, #23-01 Marina Bay Financial Centre Tower 2, Singapore 018983.
This material is distributed to persons in Australia by either Barclays Bank plc , Barclays Capital Inc., Barclays Capital Securities Limited or Barclays Capital
Asia Limited. None of Barclays Bank plc, nor any of the other referenced Barclays group entities, hold an Australian financial services licence and instead they
each rely on an exemption from the requirement to hold such a licence. This material is intended to only be distributed to “wholesale clients” as defined by the
Australian Corporations Act 2001.
IRS Circular 230 Prepared Materials Disclaimer: Barclays does not provide tax advice and nothing contained herein should be construed to be tax advice. Please
be advised that any discussion of U.S. tax matters contained herein (including any attachments) (i) is not intended or written to be used, and cannot be used, by
you for the purpose of avoiding U.S. tax-related penalties; and (ii) was written to support the promotion or marketing of the transactions or other matters
addressed herein. Accordingly, you should seek advice based on your particular circumstances from an independent tax advisor.
© Copyright Barclays Bank PLC (2017). All rights reserved. No part of this publication may be reproduced or redistributed in any manner without the prior written
permission of Barclays. Barclays Bank PLC is registered in England No. 1026167. Registered office 1 Churchill Place, London, E14 5HP. Additional information
regarding this publication will be furnished upon request.