the basics of root cause analysis - icareweb.com€¦ · the basics of root cause analysis. figure...
TRANSCRIPT

Reliability… it’s in our DNA.
An Allied Reliability Group White Paper
The Basics of Root Cause Analysis
March 25, 2014
4200 Faber Place Drive Charleston, SC 29405
843.414.5760 www.alliedreliabilitygroup.com


© 2014 Allied Reliability Group Page 1
Contents What Is Root Cause Analysis and Why Is It Important? ................................................................1
Establishing RCA Triggers .................................2 Effective RCA Barriers ........................................2
Performing RCA .......................................................3 Recognize .............................................................4 Rationalize...........................................................5 Ratify ...................................................................8 Resolve.................................................................9 Realize ............................................................... 13
Metrics .................................................................... 15
What Is Root Cause Analysis and Why Is It Important? Root Cause Analysis (RCA) is the core skill used by maintenance and reliability engineering professionals to resolve problems that impact an organization’s ability to meet strategic objectives.
RCA is not just a tool, it is a systematic methodology used by managers, engineers, supervisors, operators, and technicians to eliminate chronic problems that affect an organization. RCA is the preferred process for solving a variety of problems, not just equipment failures. Take quality management systems for example, as defined by ISO 9001:
"The organization shall take action to eliminate the cause of nonconformities in order to prevent recurrence.”
ISO 9001, Quality Management Systems - Requirements, Clause 8.5, Improvement,
Paragraph 8.5.2, Corrective Action
Sponsorship or advocacy for the RCA process must be earned. Ultimately, it comes down to a personal choice made by the individual to support the new way of doing business. Management’s commitment to the RCA process, and anyone else impacted by the RCA process, is best gained by:
• Building awareness of why the RCA process is important and why the sequence of steps within the process is relevant to meeting the needs of the business.
• Helping people understand what is expected of them and how the RCA process will impact their role or ability to meet their personal objectives.
• Providing case studies and concrete examples of successful problem solving that relate to personnel’s own experiences and needs.

Page 2 The Basics of Root Cause Analysis
• Telling the manager specifically what actions must be taken in order to ensure the success of the RCA process.
• Acknowledging behaviors that reinforce the expectations of the RCA process in order to encourage continued support.
Establishing RCA Triggers
The most significant challenge to overcome when starting an RCA program is not having enough resources to implement the corrective actions before the facility suffers from the same problem again. Strong management sponsorship and commitment certainly helps to overcome this challenge; however, if leadership does not believe that failures are effectively being resolved in a timely manner, they will lose interest and, as a result, become more directive and demanding in an effort to implement risk mitigating actions. This often leads to counterproductive and extraordinary measures such as around-the-clock maintenance monitoring of critical assets, the implementation of preventive routines that 90% of the time are not adding value, and the feeling that more MRO spares need to be carried in inventory. These are extraordinary measures because they are very costly decisions.
Establishing RCA triggers is the best way to ensure that the organization is not constrained by investigation time limits that compromise the integrity of the RCA and to ensure that there are sufficient labor, material, and financial resources to execute corrective actions.
RCA triggers act like a decision tree and should be based on organizational strategic objectives. For each trigger, it is recommended that you identify the level of effort that is allowed to resolve the risk. In essence, you are performing a Cost-Benefit Analysis. Every time an organization investigates an event, there is a cost to the organization relative to manpower and the cost of corrective actions. These costs should not be greater than the financial value gained from preventing future occurrences. A
good rule of thumb is to not exceed 85% of the financial benefit within a single fiscal year.
In the event that the failure does not impact one of the agreed upon triggers, simply document the problem using the Change Analysis method discussed later in this white paper. That way, the failure history is recorded in case this singular event is related to another, higher risk event.
Limiting RCA efforts to specific triggers helps organizations overcome time and resource barriers. Engaging leadership, as Sponsors for the RCA program, in this first round of RCA decision making aligns the strategic objectives of the organization with the RCA program and ensures that successful achievement of objectives is closely tied to how effectively the organization supports and executes RCA.
Effective RCA Barriers
There are a number of reasons why an RCA program, especially a new program, is ineffective and eventually unsustainable:
• Poorly Defined Problem Statement – Poorly defined problems lead to misguided RCA teams and ineffective problem solving. In many instances of asset-related failures, the problem needing to be solved has nothing to do with the asset. The failure, in effect, is merely a symptom of a systemic problem, or multiple problems, that needs to be investigated and resolved.
• No Formal RCA Process – Informal RCA practices lead to assumption-based analysis and decision making. Without the proper facilitation, RCA events become unproductive and rarely result in effective solutions. Most times, informal RCA becomes a “check the box” activity.
• Time Limited Investigations – Although not ideal, it is common for leadership to limit the time that RCA teams have to investigate

© 2014 Allied Reliability Group Page 3
problems. Typically, this results in the team stopping at the physical roots. This means that the true root causes of the failure will not be resolved and the organization will suffer from this problem again in the future.
• Unchecked Assumptions – It is normal to build an RCA diagram based on gut-feel and assumptions; however, this should only be the first step in brainstorming possible causal chains. The effectiveness of corrective actions is dependent upon the accuracy of the analysis. Facts should always be used to check assumptions.
• Insufficient Analysis Detail – When we try to solve asset-related problems with limited knowledge or detail, we have a tendency to only recognize the “rule breakers”. Rule breakers are events like “Johnny was not wearing his fall protection”, “Johnny did not follow the procedure”, or “Johnny ran a red light”. Although these events may be true, they are not the whole story. This leads to improper corrective action selection. It is important to break the chain of events down into small bites of information so we can better understand the human, systemic, and latent details that led to failure.
• Interim “Recovery” Solutions Become Permanent – In many situations, it is necessary to implement interim solutions in order to quickly recover from the failure event and return to normal operation. This can often mask the root causes and may even create a false sense of problem resolution.
• RCA Team Lacks Expertise – It is not uncommon to have an RCA team that lacks the skills, knowledge, and experience to drill down and explore all possible causal chains. A good indicator of this barrier is a high frequency of RCAs and solutions that primarily focus on physical roots.
• Inadequate Resources to Resolve “Big” Issues – RCA teams will quickly become frustrated and unproductive if they believe that their solutions are unlikely to be implemented due to budget constraints, unavailable capital for engineered solutions, and an already overburdened maintenance backlog.
• Skirting the “Blame Game” – Because human and latent root causes inevitably lead back to a decision made by a member of your organization, it is natural for RCA team members to attempt to hide details or skirt around a particular causal chain. No one likes to point fingers.
• “It’s Not My Job” Syndrome – It is easy for RCA team members to become overwhelmed by the thought of the mountain of work that is piling up while they are engaged in the RCA. Some may even be expressive about RCA not being their responsibility. This can quickly derail the flow of progress within the RCA.
Performing RCA As we have already stated, RCA is a systematic approach to problem solving. Figure 1 shows Allied Reliability Group’s systematic approach, known as the “R5 Cause Analysis” process. This model resembles the popular Six Sigma DMAIC methodology, whereby you first set out to define the incident in order to recognize the problem needing to be solved. With a clear understanding of the problem, the initial investigator then measures the impact that the problem is having on organizational objectives as a way to rationalize whether or not further investigation is warranted. With a ratified path forward, the RCA team proceeds to analyze the causal factors in order to determine how to improve performance by mitigating the root causes of the incident. Finally, the process is complete once you have realized that your solutions are effective and have implemented controls to prevent recurrence.

Page 4 The Basics of Root Cause Analysis
Figure 1: R5 Cause Analysis Process
Recognize
Incident Analysis
As previously discussed, the first step in the process is to determine if the incident that triggered the call for RCA is the problem needing to be solved or if it is merely an effect of a much bigger incident. Starting at too high a level within the overall cause and effect relationship may prolong the analysis process and result in both management and RCA team members becoming disengaged. Additionally, if the initiating incident is nothing more than a symptom of an underlying chain of events, the team might not arrive at the necessary corrective actions
that will truly prevent recurrence. This often leads stakeholders to be skeptical of the RCA program and may result in a lack of sponsorship to continue analysis efforts.
Design and Application Review
The Design and Application Review method is used to compare the desired expectations of an asset, process, or procedure to the original design or configuration. Differences between the desired expectation and the design should be noted as potential questions for further investigation during the RCA process. As an example, if a production process currently requires 700 gallons of a chemical per minute and the pump is only capable of 650

© 2014 Allied Reliability Group Page 5
gallons per minute per the pump flow curve, then this could be a problem or a contributing factor to the incident being investigated.
Change Analysis
The Change Analysis method is also used to clarify the problem, or problems, that need to be solved through RCA. Change Analysis helps the team identify questions that need to be answered and data that must be collected. Because the Change Analysis method quantifies the impact of the event or initial problem, when coupled with formally defined triggers, the Change Analysis method is very useful when trying to determine if an RCA is required and to what level of detail.
Listed here are the steps that should be followed and the questions that should be asked when facilitating a Change Analysis:
1. What happened? Interview all personnel directly and indirectly involved in the incident. Preserve all physical evidence and fully document the scene of the incident in order to later confirm the failure mode and mechanisms.
2. When did it happen? Document the timeline of events that surrounds the initiating incident. Collect eyewitness statements, video or photographic evidence, and all data that supports your timeline.
3. Where did it happen? Identify the specific machine, system, or area where the incident occurred. Gather information pertaining similar occurrences, including those that happened in other areas of the plant or facility.
4. How did it happen? Itemize all changes in product specifications, maintenance and operating practices or procedures, and changes to the environment that may have contributed to the incident.
5. Who was involved? List the interviewees directly or indirectly involved in the incident,
making sure to include those individuals or organizations who responded after the incident.
6. What was the effect or impact to the organization? Gather data relative to downtime, product loss, waste, scrap, and other financially quantifiable effects resulting from the incident.
Problem Statement
The number one barrier to effective problem solving is starting an analysis with a poorly defined problem statement. Fortunately, the result of either pre-analysis method is a much more clearly defined problem statement for beginning the analysis. After the incident analysis is completed, it is time to write the problem statement. The problem statement should be written in terms of the part or equipment, the defect, and the impact of the defect.
Here are a few things to remember when writing the problem statement:
• No storytelling, stick to the facts • Follow the events, not the blame • Details are better than opinions • Do not jump to conclusions or try to propose
solutions
Rationalize
Document Physical Evidence
Physical root causes are the first to be analyzed within the Resolve phase. Physical evidence helps the RCA team evaluate and eliminate suspected causal chains during the RCA. This shortens the time it takes to analyze the problem.
When documenting physical evidence associated with the incident, it is helpful to think in terms of the defect that is evident for a specific part and the reason why it occurred. This is known as the “failure mechanism”, a term used to describe the

Page 6 The Basics of Root Cause Analysis
chain of events that led to the failure. A failure mechanism is actually a single statement that contains the device, failure mode, and primary means of failure, or “mechanism”. Documenting physical evidence in this way will help the RCA team.
Types of Root Causes
Many RCAs stop at the physical root cause, where technical solutions can be created. As such, human, systemic, and latent causes of problems are not addressed. If the RCA is taken to the latent causes, then the team can look at the cost and benefits of addressing the problem at each level and determine the best level for a short-term and a long-term solution. At each level moving down the tree in Figure 2, you see expanded benefits, but in many cases at a higher cost and effort to capture that benefit. It is important for the team to complete a Cost-Benefit Analysis to determine where to address the problem.
Figure 2: RCA Elements Guide

© 2014 Allied Reliability Group Page 7
RCA Business Case and Charter
The last step in the Rationalize phase of the R5 Cause Analysis process is to begin documenting the business case for moving forward. This is not a “check the box” activity. In order to gain management’s commitment to allocate resources to the analysis of root causes, and eventually towards implementing solutions once the analysis is complete, it is important to communicate the value to the business for doing so, what success looks like, the plan for moving forward, and how progress and results will be measured.
The tool that is commonly used to communicate all of this is the A3 charter. It is called an “A3” charter because everything that needs to be communicated fits on a single sheet of A3-size, or 11 inch by 17 inch, paper. The charter is divided into boxes for Business Opportunity and Charter, Current Condition, RCA, Target Condition, Proposed Action Plan, and Metrics Plan.
Business Opportunity and Charter – The purpose of this box is to communicate the problem statement and the effect this problem has on the company’s ability to meet strategic objectives.
Current Condition – In this box, document the current condition or what is known about the conditions that may have contributed to the problem. Remember to capture what was learned during interviews about procedural changes, changes to maintenance routines, changes to parts used on the asset, or even environmental changes.
RCA – Usually, during the Rationalize phase, there is not enough information to diagram the root causes of the problem (this happens during the Resolve phase). However, if one of the basic RCA methods was used as a way to brainstorm possible avenues to follow up on during the analysis, then a preliminary graphic could
certainly be placed in this box to help build awareness around what the RCA team will be investigating.
Target Condition – The “Target Condition” describes for leadership and stakeholders what success looks like and what will change as a result of implementing the solutions or corrective actions proposed by the RCA Team.
Proposed Action Plan – At first, this box will be populated with the steps the team plans to take in order to analyze the problem. As the RCA team identifies solutions, this box in the charter will be added to in order to communicate implementation and post-implementation plans.
Metrics Plan – The last component of the A3 charter is the “Metrics Plan”, which illustrates how the organization will measure the progress of the RCA team and how solutions will be evaluated after implementation. It is a good practice to provide both milestones for the team and a definition of performance indicators in this box.
As shown, initially you will only be able to populate two (2) or three (3) boxes within the charter as the business case for RCA. In the Ratify phase, you will return to this document to communicate how the RCA team plans to tackle the issue at hand. Finally, as you finish the investigation and begin to propose corrective actions, you will again return to this document as a means of communicating with management and other stakeholders what you found and how the team plans to mitigate the problem in the future.

Page 8 The Basics of Root Cause Analysis
Ratify
RCA Team
With the business case clearly understood by management and other stakeholders, you now need to assemble the team of people who will be responsible for analyzing root causes and determining corrective action solutions.
It is best to build a cross-functional group of experts who understand the effects that operating, maintenance, and engineering procedures and standards of practice have on asset performance. You will need to identify those within the organization, or external to the organization, who are intimately familiar with the assets involved in the incident.
There are a number of reasons why a cross-functional problem solving team is the best model for facilitating an RCA. Often, when we are trying to solve complex problems, we are too close to the problem to see it for what it really is. Cross-functional teams help us expand our perspective in order to see the big picture and more accurately find solutions.
Cross-functional teams improve our ability to communicate the results of the analysis and build buy-in for the solutions at all levels within the organization. This ensures a higher likelihood that solutions will be implemented as planned. A cross-functional team also allows us to divide the analysis by function, which reduces the time it takes to complete the analysis. Finally, by bringing people together with different experiences and levels of knowledge, we are able to transcend functional boundaries and more easily solve complex problems that require creative, out-of-the-box thinking.
In addition to the RCA team, you will also need to identify who within the organization will be designated to implement the corrective actions. Answering this question up front ensures that the
RCA team members will not be distracted by the magnitude of work stemming from the solutions they select to resolve the problem. This also creates an opportunity for management to begin budgeting for implementation.
RCA Team Roles
A good place to start looking for RCA team members is the “who” list you recorded and potentially interviewed during the incident analysis. Each team member should be trained in the methods the RCA Facilitator plans to use during the analysis.
“Cross-functional” also means multiple roles. There are three (3) types of team members in the problem solving team structure:
Sponsor – This person owns the problem and is responsible for motivating the team, ensuring that each person fully understands the problem needing to be solved, and guiding decision making to ensure alignment with the strategic objectives of the organization. The Sponsor is also the team member responsible for communicating progress and results to top management in order to maintain support for the process. The team’s Sponsor should be a manager who has authority over implementation resources, believes in the RCA program, and will actively support the team’s efforts.
Facilitator – This person guides the team through the process and is responsible for engaging team members in the analysis to ensure that all perspectives are recognized and considered. The Facilitator is the owner of the RCA process, which means he or she is responsible for maintaining the team’s focus and the integrity of the analysis itself. One of the key characteristics of the team’s Facilitator is that he or she is able to remain objective, never trying to influence the team’s ideas or decisions based on his or her own preconceived notions.

© 2014 Allied Reliability Group Page 9
Contributor – The majority of team members will serve as Contributors. Fundamentally, their responsibility is to participate as expert witnesses to the problem at hand. Contributors are responsible for generating ideas under the guidance of the Facilitator, providing plausible solutions to resolve the problem, and working collaboratively with implementation resources to ensure that the team’s vision is realized. Contributors need to be willing to participate in discussions, not just excited about telling others the way it was, is, and forever shall be. Refer to the Change Analysis and identify those who were closest to the event when it occurred as they will
have firsthand knowledge of the situations leading up to and following the problem. It is important to find people who can help build a complete picture around the problem. Be cautious of those who have a limited perspective and are unable to accept the perspective of others.
Resolve
The R5 Cause Analysis T3 Chart (Figure 3) is an excellent job aid to help you remember when and how to use each of the eight (8) RCA methods in a transitional scheme during the Resolve phase.
Figure 3: R5 Cause Analysis T3 Chart
Time-Based Methods
“Time” methods are preferred when analyzing accidents or undesirable events in which the time sequence is critical to the evaluation of combined contributing factors. These methods help the RCA team determine if causal chains are in fact
interrelated in time. Time methods can also help illustrate the relationship of conditional factors that may appear to be unrelated.
Time-based methods help organize seemingly random factors into a logic sequence or scenario to explain how the incident happened.

Page 10 The Basics of Root Cause Analysis
There are four (4) steps to facilitating a time-based RCA:
1. The first thing that needs to be done is to organize the data gathered during pre-analysis, or during troubleshooting and restoration activities.
2. To remove the randomness of the event, the second step is to validate the “primary” event sequence using the Sequence of Events method.
3. Next, identify the contributing factors that enabled the primary event sequence. These are not actual occurrences; they are instead supposed conditions or systemic circumstances that must have been present in order for the event or events to occur. Contributing factors are initially identified based on assumptions, but always check assumptions with evidence.
4. The fourth and final step of the time-based RCA facilitation is to prioritize how the RCA team will investigate known events or contributing factors down to root causes in order to identify solutions to prevent recurrence. Time-based methods are an intermediate step in the overall transformational RCA that helps the RCA team and the organization decipher random events and conditions and their relationship to the incident. Typically, a tree-based or transparency-based method is still needed in order to effectively solve the real problem.
Sequence of Events
The best method to use when trying to identify the importance of each contributing factor in the causal chain is Sequence of Events. This method displays a horizontal causal chain, relative to time, leading up to the specific problem needing to be solved. It is common, as well, to document the events in time after the problem as these factors may have led to the frequency at which the problem occurs.
When facilitating this method, it is a good practice to provide evidence that supports your timeline.
Evidence within the Sequence of Events Analysis is known as “conditional causes” and may lead your RCA team to discover other problems that must be resolved in order to effectively eliminate the root cause of your initial problem. If you completed a Change Analysis prior to beginning your Sequence of Events Analysis, then you are more likely to have the evidence you need to clarify the incident requiring your attention.
Most Facilitators will start by transferring the pre-analysis data to sticky notes in order to easily separate events from conditional causes and move evidence around within the analysis as ideas from the team are contributed.
Record the events leading up to the incident. Events should be written in a way that states what happened, not a condition, conclusion, or suspected circumstance. Additionally, recording post-incident events helps to identify if restoration or troubleshooting activities may be contributing to the frequency of the incident.
Then, add the evidence collected to the diagram to validate the primary event sequence. If an event is missing evidence, assign an action item to a member of the RCA team to validate the event. In some situations, it may be necessary to pause the analysis until each and every event has been validated to prevent false conclusions as to what actually happened leading up to the incident.
Forcing Functions
Once the primary event sequence has been validated, the next step is to identify the contributing factors or “forcing functions”. We often refer to these as “forcing functions” because they are the situations that existed, or are perceived to have existed, that enabled the primary events to result in an undesirable incident. There are two (2) types of forcing functions most commonly used in time-based methods: conditional and systemic.

© 2014 Allied Reliability Group Page 11
Within the Sequence of Events method, we are going to identify the conditional functions. Conditional functions are different from events because they identify circumstances, such as asset parameters or environmental changes, that could have contributed to an event or led to the event causing the incident you are trying to solve. Some practitioners will also refer to these circumstances as “conditional causes”.
Conditional functions must also be validated using data collected prior to the analysis or after the analysis by a member of the RCA team. However, placement of these factors within the primary event sequence is subjective and based on the knowledge and experience of the RCA team. The goal is to capture the situations that existed within the timeline that could lead the team closer to identifying the true root causes of the problem.
Event and Causal Factors
When dealing with time-related problems in which various contributing conditions or branched causal chains exist, it is best to expand the Sequence of Events by using the Event and Causal Factors Analysis method. This method helps your RCA team determine the relationship in time of primary, secondary, and conditional causes, especially if the team is expected to process a large volume of data, evidence, or eyewitness accounts that appear to be unrelated to the physical events that led to the accident or undesirable incident.
At this stage in the analysis, the RCA team should use the Fault Tree Analysis method discussed in the following section to break down the conditional causes that led to the accident or undesirable incident. This will help determine corrective actions to prevent recurrence and thus stop the rest of the primary sequence of events from happening in the future.
The Event and Causal Factors Analysis method helps your RCA team determine the relationship in
time of secondary events and systemic contributing factors, especially if the team is expected to process a large volume of data, evidence, or eyewitness accounts that appear to be unrelated to the primary events.
Tree-Based Methods
“Tree” methods are used to examine the undesired effects of a system, such as the introduction of product defects and equipment breakdowns. Tree methods present the possible causes identified by the RCA team in branching scenarios that represent the logical ordering of known factors, with each scenario then evaluated using evidence to determine solution selection.
Five Why Analysis
The Five Why method is a basic RCA tool that evaluates possible causes by asking why each event or factor occurred in a chained progression, typically from top to bottom. The reason for the “5” in the “Five Why” is to ensure that human and potentially systemic root causes are documented in the causal chain. Stopping before the 5th “Why” may only capture the physical events that occurred and may not provide enough detail for effective solution selection.
The Five Why method is facilitated by asking why a condition exists. The progression of conditions can shift from the physical roots, to human, then systemic. At the fifth “Why”, we transition to the lowest element of root cause, the latent cause.
The Five Why method is best used on the shop floor by Operators and Technicians as a basic problem solving method to quickly and simply record the events that occurred leading up to the failure or quality issue. This method is not suitable for complex problems because it is limited to a single causal chain.

Page 12 The Basics of Root Cause Analysis
Fault Tree Analysis
A Fault Tree Analysis is simply a branched Five Why. When you are faced with a multi-faceted problem that could have long causal chains, the Fault Tree method is the preferred approach in order to achieve a common understanding of all of the major factors that could have contributed to the system’s undesired effect. This is an advanced method and is a better tool to use than Five Why when trying to solve complex, equipment-related problems. We must remember that when dealing with equipment-related problems we always have a minimum of two (2) causes that exist at the same point in time, a conditional cause and an actionable cause. This means that directly under your effect or problem needing to be solved, you will have at least two (2) causal chains. For this reason alone, the Five Why method is inadequate.
Logic Tree Analysis
The Logic Tree Analysis method is used to examine the various scenarios represented in a fault tree using logic to determine if causal chains are independent or interrelated.
This method uses “And” statements to illustrate that two (2) or more chains are related in time and both must occur to cause the problem. RCA teams, and their sponsors, love to see “And” statements because it reduces the number of solutions that have to be implemented. When you have two (2) causal factors that are linked by “And”, you only have to eliminate one (1) to effectively prevent the problem from occurring again in the future.
“Or” statements are used to illustrate the opposite, that each chain or branch independently causes the problem with no relationship to other factors. With an “Or” statement, you must implement a solution for each cause in order to prevent reoccurrence.
When you are transitioning from the Fault Tree to the Logic Tree Analysis, you will walk the team backwards through the diagram, from bottom to top.
This helps the team think sequentially and makes it easier to decide if causal factors are related in time or are independent.
Transparency-Based Methods
“Transparency” methods are used to proactively identify product design, safety, quality, or reliability problems that have the potential to impact your organization’s ability to meet strategic objectives. These methods create visibility of unknown relationships between systems, machines, and components, as well as the control mechanisms, such as standard operating procedures and preventive maintenance routines, that may be ineffective in mitigating risk.
Cause and Effect (Fishbone Diagram)
A Cause and Effect Diagram (also known as a “fishbone diagram”) is a basic brainstorming tool used to illustrate the relationships of various causal factors that may contribute to the problem, or “effect”. Most practitioners facilitate this brainstorming process by creating four (4) branches, one (1) for each causal factor category. We call these branches the “4 Ms”, which stand for Machine, Methods, Materials, and Man. This allows you and the RCA team to organize your thoughts to better understand what causal factors need to be analyzed further using the Simplified Failure Mode and Effects Analysis (sFMEA) or Failure Mode, Effects, and Criticality Analysis (FMECA) advanced transparency methods.
Simplified Failure Mode and Effects Analysis
sFMEA is used to identify likely failure modes in a top-down approach from system to component. We call it “simplified” because this form of Failure Mode Analysis (FMA) stops at the component level. Instead of examining the individual failure modes and effects of replacement spares such as fasteners, gaskets, and springs, the sFMEA looks at the

© 2014 Allied Reliability Group Page 13
relationship of these parts to their parent component or machine as the potential causes of failure. The relationship between component, part, and problem is what we call the failure mode, and the relationship between problem and cause is known as the failure mechanism. Combining the two forms the complete root cause statement.
From here, we can identify if a new risk mitigating action, or “control”, is needed to prevent the failure mechanism from occurring.
One of the advantages of starting your analysis with the Cause and Effect method is that it helps the team gain a common understanding of the big picture issues, especially if team members came to the problem solving event prepared to contribute ideas based on their cross-functional perspectives. The downside of the sFMEA method is that the team’s view point during the analysis is limited to what they can see on the screen, or in the template. The Facilitator will routinely need to refresh the big picture perspective by summarizing the analysis as it unfolds, in effect reconnecting the cause and effect dots in people’s minds.
Failure Mode, Effects, and Criticality Analysis
The FMECA method allows the team to quantify the risk priority of each identified failure mode within the sFMEA. A FMECA analyzes risk relative to how severely the failure mode impacts organizational objectives, such as production capacity, the probability that the failure mode will occur again in the future, and how likely it is that your organization will detect the onset of the failure mode before the effect is realized by the organization. The sum of these three (3) risk factors is known as the Risk Priority Number (RPN) of the failure mode and can be used to prioritize solution selection. This is particularly valuable when comparing the effectiveness of current controls and potential solutions.
Realize
Solution Selection
Based on the thresholds established by the RCA team, the last step in the transparency RCA method is to identify corrective actions that will reduce the overall risk associated with the loss of function. Once the results of the RCA have been captured, the team will go through this solution selection process. Ideally, every potential failure mode will be addressed, but that might not be economically feasible based on the boundaries and challenges communicated by the Sponsor.
Effective solution selection comes down to three (3) factors:
• The solution must prevent the incident and problem you are trying to solve from recurring or at least mitigate the risk.
• The solution must be within the control of your organization to implement without external limitations or constraints.
• The solution must align with the values and strategic objectives of your organization.
In order to ensure that the solutions provide a reasonable value to the organization to offset the cost of implementation, it is recommended that a solution rating matrix be established. For example, each solution could be evaluated based on its ability to impact chosen strategic objectives such as Cost, Quality, Delivery, Environmental Performance, and the Safety and Health of employees and the community surrounding the facility.
Along with the matrix, you and the RCA team will need to determine the minimum required score for solution selection. Remember the “Sponsor” role from the RCA team structure? The Sponsor is an advocate and advisor to the RCA team who represents the direction and perspective of stakeholders, but also helps to remove barriers during the RCA process. When establishing solution

Page 14 The Basics of Root Cause Analysis
selection criteria, consult your Sponsor for guidance to ensure that management will continue to support the implementation of corrective actions.
Risk Priority Number
As we already stated, the RPN is the sum of three (3) risk factors: severity, occurrence, and detectability. The Facilitator must guide the team to identify the level of risk in each factor and determine which failure modes are the most significant to the organization’s ability to resolve the problem at hand. It is recommended that a minimum threshold be established for solution selection. For example, the team could agree that failure modes that are unlikely to occur will not be addressed in solution selection. Or, the team could decide that failure modes that have a minor impact on production performance will not be selected, regardless of the probability of occurrence. This needs to be a consensus decision and it is the responsibility of the Facilitator to guide the team to an agreed upon threshold.
TECHNICAL NOTE: There are three (3) accepted ways to calculate RPN using the severity, occurrence, and detectability risk factors. First, there is the simple calculation that sums the severity, occurrence, and detection risk factors in order to determine risk priority. Second, there is the traditional calculation, which is to multiply these same three (3) risk factors together to produce an RPN between ‘1’ and ‘1000’. This is a widely accepted practice as it provides more granularity in the analysis. If the FMECA returns a large number of potential causes, use this traditional RPN calculation to clearly separate one risk from another. The third and very common variation to the risk calculation is to divide the product of the three (3) risk factors by the total points possible. This weights the three (3) risk factors and produces an RPN relative to 100% of the total possible risk. Many practitioners use this methodology because it is easier to relate risk to non-technical associates in terms of a percentage.
The trick to facilitating solution selection using the FMECA method is to focus ideas on preventing the potential causes of each failure mode. RCA teams are commonly sidetracked in this portion of the analysis by focusing their attention on the failure effects and trying to determine how to improve their ability to detect the symptoms of failure. This is a reactive way of thinking.
Once the team has identified all of the recommended actions for each failure mode, and there could be more than one (1) per failure mode, guide the team back through the risk evaluation as a means of verifying that the proposed solutions will reduce the likelihood of occurrence or improve the organization’s ability to detect the failure mode before a loss of function. Only redesign solutions that call for functional redundancy will reduce the severity of impact risk.
The before and after RPN values are an excellent data point to use when developing the business case for solution implementation. The post-solution risk values can also be used to track and validate the effectiveness of each solution.
Corrective Action Tracking
Communication is the key to success of any RCA program. Ensure that a Communication Plan is implemented to maximize knowledge, awareness, and recognition and to ensure solution implementation. This includes training plans for embedding any human, systemic, or latent root solutions.
During implementation, each corrective action chosen should be managed using standard project management processes and tracked with a Corrective Actions Tracking Log. Using a Corrective Actions Master List, enter each corrective action, the person who is responsible for it, and the completion date in a spreadsheet or project tracking tool. To help with tracking, create a separate list for actions that call for review, analysis, or
© 2014 Allied Reliability Group Page 15
investigation. Also, projects or “nice-to-do” tasks should be kept separate from the Corrective Actions Master List, which should only include those specific items that result from a formal RCA investigation.
The Corrective Actions Tracking Log should be updated frequently and have the highest visibility in the organization. If a corrective action is not completed on time, an explanation should be provided and a new date assigned.
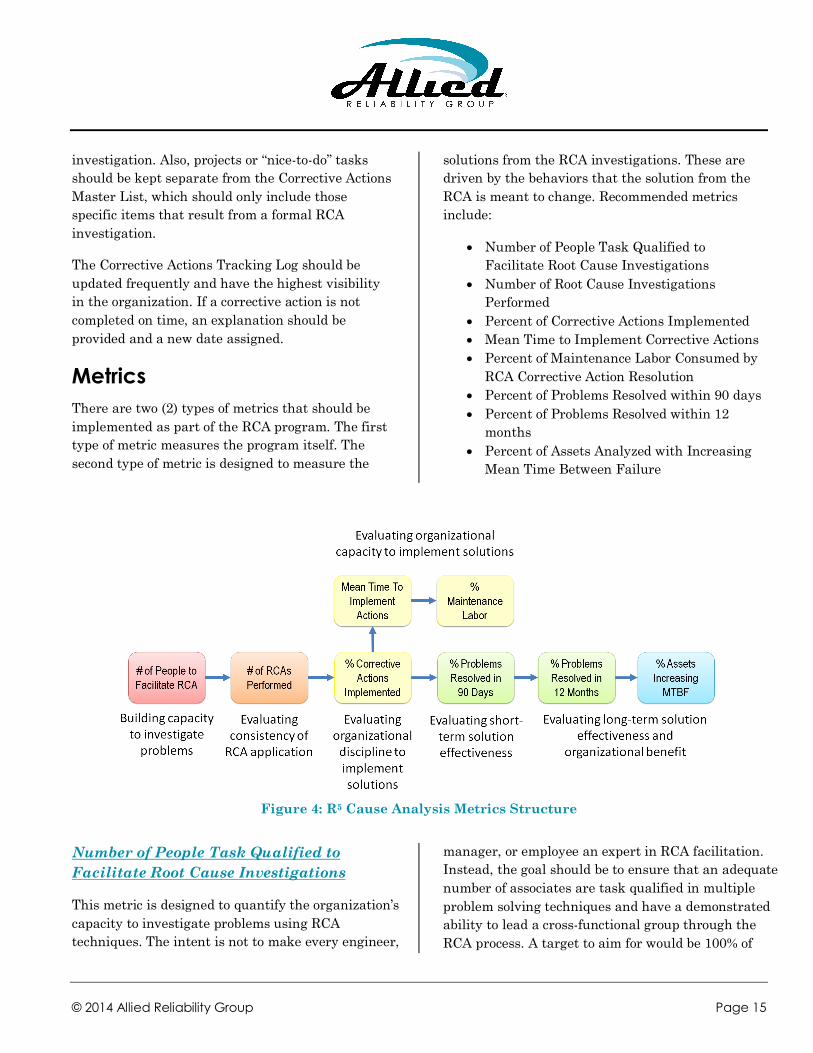
Metrics There are two (2) types of metrics that should be implemented as part of the RCA program. The first type of metric measures the program itself. The second type of metric is designed to measure the
solutions from the RCA investigations. These are driven by the behaviors that the solution from the RCA is meant to change. Recommended metrics include:
• Number of People Task Qualified to Facilitate Root Cause Investigations
• Number of Root Cause Investigations Performed
• Percent of Corrective Actions Implemented • Mean Time to Implement Corrective Actions • Percent of Maintenance Labor Consumed by
RCA Corrective Action Resolution • Percent of Problems Resolved within 90 days • Percent of Problems Resolved within 12
months • Percent of Assets Analyzed with Increasing
Mean Time Between Failure
Figure 4: R5 Cause Analysis Metrics Structure
Number of People Task Qualified to Facilitate Root Cause Investigations
This metric is designed to quantify the organization’s capacity to investigate problems using RCA techniques. The intent is not to make every engineer,
manager, or employee an expert in RCA facilitation. Instead, the goal should be to ensure that an adequate number of associates are task qualified in multiple problem solving techniques and have a demonstrated ability to lead a cross-functional group through the RCA process. A target to aim for would be 100% of

Page 16 The Basics of Root Cause Analysis
those roles within the organization that have responsibility for problem resolution, such as Maintenance Engineers, Reliability Engineers, and Continuous Improvement Leaders, plus 23% of operating and maintenance resources that are expected to perform initial investigations. The number of task qualified personnel should be proportionate to the engineering and maintenance organizations’ capacities to execute corrective actions.
Number of Root Cause Investigations Performed
Although the focus of the RCA program should be to solve problems, not simply investigate problems, early on in the deployment of the program the organization will need to gauge its ability to consistently apply the RCA process. There is no sense in evaluating corrective actions if investigations are infrequent as the overall benefit to the organization will be insignificant. So, how many root cause investigations should be completed in order to justify continued sponsorship for the program? The answer is simple: 100% of those problems that can be attributed to the organization’s triggers. When calculating this metric, count the number of investigations performed relative to the number of triggers met. In doing so, the organization will be able to determine if the program is being consistently executed. If the triggers are too aggressive, and a low percentage of investigations are performed, then the triggers need to be refined to ensure adequate capacity for RCA. This is why we start with triggers.
Percent of Corrective Actions Implemented
Problems will not go away unless corrective actions, identified through formal RCA, are implemented. This metric evaluates the organization’s discipline to implement corrective actions. A reasonable target is 80% of the identified solutions that do not require capital investment. Using this target turns the organization’s attention towards those solutions that are within the control of the local organization. In many cases, changes to standard operating
procedures and maintenance practices are identified and completely within the organization’s ability to implement. As we have discussed, the RCA team is responsible for evaluating proposed solutions prior to presenting the results of the investigation to leadership. Their evaluation criteria should consider whether or not each solution is within the organization’s ability to implement without external constraints.
Mean Time to Implement Corrective Actions
In the event that the percent of corrective actions implemented is below the agreed upon target, the organization should evaluate their capacity to execute solutions. The first of two (2) metrics that will enable decisions to be made relative to corrective action implementation is the mean time to implement. This metric will help identify constraints relative to the maintenance backlog, or the total volume of maintenance work divided by the number of net available labor hours per week. Ideally, corrective actions will be implemented within 30 days. This metric is looking for the mean, the average lead-time, so some solutions may take longer or may be implemented sooner than 30 days. A mean time greater than 30 days may be the result of a maintenance backlog greater than 6 weeks - meaning new work orders that enter the backlog will take longer than 6 weeks to plan, schedule, and execute due to labor and/or material constraints. With this metric in place, the organization can determine if additional improvements are required within the maintenance work management process in order to fully realize the benefits of the RCA program.
Percent of Maintenance Labor Consumed by RCA Corrective Action Resolution
If the mean time to implement corrective actions is within the desired target, but a low percentage of corrective actions are being implemented, the organization must look at the percent of maintenance labor consumed by RCA corrective action resolution.

© 2014 Allied Reliability Group Page 17
To enable this metric, the computerized maintenance management or enterprise asset management system must contain a work order code that links the consumption of labor and materials to RCA corrective actions. With this visibility within the work order system, the organization can ascertain whether or not the RCA program is causing an increase in maintenance backlog, thus preventing more solutions from being implemented – “flooding the system” so to speak – or if the volume of available labor hours per week is insufficient due to other, higher priority work orders. It is not uncommon within a new RCA program to still have a lot of “firefighting” going on. These emergent work orders consume maintenance labor that could be otherwise allocated to permanently resolving the same issues that are causing the reactive behavior. Having this metric in place allows the organization to make priority decisions in the short term that will improve results long term.
Percent of Problems Resolved within 90 days
Up to this point, the organization has evaluated its capacity to apply the RCA process, and made decisions to improve the implementation of corrective actions. Next it is important to evaluate the results. First, the organization should evaluate the effectiveness of solutions in the short term. Using the triggers identified by the organization, calculate the percent of problems (i.e. triggers met) that did not reoccur within 90 days of corrective action implementation. For example, if a critical asset failure resulted in more than 4 hours of downtime, and this was a trigger for the production area, run a maintenance history report, using the asset identification number and the failure code associated with the trigger, for the last 90 days and determine if the same event occurred after implementation of the corrective actions. If the event did not reappear in the history report, it can be considered a short-term victory and should be reevaluated at the 12-month mark. If the event did occur after corrective actions
were implemented, the RCA Facilitator should reopen the investigation and determine, using the Failure Mode and Effects Analysis technique, if the event was a result of a root cause that was not identified in the first investigation, or if the solutions implemented were insufficient in resolving the problem. This is known as a dynamic RCA and proves the point why it is important to retain a formal record of each investigation.
Overall, the focus of this metric is not to achieve perfection, but instead should focus on opportunities to improve the application of investigation and problem solving techniques, and increase the organization’s understanding of repetitive problems in order to successfully eliminate root causes. With new RCA programs, a good target for this metric would be 60%. As organizational maturity increases, and reactive practices are replaced with proactive solutions, a target of 100% is not unrealistic at the 90-day interval.
Percent of Problems Resolved within 12 months
This metric is similar to the 90-day metric; however, the intent of this metric is to determine if the corrective actions implemented were sustainable. The calculation is similar, just broadening the history report to 12 months rather than 90 days. A good target would be 100% of those problems that were resolved at the 90-day interval and 60% of those that were still evident at 90 days. Using both the 90-day and 12-month metrics to evaluate solution effectiveness ensures that program successes do not go unrecognized and provides a series of milestones from which the organization can gauge program maturity. Those problems that are unsuccessfully resolved within 12 months may require help from external resources in order to bring additional knowledge and perspectives to the analysis. These events should also be prioritized if capital solutions were identified but not provisioned for during the short-term corrective action selection process.

© 2014 Allied Reliability Group The Basics of Root Cause Analysis
Percent of Assets Analyzed with Increasing Mean Time Between Failure
The ultimate goal of the RCA program, relative to asset and process reliability, is to see an increase in asset Mean Time Between Failures (MTBF), or the average duration between functional failures, regardless of failure mode. This metric can be easily translated into organizational value. If the asset is available to operations over longer periods of time, and assuming the product(s) produced by the asset are in demand or “sold out”, then every hour of additional availability equates to more revenue or contribution margin for the organization. As the MTBF increases, the window of asset availability increases, but the frequency of maintenance activity also decreases. As a result, the organization can also relate increases in MTBF to reductions in maintenance material and contract or overtime labor costs.
For this metric, the organization must be capable of tracking failure and maintenance history within the computerized maintenance management or enterprise asset management system using event or time stamps. Typically, this metric is not calculated within the first 12 months of RCA program deployment; however, to enable this metric, the organization will need to set a baseline MTBF for each asset triggering a root cause investigation. After the first 12 months, compare the current MTBF of assets analyzed through the RCA process against the initial baselines collected within the Recognize phase. Then calculate the percent of assets analyzed that have an increasing MTBF. There is no set target; the results of this metric should be trended over time as a measuring stick for program maturity. On a per asset basis, however, it is recommended that results be shared with leadership in order to demonstrate the value realized by the organization from RCA and sustain sponsorship for continued deployment.
About Allied Reliability Group Allied Reliability Group (ARG) offers best-in-industry maintenance, reliability, and operational consulting and services, training, staffing, and integrated software solutions servicing the industrial and manufacturing sector.
Reliability… it's in our DNA.
For more information about Allied Reliability Group, please contact:
Global Headquarters 843.414.5760 [email protected] www.alliedreliabilitygroup.com