the behavior of rhenium and the platinum group … pitcher1 the behavior of rhenium and the platinum...
TRANSCRIPT
GEOL394 Pitcher1
The Behavior of Rhenium and the Platinum Group Elements during Fractional Crystallization of the
Kilauea Iki Lava Lake in Hawaii
Lynnette L. Pitcher1, Richard J. Walker1 and Rosalind T. Helz2 1-Dept of Geology, Univ. MD, College Park, MD 20742
2-U.S. Geological Survey, Reston, VA Abstract
Through the use of the isotope dilution method, concentrations of Rhenium and the Platinum
Group Elements in basalts from the Kilauea Iki lava lake were measured in order to improve our
understanding of the behavior of these elements during volcanic events. The lava lake was
formed as a result of the 1959 eruption of the Kilauea volcano. Olivine was the dominant phase
during eruption and fractional crystallization of the lake. The lake has a high average MgO
content of approximately 15.5%. In the basalts studied MgO varies from 26.8 to 2.3 wt%.
Osmium and Ruthenium behave as compatible trace elements with a positive correlation with
MgO. Iridium did not correlate as well as osmium and ruthenium but also appears to be
incompatible. Rhenium, Palladium, and Platinum do not well correlate with MgO, although both
Re and Pd tend to decrease with increasing Mgo, consistent with incompatible trace element
behavior. The poor correlation may be an indication that the abundances are controlled by a
phase other than olivine. The low abundances and variability of Re may also be the result of
degassing during the eruption Kilauea volcano.
Introduction The behavior of Rhenium (Re) and the Platinum Group Elements (PGE) are studied in a picritic
system, the Kilauea Iki Lava Lake (KILL), Hawaii. The investigation documents the
compatibility or incompatibility of these elements by determining their concentrations in KILL
samples as a function of known crystal-liquid fractionation sequence (e.g. MgO content in each
rock). Concentration variations are used to estimate bulk-distribution coefficients (D-values). I
have successfully measured the concentrations of these elements in sixteen of the basalts.
GEOL394 Pitcher2
Background
Problem The behavior of Re and PGE in mafic systems is not well understood due to their low
abundances; for this reason studying these elements in samples from the well-characterized
KILL will help improve our understanding of how these elements behave during injection and
crystallization of a magmatic system.
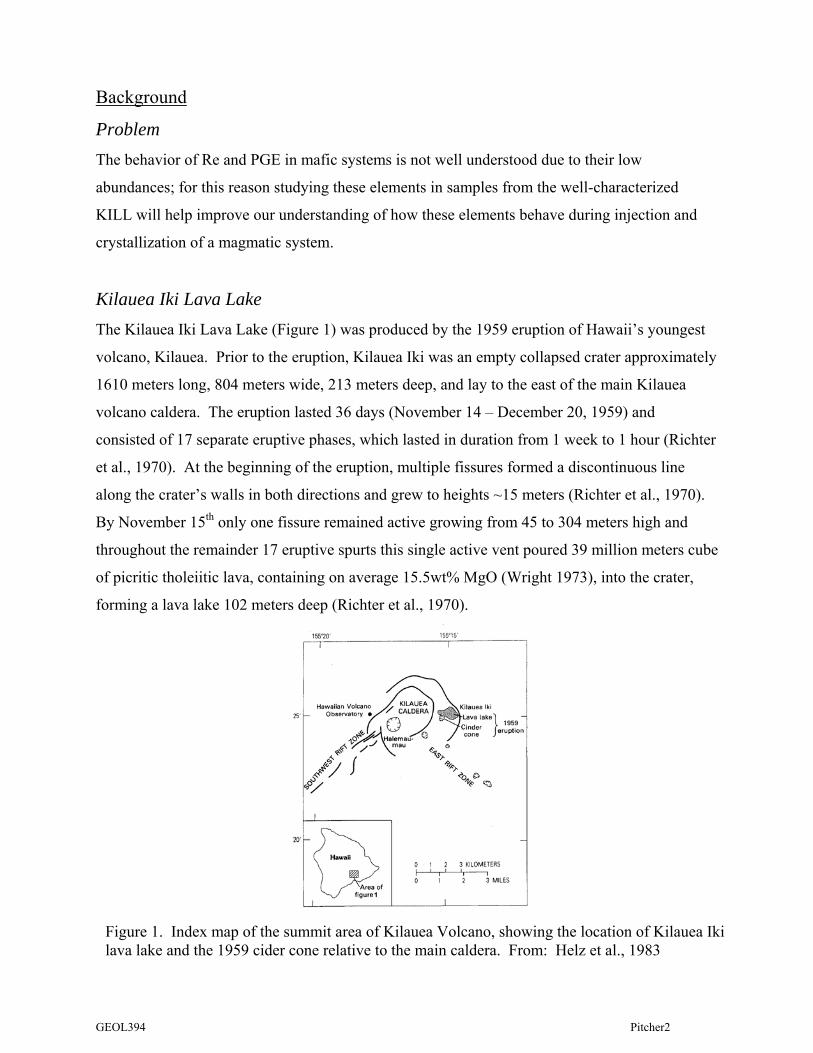
Kilauea Iki Lava Lake The Kilauea Iki Lava Lake (Figure 1) was produced by the 1959 eruption of Hawaii’s youngest
volcano, Kilauea. Prior to the eruption, Kilauea Iki was an empty collapsed crater approximately
1610 meters long, 804 meters wide, 213 meters deep, and lay to the east of the main Kilauea
volcano caldera. The eruption lasted 36 days (November 14 – December 20, 1959) and
consisted of 17 separate eruptive phases, which lasted in duration from 1 week to 1 hour (Richter
et al., 1970). At the beginning of the eruption, multiple fissures formed a discontinuous line
along the crater’s walls in both directions and grew to heights ~15 meters (Richter et al., 1970).
By November 15th only one fissure remained active growing from 45 to 304 meters high and
throughout the remainder 17 eruptive spurts this single active vent poured 39 million meters cube
of picritic tholeiitic lava, containing on average 15.5wt% MgO (Wright 1973), into the crater,
forming a lava lake 102 meters deep (Richter et al., 1970).
Figure 1. Index map of the summit area of Kilauea Volcano, showing the location of Kilauea Iki lava lake and the 1959 cider cone relative to the main caldera. From: Helz et al., 1983

GEOL394 Pitcher3
Weeks after the eruption, the surface cooled forming a solid layer, but with liquid remaining
inside for more than 30 years. Over the course of 30+ years, the lake cooled and crystallized
inward as a self-roofed magma chamber (Helz el at., 1989); essentially as a closed system where
there was no additional volcanic activity and minimal chemical weathering, and the chemistry of
the lake was not affected by the composition of the surrounding walls of the crater. While the
lava lake was solidifying, 23 successive series of deep boreholes were drilled into the lake (1960,
1961, 1962, 1967, 1975, 1976, 1979, and 1981) recovering roughly 1,200 m of drill core (Helz
1987), and giving an in-depth look at the differentiation of the lava lake (Figure 2). Samples
from these cores are the focus of this study.
The KILL is an ideal setting to investigate Re and PGE behavior in a closed system due to the
fact that the lava lake is:
1. A natural system that provided an opportunity to observe the behavior of these elements
in an environment where they occur in natural abundances.
2. A closed system; the lava lake has not been affected by additional volcanic activity (Helz
el at., 1989), chemical weathering (e.g. rain), etc.
3. With constant drilling, the natural course of crystallization, differentiation processes, and
composition of KILL can be monitored in detail (Helz el at., 1989).
Figure 2. -- Plan view of the post 1959 surface of Kilauea Iki. The small black dots show the locations of the network of leveling stations. Larger red dots are locations of holes drilled between 1967 and 1988. From: Helz et al., 1994
GEOL394 Pitcher4
4. The PGE and Re in KILL basalts have not previously been studied.
As a side benefit, the data generated from this study can contribute towards broadening
geological knowledge about the Earth’s deep mantle processes. Mantle melting is not
completely understood, so analyzing the end products of mantle melting is crucial to our
understanding of the mantle. With updated knowledge about the Earth’s mantle, educated
guesses can be made about element partitioning and mantle processes on other planetary bodies;
particularly within the moon’s mantle where the composition may be similar to Earth’s.
Moreover, insight about hot spots can be enhanced; questions about why hot spots appear in the
mantle and why they arise at a particular spot can be potentially answered.
Platinum Group Elements (PGE) Platinum (Pt), Palladium(Pd), Iridium (Ir), Ruthenium (Ru), Rhodium (Rh), and Osmium (Os)
together form a group of elements known either as the Platinum Group Elements (PGE), the
Platinum Group Metals (PGM), or the Precious Metals (PM). These elements are highly
chalcophile (sulfur loving), and are called PM because they’re the rarest elements commonly
found together in Earth’s crust and are mined dominantly in Russia and South Africa. They have
similar physical properties, e.g. high density and melting points, and are non reactive with other
elements and ions. Platinum and Pd are found in nature as pure forms while the other PGE occur
in nature as natural alloys with platinum and gold. Platinum has multiple uses, for example it
acts as a catalyst for the control of automobile and industrial plant emissions, and for the
production of acids, organic chemicals, and pharmaceuticals. The PGE are used to make
reinforced plastic, electrical contacts, conductive and resistive films in electronic circuits, and in
jewelry (Mineral Info. Institute).
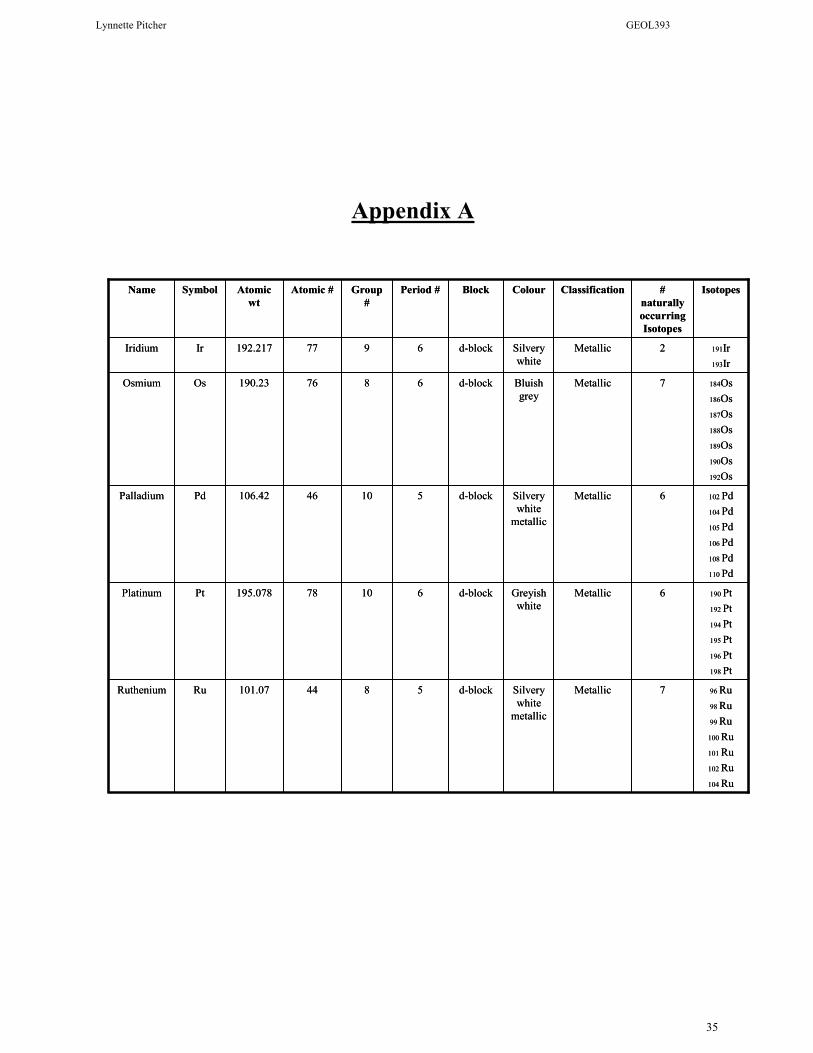
For this thesis project Rh was not measured because it has only one stable isotope; elements with
at least two stable isotopes are required in order to conduct isotope dilution. Standard
information about the PGE is given in appendix A.
Rhenium (Re) Rhenium is a silvery white metal with a metallic luster. It is a chalcophile element and is found
in nature as a minor component in the mineral gadolinite. It has an atomic mass of 186.207,
GEOL394 Pitcher5
atomic number of 75, and has two naturally occurring isotopes (185Re, 187Re). Rhenium is used
for mechanical and chemical purposes (e.g. wires in photography flash lamps).
Fractional Crystallization Fractional Crystallization (FC) is an igneous process during which the crystallizing mineral is
physically separated from the parental magma so that the two phases can no longer maintain
chemical equilibrium (the newly formed crystals do not further interact/equilibrate with the
melt). FC is important in geochemistry because it can lead to the major changes in melt
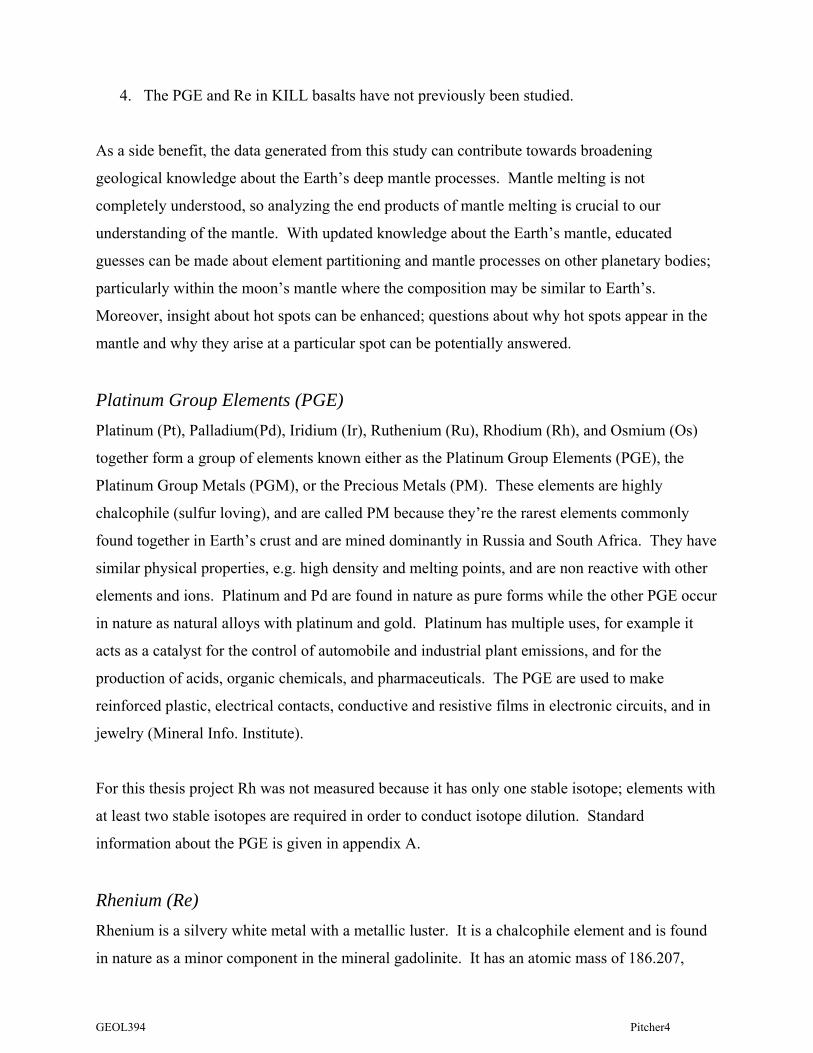
compositions. Figure 3 is a Fenner diagram from Winter (2001) showing the effects of olivine
crystallization on a variety of major elements for the 1959 eruption of the Kilauea volcano.
The Partition Coefficient The partition coefficient (Kd) is important in crystal-liquid fractionation because it is a measure
of the incompatibility or compatibility of a trace element in a mineral. Trace elements rarely
Figure 3. Variation diagram using MgO as the abscissa (sometimes called a “Fenner” diagram) for lavas associated with the 1959 Kilauea eruption in Hawaii. The parent melt (asterisks) was estimated from the most primitive glass found. Subsequent studies have suggested that the parent melt had MgO of about 15.5 wt.%. All the variation can be accounted for by the extraction and accumulation of olivine phenocrysts (after Murata and Richter, 1966, as modified by Best, 1982). From: Winter 2001.
GEOL394 Pitcher6
form their own phases; therefore they must reside in major or minor mineral phases. To be
compatible or incompatible refers to a trace element’s preference to replace a major element in
available sites in the crystal structure of a mineral; an incompatible element favors the melt; a
compatible element favors the solid. A Kd value is the concentration of an element in a
crystallizing mineral divided by the concentration of the element in the melt from which the
mineral is crystallizing.
The Bulk Distribution Coefficient The bulk distribution coefficient (D-values) differs from the partition coefficient in that D-values
are used to deal with multiple mineral systems; but like the partition coefficient, D-values reflect
the compatibility or incompatibility of a trace element. The equation to calculate the D-Value is
given below, where D > 1 is a compatible element and D < 1 is an incompatible element.
⎥⎥⎦
⎤
⎢⎢⎣
⎡⎟⎟⎠
⎞⎜⎜⎝
⎛⎟⎟⎠
⎞⎜⎜⎝
⎛
⎥⎥⎦
⎤
⎢⎢⎣
⎡⎟⎟⎠
⎞⎜⎜⎝
⎛⎟⎟⎠
⎞⎜⎜⎝
⎛
⎥⎥⎦
⎤
⎢⎢⎣
⎡⎟⎟⎠
⎞⎜⎜⎝
⎛⎟⎟⎠
⎞⎜⎜⎝
⎛++=−
Zmineral
ofdK
Zmineralof fraction
....Bminearl
ofdK
Bmineral offraction
Amineral
ofdK
Amineralof fraction
ValueD
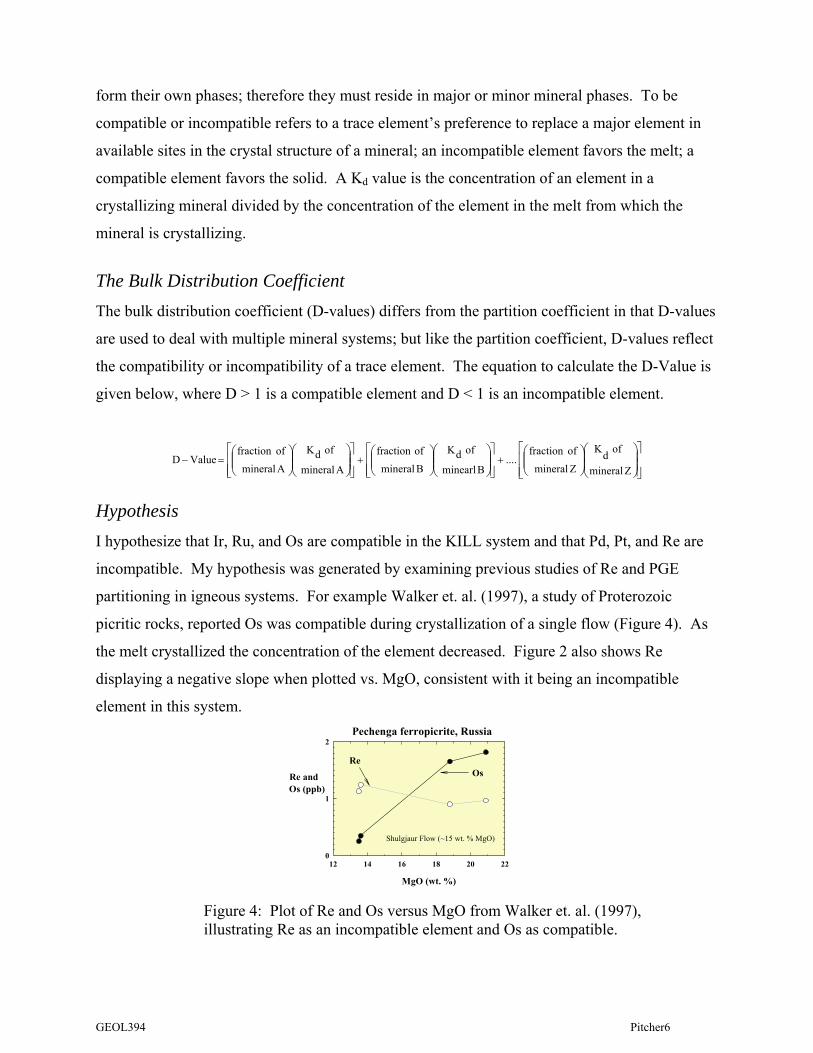
Hypothesis I hypothesize that Ir, Ru, and Os are compatible in the KILL system and that Pd, Pt, and Re are
incompatible. My hypothesis was generated by examining previous studies of Re and PGE
partitioning in igneous systems. For example Walker et. al. (1997), a study of Proterozoic
picritic rocks, reported Os was compatible during crystallization of a single flow (Figure 4). As
the melt crystallized the concentration of the element decreased. Figure 2 also shows Re
displaying a negative slope when plotted vs. MgO, consistent with it being an incompatible
element in this system.
12 14 16 18 20 220
1
2
MgO (wt. %)
Re and Os (ppb)
OsRe
Pechenga ferropicrite, Russia
Shulgjaur Flow (~15 wt. % MgO)
Figure 4: Plot of Re and Os versus MgO from Walker et. al. (1997), illustrating Re as an incompatible element and Os as compatible.

GEOL394 Pitcher7
Brenan et. al. (2005) reported the olivine-melt partition coefficients (Kd) of some PGE for an
experimental system. Figure 5 shows how the olivine-melt partition coefficients (Kd) of the PGE
and Re vary with decreasing Oxygen Fugacity (ƒO2). It illustrates Ir and Ru as compatible and
Pd, Ru, Pt, and Re as incompatible. Note how the Kd values of Ir and Ru increase with
decreasing log ƒO2 (Kd > 1). Observe also that Ru, Pd, Pt, and Re Kd values decrease with
decreasing log ƒO2 (Kd< 1), but Re is more incompatible than the other elements.
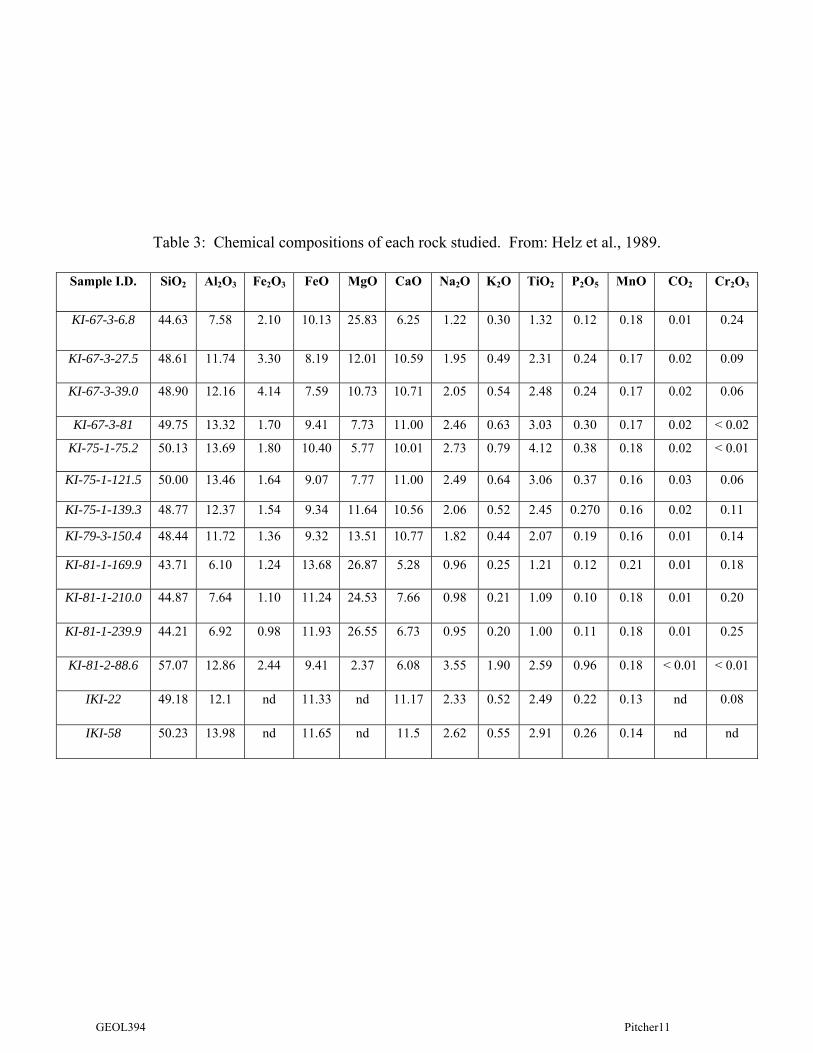
Sample Descriptions Tables 1-3 and Figure 6 describe and classify the rocks and thin-sections and their compositions.
All the cores and thin-sections used were obtained by Dr. Rosalind Helz from the United States
Geological Survey (USGS). The samples are recoveries from the 1967, 1975, 1979, and 1981
drillings (Helz el at., 1989) as shown in Figure 6. The Kilauea Iki rocks range from olivine rich
cumulates, olivine tholeiites to ferrodiabase, and silicic veins, all of which were produced by
internal differentiation in the lava lake (Tomascak el at., 1999).
Figure 5: Graph from Brenan et. al. (2005) illustrating how the olivine-melt partitioning coefficients (Kd) of the PGE and Re vary with decreasing log ƒO2.

GEOL394 Pitcher8

GEOL394 Pitcher9
Table 1. Sample Chart. Samples examined for this study, in decreasing MgO content, and their identification numbers. The check marks (√) indicates which rock I have a thin-section of, and the X indicates which cores I do not have a thin-section of. From: (Helz1989
Sample I.D. MgO (wt%) Thin-Section
KI-81-1-169.9 26.87** VORB (Vertical Olivine Rich Bodies)
contains glass KI-81-1-239.9 26.55
Contains glass KI-67-3-6.8 25.83 X
Phase 4 & 5 of eruption
KI-81-1-210.0 24.5 X Contains glass
Iki-22 19.52 KI-79-3-150.4 13.5 X KI-67-3-27.5 12 KI-75-1-139.3 11.7 X
Contains glass KI-67-3-39.0 10.73
Iki-58 8.08 KI-67-3-81 7.73
Contains glass KI-75-1-121.5 7.5 KI-75-1-75.2 5.77
Segregation vein KI-67-2-85.7 2.60* X KI-81-2-88.6 2.37* X
Vein – in - vein *(Sample with the lowest amount of MgO).
**(Sample with the highest amount of MgO)

GEOL394 Pitcher10
Sample # Textures Minerals Present an their % Abundance
Color Index (CI)
Rock Name
KI-67-3-6.8 Vesicular
Aphanitic
porphyritic
Olivine (green mineral)
85%
Mafic 70-85%
Vesicular Porphyritic
Aphanitic Basalt
KI-75-1-75.2 Vesicular
Aphanitic
Plagioclase (white elongated
minerals)
70%
Olivine (green minerals)
10%
Mafic 45-85%
Vesicular Aphanitic Basalt
KI-75-1-121.5 Aphanitic Plagioclase (white minerals)
90%
Olivine (green minerals)
5%
Pyroxene (dark minerals)
5%
Mafic 50-85%
Basalt
KI-75-1-139.3 Aphanitic
porphyritic
Olivine (green minerals)
75%
Mafic 45-85%
Porphyritic Basalt
KI-81-1-169.9 Aphanitic
porphyritic
Olivine (green minerals)
90%
Mafic 45-85%
Porphyritic Basalt
KI-81-1-210.0 Aphanitic
porphyritic
Olivine (green minerals)
85%
Mafic 45-85%
Porphyritic Basalt
KI-81-1-239.9 Aphanitic
porphyritic
Olivine (green minerals)
90%
Mafic 45-85%
Porphyritic Basalt
Table 2: Hand Sample Classification. Descriptions of hand samples available, as listed in table 1, for classification. Note that that the hand samples and thin-sections were not available for all samples analyzed.
GEOL394 Pitcher11
Table 3: Chemical compositions of each rock studied. From: Helz et al., 1989.
Sample I.D. SiO2 Al2O3 Fe2O3 FeO MgO CaO Na2O K2O TiO2 P2O5 MnO CO2 Cr2O3
KI-67-3-6.8 44.63 7.58 2.10 10.13 25.83 6.25 1.22 0.30 1.32 0.12 0.18 0.01 0.24
KI-67-3-27.5 48.61 11.74 3.30 8.19 12.01 10.59 1.95 0.49 2.31 0.24 0.17 0.02 0.09
KI-67-3-39.0 48.90 12.16 4.14 7.59 10.73 10.71 2.05 0.54 2.48 0.24 0.17 0.02 0.06
KI-67-3-81 49.75 13.32 1.70 9.41 7.73 11.00 2.46 0.63 3.03 0.30 0.17 0.02 < 0.02
KI-75-1-75.2 50.13 13.69 1.80 10.40 5.77 10.01 2.73 0.79 4.12 0.38 0.18 0.02 < 0.01
KI-75-1-121.5 50.00 13.46 1.64 9.07 7.77 11.00 2.49 0.64 3.06 0.37 0.16 0.03 0.06
KI-75-1-139.3 48.77 12.37 1.54 9.34 11.64 10.56 2.06 0.52 2.45 0.270 0.16 0.02 0.11
KI-79-3-150.4 48.44 11.72 1.36 9.32 13.51 10.77 1.82 0.44 2.07 0.19 0.16 0.01 0.14
KI-81-1-169.9 43.71 6.10 1.24 13.68 26.87 5.28 0.96 0.25 1.21 0.12 0.21 0.01 0.18
KI-81-1-210.0 44.87 7.64 1.10 11.24 24.53 7.66 0.98 0.21 1.09 0.10 0.18 0.01 0.20
KI-81-1-239.9 44.21 6.92 0.98 11.93 26.55 6.73 0.95 0.20 1.00 0.11 0.18 0.01 0.25
KI-81-2-88.6 57.07 12.86 2.44 9.41 2.37 6.08 3.55 1.90 2.59 0.96 0.18 < 0.01 < 0.01
IKI-22 49.18 12.1 nd 11.33 nd 11.17 2.33 0.52 2.49 0.22 0.13 nd 0.08
IKI-58 50.23 13.98 nd 11.65 nd 11.5 2.62 0.55 2.91 0.26 0.14 nd nd
GEOL394 Pitcher12
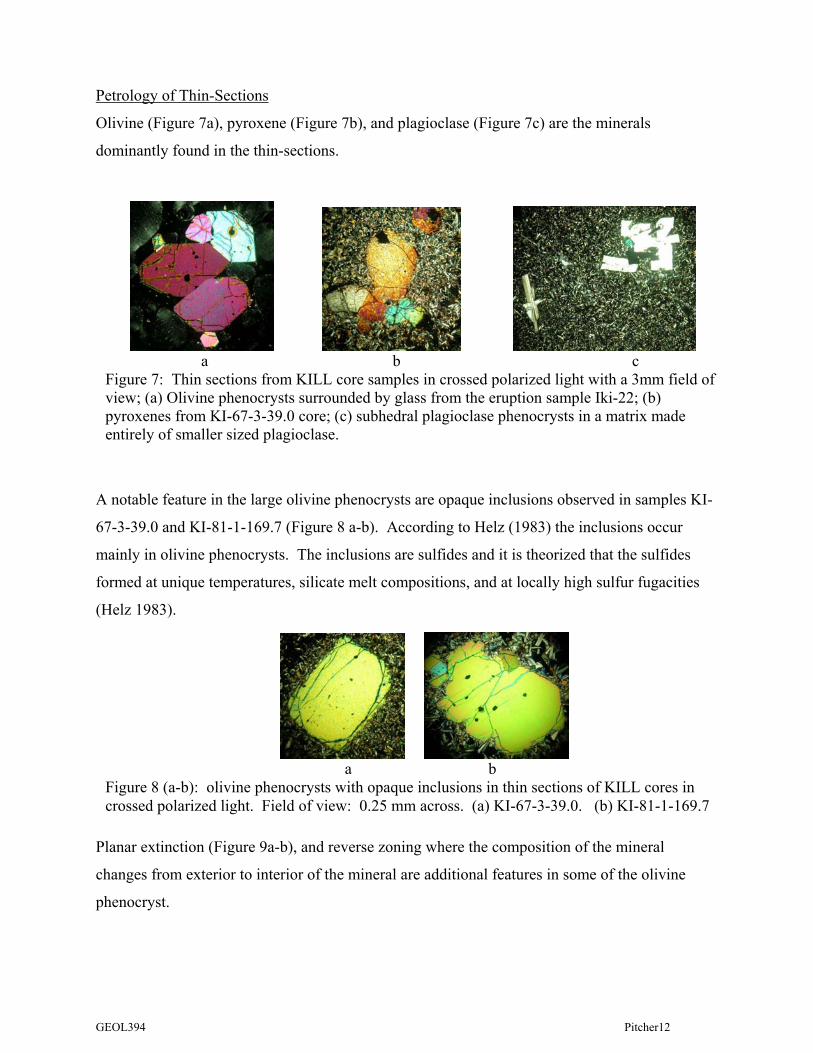
Petrology of Thin-Sections
Olivine (Figure 7a), pyroxene (Figure 7b), and plagioclase (Figure 7c) are the minerals
dominantly found in the thin-sections.
A notable feature in the large olivine phenocrysts are opaque inclusions observed in samples KI-
67-3-39.0 and KI-81-1-169.7 (Figure 8 a-b). According to Helz (1983) the inclusions occur
mainly in olivine phenocrysts. The inclusions are sulfides and it is theorized that the sulfides
formed at unique temperatures, silicate melt compositions, and at locally high sulfur fugacities
(Helz 1983).
Planar extinction (Figure 9a-b), and reverse zoning where the composition of the mineral
changes from exterior to interior of the mineral are additional features in some of the olivine
phenocryst.
a b
Figure 8 (a-b): olivine phenocrysts with opaque inclusions in thin sections of KILL cores in crossed polarized light. Field of view: 0.25 mm across. (a) KI-67-3-39.0. (b) KI-81-1-169.7
a b c Figure 7: Thin sections from KILL core samples in crossed polarized light with a 3mm field of view; (a) Olivine phenocrysts surrounded by glass from the eruption sample Iki-22; (b) pyroxenes from KI-67-3-39.0 core; (c) subhedral plagioclase phenocrysts in a matrix made entirely of smaller sized plagioclase.

GEOL394 Pitcher13
Another characteristic visible in some olivines are resorption rims (Figure 10). Resorption rims
indicate that the olivine phenocrysts were reacting with the remaining liquid at the time of
consolidation of the rock (McDonald el at., 1961).
Samples KI-67-2-85.5 and KI-79-3-158.0 exhibit a poikilitic texture where the pyroxene,
hypersthene occurs as oikocrysts (Helz 1987), the host crystal containing numerous inclusions of
plagioclase which they enveloped as the pyroxenes grew (Figure 11).
Figure 10: thin-section of KILL eruption pumice sample Iki-22. Field of view: 3mm across. The olivine phenocryst is surrounded by volcanic glass. Resorption rims are located around the edges of the mineral.
a b
Figure 9a-b: Thin sections from KILL core samples in crossed polarized light. Field of view: 3mm across. (a-b) Olivine phenocryst in sample KI-81-1-169.7, displaying planar extinction.
a b
Figure 11: thin-section of KILL cores. Field of view: 5mm across. (a) KI-79-3-158.0 and (b) KI-67-2-85.5 display poikilitic texture.
GEOL394 Pitcher14
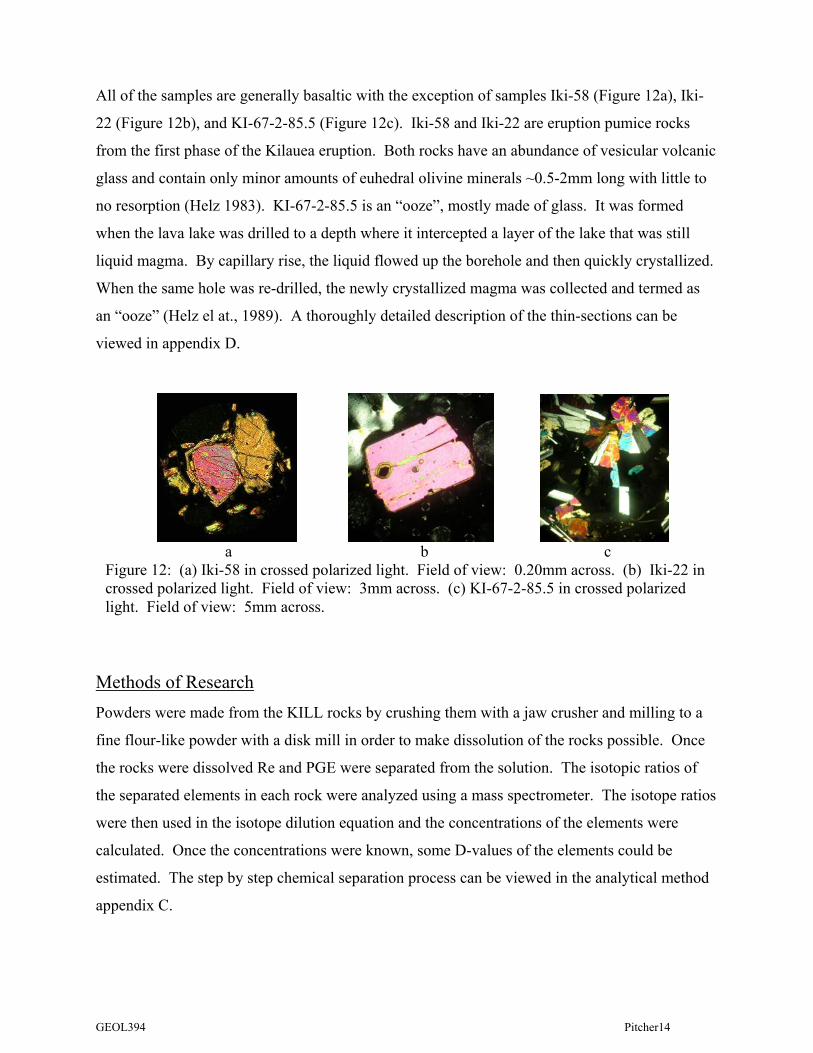
All of the samples are generally basaltic with the exception of samples Iki-58 (Figure 12a), Iki-
22 (Figure 12b), and KI-67-2-85.5 (Figure 12c). Iki-58 and Iki-22 are eruption pumice rocks
from the first phase of the Kilauea eruption. Both rocks have an abundance of vesicular volcanic
glass and contain only minor amounts of euhedral olivine minerals ~0.5-2mm long with little to
no resorption (Helz 1983). KI-67-2-85.5 is an “ooze”, mostly made of glass. It was formed
when the lava lake was drilled to a depth where it intercepted a layer of the lake that was still
liquid magma. By capillary rise, the liquid flowed up the borehole and then quickly crystallized.
When the same hole was re-drilled, the newly crystallized magma was collected and termed as
an “ooze” (Helz el at., 1989). A thoroughly detailed description of the thin-sections can be
viewed in appendix D.
Methods of Research Powders were made from the KILL rocks by crushing them with a jaw crusher and milling to a
fine flour-like powder with a disk mill in order to make dissolution of the rocks possible. Once
the rocks were dissolved Re and PGE were separated from the solution. The isotopic ratios of
the separated elements in each rock were analyzed using a mass spectrometer. The isotope ratios
were then used in the isotope dilution equation and the concentrations of the elements were
calculated. Once the concentrations were known, some D-values of the elements could be
estimated. The step by step chemical separation process can be viewed in the analytical method
appendix C.
a b c
Figure 12: (a) Iki-58 in crossed polarized light. Field of view: 0.20mm across. (b) Iki-22 in crossed polarized light. Field of view: 3mm across. (c) KI-67-2-85.5 in crossed polarized light. Field of view: 5mm across.

GEOL394 Pitcher15
Re-Os-(PGE) chemical separation techniques All materials used in the chemical separation needed to be cleaned. Teflon vessels, carius tubes,
centrifuge tubes, pipetter tips and transfer pipetters were “acid-washed” in concentrated acids in
order to remove any residual contamination (Figure 13a). After cleaning the equipment,
appropriate weights of the Os, Re, and other HSE (Highly Siderophile Elements) spikes were
calculated on a spread sheet based on the MgO wt% in the rock. In grams, the powders, spikes,
and acids were added to the carius tubes (Table 4). Once done each tube was taken to the
mineral separation lab, sealed with a torch, placed in a metal jacket, and heated in an oven to
260°C from 12 hours to a week (Figure 13b-c).
a b c
Table 4. The Kilauea Iki cores used in the studied and the amounts of sample powders and spike weights added to carious tubes. Samples are listed with decreasing MgO content
Sample ID MgO
Content (wt.%)
Sample wt. (g)
Os spike wt. (g)
Quantity of Os spike
added (ng)
Re spike wt. (g)
Quantity of Re spike
added (ng)
HSE spike wt.
(g)
KI-81-1-169.9 26.87 1.96035 0.03826 0.5156 0.03826 0.1287 0.07313 KI-81-1-239.9 26.55 1.74627 0.34760 0.6785 0.45487 1.7226 0.40906 KI-67-3-6.8 25.83 1.78182 0.3110 0.60704 0.68780 2.6047 0.41630
KI-81-1-210.0 24.5 2.01383 0.33207 0.64817 0.47933 1.8152 0.48680 IKI-22 19.52 2.01862 0.03458 0.4660 0.03458 0.1163 0.07307
KI-79-3-150.4 13.5 2.16700 0.10407 0.20313 0.51161 1.9375 0.44369 KI-67-3-27.5 12 1.79777 0.11456 0.22361 0.50601 1.9163 0.44351
KI-75-1-139.3 11.7 1.75684 0.11529 0.22503 0.45968 1.7408 0.37934 KI-67-3-39.0 10.73 2.03020 0.16787 0.32767 0.51423 1.9474 0.44347
IKI-58 8.08 1.78061 0.55839 0.07537 0.38245 1.4483 0.20968 KI-67-3-81 7.73 2.04286 0.54567 0.07365 0.52512 1.9886 0.22187
KI-75-1-121.5 7.5 1.76284 0.18753 0.02531 0.41510 1.5720 0.20850 KI-75-1-75.2 5.77 2.30437 0.50497 0.06816 0.50935 1.9289 0.22249 KI-67-2-85.7 2.60 1.76317 0.18634 0.02515 0.43131 1.6334 0.20922 KI-81-2-88.6 2.37 2.28269 0.20036 0.20036 0.53280 2.0177 0.14720
Figure 13. (a) Carious tubes soaking in an “acid bath” of concentrated aqua regia (50% milli-q water, 25% HCl, and 25% HNO3). (b) Sealing a carius tube containing powders, spikes, and acids with a blow touch. (c) Carius tubes in a metal jacket and placed in an oven for digestion.

GEOL394 Pitcher16
The purpose of sealing and digesting the samples in carius tubes was to ensure that the powder,
acid + spike solution equilibrate. The Re and PGE elements were extracted from the sample into
the acid + spike solution. After digestion the Osmium Separation Procedures (OSP) was
performed. The digested powders and blanks were put into centrifuge tubes containing carbon
tetrachloride (CCl4) and centrifuged. After centrifuging the tubes containing CCl4 and aqua
regia; Os was attracted to the CCl4 while Re & the remaining PGE remained in the aqua regia.
The denser CCl4 is extracted from the centrifuge tubes and put into Teflon vessels containing
hydrobromic acid (HBr), where the HBr reduced the Os and stabilize it. The aqua regia was
placed to the side for later use. After the Os was completely reduced, it was transferred from the
CCl4 to the HBr. The CCl4 is removed and disposed of while the HBr is dried down under a heat
lamp. The Os can now be purified further by Osmium Micro-Distillation (OMD).
In OMD a small amount of HBr is added to the Os which is then transferred to the center of a
conical Teflon vessel cap and dried down under the heat lamp. After the HBr on the cap is dried,
HBr is added the tip of the Teflon conical vessel and dichromate is added to the Os on the cap.
The conical Teflon vessel is inverted, screwed onto the cap, wrapped in aluminum foil, and
heated to ~80°C in a heat block (Figure 14). The purpose of having the conical vessel inverted is
to have the HBr on the top of the Teflon conical vessel, so when the Os evaporates from the
dichromate and rises, it is trapped in the small amount of HBr. After heating overnight in a heat
block, the caps are unscrewed from the conical vessels, the caps are rinsed, and the conical
vessels containing the HBr are dried under a heat lamp. The Os is now ready for loading into the
mass spectrometer.
Figure 14. Inverted conical vessels wrapped in aluminum foil and heated in a heat block during Osmium Micro-Distillation.

GEOL394 Pitcher17
The Re and remaining PGE in the aqua regia is dried down, diluted with low molarity HNO3,
centrifuged to remove residual sludge, and then eluted onto an anion exchange column (Figure
15). In dilute HCl or HNO3, these elements will stick to the anion resin, whereas most other rock
components will not and wash through the column. Rhenium & PGE are washed off the
columns with high molarity HNO3 and HCl. The Teflon vessels containing the Re, Ru, Pt, Ir,
and Pd are dried under a heat lamp and then analyzed with an Inductively-Couple Plasma Mass
Spectrometer (ICP-MS).
Mass Spectrometer A mass spectrometer is an instrument used to measure isotope abundances by sending ions
through a magnetic field. The ions are separated on the basis of their masses and then the
relative intensities of the different isotopes are measured and the isotopic ratios for each rock can
be measured. Determining the isotope ratio is important because the ratio values are used in the
isotope dilution equation to solve for the concentration of a particular element.
Measuring the relative intensities of the Os isotopes is done with the Thermal Ionization Mass
Spectrometer (TIMS) (Figure 16a). The first step is to clean the filaments by removing used Pt
ribbons from posts and filing the sides of the filaments’ posts; this step eliminates cross sample
contamination in the mass spectrometer. New Pt ribbons were attached to the sides of the posts
by using copper electrode in a welding machine. Next the ribbons and their filaments are
degassed in a degassing machine to get rid of any contamination on the filament posts and on the
ribbon. The ribbons and filaments were allowed to cool over night and then the samples were
loaded onto the ribbons. To do this the filaments have to be screwed into the filament holder and
placed on the degassing machine. The Os sample from the chemical separation is placed on the
Figure 15. Anion exchange columns, separating Re, Pt, Pd, Ir, and Ru by washing them out of the anion resin with concentrated acids.

GEOL394 Pitcher18
ribbon in HBr, dried, then Ba(OH)2 is added. Once the ribbon is dry the filament can then be
loaded into the mass spectrometer for analysis. Rhenium, Ru, Ir, Pt, and Pd were analyzed with
the ICP-MS (Figure 16b). An ICP-MS has the same basic functions as a TIMS, but do not
require the use of filaments and filament ribbons. The elements are in 0.8M HNO3 solution.
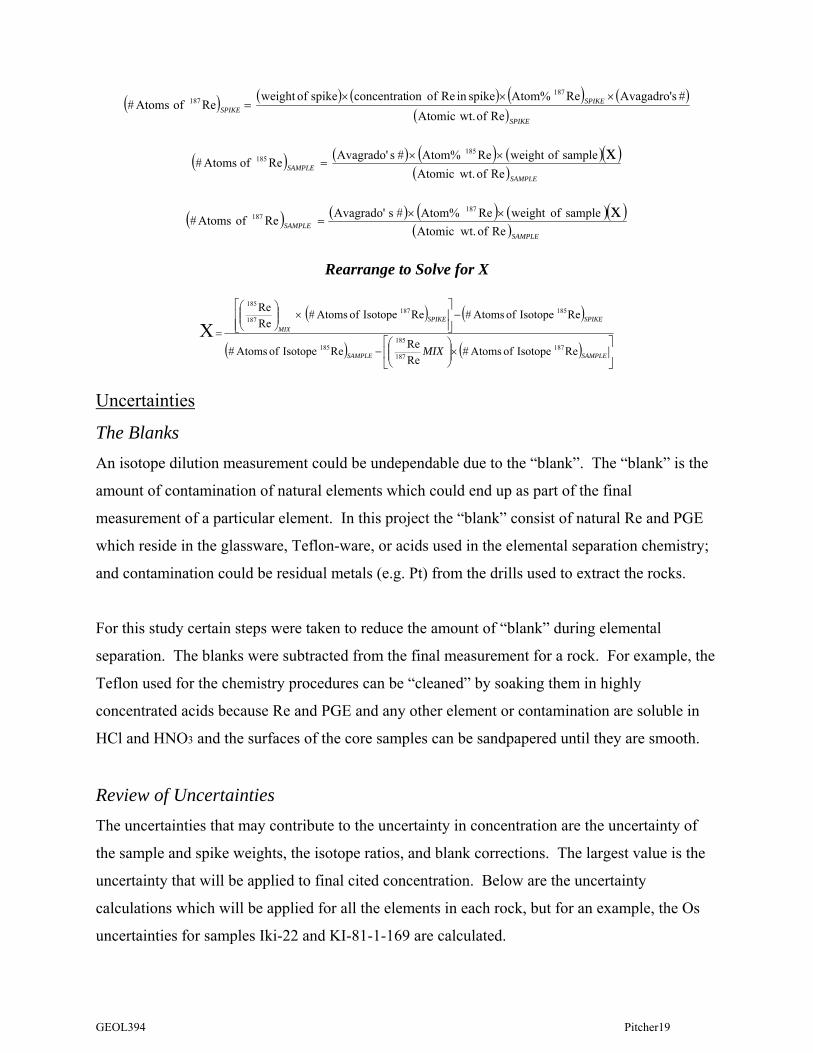
Isotope Dilution Isotope dilution is a process where a known amount of an isotopically enriched ‘spike’ is added
to a sample. The measured isotopic composition of the mix can be used to calculate the
concentration of the element. For an example the isotope dilution equation is given below where
the number of atoms of 185Re and 187Re, in the spike, and the isotope ratio are the knowns. The
only component not known is the concentration of Re in the sample. Rearranging the equation to
solve for X, the concentration of Re.
Isotope Dilution Equation
( ) ( )( ) ( )SAMPLESPIKE
SAMPLESPIKE
MIX ReIsotope of Atoms #ReIsotope of Atoms #ReIsotope of Atoms #ReIsotope of Atoms #
ReRe
187187
185185
187
185
++
=⎟⎟⎠
⎞⎜⎜⎝
⎛
The Knowns
( ) ( ) ( ) ( ) ( )( )SPIKE
SPIKESPIKE Reofwt.Atomic
#sAvagadro'ReAtom% spikeinReofion concentratspikeofweightReof Atoms#
185185 ×××
=
Figure 16. (a) Thermal Ionization Mass Spectrometer. (b) Inductively-Couple Plasma Mass Spectrometer
GEOL394 Pitcher19
( ) ( ) ( ) ( ) ( )( )SPIKE
SPIKESPIKE Reofwt.Atomic
#sAvagadro'ReAtom% spikeinReofion concentratspikeofweightReofAtoms#
187187 ×××
=
( ) ( ) ( ) ( )( )
( )SAMPLESAMPLE Reofwt.Atomic
sample ofweight ReAtom% # sAvagrado'Reof Atoms# x185185 ××
=
( ) ( ) ( ) ( )( )
( )SAMPLESAMPLE Reofwt.Atomic
sample ofweight ReAtom% # sAvagrado'Reof Atoms# x187187 ××
=
Rearrange to Solve for X
( ) ( )
( ) ( ) ⎥⎦
⎤⎢⎣
⎡×⎟⎟⎠
⎞⎜⎜⎝
⎛−
−⎥⎥⎦
⎤
⎢⎢⎣
⎡×⎟⎟
⎠
⎞⎜⎜⎝
⎛
=
SAMPLESAMPLE
SPIKESPIKEMIX
MIX ReIsotope of Atoms #ReReReIsotope of Atoms #
ReIsotope of Atoms #ReIsotope of Atoms #ReRe
187
187
185185
185187187
185
X
Uncertainties
The Blanks An isotope dilution measurement could be undependable due to the “blank”. The “blank” is the
amount of contamination of natural elements which could end up as part of the final
measurement of a particular element. In this project the “blank” consist of natural Re and PGE
which reside in the glassware, Teflon-ware, or acids used in the elemental separation chemistry;
and contamination could be residual metals (e.g. Pt) from the drills used to extract the rocks.
For this study certain steps were taken to reduce the amount of “blank” during elemental
separation. The blanks were subtracted from the final measurement for a rock. For example, the
Teflon used for the chemistry procedures can be “cleaned” by soaking them in highly
concentrated acids because Re and PGE and any other element or contamination are soluble in
HCl and HNO3 and the surfaces of the core samples can be sandpapered until they are smooth.
Review of Uncertainties The uncertainties that may contribute to the uncertainty in concentration are the uncertainty of
the sample and spike weights, the isotope ratios, and blank corrections. The largest value is the
uncertainty that will be applied to final cited concentration. Below are the uncertainty
calculations which will be applied for all the elements in each rock, but for an example, the Os
uncertainties for samples Iki-22 and KI-81-1-169 are calculated.
GEOL394 Pitcher20
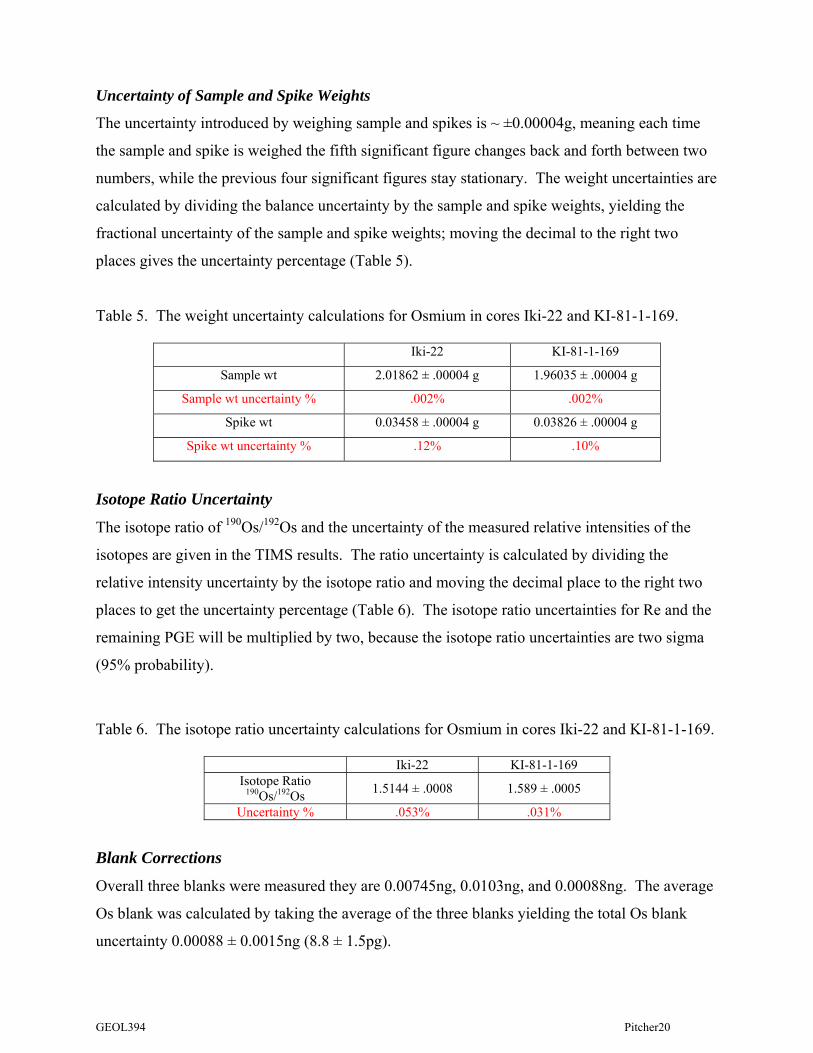
Uncertainty of Sample and Spike Weights
The uncertainty introduced by weighing sample and spikes is ~ ±0.00004g, meaning each time
the sample and spike is weighed the fifth significant figure changes back and forth between two
numbers, while the previous four significant figures stay stationary. The weight uncertainties are
calculated by dividing the balance uncertainty by the sample and spike weights, yielding the
fractional uncertainty of the sample and spike weights; moving the decimal to the right two
places gives the uncertainty percentage (Table 5).
Table 5. The weight uncertainty calculations for Osmium in cores Iki-22 and KI-81-1-169.
Iki-22 KI-81-1-169
Sample wt 2.01862 ± .00004 g 1.96035 ± .00004 g
Sample wt uncertainty % .002% .002%
Spike wt 0.03458 ± .00004 g 0.03826 ± .00004 g
Spike wt uncertainty % .12% .10%
Isotope Ratio Uncertainty
The isotope ratio of 190Os/192Os and the uncertainty of the measured relative intensities of the
isotopes are given in the TIMS results. The ratio uncertainty is calculated by dividing the
relative intensity uncertainty by the isotope ratio and moving the decimal place to the right two
places to get the uncertainty percentage (Table 6). The isotope ratio uncertainties for Re and the
remaining PGE will be multiplied by two, because the isotope ratio uncertainties are two sigma
(95% probability).
Table 6. The isotope ratio uncertainty calculations for Osmium in cores Iki-22 and KI-81-1-169.
Iki-22 KI-81-1-169 Isotope Ratio
190Os/192Os 1.5144 ± .0008 1.589 ± .0005
Uncertainty % .053% .031%
Blank Corrections
Overall three blanks were measured they are 0.00745ng, 0.0103ng, and 0.00088ng. The average
Os blank was calculated by taking the average of the three blanks yielding the total Os blank
uncertainty 0.00088 ± 0.0015ng (8.8 ± 1.5pg).
GEOL394 Pitcher21
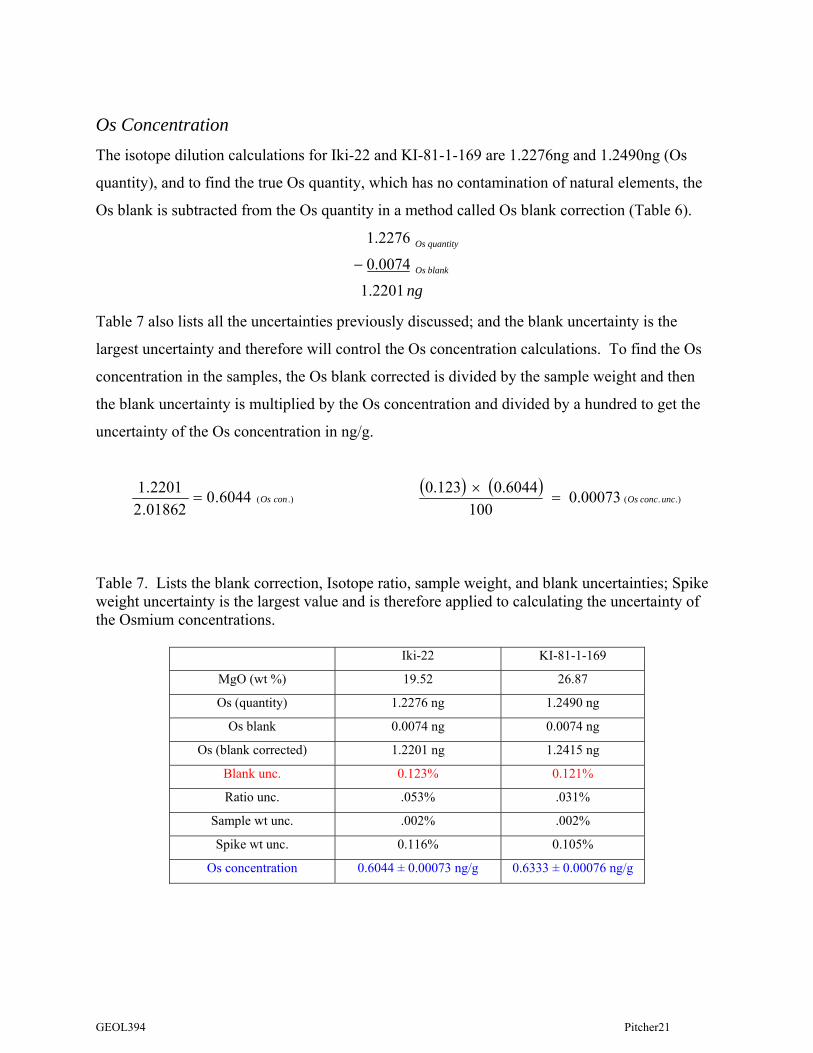
Os Concentration The isotope dilution calculations for Iki-22 and KI-81-1-169 are 1.2276ng and 1.2490ng (Os
quantity), and to find the true Os quantity, which has no contamination of natural elements, the
Os blank is subtracted from the Os quantity in a method called Os blank correction (Table 6).
ngblankOs
quantityOs
2201.1
0074.0
2276.1
−
Table 7 also lists all the uncertainties previously discussed; and the blank uncertainty is the
largest uncertainty and therefore will control the Os concentration calculations. To find the Os
concentration in the samples, the Os blank corrected is divided by the sample weight and then
the blank uncertainty is multiplied by the Os concentration and divided by a hundred to get the
uncertainty of the Os concentration in ng/g.
.)(6044.001862.22201.1
conOs= ( ) ( ).).(00073.0
1006044.0123.0
uncconcOs=×
Table 7. Lists the blank correction, Isotope ratio, sample weight, and blank uncertainties; Spike weight uncertainty is the largest value and is therefore applied to calculating the uncertainty of the Osmium concentrations.
Iki-22 KI-81-1-169
MgO (wt %) 19.52 26.87
Os (quantity) 1.2276 ng 1.2490 ng
Os blank 0.0074 ng 0.0074 ng
Os (blank corrected) 1.2201 ng 1.2415 ng
Blank unc. 0.123% 0.121%
Ratio unc. .053% .031%
Sample wt unc. .002% .002%
Spike wt unc. 0.116% 0.105%
Os concentration 0.6044 ± 0.00073 ng/g 0.6333 ± 0.00076 ng/g

GEOL394 Pitcher22
Results The MgO content and concentrations measured for Re and the PGE are listed in table 8 and then
plotted on separate graphs (Figure 17). On each graph the Residual (R2) value is included to
indicate how well the data points fit on the linear regression line. Osmium and Ru
concentrations range from 0.0006 to 1.06 ppb and 0.0034 to 2.01 ppb respectively. Plotted on a
graph with variation in MgO wt. %, Os and Ru behave as highly compatible elements with
positive correlations. Regressions for both elements have relatively high residual (R2) values of
0.865 (Ru) and 0.858 (Os), indicating a good linear correlation. Iridium concentrations were
measured between 0.0003 to 0.76 ppb and graphed; Ir does not correlate as well as Os and Ru
with a low R2 of 0.41.
Re has low concentrations (0.030 - 2.0) and a poor correlation to changes in MgO wt. %, with an
R2 of 0.32. Palladium concentrations ranges from 0.24 to 5.81 ppb and Pt concentrations are
1.15 to 10.4 ppb. Both elements have low R2 values of 0.021 (Pt) and 0.35 (Pd).
Sample ID MgO (wt. %) Os (ppb) Ir (ppb) Ru (ppb) Pt (ppb) Pd (ppb) Re (ppb)
KI-81-1-169.9 26.87 0.6333 0.3312 1.958 1.401 1.962 0.1511
KI-81-1-239.9 26.55 0.9669 0.4801 1.613 10.43 0.2474 0.03041
KI-67-3-6.8 25.83 1.065 0.3807 1.482 1.151 1.351 0.4186
KI-81-1-210.0 24.5 0.8207 0.7508 2.012 1.921 0.3490 0.03901
Iki-22 19.52 0.6044 0.3927 1.301 5.564 1.526 0.2247
KI-79-3-150.4 13.5 0.4343 0.5196 0.6264 3.102 2.463 0.2269
KI-67-3-27.5 12 0.2224 0.2668 0.5171 2.394 2.626 0.4306
KI-75-1-139.3 11.7 0.2403 0.7639 1.412 1.636 0.2868 0.06889
KI-67-3-39.0 10.73 0.1725 0.2252 0.4530 3.533 5.812 0.2985
IKI-58 8.08 0.05603 0.1651 0.4017 2.285 2.083 0.4141
KI-67-3-81 7.73 0.09690 0.1227 0.1588 2.360 3.169 0.2120
KI-75-1-121.5 7.5 0.02664 0.2127 0.2408 1.582 1.239 0.1873
KI-75-1-75.2 5.77 0.01044 0.0065 0.04781 2.620 3.605 0.9308
KI-67-2-85.7 2.6 0.1050 0.1170 0.1037 5.180 3.883 0.6261
KI-81-2-88.6 2.37 0.0006 0.0003 0.0034 3.924 3.125 2.0293
Table 8. Measured Re, Ir, Os, Pd, Pt, and Ru concentrations (ppb) in KILL cores of various MgO

GEOL394 Pitcher23
R2 = 0.3122
-0.1
0.4
0.9
1.4
1.9
2.4
0 5 10 15 20 25 30
MgO (wt%)
Re
(ppb
)
R2 = 0.4083
-0.1
0.0
0.1
0.2
0.3
0.4
0.5
0.6
0.7
0.8
0.9
0 5 10 15 20 25 30
MgO (wt.%)
Ir (p
pb)
R2 = 0.3479
-0.1
0.9
1.9
2.9
3.9
4.9
5.9
6.9
0 5 10 15 20 25 30
Mgo (wt.%)
Pd (p
pb)
R2 = 0.8646
-0.5
0.0
0.5
1.0
1.5
2.0
2.5
0 5 10 15 20 25 30
MgO (wt.%)
Ru
(ppb
)
R2 = 0.0214
0.0
2.0
4.0
6.0
8.0
10.0
12.0
0 5 10 15 20 25 30
MgO (wt.%)
Pt (p
pb)
R2 = 0.8582
-0.2
0.0
0.2
0.4
0.6
0.8
1.0
1.2
0 5 10 15 20 25 30
MgO (wt.%)
Os
(ppb
)
Figure 17. Plots of MgO (wt. %) versus Re, Os, Ir, Pt, and Ru concentrations (in ppb).

GEOL394 Pitcher24
Table 9. Iridium. The blank correction, Isotope ratio, sample weight, and blank uncertainties; the largest uncertainty (in red) is applied to calculating the uncertainty of the Iridium concentrations (in blue).
Sample ID MgO
Content wt.%
Ir (quantity)
ng
Ir Blank ng
Ir (blank corrected)
ng
Blank Unc. %
Ratio Unc. %
Sample wt
Unc. %
Spike wt
Unc. %
Ir Concentration
(ng/g)
KI-81-1-169.9 26.87 0.5080 0.000155 0.6492 0.10 0.14 0.0020 0.55 0.3311±0.0018 KI-81-1-239.9 26.55 0.8399 0.000155 0.8384 0.070 0.17 0.0023 0.10 0.4801±0.0008 KI-67-3-6.8 25.83 0.6787 0.0003 0.6784 0.090 0.66 0.0022 0.10 0.3807±0.0025
KI-81-1-210.0 24.50 1.5135 0.000155 1.5120 0.040 0.15 0.0020 0.080 0.7508±0.0011 Iki-22 19.52 0.7942 0.000155 0.7927 0.080 0.060 0.0020 0.55 0.3927±0.0021
KI-79-3-150.4 13.50 1.1262 0.0003 1.1259 0.060 0.14 0.0018 0.090 0.5196±0.0007 KI-67-3-27.5 12 0.4800 0.0003 0.4797 0.13 0.52 0.0022 0.090 0.2668±0.0013 KI-75-1-139.3 11.7 1.3436 0.000155 1.3421 0.050 0.10 0.0023 0.11 0.7639±0.0008 KI-67-3-39.0 10.73 0.4575 0.0003 0.4572 0.14 0.47 0.0020 0.090 0.2252±0.0010
IKI-58 8.08 0.2955 0.000155 0.2940 0.21 0.15 0.0022 0.19 0.1651±0.0003 KI-67-3-81 7.73 0.2510 0.0003 0.2507 0.25 1.36 0.0020 0.18 0.1227±0.0016
KI-75-1-121.5 7.5 0.3764 0.000155 0.3749 0.17 0.15 0.0023 0.19 0.2127±0.0004 KI-75-1-75.2 5.77 0.0152 0.0003 0.0149 4.20 2.06 0.0017 0.18 0.0065±0.0002 KI-67-2-85.7 2.6 0.2078 0.000155 0.2062 0.30 0.22 0.0023 0.19 0.1170±0.0003 KI-81-2-88.6 2.37 0.0010 0.0003 0.0007 83.97 8.70 0.0018 0.27 0.0003±0.0002
Table 10. Osmium. The blank correction, Isotope ratio, sample weight, and blank uncertainties; the largest uncertainty (in red) is applied to calculating the uncertainty of the Osmium concentrations (in blue)
Sample ID MgO
Content wt.%
Os (quantity)
ng
Os Blank ng
Os (blank corrected)
ng
Blank Unc. %
Ratio Unc. %
Sample wt
Unc. %
Spike wt
Unc. %
Os Concentration
(ng/g)
KI-81-1-169.9 26.87 1.2190 0.00745 1.2415 0.12 0.031 0.0020 0.10 0.6333±0.00076 KI-81-1-239.9 26.55 1.6973 0.0088 1.6885 0.090 1.14 0.0023 0.010 0.9669±0.01102 KI-67-3-6.8 25.83 1.9092 0.0103 1.8989 0.080 2.25 0.0022 0.010 1.065±0.2398
KI-81-1-210.0 24.50 1.6616 0.0088 1.6528 0.090 1.35 0.0020 0.010 0.8207±0.01108 Iki-22 19.52 1.2276 0.00745 1.2201 0.12 0.053 0.0020 0.12 0.6044±0.00073
KI-79-3-150.4 13.50 0.9515 0.0103 0.9412 0.16 3.08 0.0018 0.040 0.4343±0.00069 KI-67-3-27.5 12 0.4101 0.0103 0.3998 0.38 1.54 0.0022 0.030 0.2224±0.00342 KI-75-1-139.3 11.7 0.4309 0.0088 0.4221 0.36 1.90 0.0023 0.030 0.2403±0.00457 KI-67-3-39.0 10.73 0.3604 0.0103 0.3501 0.43 3.62 0.0020 0.020 0.1725±0.00624
IKI-58 8.08 0.1086 0.0088 0.0998 1.50 4.32 0.0022 0.010 0.0560±0.00242 KI-67-3-81 7.73 0.2083 0.0103 0.1980 0.76 3.16 0.0020 0.010 0.0969±0.00306
KI-75-1-121.5 7.5 0.0558 0.0088 0.0470 3.19 1.59 0.0023 0.020 0.0266±0.00085 KI-75-1-75.2 5.77 0.0344 0.0103 0.0241 6.24 3.07 0.0017 0.010 0.01044±0.0006 KI-67-2-85.7 2.6 0.1940 0.0088 0.1852 0.81 7.31 0.0023 0.020 0.105±0.00768 KI-81-2-88.6 2.37 0.0117 0.0103 0.0014 103.98 3.09 0.0018 0.020 0.0006±0.00062
GEOL394 Pitcher25
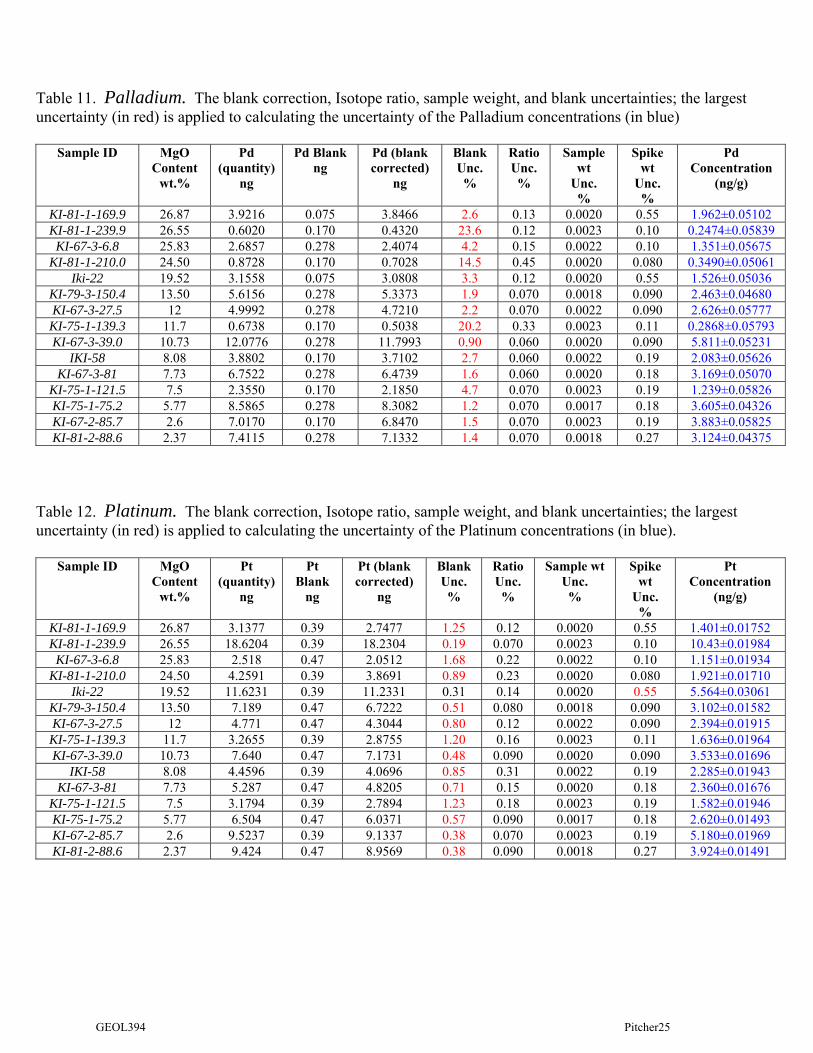
Table 11. Palladium. The blank correction, Isotope ratio, sample weight, and blank uncertainties; the largest uncertainty (in red) is applied to calculating the uncertainty of the Palladium concentrations (in blue)
Sample ID MgO
Content wt.%
Pd (quantity)
ng
Pd Blank ng
Pd (blank corrected)
ng
Blank Unc. %
Ratio Unc. %
Sample wt
Unc. %
Spike wt
Unc. %
Pd Concentration
(ng/g)
KI-81-1-169.9 26.87 3.9216 0.075 3.8466 2.6 0.13 0.0020 0.55 1.962±0.05102 KI-81-1-239.9 26.55 0.6020 0.170 0.4320 23.6 0.12 0.0023 0.10 0.2474±0.05839 KI-67-3-6.8 25.83 2.6857 0.278 2.4074 4.2 0.15 0.0022 0.10 1.351±0.05675
KI-81-1-210.0 24.50 0.8728 0.170 0.7028 14.5 0.45 0.0020 0.080 0.3490±0.05061 Iki-22 19.52 3.1558 0.075 3.0808 3.3 0.12 0.0020 0.55 1.526±0.05036
KI-79-3-150.4 13.50 5.6156 0.278 5.3373 1.9 0.070 0.0018 0.090 2.463±0.04680 KI-67-3-27.5 12 4.9992 0.278 4.7210 2.2 0.070 0.0022 0.090 2.626±0.05777 KI-75-1-139.3 11.7 0.6738 0.170 0.5038 20.2 0.33 0.0023 0.11 0.2868±0.05793 KI-67-3-39.0 10.73 12.0776 0.278 11.7993 0.90 0.060 0.0020 0.090 5.811±0.05231
IKI-58 8.08 3.8802 0.170 3.7102 2.7 0.060 0.0022 0.19 2.083±0.05626 KI-67-3-81 7.73 6.7522 0.278 6.4739 1.6 0.060 0.0020 0.18 3.169±0.05070
KI-75-1-121.5 7.5 2.3550 0.170 2.1850 4.7 0.070 0.0023 0.19 1.239±0.05826 KI-75-1-75.2 5.77 8.5865 0.278 8.3082 1.2 0.070 0.0017 0.18 3.605±0.04326 KI-67-2-85.7 2.6 7.0170 0.170 6.8470 1.5 0.070 0.0023 0.19 3.883±0.05825 KI-81-2-88.6 2.37 7.4115 0.278 7.1332 1.4 0.070 0.0018 0.27 3.124±0.04375
Table 12. Platinum. The blank correction, Isotope ratio, sample weight, and blank uncertainties; the largest uncertainty (in red) is applied to calculating the uncertainty of the Platinum concentrations (in blue).
Sample ID MgO
Content wt.%
Pt (quantity)
ng
Pt Blank
ng
Pt (blank corrected)
ng
Blank Unc. %
Ratio Unc. %
Sample wt Unc. %
Spike wt
Unc. %
Pt Concentration
(ng/g)
KI-81-1-169.9 26.87 3.1377 0.39 2.7477 1.25 0.12 0.0020 0.55 1.401±0.01752 KI-81-1-239.9 26.55 18.6204 0.39 18.2304 0.19 0.070 0.0023 0.10 10.43±0.01984 KI-67-3-6.8 25.83 2.518 0.47 2.0512 1.68 0.22 0.0022 0.10 1.151±0.01934
KI-81-1-210.0 24.50 4.2591 0.39 3.8691 0.89 0.23 0.0020 0.080 1.921±0.01710 Iki-22 19.52 11.6231 0.39 11.2331 0.31 0.14 0.0020 0.55 5.564±0.03061
KI-79-3-150.4 13.50 7.189 0.47 6.7222 0.51 0.080 0.0018 0.090 3.102±0.01582 KI-67-3-27.5 12 4.771 0.47 4.3044 0.80 0.12 0.0022 0.090 2.394±0.01915 KI-75-1-139.3 11.7 3.2655 0.39 2.8755 1.20 0.16 0.0023 0.11 1.636±0.01964 KI-67-3-39.0 10.73 7.640 0.47 7.1731 0.48 0.090 0.0020 0.090 3.533±0.01696
IKI-58 8.08 4.4596 0.39 4.0696 0.85 0.31 0.0022 0.19 2.285±0.01943 KI-67-3-81 7.73 5.287 0.47 4.8205 0.71 0.15 0.0020 0.18 2.360±0.01676
KI-75-1-121.5 7.5 3.1794 0.39 2.7894 1.23 0.18 0.0023 0.19 1.582±0.01946 KI-75-1-75.2 5.77 6.504 0.47 6.0371 0.57 0.090 0.0017 0.18 2.620±0.01493 KI-67-2-85.7 2.6 9.5237 0.39 9.1337 0.38 0.070 0.0023 0.19 5.180±0.01969 KI-81-2-88.6 2.37 9.424 0.47 8.9569 0.38 0.090 0.0018 0.27 3.924±0.01491

GEOL394 Pitcher26
Table 13. Ruthenium. The blank correction, Isotope ratio, sample weight, and blank uncertainties; the largest uncertainty (in red) is applied to calculating the uncertainty of the Ruthenium concentrations (in blue).
Sample ID MgO
Content wt.%
Ru (quantity)
ng
Ru Blank
ng
Ru (blank corrected)
ng
Blank Unc. %
Ratio Unc. %
Sample wt Unc. %
Spike wt
Unc. %
Ru Concentration
(ng/g)
KI-81-1-169.9 26.87 3.8399 0.00025 3.8396 0.17 0.090 0.0020 0.55 1.958±0.01077 KI-81-1-239.9 26.55 2.8173 0.00025 2.8171 0.24 0.31 0.0023 0.10 1.613±0.00500 KI-67-3-6.8 25.83 2.6558 0.0137 2.6421 0.25 0.66 0.0022 0.10 1.482±0.00979
KI-81-1-210.0 24.50 4.0534 0.00025 4.0532 0.17 0.13 0.0020 0.080 2.012±0.00342 Iki-22 19.52 2.6263 0.00025 2.6261 0.26 0.070 0.0020 0.55 1.300±0.00715
KI-79-3-150.4 13.50 1.37712 0.0137 1.3575 0.50 0.14 0.0018 0.090 0.6264±0.00313 KI-67-3-27.5 12 0.9434 0.0137 0.9297 0.72 0.52 0.0022 0.090 0.5171±0.00372 KI-75-1-139.3 11.7 2.4823 0.00025 2.4820 0.27 2263.1 0.0023 0.11 1.412±31.973 KI-67-3-39.0 10.73 0.9333 0.0137 0.9196 0.73 0.47 0.0020 0.090 0.4530±0.00331
IKI-58 8.08 0.7155 0.00025 0.7152 0.94 1.21 0.0022 0.19 0.4017±0.00486 KI-67-3-81 7.73 0.3381 0.0137 0.3244 2.07 1.36 0.0020 0.18 0.1588±0.00329
KI-75-1-121.5 7.5 0.4247 0.00025 0.4245 1.58 0.34 0.0023 0.19 0.2408±0.00380 KI-75-1-75.2 5.77 0.1239 0.0137 0.1102 6.08 2.06 0.0017 0.18 0.0478±0.00291 KI-67-2-85.7 2.6 0.1831 0.00025 0.1829 3.66 1.72 0.0023 0.19 0.1037±0.00380 KI-81-2-88.6 2.37 0.0214 0.0137 0.0077 87.09 8.70 0.0018 0.27 0.0034±0.00296
Table 14. Rhenium. The blank correction, Isotope ratio, sample weight, and blank uncertainties; the largest uncertainty (in red) is applied to calculating the uncertainty of the Rhenium concentrations (in blue).
Sample ID MgO
Content wt.%
Re (quantity)
ng
Re Blank
ng
Re (blank corrected)
ng
Blank Unc. %
Ratio Unc. %
Sample wt Unc. %
Spike wt
Unc. %
Re Concentration
(ng/g)
KI-81-1-169.9 26.87 0.2972 0.00011 0.2961 1.69 0.12 0.0020 0.10 0.1511±0.00255 KI-81-1-239.9 26.55 0.0641 0.011 0.0531 9.42 0.24 0.0023 0.010 0.03041±0.00286 KI-67-3-6.8 25.83 0.7466 0.0007 0.7459 0.67 0.12 0.0022 0.010 0.4186±0.00280
KI-81-1-210.0 24.50 0.0896 0.011 0.0786 6.36 0.17 0.0020 0.010 0.03901±0.00248 Iki-22 19.52 0.4547 0.00011 0.4536 1.10 0.10 0.0020 0.12 0.2247±0.00247
KI-79-3-150.4 13.50 0.4923 0.0007 0.4916 1.02 0.090 0.0018 0.010 0.2269±0.00231 KI-67-3-27.5 12 0.7747 0.0007 0.7740 0.65 0.13 0.0022 0.010 0.4306±0.00280 KI-75-1-139.3 11.7 0.1320 0.011 0.1210 4.13 0.15 0.0023 0.010 0.06889±0.00285 KI-67-3-39.0 10.73 0.6068 0.0007 0.6061 0.82 0.13 0.0020 0.010 0.2985±0.0024
IKI-58 8.08 0.7484 0.011 0.7374 0.68 0.030 0.0022 0.010 0.4141±0.00282 KI-67-3-81 7.73 0.4337 0.0007 0.4330 1.15 0.15 0.0020 0.010 0.2120±0.00244
KI-75-1-121.5 7.5 0.3412 0.011 0.3302 1.51 0.050 0.0023 0.010 0.1873±0.00283 KI-75-1-75.2 5.77 2.1456 0.0007 2.1449 0.23 0.13 0.0017 0.010 0.9308±0.00214 KI-67-2-85.7 2.6 1.1148 0.011 1.1038 0.45 0.030 0.0023 0.010 0.6261±0.00282 KI-81-2-88.6 2.37 4.6329 0.0007 4.6322 0.11 0.090 0.0018 0.010 2.029±0.00223

GEOL394 Pitcher27
Discussion
Supporting the Hypothesis The MgO plots for Os and Ru shows that the hypothesis for these elements is supported. It was
hypothesized that Os and Ru are compatible. The compatible elements would display a positive
slope which is associated with well-suited elements; as the melt crystallizes from high MgO
content to low, the concentration of the compatible element will decrease.
Due to the poor correlation of Re, Pd, Pt, and Ir in the graphs, the hypothesis that Re, Pd, and Pt
are incompatible and Ir is compatible is not well supported. Therefore it can be deduce that Re,
Pd, Pt, and Ir are being controlled by an additional phase other than olivine during fractional
crystallization of the Kilauea Iki lava lake; and the low abundances of Re is perhaps a result of
degassing of Re during the eruption of the Kilauea volcano.
Additional Phases Rhenium and the PGE are sulfur loving (chalcophile) elements and there is a possibility that
sulfur and chromite are the additional phases controlling Pd, Pt, and Ir during fractional
crystallization of the lava lake. Chromite is an oxide is found as inclusions in the olivine
phenocrysts in cores from the 1959 eruption. Sulfides are rarely found in Kilauea basalts, but it
is reportedly found as inclusions or associated with ilmenite and titanomagnetite separates from
differentiated rift lava (Helz 1983, Desborough 1968). Sulfides are also found in interstitial
liquid in Alae Lava Lake (Helz 1983, Skinner 1969). The Kilauea summit lavas are the first
known occurrences of sulfide in Kilauean basalts (Helz 1983). Sulfide occurs in olivine as one
phase in swarms of inclusions (Helz 1983). For a sulfide to be stable as a separate phase a
combination of necessary conditions must take place. These special requirements (e.g.,
temperature, silicate melt composition, and sulfur and oxygen fugacities) are discussed in greater
detail in Helz 1983.
Through the use of the ICP-MS ID technique, Re and PGE were examined in the komatiitic
basalt lava lake in the Vetreny belt (Baltic shield) and it was found that Ru, Ir, Pt, and Pd are
compatible with chromite, while Pt and Pd compatibility are moderate compared to Ru and Ir
(Puchtel el at., 2001) (Figure 18). Therefore the speculation of chromite being the controlling

GEOL394 Pitcher28
phase in the Kilauea Iki lava lake is plausible. Chromium data, however, are not available for
the Iki samples to test this hypothesis.
Degassing of Rhenium There have been proposals that the low and variable Re concentrations in Ocean Island Basalts
(OIB) is due to outgassing during volcanic events (Norman el at., 2004; Bennett et al., 2000).
For instance Re loss during magmatic out-gassing was examined in greater detail through
comparing metal abundances and sulfur contents in a suite of basaltic degassed and un-degassed
glasses from Ko’olau and Moloka’i volcanoes, Hawaii (Norman el at., 2004). Rhenium
concentrations in the un-degassed glasses (1.2 – 1.5 ppb) were higher than those measured in the
degassed glasses (0.24 – 0.87).
Figure 18. Variation diagrams of PGE (ppb) vs. Cr (ppm) for the komatiitic basalt lava lake rocks and mineral separates. (From: Puchtel el at., 2001)
GEOL394 Pitcher29
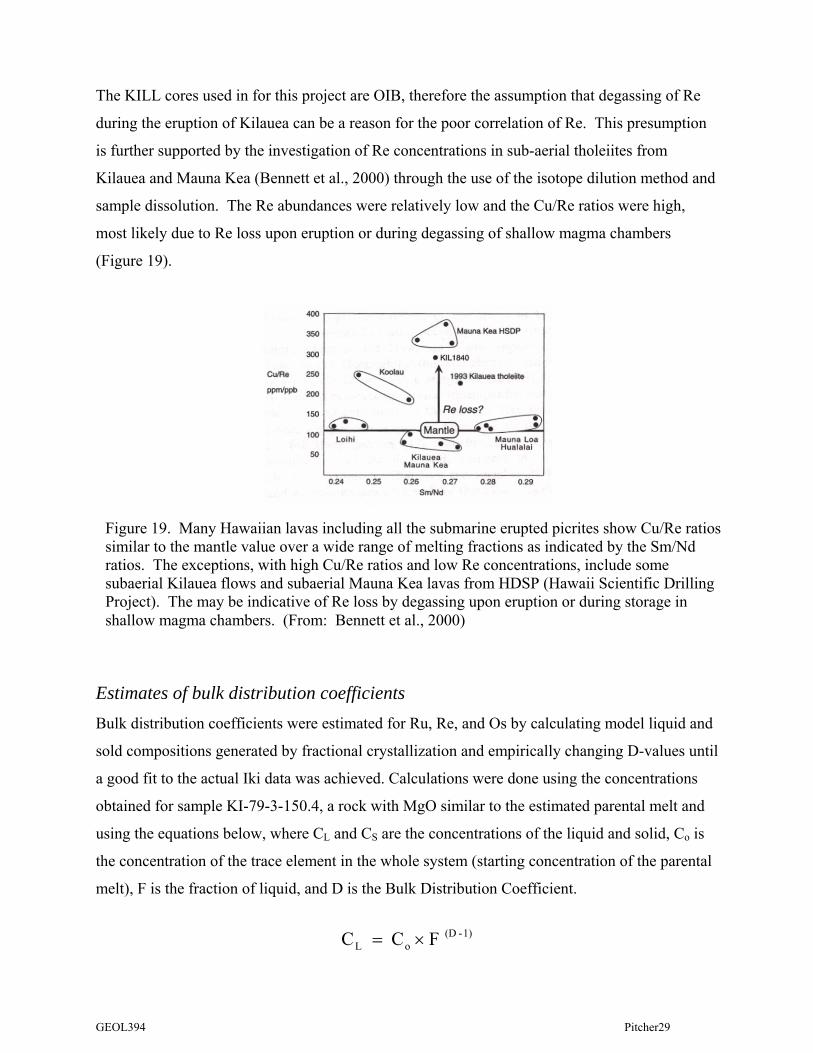
The KILL cores used in for this project are OIB, therefore the assumption that degassing of Re
during the eruption of Kilauea can be a reason for the poor correlation of Re. This presumption
is further supported by the investigation of Re concentrations in sub-aerial tholeiites from
Kilauea and Mauna Kea (Bennett et al., 2000) through the use of the isotope dilution method and
sample dissolution. The Re abundances were relatively low and the Cu/Re ratios were high,
most likely due to Re loss upon eruption or during degassing of shallow magma chambers
(Figure 19).
Estimates of bulk distribution coefficients Bulk distribution coefficients were estimated for Ru, Re, and Os by calculating model liquid and
sold compositions generated by fractional crystallization and empirically changing D-values until
a good fit to the actual Iki data was achieved. Calculations were done using the concentrations
obtained for sample KI-79-3-150.4, a rock with MgO similar to the estimated parental melt and
using the equations below, where CL and CS are the concentrations of the liquid and solid, Co is
the concentration of the trace element in the whole system (starting concentration of the parental
melt), F is the fraction of liquid, and D is the Bulk Distribution Coefficient.
1) - (D
oL F C C ×=
Figure 19. Many Hawaiian lavas including all the submarine erupted picrites show Cu/Re ratios similar to the mantle value over a wide range of melting fractions as indicated by the Sm/Nd ratios. The exceptions, with high Cu/Re ratios and low Re concentrations, include some subaerial Kilauea flows and subaerial Mauna Kea lavas from HDSP (Hawaii Scientific Drilling Project). The may be indicative of Re loss by degassing upon eruption or during storage in shallow magma chambers. (From: Bennett et al., 2000)

GEOL394 Pitcher30
F - 1F(CL) - C C o
S =
The values used for Co are the concentrations of Os (0.43ng/g), Re (0.21ng/g), and Ru (0.63ng/g)
in sample KI-79-3-150.4 (~14 MgO wt. %). F is a variable representing the fraction of melt in
the system (e.g. 100 to 1 percent melt). Estimated D-values were varied until the concentrations
of the liquids and solids correlated well with the trend for the Iki data. For example, the starting
concentration for Os is 0.43ng/g; therefore the concentration of Os at 100 percent melt should be
~0.43ng/g. Once there is a good correlation between bulk-D and fraction of liquid, the
concentrations of Os relative to Re concentrations were plotted (Figure 20a-b).
Os (ng/g)0.0 0.2 0.4 0.6 0.8 1.0 1.2
Re
(ng/
g)
0.0
0.5
1.0
1.5
2.0
2.5
3.0
Liquids
Solids
Parental Melt
DOs = 2.5
DRe = 0.45
-0.5
0.0
0.5
1.0
1.5
2.0
-0.5 0.0 0.5 1.0 1.5 2.0 2.5
Ru (ng/g)
Re
(ng/
g)
a b
Figure 20a illustrates Re as an incompatible element with a bulk-D value of 0.45, where its
concentration is higher in the liquid phase than in the solid phase. Os is a compatible element
with a bulk-D value of 2.5. As a compatible element its concentration is higher in the solid
phase than in the liquid phase. Ru is a compatible element (D = 3.0) and therefore behaves
similar to Os. As the lava lake crystallized Ru may take the place of a major element in available
Figure 20. (a) Bulk distribution coefficients for Os and Re. (b) Bulk distribution coefficients for Re and Ru.
Parental Melt
Liquids
Solids
D Re = 0.45 D Ru = 3.0
GEOL394 Pitcher31
sites in the crystal structure of olivine, rather than remaining in the melt. As a result, the
concentration of Ru is greater in the solid phase than in the liquid phase (Figure 20b). For
contrast and comparison, Brenan et al., (2005) diagram (Figure 5) reported data for Ru at high
oxygen fugacities (-2 to -5) as a compatible element and Re at lower fugacities as a incompatible
element.
Conclusions Concentrations of Re and PGE were measured in borehole cores from the Kilauea Iki lava lake.
Osmium (0.0006 – 1.06 ppb) and Ru (0.0034 – 2.01 ppb) displayed a good correlation with MgO
content, indicating that olivine controlled these elements during fractional crystallization of the
lava lake. Iridium (0.0003 – 0.7 ppb), Pd (0.24 – 5.8 ppb), Pt (1.15 – 10.4 ppb), and Re (0.030 –
2.0 ppb) have limited correlation to changes in MgO wt. %, leading to two assumptions; (1)
Iridium, Pd, and Pt were influenced less by olivine and more by a co-precipitating phase like
chromite, or sulfides found as inclusions in the olivine phenocrysts. (2) Outgassing of Re during
the eruption of the Kilauea volcano may have contributed to low Re concentrations. The bulk
distribution coefficients for Os (2.5), Re (0.45), and Ru (3.0) were estimated by calculating the
CL and CS on a spreadsheet and plugging in different values for D into the equations until a
match with the Iki data was achieved.
Acknowledgments — I wish to thank Dr. Rosalind T. Helz from the USGS for providing the
cores and thin-sections for this experiment, as well as acting as a consultant; providing additional
information on the rocks and thin-sections. Thanks also go to Dr. Igor S. Puchtel for guidance in
the University of Maryland’s geochemistry clean laboratories, with the chemical separation
methods and application, and direction with making and preparing mass spectrometer filaments
and filament ribbons; and for guidance with the Thermal Ionization and Inductively-Couple
Plasma Mass Spectrometers. Thanks to Dr. Roberta L. Rudnick for the use of her digital camera
and microscope to photograph thin-sections. Thank you to Dr. Philip A. Candela for the crash
course in oxygen and sulfur fugacities. Special thanks is due to Dr. Richard J. Walker for taking
the role as my thesis advisor, mentor, and teacher; for constantly being available to help in the
laboratories, with my scientific writing skills, for coaching me in how to use the TIMS and ICP-

GEOL394 Pitcher32
MS, and for his patience. I would also like to thank Dr. Walker for encouraging me to
participate in the American Geophysical Union meeting.
References Anderson, A. T., Jr., Swihart G. H., Artoli G. and Geiger C.A. (1984), Segregation vesicles, gas filter-
pressing, and igneous differentiation: J. Geol. 92, 55-72 Brenan, M.J, William F. McDonough and Richard Ash, An experimental study of the solubility and
partitioning of iridium, osmium and gold between olivine and silicate melt, In: Earth and Planetary Science Letters, Volume 237, Issues 3-4, 15 September 2005, Pages 855-872
Crocket, James H., Platinum-group element distribution in komatiitic and tholeiitic volcanic rocks from
Munro Township, Ontario, In: Economic Geology and the Bulletin of the Society of Economic Geologists, 1986, Vol. 81, Issue 5, pp.1242-1251
Desborough, G.A., Anderson, A.T., Jr., and Wright, T.L. (1968), Mineralogy of sulfides from certain
Hawaiian basalts, In: American Mineralogist, vol. 63, p. 6366-644. Eaton, J. P (1962), Crustal structure and volcanism in Hawaii: Geophysical Monograph, January 1962,
pp.13-39 Geological Association of Canada Meeting (1986), Re-equilibration of chromite from Kilauea Iki lava
lake, Hawaii: Abstracts of papers. February 1986, Vol. 11, p.125 Gunn, Bernard M (1971), Trace element partition during olivine fractionation of Hawaiian basalts:
Chemical Geology, Vol. 8, Issue 1, pp.1-13 Hardee, H. C. (1980), Solidification in Kilauea Iki lava lake. J. Volcanol. Geothermal Res. 7, 211-223 Helz, R. T. and Wright T. L. (1983) Drilling report and core logs for the 1981 drilling of Kilauea Iki lava
lake (Kilauea volcano, Hawaii) with comparative notes on earlier (1967-1979) drilling experiences. U.S. Geol. Survey Open-File Report 83-326, 66pp.
Helz, R. T. (1993), Drilling report and core logs for the 1988 drillings of Kilauea Iki Lava Lake, Kilauea
Volcano, Hawaii, with summary descriptions of the occurrence of foundered crust and fractures in the drill core: U.S. Geological Survey Open file Report 93-15, pp. 1-57
Helz, R.T., Banks, N.G., Casadevall, T.J., Fiske, R.S., and Moore, R.B. (1984), A catalogue of drill core
recovered from Kilauea Iki lava lake from 1967-1979: U.S. Geological Survey Open File Report 84-484, 72p.
Helz, R.T., (1980), Crystallization history of Kilauea Iki lava lake as seen in drill core recovered in 1967-
1979: Bulletin Volcanologique, v. 43-4, p. 675-701. Helz, R.T., (1983), Diverse olivine population in lavas of the 1959 eruption of Kilauea Volcano, Hawaii:
Eos, v. 64 p. 900

GEOL394 Pitcher33
Helz, R.T., (1984), In situ fractionation of olivine tholeiite: Kilauea Iki lava lake, Hawaii: Geological Society of America Abstracts with Programs, v. 16, p. 536-537
Helz, R.T., (1987a), Character of olivines in lavas of the 1959 eruption of Kilauea Volcano and its
bearing on eruption dynamics: U.S. Geological Survey Professional Paper 1350, Chap. 25 Helz, R.T., (1987b) Diapiric transfer of melt in Kilauea Iki lava lake: A quick, efficient process of
igneous differentiation: Geological Society of America Bulletin, April 1989, Vol. 101, Issue 4, pp.578-594
Helz, R. T., Kirschenbaum, H., and Marinenko, J. W., (1989), Whole-rock analyses of drill core from
Kilauea Iki lava lake, Kilauea Volcano, Hawaii: U.S. Geological Survey Open-File Report, 30 p. Helz, R.T., (1991), Kilauea Iki; a model magma chamber: Eos, Transactions, American Geophysical
Union, April 23, 1991, Vol. 72, Issue 17, pp.315 James M. Brenan, William F. McDonough and Richard Ash, An experimental study of the solubility and
partitioning of iridium, osmium and gold between olivine and silicate melt, In: Earth and Planetary Science Letters, Volume 237, Issues 3-4, 15 September 2005, Pages 855-872
Luth W. C., Gerlach T.M. and Eichelberger J. C. (1981), Kilauea Iki lava lake: April 1981. EOS 62, 1073 MacDonald, G.A., Katsura, Takashi. (1961), Variations in the lava of the 1959 Eruption in Kilauea Iki:
Pacific Science, January 1961, Vol. 15, Issue 3, pp. 358-369 Mangana M. T. and Helz R. T. (1985), Vesicle and phenocryst distribution in Kilauea iki lava lake,
Hawaii. EOS Vol.66, Issue 46, p.1133. Mineral Information Institute, “Platinum Group.” http://www.mii.org/Minerals/photoplat.html Murata, K.J., and Richter, D.H., (1966a), Chemistry of the lavas of the 1959-1960 eruption of Kilauea
Volcano, Hawaii: U.S. Geological Survey Professional Paper 537-A, 26p. Murata, K.J., and Richter, D.H., (1966b), The settling of olivine in Kilauean magma as shown by lavas of
the 1959 eruption: American Journal of Science. Vol. 264, Issue 3, pp.194-203 Norman, M.D., Garcia, M.O., Bennett, V.C., (2004), Rhenium and chalcophile elements in basaltic
glasses from Ko’olau and Moloka’i volcanoes: Magmatic outgassing and composition of the Hawaiian plume. Geochimica et Cosmochimica Acta,Vol. 68, No. 18, pp. 3761 - 3777
Puchtel, Igor, and Humayun, Munir, (2001), Platinum group element fractionation in a komatiitic basalt
lava lake, In: Geochimica et Cosmochimica Acta, Vol. 65, Issue Rehkaemper, Mark, Ir, Ru, Pt, and Pd in basalts and komatiites; new constraints for the geochemical
behavior of the platinum-group elements in the mantle, In: Geochimica et Cosmochimica Acta, November 1999, Vol. 63, Issue 22, pp.3915-3934
Richter, D.H., Eaton, J.P., Murata, K.J., Ault, W.U., and Krivoy, H.L., (1970), Chronological narrative of
the 1959-1960 eruption of Kilauea Volcano, Hawaii: U.S. Geological Survey Professional Paper 537-B, 73 p.

GEOL394 Pitcher34
Richter, D.H., and Murata, K.J., (1966), Petrography of the lavas of the 1959-1960 eruption of Kilauea Volcano, Hawaii: U.S. Geological Survey Professional Paper 537-D, 12 p.
Richter, D.H., and Murata, K.J., (1966), Petrography of the lavas of the 1959-1960 eruption of Kilauea
Volcano, Hawaii: U.S. Geological Survey Professional Paper 537-B, 26 p. Skinner, B.J., and peck, d.L., (1969), an immiscible sulfide melt from Hawaii: Economic Geology
Monograph, vol. 4, p. 217-232. Tatsumi, Yoshiyuki, The behaviour of platinum-group elements during magmatic differentiation in
Hawaiian tholeiites, In: Geochemical Journal, 1999, Vol. 33, Issue 4, pp.237-247 Tomascak, Paul B., The absence of lithium isotope fractionation during basalt differentiation; new
measurements by multi-collector sector ICP-MS, In: Geochimica et Cosmochimica Acta, March 1999, Vol. 63, Issue 6, pp.907-910
Van Kooten, G.K., and Buseck, P.R., (1978), Interpretation of olivine zoning: study of a maar from the
san Francisco volcanic field, Arizona: Gological Society of American Bulletin, v. 89, p. 744-754. Walker, R.J., Morgan, J.W., Hanski, E.J., Smolkin V.F., (1997), Re-Os systematics of Early Proterozoic
ferropicrities, Pechenga Complex, northwestern Russia: Evidence for ancient 187Os-enriched plums: Geochmica et Cosmochicia Acta, Vol. 61, No.15, pp. 3145-3160.
Wright, T.L., (1971), Chemistry of Kilauea and Mauna Loa lava in space and time: U.S. Geological
Survey Professional Paper 735, 40p. Wright, T.L., (1973), Magma mixing as illustrated by the 1959 eruption, Kilauea Volcano, Hawaii:
Geological Society American Bulletin, v. 84, p. 849-585. Wright, T. L., (1976), Kilauea lava lakes; natural laboratories for study of cooling, crystallization, and
differentiation of basaltic magma: Geophysical Monograph, January 1976, Issue 19, pp.375-390 Wright, T.L., (1984), Origin of Hawaiian tholeiite: a metasomatic model: Journal of Geophysical
Research, v. 89 p. 3233-3252 Wright, T.L., Helz, T.H., (1992), Differentiation and magma mixing on Kilauea’s east rift zone: a further
look at the eruptions of 1955 and 1960. Part I, the late 1955 lavas: Bulletin of Volcanology, Vol. 56, pp. 361-384
Lynnette Pitcher GEOL393
35
Appendix A
96 Ru98 Ru99 Ru
100 Ru101 Ru102 Ru104 Ru
7MetallicSilvery white
metallic
d-block5844101.07RuRuthenium
190 Pt192 Pt194 Pt195 Pt196 Pt198 Pt
6MetallicGreyishwhite
d-block61078195.078PtPlatinum
102 Pd104 Pd105 Pd106 Pd108 Pd110 Pd
6MetallicSilvery white
metallic
d-block51046106.42PdPalladium
184Os186Os187Os188Os189Os190Os192Os
7MetallicBluish grey
d-block6876190.23OsOsmium
191Ir193Ir
2MetallicSilvery white
d-block6977192.217IrIridium
Isotopes# naturally occurring Isotopes
ClassificationColourBlockPeriod #Group #
Atomic #Atomic wt
SymbolName

Lynnette Pitcher GEOL393
36
Appendix B
Isotope Dilution Equations
Isotope Dilution Equation
( ) ( )( ) ( )SAMPLESPIKE
SAMPLESPIKE
MIX ReIsotope of Atoms #ReIsotope of Atoms #ReIsotope of Atoms #ReIsotope of Atoms #
ReRe
187187
185185
187
185
++
=⎟⎟⎠
⎞⎜⎜⎝
⎛
The Knowns
( ) ( ) ( ) ( ) ( )( )SPIKE
SPIKESPIKE Reofwt.Atomic
#sAvagadro'ReAtom% spikeinReofion concentratspikeofweightReof Atoms#
185185 ×××
=
( ) ( ) ( ) ( ) ( )( )SPIKE
SPIKESPIKE Reofwt.Atomic
#sAvagadro'ReAtom% spikeinReofion concentratspikeofweightReofAtoms#
187187 ×××
=
( ) ( ) ( ) ( )( )( )SAMPLE
SAMPLE Reofwt.Atomicsample ofweight ReAtom% # sAvagrado'Reof Atoms# x185
185 ××=
( ) ( ) ( ) ( )( )( )SAMPLE
SAMPLE Reofwt.Atomicsample ofweight ReAtom% # sAvagrado'Reof Atoms# x187
187 ××=
Rearrange to Solve for X
( ) ( )
( ) ( ) ⎥⎦
⎤⎢⎣
⎡×⎟⎟⎠
⎞⎜⎜⎝
⎛−
−⎥⎥⎦
⎤
⎢⎢⎣
⎡×⎟⎟
⎠
⎞⎜⎜⎝
⎛
=
SAMPLESAMPLE
SPIKESPIKEMIX
MIX ReIsotope of Atoms #ReReReIsotope of Atoms #
ReIsotope of Atoms #ReIsotope of Atoms #ReRe
187
187
185185
185187187
185
X

Lynnette Pitcher GEOL393
37
Figure 2
Figure 3
Figure 1
Analytical Method Appendix C
I. Prepare Powders A. Sand paper drilled or sawn surfaces of rocks until surfaces are
contaminant free.
B. Jaw-crusher
1. clean area, Jaw-crusher, and tray (Fig. 1)
a. Make sure nothing is in the machine and tray which
could contaminate your sample.
b. Clean everything between each sample.
2. Tightly screw in knob (located in the front of the machine).
3. place tray into slot
a. Catches the crushed rock.
4. Turn on machine and drop a piece of rock between plates and
collect crushed rock in tray.
C. Disk Mill
1. Clean area and equipment (Fig. 2).
2. Turn knob counterclockwise before locking the disk mill, allowing space between the two
disks.
3. Put crushed rock on top of a piece of paper with crease in the middle.
4. Turn on disk mill and turn knob clockwise until you hear the two disks rub against each
other.
5. Pour crushed rock into machine. Once the sample goes
through, turn knob counterclockwise until disks no longer
touch.
6. Turn off disk mill and pour powder onto creased paper and
collect it in a clean bottle (Fig. 3).
a. Make sure to throw away creased paper and use a new
sheet for each sample.
II. Re-Os-highly siderophile elements (PGE) chemical separation. A. Re-Os-PGE preparation.
1. Required materials.
a. (10) carius tubes
b. (20) 15ml round bottom Teflon vials
c. (10) 5ml conical bottom Teflon vials
Lynnette Pitcher GEOL393
38
Figure 4
Figure 5
d. Funnels
e. Transfer pipetters
f. Centrifuge tubes
g. Biorad columns
h. 100-200 mesh anion resin
i. HCL (concentrated, 1M)
j. HNO3 (concentrated, 0.8M, 6M)
k. HBr (concentrated)
l. Milli-Q water
m. (2) 5ml pipetter tips for adjustable pipetter
n. 10-200 µl pipetter tips for adjustable pipetter
o. 2000 ml beaker
p. Protective eyewear
q. Lab coat
r. gloves
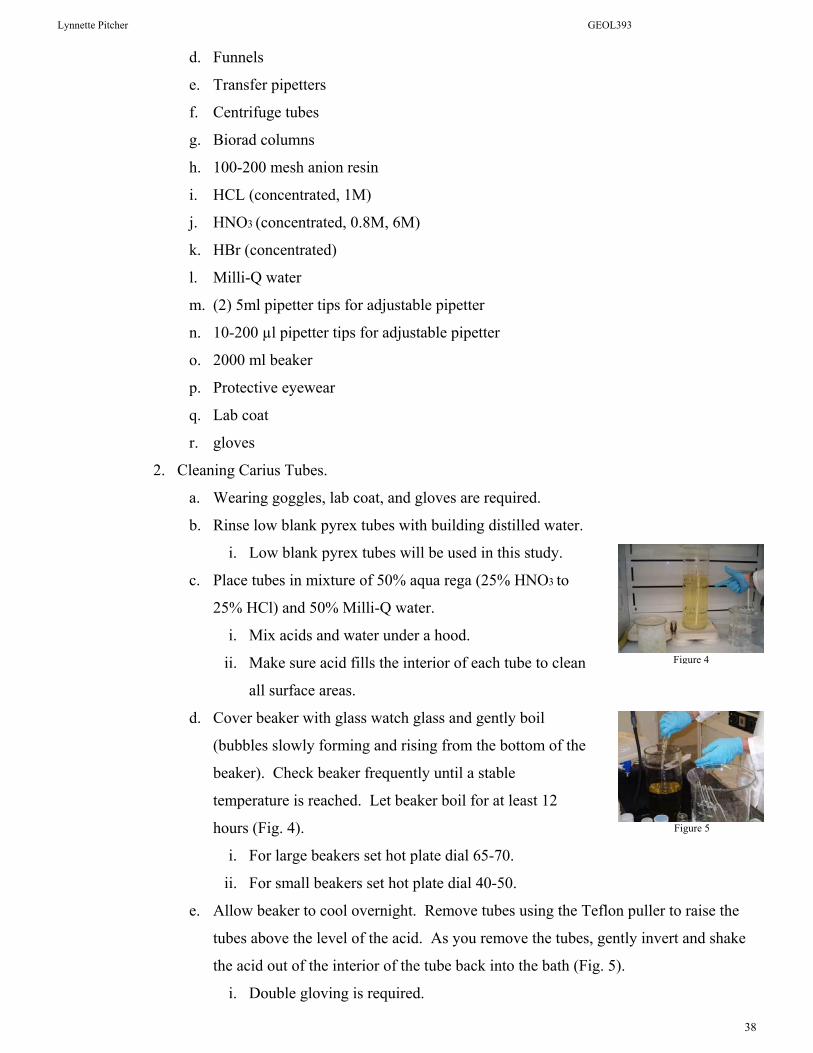
2. Cleaning Carius Tubes.
a. Wearing goggles, lab coat, and gloves are required.
b. Rinse low blank pyrex tubes with building distilled water.
i. Low blank pyrex tubes will be used in this study.
c. Place tubes in mixture of 50% aqua rega (25% HNO3 to
25% HCl) and 50% Milli-Q water.
i. Mix acids and water under a hood.
ii. Make sure acid fills the interior of each tube to clean
all surface areas.
d. Cover beaker with glass watch glass and gently boil
(bubbles slowly forming and rising from the bottom of the
beaker). Check beaker frequently until a stable
temperature is reached. Let beaker boil for at least 12
hours (Fig. 4).
i. For large beakers set hot plate dial 65-70.
ii. For small beakers set hot plate dial 40-50.
e. Allow beaker to cool overnight. Remove tubes using the Teflon puller to raise the
tubes above the level of the acid. As you remove the tubes, gently invert and shake
the acid out of the interior of the tube back into the bath (Fig. 5).
i. Double gloving is required.

Lynnette Pitcher GEOL393
39
Figure 7
a
b
Figure 6
Figure 8
f. Place cleaned tubes in a clean tray with building distilled water (Fig. 6a).
g. Rinse each tube 3 times (inside and out) with Milli-Q water.
h. Place tubes in a clean large beaker filled with Milli-Q water. Place beaker on a
hotplate. Gently boil overnight.
i. Place inverted tubes in a hood on plastic wrap and dry
completely (Fig. 6b).
j. Wrap dry tubes in plastic wrap and put into storage box.
3. Cleaning Teflon Vessels
a. Wearing goggles, lab coat, and gloves is required.
b. Place round and conical bottom Teflon vessels in a 2000
ml beaker containing a mixture of 50% Milli-Q water,
25% HCl, 25% HNO3.
i. Mix under a hood.
ii. Put them into beaker individually to ensure total
submergence to clean all surface area.
c. Set hot plate on 55 dial.
d. Place beaker on hot plate for 12 hours or over night (Fig.
7).
e. After boiling let beaker cool for several hours.
f. Decant acid into another clean beaker.
g. Rinse clean Teflon and beaker with Milli-Q water.
h. Rinse clean Teflon and beaker (individually) with Milli-
Q water.
i. Make sure all surfaces are rinsed repeatedly.
i. Put Teflon in a beaker filled with Milli-Q water. Place
beaker on a hot plate on a low dial setting for 3 hours.
i. Repeat twice.
j. Place inverted Teflon in laminar flow hood on plastic
wrap to dry (Fig. 8).
i. Remove from hood as soon as dry.
k. Store clean Teflon into zip-lock bags or clean box.
4. Cleaning Transfer Pipetters and Pipetter Tips
a. Pipetter and pipetter tips are always kept clean in the clean lab and are stored in acid
filled (dilute HCl) bottles.

Lynnette Pitcher GEOL393
40
Figure 10
Figure 11
b. Pipetter and pipetter tips used in chemistry experiment should be removed from acid
prior to starting work.
c. Once removed from acid, the tips should be rinsed inside and out at least 3 times
with Milli-Q water.
d. To rinse out the inside of the pipetters fill a clean beaker with Milli-Q water and use
the pipetters to suck in the water, shake it to rinse the inside completely, and then
expel the water into another beaker.
i. Do this 3 times.
e. Once chemistry work is done, place pipetters and pipetter tips back into the dilute
HCl beaker.
B. Re-Os-HSE chemistry
1. Introduction of Sample and Spikes to Carius Tubes
a. Fill a bucket with crushed ice. Label four cleaned carius tubes and the cap and
bottom of four cleaned 15ml round bottom Teflon vessels (1, 2, 3, and 4) with
Lumocolor Permanent marker pens. Bury the carius tubes in the ice bath (Fig. 9a &
b).
b. Weigh the aluminum foil and sample.
i. Want 2grams of sample
c. Place sample into carius tube by using a Teflon funnel
(Fig. 10).
i. Use a separate piece of aluminum foil for each
sample.
d. Add appropriate amounts of spikes to Teflon vessels
(Fig. 11).
e. Add spike into carius tubes using Teflon funnels.
i. Spike in vessel 1 goes into carius tube 1; spike in
vessel 2 goes into carius tube 2, etc.
a b
Figure 9

Lynnette Pitcher GEOL393
41
Figure 12
a
b
Figure 14
f. Add 3.5 ml of concentrated distilled HCl to Teflon vessels (1, 2, 3, and 4).
g. Add HCl in Teflon vessel 1 to carius tube 1 using Teflon funnel, and so forth (vessel
2 to carius tube 2, etc.).
i. Rinse any residual powder present in funnel top with HCl.
h. Cover the openings of carius tubes with laboratory film (Figure 12).
i. Let mix freeze.
j. Add 5 ml of concentrated nitric acid (HNO3) to Teflon
vessels (1, 2, 3, and 4).
k. Add HNO3 in Teflon vessel 1 to carius tube 1 using
Teflon funnel, and so forth (HNO3 in vessel 2 goes into
carius tube 2, etc.)
i. Rinse any residual powder present in funnel top with HNO3.
l. Let mix freeze. Rinse the funnel with a few drops of Milli-Q water.
m. Remove funnels from carius tubes and dispose into trash can.
2. Sealing Carius Tubes
a. Transfer carius tubes + samples to the mineral separation laboratory.
b. Clamp the carius tube in holder. Using propane torch for Pyrex tubes, heat central
portion of neck until it closes (Figure 13a & b).
i. Take care not to pull upward to form a capillary.
c. Turn OFF gases and clean-up room before leaving.
Cooled glass detritus must go in the glass disposal box.
d. Allow carius tubes to cool for 15 minutes.
e. Wrap tubes in aluminum foil and label which carius tube
is which (1, 2, 3, or 4)
f. Place each wrapped carius tube into a metal jacket (Fig.
14a). Each jacket should be LIGHTLY screwed.
a b
Figure 13

Lynnette Pitcher GEOL393
42
Figure 16
Figure 15
g. Turn oven onto 240° and place each metal jacket inside (Fig. 14b). Allow tubes to
cook for a few days.
3. Osmium Separation Procedures
a. Take metal jackets out of oven and allow them to cool off.
b. Rinse and clean 15ml round bottom Teflon vessels used
for weighting spikes with Milli-Q water and kimwipes.
Cover the top edges of the Teflon vessels with Teflon
thread seal tape (Fig. 15)
i. This will prevent any Os evaporating.
c. Place all four Teflon vessels under the hood.
d. Remove four 60ml and two 15ml centrifuge tubes from
acid bath. Rinse three times with Milli-Q water (Fig. 16).
When dry label the four 60ml centrifuge tubes with
sample numbers (1, 2, 3, and 4) and label the two 15ml
centrifuge tubes 1 and 2. Put all centrifuge tubes in a
centrifuge rack and place them and bottles of HBr and
CCl4 under the hood (Fig. 17)
e. Label two 5ml pipette tips (previously cleaned) “acid” and “solvent”. Label one
transfer pipette for each sample with sample numbers (1, 2, 3, and 4). Put all six
under the hood.
f. Working under a hood and wearing gloves; put 3ml of carbon tetrachloride (CCl4)
into each centrifuge tubes using the same 5ml pipette tip for all 4 Teflon vessels.
Disregard the CCl4 pipette tip, and get a new one.
g. Under the hood put 4ml of concentrated distilled hydrobromic acid (HBr) into each
Teflon vessel using the new 5ml pipette tip (Fig 17)
Figure 17

Lynnette Pitcher GEOL393
43
Figure 17
a
Figure 18
Figure 19
h. Fill a bucket with ice and return to mineral separation room. Remove the four carius
tubes from the metal jackets, take off the aluminum foil, shake the contents, and
clean the exterior of the carius tubes with Milli-Q water.
i. Using a (scratcher?) scratch a straight line halfway
around the top part of each carius tube and submerge
them into the ice bucket. After 15 minutes clamp the
carius tube in holder. Using propane torch for Pyrex
tubes heat the tip of a glass wand and then press the
hot tip to the carius tube where you scratched it.
Repeat for the other 3 carius tubes.
i. The heat from the glass wand tip will cause the carius tube to crack along the
scratched line.
j. Turn OFF gases and clean-up room before leaving. Cooled glass detritus must go in
the glass disposal box. Return to clean lab with
carius tubes in bucket.
k. Put on vinyl gloves and put a large empty beaker
under hood.
l. Unscrew the top off of the 15ml centrifuge tube #1.
Holding carius tube #1 away from you under the
hood, press on the top part of the tube where it is
cracked. The top of the tube should pop off easily.
Disregard the top into the empty beaker.
m. Pour contents in carius tube #1 into 15ml centrifuge
tube #1. Disregard the carius tube into the large
beaker (Fig. 18a). Squirt 6N HNO3 into carius tube to wash down any content
clinging to the insides of the tube and pour into 15ml
centrifuge tube #1 (Fig. 18b).
i. DO NOT let the tip of the 6N HNO3 bottle
touch the carius tube.
n. Screw back on the top of the 15ml centrifuge tube #1.
o. Repeat steps l-n for carius tube #2 and 15ml
centrifuge tube #2.
p. Shake each sealed centrifuge tube for 1-2 minutes and then centrifuge them on high
for 15 minutes (Fig. 19)
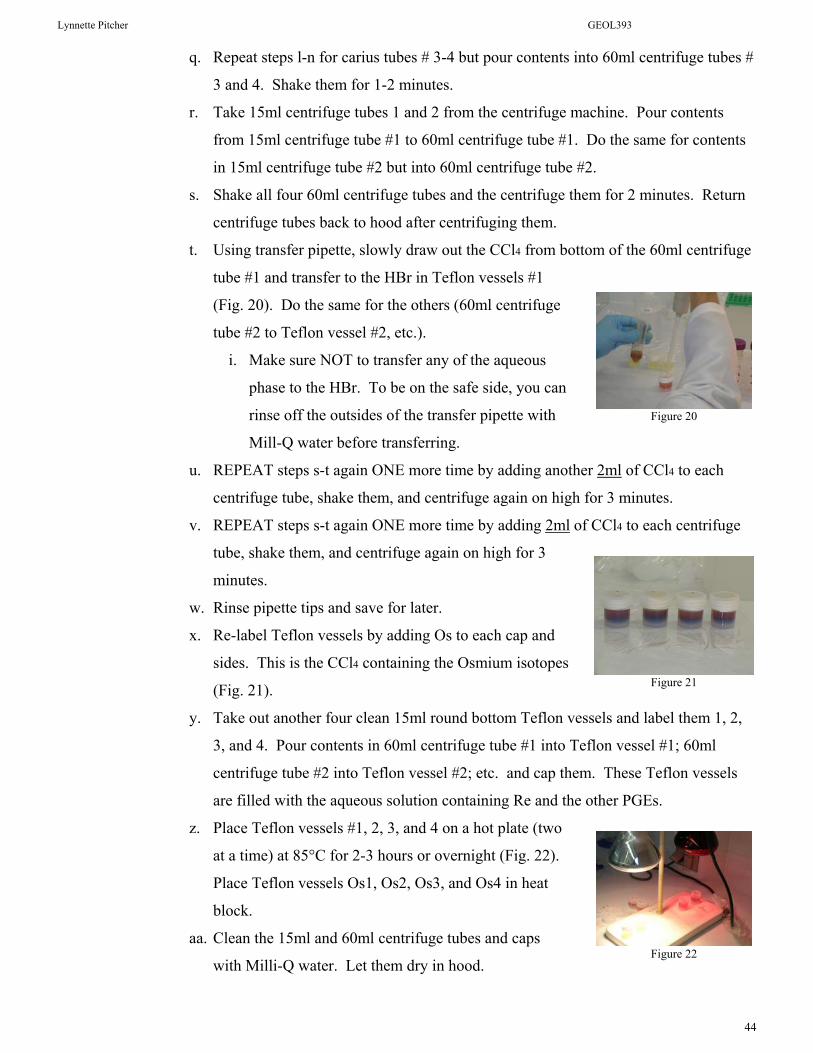
Lynnette Pitcher GEOL393
44
Figure 20
Figure 21
Figure 22
q. Repeat steps l-n for carius tubes # 3-4 but pour contents into 60ml centrifuge tubes #
3 and 4. Shake them for 1-2 minutes.
r. Take 15ml centrifuge tubes 1 and 2 from the centrifuge machine. Pour contents
from 15ml centrifuge tube #1 to 60ml centrifuge tube #1. Do the same for contents
in 15ml centrifuge tube #2 but into 60ml centrifuge tube #2.
s. Shake all four 60ml centrifuge tubes and the centrifuge them for 2 minutes. Return
centrifuge tubes back to hood after centrifuging them.
t. Using transfer pipette, slowly draw out the CCl4 from bottom of the 60ml centrifuge
tube #1 and transfer to the HBr in Teflon vessels #1
(Fig. 20). Do the same for the others (60ml centrifuge
tube #2 to Teflon vessel #2, etc.).
i. Make sure NOT to transfer any of the aqueous
phase to the HBr. To be on the safe side, you can
rinse off the outsides of the transfer pipette with
Mill-Q water before transferring.
u. REPEAT steps s-t again ONE more time by adding another 2ml of CCl4 to each
centrifuge tube, shake them, and centrifuge again on high for 3 minutes.
v. REPEAT steps s-t again ONE more time by adding 2ml of CCl4 to each centrifuge
tube, shake them, and centrifuge again on high for 3
minutes.
w. Rinse pipette tips and save for later.
x. Re-label Teflon vessels by adding Os to each cap and
sides. This is the CCl4 containing the Osmium isotopes
(Fig. 21).
y. Take out another four clean 15ml round bottom Teflon vessels and label them 1, 2,
3, and 4. Pour contents in 60ml centrifuge tube #1 into Teflon vessel #1; 60ml
centrifuge tube #2 into Teflon vessel #2; etc. and cap them. These Teflon vessels
are filled with the aqueous solution containing Re and the other PGEs.
z. Place Teflon vessels #1, 2, 3, and 4 on a hot plate (two
at a time) at 85°C for 2-3 hours or overnight (Fig. 22).
Place Teflon vessels Os1, Os2, Os3, and Os4 in heat
block.
aa. Clean the 15ml and 60ml centrifuge tubes and caps
with Milli-Q water. Let them dry in hood.
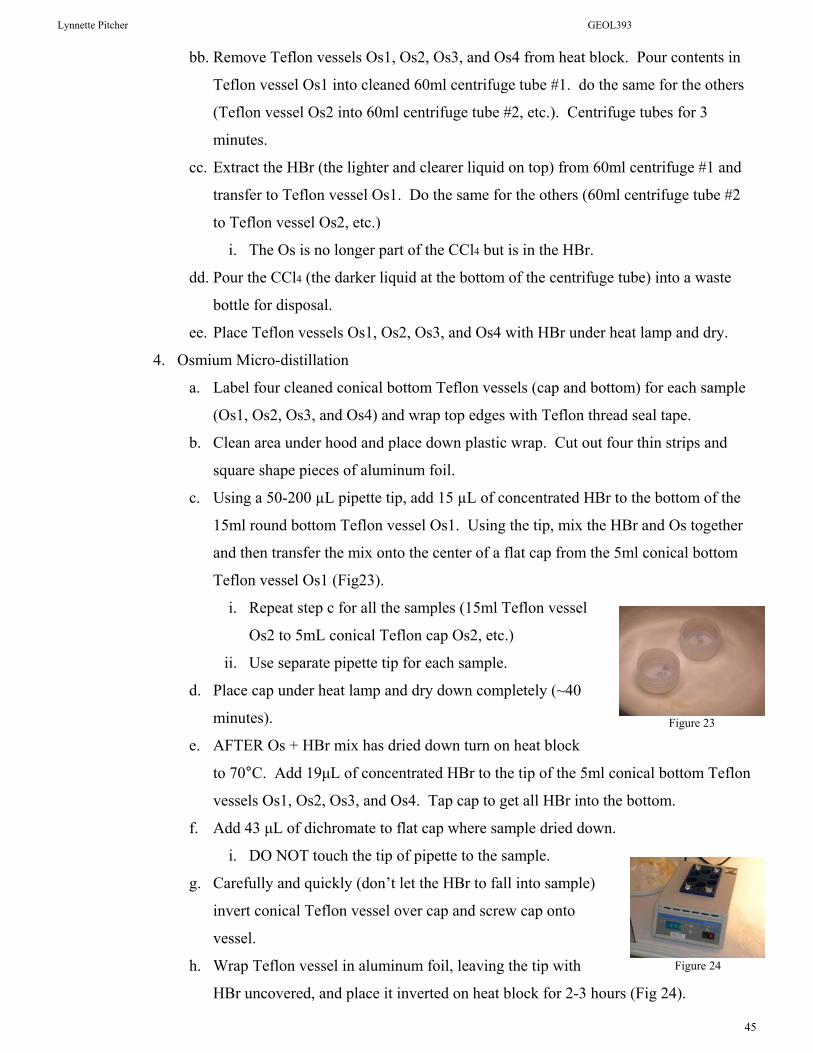
Lynnette Pitcher GEOL393
45
Figure 23
Figure 24
bb. Remove Teflon vessels Os1, Os2, Os3, and Os4 from heat block. Pour contents in
Teflon vessel Os1 into cleaned 60ml centrifuge tube #1. do the same for the others
(Teflon vessel Os2 into 60ml centrifuge tube #2, etc.). Centrifuge tubes for 3
minutes.
cc. Extract the HBr (the lighter and clearer liquid on top) from 60ml centrifuge #1 and
transfer to Teflon vessel Os1. Do the same for the others (60ml centrifuge tube #2
to Teflon vessel Os2, etc.)
i. The Os is no longer part of the CCl4 but is in the HBr.
dd. Pour the CCl4 (the darker liquid at the bottom of the centrifuge tube) into a waste
bottle for disposal.
ee. Place Teflon vessels Os1, Os2, Os3, and Os4 with HBr under heat lamp and dry.
4. Osmium Micro-distillation
a. Label four cleaned conical bottom Teflon vessels (cap and bottom) for each sample
(Os1, Os2, Os3, and Os4) and wrap top edges with Teflon thread seal tape.
b. Clean area under hood and place down plastic wrap. Cut out four thin strips and
square shape pieces of aluminum foil.
c. Using a 50-200 µL pipette tip, add 15 µL of concentrated HBr to the bottom of the
15ml round bottom Teflon vessel Os1. Using the tip, mix the HBr and Os together
and then transfer the mix onto the center of a flat cap from the 5ml conical bottom
Teflon vessel Os1 (Fig23).
i. Repeat step c for all the samples (15ml Teflon vessel
Os2 to 5mL conical Teflon cap Os2, etc.)
ii. Use separate pipette tip for each sample.
d. Place cap under heat lamp and dry down completely (~40
minutes).
e. AFTER Os + HBr mix has dried down turn on heat block
to 70°C. Add 19μL of concentrated HBr to the tip of the 5ml conical bottom Teflon
vessels Os1, Os2, Os3, and Os4. Tap cap to get all HBr into the bottom.
f. Add 43 μL of dichromate to flat cap where sample dried down.
i. DO NOT touch the tip of pipette to the sample.
g. Carefully and quickly (don’t let the HBr to fall into sample)
invert conical Teflon vessel over cap and screw cap onto
vessel.
h. Wrap Teflon vessel in aluminum foil, leaving the tip with
HBr uncovered, and place it inverted on heat block for 2-3 hours (Fig 24).

Lynnette Pitcher GEOL393
46
a
b
Figure 25
i. Carefully remove Teflon vessel from hotplate and carefully remove aluminum foil.
j. Gently unscrew Teflon cap and check the residue. If it looks green as is or looks
green after adding a little Milli-Q water, there was insufficient Cr+³ for oxidizing the
Os; therefore add more dichromate and redistill. If residue looks red and dissolves
into yellow liquid when water is added, the cap can be rinsed out and dried.
k. Screw cap back onto vessel. It is best to let HBr sit for several hours to make sure
all Os is reduced. The HBr can then be evaporated under a heat lamp.
l. The sample is now ready for loading into mass spectrometer.
5. Anion Exchange Column Procedures for Rhenium and Platinum-Group Elements
a. Add 10ml of to the 0.8M HNO3 in Teflon vessels 1, 2, 3, and 4. Screw cap back on
and place vessels onto hot plate over night.
b. Take out four 10mL Teflon columns from acid bath, rinse with Milli-Q water 3×,
and dry under the hood. Label them (1,2, 3, and 4) and put into column stand and
place catch cups under each column.
c. Pour the contents in Teflon vessels 1, 2, 3, and 4 into centrifuge tubes, centrifuge the
samples, and place to the side for later.
d. Fill Teflon vessels 1, 2, 3, and 4 halfway (7.50 ml) with Quartz distill HNO3. screw
back on cap and place onto hotplate for cleaning.
e. Reduced Column Chemistry for Re and HSE (after Os extraction)
i. Fill columns with 1.6 ml of resin (AG 1× 8 100-200 mesh, cleaned for PGE)
ii. Clean with 10 ml Milli-Q water (Fig. 25a)
iii. Clean with 10 ml 8N HNO3 (2×)
1) Make sure to use the Quartz distilled acid
iv. Clean with 2 ml Milli-Q water
v. Clean with quartz distilled HCl
vi. Equilibrate with 2 ml 0.8N HNO3 (2×)
vii. Load centrifuged samples (liquid only) into
columns.
1) Throw centrifuge tubes into the trash.
viii. Elute 5 ml 0.8N HNO3
ix. Elute with 2 ml 0.8N HNO3 (2×)
x. Elute with 5ml 1M HCl
xi. Elute with 2ml of 0.8M HNO3
1) Use Teflon distilled acid.
xii. Remove catch cups and dispose the waste in the appropriate waste container.

Lynnette Pitcher GEOL393
47
xiii. Replace the catch cups with four new Teflon vessels (labeled Re1, Re2, Re3,
and Re4) under the columns
1) Collect 10 ml 6N HNO3 into Teflon vessels (Fig 25b)
2) Place under heat lamp to dry down.
xiv. Remove the Teflon vessels 1, 2, 3, and 4 from hotplate. Pour the quartz distill
HNO3 into the appropriate waste container. Place the Teflon vessels (relabeled
Ru, Pt, and Ir) under the columns.
1) Collect 15 ml 13.5N HNO3 into Teflon vessels
2) Place under heat lamp to dry down.
xv. Place four new Teflon vessels (labeled Pd1, Pd2, Pd3, and Pd4) under columns
1) Elute 1 ml H2O
2) Collect 15 ml 10N HCl
3) Place under heat lamp to dry down.
f. AFTER samples have dried and you can see visible residue on the bottom of the
Teflon vessels, re-cleaning the samples with 0.25ml anion exchange columns is
imperative. Re-clean samples as follows:
i. Dissolve all the samples in 2ml of 6M HNO3 and place on hotplate to dissolve
for an hour.
ii. Mix sample Re1, Ru1, Ir1, Pt1, and Pd1 together in one of the Teflon vessels
marked for sample 1 (e.g. Re1). Do the same for all the other samples; mix
Re2, Ru2, Ir2, Pt2, and Pd2 together in a Teflon vessel marked for sample 2
(e.g. Re2).
iii. Placed the mixed samples under a heat lamp to dry down.
iv. Dissolve the samples in 2ml of 0.8M HNO3 and place on hotplate.
v. Take four 0.25ml Teflon columns out of the acid bath. Rinse with Milli-Q
water.
vi. Place some quartz wool (the size of the tip a pinkie finger) inside each column.
Using a glass stirring rod push the quartz wool down to the bottom of the
column. DO NOT pack down or force the wool down, it will slow down the
rate of rinsing.
vii. Fill the columns with 0.25ml of resin (AG 1× 8 100-200 mesh, cleaned for
PGE). Be careful
g. Cleaning up
i. Wrap the columns tightly in plastic wrap and disregard into the trash can.
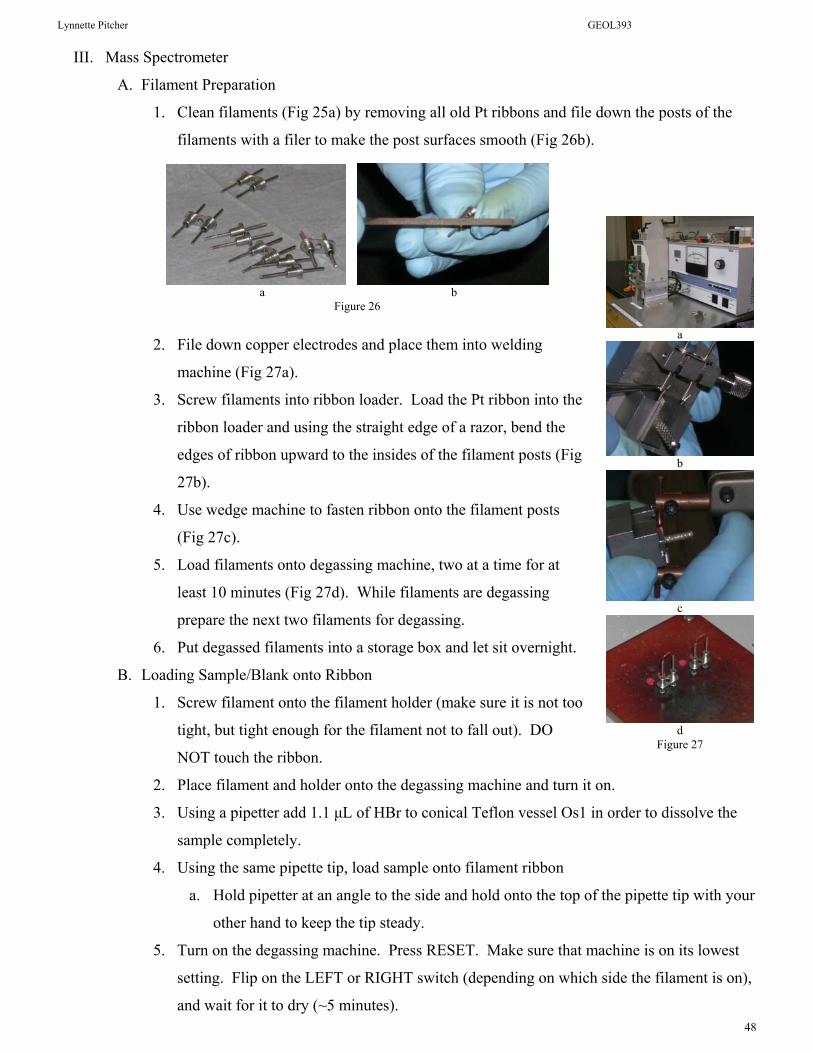
Lynnette Pitcher GEOL393
48
a
b
c
d
Figure 27
III. Mass Spectrometer
A. Filament Preparation
1. Clean filaments (Fig 25a) by removing all old Pt ribbons and file down the posts of the
filaments with a filer to make the post surfaces smooth (Fig 26b).
2. File down copper electrodes and place them into welding
machine (Fig 27a).
3. Screw filaments into ribbon loader. Load the Pt ribbon into the
ribbon loader and using the straight edge of a razor, bend the
edges of ribbon upward to the insides of the filament posts (Fig
27b).
4. Use wedge machine to fasten ribbon onto the filament posts
(Fig 27c).
5. Load filaments onto degassing machine, two at a time for at
least 10 minutes (Fig 27d). While filaments are degassing
prepare the next two filaments for degassing.
6. Put degassed filaments into a storage box and let sit overnight.
B. Loading Sample/Blank onto Ribbon
1. Screw filament onto the filament holder (make sure it is not too
tight, but tight enough for the filament not to fall out). DO
NOT touch the ribbon.
2. Place filament and holder onto the degassing machine and turn it on.
3. Using a pipetter add 1.1 μL of HBr to conical Teflon vessel Os1 in order to dissolve the
sample completely.
4. Using the same pipette tip, load sample onto filament ribbon
a. Hold pipetter at an angle to the side and hold onto the top of the pipette tip with your
other hand to keep the tip steady.
5. Turn on the degassing machine. Press RESET. Make sure that machine is on its lowest
setting. Flip on the LEFT or RIGHT switch (depending on which side the filament is on),
and wait for it to dry (~5 minutes).
a b
Figure 26
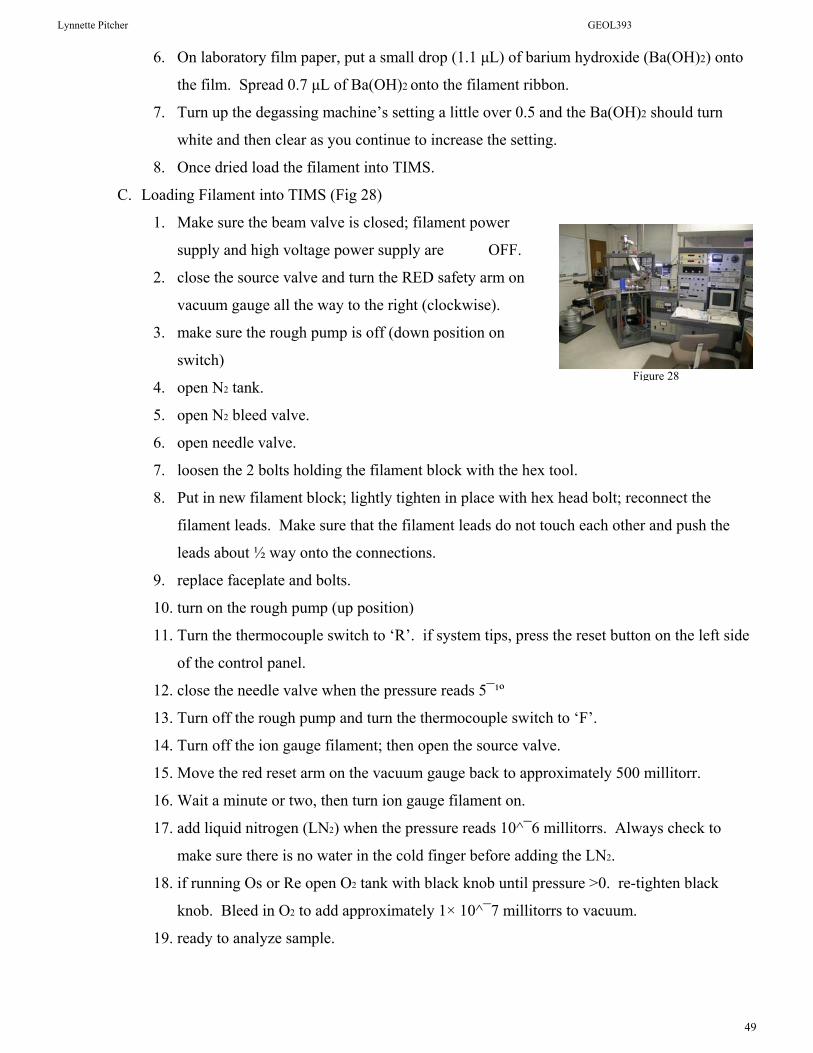
Lynnette Pitcher GEOL393
49
Figure 28
6. On laboratory film paper, put a small drop (1.1 μL) of barium hydroxide (Ba(OH)2) onto
the film. Spread 0.7 μL of Ba(OH)2 onto the filament ribbon.
7. Turn up the degassing machine’s setting a little over 0.5 and the Ba(OH)2 should turn
white and then clear as you continue to increase the setting.
8. Once dried load the filament into TIMS.
C. Loading Filament into TIMS (Fig 28)
1. Make sure the beam valve is closed; filament power
supply and high voltage power supply are OFF.
2. close the source valve and turn the RED safety arm on
vacuum gauge all the way to the right (clockwise).
3. make sure the rough pump is off (down position on
switch)
4. open N2 tank.
5. open N2 bleed valve.
6. open needle valve.
7. loosen the 2 bolts holding the filament block with the hex tool.
8. Put in new filament block; lightly tighten in place with hex head bolt; reconnect the
filament leads. Make sure that the filament leads do not touch each other and push the
leads about ½ way onto the connections.
9. replace faceplate and bolts.
10. turn on the rough pump (up position)
11. Turn the thermocouple switch to ‘R’. if system tips, press the reset button on the left side
of the control panel.
12. close the needle valve when the pressure reads 5¯¹º
13. Turn off the rough pump and turn the thermocouple switch to ‘F’.
14. Turn off the ion gauge filament; then open the source valve.
15. Move the red reset arm on the vacuum gauge back to approximately 500 millitorr.
16. Wait a minute or two, then turn ion gauge filament on.
17. add liquid nitrogen (LN2) when the pressure reads 10^¯6 millitorrs. Always check to
make sure there is no water in the cold finger before adding the LN2.
18. if running Os or Re open O2 tank with black knob until pressure >0. re-tighten black
knob. Bleed in O2 to add approximately 1× 10^¯7 millitorrs to vacuum.
19. ready to analyze sample.

Lynnette Pitcher GEOL393
50
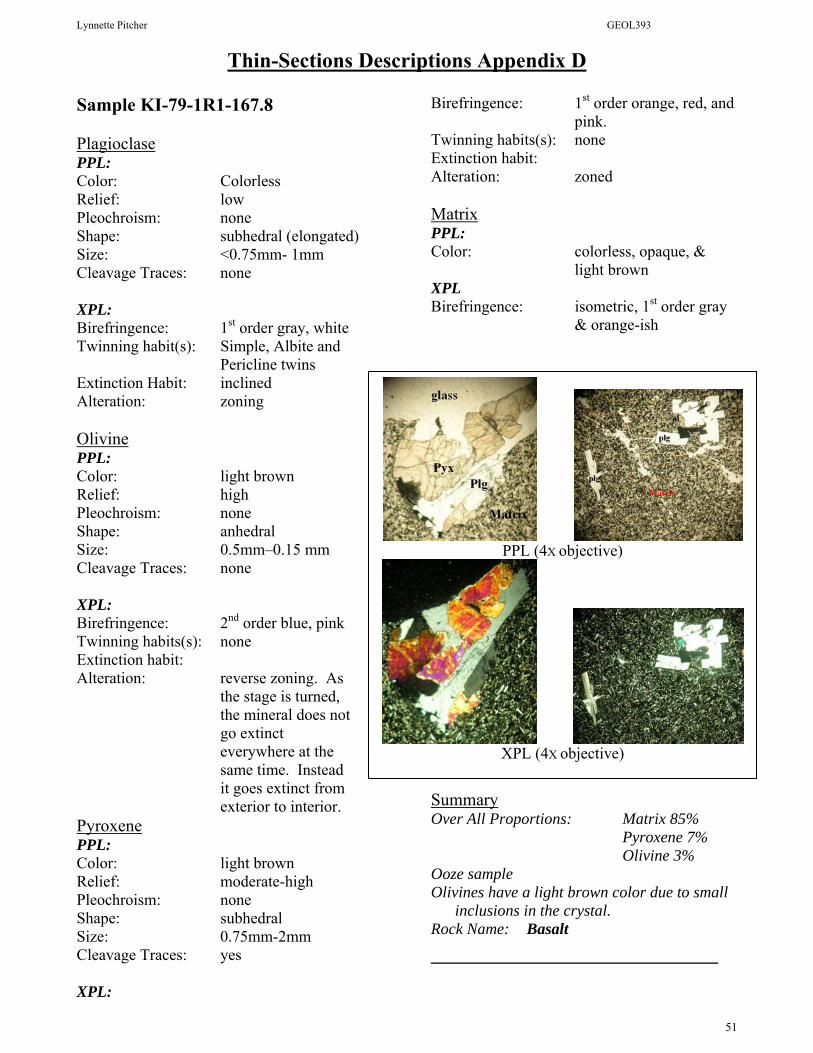
Lynnette Pitcher GEOL393
51
PPL (4Х objective)
XPL (4Х objective)
Thin-Sections Descriptions Appendix D Sample KI-79-1R1-167.8 Plagioclase PPL: Color: Colorless Relief: low Pleochroism: none Shape: subhedral (elongated) Size: <0.75mm- 1mm Cleavage Traces: none XPL: Birefringence: 1st order gray, white Twinning habit(s): Simple, Albite and
Pericline twins Extinction Habit: inclined Alteration: zoning Olivine PPL: Color: light brown Relief: high Pleochroism: none Shape: anhedral Size: 0.5mm–0.15 mm Cleavage Traces: none XPL: Birefringence: 2nd order blue, pink Twinning habits(s): none Extinction habit: Alteration: reverse zoning. As
the stage is turned, the mineral does not go extinct everywhere at the same time. Instead it goes extinct from exterior to interior.
Pyroxene PPL: Color: light brown Relief: moderate-high Pleochroism: none Shape: subhedral Size: 0.75mm-2mm Cleavage Traces: yes XPL:
Birefringence: 1st order orange, red, and pink.
Twinning habits(s): none Extinction habit: Alteration: zoned Matrix PPL: Color: colorless, opaque, &
light brown XPL Birefringence: isometric, 1st order gray
& orange-ish
Summary Over All Proportions: Matrix 85% Pyroxene 7% Olivine 3% Ooze sample Olivines have a light brown color due to small
inclusions in the crystal. Rock Name: Basalt
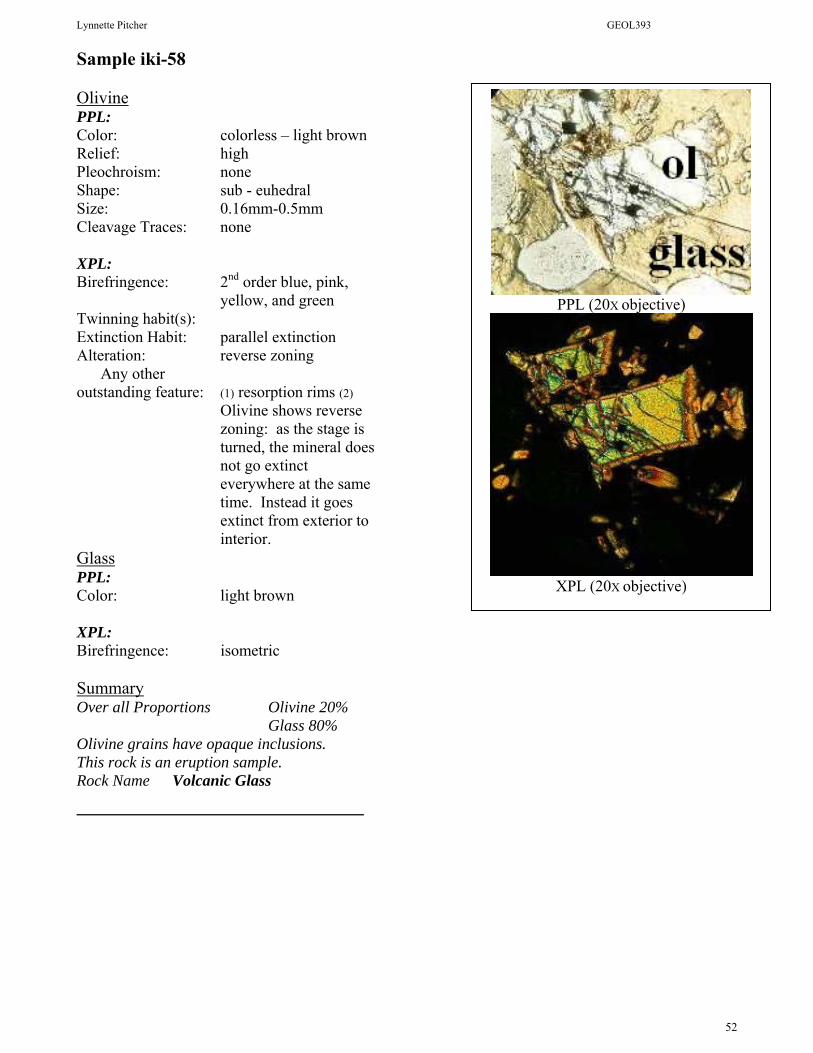
Lynnette Pitcher GEOL393
52
PPL (20Х objective)
XPL (20Х objective)
Sample iki-58 Olivine PPL: Color: colorless – light brown Relief: high Pleochroism: none Shape: sub - euhedral Size: 0.16mm-0.5mm Cleavage Traces: none XPL: Birefringence: 2nd order blue, pink,
yellow, and green Twinning habit(s): Extinction Habit: parallel extinction Alteration: reverse zoning
Any other outstanding feature: (1) resorption rims (2)
Olivine shows reverse zoning: as the stage is turned, the mineral does not go extinct everywhere at the same time. Instead it goes extinct from exterior to interior.
Glass PPL: Color: light brown XPL: Birefringence: isometric Summary Over all Proportions Olivine 20% Glass 80% Olivine grains have opaque inclusions. This rock is an eruption sample. Rock Name Volcanic Glass

Lynnette Pitcher GEOL393
53
PPL (4Х objective)
XPL (4Х objective)
Sample Iki-22 (S-5) Olivine PPL Color: colorless Relief: high Pleochroism: none Shape: sub-euhedral Size: 0.5mm-2mm Cleavage Traces: none XPL Birefringence: 2nd order pink, blue,
and green Twinning habit(s): none Extinction Habit: parallel extinction Alteration: washed color. As if
there has been weathering, but this confuses me because KILL is a closed system.
Any other outstanding feature: (1) resorption rims in
the fractures of the olivine grains. (2) opaque inclusions in the olivine grains.
Glass PPL Color: light brown XPL Birefringence: isometric Summary Over all Proportions: Glass 75% Olivine 25% Eruption sample Rock name

Lynnette Pitcher GEOL393
54
PPL (4Х objective)
XPL (4Х objective)
Sample KI-67-3-39.0 Pyroxene PPL Color: light brown Relief: moderate-high Pleochroism: none Shape: sub-anhedral Size: 05.mm-2mm Cleavage Traces: multi directional XPL Birefringence: 1st order orange and red-
ish-pink, tan, gray Twinning habit(s): none Extinction Habit: ~90° extinction angle Alteration: yes
Any other outstanding feature: (1) ooze squeezing
through the fractures of the pyroxenes.
Olivine PPL Color: colorless Relief: high Pleochroism: none Shape: sub - euhedral Size: 1mm-1.25mm Cleavage Traces: none XPL Birefringence: 2nd order green, blue, and
yellow Twinning habits(s): none Extinction habit: parallel extinction Alteration: none
Any other outstanding feature: (1) opaque inclusions in
the olivine grains. (2) Faint planar extinction in one of the minerals observed, but over all parallel extinction.
Matrix PPL Color: light brown color,
colorless, opaque spots XPL Birefringence: 1st order gray, black,
brown, red-ish orange. 2nd order pink and blue.
Twinning habits(s): twinning is noticeable.
Summary Over all Proportions Matrix 65% Olivine 15% Pyroxene 20% Ooze sample Large Olivine phenocrysts with opaque
inclusions Rock Name Basalt
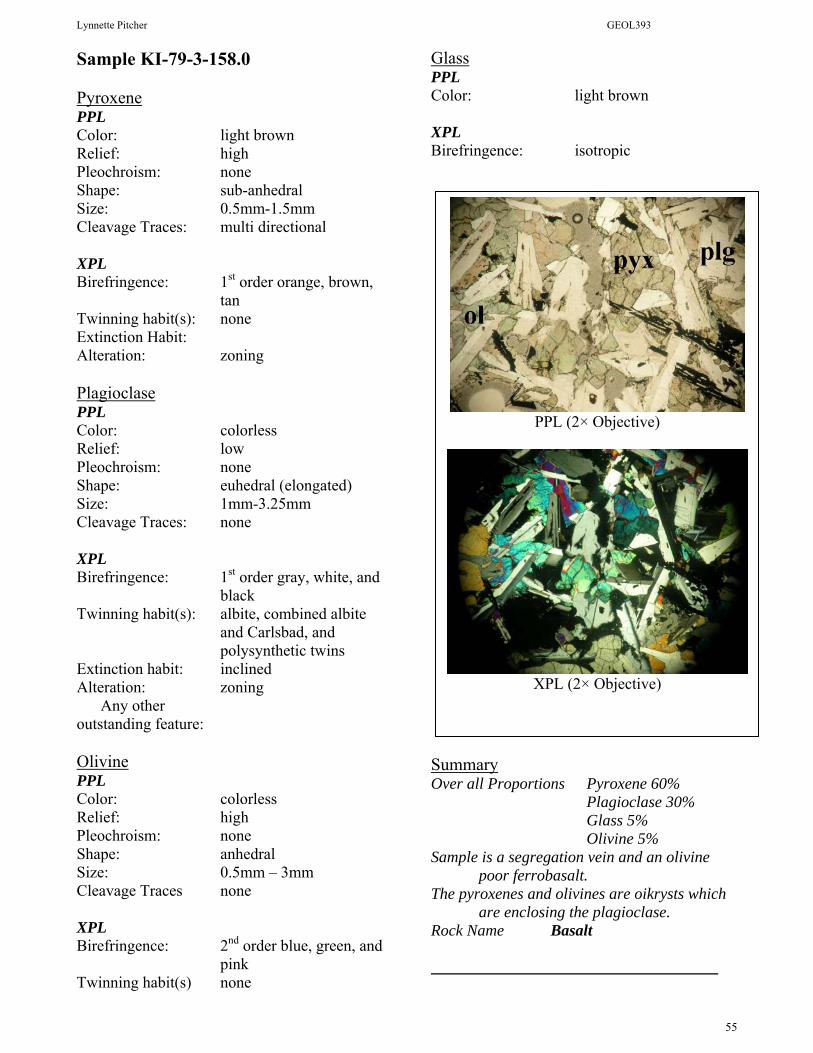
Lynnette Pitcher GEOL393
55
PPL (2× Objective)
XPL (2× Objective)
Sample KI-79-3-158.0 Pyroxene PPL Color: light brown Relief: high Pleochroism: none Shape: sub-anhedral Size: 0.5mm-1.5mm Cleavage Traces: multi directional XPL Birefringence: 1st order orange, brown,
tan Twinning habit(s): none Extinction Habit: Alteration: zoning Plagioclase PPL Color: colorless Relief: low Pleochroism: none Shape: euhedral (elongated) Size: 1mm-3.25mm Cleavage Traces: none XPL Birefringence: 1st order gray, white, and
black Twinning habit(s): albite, combined albite
and Carlsbad, and polysynthetic twins
Extinction habit: inclined Alteration: zoning
Any other outstanding feature: Olivine PPL Color: colorless Relief: high Pleochroism: none Shape: anhedral Size: 0.5mm – 3mm Cleavage Traces none XPL Birefringence: 2nd order blue, green, and
pink Twinning habit(s) none
Glass PPL Color: light brown XPL Birefringence: isotropic
Summary Over all Proportions Pyroxene 60% Plagioclase 30% Glass 5% Olivine 5% Sample is a segregation vein and an olivine
poor ferrobasalt. The pyroxenes and olivines are oikrysts which
are enclosing the plagioclase. Rock Name Basalt

Lynnette Pitcher GEOL393
56
PPL (4Х objective)
XPL (4Х objective)
Sample KI-81-1-169.9 Olivine PPL Color: colorless Relief: high Pleochroism: none Shape: sub-euhedral (some
minerals show a six sided shape)
Size: 1.5mm-3mm Cleavage Traces: none XPL Birefringence: 2nd order pink,
yellow, blue, green, and purple.
Twinning habit(s): none Extinction Habit: planar and parallel
extinction Alteration: none
Any other outstanding feature: opaque inclusions in
the olivine grains Plagioclase PPL Color: colorless Relief: low Pleochroism: none Shape: anhedral Size: ≤ 0.5mm Cleavage Traces: none XPL Birefringence: 1st order gray, white, and
black Twinning habits(s): polysynthetic and simple
twins Extinction habit: inclined Alteration: zoning Summary Over all Proportions Olivine 70% Plagioclase 30% Some olivine minerals are well rounded, while
others have a six sided shape. Rock Name Porphyritic Basalt
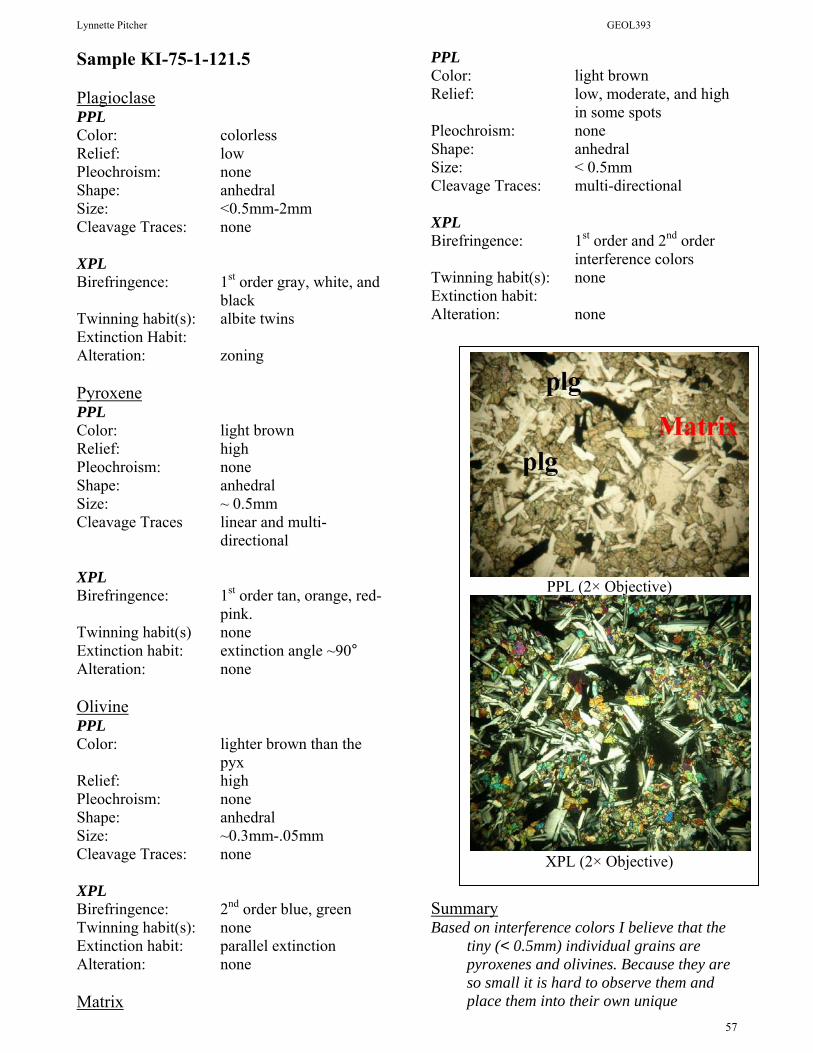
Lynnette Pitcher GEOL393
57
PPL (2× Objective)
XPL (2× Objective)
Sample KI-75-1-121.5 Plagioclase PPL Color: colorless Relief: low Pleochroism: none Shape: anhedral Size: <0.5mm-2mm Cleavage Traces: none XPL Birefringence: 1st order gray, white, and
black Twinning habit(s): albite twins Extinction Habit: Alteration: zoning Pyroxene PPL Color: light brown Relief: high Pleochroism: none Shape: anhedral Size: ~ 0.5mm Cleavage Traces linear and multi-
directional XPL Birefringence: 1st order tan, orange, red-
pink. Twinning habit(s) none Extinction habit: extinction angle ~90° Alteration: none Olivine PPL Color: lighter brown than the
pyx Relief: high Pleochroism: none Shape: anhedral Size: ~0.3mm-.05mm Cleavage Traces: none XPL Birefringence: 2nd order blue, green Twinning habit(s): none Extinction habit: parallel extinction Alteration: none Matrix
PPL Color: light brown Relief: low, moderate, and high
in some spots Pleochroism: none Shape: anhedral Size: < 0.5mm Cleavage Traces: multi-directional XPL Birefringence: 1st order and 2nd order
interference colors Twinning habit(s): none Extinction habit: Alteration: none
Summary Based on interference colors I believe that the
tiny (< 0.5mm) individual grains are pyroxenes and olivines. Because they are so small it is hard to observe them and place them into their own unique

Lynnette Pitcher GEOL393
58
PPL (2× Objective)
XPL (2× Objective)
category, therefore I am going to put the smaller grains into the matrix category; making the composition of the matrix to be composed of olivine, pyroxene, and plagioclase (I can see some twinning in the matrix).
Over all Proportions Plagioclase 60% Matrix 40% Rock Name Basalt Sample KI-67-3-8.2 Pyroxene PPL Color: light brown Relief: high Pleochroism: none Shape: subhedral Size: 1.5mm-3.5mm Cleavage Traces: linear cleavage XPL Birefringence: 1st order orange and red Twinning habit(s): none Extinction Habit: extinction angle ~90° Alteration: none Olivine PPL Color: lighter brown than the
pyx Relief: high Pleochroism: none Shape: subhedral Size: 0.5mm-3mm ≥ Cleavage Traces: none XPL Birefringence: 2nd order yellow, blue,
pink Twinning habit(s): none Extinction habit: parallel extinction Alteration: resorption rims Plagioclase PPL Color: colorless Relief: low Pleochroism: none Shape: euhedral (elongated)
Size: ~0.5mm-1.5mm Cleavage Traces: none XPL Birefringence: 1st order gray and white Twinning habit(s): simple and polysynthetic
twins Extinction habit: inclined Alteration: zoning Matrix PPL Color: light brown, black
opaque spots, and colorless
XPL Birefringence: 1st order colors to 2nd
order pink.

Lynnette Pitcher GEOL393
59
PPL (2× Objective)
XPL (2× Objective)
Twinning habit(s): Twinning is noticeable Summary Over all Proportions Pyroxene 25% Olivine 20% Matrix+ Plagioclase
55% Rock is an Ooze sample and the most
differentiated. Note: It was hard for me to distinguish
between olivine and pyroxene because they each share the same characteristics. For example, the olivine in the picture for this sample is showing 2nd order colors and absorption rims, which is associated with Olivine minerals, BUT the same minerals are showing linear cleavages, which are associated with pyroxenes.
I am going to do deduce by using the
Bowen’s Reaction Scale that the reason why so many of the olivine minerals are looking like the pyroxene minerals is because the olivine was half way turning into a pyroxene.
Rock Name Basalt Sample KI-67-2-82.5 Plagioclase PPL Color: colorless Relief: low Pleochroism: none Shape: euhedral (elongated) Size: ≤ 1.5mm Cleavage Traces: none XPL Birefringence: 1st order gray and white Twinning habit(s): albite and Pericline twins Extinction Habit: inclined Alteration: zoning Pyroxene PPL
Color: light brown Relief: high Pleochroism: none Shape: subhedral Size: 0.5mm-1.5mm Cleavage Traces: multi-directional XPL Birefringence: 1st order brown and
orange Twinning habits(s): none Extinction habit: Some of the pyroxenes
are showing extinction similar to bird’s eye, where the whole mineral does not go completely extinct with full rotation of stage. Therefore I am going to deduce that there was alteration.
Alteration: yes Any other
outstanding feature:

Lynnette Pitcher GEOL393
60
PPL (2× Objective)
Olivine PPL Color: light brown Relief: high Pleochroism: none Shape: subhedral Size: ≤ 1mm Cleavage Traces: none XPL Birefringence: 2nd order blue, pink,
green Twinning habit(s): none Extinction habit: parallel extinction;
extinction angle 90°-95° Alteration: resorption rims Matrix PPL Color: light brown, colorless,
black opaque spots. XPL Birefringence: 1st order black and
brown Twinning habit(s): twinning is noticeable in
matrix Summary Over all Proportion Matrix + Plagioclase
90% Pyroxene5% Olivine 5% Rock Name Basalt/Ooze Sample KI-67-2-85.5 Plagioclase PPL Color: colorless Relief low Pleochroism: none Shape: euhedral (elongated) Size: 0.5mm-2mm Cleavage Traces: none XPL Birefringence: 1st order gray, and white Twinning habit(s): simple, albite, and
Pericline twins
Extinction Habit: symmetrical Alteration: zoning
Any other outstanding feature: large number of
plagioclase is zoning Pyroxene PPL Color: light brown Relief high Pleochroism: none Shape: subhedral Size: 0.5mm-1.5mm Cleavage Traces: linear
XPL Birefringence: 1st order brown and
orange. Twinning habits(s): none

Lynnette Pitcher GEOL393
61
Extinction habit: pyroxenes are showing a bird’s eye type of extinction, where it does not go completely extinct with rotation of the stage. There fore I am going to deduce that there has been some kind of alteration.
Alteration: Yes Any other
outstanding feature: The pyroxenes are enclosing the plagioclase minerals, functioning as oikcrysts
Olivine PPL Color: light brown Relief: high Pleochroism: none Shape: anhedral Size: ≤ 1mm Cleavage Traces: none XPL Birefringence: 2nd order blue, yellow,
green, purple. Twinning habits(s): none Extinction habit: parallel extinction Alteration: none
Any other outstanding feature: olivine minerals appear
to enclose the plagioclase minerals and are therefore functioning as oikcrysts.
Glass PPL Color: brown XPL Birefringence: isometric Summary Over all Proportions Glass 58% Pyroxene 10% Plagioclase 20% Olivine 2% Rock Name Basalt/Ooze