the behaviour of thin stemmed - mcgill universitydigitool.library.mcgill.ca/thesisfile61762.pdf ·...
TRANSCRIPT
c
'C
THE BEHAVIOUR OF THIN STEMMED
PRECAST PRESTRESSED CONCRETE MEMBERS
WITH DAPPED ENDS
by
KIN MAN PETER SO
Department of Civil Engineering and Applied Mechanics
McGill University
Montreal, Canada
June 1989
A thesis submitted to the Faculty of Graduate Studies
and Research in partial fulfillment of the requirements
for the degree of Master of Engineering
@ Peter K. M. So 1989
The Short Topic is:
Behaviour of Thin Stemmed Precast Concrete Members with Dapped Ends
by
KIN MAN PETER 80
Department of civil Engineering and Applied Mechanics
McGill University
Montreal, Canada
June 1989
1

To rny parents
, 1 Il l'
(
(
ABSTRACT
In this research programme, the behaviour of thin stemmed precast prestressed
concrete members with dapped ends was investigated. Two different "strut-and-tie"
models were developed for the design of the dapped end specimens. Based on these
models, two different reinforcement .'1chemes in the form of removable reinforcing
"cages" were developed for rectangular and inclined dapped ends, respectively. In order
to study these reinforcement schemes, two slmply supported prestrc'3sed concrete mem
bers, each representing one half of a standard double-tee section and consisting of four
different dapped end specimens, were test,ed under both vertical load and horizontal
tension. A non-linear finite element program FIELDS was used to predict the response
of the test specimens. The predictions obtained from FIELDS and the "strut-and-tie"
models were compared with the results acquired from the test.

RESUME
Le comportement de poutres préfabriquées fait de béton précontraint ayant de
âmes étroites et extrémités entaillées furent l'objet de ce programme de recherche.
Deux modèles simples constitués de réseaux d'éléments agissant en compression ou en
tension furent dévelopés pour ces poutres. Ceci permit le développement de deux cages
d'armature pour les poutres à extrémités entaillées et rectangulaire respectivement.
Pour vérifier le comportement théorique de ces deux modèles, deux poutres précon-
traintes à appuie simple furent testées sous l'application de charges verticales et de
charges horizontales en tension. Ces poutres représentaient la moitié d'une poutre
double-tee standard et consistaient d'un total de quatre différentes extrémités entaillées.
Un programme d'ordinateur, FIELDS, effectuant des analyses non-linéaire à élément
fini, fut utilisé pour prédire le comportment de ces poutres, et une comparaison fut
faîte avec les prédictions des modèles théoriques.
ii

c
- -------~-----_._-----
ACKNOWLEDGMENTS
The author wishes to express his sincere thanks to Professor D. Mitchell for his
invaluable guidance and useful suggestions throughout this research programme.
In addition the author would like to thank Dr. W. D. Cook for his informative
discussions and helpful assistance in both the experimental and analytical phases of
this research programme.
The writer would like to express his gratitude to the Department of Civil Engineer
ing and Applied Mecbanics, McGill University, for providing the fadlities necessary for
carrying out this research programme. The assistance provided by Mr. B. Cockayne
and Mr. R. Sheppard is gn.tefully acknowledged. The author would like to extend his
appreciation to aIl the fellow students who had contributed their valuable assistance in
this research programme.
Finally, the author would like to thank the Natural Sciences and Engineering
Research Council of Canada for providing the financial support for this research pro
gramme.
iii
Il -
TABLE OF CONTENTS
1 INTRODUCTION 1.1 Introduction
1.2 Previous Work
1.2.1 Experiments on Dapped End Beams
1.2.2 Strut-and-Tie Model
1.2.3 Computer Model
1.3 Objectives . . .
2 EXPERIMENTAL PROGRAMME 2.1 Introduction . .
2.2 Design of the Test Specimens
2.2.1 Design Criteria
2.2.2 Test Specimens
2.2.2.1 Dapped end specimens D-IR and D-lS .
2.2.2.2 Dapped end specimens D-2R and D-2S
2.3 Material
2.3.1 Concrete .
2.3.2 Reinforcing Steel .
2.4 Fabrication of the Test Specimens
2.5 Test Set-up ...
2.6 Instrumentation and Testing Procedure
3 EXPERIMENTAL RESULTS 3.1 Introduction .
3.2 Response of Specimen D-IR
3.3 Response of SpeCImen D-lS
3.4 Response of Specimen D-2R
3.5 Response of Specimen D-2S
3.6 Overall Summruy of the Results .
4 Strut-and-Tie Models
4.1 Introduction ....... .
4.2 General Development Procedure for "Strut-and-tie" Model
4.3 "Strut-and-Tie" Models for Dapped Ends
4.4 Design Procedures for Dapped Ends
iv
1
1
3
3 17 19
20
22
22
22
22
23
24
30 33
33 36
37
39
42
45
45
45
49 52
57 62
65
65
67
68 72
(
c
- --------------------------
4.5 Numerical Design Example for Dapped Ends . .
4.5.1 Design example for rectangular dapped ends
4.5.2 Design example for inclined dapped ends
4.6 Prediction of the Failure Loads by "Strut-and-Tie" Models
4.6.1 Specimen D-IR and D-2R
4.6.2 Specimen D-1S and D-2S
1) Computer ModeJs .
5.1 Introduction . .
5.2 Program FIELDS
5.3 Program Logic
5.4 Evaluation of Tangent Stiffness for CFTQ and CFTT Elements
5.5 Computer Models for the Test Specimens
5.5.1 Development of the computer model .
5.5.2 Computer analysis for specimen D-2R
5.5.3 Computer analysis for specimen D-1R
5.5.4 Computer analysis for specimen D-2S
5.5.5 Computer analysis for specimen D-1S
78 79
84 88 89 91
94
94
94
95
97
· 104 105
107
110
· . 110
· 114
6 Comparison of Experimental Results and Theoretical Predictions
6.1 Introduction .
116
· 116 6.2 Specimen D-1R
6.3 Specimen D-2R
6.4 Specimen D-1S
6.5 Specimen D-2S
6.6 Comments on the Modeling of the 3pecimens . .
7 Summaryand Conclusions
REFERENCES . . . . .
APPENDIX A - EXPERIMENTAL DATA
A.1 Introduction . . . . .
A.2 Specimens D-1R and D-1S
A.3 Specimens D-2R and D-2S
v
· . 116
120
123
· 125 127
· 129
· . 132
· . 135
· . 135
· 138 145
~
'. LIST OF FIGURES ~
1.1 Flow of Stresses in a Rectangular Dapped End Beam 2
1.2 Flow of Stresses in an Inclined Dapped End 2
1.3 Failure Conditions of Specimens Tested by Hahn. 4
1.4 Design Method Proposed by Reynolds 5
1.5 Summary of Experiments Conducted by Werner and Dilger 6
1.6 Details of Dapped End Specimens Tested by Hamoudi 8
1.7 Design Method Proposed by Mattock and Chan 9
1.8 Summary of the Test Conducted by Mattock and Theryo 12
1.9 Details of the Specimens Tested by Mattock and Theryo 13
1.10 Design Method Proposed by Haywood 15
1.11 Details of the Specimens Tested by Cook and Mitchell 16
1.12 Stress Limits on Nodal Zones given by the CSA Code 18
2.1 Dimensions of the Test Specimens 23
2.2 Flow of Stresses for Specimen D-1R 26
2.3 Strut-and-Tie Model for Specimen D-1R 26
2.4 Truss Idealization for Specimen D-1R . 26
2.5 Reinforcement Scheme for Specimen D-1R 27
2.6 Flow of Stresses for Specimen D-1S 28
2.7 Strut-and-Tie Model for Specimen D-1S 28
2.8 Truss Idealization for Specimen D-1S 28
2.9 Reinforcement Schcme for Specimen D-1S 29
2.10 Strut-and-Tie Model for Specimen D-2R . 31
2.11 Truss Idealization for Specimen D-2R . 31
2.12 Reinforcement Details for Specimen D-2R 32
2.13 Strut-and-Tie Model for Specimen D-2S 34
2.14 Truss Idealization for Specimen D-2S 34
2.15 Reinforcement Details for Specimen D-2S 35
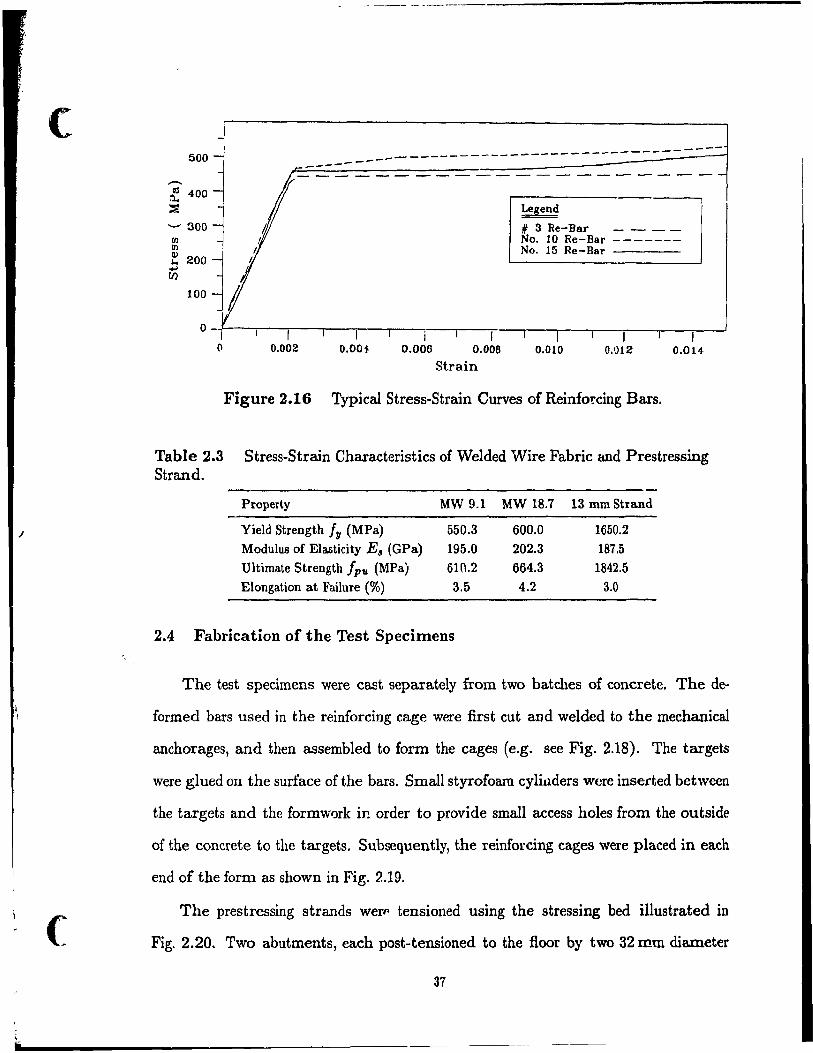
2.16 Typical Stress-Strain Curves of Reinforcing Bars 37
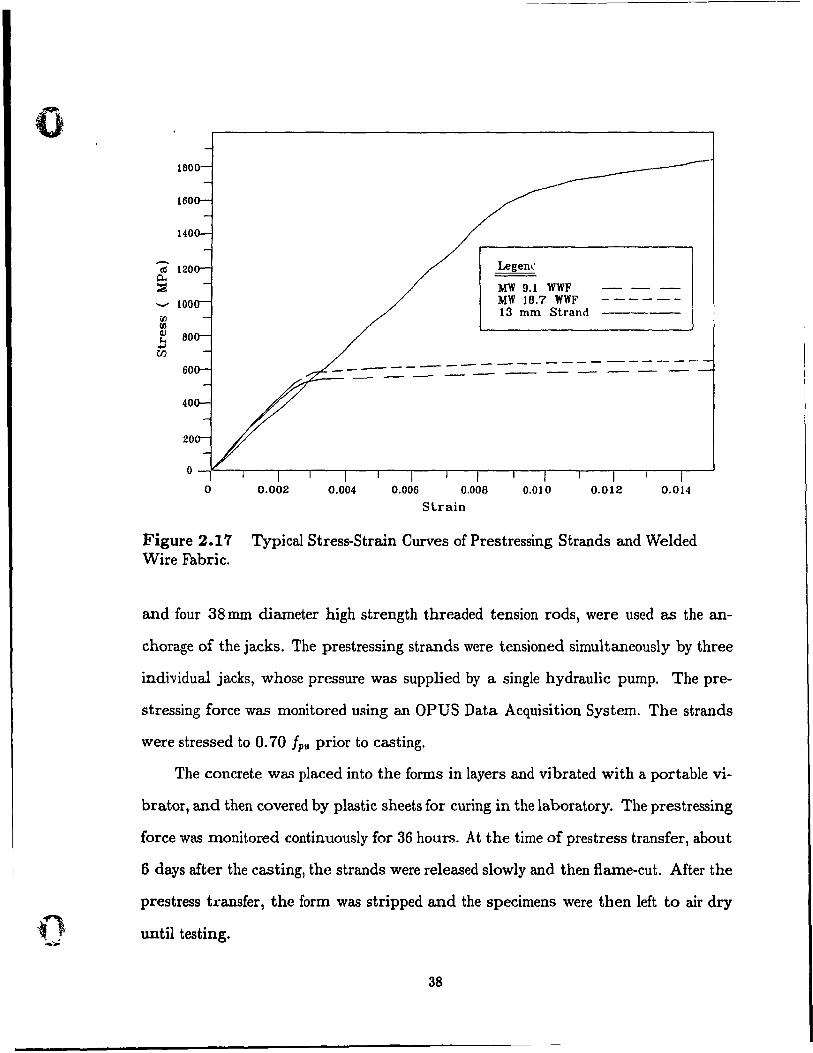
2.17 Typical Stress-Straîn Curves of Prestressing Strands and Welded Wire Fabric 38
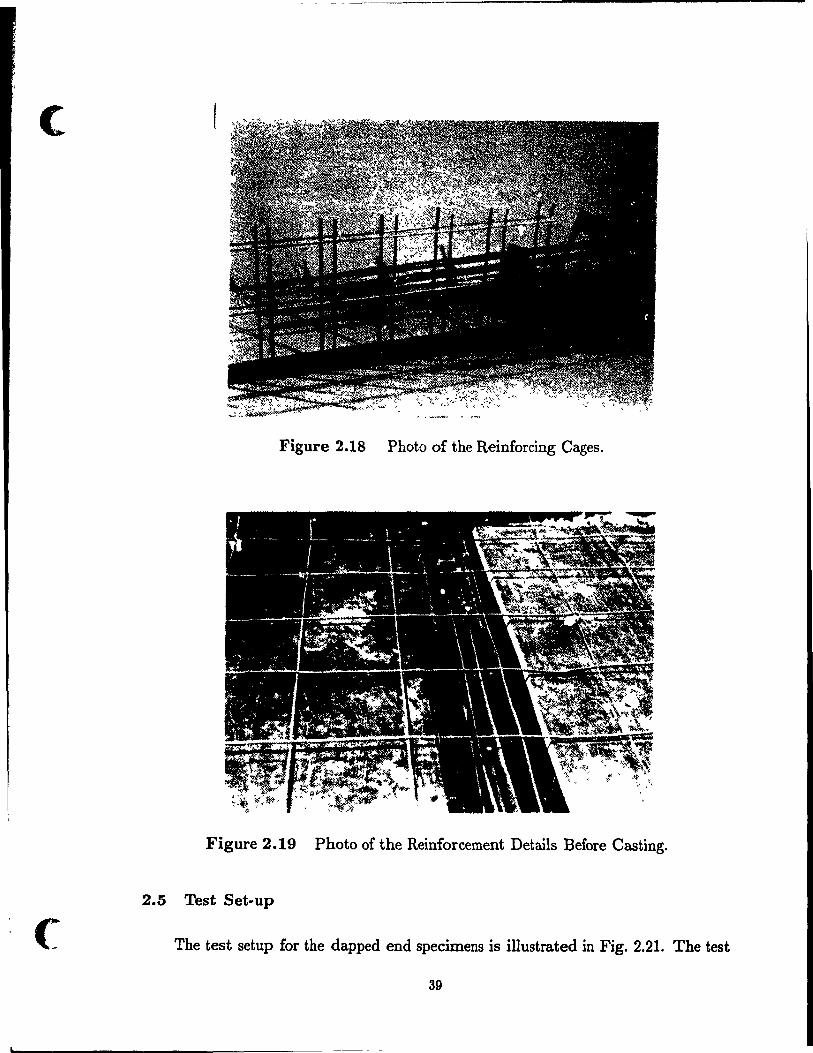
2.18 Photo of the ... i.einforcing Cages 39
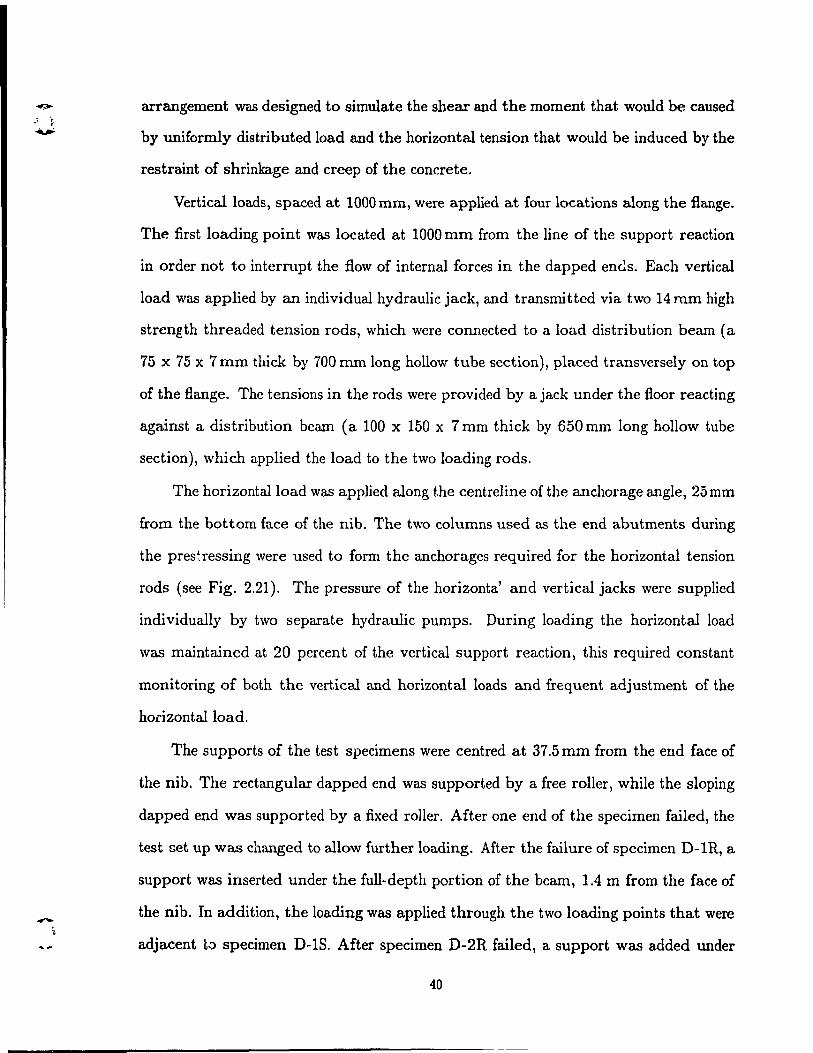
2.19 Photo of the Reinforcement Details Before Casting 39 .... 2.20 'j , Prestressing Bed Set-up 41
....... 2.21 Test Set-up . 41
vi
(
__ _____ _ _ _______ '" _~r~ ___ ... _____ ... ~
2.22 Positioning of Targets OIl the Concrete
2.23 Position of the Steel Targets. ..
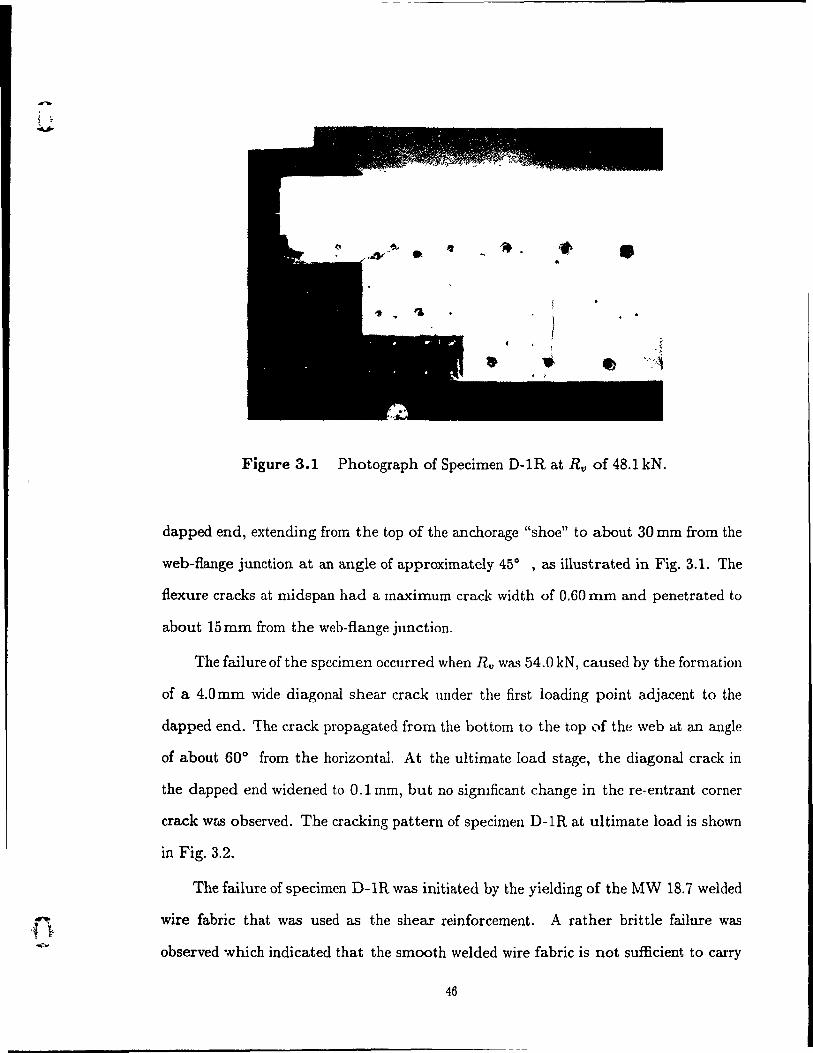
3.1 Photograph of Specimen D~lR at RI) of 48.1kN
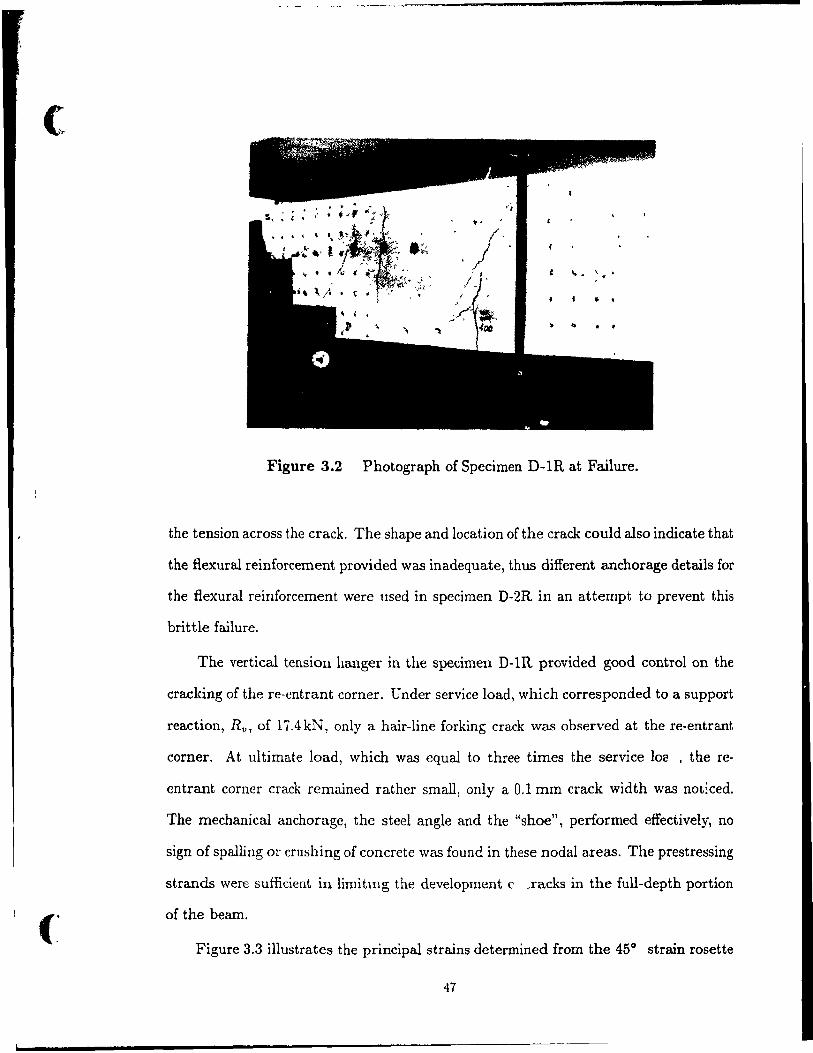
3.2 Photograph of Specimen D-IR at Failure
43
44
46
. 47
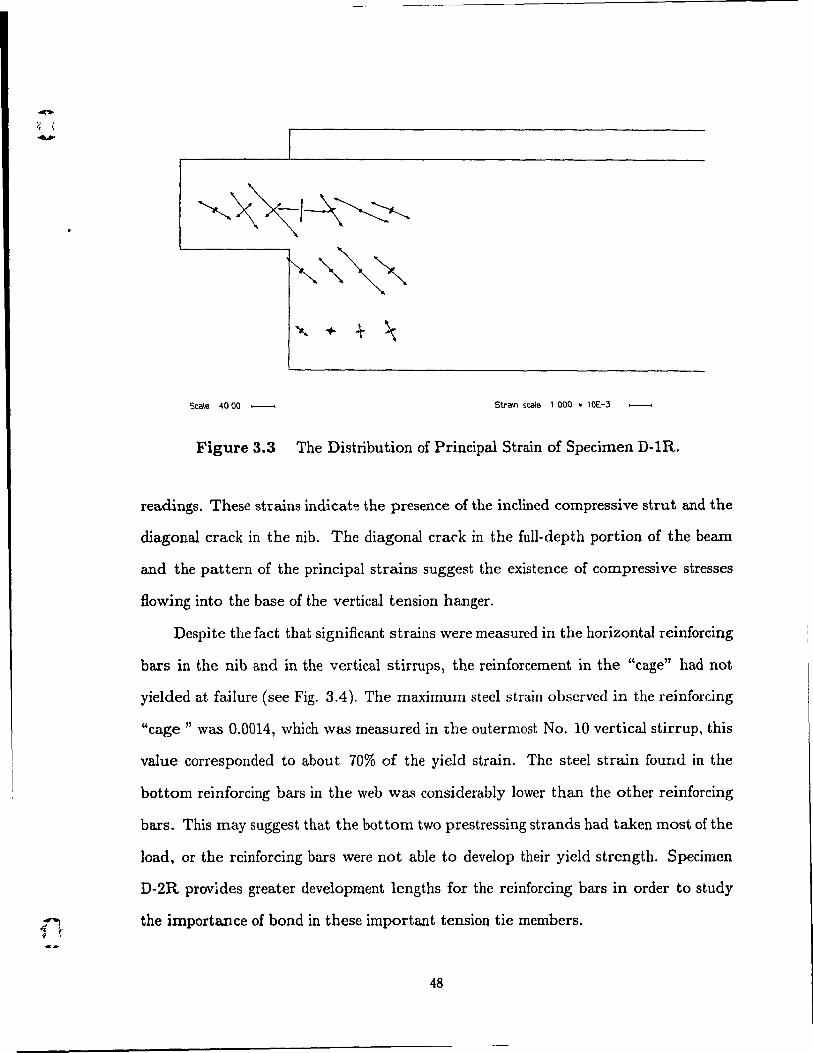
3.3 The Distribution of Principal Strain of Specimen D-'lR 48
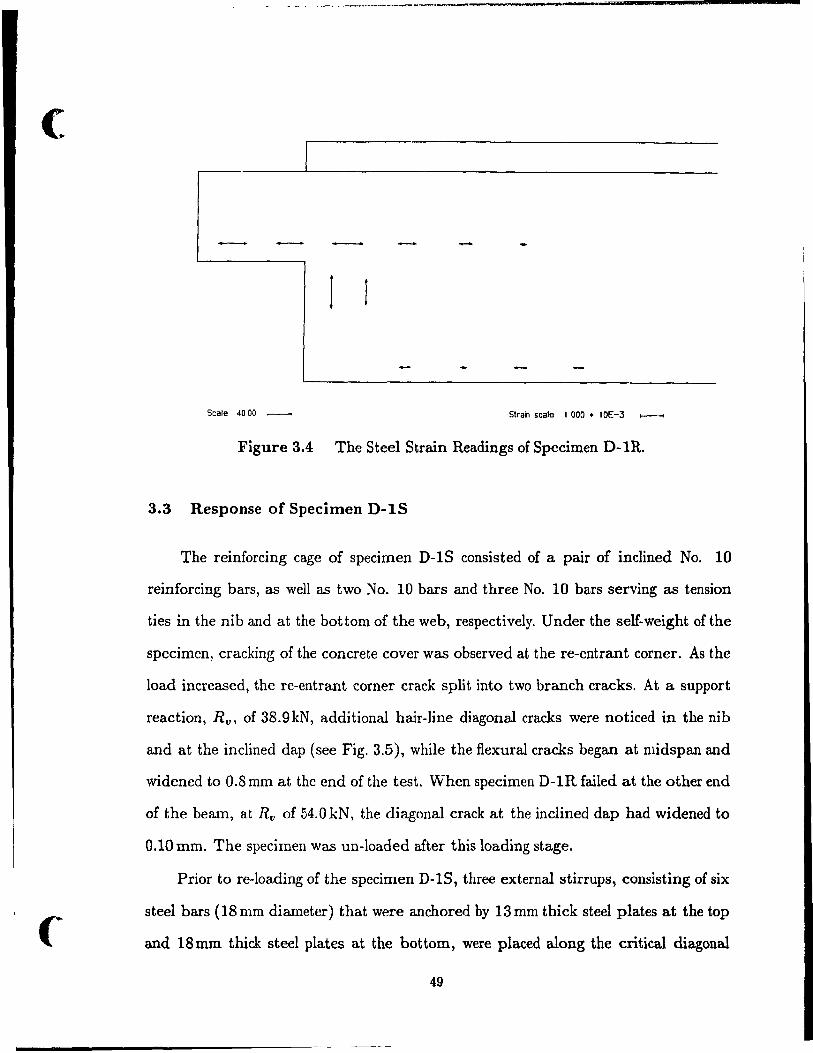
3.4 The Steel Strain Readings of Specimen D-1R ... 49
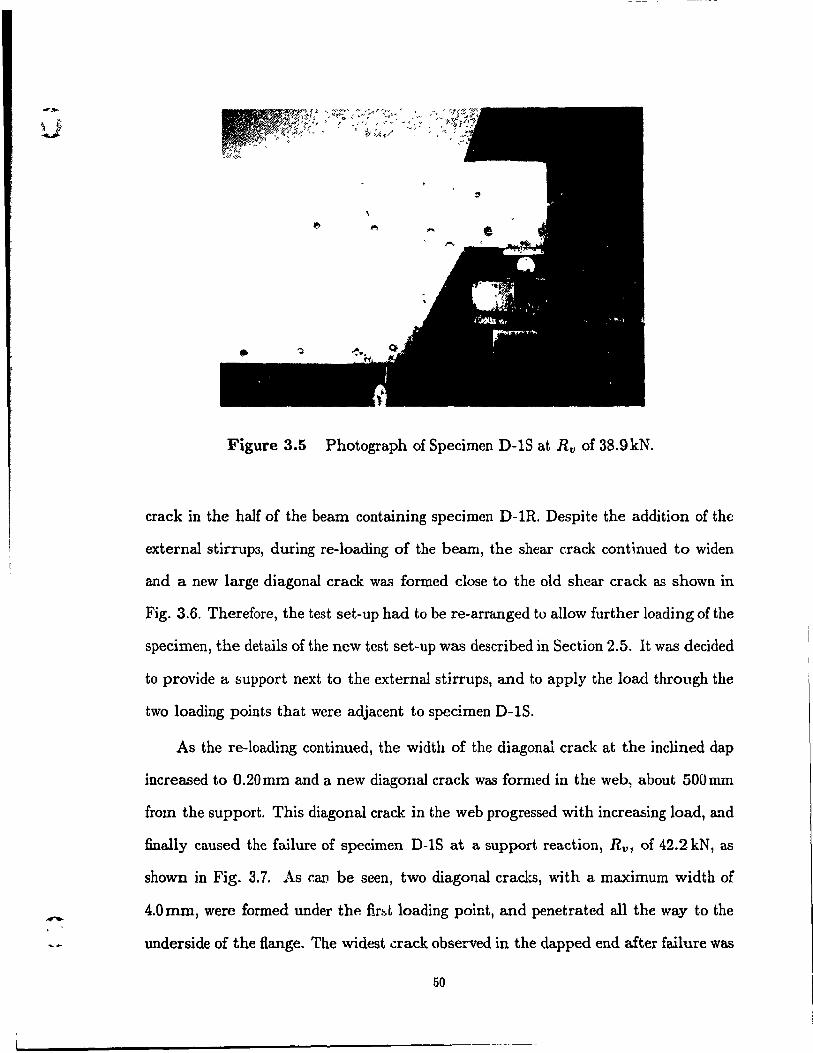
3.5 Photograph of Specimen D-IS at RI) of 38.9kN 50
3.6 Photograph of Additional Diagonal Crack formed during Re-loading 51
3.7 Photograph of Specimen D-lS at Failure. . . . . . 51
3.8 The Distribution of Principal Strain of Specimen D-lS 53
3.9 The Steel Strain Readings of Specimen D-1S 53
3.10 Photograph of Specimen D-2R at RI) of 40.6kN 54
3.11 Photograph of ;':>ecimen D-2R at RI) of 60.2kN 55
3.12 Photograph of Specimen D-2R at Failure 56
3.13 The Distribution of Principal Strain of Specimen D-2R
3.14 The Steel Strain Readings of Specimen D~2R
3.15 Photograph of Specimen D-2S at Rv of 49.1 kN
3.16 Photograph of Specimen D-2S at Rv of 60.2kN
3.17 Photograph of Specimen D-2S at Rv of 68.8kN
3.18 Photograph of Specimen D-2S at Rv of 93.1 kN
3.19 Photograph of Specimen D-2S at Failure .
3.20 The Distribution of Principal Strain of Specimen D-2S
3.21 The Steel Strain Reading:.; of Specimen D-2S ...
4.1 Primary Stress Fields for Rectangular Dapped Ends
4.2 Strut-and-Tie Model for Rectangular Dapped Ends .
4.3 Strut-and-Tie Model for In ~lined Dapped Ends
4.4 Limits on the Inclination Angle of the Uniform Compressive Stress Field, adapted frorn Collins and Mitchell ..
57
58
59
59
60
. . . . 60
61
63
63
69
70
71
72
4.5 Dimensions of a 2400 x 400 mm Double-Tee Section . 78
4.6 Strut-and-Tie Model of Design Example for Rectangular Dapped Ends 81
4.7 Reinforcment Details of Design Example for Rectangular Dapped Ends 81
4.8 Strut-and-Tie Model of D<:sign Example for IncFlned Dapped Ends 85
4.9 Reinforcment Details of Design Example for lncliued Dapped Ends 85
4.10 Strut-and-Tie Model for Specimen D-1R . 90
4.11 Strut-and-Tie Model for Specimen D-2R .
4.12 Strut-and-Tie Model for Specimen D-lS
vii
90
92
il 4.13 Strut-anG-Tie Model for Specimen D-2S . . . . . . . .
5.1' Evaluating Stresses at a Gauss Point of a CFTQ Element
5.2 Average Concrete Stress-Strain Relationships . . . . . .
5.3 Investigating Stresses at Crack Interface. . . . . . . .
5.4 Finite Element Mesh for Rectangular Dapped Ends (Trial 1)
5.5 Finite Element Mesh for Rectangular Dapped Ends (Trial 2)
5.6 Finite Element Mesh for Specimens D-IR and D-2R
5.7 Results of the Computp.r Analysis for Specimen D-2R .
5.8 Results of the Computer Analysis for Specimen D-IR
5.9 Finite Element Mesh for Specimens D-lS and D-2S .
5.10 Results of Computer Analysis for Specimen D-2S . . . .
5.11 Results of the Computer Analysis for Specimen D-1S
6.1 Comparison of the Experimental Results and the Theoretical Predictions for Specimen D-IR . . . . . . . . . .
6.2 Comparison of the Experimental Results and the Theoretical Predictions for Specimen D-2R . . . . . . . . . .
6.3 Comparison of the Experimental Results and the Theoretical Predictions for Specimen D-IS . . . . . . . . . .
6.4 Comparison of the Experimental Results and the Theoretical Predictions for Specimen D-2S . . . .
A.t Positioning of Targets on the Concrete
A.2 Position of the Steel Targets . . . .
viii
92 98
99 101
· 105
· . 107
· . 108 109
111
· 112
· . 113 115
119
121
124
126
· 136
· 137
c
(
- - ----------------------------'"'--"'_.--~
LIST OF TABLES
1.1 Test Results of Mattock and Theryo's Specimens
2.1 Summary of Concrete Properties . . . . . .
2.2 Summary of the Strength of Deformed Bars
14 33
36
2.3 Stress-Strain Characteristics of Welded Wire Fabric and Prestressing Strand 37
4.1 Summary of the Member Forces of Specimen D-1R by "Strut-and-Tie" Model . . . . . . . . . . . . . . . . . 89
4.2 Summary of the Member Forces of Specimen D-2R by "Strut-and-Tie" Model . . . . . . . . . . . . . . . . . 91
4.3 Summary of the Member Forces of Specimen D-lS by "Strut-and-Tie" Model . . . . . . . . . . . . . . . . . 93
4.4 Summary of the Member Forces of Specimen D-2S by "Strut-and-Tie" Modp.1 . . . . . . . . . . . . . 93
6.1 Summary of the Predicted and the Experimental Failure Loads 115
A.1 Measured Loads and Deflections for Specimens D-IR and D-1S
A.2 Con crete Strains for Specimens D-1R and D-1S . . . . . .
A.3 Steel Strains for Specimens D-1R and D-1S ...... .
. 138
. 138
. . 143
A,4 Measured Loads and Deflections for Specimens D-2R and D-2S 145
A.5 Concrete Strains for Specimens D-2R and D-2S . . . . . . 145
A.6 Steel Strains for Specimens D-2R and D-2S ....... 150
A.7 Measured Loads and Defections for Specimen D-2S (Re-Loading).. . 152
A.8 Concrete Strains for Specimen D-2S (Re-Loading) 152
A.9 Steel Strains for Specimen D-2S (Re-Loading). . . . . . . . 154
ix

...n-~ f
......
LIST OF SYMBOLS
a
A AI An A, AlJj
b ba
br, be bv B
d
d" D
emi
Ee E, Eat EIX E,y
f~ fer
fci
Jet JcI
Jc2
fc2ma.:r;
f,z
J,z,cr
J,'I
f''I,cr fil
maximum aggregate size
element surface area
area of flexural reinforcement
area of reinforcement to carry horizontal force Nu
area of tension tie reinforcemellt
area of reinforcement to transfer shear across the interface between the nib and the full-depth portion of the beam
width of nib
width of bearing angle
width of concrete confined at node B
width of concrete confined at node C
effective shear width
strain-displacement matrix
effective depth
effective shear depth
incremental stress-strain constitutive matrix
mean strain of member i
initial tangent modulus of elasticity of con crete
modulus of elasticity of reinforcement
tangent modulus after yielding of reinforcement
modulus of elasticity of reinforcement in x direction
modulus of elasticity of reinforcement in y direction
compressive strength of concrete (from a standard cylinder test)
stress in con crete at cracking
initial concrete compressive strength (at transfer)
concrete tensile strength
average principal tensile stress in concrete
principal compressive stress in concrete
compressive strength of cracked concrete
average stress in x reinforcement
stress in x reinfœ:cement at a crack
average stress in y reinforcement
stress in y reinforcement at a crack
yield str~ss of reinforcement
x
(
(
__________ __ ~ ___________ A~ •• __ -
LIST OF SYMBOLS (Continued)
h Id ,.
1
Mu Nu Rv s
Smx
sm1l
Sm9
t
Td Th T,
Tv
Vci
Vcimaz
V Z1l
Vb
Vc VI li;, Vr
V. Vu
ultimate strength of prestressing strand
diagonal compressive stress in concrete
force in st rut or tie i
overall height of member
net horizontal force at support
element tangent stiffness matrix
factor ta account for lightweight concrete (K = 0.50 for normal weight concrete, 0.25 for all-lightweight concrete, and 0.31 for sanded lightweight concrete)
length of node B
development length of reinforcement
length of member i
ultimate fiexural strength
horizontal force in nib
support readion
spacing of vertical stirrups within length x
crack opacing expected for axial tension in the local x direction
crack spacing e:Kpected for axial tension in the local y direction
average crack spélcing expected at angle (J from the global X axis
element thickness
force in diagonal reinforcement in nib
force in horizontal reinforcement in nib
force in vertical stirrups within length x
force in vertical hanger reinforcement
shear stress on crack interface
maximum shear stress permitted on a crack interface
shear stress in reinforced concrete element
externalload on no de B
shear resistance provided by concrete
factored shear force
vertical component of prestressing force
shear resistance
shear resistance provided by shear reinforcement
ultimate shear strength
xi

LIST OF SYMBOLS (Continued)
WJ
WAB
W
fer
factored uniform load ver unit length
width of strut AB at node B
crack width
angle between tension tie and compressive strut
factor accounting for the reduction in compressive strength of cracked concrete
additional incremental stress in x reinforcement at a crack location
additional incremental stress in y reinforcement at a crack location
strain in concrete at peak stress, f~ (from a standard cylinder test)
strain in concrete at cracking
tensile strain in tension tie
strain in x reinforcement
strain in y reinforcement
principal tensile strain
principal compressive strain
an~le of inclination of principal compressive strain measured from global X axis
inclination of the dap
angle between the local x reinforcement and the global X axis
angle between the local y reinforcement and the global X axis
factor to account for low density concrete (À = 1.00 for normal density, 0.85 for structural semi-Iow density, and 0.75 for structurallow density concretes)
reinforcement ratio for the local x reinforcement
reinforcement ratio for the local y reinforcement
resistance factor for concrete (f/lc = 0.60)
resistance factor for normal reinforcement (~6 = 0.85)
resistance factor for prestressing strand (~p = 0.90)
xii

(
(
CHAPTER 1
INTRODUCTION
1.1 Introduction
- -- -- -------,-~--_ .. ---~---------
Beams with dapped ends are widely used in the construction of precast con crete
buildings and bridges. Dapped ends provide better lateral stability and reduce the
floor height of buildings. However, as the flow of internal forces is interrupted by
the sudden change in geometry, regions of disturbances in the flow of these forces are
created around the re-entrant corner and in the nib. These regions are referred to as
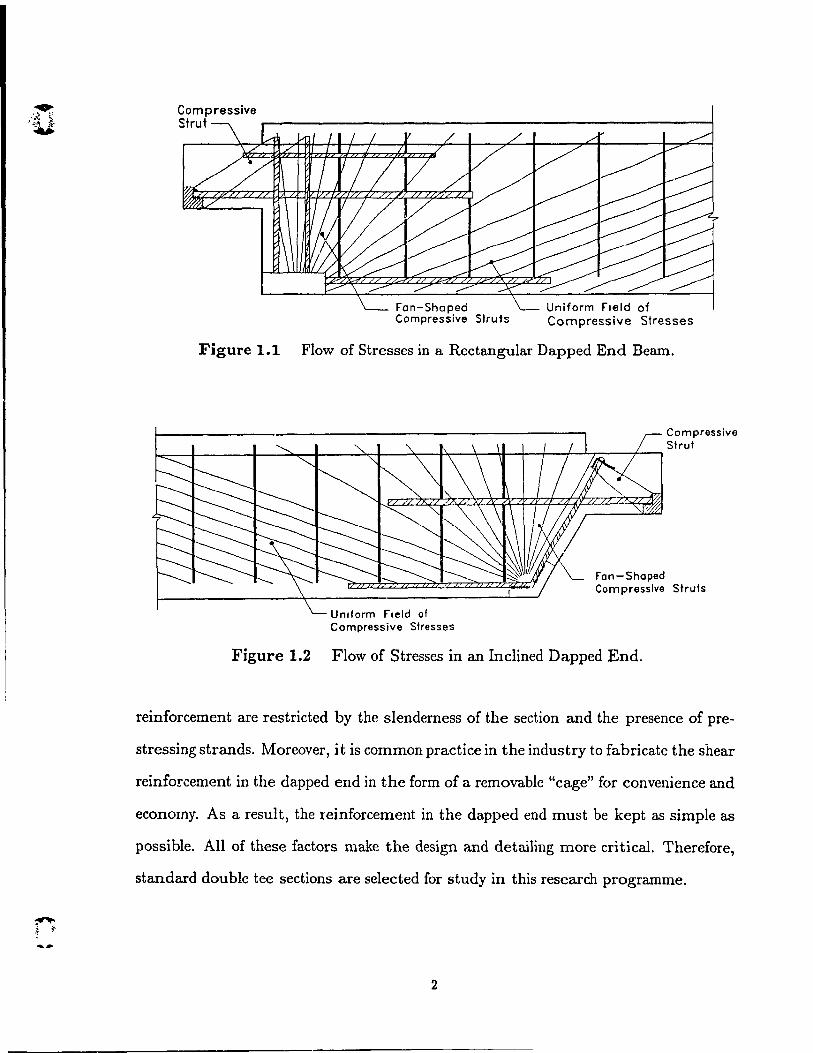
"disturbed regions". For design, disturbed regions of the dapped end beam are idealized
using an inclined compressive strut in the nib, and a fan-shaped zone of compressive
struts radiating from the corner of the full depth portion of the beam, as shown in
Fig. 1.1 and 1.2.
Due to the complexity of the flow of stresses, traditional design methods are not
adequate for designing dapped end bcams. In addition, sorne important aspects, such as
proper detailing and the need for checking the stresses in the concrete, are frequently
overlooked by the designer. These oversights often lead to poor serviceability, e.g.
extensive cracking in the re-entrant corner and the nib, spalling of con crete cover, and
may sometimes even cause premature brittle failure.
The role of proper detailing is of utmost importance for members such as standard
double-tee prestressed dapped end members, as the arrangement and the amount of
1
.....
Compressive Strut ~--------------------------------------------------~
Fon-Shaped Compressive Struts
Uniform Field of Compressive Stresses
Figure 1.1 Flow of Stresses in a Rectangular Dapped End Bearn.
~~----~--~~~--~~~--~~~r-r-r-+-~~~~
Compressive Strut
Unlform Field of Compressive Stresses
Fon-Shoped Compressive Struts
Figure 1.2 Flow of Stresses in an Inclined Dapped End.
reinforcement are restricted by the slenderness of the section and the presence of pre-
stressing strands. Moreover, i t is common practice in the industry to fabricate the shear
reinforcement in the dapped end in the form of a removable "cage" for convenience and
economy. As a result, the reinforcement in the dapped end must be kept as simple as
possible. AU of these factors make the design and detailing more critical. Therefore,
standard double tee sections are selected for study in this research programme .
2
,
)
-
--- --- ------- ---------_._--<-_._--~-----------
1.2 Previous Work
1.2.1 Experiments on Dapped End Beams
In the last two decades, a number of experiments have been eonducted on dapped
end beams, however, most of the beams that were tested were either designed using
the traditional "nominal shear strength" approach or based on elastic analysisl-6,8,9.
Although the "strut-and-tie" model approach was used in the research carried out by
Cook and MitchellIO,ll, the dapped end specimens were full-seale preeast concrete, non-
prestressed beams with rela.tively large web widths (300 mm). A summary of previous
studies on the behaviour and design of dapped end beams is given below.
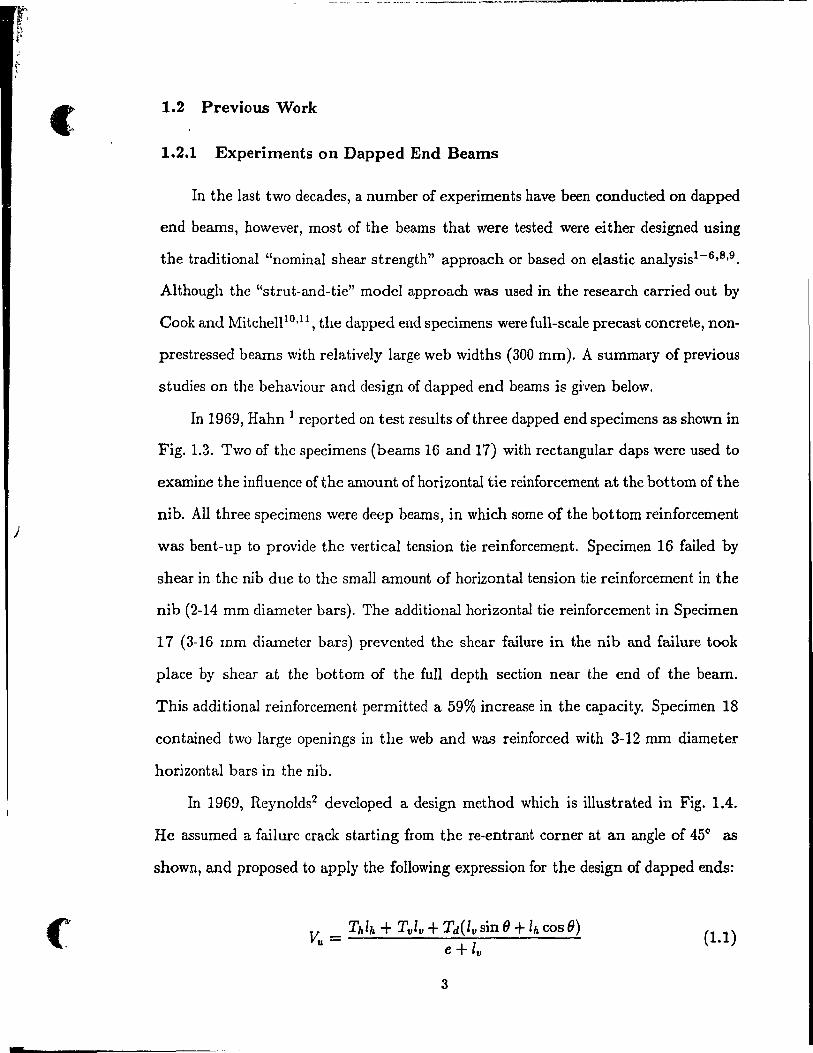
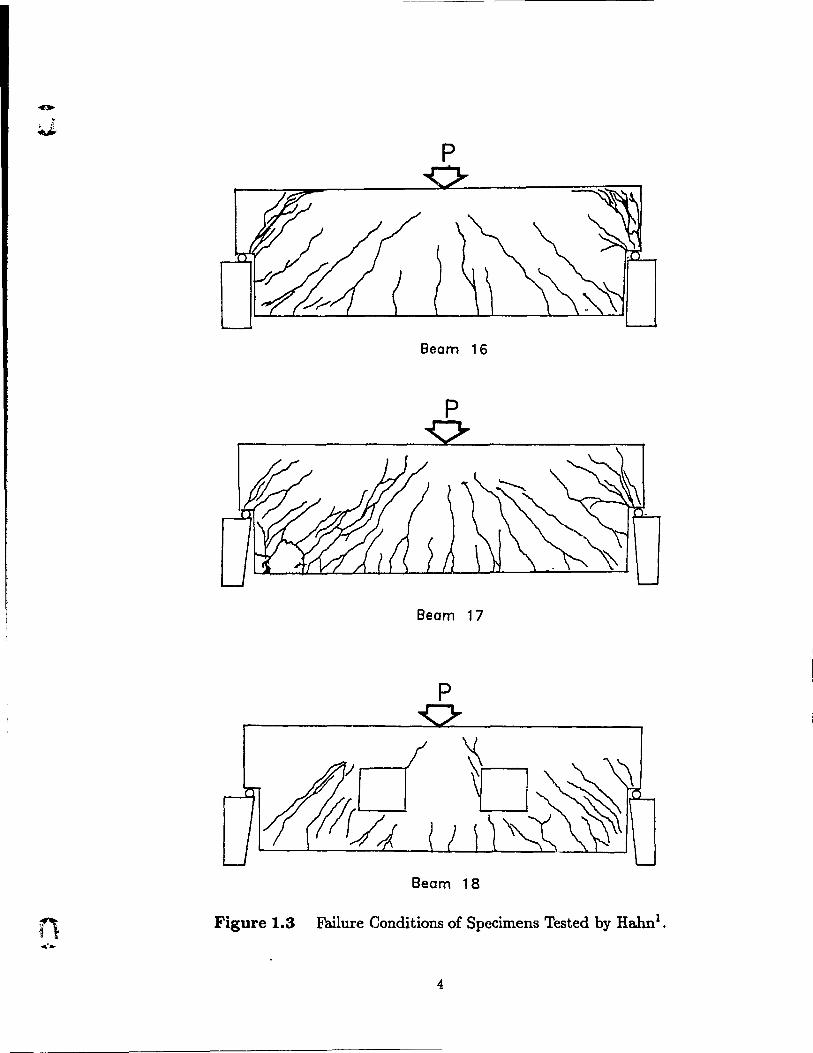
In 1969, Hahn 1 reported on test results of three dapped end specimens as shown in
Fig. 1.3. Two of the specimens (beams 16 and 17) with rectangular daps were used to
examine the influence of the amount of horizontal tie reinforcement at the bot tom of the
nib. AlI three specimens were deep beams, in which sorne of the bot tom reinforcement
was bent-up to provide the vertical tension tie reinforcement. Specimen 16 failed by
shear in the nib due to the small amount of horizontal tension tie reinforcement in the
nib (2-14 mm diarneter bars). The additional horizontal tie reinforcement in Specimen
17 (3-16 mm diameter bars) prevented the shear failure in the nib and failure took
place by shear at the bottom of the full depth section near the end of the beam.
This additional reinforcement permitted a 59% increa.."le in the capacity. Specimen 18
contained two large openings in the web and was reinforced with 3-12 mm diameter
horizontal bars in the nib.
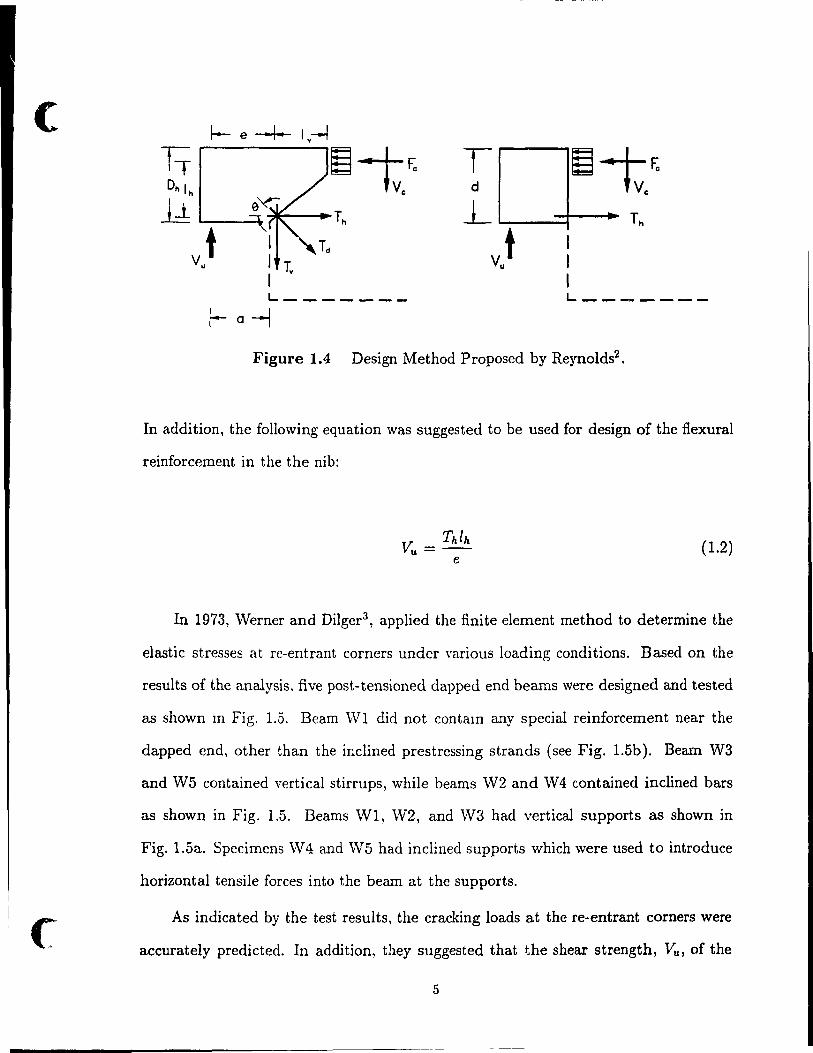
In 1969, Reynolds2 developed a design method which is illustrated in Fig. lA.
He assumed a failure crack starting from the re-entrant corner at an angle of 45° as
shawn, and proposed to apply the following expression for the design of dapped ends:
Vu = Th1h + Tvlv + Td( Iv sin 6 + Ih cos 6) e + lv
3
(1.1)
--p
Beam 16
p
Beam 17
p
Beam 18
Figure 1.3 Failure Conditions of Specimens Tested by Hahnl ,
4
(
c
L ______ _ L ______ _
f-0-1 Figure 1.4 Design Method Proposed by Reynolds2 •
In addition, the following equation was suggested to be used for design of the flexural
reinforcement in the the nib:
(1.2)
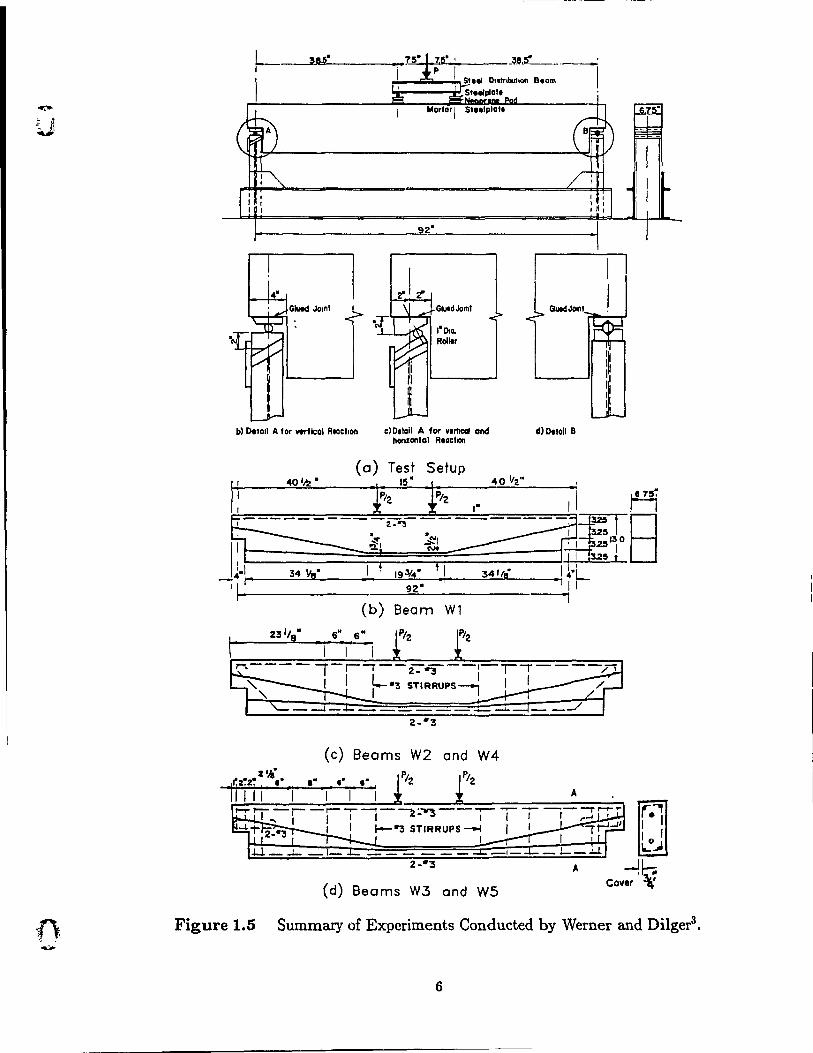
In 1973, Werner and Dilger3 , applied the finite element method to determine the
elastic stresses at re-entrant corners under various loading conditions. Based on the
results of the analysis. five post-tensioned dapped end beams were desiglled and tested
as shown III Fig. 1.5. Bearn vVI did not contam any special reillforcement near the
dapped end, other than the inclined prestressing strands (see Fig. 1.5b). Bearn W3
and W5 contained vertical stirrups, while bearns W2 and W 4 contained inclined bars
as shown in Fig. 1.5. Beams WI, W2, and W3 had vertical supports as shown in
Fig. 1.5a. Specimens \V 4 and VV5 had inclined supports which were used to introduce
horizontal tensile forces into the beam at the supports.
As indicated by the test results, the cracking loads at the re-entrant corners were
accurately predicted. In addition, they suggested that t.he shear strength, VU! of the
5
~ __ ~~· ________ ~'~7~5~·~~~ ______ ~~_~
... '-..=;---, ~Stlll 0.'''"'''''011 SIam 1 L.,i----P1. St,"plal,
Morler 1 SI"'p'a"
92·
,. Ota. Roll ..
b) Delall A for vertical Reoclton c) Oltall A for v,rtlcal and honzontal R.oehon
40'k· Setup
40 ''z''
(b) Bearn W1
(c) Beams W2 and W4
(d) Beams W3 and W5
dl Ottoil B
A
Figure 1.5 Summary of Experiments Conducted by Werner and Dilger3•
6
(
(
dapped end could be obtained as:
(1.3)
where Vc = the cracking load of the re-entrant corner
Vpv = the vertical component of the prestressing force
V" = the forces in the shear reinforcement crossing the crack.
In comparing their finite element analysis with the test results, they concluded that
the cancre te cracks at the re-~ntrant corner at a stress of 6/J! in psi units (O.5..Jfl
in MPa units), The la ad corresponding to this cracking can he used to predict Vc in
Eq, 1.3. In design they recommended that Vc be determined from an analysis with
cracking assumed ta occur at a stress of 4V'lf in psi units(O.33I]-I inMPa units).
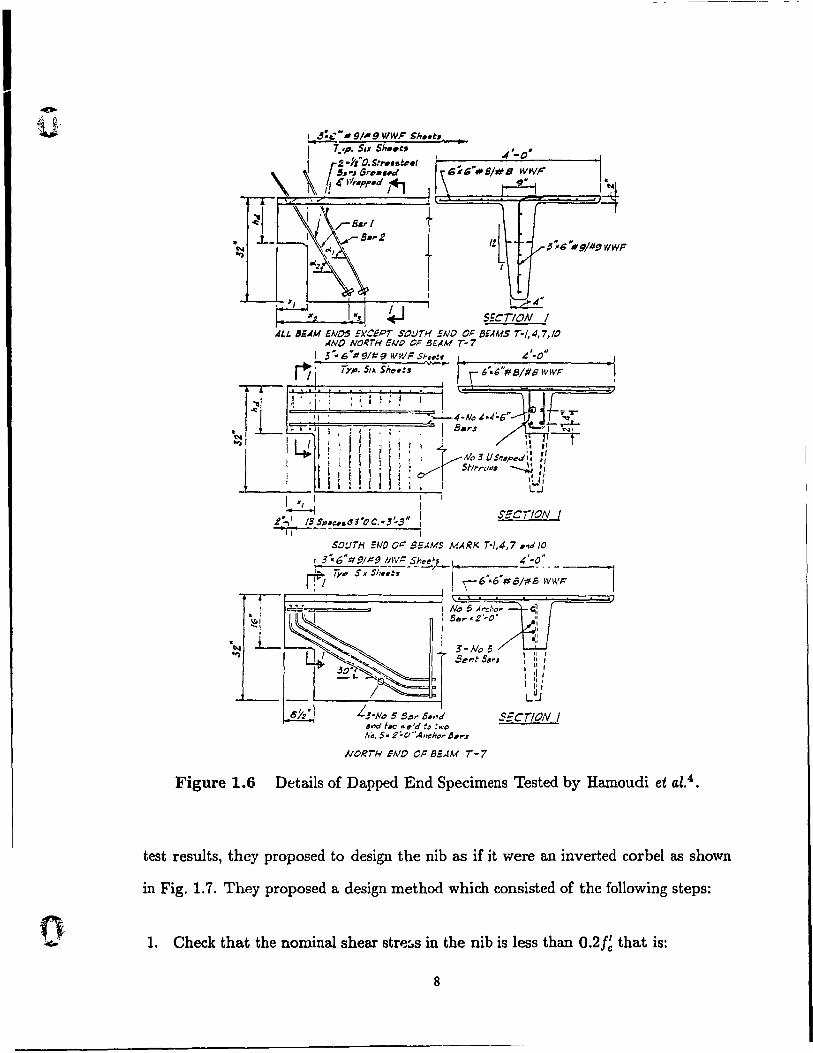
In 1975, Hamoudi et al,4 reported the test results of eight prestressed con crete tee
beams with dapped ends. The purpose of these tests was to de termine the efficiency oi
different reinforcement details for the dapped ends. In these tests, post-tensioned high
strength rods, U-shaped stirrups, and hent inclined bars were used as shear reinforce-
ment. The dctails of the test s~ecimens are shawn in Fig. 1.6. The design was based on
stress functions obtained from the analysis of the dapped end using the theory of elas
ticity. They concluded that elastic analysis could be applied in design of dapped end
beams, and it provided better results than those based on the "nominal shear stress"
approach. For the specimens with inclined post-tensioning, as the main reinforcement
in the dapped end, excellent performance at service loads was achieved, however the
ultimate capacity was reached when shear cracking occurred. Specimens with stirrups
or inclined reinforcement resulted in capacities greater than the shear cracking loads.
Mattock, at the University of Washington, has performed an extensive investiga
tion on the behaviour of dapped end beams. In an earlier study reported by Mattock
and ChanS in 19'ï9, four non-prestressed dapped end beams were tested. Based on the
7
1
~ SECT/ON 1
SECïlON 1
SECr/ON J
NORTH ~N[) OF BE...lM r-7
Figure 1.6 Details of Dapped End Specimens Tested by Hamoudi et al.4 •
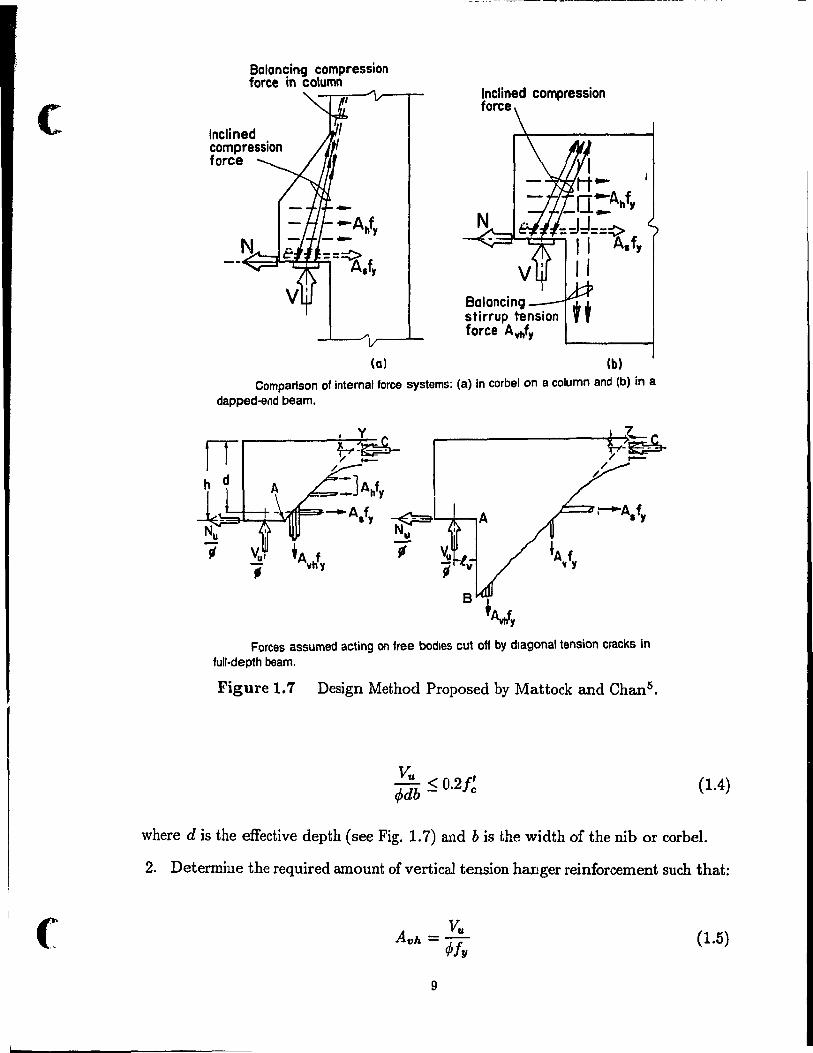
test results, they proposed to design the nib as if it were an inverted corbel as shown
in Fig. 1.7. They proposed a design method which consisted of the following steps:
1. Check that the nominal shear st reGS in the nib is less than O.2f~ that is:
8
(
(
BalancinQ compression force in column
(a)
Inclined compression force
Balancing stirrup tension force Avt..t'l
tt (b)
Comparison of intemal force systems: (a) in corbelon a column and (b) in a
dapped-end beam.
Forces assumed acting on free bodies cut off by diagonal tension cracks in full-depth beam.
Figure 1. 7 Design Method Proposed by Mattock and Chans.
Vu ç' </Jdb ~ O.2Jc (1.4)
where d is the effective depth (see Fig. 1. 7) and b is the width of the nib or corbel.
2. Determine the required amount of vertical tension hanger reinforcement such that:
(1.5)
9
where Avh is the area of vertical hanger reinforcement.
3. . Provide suflicient flexural capacity in the nib such that:
(1.6)
where a is the distance between the Hne of action of Vu and the center of the
hanger reinforcenl;~nt .Avh . The required amount of flexural reinforcement, AJ, can be
determined 50 that ~Mn ;:::: Afu.
4. Check that there is sufficient area of reinforcement, An, to carry the horizontal
force, Nu, such that:
(1.7)
5. Using a modified shear friction approach determine the area of reinforcement to
transfer shear across the interface between the nib and the full depth portion of
the beam, that is:
..Yu... - Kbd O.2bd A - O.Bq, > __ vI - fy - fy
where [( = 0.5 for normal weight concrete
[( = 0.25 for all-lightweight concrete
K = 0.31 for sanded lightweight concrete.
(1.8)
6. Check that the amount of reinforcement, As, provided at the bottom of the nib is
such that:
when ~Avf > Aj
when ~Avf < Af (1.9)
7. Provide positive anchorage for A" at the outer end of the nib. Extend this rein
forcement a distance equal to (h - d + Id) beyond the re-entrant corner.
10
c
S. Provide horizontal stirrups in the lower two-thirds of the depth of the nib having
a total area of:
(1.10)
Extend these stirrups into the full depth beam a distance of at least 1.7 Id, These
stirrups should be closed stirrups at the outer face of the nib but may be open at the
other end.
9. The hanger reinforcement must have positive anchorage at both ends.
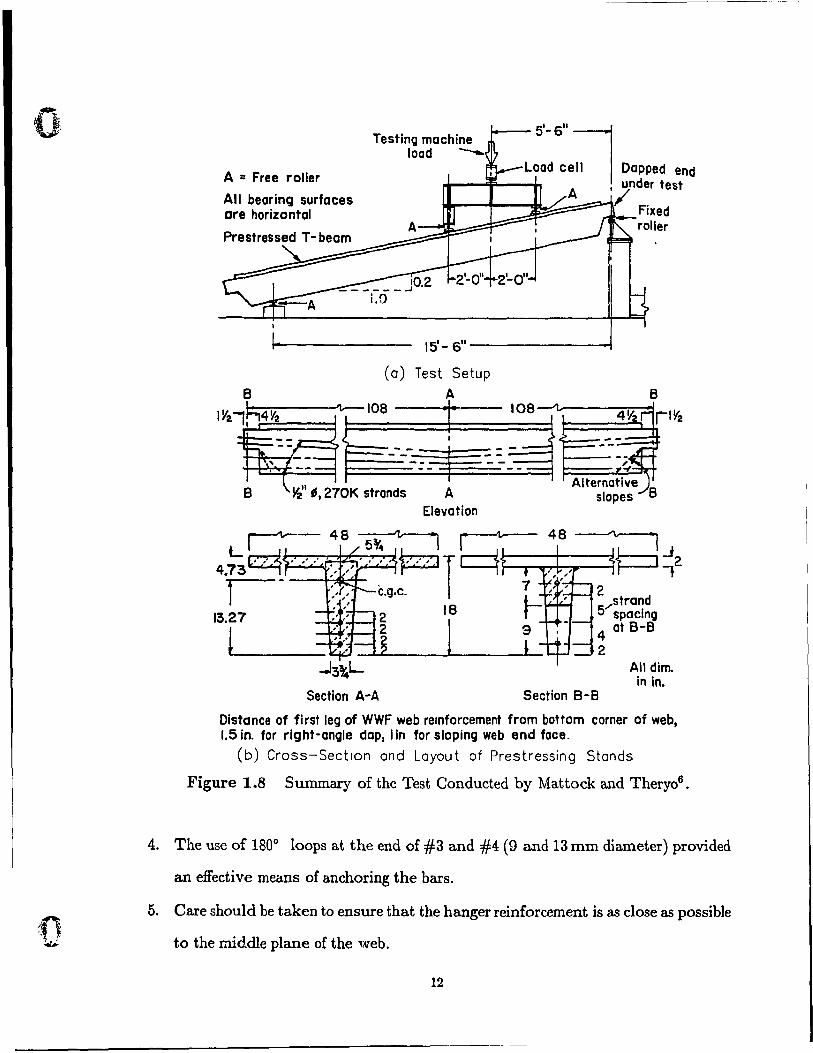
Mattock and Theryo6 condllcted a series of tests to develop different reinforcement
schemes for thin-stemmed prestressed dapped end members. Figure 1.8a show the
set-up for testing these specimens. The inclined tee beam together with a fixed roller
provide a horizontal force at the end of the beam, which is 20% of the support reaction.
Each specimen tested represented one half of an 1S in (460 mm) deep, 8 ft. (2.4 m)
wide standard PCI double-tee. The cross-section and the layout of prestressing steel
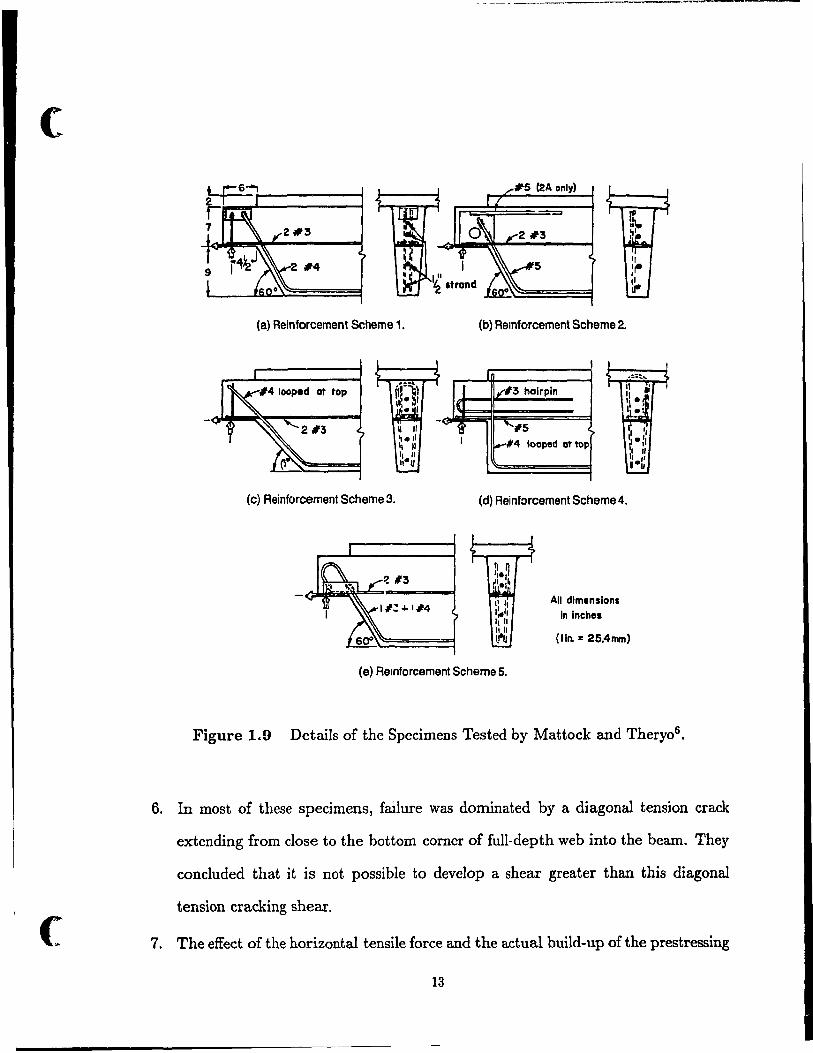
is given in Fig. 1.Sb. Different details for reinforcing the dapped end are shown in
Fig. 1.9. AlI of the beams contained a single sheet of welded wire fabric with 5mm
diameter vertical wires at 7.5 in (190 mm) spacing. This reinforcement corresponds to
the minimum amount of web reinforcement as specified in the AC! Code7 • A summary
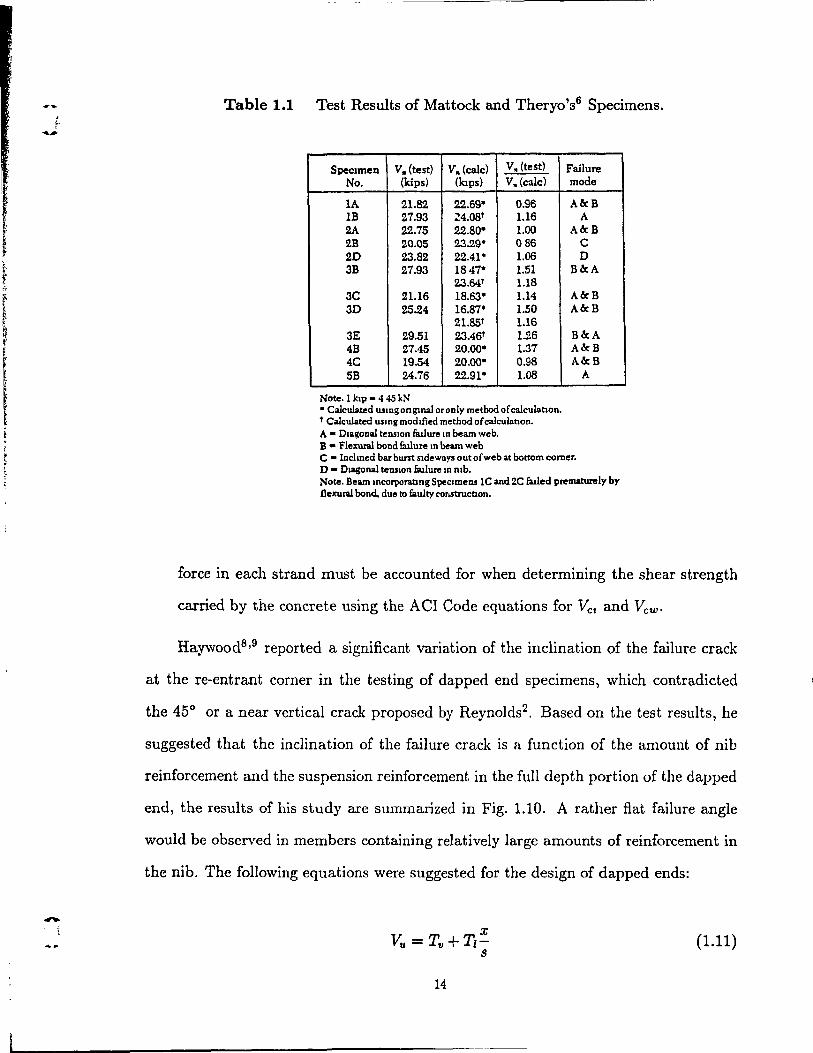
of the test results are given in Table 1.1 Their conclusions from the test results are as
follows:
1. In all cases, the horizontal extension of the hanger reinforcement in the bot tom of
the web should not be less than 1.7 Id'
2. Specimens containing inclined hanger reinforcement provided better crack control
than the specimens with reinforcement scheme 4.
3. Draping half of the prestressing strands through the nib resulted in better crack
control.
11
0,. - ,
Testing machine load --
5'-6"1 A = Free raller
Load cell 1 Dapped end """--1---" . under test Ali bearing surfaces are horizontal
Prestressed T - beam
1
A / _Fixed
roller
1 .. 15'- 6" ---------1 (a) Test Setup
A
A Elevation
L~-48~ ~
4.73~·"· :./ . "~Tq ,--- 7 1 C.g.c. L
13.27 t
1
B
48 ----:--l ,/ p~2
2 .... strand
5 spacing 4 ot B-B
2 Ali dim.
irt in. ....13\1-
Section A-A Section B-B
Distance of first leg of WWF web retnforcement from bot tom corner of web, 1.5 in. for right-angle dop, 1 in for sioping web end face.
(b) Cross-Section and Layout of Prestressing Stands
Figure 1.8 Summary of the Test Conducted by Mattock and Theryo6.
4. The use of 1800 loops at the end of #3 and #4 (9 and 13 mm diameter) provided
an effective rneans of anchoring the bars.
5. Care should be taken to ensure that the hanger reinforcement is as close as possible
to the middle plane of the web.
12
(
(
(a) Reinforcement Scheme 1. (b) Relnforcement Scheme 2.
1 111'/3 halrpin
~ ..... /5
1-#4 looped ot top
(c) Reinforcement Scheme3. (d) Reinforcement Scheme 4.
l' '. Ali dimensions 1:'" ln Inchel 1,11 Il Il tr'IJ (lin. = 25.4mm)
(e) Relnforcement Scheme 5.
Figure 1.9 Details of the Specimens Tested by Mattock and Theryo6.
6. In most of these specimens, failure was dominated by a diagonal tension crack
extending from close to the bot tom corner of full-depth web into the beam. They
concluded that it is not possible to develop a shear greater than this diagonal
tension cracking shear.
7. The effect of the horizontal tensile force and the actual build-up of the prestressing
13
-, i
Table 1.1 Test Results of Mattock and Theryo's6 Specimens.
SpeClmen V. (test) V. (calc) V. (test)
No. (kips) (laps) V. (calc)
lA 21.82. 2.2.69" 0.96 lB 27.93 ~4.08t 1.16 2A 2.2..75 2.2.80- 1.00 2B 20.05 23.29" 086 2.D 23.82. 2.2.41- 1.06 3B 27.93 1847" 1.51
23.64t 1.18 3C 21.16 18.63- 1.14 3D 25.24 16.87" 1.50
21.85t 1.16 3E 29.51 23.461 1.26 4B 27.45 20.00· 1.37 4C 19.54 20.00· 0.98 SB 24.76 2.2.91· 1.08
Note. 1 ktp - 4 45 kN - Calculated IUtng ongtnal or only method of calculatton. t Calculated wlng modÛled method of calculauon. A - Diagonal tension fatlure ID beam web. B - Flexural bond l'allure ID beam web
Failure mode
AleB A
AleB C D
BleA
AleB AleB
BleA AleB AleB
A
C - Inclmed bar bum sldewBYs out ofweb at bottom corner. o - DIAgOnal tenSion liulure IR nib. Note. Bearn mcorporatlng Specimens IC and 2C wIed prematurely by flexur.ù bond, due to faulty cor.structlon.
force in each strand must be accounted for when determining the shear strength
carried by the concrete using the ACI Code equations for VCI and Vcw .
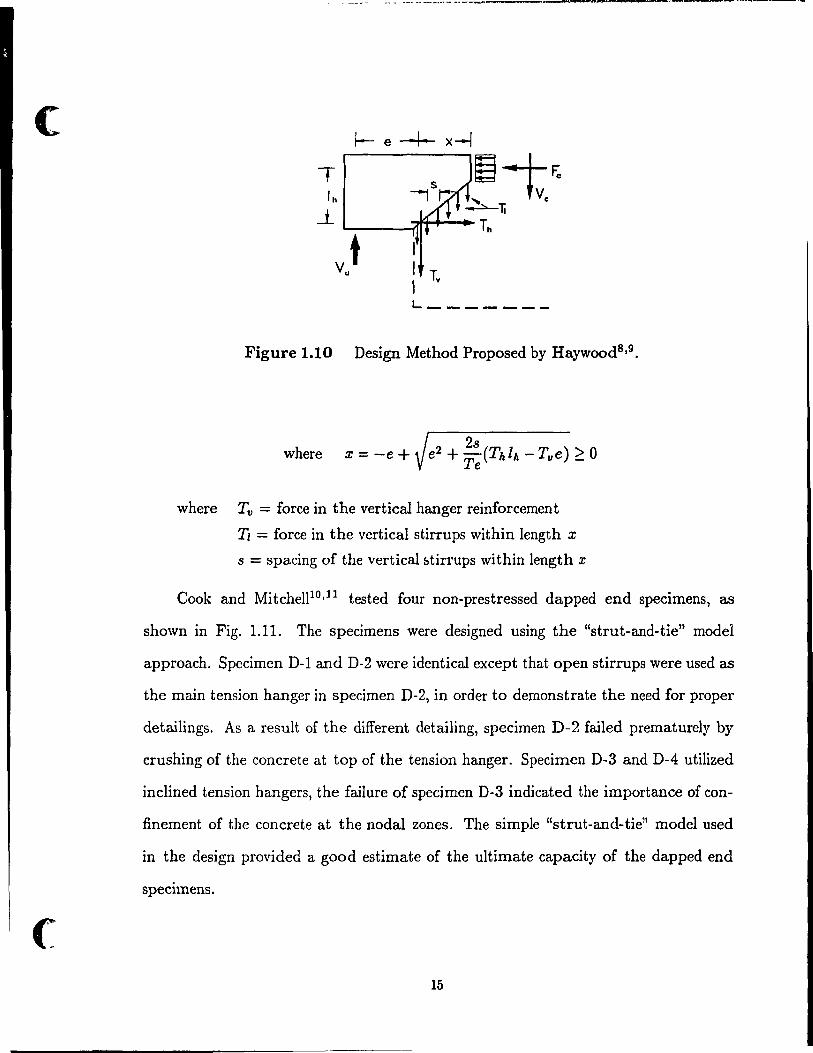
Haywood8 ,9 reported a significant variation of the inclination of the failure crack
at the re-entrant corner in the testing of dapped end specimens, which contradicted
the 450 or a near vertical crack proposed by Reynolds2 . Based on the test results, he
suggested that the inclination of the failure crack is a function of the amount of nib
reinforcement and the suspension reinforcement in the full depth portion of the dapped
end, the results of his study are summarized in Fig. 1.10. A rather fiat failure angle
would be observed in members containing relatively large amounts of reinforcement in
the nib. The following equations were suggested for the design of dapped ends:
x Vu = T,,+T,
s
14
(1.11)
(
(
L ______ _
Figure 1.10 Design Method Proposed by Haywood8 ,9.
where
where Tv = force in the vertical hanger reinforcement
T, = force in the vertical stirrups within length x
s = spacing of the vertical ~tirrups within length x
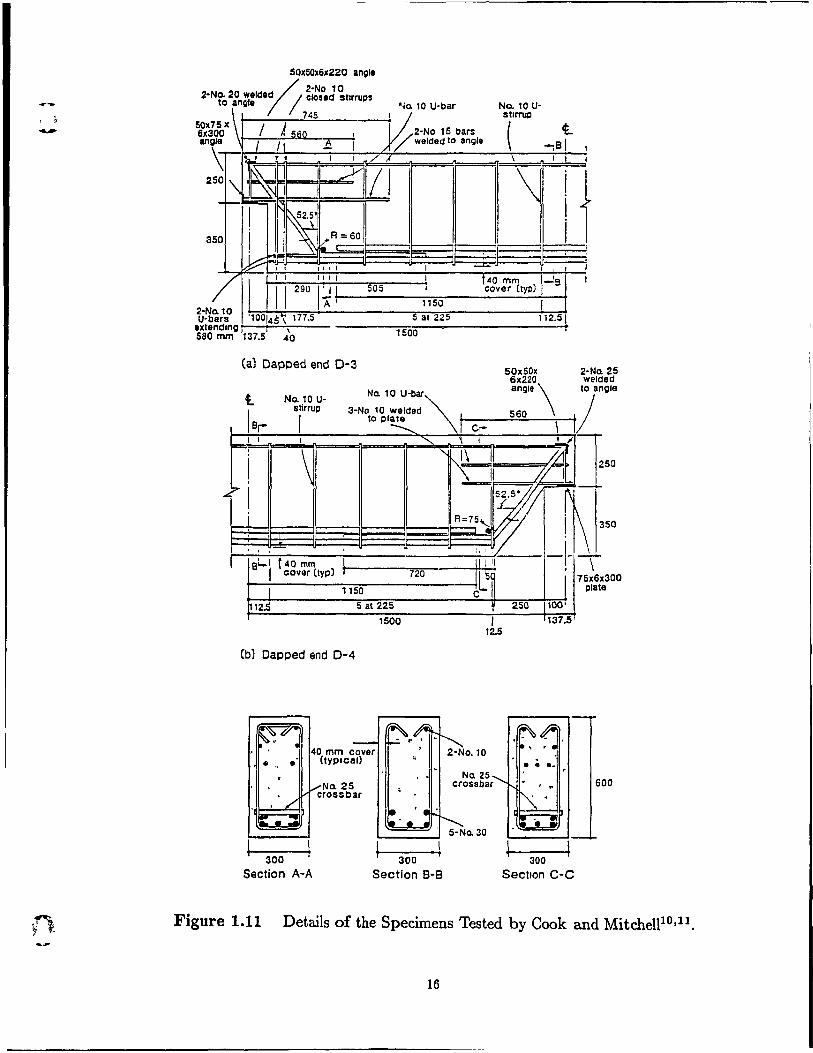
Cook and Mitchell10 ,11 tested four non-prestressed dapped end specimens, as
shown in Fig. 1.11. The specimens were designed using the "strut-and-tie" model
approach. Specimen D-l and D-2 were identical except that open stirrups were used as
the main tension hanger in specimen D-2, in order to demonstrate the need for proper
detailings. As a result of the different detailing, specimen D-2 failed prematurely by
crushing of the concrete at top of the tension hanger. Specimen D-3 and D-4 utilized
inclined tension hangers, the failure of specimen D-3 indicated the importance of con
finement of the concrete at the nodal zones. The simple "strut-and-tie" model used
in the design provided a good estimate of the ultimate capacity of the dapped end
specllnens.
15
-
fi al 225
1500
(a) Dapped end 0-3
No. 10 Ustlrrup
( \
l 50x50x
6x220
t. -;81
1 1
2-Na. 25 welded
Na. 10 U-bar angle \ Z'" t No. 10 U-
1 Br-stlrrup 3-No 10 welde~ "\,t 560
1 1 IOPI~
Cr- \ 1 1 1 " 1 , , ,
\ "-1',1\ 1 ~ 1 \i ~I --=-=
~~Î i\
250
i [ A=75 ...... 1 ~ ~ _IJ~ 350
. ,
eL.. 1 t40 mm ~ cover (Iyp) 720
1150
112.5 5 al 225
(b) Dapped end 0-4
300 Section A-A
No. 25 crossbar
1500
300
Section B-B
11 l,
1111[
Jl:~ C 1
f 1
12.5
l 250 100'
137.5'
300
Section C-C
\" 75 x6x300
late p
600
Figure 1.11 Details of the Specimens Tested by Cook and MitcheU1o,11,
16
(
f
1.2.2 Strut-and-Tie Model
The application of the truss model for the design of reinforced concrete mem
bers subjected to shear was first introduced by Ritter12 in 1899 and later modified by
Morsch13. Since it was thought to be mathematically impossible to determine the angle
of inclination of the diagonal compressive stresses, it was conservatively chosen to be
45° . In order to cornpensate for the conservative predictions in the 45° truss model,
an additional empirical concrete contribution term was included in the traditional shear
resistance equation:
(1.12)
where Vc and V" denote the shear resistance provided by the con crete and by the
shear reinforcement respectively. For prestressed concrete members, Vc is taken as
the smaller of the web-shear cracking load and the flexural-shear cracking load. This
approach forrns the basis for shear design in the ACI Code7•
More generalized truss models wer€' incorporated into the 1978 CEB-FIB Code14 ,
which allows the designer to choose the angle of the model. The variable-angle truss
model was further refined by Thürlimann et al. 15 , Marti16 , and Schlaich et alP in
or der to design disturbed regions. In this approach, the internaI forces in the disturbed
region are idealized by a strut-and-tie model, in which the principal compressive stresses
and the principal reinforcement are represented by the struts and ties respectively. A
general strut-and-tie design procedure for disturbed regions was described by Marti16 •
He suggested to replace the concrete member by struts and ties with fini te dimensions,
and also proposed to use 0.6 f~ as the Emit of the concrete compressive stress in the
struts. Schlaich et al. 17 recommended developing strut-and-tie models by following the
paths of the elastic flow of stresses throughout a member. He also pointed out the
importance of accurate dimensioning of the concrete compressive struts and proper
detailing of the reinforcement.
17
-
-, J,-I 1.
t • Nodal zone
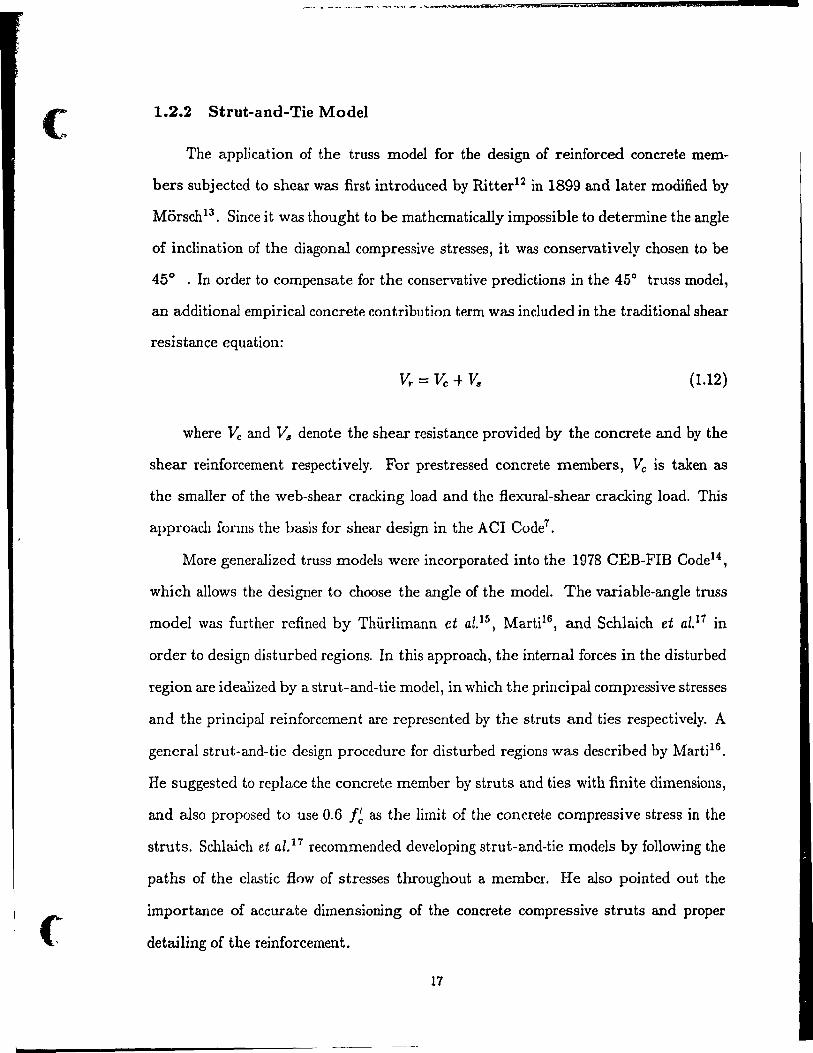
Figure 1.12 Stress Limits on Nodal Zones given by the CSA CodelB•
Recently, the CSA Code (CAN3-A23.3-M84)18 has incorporated the strut-and-tie
model for design of disturbed regions as developed by Collins and Mitchell19• The
compression field theory is utilized to determine the compressive strength of the struts
under the influence of tensile strain softening. For the design of the concrete regions
at the intersection of cumpressive struts and tension ties (called nodal zones), the
Canadian Code gives limits on the compressive stress depending on the strain conditions
of the nodal zones, see Fig. 1.12. The development of this strut-and-tie model, was
facilitated by the research conducted by Cook and Mitchell1o,1l, in which they also
suggested that the nodal zone dimensions in the model are highly sensitive to the
available anchorage details, so it is important to model the details of anchorages and
bearing areas carefully. A more complete description of "strut-and-tie" rnodels is given
in Chapter 4.
18
(
(
--- -------
1.2.3 Computer Model
One of the earliest applications of finite element analysis to reinforced concrete
structures was performed by Ngo and Scordelis20 in 1967, in which two dimensional
triangular elements were used to predict the post-cracking response of reinforced con
crete beams. Since 1967 numerous studies have been conducted on the modeling of
reinforced concrete. A comprehensive discussion of the applications of finite element
analysis to reinforced concrete was presented in the State-of-the-Art Report on Fi
nite Element Analysis of Reinforced Concrete21 • In addition, computer programs that
are generally available for analysis of reinforced concrete were listed in this report.
However, most of these computer programs cannot simulate many of the behavioural
features needed to analyze disturbed regions.
In 1986, Adeghe and Co1lins22 incorporated the Compressive Field Theory and a
modified stress-strain relationship for cracked concrete into a general purpose computer
program, ADINA, and it was used to study the behaviour of reinforced concrete beams
and prestressing anchorage zones containing different reinforcement details. The com
pression field theory was aIso applied in the computer program FIELDS, developed by
Cook and Mitche1l10 ,ll, to predict the response of reinforced concrete members with
disturbl:!d regions. The computer program is capable of performing a two-dimensional
analysis on the complete response of the member. The study showed that the ultimate
capacity of a disturbed region is sensitive to the ways in which the details of the bearing
areas and the nodal zones are modeled. Therefore, to ensure an accurate prediction of
the behaviour of the member near ultimate, the model should resemble, as closely as
possible, the condition of the member at failure, (e.g. the thickness of the element used
should be consistent with the available anchorage detai~s, thus the effect of spalling of
the concrete cover should be considered in the model).
19
.... _------------------- ---
......
-
-\ .... ",..
-----------------
1.3 Objectives
The purpose of this research programme is to study the behaviour of precast
prestressed double tee dapped end beams. For the study, standard prestressed concrete
double tee sections were chosen from the CPCI Design Handbook23 . They consisted
of dapped end sections with two different geometries and reinforcement schemes. The
sections were first designed and analyzed using t.he "8trut-and-tie" model, in which the
struts and ties were used to model the principal compressive stresses and the princi
pal reinforcement. The struts and ties were represented by idealized truss members
and connected by nodal zones with finite dimensions, then the internal forces were
determined from 5Latics.
Two full seale specimens were then fabricated and tested, and the experimental
results were compared with the predictions obtained from non-linear finite element
analyses. Predictions of the responses of the specimens were performed using the finite
element program FIELDS, deveioped by Cook and MitchellIO,Il. The compressive field
theory is applied in this computer program to determine the tangent stiffness of two
dimensional plane stress concrete dements, whîch can be utilized to model both the
concrete and the reinforcement. In addition, effects of compressive strain softening and
tension stiffening of the con crete are also accounted for in the program. The program
FIELDS runs on a personal computer, so the results of analysis can be stored in files
for further graphical processing.
The objectives of this research programme are:
1. To study different reinforcement details for thin stemmed precast con crete mem
bers.
2. To design and test two full Reale specimens with four different dapped ends.
3. To predict the responses of each dpecimen using the computer program FIELDS.
4 . To compare the predicted responses with the experimental results.
20

(
(
5. To develop and to verify the strut and tie mode} for dapped eods with varying
geometry.
21
CHAPTER 2
EXPERIMENTAL PROGRAMME
2.1 Introduction
Two beam specimens with four dapped ends of different geometries and reinforce
ment schemes were investigated in this research programme. The dapped end specimens
were designed using the "strut-and-tie" model approach, whose details are presented
in Section 4.2. Example design calculations for rectangular and inclined dapped end
specimens are given in Section 4.5. The test specimens were designed according to the
design criteria discussed in the following section.
2.2 Design of the Test Specimens
2.2.1 Design Criteria
The dapped end specimens were designed according to the following criteria:
1. The specimens were to be full-size precast-prestressed thin-stemmed beams with
properties corresponding to standard elements given in CPCI Design Handbook23 •
2. The dapped ends were to be reinforced with a simple removable "cage" consisting
of deformed reinforcing bars and structural steel components.
3. The specimens were to be designed te fail in the dapped end.
22
( 1
150 1 .1
t L~
/6& t , ~1'------------------------5000-------------------------~
Side View
/
1-. ---------- 1200 -----------1
SOL .---_____ -1 __ f-_1_55 ___ --.
f 150
f-200
1
L Ali dimensions are in millimeters
-j /-122 Front View
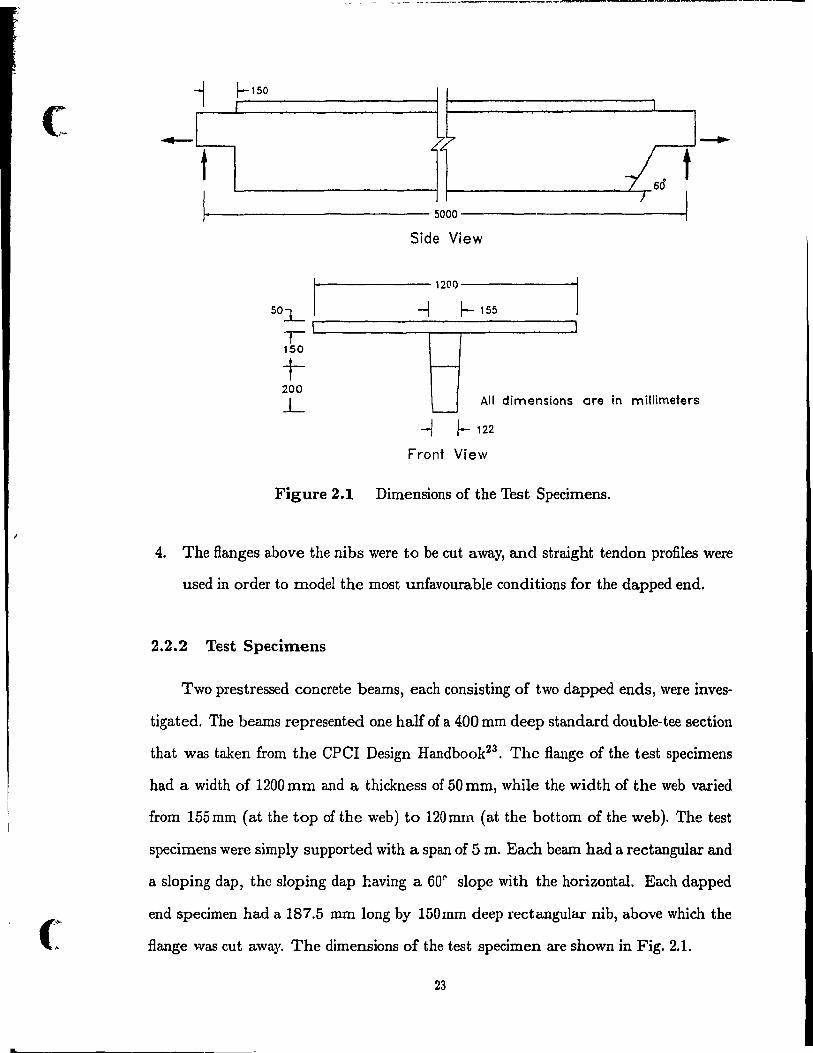
Figure 2.1 Dimensions of the Test Specimens.
4. The flanges above the nibs were to be cut away, and straight tendon profiles were
used in or der to model the most unfavourable conditions for the dapped end.
2.2.2 Test Specimens
Two prestressed concrete beams, each consisting of two dapped ends, were inves-
tigated, The beams represented one half of a 400 mm deep standard double-tee section
that was taken from the CPCl Design Handbook23 • The flange of the test specimens
had a width of 1200 mm and a thickness of 50 mm, while the width of the web varied
from 155 mm (at the top of the web) to 120 mm (at the bottom of the web). The test
specimens were simply supported with a span of 5 m. Each beam had a rectangular and
a sloping dap, the sloping dap having a 601' slope with the horizontal. Each dapped
end specimen had a 187.5 mm long by 150mm deep rectangular nib, above which the
Bange was cut away, The dimensions of the test specimen are shown in Fig. 2.1.
23
--The prestressing force for each of the specimens was supplied by three 13 mm
diameter low-relaxation strands, with an ultimate strength, fpu equal to 1860 MPa.
The tendons were tcnsioned to 0.70 fpu using a straight tendon profile. The two
bottom strands were located at lOOmm and 150 mm from the base of the beam, and
were terminated at the face of the full-depth portion of the beam. The top strand was
placed at 300mm from the bottom of the beam, and passed through the nib.
The flange was reinforced with a sheet of 152 x 152 MW 9.1 x MW 9.1 smooth
welded wire fabric. In addition to the reinforcing "cage" at the dapped ends, 152 x 152
MW' 18.7 x MW 18.7 welded wire fabric was used as the shear reinforcement over the
length of the beam.
2.2.2.1 Dapped end specimens D-IR and D-1S The first prestressed beam
consisted of two dapped end specimens, namely D-IR and D-1S, where the "R" and
"S" denote the rectangular and sloping dapped ends respectively. These two dappeJ
ends were designed to be pilot tests in arder ta study the performance of the individual
components in the dapped end and ta demonstrate the necessity of modeling the whole
member. The test specimens were designed in accordance with common ~ctual prac
tice material properties, that is, an initial concrete compressive strength (at transfer),
f~i = 30 MPa, a final concrete strength f~ = 40 MPa, a steel yield strength, fy = 400
MPa, and a prestressing strand ultimate strength, fpu = 1860 MPa. The specimens
were designed using the "strut-and-tie" model approach, (see Section 4.2), for a uniform
distributed live load of 4.8 kN/m2 and a superimposed de ad load of 1.0 kN 1m2•
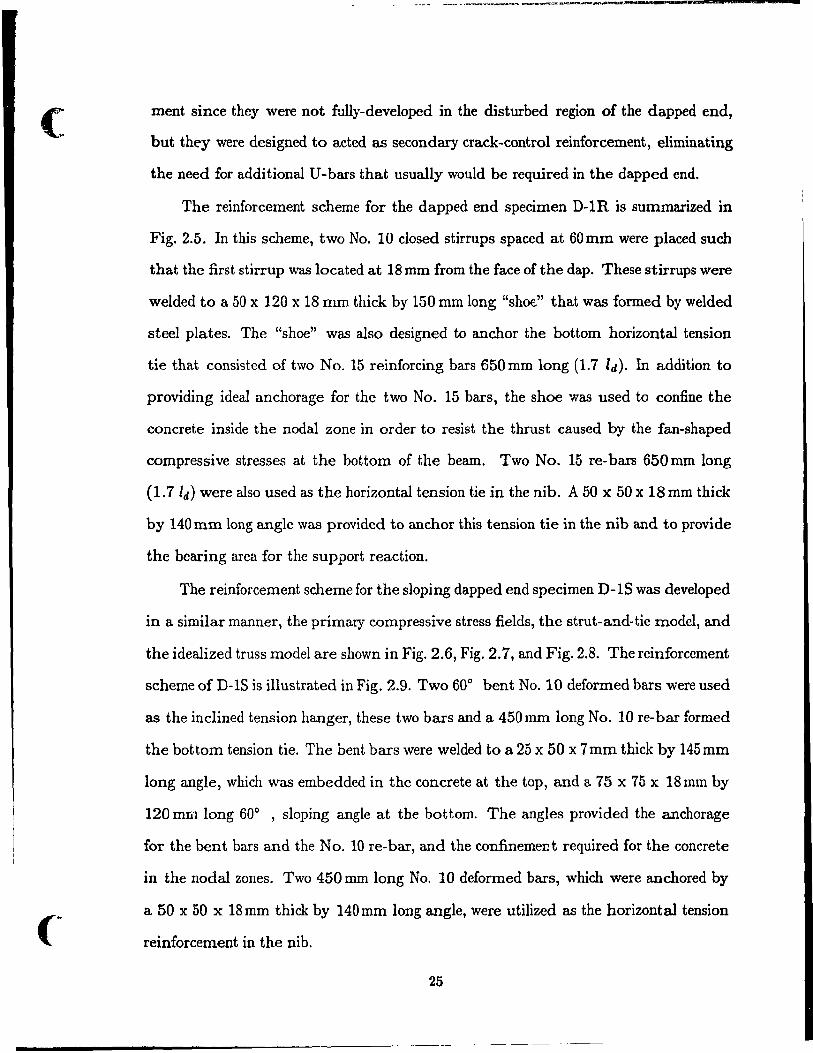
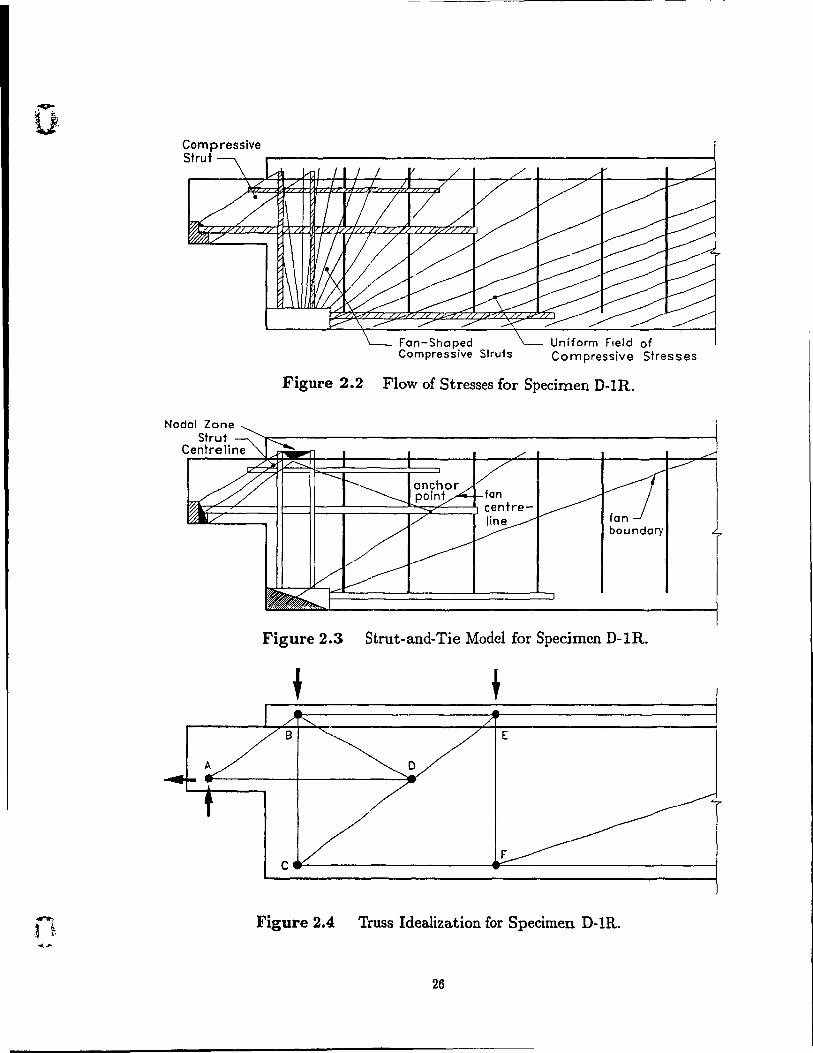
The design of dapped end specimen D-IR began with th(' sketching of the flow of
compfl~ssive stresses in the dapped end as shown in Fig. 2.2, from which a strut-and-tie
.model was constructed (see Fig. 2.3), then the strut-and-tie model was further simpli
fied into the idealized truss model illustrated in Fig. 2.4 The amount of reinforcement
required was then designed based on the internaI forces determined from the truss
mode!. The prestressing strands were not included in the model as principal reinforce-
24
(
(~
ment since they were not fully-developed in the disturbed region of the dapped end,
but they were designed to acted as secondary crack-control reinforcement, eliminating
the need for additional U-bars that usually would be required in the dapped end.
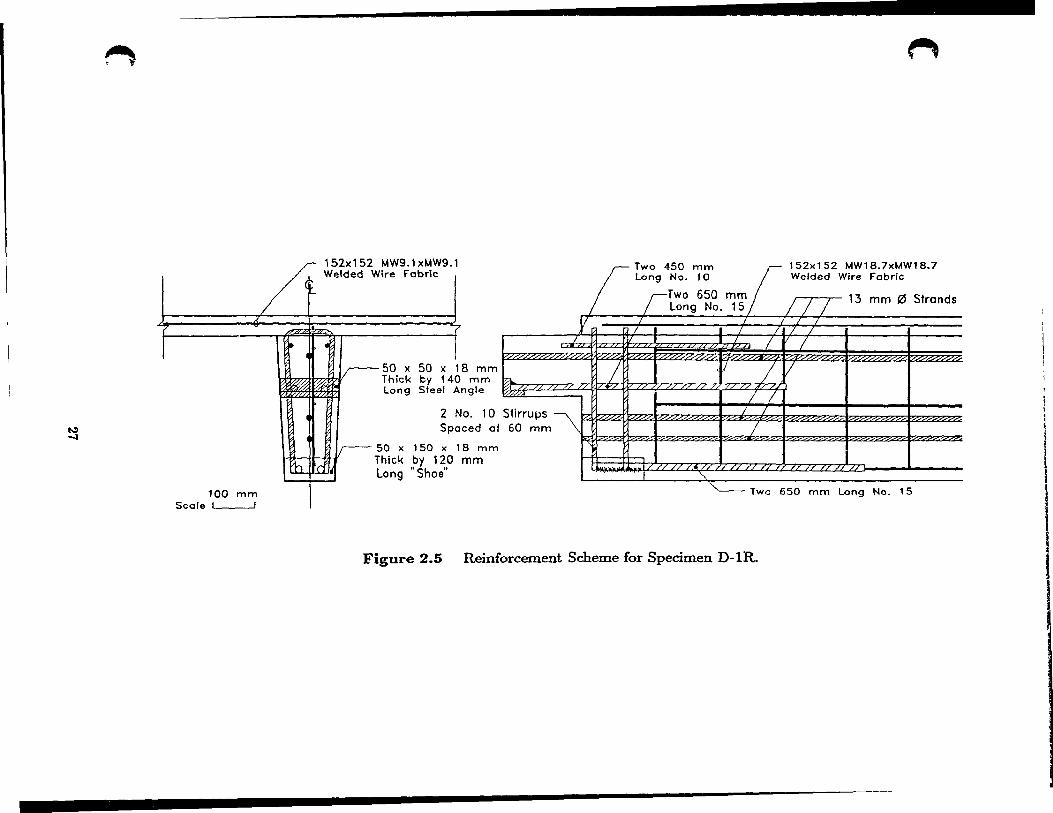
The reinforcement scheme for the dapped end specimen D-IR is summarized in
Fig. 2.5. In this scheme, two No. 10 closed stirrups spaced at 60mm were placed sucb
that the first stirrup was located at 18 mm from the face of the dap. These stirrups were
welded to a 50 x 120 x 18 mm thick by 150 mm long "shoe" that was formed by welded
steel plates. The "shoe" was also designed to anchor the bot tom horizontal tension
tie that consisted of two No. 15 reinforcing bars 650 mm long (1.7 Id). In addition to
providing ideal anchorage for the two No. 15 bars, the shoe was used to confine the
concrete inside the nodal zone in order to resist the thrust caused by the fan-shaped
compressive stresses at the bottom of the beam. Two No. 15 re-bars 650 mm long
(1. 7 Id) were also used as the horizontal tension tie in the nib. A 50 x 50 x 18 mm thick
by 140 mm long angle was provided to anchor this tension tie in the nib and to provide
the bearing area for the support reaction.
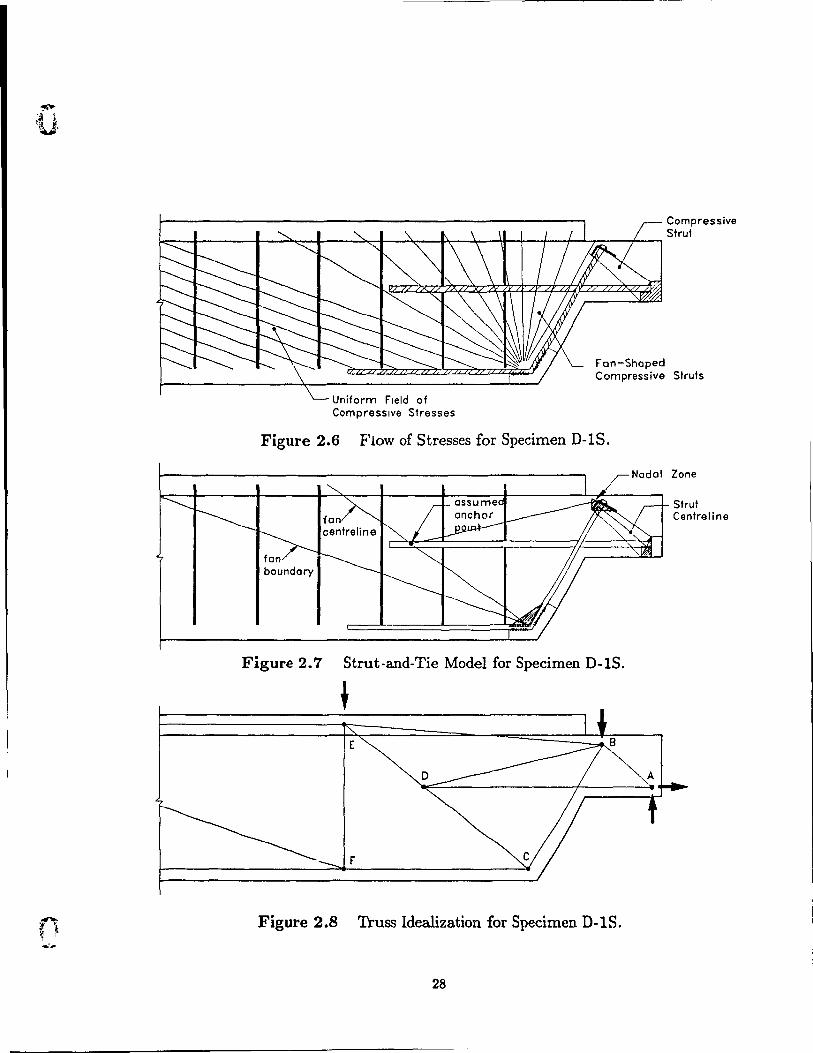
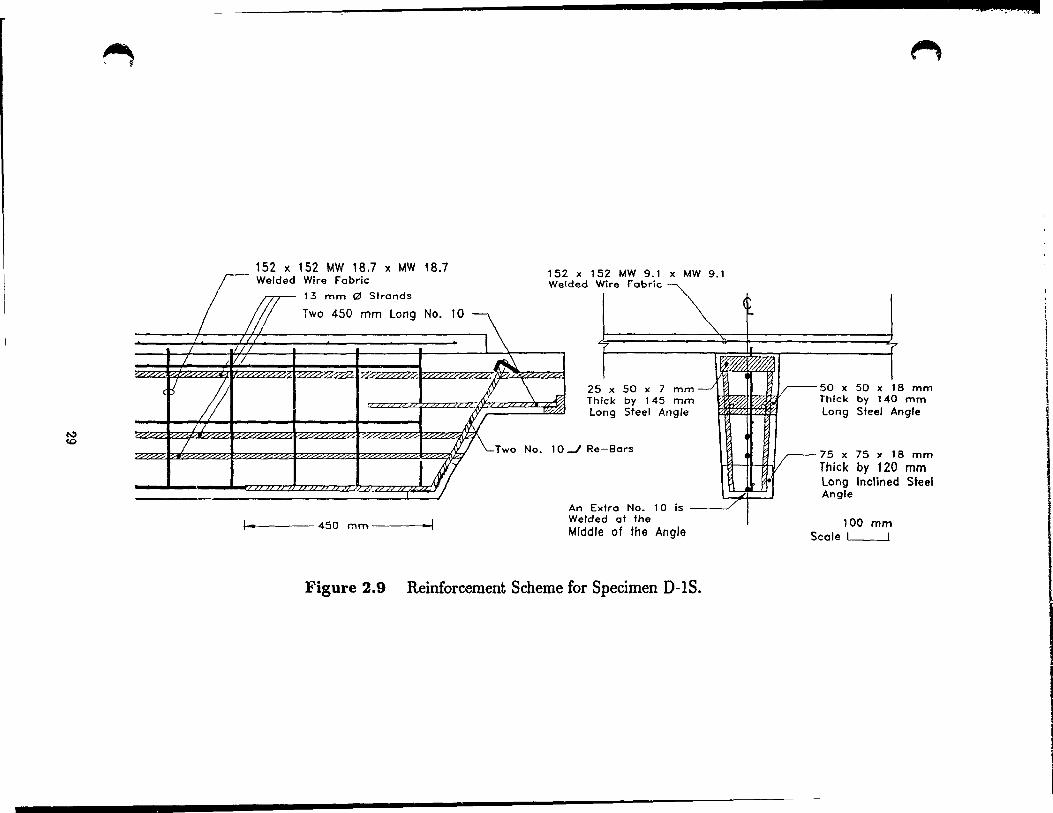
The reinforcement scheme for the sloping dapped end specimen D-lS was developed
in a similar manner, the prirnary compressive stress fields, the strut-and-tie model, and
the idealized truss model are shown in Fig. 2.6, Fig. 2.7, and Fig. 2.8. The reinforcement
scheme of D-lS is illustrated in Fig. 2.9. Two 60° bent No. 10 deformed bars were used
as the inc1ined tension hanger, these two bars and a 450 mm long No. 10 re-bar formed
the bottom tension tie. The bent bars were welded to a 25 x 50 x 7mm thick by 145mm
long angle, which was embedded in the concrete at the top, and a 75 x 75 x 18mm by
120 mm long 60° ,sloping angle at the bot tom. The angles provided the anchorage
for the bent bars and the No. 10 re-bar, and the confinement required for the concrete
in the nodal zones. Two 450 mm long No. 10 deformed bars, which were anchored by
a 50 x 50 x 18mm thick by 140mm long angle, were utilized as the horizontal tension
reinforcement in the nib.
25
Q, Compressive Strut r-----------------------------\
Nodal Zone Strut
Centreline
Fan-Shaped Compressive Siruts
Uniform Field of Compressive stresses
Figure 2.2 Flow of Stresses for Specimen D-IR.
fan boundary
Figure 2.3 Strut-and-Tie Model for Specimen D-IR.
o
c~----------------------~------------------------~
Figure 2.4 Truss Idealization for Specimen D-IR.
26
~ -.1
~
f /<
~
h
100 mm Scale 1 1
152x152 MW9.1 xMW9.1 ..... _ ...... _ ......... '- ........... -
[...
• 1;----50 x 50 x 1
Thick by 140 Long Steel A
2 ~
Spa
;--- 50 x 1 50 x 1
'0 Thick by 120 Long "Shoe"
Figure 2.5
8 mm mm
ngle
o. 10 ced 01
8 mm mm
Y j
in.
Slirrups,\
60 mm
T 50
-
/
1 "
~
152x152 MW18.7xMW18.7
/ / L 1 1
/ 1 1 j / V
/ /
/
Two 650 mm Long No. 15
Reinforcement Scheme for Specimen D-IR.
~ ;u'
-l ~ ~ ,
~~~----~--~~~--~~--~~~~--*-+-~~~~--~~
Compressive St rut
Fan-Shaped Compressive Struts
Uniform Field of Compressive Stresses
Figure 2.6 Flow of Stresses for Specimen D-1S.
fon boundory
Figure 2.7 Strut-and-Tie Model for Specimen D-lS.
E
o
Figure 2.8 Truss Idealization for Specimen D-lS.
28
Zone
Strut Centreline
t.:) co
~
1 L
Vj /
1 L
VI
152 x 152 MW 18.7 x MW 18.7 152 x 152 MW 9.1 x MW 9.1 ded Wire Fobr'
1 \ ~
7 \ ~ 11
-o\LTwo No. 10
li
25 Th L
.J Re
"\ r
x 50 x 7 mm--.--l ick by 145 mm 'ng Steel Angle
-Bors
~ r-
~ ~
~ E0
1/ ~j
~ ~
An E Weld
[tro No. lOis--./'
1.. 450 mm .1 d ot the
Middle of the Angle
Figure 2.9 Reinforcement Scheme for Specimen D-1S.
7
mm Scole 1
~
8 mm mm
ngle
8 mm mm Steel
~._-~~ .. -r->~
1
1 1
i 1
In both dapped end specimens, a single sheet of smooth 152 x 152 MW 18.7 x
MW 18.7 welded wire fabric was used as the shear reinforcement in the full depth
portions of the beams. The welded wire fabric was placed adjacent to the tension
hangers, and was cut in a way such that a cross-wÏre was located at the bottom of the
mesh, 18 mm from the bot tom of the beam, to improve the anchorage.
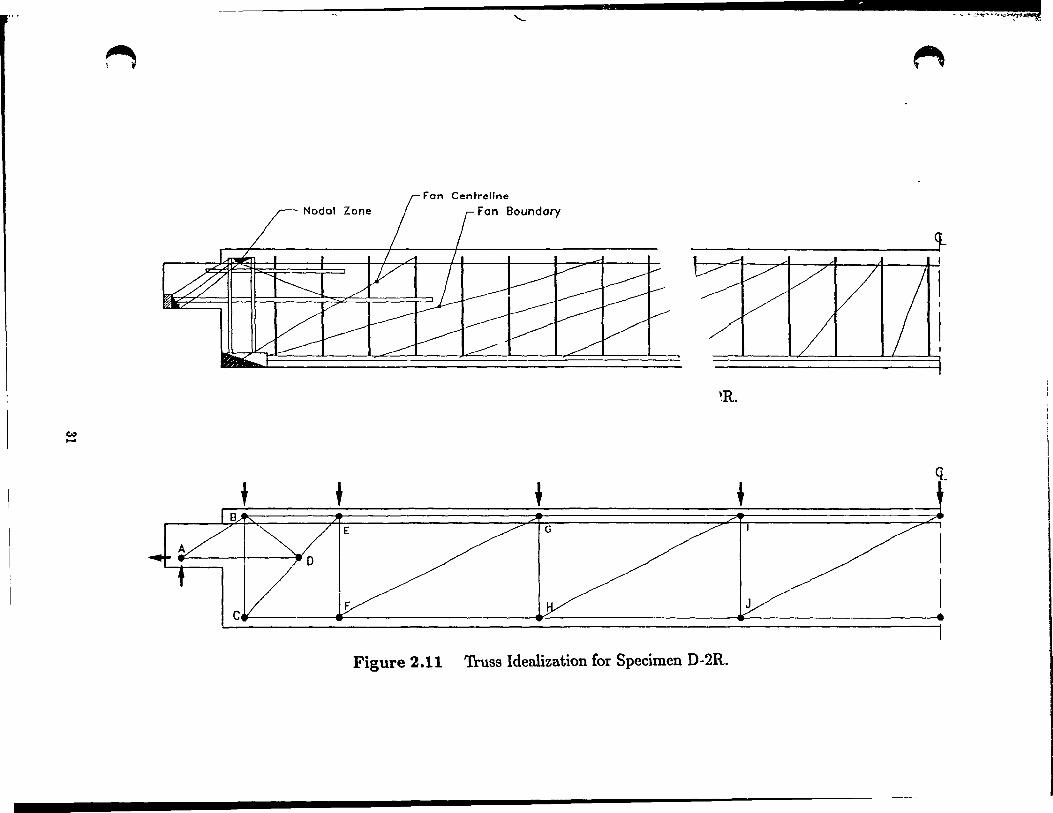
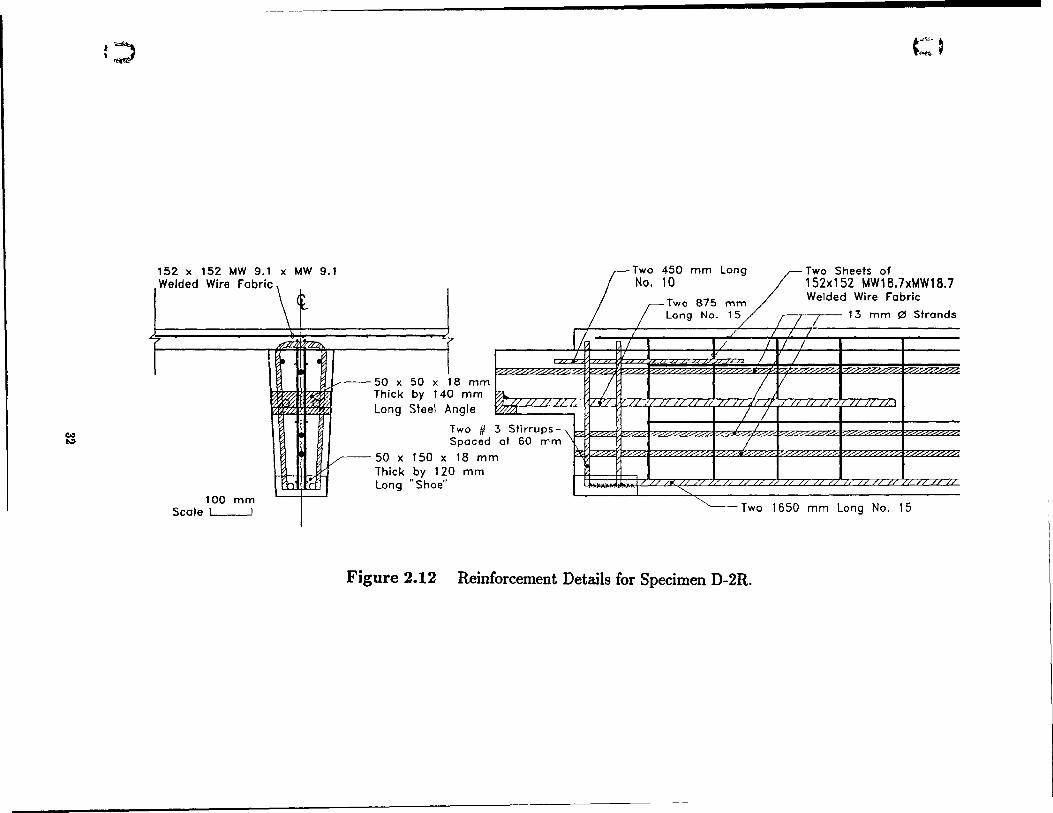
2.2.2.2 Dapped end specimens D-2R and D-2S The second set of dapped
end specimens, D-2R and D-2S, were designed 80 that failure would take place by
yie1ding of the tension hanger in the dapped end. Based on the results of the first
test, the strut-and-tie model was extended to coyer the whole member. To ensure the
yielding of the tension hanger before yielding of the bot tom flexural steel, two additional
No. 15 re-bars were placed at 30 mm from the bot tom of the beam, and were spliced over
a length of 650mm (1.7 Id), with the bottom horizontal tension tie of the reinforcing
cage at eac1-1 dapped end. In addition, two sheets of 152 x 152 MW 18.7 x MW 18.7
welded wire fabric were used in the full depth portions of the beams.
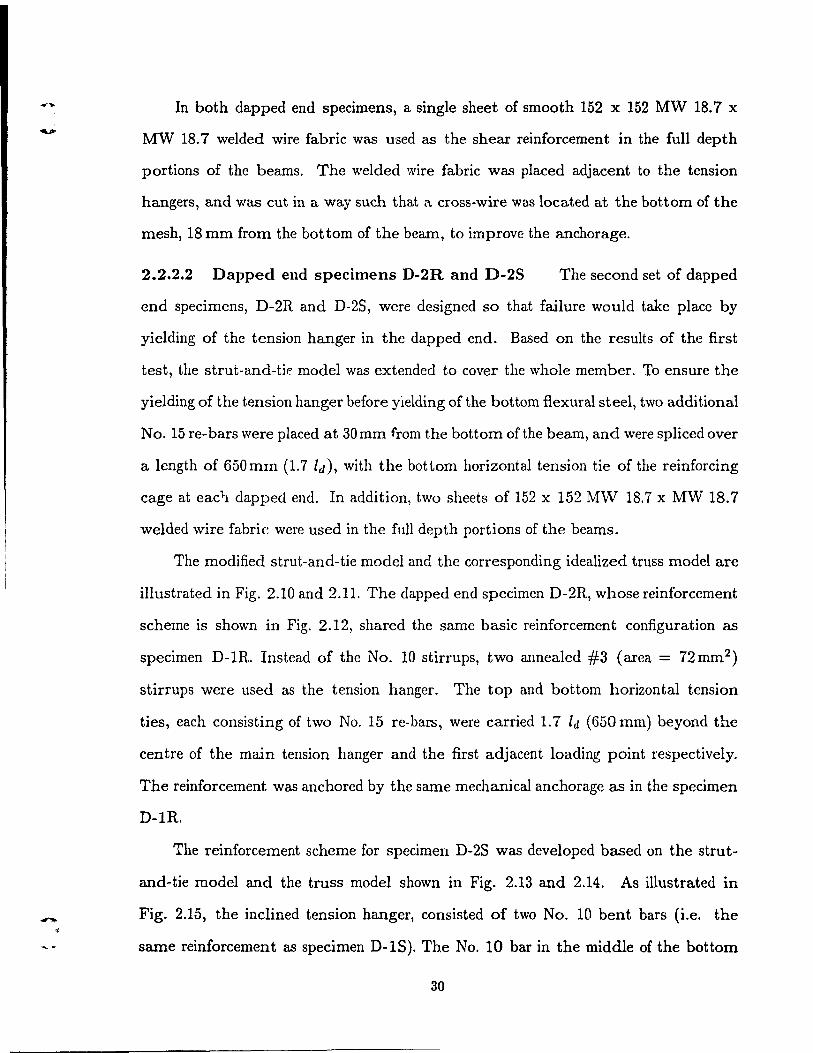
The modified strut-and-tie model and the corresponding idealized truss model are
illustrated in Fig. 2.10 and 2.11. The dapped end specimen D-2R, whose reinforcement
scheme is shown in Fig. 2.12, shared the same basic reinforcement configuration as
specimen D-1R. Instead of the No. 10 stirrups, two annealed #3 (area = 72mm2 )
stirrups were used as the tension hanger. The top and bottom horizontal tension
ties, each consisting of two No. 15 re-bars, were carried 1.7 Id (650 mm) beyond the
centre of the main tension hanger and the first adjacent loading point respectively.
The reinforcement was anchored by the same mechanical anchorage as in the specimen
D-IR.
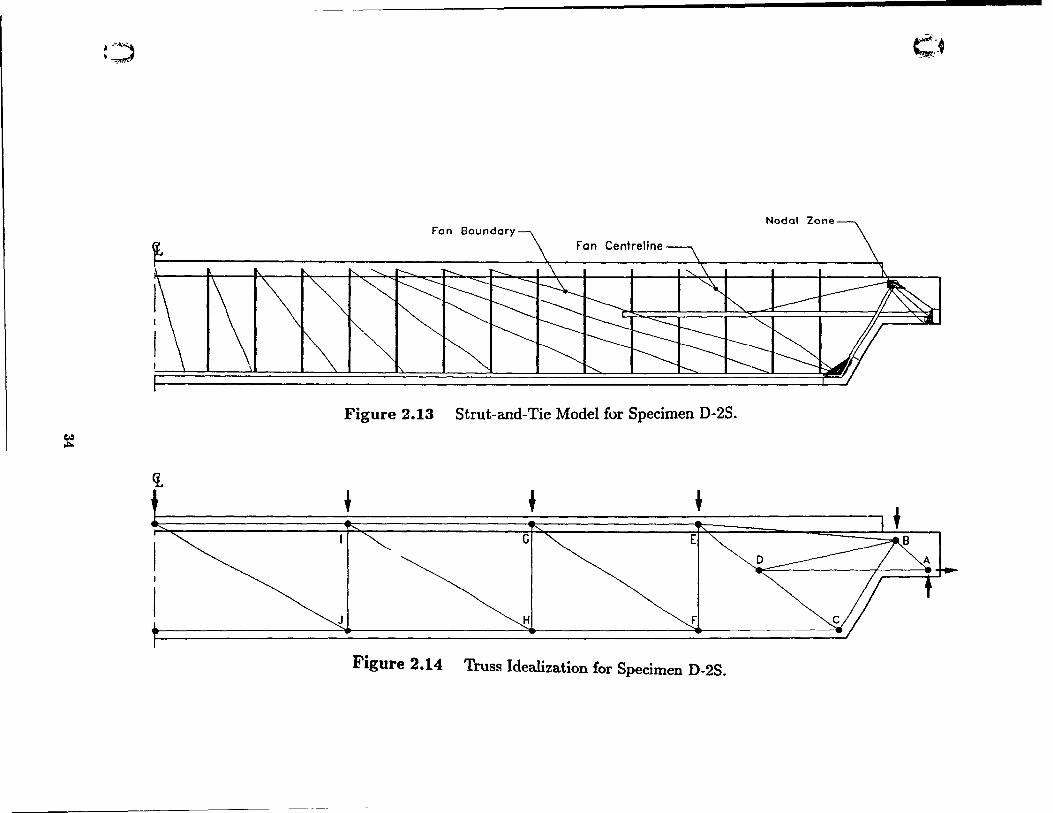
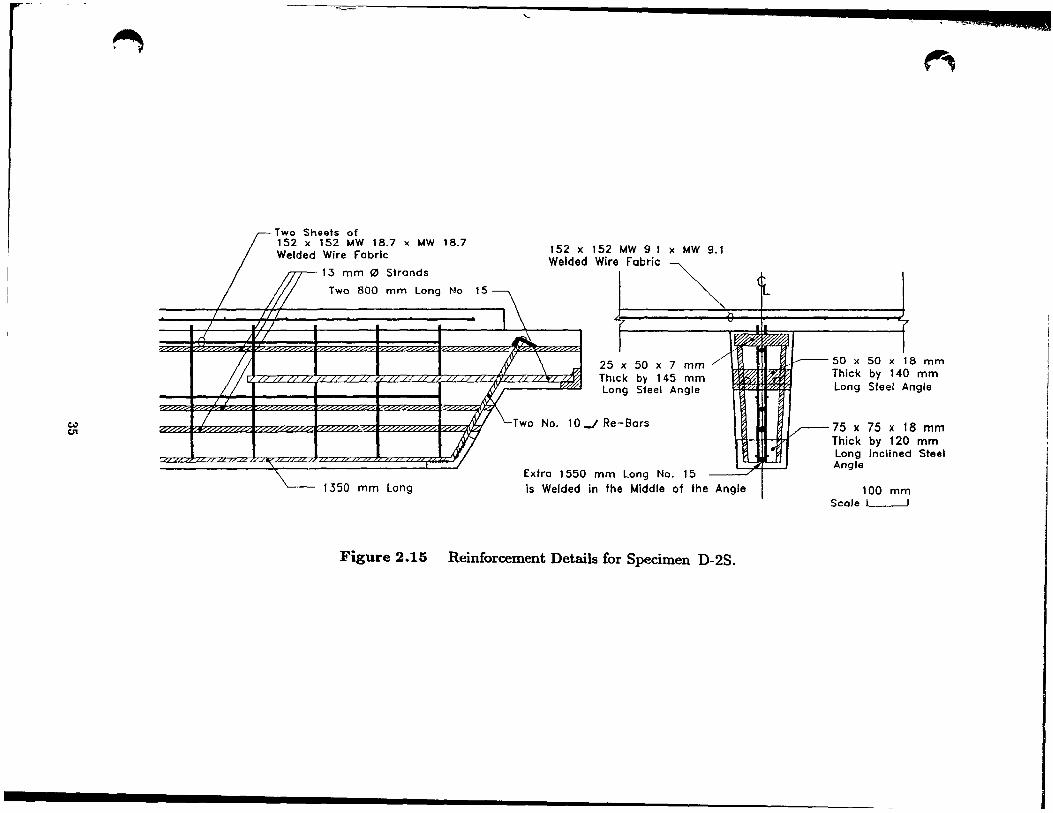
The reinforcement scheme for specimen D-2S was developed based on the strut
and-tie model and the truss model shown in Fig. 2.13 and 2.14. As illustrated in
Fig. 2.15, the inclined tension hanger, consisted of two No. 10 bent bars (i.e. the
same reinforcement as specimen D-lS). The No. 10 bar in the middle of the bot tom
30
c,.., -
~
c
'-
Centreline
Nodal Zone fan Boundory
~R.
+ + E ~ IG
o
F.
Figure 2.11 Truss Idealization for Specimen D-2R.
~
<t-
J
'" t.:I
~~
152 x 152 MW 9.1 x MW 9.1 We/ded Wire fabric \ (~
1- •
~ ~
b: te 100 mm
Scale 1 1
{
1 c.----50 x 50 x 1
Thick by 14(
Long Steel ~
V-- 50 x 150 x Thick by 121 Long "Shoe"
8 mm mm
ngle ~
v//,
wo # Spaced
18 mm mm
, Stirrups.:::\ ct 60 mm
Two 450 mm Long T Sheefs of
III / 1
1 1 1 1 1 1 l 1
vL Il / /
/
/
1 ""-- -
Two 1650 mm Long No. 15
Figure 2.12 Reinforcement Details for Specimen D-2R.
t:: ~
(
(
horizontal tension tie was replaced by a No. 15 bar, which was welded to the bottom
75 x 75 x 18 mm thick by 120 mm long inclined angle. The top horizontal tension tie
. consisted of two No. 15 re-bars, anchored by a 50 x 50 x I8mm thick by 140 mm long
angle at the end of the nib. These bars were carried 1.7 Id (650 mm) past the vertical
tension hanger. The bottom tension tie was also lengthened to 1.7 Id (450 mm for the
No. 10 bars and 650 mm for the No. 15 bars) past the first loading point.
2.3 Material
2.3.1 Concrete
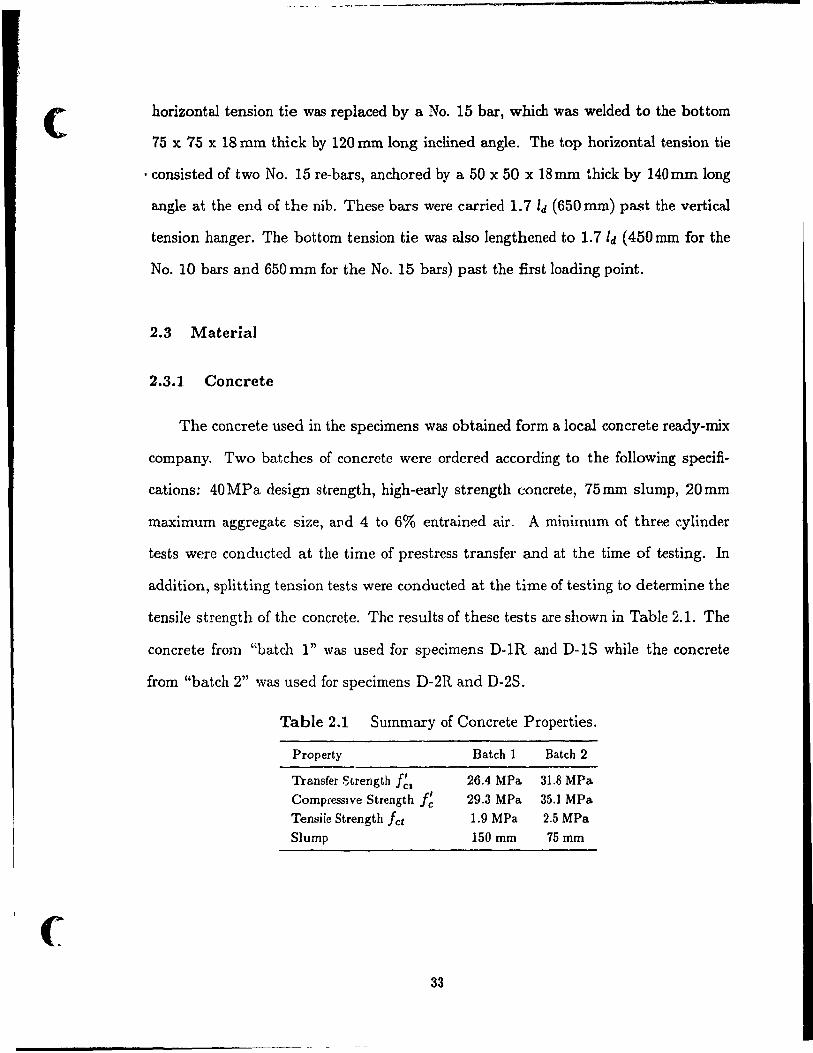
The con crete used in the specimens was obtained form a local concrete ready-mix
company. Two batches of con crete were ordered according to the following specifi-
cations: 40MPa design strength, high-early strength concrete, 75mm slump, 20mm
maximum aggregatE: size, aI1d 4 to 6% entrained air. A minimum of three cylinder
tests were conducted at the time of prestress transfer and at the time of testing. In
addition, splitting tension tests were conducted at the time of testing to determine the
tensile strength of the concrete. The results of these tests are shown in Table 2.1. The
concrete from "batch 1" was used for specimens D-IR and D-lS while the concrete
from "batch 2" was used for specimens D-2R and D-2S.
Table 2.1 Summary of Concrete Properties.
Property Batch 1 Batch 2
Transfer Strength f~1 26.4 MPa 31.8 MPa
Compressive Strength f~ 29.3 MPa 35.1 MPa
Tensiie Strength Ict 1.9 MPa 2.5 MPa
Slump 150 mm 75 mm
33
----------------- ---- --- -
(.1) ,:..
:"~ ~
ct
J
c:'À .... - .-
Fan Boundary
Fan Centreline
Figure 2.13 Strut-and-Tie Model for Specimen D-2S.
+ + + G E
o
H F
Figure 2.14 Truss Idealization for Specimen D-2S.
~
Two Sheets of 152 x 152 MW 18.7 )( MW Welded Wire Fobrlc
13 mm (2) Strands
'--
18.7
Two 800 mm Long No 15 ~
1\ À
152 x 152 MW 9 1 x MW 9.1 Welded Wire Fabric
~ h
x 50 x 7 mm / L \ 17,
.Li 25 Th Lo
ck b'y 145 mm ng S1eel Angle ~
4 ~:t t t tf LI.o No. 10-, R.
=*/V~~::::::::: Extra 1550 mm
Îs Welded in t
-Bors
Long No. 15 e Middle of the Angle
Figure 2.15 Reinforcement Details for Specimen D-2S.
"'-:
(If 1 ....
~ ~
V-i"'! L-.J
?
'"
8 mm mm
ngle
8 mm mm
d Steel
m Scole 1
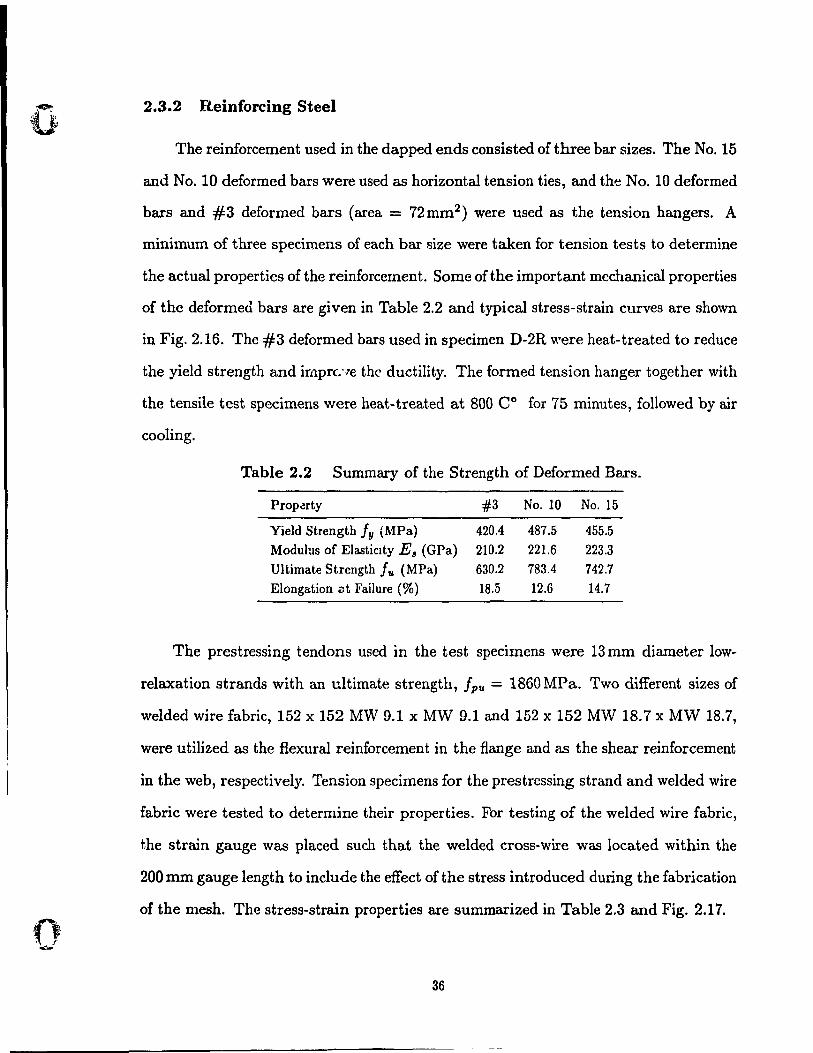
2.3.2 Reinforcing Steel
The reinforcement used in the dapped ends consisted of three bar sizes. The No. 15
and No. 10 deformed bars were used as horizontal tension ties, and the No. 10 deformed
bars and #3 deformed bars (area = 72mm2 ) were used as the tension hangers. A
minimum of three specimens of each bar size were taken for tension tests to determine
the actual properties of the reinforcernent. Some of the important mechanical properties
of the deformed bars are given in Table 2.2 and typical stress-strain curves are shown
in Fig. 2.16. The #3 deformed bars used in specimen D-2R v,'ere heat-treated to reduce
the yield strength and irnprc. 'Je the ductility. The formed tension hanger together with
the tensile test specimens were heat-treated at 800 Co for 75 minutes, followed by air
cooling.
Table 2.2 Summary of the Strength of Deformed Bars.
Property #3 No. 10 No. 15
Yield Strength fy (MPa) 420.4 487.5 455.5
Modulus of Elasticlty E~ (GPa) 210.2 221.6 223.3
Ultimate Strength fu (MPa) 630.2 783.4 742.7
Elongation <lt Failure (%) 18.5 12.6 14.7
The prestressing tendons used in the test specimens were 13 mm diameter low
relaxation st rands with an ultimate strength, fpu = 1860 MPa. Two different sizes of
welded wire fabric, 152 x 152 MW 9.1 x MW 9.1 and 152 x 152 MW 18.7 x MW 18.7,
were utili2ed as the flexural reinforcement in the ftange and as the shear reinforcement
in the web, respectively. Tension specimens for the prestressing strand and welded wire
fabric were tested to determine their properties. For testing of the welded wire fabric,
t,he strain gauge was placed such that the welded cross-wire was located within the
200 mm gauge length to include the effect of the stress introduced during the fabrication
of the mesh. The stress-strain properties are summarized in Table 2.3 and Fig. 2.17.
36
(
/
(
, !j
500
,-...
Ils 400 :l., ~
- 300 rn rn ~ 200 ..., rn
100
------------------------------------------------------------
~ ~I # 3 Re-Bar - - - -No. 10 Re-Bar -- ----No. 15 Re-Bar
O-l'~~--,Ir-~---rl --~--"i---~--rl--.---ïl --r---r-~--~I~ (\ 0.002 0.001 0.006 0.008 0.010 0.012 0.014
Strain
Figure 2.16 Typical Stress-Strain Curves of Reinforcing Bars.
Table 2.3 Stress-Strain Characteristics of Welded TvVire Fabric and Prestressing Strand.
Property MW 9.1 MW 18.7 13 mm Strand
Yield Strength /y (MPa) 550.3 600.0 1650.2
Modulus of Elasticity E8 (GPa) 195.0 202.3 187.5
Ultimate Strength fpu (MPa) 610.2 664.3 1842.5
Elongation at Failure (%) 3.5 4.2 3.0
2.4 Fabrication of the Test Specimens
The test specimens were cast separately from two batelles of concrete. The de
formed bars used in the reinforcing cage were first eut and welded to the mechanical
anchorages, and then assembled to form the cages (e.g. see Fig. 2.18). The targets
were glued on the surface of the bars. Small styrofoarn cylillders were inseded between
the targets and the formwork il'! order to provide smali access holes from the outside
of the concrete to the targets. Subsequently, the reinforcing cages were placed in each
end of the form as shown in Fig. 2.19.
The prestressing strands werp tensioned using the stressing bed illustrated in
Fig. 2.20. Two abutments, each post-tensioned to the floar by two 32 mm diameter
37
0 180
160
140
--cd 120 p.. ~ - 100 in III cv 80 b
CI')
60
40
20
0.002
Legem'
MW 9.1 WWF MW 18.7 WWF 13 mm Strand
----------------------- -- -- --- -- -- -- -- --
0.004 0.006 0.008 0.010 0.012 0.014
Slrain
Figure 2.17 Typical Stress-Strain Curves of Prestressing Strands and Welded Wire Fabric.
and four 38 mm diameter high strength threaded tension rads, were used as the an
chorage of the jacks. The prestressing strands were tensioned simultaneously by three
individual jacks, whose pressure was supplied by a single hydraulic pump. The pre
stressing force was monitored using an OPUS Data Acquisition System. The st rands
were stressed to 0.70 !pu prior to casting.
The concrete was placed into the forms in layers and vibrated with a portable vi
brator, and then covered by plastic sheets for curing in the laboratory. The prestressing
force was monitored continuously for 36 hours. At the time of prestress transfer, about
6 days after the casting, the strands were released slowly and then Rame-eut. After the
prestress tJ:ansfer, the form was stripped and the specimens were then left ta air dry
until testing.
38
c
2.5
-- - ------------------------------
Figure 2.18 Photo of the Reinforcing Cages.
Figure 2.19 Photo of the Reinforcement Details Before Casting.
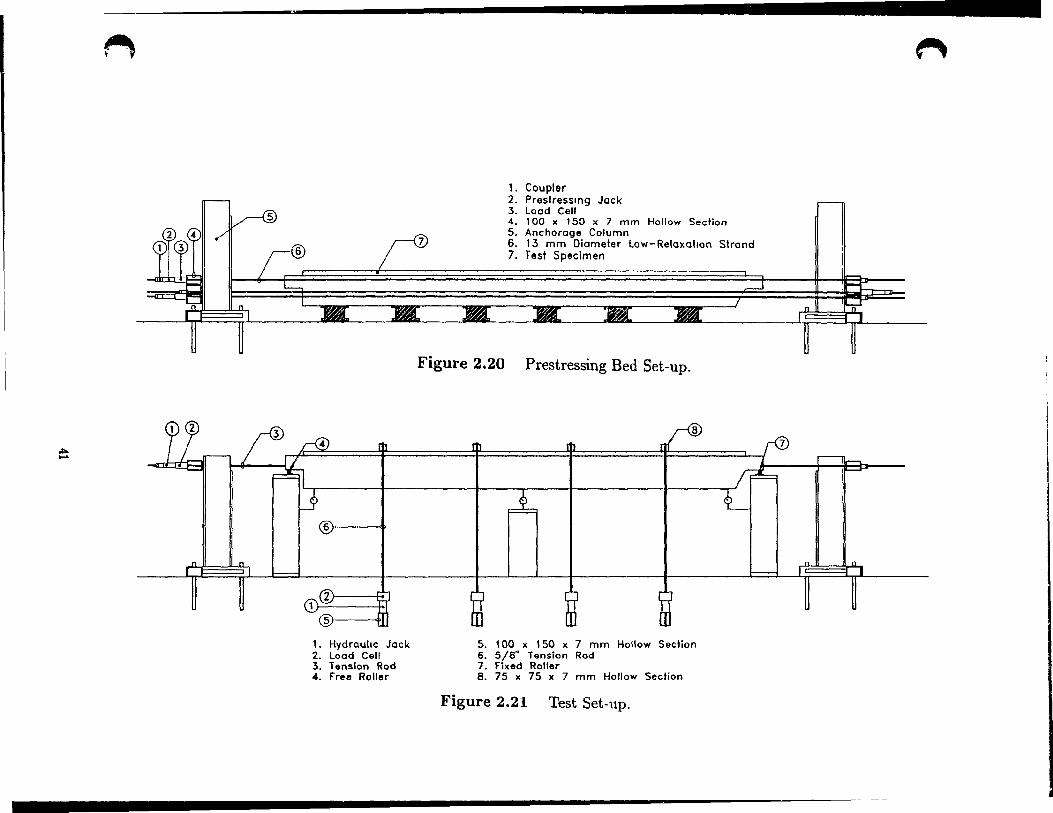
Test Set-up
The test setup for the dapped end specimens is illustrated in Fig. 2.21. The test
39
arrangement was designed to simulate the shear and the moment that would be caused
by uniformly distributed load and the horizontal tension that would be induced by the
restraint of shrinkage and creep of the concrete.
Verticalloads, spaced at 1000 mm, were applied at four locations along the flange.
The tirst loading point was located at 1000 mm from the line of the support reaction
in order not to interrupt the flow of internaI forces in the dapped encls. Each vertical
load was applied by an individual hydraulic jack, and transmitted via two 14 mm high
stren,gth threaded tension rods, which were connected to a load distribution beam (a
75 x 75 x 7 mm thick by 700 mm long hollow tube section), placed transversely on top
of the flange. The tensions in the rods were provided by a jack under the floor reacting
against a distribution beam (a 100 x 150 x 7 mm thick by 650 mm long hollow tube
section), which applied the load to the two loading rods.
The horizontalload was applied along the centreline of the anchorage angle, 25 mm
from the bottom face of the nib. The two columns used as the end abutments during
the pres~ressing were used to form the anchorages required for the horizontal tension
rods (see Fig. 2.21). The pressure of the horizonta' and vertical jacks were supplied
individually by two separate hydraulic pumps. During loading the horizontal load
was maintained at 20 percent of the vertical support reaction, this required constant
monitoring of both the vertical and horizontal loads and frequent adjustment of the
horizontalload.
The supports of the test specimens were centred at 37.5mm from the end face of
the nib. The rectangular dapped end was supported by a free roller, while the sloping
dapped end was supported by a fixed roller. After one end of the specimen failed, the
test set up was changed to allow further loading. After the failure of specimen D-IR, a
support was inserted under the full-depth portion of the beam, 1.4 m from the face of
the nib. In addition, the loading was applied through the two loading points that were
adjacent t.') specimen D-1S. After specimen D-2R failed, a support was added under
40
01>0 ...
fII\
6) t
1. Hydraullc Jack 2. Load Cell 3. Tension Rod 4. Free Roller
~
1. Coupler 2. Prestressln9 Jack 3. Load Cell 4. 100 x 150 x 7 mm Hollow Section 5. Anchorage Column 6. 13 mm Diameter Low-Relaxatlon Strand 7. Test Specimen
Figure 2.20 Prestressing Bed Set-up.
8
5. 100 x 150 x 7 mm Hollow Section 6. 5/S" Tension Rod 7. Fixed Roller B. 75 x 75 x 7 mm Hollow Section
Figure 2.21 Test Set-up.
the full depth portion of specimen D-2R, 200 mm from the face of the nib.
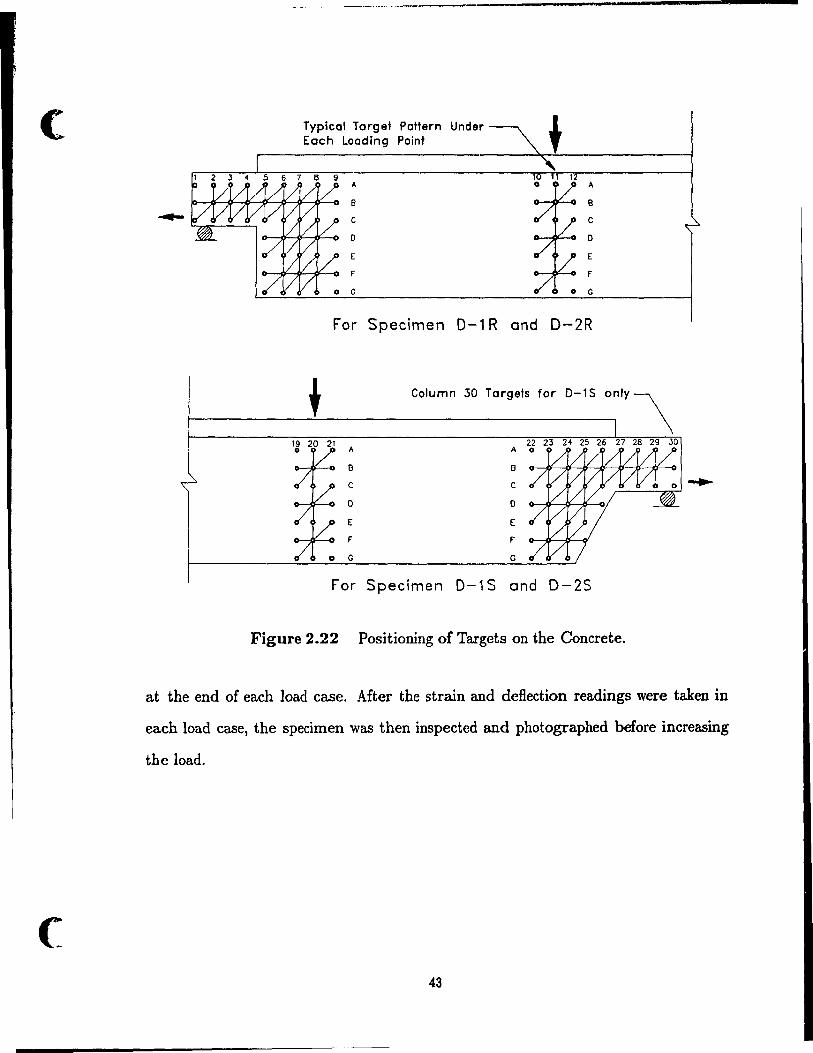
2.6 Instrumentation and Tzsting Procedure
Aluminum targets were glued to the surface of the concrete as shown in Fig. 2.22.
Grids of targets at a spacing of 50 mm were placed at each dapped end and un der
each loading point. Surface strains were determined by measuring the displacements
between the targets using a mechanical gauge. Strain readings were taken in horizontal,
vertical, and diagonal directions to form a series of 450 strain rosettes. A gauge length
of 100 mm was used to measure the horizontal and vertical strains, and diagonal strains
were measured over a 141 mm gauge length. In addition to the strain rosettes on the
concrete, targets spaced at 100 mm were aiso glued on the deformed bars prior to casting
the concrete in order to determine the strain in the reinforcement. Small styrofoam
cylinders were cast into the con crete over the targets on the reinforcement. These
cylinders were later removed using acetO!1e to form small access holes that enabled the
steel strains to be measured. The locations of the targets on the reinforcement are
shown in Fig. 2.23.
Deflections were measured at the bot tom of the full depth portion at the dapped
ends and at the midspan using mechanical dial gauges. The applied loads were de ter
mined by load ceils that connected to the OPUS Data Acquisition System, and recorded
by an IBM personal computer. In addition, the pressure of the hydraulic pumps was
monitored continuously during the tests. The crack widths of the test specimens were
measured by comparing visually with a crack width gauge.
Prior to the test, two zero readings were taken for all strain gauges. During the
test, the load was applied in small increments uniil failure. During each loading, the
verticall.Jads and the horizontaiload were increased alternatively in small incrernents
to maintain the horizontal load at 20% of the end vertical reaction. The applied loads
were monito~'ed continuously during the test, and were recorded at the beginning and
42
(
(
~ ~~~---~-~~----_ .. _--------------------
Typical Target Pattern Under Each Loading Point
A A
B B
C C
0 0
E
F F
For Specimen 0-1 Rand D-2R
A
B
C
o E
F
22 23 A 0
8
C
o E
F
G
For Specimen D-1 Sand D-2S
Figure 2.22 Positioning of Targets on the Concrete.
at the end of each load case. After the strain and deflection readings were taken in
each load case, the specimen was then inspected and photographed before increasing
the load.
43

~ -u-
-
-
4 5 6 71H
:r r: lV J J : ~ 2H .
Specimen D-1R (Front Foce)
Specimen 0-1 R (Beck Face)
4H.1
Specimen 0-15 (front race)
-
4 t 6 7 ~IH . . . IV 1 \ J 4 5 ~ 7 B 22H . . . . . Specimen D-2R (Front face)
2V~6H
Specimen 0-2R (Bock Foce)
1 JH. 6 1 8.
Specimen 0-2S (Front Foce)
4H~
Specimen 0-15 (Bock face) Specimen 0-2S (Bock Face)
Figure 2.23 Position of the Steel Targets.
44
--
--
c
)
(
- --- ------ ---------------~,----------------
CHAPTER 3
EXPERIMENTAL RESULTS
3.1 Introduction
Four specimens were tested to observe the behaviour of the disturbed regions
caused by the dapped ends. The experimental data is compared with the theoretical
predictions and is presented in Chapter 6. In this chapter, the responses of the test
specimens are described, with the relevant test data given in Appendix A.
3.2 Response of Specimen D-1R
Specimen D-IR was designed to evaluate the reinforcement details developed for
rectangular dapped ends, in which a pair of No. 10 closed stirrups were used as the
tension hanger, and two No. 15 bars were used as the horizontal tension ties. Prior to
the test, under the self-weight of the beam, a fine hair-line crack had ai>peared at the
re-entrant corner extending at about 45° from the horizontal toward the outermost
vertical stirrup. At a support reaction, Rv, of 18.9kN, (the support reaction reported
does not include the self-weight of the specimen), a short hair-line crack was formed
bran ching off of the re-entrant corner crack. Flexural cracking first appeared at midspan
when Rv was 38.9 kN, while a web flexure crack was aiso found in the full-depth portion
of the dapped end, approximate 450 mm from the support.
In the next load stage, Rv = 48.1 kN, a diagonal shear crack was formed in the
45
-
Figure 3.1 Photograph of Specimen D-IR at Ru of 48.1 kN.
dapped end, extending from the top of the anchorage "shoe" to about 30 mm from the
web-flange junction at an angle of approximately 450 ,as illustrated in Fig. 3.1. The
flexure cracks at midspan had a maximum crack width of 0.60 mm and penetrated to
about 15 mm from the web-Bange junction.
The failure of the specimen occurred when Ru was 54.0 kN, caused by the formation
of a 4.0 mm wide diagonal shear crack under the first loading point adjacent to the
dapped end. The crack propagated from the bot tom to the top of the web lit an angle
of about 60° from the horizontal. At the ultimate load stage, the diagonal crack in
the dapped end widened to 0.1 mm, but no sigmficant change in the re-entrant corner
crack wr.cs observed. The cracking pattern of specimen D-IR at ultimate load is shown
in Fig. 3.2.
The failure of specimen D-IR was initiated by the yielding of the MW 18.7 welded
wire fabric that was used as the shear reinforcement. A rather brittle failure was
observed which indicated that the srnooth welded wire fabric is not sufficient to carry
46
(
- - - - -- ----~-~~.,~~-----------------
Figure 3.2 Photograph of Specimen D-IR at Failure.
the tension across the crack. The shape and location of the crack could also indicate that
the flexural reinforcement pl'Ovided was inadequate, thus different anchorage details for
the flexural reinforcement were used in specimen D-2R in an atternpt to prevent this
brittle failure.
The vertical tension hanger in the specimen D-IR provided good control on the
cracking of the re-entrant corner. Un der service load, which corresponded to a support
reaction, Rv, of 1Î.4 kN, ouly a hair-line forking crack was observed at the re-entrant
corner. At ultimate load, which was equal to three times the service loa , the re
entrant corner crack remained rather small, only a 0.1 mm crack width was notked.
The mechanical anchorage, the steel angle and the "shoe", performed effectively, no
sign of spalling or crushing of con crete was found in these nodal areas. The prestressing
strands were sufficient in limitmg the development C Jracks in the full-depth portion
of the beam.
Figure 3.3 illustrates the principal strains determined frorn the 450 strain rosette
47
Scale 4000 >----< Straln scale 1 000 • IOE-3
Figure 3.3 The Distribution of Principal Strain of Specimen D-IR.
readings. These strains indicate the presence of the inclined compressive strut and the
diagonal crack in the nib. The diagonal crack in the full-depth portion of the bearn
and the pattern of the principal strains suggest the existence of compressive stresses
Rowing into the base of the vertical tension hanger.
Despite the fact that significant strains were measured in the horizontal reinforcing
bars in the nib and in the vertical stirrups, the reinforcement in the "cage" had not
yielded at failure (see Fig. 3.4). The maximum steel strain observed in the reinforcing
"cage" was 0.0014, which was measured in the outermost No. 10 vertical stirrup, this
value corresponded to about 70% of the yield strain. The steel strain found in the
bot tom reinforcing bars in the web was considerably lower than the other reinforcing
bars. This may suggest that the bot tom two prestressing strands had taken most of the
load, or the reinforcing bars were not able to develop their yield strength. Specimen
D-2R provides greater developrnent lengths for the reinforcing bars in or der to study
the importance of bond in these important tension tie members.
48
(
f
__________ ~~~r~~~ ______ ~ _________ ... _'._IIJ_ ..... :I:iI ... __ • ________ =-----
l
Scale 40 00 ~ Straln scale 1 000 • 10E-J ___
Figure 3.4 The Steel Strain Readings of Specimen D-IR.
3.3 Response of Specimen D-18
The reinforcing cage of specimen D-1S consisted of a pair of inclined No. 10
reinforcing bars, as weIl as two No. 10 bars and three No. 10 bars serving as tension
ties in the nib and at the bot tom of the web, respectively. Under the self-weight ofthe
specimen, cracking of the concrete cover was observed at the re-entrant corner. As the
load increased, the re-entrant corner crack split into two branch cracks. At a support
reaction, Ru, of 38.9kN, additional hair-line diagonal cracks were noticed in the nib
and at the inclined dap (see Fig. 3.5), while the flexural cracks began at midspan and
widened to 0.8 mm at the end of the test. When specimen D-IR failed at the other end
of the beam, at Rv of 54.0 kN, the diagonal crack at the inclined dap had widened to
O.10mm. The specimen was un-loaded after this loading stage.
Prior to re-loading of the specimen D-1S, three external stirrups, consisting of six
steel bars (18mm diameter) that were anchored by 13mm thick steel plates at the top
and 18mrn thick steel plates at the bottom, were placed along the critical diagonal
49
-
:>3;~' :}:('; ,;::: '. ;.';'; ,':,'
i" "'.'
Figure 3.5 Photograph of Specimen D-IS at Rv of 38.9kN.
crack in the half of the beam containing specimen D-IR. Despite the addition of the
external stirrup3, during re-loading of the beam, the shear crack conHnued to widen
and a new large diagonal crack was formed close to the old shear crack as shown in
Fig. 3.6. Therefore, the test set-up had to be re-arranged to allow further loading of the
specimen, the details of the new test set-up was described in Section 2.5. It was decided
to provide a support next to the external stirrups, and to apply the load through the
two loading points that were adjacent to specimen D-lS.
As the re-loading continued, the width of the diagonal crack at the inclined dap
increased to O.20mm and a new diagonal crack was formed in the web, about 500mm
from the support. This diagonal crack in the web progressed with increasing load, a."ld
nnally caused the failure of specimen D-IS at a support reaction, Rv, of 42.2kN, as
shown in Fig. 3.7. As r,an be seen, two diagonal cracks, with a maximum width of
4.0 mm, were formed under th~ fir~i loading point, and penetrated all the way to the
underside of the flange. The widest crack observed in the dapped end after failure was
50
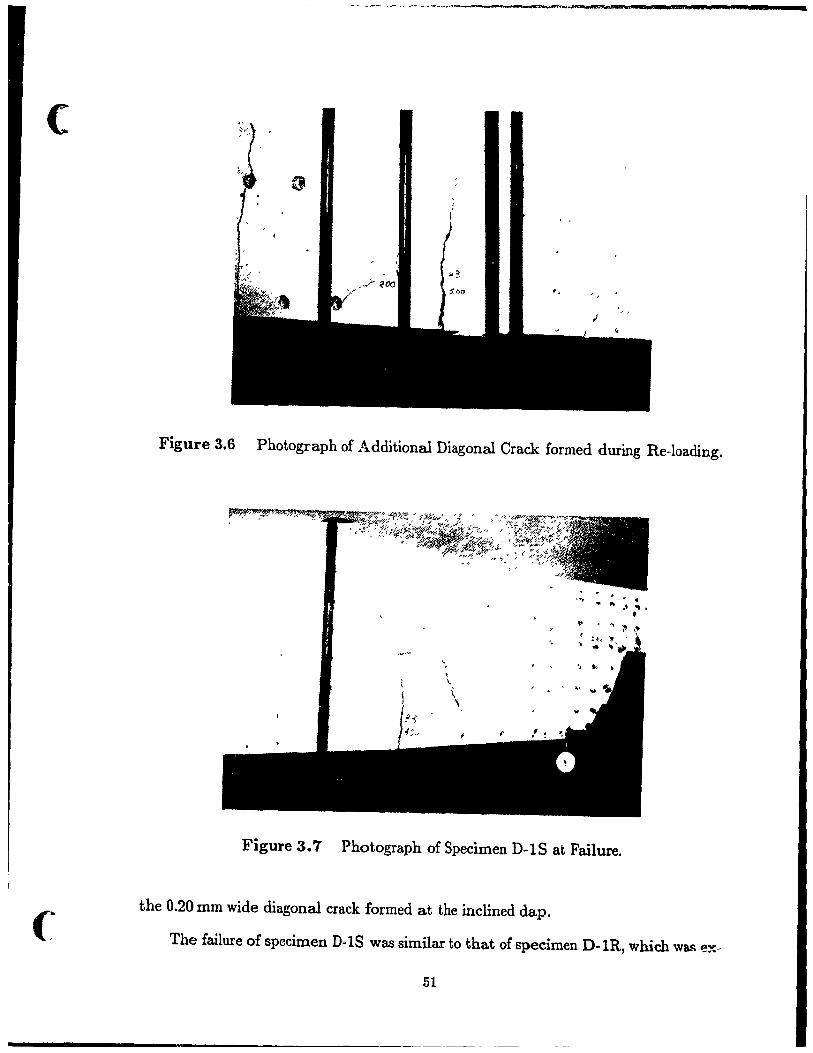
(
(
------_.~--~~~~,------------=--~------------
Figure 3.6 Photograph of Additional Diagonal Crack formed during Re-loading .
'. \
\ ~ , '\
. . . .. " J .....
t
" . f '. \
Figure 3.7 Photograph of Specimen D-lS at Failure.
the 0.20 mm wide diagonal crack formed at the inclined dap.
The {ailure of specimen D-1S was similar to that of specimen D-IR, which was e~-
51
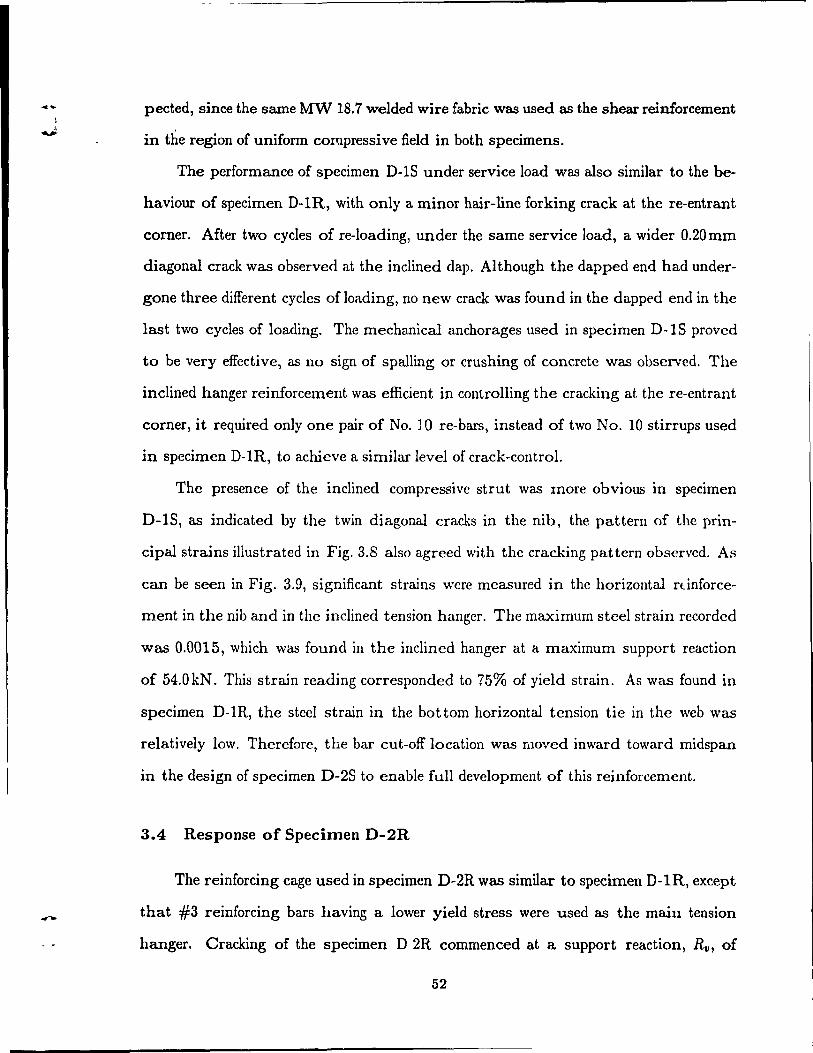
\ J, -
-
peeted, sinee the same MW 18.7 welded wire fabrie was used as the shear reinforcement
in the region of uniform corupressive field in both specimens.
The performance of specimen D-1S under service load was also similar to the be-
haviour of specimen D-IR, with only a minor hair-line forking crack at the re-entrant
corner. After two cycles of re-Ioading, un der the same service load, a wider 0.20mm
diagonal crack was observed at the inclined dap. Although the dapped end had under
gone three different cycles of loading, no new crack was round in the dapped end in the
last two cycles of loading. The mechanical anchorages used in specimen D-lS proved
to be very effective, as no sign of spalling or crushing of concrete was observed. The
inclined hanger reinforcement was efficient in controlling the cracking at the re-entrant
corner, it required only one pair of No. JO re-bars, instead of two No. 10 stirrups used
in specimen D-1R, to acllieve a similar level of crack-control.
The presence of the inclined compressive strut was more obvioll.." III specImen
D-lS, as indicated by the twin diagonal cracks in the nib, the pattern of the prin-
cipal strains illustrated in Fig. 3.8 also agreed with the cracking pattern observcd. As
can be seen in Fig. 3.9, significant strains were measured in the horizontal ninforce-
ment in the nib and in the inclined tension hanger. The maximum steel strain recorded
was 0.0015, which was found in the inclined hanger at a maximum support reaction
of 54.0kN. This strain reading corresponded to 75% of yield strain. As was found in
specimen D-IR, the steel strain in the bot tom horizontal tension tie in the web was
relatively low. Therefore, the bar eut-off location was moved inward toward midspan
in the design of specimen D-2S to en able full development of this reinforcement.
3.4 Response of Specimen D-2R
The reinforcing cage used in specimen D-2R was similar to specimen D-1R, except
that #3 reinforcing bars having a lower yield stress were used as the main tension
hanger. Cracking of the specimen D 2R commenced at a support reaction, Rv, of
52
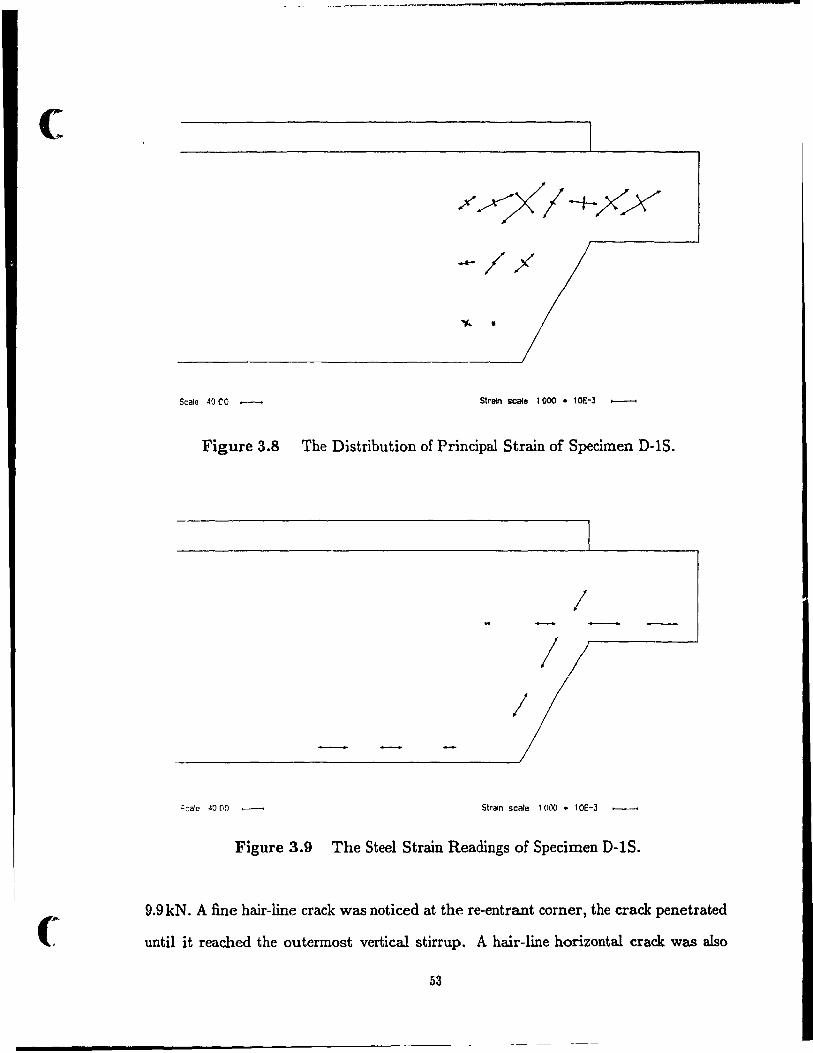
(
(
~~---~-----~-------~-----------------_.
Scale 40 CO _ straln Ecale 1000 • 10E-J --
Figure 3.8 The Distribution of Principal Strain of Specimen D-IS.
/
/ /
~cale 4000 _ Straln sCille 1000 • 10E-] _
Figure 3.9 The Steel Strain Readings of Specimen D-1S.
9.9kN. A fine hair-line crack was noticed at the re-entrant corner, the crack penetrated
until it reached the outermost vertical stirrup. A hair-line horizontal crack was also
53
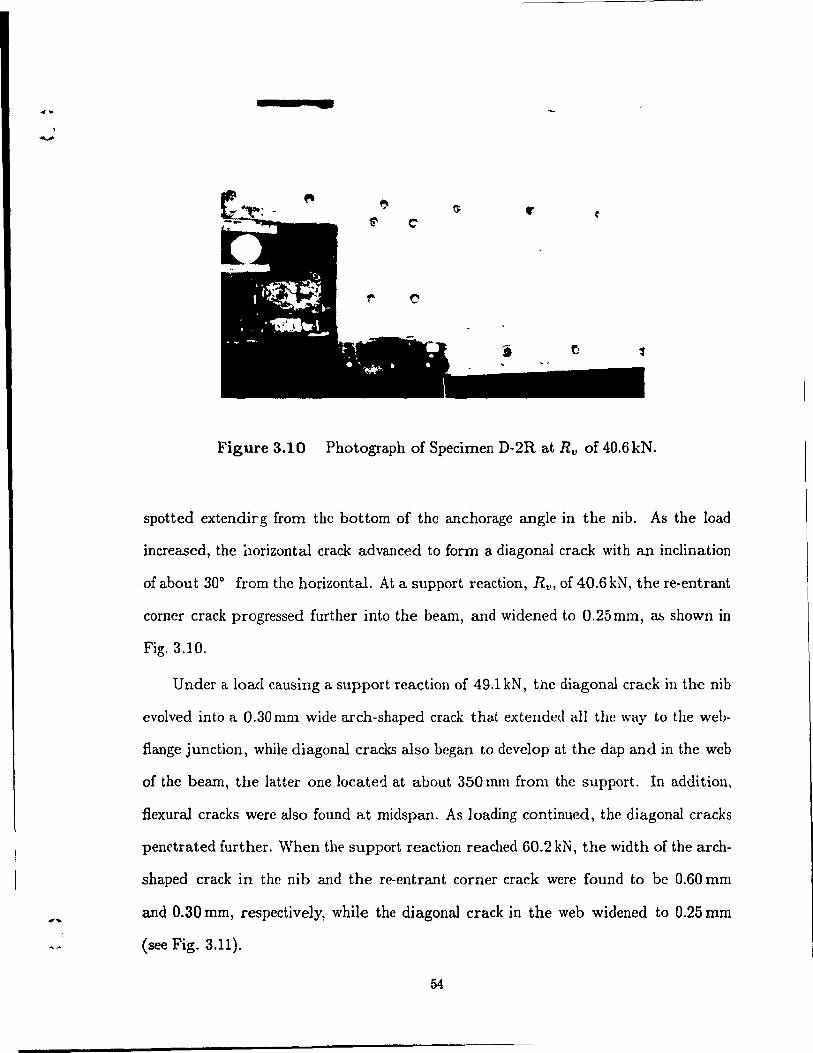
-
•
Figure 3.10 Photograph of Specimen D-2R at Rv of 40.6kN.
spotted extendirg from the bot tom of the anchorage angle in the nib. As the load
increased, the llOrizontal crack advanced to form a diagonal crack with an inclination
of about 30° from the horizontal. At a support reaction, Ru, of 40.6kN, the re-entrant
corner crack progressed further into the beam, and widened to 0.25mm, ru, shown in
Fig. 3.10.
Under a load causing a support reaction of 49.lkN, the diagonal crack in the nib
evolved into a 0.30 mm wide arch-shaped crack that extended aIl the way to the web
Range junction, while diagonal cracks also began to develop at the dap and in the web
of the beam, the latter one locate'.! at about 350 mm from the support. In addition,
Rexural cracks were also found at midspan. As loading continued, the diagonal cracks
penetrated further. Wh en tht' support reaction reached 60.2kN, the width of the arch
shaped crack in the nib and the re-entrant corner crack were found to be 0.60 mm
and 0.30 mm, respectively, while the diagonal crack in the web widened to 0.25 mm
(see Fig. 3.11).
54
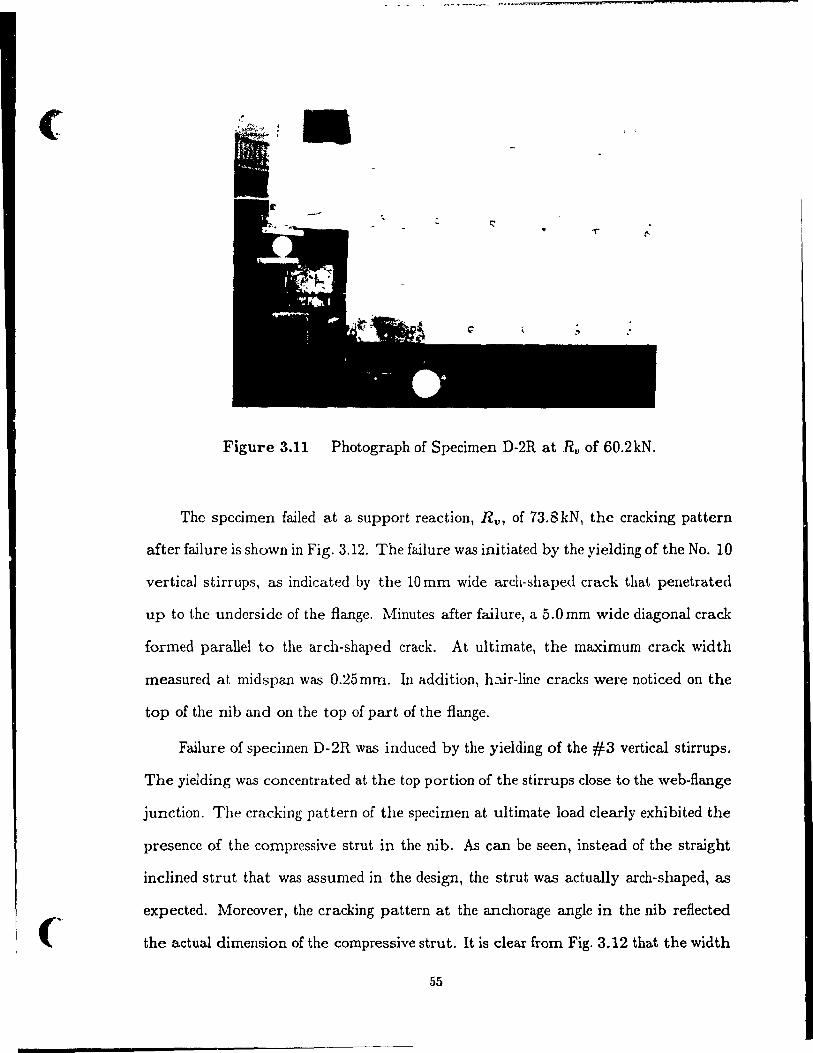
c
(~
. '.
Figure 3.11 Photograph of Specimen D-2R at Rv of 60.2kN.
The specimen failed at a support reaction, Ru, of 73.8kN, the cracking pattern
after failure is shown in Fig. 3.12. The failure was initiated by the yielding of the No. 10
vertical stirrups, as indicated by the 10 mm wide arch-shaped crack that penetrated
up to the underside of the Bange. Minutes after failure, a 5.0 mm wide diagonal crack
formed parallel to the arch-shaped crack. At ultimate, the maximum crack width
measured at midspan was 0.25mm. In addition, h.::\Ïr-line cracks were noticed on the
top of the nib and on the top of part of the Bange.
Failure of specimen D-2R was induced by the yielding of the #3 vertical stirrups.
The yielding was concentrated at the top portion of the stirrups close to the web-flange
junction. The cracking pattern of the specimen at uItimate load clearly exhibited the
presence of the compressive strut in the nib. As can be seen, instead of the straight
inclined strut that was assumed in the design, the strut was actually arch-shaped, as
expected. Moreover, the cracking pattern at the anchorage angle in the nib refiected
the actual dimension of the compressive strut. It is clear from Fig. 3.12 that the width
55
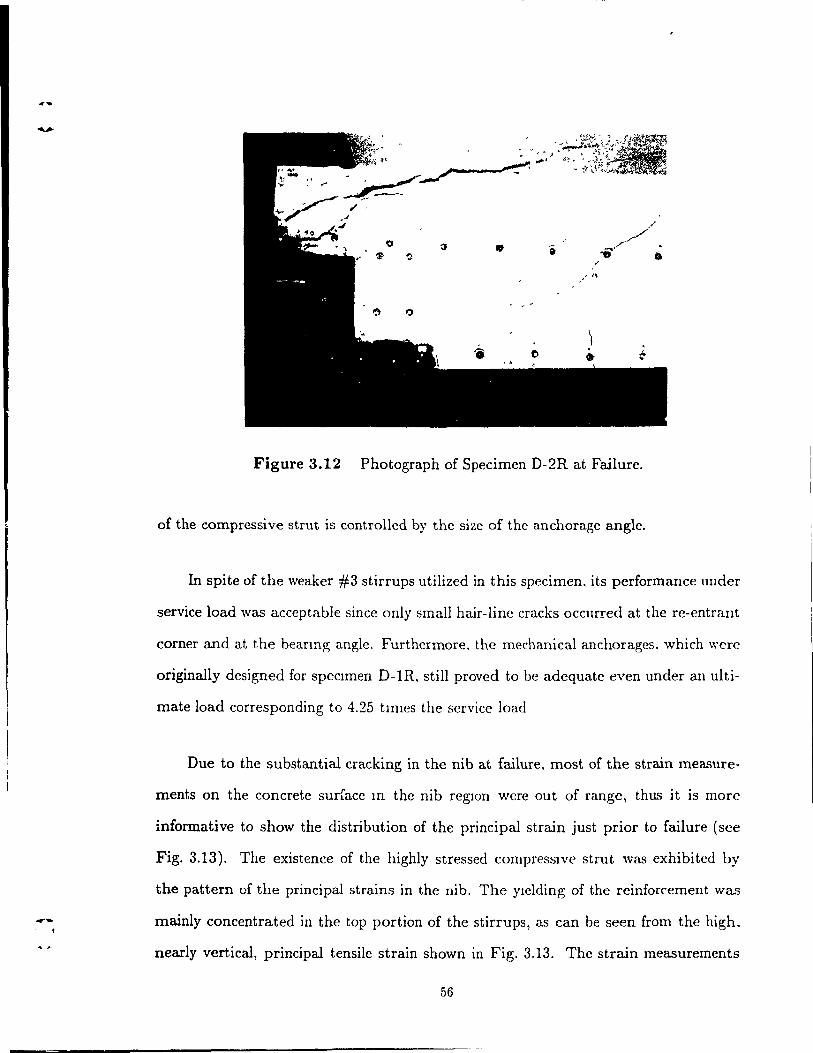
......
...., ,
0 ///
~ • i ~./ ~ $> ';) -e ..
?
/1\
~ 1)
1
Figure 3.12 Photograph of Specimen D-2R at Failure.
of the compressive strut is controlled by the size of the anchorage angle.
In spïte of the weaker #3 stirrups utilized in this specimen, its performance under
service load \Vas acceptable since only small hair-line cracks occurred at the re-entrant
corner and at the bearmp.; angle. Furthermore. the mechanical anchorages. which wcre
originally designed for speCImen D-1R. still proved to be adequate even under an ulti-
mate load corresponding ta 4.25 tImes the service load
Due to the substantial cracking in the nib at failure, most of the strain measure-
ments on the con crete surface m the nib reglOn were out of range, thus it is more
informative to show the distribution of the principal strain just prior to failure (see
Fig. 3.13). The existence of the highly stressed compreSSIve strut was exhibited by
the pattern of the principal strains in the nib. The ylelding of the reinforcement was
mainly concentrated in the top portion of the stirrups, as can be seen from the high,
nearly vertical, principal tensile strain shown in Fig. 3.13. The strain measurements
56
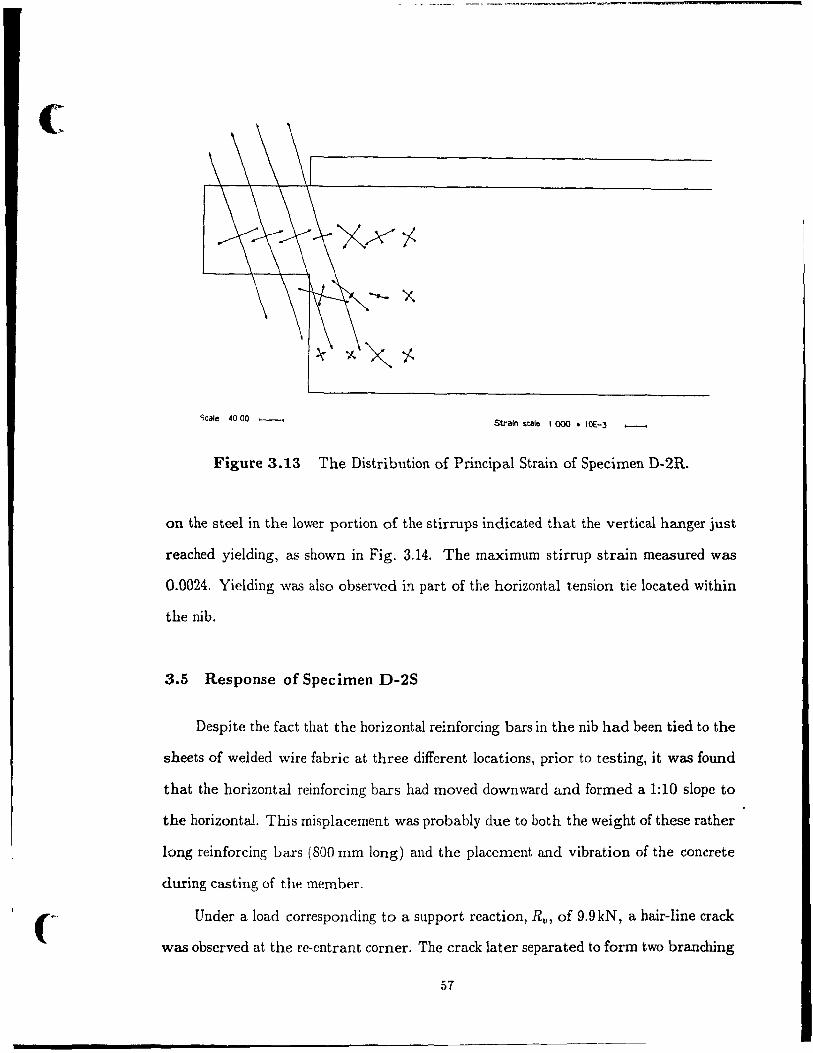
c
-- ----- -----"----~----~----_ ... -........ ------
--x
Scale 4000 ___ Straln scale 1 000 • lOE-J
Figure 3.13 The Distribution of Principal Strain of Specimen D-2R.
on the steel in the lower portion of the stirrups indicated that the vertical hanger just
reached yielding, as shown in Fig. 3.14. The maximum stirrup strain measured was
0.0024. Yielding was aiso observed in part of the horizontal tension tie located within
the nib.
3.5 Response of Specimen D-2S
Despite the fact that the horizontal reinforcing bars in the nib had been tied to the
sheets of welded wire fabric at three different locations, prior to testing, it was found
that the horizontal reinforcing bars had moved downward and formed a 1:10 slope to
the horizontal. This misplacement was probably due to bath the weight of these rather
long reinforcing bars (800 mm long) and the placement and vibration of the concrete
during casting of the member.
Under a load corresponding to a support reaction, Rv, of 9.9kN, a hair-line crack
was observed at the re-entrant corner. The crack later separated to form two branching
57
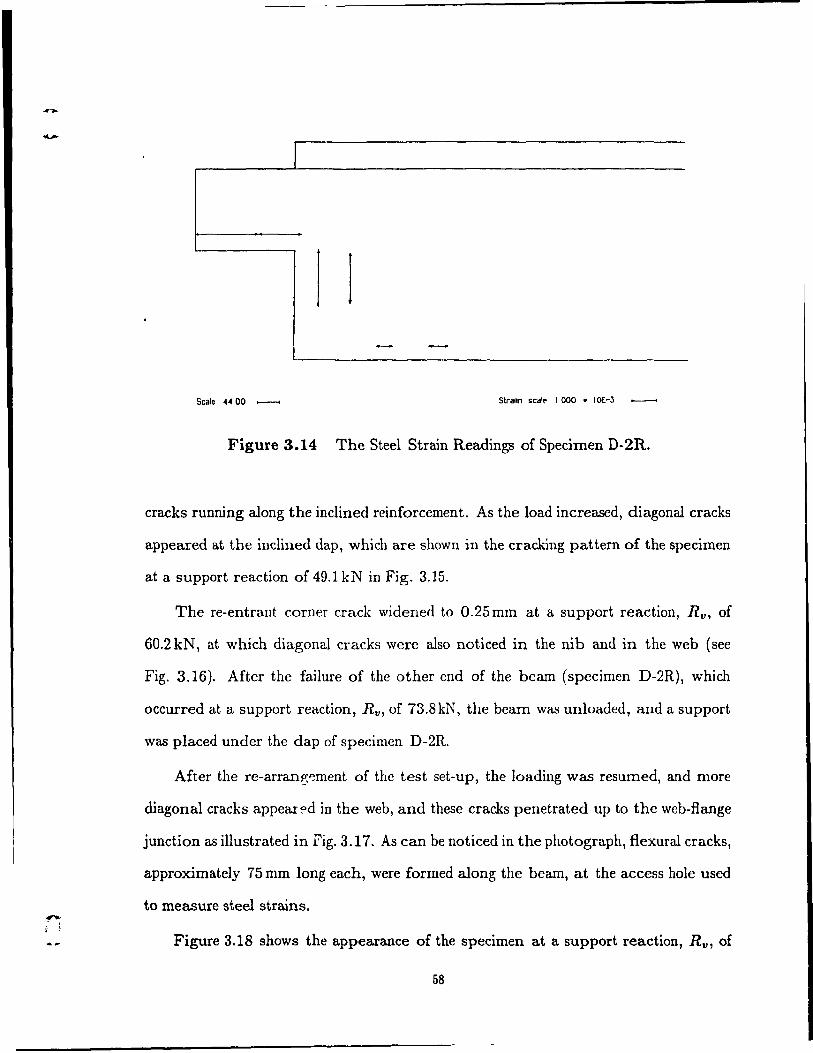
~ . , ~ ,
1
l ______________________________________ __
Scale 44 00 0---< Straln .calp 1 000 • lOE-3
Figure 3.14 The Steel Strain Readings of Specimen D-2R.
cracks running along the inclined reinforcement. As the load increased, diagonal cracks
appeared at the inclined dap, which are shown in the cracking pattern of the specimen
at a support reaction of 49.1 kN in Fig. 3.15.
The re-entrant corner crack widened to O.25mm at a support reaction, Rv, of
60.2kN, at which diagonal cracks were also noticed in the nib and in the web (see
Fig. 3.16). After the failure of the other end of the beam (specimen D-2R), which
occurred at a support reaction, Rv, of 73.8 kN, the bearn was unloaded, and a support
was placed under the clap of specimen D-2R.
After the re-arrang~ment of the test set-up, the loading was resumed, and more
diagonal cracks appear ~d in the web, and these cracks penetrated up to the web-Range
junction as illustrated in Fig. 3.17. As can be noticed in the photograph, fiexural cracks,
approximately 75 mm long each, were formed along the beam, at the access hole used
to measure steel strains.
Figure 3.18 shows the appearance of the specimen at a support reaction, Rv, of
58
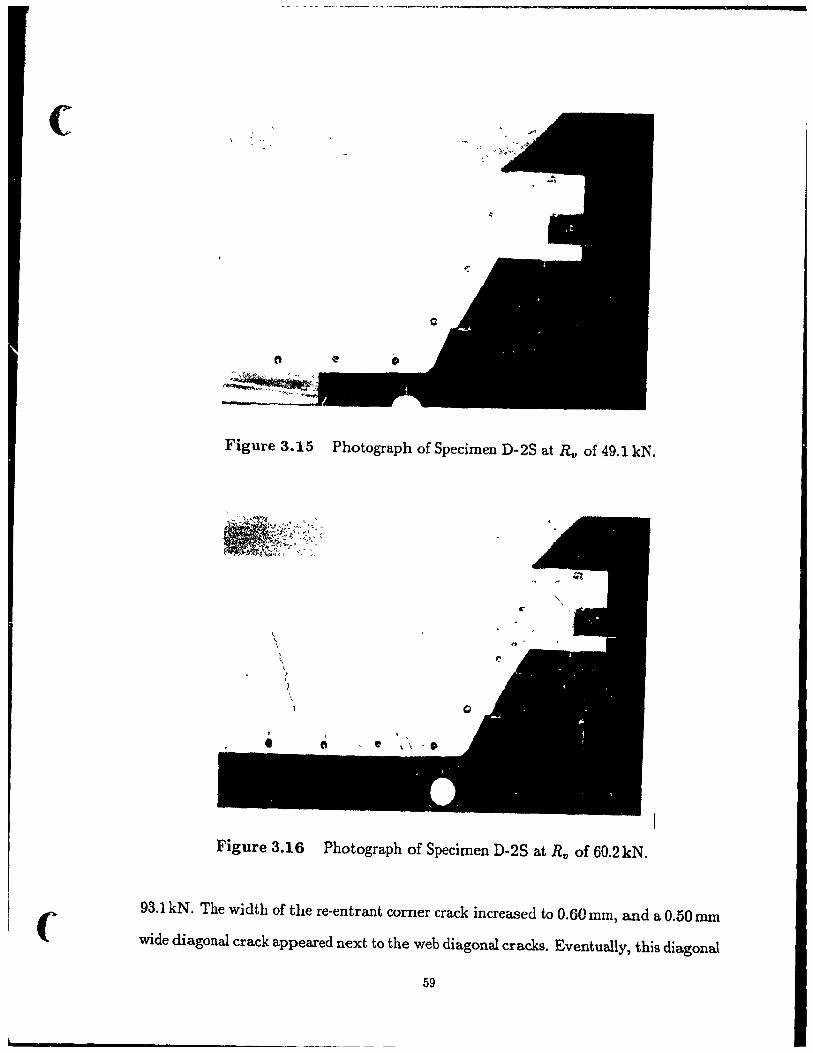
(
(
-- - - -- ----------~-~-._--------------
Figure 3.15 Photograph of Specimen D-2S at R" of 49.1 kN.
, \
(, t: , : 1
Figure 3.16 Photograph of Specimen D-2S at R" of 60.2kN.
93.1 kN. The width of the re-entrant corner crack increased to O.60mm, and a O.50mm
wide diagonal crack appeared next to the web diagonal cracks. Eventually, this diagonal
59
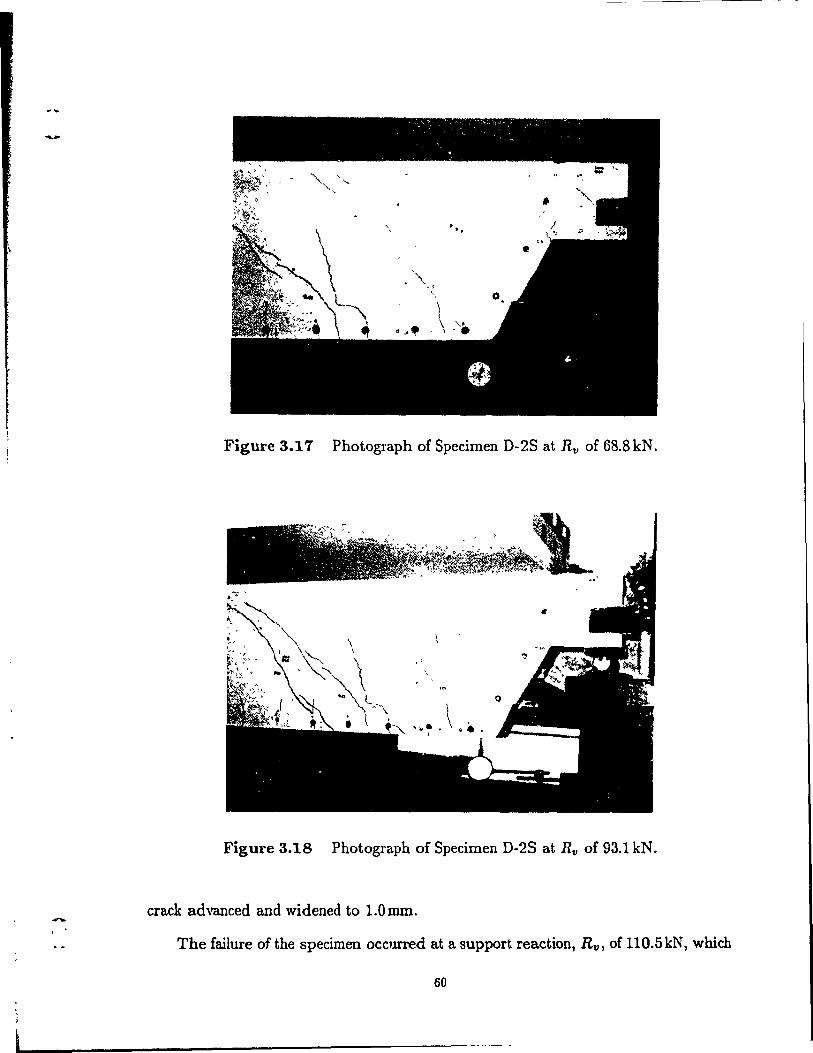
Figure 3.17 Photograph of Specimen D-28 at Rv of 68.8 kN .
Figure 3.18 Photograph of Specimen D-2S at Rv of 93.1 kN.
crack advanced and widened to 1.0 mm. -The failure of the specimen occurred at a support reaction, Rv, of llO.5kN, which
60
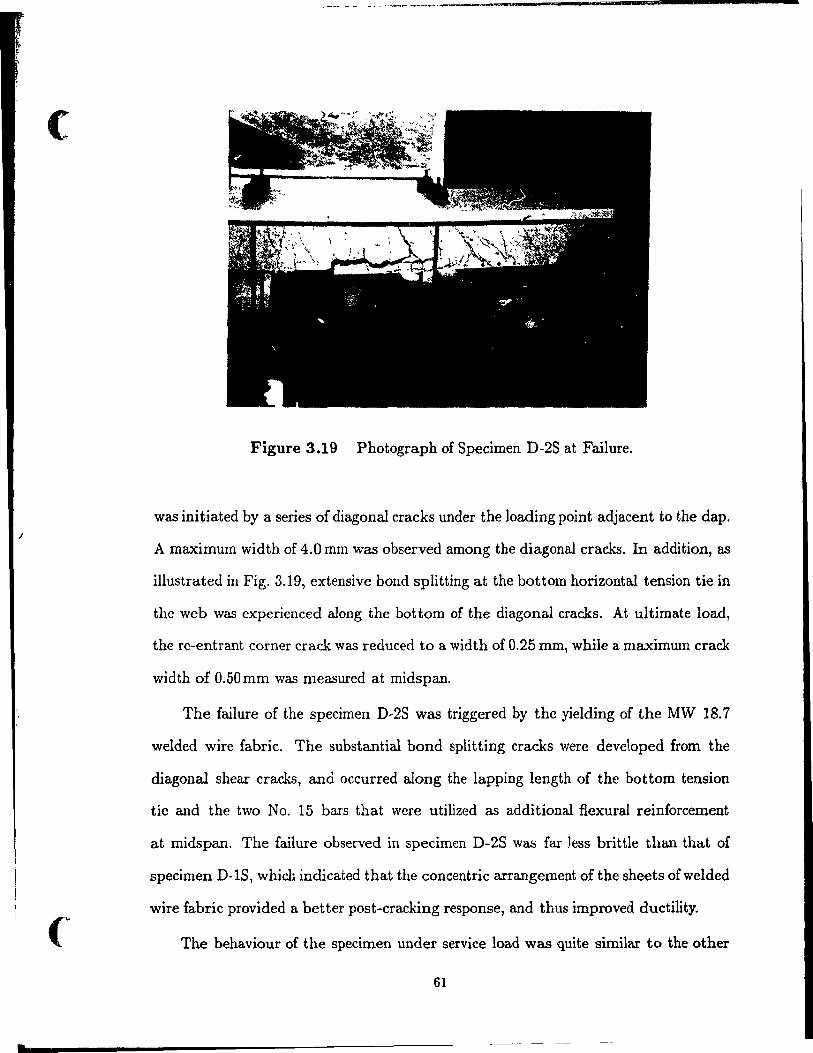
(
/
(~
•
,--, -- "--,~~-,------------------
Figure 3.19 Photograph of Specimen D-2S at Failure.
was initiated by a series of diagonal cracks under the loading point adjacent to the dap.
A maximum width of 4.0mm was observed among the diagonal cracks. In addition, as
illustrated in Fig. 3.19, extensive bond splitting at the bottom horizontal tension tie in
the web was experienced along the bot tom of the diagonal cracks. At ultimate load,
the re-entrant corner crack was reduceo to a width of 0.25 mm, while a maximum crack
width of 0.50 mm was measured at midspan.
The failure of the specimen D-2S was triggered by the yielding of the MW 18.7
welded wire fabric. The substantial bond splitting cracks were deve\oped from the
diagonal shear cracks, and occurred along the lapping length of the bottom tension
tie and the two No. 15 bars that were utilized as additional fiexural reinforcement
at midspan. The failure observed in specimen D-2S was far Jess brittle than that of
specimen D-IS, which indicated that the concentric arrangement of the sheets ofwelded
wire fabric provided a beHer post-cracking response, and thus irnproved ductility.
The behaviour of the specimen under service load was quite similar to the other
61
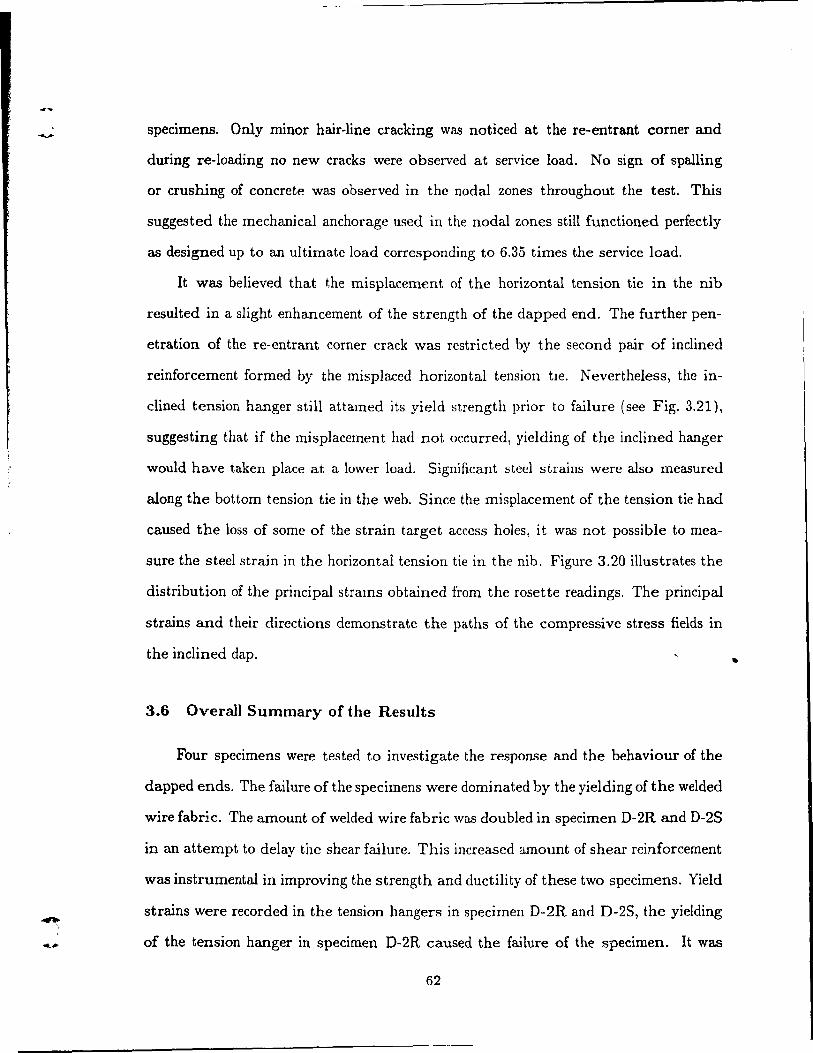
-
specimens. Only minor hair~line cracking was noticed at the re-entrant corner and
during re~loading no new cracks were observed at service load. No sign of spalling
or crushing of concrete was observed in the nodal zones throughout the test. This
suggested the mechanical anchorage used in the nodal zones still functioned perfectly
as designed up to an ultimate load corresponding to 6.35 times the service load.
It was believed that t,he misplacement of the horizontal tension tie in the nib
resulted in a slight enhancernent of the strength of the dapped end. The further pen
etration of the re~entrant corner crack was restricted by the second pair of inclined
reinforcernent formed by the misplaced horizontal tension tIe. Nevertheless, the in
clined tension hanger still attamed its yield strength prior to failure (see Fig. 3.21),
suggesting that if the rnisplacernent had not occurred, yielding of the inclined hanger
would have taken place at a lower load. Significant steel strains were aiso measured
along the bottom tension tie in the web. Since the misplacement of the tension tie had
caused the 10ss of sorne of the strain target access hales, i t was not possible ta rnea
sure the steel strain in the horizontal tension tie in the nib. Figure 3.20 illustrates the
distribution of the principal strams obtained from the rosette readings. The principal
strains and their directions demonstrate the paths of the compressive stress fields in
the inclined dap.
3.6 Overall Summary of the Results
Four specimens were tested to investigate the response and the behaviour of the
dapped ends. The failure of the specimens were dominated by the yielding of the welded
wire fabric. The amount of welded wire fabric was doubled in specimen D-2R and D-2S
in an attempt to delay the shear failure. This increased amount of shear rein forcement
was instrumental in improving the strength and ductility of these two specimens. Yield
strains were recorded in the tension hangers in specimen D-2R and D-2S, the yielding
of the tension hanger in specimen D-2R caused the failure of the specimen. It was
62
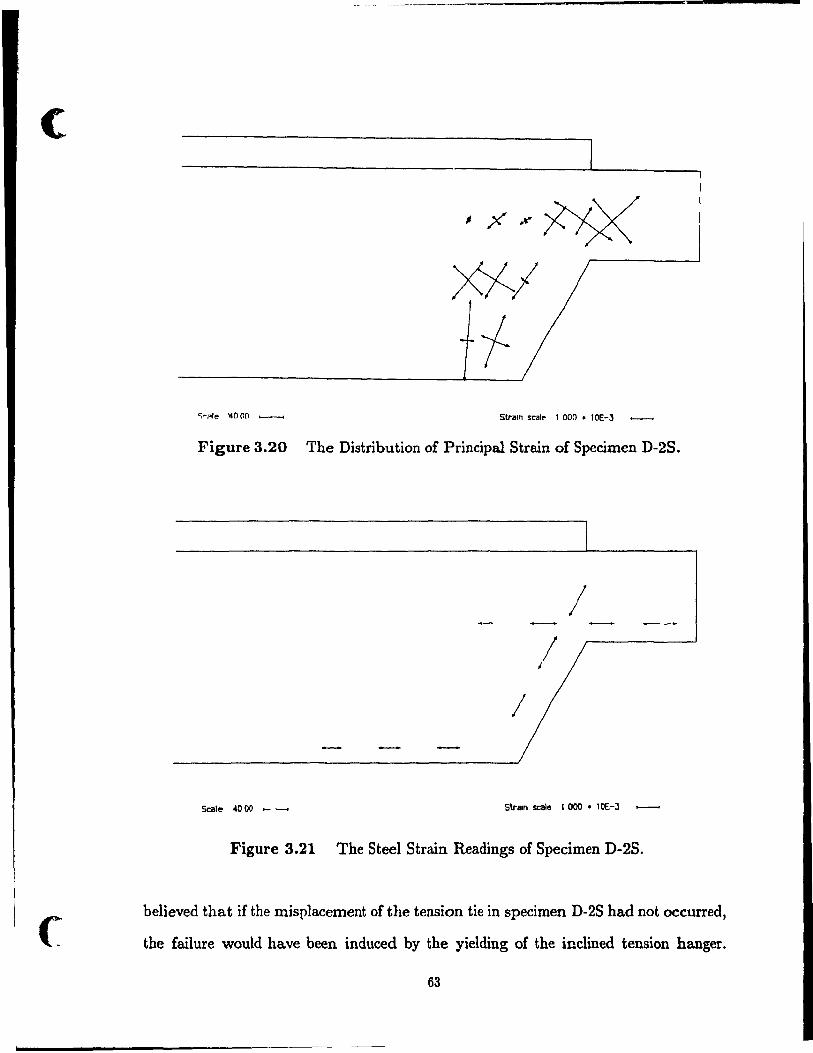
c
(
S-"I" 14000 >---< Slraln scal.. 1 000 • 10E-J ______
Figure 3.20 The Distribution of Principal Strain of Specimen D-2S.
/
Scate .000 ............ Slraln scate 1 000 • lOE-J ......--.
Figure 3.21 The Steel Strain Readings of Specimen D-2S.
believed that if the misplacement of the tension tie in specimen D-2S had not occurred,
the failure would have been induced by the yielding of the inclined tension hanger.
63
n, - li } . . ' ..
The failure of specimen D-IR 8J'd D-lS demonstratp.d the necessity of modeling allof
the components in the member, which required extending the "strut-and-tie" model to
cover the entire specimen.
The reinforcement schemes developed proved to he suitahle in reinforcing both
rectangular and inclined dapped ends. The reinforcing cages used in the test speci
mens were simple and effective, as can be seen in the tests. The performance of the
dapped ends under service load was satisfadory, since only minor ha.ir-Hne cracks were
observed at the re-entrant corners. Cracks appearing at the re-entrant corners were
well-controlled by the presence of the inclined and vertical tension hangers.
Due to the steep inclination of the compressive strut in the nib of the inclined
dapped ends, lower stress levels were found in these compressive struts. The lower
stress levels in the inclined reinforcement implied that the inclined reinforcement was
more efficient than the vertical reinforcement in rectangular dapped endo.
The lower two prestressing strands provided adequate control of secondary cracking
in the full-depth portion of the beam, and were believed to have taken a higher share
of load in the dapped end than originally expeded. Moreover, the nodal zones in
the specimens were well-confined by the mechanical anchorages. VVlth the mechanical
anchorages, the tension hangers in specimen D-2R and D-2S were able to develop the
yield strength. The presence of the bearing angle in the nib also enabled the yielding
of the horizontal tension tie in specÏInen D-2R.
To obtain a better understanding of the behaviour of the test specimens, the "strut
and-tie" model and the computer program FIELDS were used to analyze the specimens.
The results of the analyses are presented in Chapters 4 and 5, and the comparisons of the
predicted and the experimental response of each specimen are describcd in Chapter 6.
64

{
CHAPTER 4
Strut-and-Tie Models
4.1 Introduction
Traditional sectional design based on the Bernoulli-Hypothesis of plane sections,
can only be used in the design of reinforced con crete regions that are not aHected
by disturbances such as geometric discontimllties or concentrated loads or reactions.
However, because of the complexity of disturbed regions, the strains are highly non
linearj therefore, it is not appropriate to use the plane sections design approach for these
regions. Although the complete response of a member can be obtained using a non
linear fini te element program, it is too time consuming for everyday design purposes.
The time required and the complexity of the design are greatly reduced by analyzing
the member using simple "strut-and-tie" models.
The "strut-and-tie" mode! is an idealization of reinforced concrete at the ultimate
stage, in which principal compressive stresses and tensile reinforcement are represented
by compressive st ruts and tension ties, respectively. In reality, tensile foreen are earried
by concrete and tensile reinforcement, but after cracking, tensile stresses in the con crete
are usually neglected.
Both struts and ties are assumed to possess finite dimensions and are joined to
gether by "nodal zones". The deviations of the internaI forces are assumed to be
concentrated in the nodal zones, and the compressive stresses are approximated using
65
straight struts. The width of a strut is governed by the dimensions of the associated
nodal zone. The compressive strength of the concrete in compressive struts and within
nodal zones is influenced by a ntunber of parameters, such as the multi-axial state of
stress, disturbances from cracks, and amount of lateral confinement.
In general, transverse compressions will enhance the strength of compressive st ruts
and nodal zones. On the other hand, transverse tension can reduce the compressive
strength of con crete and will cause the concrete to fail at a considerably lower stress
than that obtained from a standard cylinder compression test. The Canadian Con crete
Code18 includes an equation to predict the compressive strength of concrete under
the influence of transverse tcnslle strains. In addition, the following stress limits are
assigned to nodal zones:
(a) O.85<pc!~ in nodal zones bounded by compressive struts and bearing areas.
(b) o. 75<Pcf~ in nodal zones anchoring only one tension tie.
(c) O.60<Pcf~ in nodal zones anchoring tension ties in morc than one direction.
Nodal zones, which are defined as the locations where the abrupt change of internaI
forces occur, are assumed to have fini te dimensions. Tension ties are anchored in nodal
zones and therefore the details of anchorage of the ties influence the nodal zone stresses.
The dimensions of a compressive strut must match the dimensions of the face of the
nodal zone at the intersection of the strut and the nodal zone. Renee. the stress of ~he
compressive struts can be found, if it is assumed that there are no shear stresses on the
face of the nodal zones, then from equilibrium the stress on the faces must be equai
(i.e. "hydrostatic" state). The actual procedure of chccking the stresses in the struts
and nodal zones is given in Section 4.4.
66

(
)
•
4.2 General Development Procedure for "Strut-and-tie" Model
Disturbed regions are highly sensitive ta the geometry, reinforcement details, and
loading conditions; therefore, it is necessary to model each disturbed region individually.
The designer traces out the approximate paths of the internaI forces by identifying the
patterns of the flow of compressive stresses, The usual patterns of compressive stress
flow include uniform compressive fields, fans, arches, and concentrated struts. The
compressive fields and fans are then replaced by (l single strut, or a series of struts,
that cOIllcide \Vith the orientation of the stress fields. However, the designer should also
consider the practicality of the reinforcement details, e g" orthogonal reinforcement
is more preferable than oblique reinforcement. The compressive struts are usually
located at the centreline of the compressive fields or fans, Sometimes, more than one
compressive strut is reqUlred to represent a comphcated compressive field to provide a
better modei of the flow of internaI forces,
The npxt step is to add in the extra struts and ties required to maintain equilibrium
of forces, and the nature and dimensions of nodal zones are determined after aU struts
and ties are identified, The "strut-and-tie" model is then further simplified into a truss
model, in which struts and tics are replaced by truss members and nodal zones are
modeled by pin-jomted llodes of the truss, The applied load is then assumed to be
coUected at each corresponding truss Joint. Having determmed the external forces, a
lower-bound solution of the internal forces can be obtained [rom the truss model by
statics,
In developing the model, it is helpful to consider the fact that loads trend to travel
in the stiffest direction path in order to consume a minimum amount of energy, hence
one can optimlze a model by selectmg the "strut-and-tie" action that requires the least
energy, As suggested by Schlaich et a1 17 , based on the principle of mmimum strain
energy, the following expression can be applied to optimize the "strut-and-tie" model:
67

E F,l,Erni = Strain Energy
where FI = force in strut or tie i
li = length of the member i
f m , = mean strain of member ~
(4.1)
In general, the strain in the concrete struts is very small, 50 the contribution of
the strut to the strain energy can be omitted in rnost cases.
4.3 "Strut-and-Tie" Models for Dapped Ends
As different reinforcement details are used in the rectangular and the inclined
dapped ends, 50 two different "strut-and-tie" rnodels are developed. For the cases
considered, it is assumed that the applied load is uniforrnly distributed. In addition,
sinee the prestrcssing strands in the dapped ends are not fully developed, they are not
included in the mode!. The procedure for developing the "strut-and-tie" model for a
rectangular dapped end is discussed below.
As illustrated in Fig. 4.1, the primary compressive stress fields are sketched for the
beam with a rectangular dapped end. As can be seen, the applied load is first collected
by the uniform field of diagonal compressive stresses along the beam, and then carried
into the bot tom corner of the full-depth portion of the dapped end by the fan-shaped
zone of compressive stresses. A set of tension hangers are used to lift the load up to the
top of the web. The load is then delivered into the support via the inclined compressive
strut in the nib.
In order to balance the outward thrust created by the fan-shaped zone of compres-
sive stresses, tension ties are needed at the bot tom of the vertical tension hanger. In the
bottom of the nib a horizontal tension tie is provided to equilibrate the outward thrust
of the compressive strut in the nib and also to carry any tensions applied through the
68
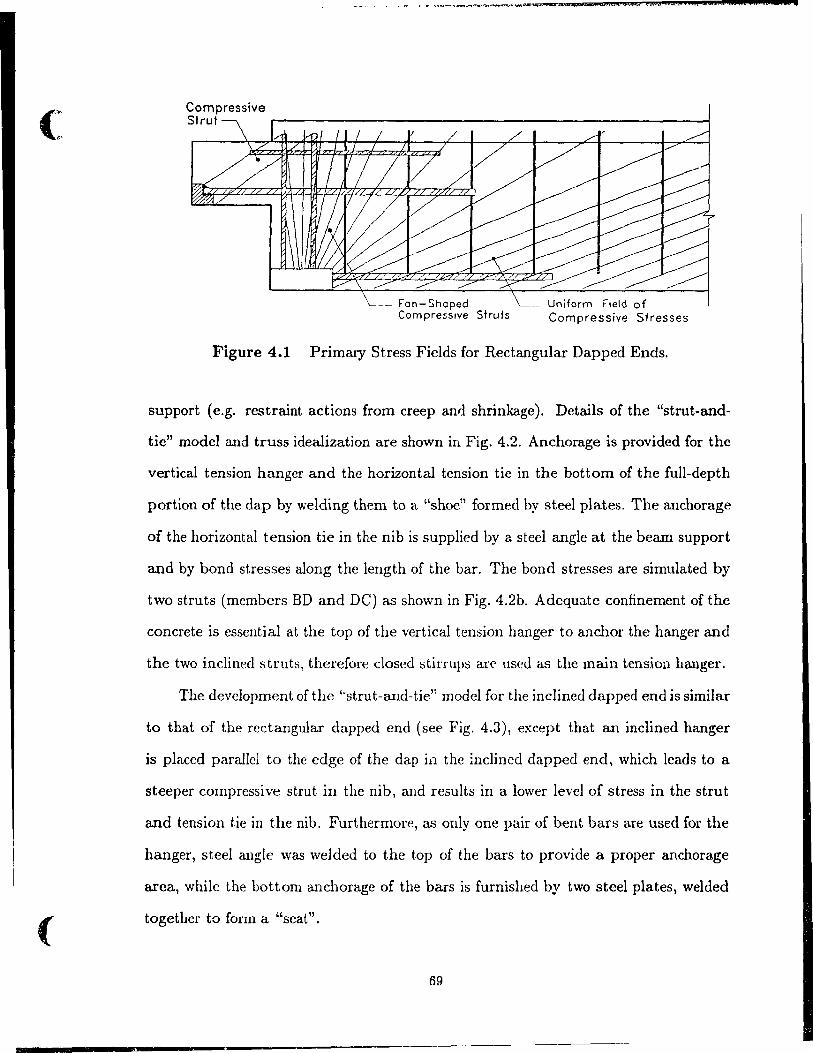
( '"
E'
(
Compressive Strut r-------------------------------------------------~
- Fan-Shaped Compressive Struts
./
Uniform Field of Compressive stresses
Figure 4.1 Primary Stress Fields for Rectangular Dapped Ends.
support (e.g. restraint actions from creep and shrinkage). Details of the "strut-and-
tie" model and truss idealization are shown in Fig. 4.2. Anchorage is provided for the
vertical tension hanger and the horizontal tension tie in the bottom of the full-depth
portion of the dap by welding them to a "shoe" formed by steel plates. The anchorage
of the horizontal tension tie in the nib is supplied by a steel angle at the beam support
and by bond stresses along the length of the bar. The bond stresses are simulated by
two struts (members BD and De) as shawn in Fig. 4.2b. Adequate confinement of the
concrete is esscntial at the top of the vertical tension hanger ta anchor the hanger and
the two inclined struts, therefore closed stirrups are used as the main tension hanger.
The devclopment of the "strut-and-tie" modcl for the inclined dapped end is similar
to that of the rcctangular dapped end (see Fig. 4.3), except that an inclinecl hanger
is placed parallel to the edge of the clap ill the inclined dapped end, which leads ta a
steeper compressive strut in the nib, and results in a lower level of stress in the strut
and tension tie in the nib. Furthermore, as only one pair of bent bars are used fol' the
hanger, steel angle was welded to the top of the bars ta provide a proper anchorage
area, while the bottorn anchorage of the bars is furnished by two steel plates, welded
together to form a "seat".
69
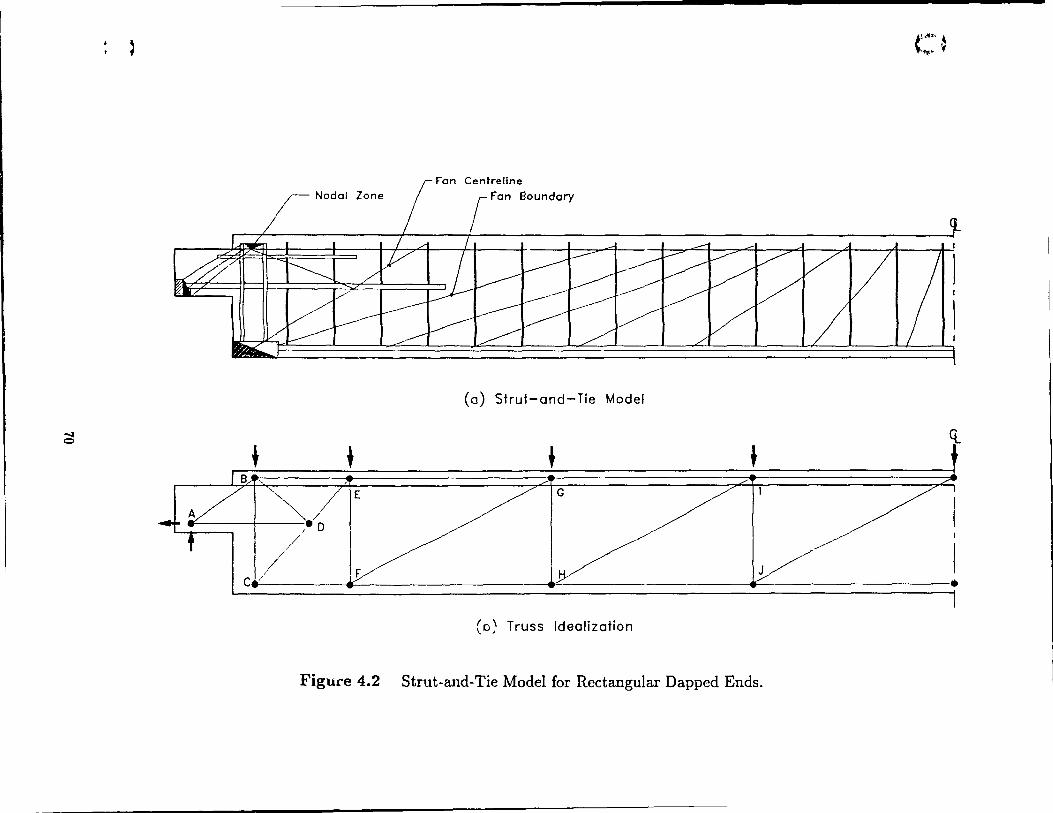
~ o
)
Fan
Nodal Zone Boundary
(0) Strut-and-Tie Model
+ + + + E G
.... ===--+--'\ / -./ , 0
// F
//
c'/ J
(0) Truss Idealization
Figure 4.2 Strut-and-Tie Model for Rectangular Dapped Ends.
;""%« ~ ~"". 'f
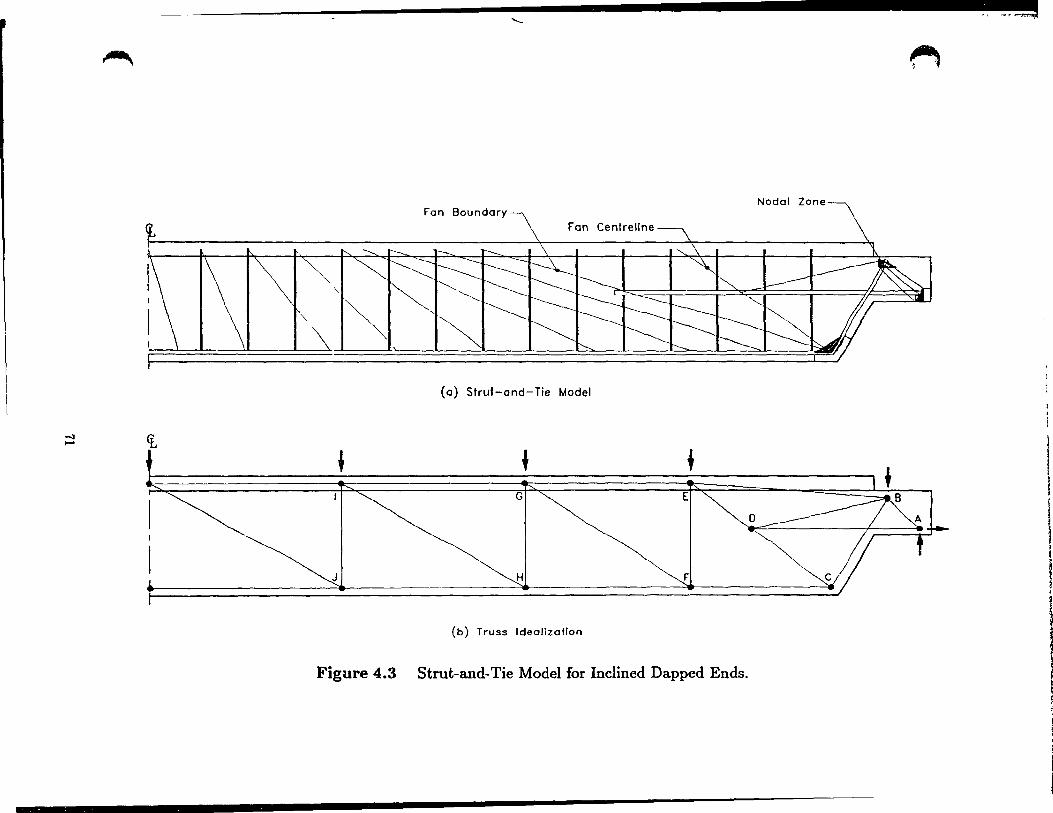
'-
~ ~ >,
Nodal Zone Fon Boundary
Fan Centreline
"""", 1 "
" ~~
~~ '",-
(a) Strut-ond-Tie Model
-l CL
1
..-
+ + + GI ""- El '" ~\J
1 ,
0
1 , i
JI ~HI ~FI ""-C / 1 t ! ,
(b) Truss Idealization
,
Figure 4.3 Strut-and-Tie Model for Inclined Dapped Ends.
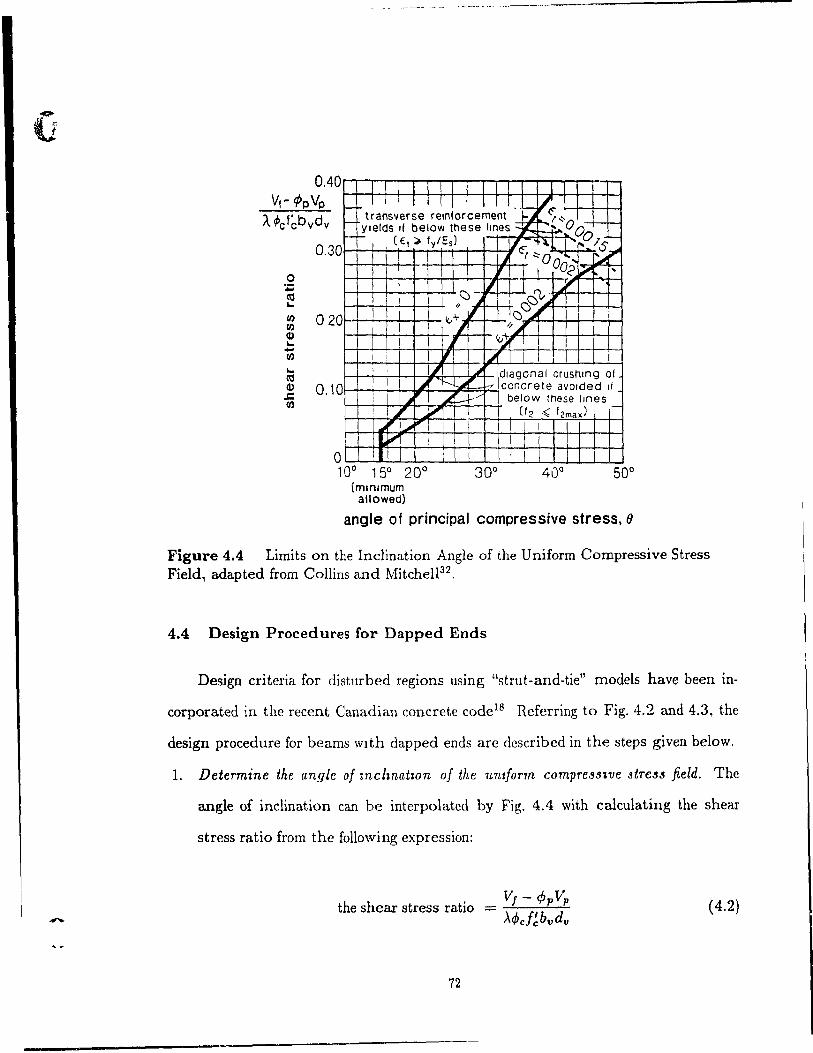
-
--- ----- ---- -----------------------
DAO Vf - CPpVp
À.pcf~bvdv
o :;: (Il ...
0.30
If) 020 If) (1) ... .... en ... (Il
~ 0.10 en
T 1
l- I 1 1 1 1 1 1 1 1 1 1--1-~ 1-
transverse retnforcement J:i., ..... ~ ~ ,,--+-_ ylelds If below these Imes .. 0 CI,
1-'-1 (é,:)fy/Es) Z \.l .. '?7S-
1 J ~:::OO· ...... :/ , 1 1 02~ ,
l 1 ~
1j\J J. ~C(,~ 1 4:,,+ ., I\:)G./
'- ' ~~
4:"X 1
1 '1 1,,;( i !~ i,.l diagonal crushmg of
./h..L concrete avolded If
1 ~ .L-v' beJow tl1ese Ilnes 1
1 V (12 -< t2ma~) -1
~ ~ J' tr
1 1 1 1
L ~ 1
1 1
(minimum allowed)
angle of principal compressive stress, 0
Figure 4.4 Limits on the Inclination Angle of the Uniform Compressive Stress Field, adapted from Collins and Mitche1l32 .
4.4 Design Proced ures for Dapped Ends
Design criteria for disturbed regions using "strut-and-tie" models have been in
corporated in the recent Canadian concrete code1S Rcferring to Fig. 4.2 and 4.3, the
design procedure for beams wIth dapped ends are dcscribed in the steps given below.
1. Determine the angle of znclwatwn of the 1Lmform compre3S1ve stre.!!.!! field. The
angle of inclination cau be interpolatcd by Fig. 4.4 with calculating the shear
stress ratio From the following expression:
V, - fjJpVp the shear stress ratio -
).<pc!~bvdv
72
( 4.2)
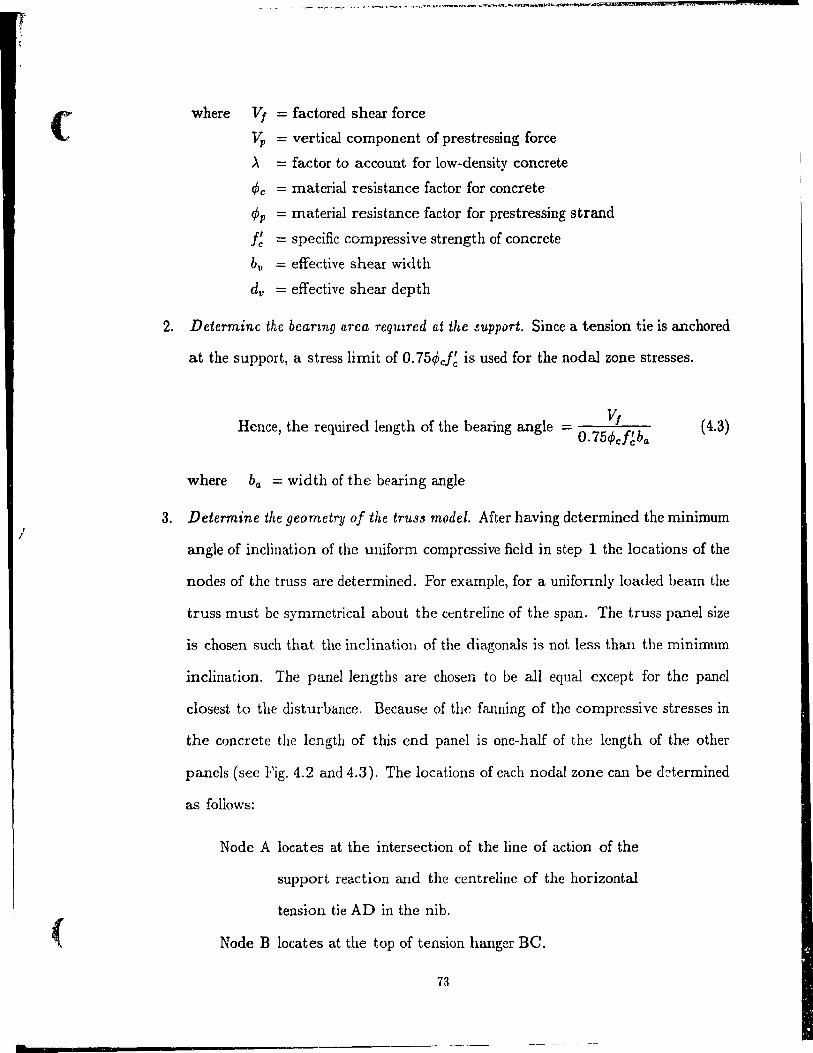
(
)
(
.
where V,
Vp À
ifJc ifJp
f~ bt>
dv
= factored shear force
= vertical component of prestressing force
= factor ta account for low-density concrete
= material resistance factor for concrete
= material resistance factor for prestressing strand
= specifie compressive strength of concrete
= effective shear width
= effective shear depth
2. Determine the bearmg are a reqmred at the support. Sinee a tension tie is anchored
at the support, a stress limit of O. 754>cf~ is used for the nodal zone stresses.
V, Renee, the required length of the bearing angle == __ .t.-_
O. 75<Pcf~ba
where ba = width of the bearing angle
(4.3)
3. Determine the geomctry of the tru3S model. After having determined the minimum
angle of inclination of the uniform compressive field in step 1 the locations of the
nodes of the truss are determined. For example, for a uniformly loaded beam the
truss must be symmctrical about the centreline of the span. The truss panel size
is chosen sueh that the inclinatioll of the diagonals is not less than the minimum
inclination. The panel lengths are chas en ta be all equal except for the panel
closest to the disturbance. Because of the fanning of the compressive stresses in
the concrete the length of this end panel is one-half of the lcngth of the other
panels (see Fig. 4.2 and 4.3). The locations of eaeh nodal zone can be ddermined
as follows:
Node A locates at the intersection of the li ne of action of the
support reaction and the centreline of the horizontal
tension tie AD in the nib.
Node B locates at the top of tension hanger Be.
73
; \ 1 .......
Node C locates at the intersection of the centreline of tension
hanger BC and the centreline of the bot tom horizontal
tension tie CF in the web.
Node D locates at the intersection of the centreline of strut CE
and the centreline of tension tie AD, which is also the
anchor point of Strut BD and tie AD.
Node E is located at half of the assumed length of the fan,
which is dv /{2 tan B) from the top of tension han~er
BC, so that strut CE can represent the fan-shaped zone
of compressive struts.
Node F is located directly below Node E so that tension tie
EF can represent the vertical reinforcement within the
length d v / tan () .
Node G is located at a length of dv / tan () from the top of the
tension hanger EF.
Node H is located directly below Node G so that tension hanger
CH can represent the vertical reinforcement within the
length d v / tan (j.
This procedure is repeated until the full truss idealization
is achieved.
Depending on the angle of inclination of the compressive stresses and the span length
of the beam, the number of tension hangers in the region of the uniform compressive
field may vary.
4. Determine mternai forces ln the tru~~s model by "tatics. Equivalent nodal loads
are determined at the top nodes of the truss based on the tributary area for each
node.
5. Determine the amount of tie reinforcement reqmred.
74
(
/
(
•
the required amount of tie reinforcement,
where Fa = force in the tensile memher i
<P! = material resistance factor for reinforcement
fy = yicld strength of reinforcement
6. Check stress limlt at cntical nodal zones.
(4.4)
Node A- In addition to the hearing length selected in step 2, the bearing angle should
also provide adequate depth to the nodal zone in order not to exceed the stress limit
the required depth of the hearing angle - O.75~:f~ba (4.5)
where Hf is the net horizontal force at the support (the horizontal component of strut
AB).
Node B- Since spalling may occur at this node, then only the concrete confined by the
tension hanger BC is considered. The O. 75<Pcf~ stress limit is used because one tension
tie is anchored by t.he node.
the required width of no de B perpendicular to tie BC - O. 7:~c~~bb (4.6)
where FeB = force round in tension hanger CB
bb = width of the concrete confined at node B
Node C- As two tension tics are anchored at this nodal zone, 50 a stress limit of
O.60<pc!~ applies to this case. Thus the horizontal projection of the area of node C must
he capable of transmitting vertical component in the strut CD. Similarly the vertical
projection area of node C must he capable of transmitting the horizontal component
of strut CD.
75
-h . d 'd h f d C d' 1 . BC FeB sin6j t e reqU1re WI t 0 no e perpen lCU ar to tIe = 0 6 f' b
. O<Pc c c
h . h ., F CF - Fe B cos BI t e reqUlred dept of node C perpendlcular to tIe CF = O.60<Pcf~bc
where FCF = force found in tension tie CF
bc = width of the con crete confined at node C
BI = inclination of the dap
(4.7)
(4.8)
7. Check the stress llmit in compressIve struts. Further checking for the struts in
the compressive stress field is not necessary, as the struts are ensured to be under
the stress limit when a ~)roper angle of inclination is chosen in step 1. It is not
required to to check the stress of strut CD-DE as it represents a fan-shaped zone
of radiating stru ts and 3.S the nodal stresses at node C (at the base of the fan)
have been checked in step 6. It is essential ta check the ::.tress limit of the struts
connected to Node B. By assuming a "hydrostatic state" of stress in node B, the
width of strut AB at node B can be determined as follows:
the width of strut, AB at node B WAB = F FAB Vi lb BC + b
where FAB = force found in strut AB
Vb = external load on node B
lb = width of the nade B
the stress in strut AB
76
(4.9)
(4.10)
(
_ ~ ___ -.........-.~,~_~ ___ .... ___ ". _____ ... I!ïIWll ___ ... _ ...... @$ ... • " ............ = ....... _-.. =
where b6 = width of the concrete confined at node B
The compressive strength of strut AB is reduced by the presence of tension hanger
CB. In order to consider the effect of tension hanger BC, the average tensile strain in
tension hanger CB has to be estimated by the following equation.
(4.11)
where FeB = force found in tension hanger CB
A"CB = actual amount of reinforcement provided by tension hanger CB
E" = modulus of elasticity of reinforcernent
The strain fI perpendicular to the strut AB cau be found from compatibility of
strains as:
€" + 0.002 €I = €" + 2
tan a" ( 4.12)
where a" is the angle between the strut AB and the tension hanger CB.
The compressive strength of strut AB, accounting for the influence of the tensile
strain perpendicular to the strut is:
f )..4>cf~ J2max = 0.8 + 170€1 ( 4.13)
where ).. i8 the reduction factor for lightweight concrete.
The stress, h, in the strut rnabt be less than hmru:.
The other compressive st ruts joining at Node B will have the same compressive
stress at node B due to the "hydrostatie stress" condition, but have smaller values of
tensile strain, el. Renee these struts will not control the design of node B.
77
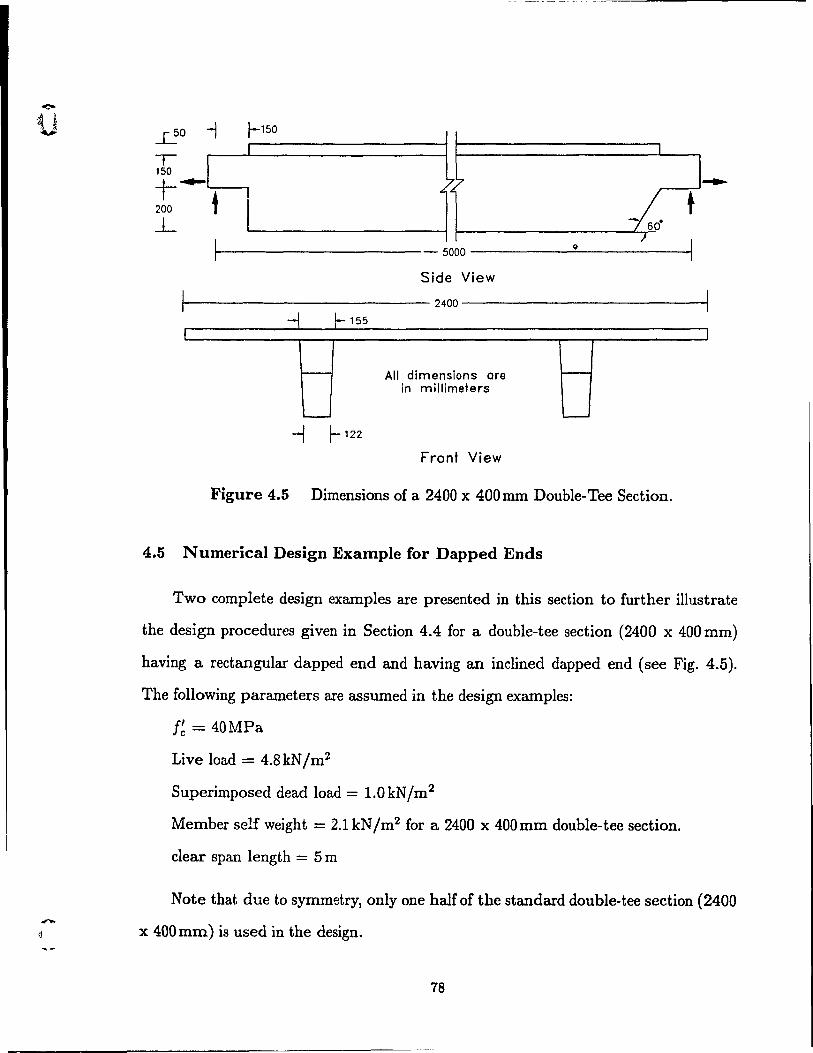
~o -J T
1 150 t-.... 200 t l
1·
1-150
1
-1 1- 155
'-----'
-1 1- 122
1
~
la· , - 5000
0
Side View
2400
Ali dimensions ore -in millimeters
Front View
Figure 4.5 Dimensions of a 2400 x 400 mm Double-Tee Section.
4.5 N umerical Design Example for Dapped Ends
Î t
·1
1
Two complete design examples are presented in this section to further illustrate
the design procedures given in Section 4.4 for a double-tee section (2400 x 400 mm)
having a rectangular dapped end and having an inclined dapped end (see Fig. 4.5).
The following parameters are assumed in the design examples:
f~ = 40MPa
Live load = 4.8 kN 1m2
Superimposed dead load = 1.0kN/m2
Member self weight = 2.1kN/m2 for a 2400 x 400 mm double-tee section.
clear span length = 5 ID
Note that due to symmetry, only one half of the standard double-tee section (2400
x 400 mm) is used in the design.
78
-li
n
4.5.1 Design example for rectangular dapped ends
Factored load, W/ = [1.25 x (2.1 + 1.0)+1.5x4.8]x2.4xO.5
= 13.3 kN lm/web
1. Determine the inclination angle of the 'Uniform compre""ive field.
The minimum web width, bv, is 120mm, the effective shear depth, dt" can be taken
as O.9d, and the effective depth, d, can be assumed as O.Bh for a prestressed member.
the shear stress ratio in the full-depth portion = ~~ -:,/~c ~P 'fIcJ c v v
13.3x5x 103 xO.5 - 1xO.6x40x 120xO.72x400
= 0.040
From Fig. 4.4, using €x = 0.002 the angle of 18.50 is chosen. Since the shear
stress in the full-depth portion of the beam is relatively low, spalling does not occur,
so the assumption of bu = 120 mm is correct.
2. Determine the bearing area req'Uired at the "'l.I.pport. Assuming the length of the
angle is 140 mm, then from Eq. 4.3,
Vi the required width of the bearing angle - --~-O.7D4>cf~ba
13.3x5x103 xO.5 - 0.75 xO.6x40x 140
= 13.2 mm
Provide a 50 x 50mm steel angle made from 19mm thick plates. Note that this
thickness provides about 20 mm cover for the horizontal tension tie as required in CPCI
Metric Design Manual23 •
79
c.
(
3. Determine the geometry of the tru88 model. In order to determine the geometry of
the truss, it is assumed that No. 10 closed stirrups spaced at 60 mm are used for
the main tension hanger, and No. 10 reinforcing bars are used for the horizontal
tension ties. A clear cover of 20 mm will be provided. The truss model is shown
in Fig. 4.6.
4. Determine internai force8 in the tru88 model by ~tatic8. The internai forces found
are summarized in F;g. 4.6.
5. Determine the amount of reinforcement required.
From Eq. 4.4,
Tension hanger CB, 46.9 x 10³
2
A" = O.85x400 = 138mm
Use two #3 or two No. 10 closed stirrups for the tension hanger
Tension 'rie AD, A = 52.1 x 103 = 153m 2
/J O.85x400 m
Use two No. 10 bars (extended 1.7 Id beyond Node D)
In the design of tension tie CF only the normal reinforcing bars at this location
are assumed to carry the load, sinee the prestressing strands are not fully developed.
Tension Tie CF, A = 61.8 x 103
= 182 2 /J 0.85x400 mm
Use two No. 10 bars (extended 1.7 Id beyond the point that the prestressing strands
develop their full strength)
As the shear reinforcement in the web will be provided in the form of welded wire
fabric, the force in member EF will govern the design. Hence
A = 17.8x103 = 52 2
"O.85x400 mm
80
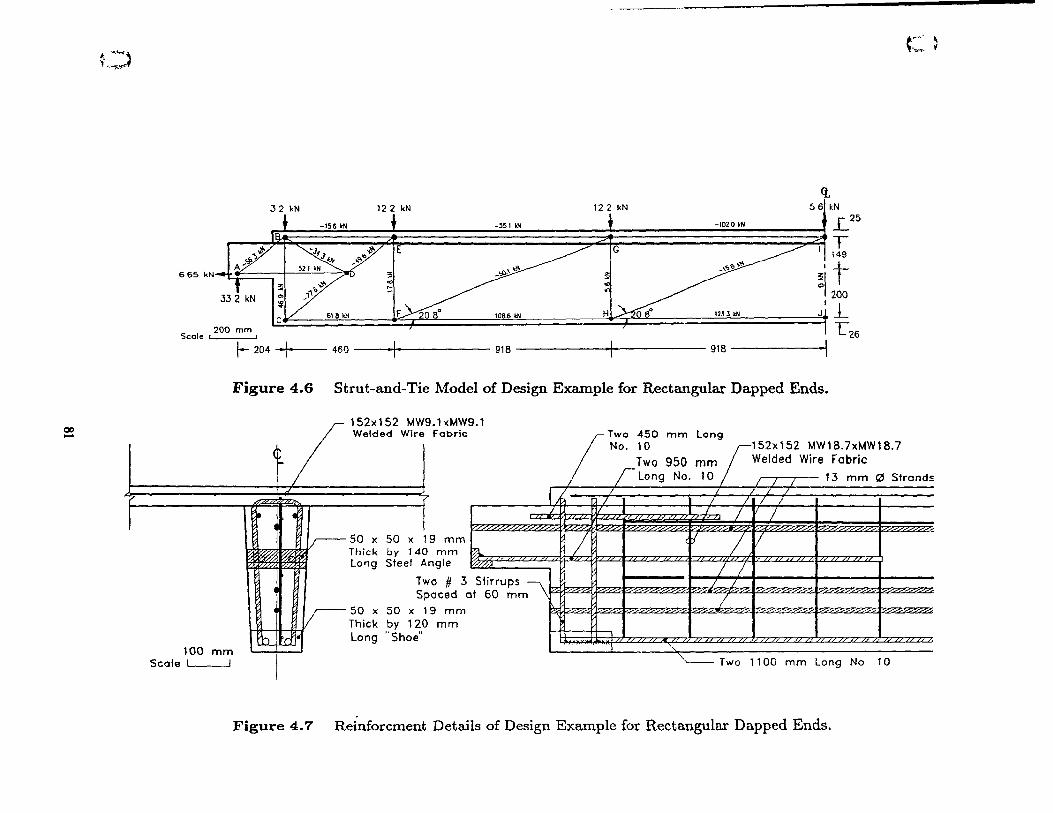
00 ....
l, --~ l __ .",r-
CL 32 kN 122 kN 122 kN 56* kN
-551 IN t -1020kN L 25
T 11149
•• , _. :;:?D 665 kN-+f 1 I>~
:\" ~
'"
_'i>-~ "'\ ~ ~' t °1 200
~
C &18 kN
200 mm Scole 1
108.6 IN H,L...?;1O Il l1J J kN J~ L LZ6
f- 204 460 ----t------- 918 ·1 918 .\
Figure 4.6 Strut-and-Tie Model of Design Example for Rectangular Dapped Ends.
100 mm Seote 1 1
152x 152 MW9.1 xMW9.1 F'abrÎc
(. / • t
• ;----50 x 50 x 1 Thick by 140 Lo"g Steel A
Tv. S~ V-50 x 50 x 1
Thick by 120
tL :d. Long "Shoe"
9 mm mm
ngle ~
0#3 oeed 0
9 mm mm
S1irrups n\ 60 mm
(~WO
/
/
450 mm Long 10
j
/
/
/ / /
J L 1
"
152x152 MW18.7xMWI8.7
/ 1
/ /
L V
Two 110 m Long
Figure 4.7 Reinforcment Details of Design Example for Rectangular Dapped Ends.
,--' 11 ,.'";" 1
<:
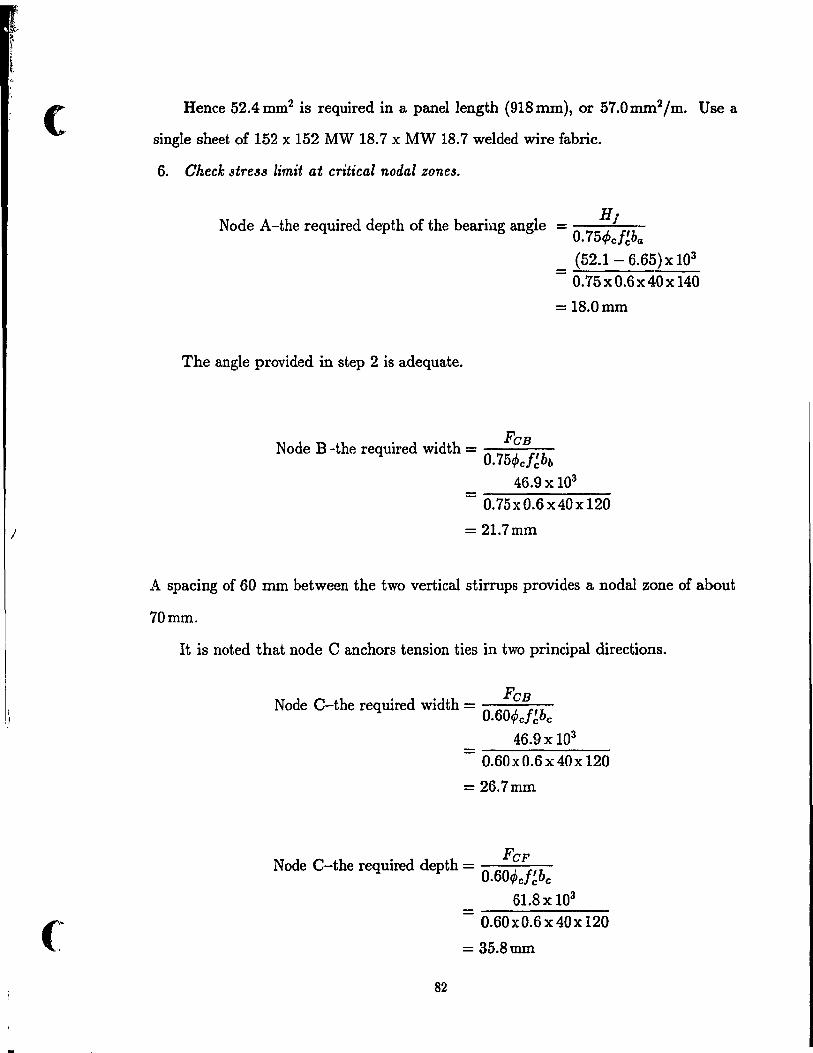
(
J
(
Henee 52.4mm2 is required in a panellength (918mm), or 57.0mm2jm. Use a
single sheet of 152 x 152 MW 18.7 x MW 18.7 welded wire fabric.
6. Check stress limit at critical nodal zones.
Node A-the required depth of the bearÏ11g angle _ Hf O. 754>cf~ba (52.1 - 6.65) x 103
- 0.75xO.6x40x 140
= 18.0 mm
The angle provided in step 2 is adequate.
Node B -the required width = O. 7:~~~bb 46.9x 10³
--------0.75xO.6x40x120
= 21.7mm
A spacing of 60 mm between the two vertical stirrups provides a nodal zone of about
70 mm.
It is noted that node C anchors tension ties in two principal directions.
Node C-the required width = 0.6:~c~~bc 46.9x 10³
--------0.60 x 0.6 x 40 x 120
= 26.7mm
Node C-the required depth = 0.6:~J~bc 61.8x 10³
--------0.60 x 0.6 x 40 x 120
= 35.8mm
82
7. Check the "tre38 limit in compressive "tr1.t.t". Assuming a hydrostatic state of stress
at node B, then the width of the strut Ab at node B cl:ln be found from:
the stress in strut AB is
FAB wAB = lb
FBC+ Vb 56.3
- 46.9 + 3.2 x 70
= 78.7mm
h = FAB 'WABbb
56.3x10³
- 78.7x 155
=4.62MPa
the tensile strain in hanger CB,
- ------------------2x2 x72.2 x 0.85x 200 x 103
= 0.955 X 10⁻³
The strain El perpendicular to the strut AB is
f6 + 0.002 fI = E6 + 2 tan 0:6
= 9.41 X 10⁻⁴ 0.955 X 10⁻³ + 0.002
+ tan2 53.9°
= 0.00253
the maximum compressive strength in strut AB is
f: )..<Pc!~
2max = 0.8 + 170El 1.0xO.60x40 ---------
0.8 + 170 x 0.00253
= 19.5 MPa > h = 4.62 MPa
83
(
(
The reinforeement details are summarized in Fig. 4.7.
4.5.2 Design example for inclined dapped ends
Step 1 and 2 are same as the design example of rectangular dapped ends. The same
bearing angle, 50 x 50 x 19 mm, is used as the bearing angle.
3. Determine the geometry of the truss model. In order to determine the geometry
of the truss, it is assumed that the tension hanger is furnished by a pair of No. 10
bent bars, and No. 15 bars are used for the horizontal tension ties. A clear eover
of 20 mm will be provided. The truss model is shown in Fig. 4.8.
4. Determme internai forces in the truss model by statics. The internal forces found
are summarized in Fig. 4.8.
5. Determine the amount of reinforcement required.
Fi From Eq. 4.4, A" = 4>"fy
Tension hanger CB, A - 41.1 X 10³
_ 121 2 ,,- - mm O.85x400
Use two No. 10 bent bars for the inelined tension hanger.
Tension Tie AD, A :::: 39.8x 103
= 117m 2 "0.85x400 m
Use two No. 10 bars (extended 1.7 Id beyond Node D)
In the design of tension tie CF only the normal reinforcing bars at this location
are assumed to carry the load, sinee the prestressing st rands are not fully developed.
Tension Tie CF, A - 65.2x 10³
- 192 2 11- - mm
0.85x400
Use two No. 10 bars (extended 1.7 Id beyond the point that the prestressing st rands
developed their full strength)
84
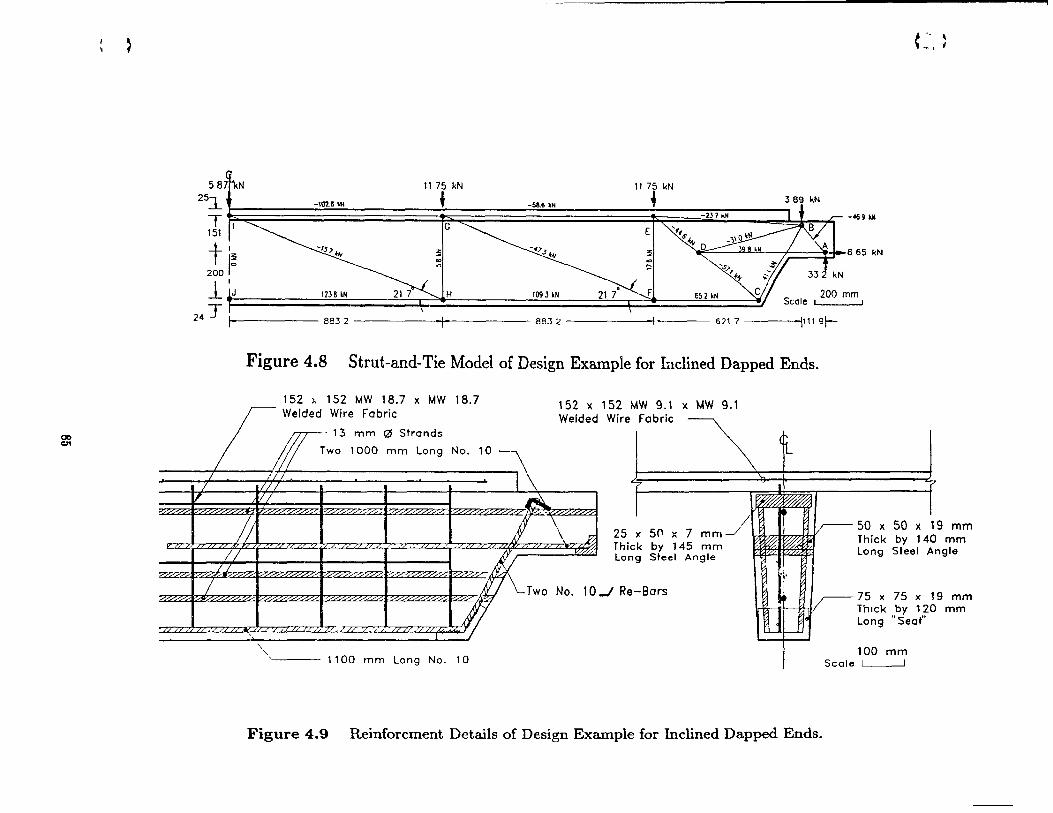
00 c:n
"")
587'hN 25l
TI 151 + '~ 2001°
1 tJ
24 T 1
/ /
"
1175 kN 1175 kN
+ ~ 389 kN -102! Id! -58.6 kN
+ -237kH ~ -469 jH
G E
~ ~I ~ J~ C !lrt )
( '~ "'-6 65 kN ., '" ~ ~
1236 kN 21i~H 1093 kN 21 7" ~ 652 kN ~/ 200 mm Seole L--------'
8832 1 883 L 1 6217 11119r-
Figure 4.8 Strut-and-Tie Madel of Design Example for Inclined Dapped Ends.
152 ), 152 MW 18.7 x MW 18.7
'/ / l \ (/ / '1 &
152 x '52 MW 9.1 x MW 9.1 Wire Fob .
"'\ ;/~
(k IL.
L',
7
/; ,T\ &! 25 Thi Lon
1
)l 50 x 7 mm J k by 145 mm
/ ~ ~
1~50 x 50 x 1 Thick by 14(
9 mm mm
ngle Il 77
7 ff:-rwo No. 10
Il
g Steel Angle Long Steel A
.\.
Bars ) 1~75 x 75 x 1
~ 1.1 Thlck by 12(
Long "Seot'"
...1 Re
100 mm Seale 1 1
\
",~-- 1100 mm Lang No. 10
Figure 4.9 Reinforcment Details of Design Example for lnclined Dapped Ends.
9 mm mm
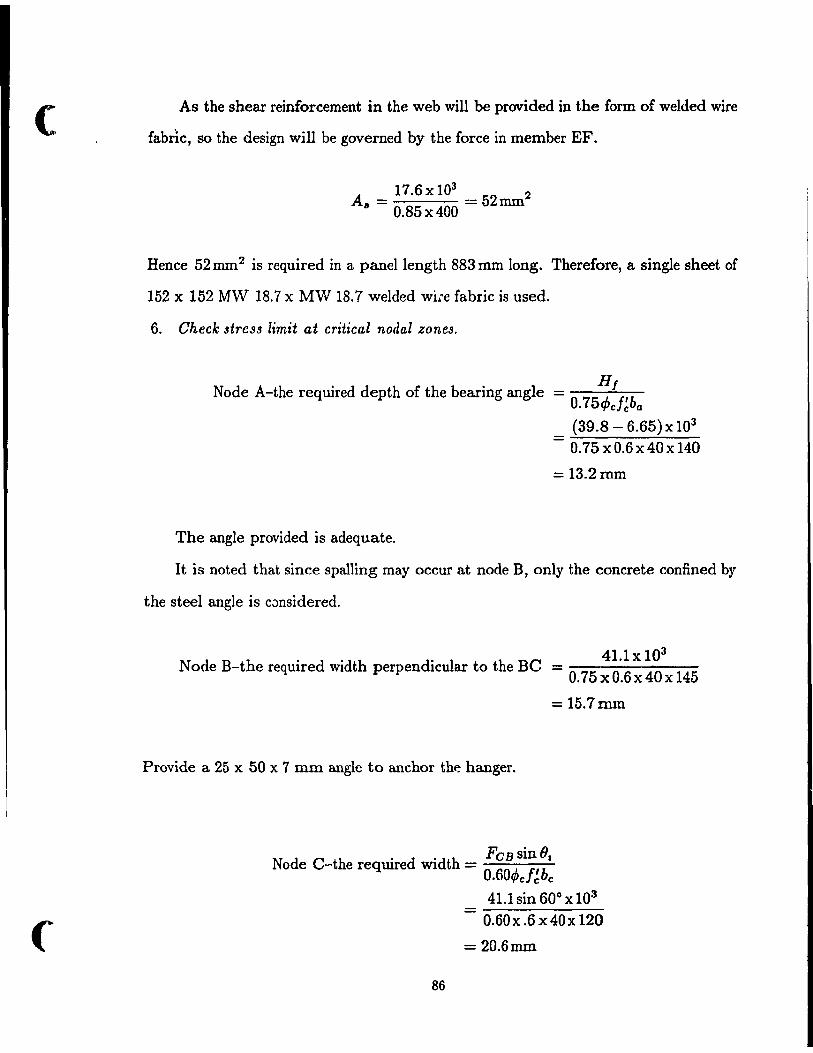
(
f
As the shear reinforcement in the web will be provided in the form of welded wire
fabrlc, so the design will be governed by the force in member EF.
A - 17.6x10³
-- 52 2 11 - 0.85x400 - mm
Rence 52 mm 2 is required in a panel length 883 mm long. Therefore, a single sheet of
152 x 152 MW 18.7 x MW 18.7 welded wi.e fabric is used.
6. Check stress limit at critical nodal zones.
HI Node A-the required depth of the bearing angle = --""'---O. 754>c!~ba (39.8 - 6.65) x 103
- 0.75 xO.6x40x140
= 13.2 mm
The angle provided is adequate.
It is noted that sinee spalling may oceur at node B, only the concrete eonfined by
the steel angle is c.Jnsidered.
41.1 X 10³
Node B-the required width perpendicular to the Be - 0.75xO.6x40x145
= 15.7mm
Provide a 25 x 50 x 7 mm angle to anchor the hanger.
. • FOB sin(}. Node C-the reqU1red wldth = 0.60~cf~bc
41.1 sin 60° x 103
-0.60x .6x40x 120
= 20.6mm
86
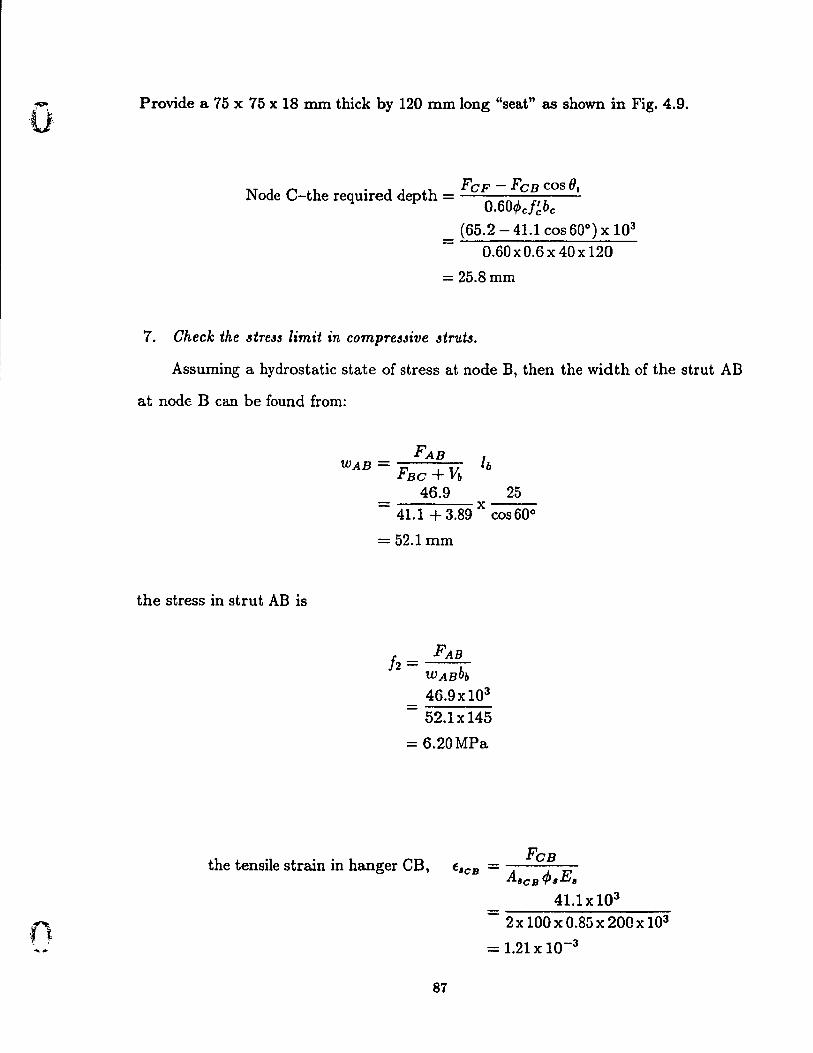
Provide a 75 x 15 x 18 mm thick by 120 mm long "seat" as shown in Fig. 4.9.
. FeF - FeR cos 01
Node C-the reqUlred depth = 0.60c/>cf~bc
(65.2 - 41.1 cos 60°) x 103
-- 0.60 x 0.6 x 40 x 120
= 25.8 mm
1. Check the "tress limit in compressive struts.
Assuming a hydrostatic state of stress at node B, then the width of the strut AB
at node B cau be found from:
the stress in strut AB is
FAR wAB = lb
FRe + Vb 46.9 25
= x 41.1 + 3.89 cos 60°
= 52.1 mm
12= FAB WARbb
46.9xl03
-52.lx 145
= 6.20MPa
the tensile strain in hanger CB, FeB
EIJCB =----AIJCB<PIIEIJ
41.1 X 10³
-----------------~ 2x 100xO.85x200x 103
= 1.21 X 10⁻³
87
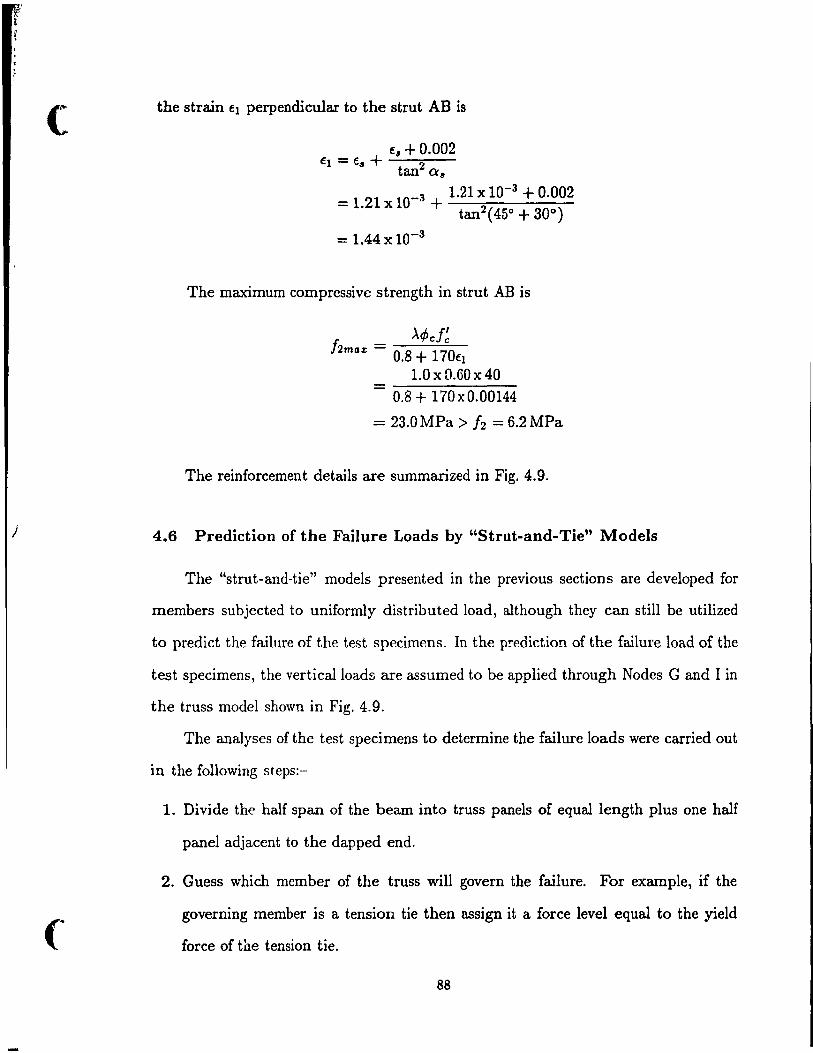
f
(
J
(
the strain fI perpendicular to the strut AB is
f, + 0.002 fI = fa + 2
tan a,
= 1.21 x 10⁻³ 1.21 X 10⁻³ + 0.002
+ tan2 ( 45° + 30°)
= 1.44 x 10⁻³
The maximum compressive strength in strut AB is
f: >'<Pc1~ 2ma% = 0.8 + 170fl
1.0 x 0.60 x 40 - --------------
0.8 + 170xO.00144
= 23.0 MPa > 12 = 6.2 MPa
The reinforcement details are summarized in Fig. 4.9.
4.6 Prediction of the Failure Loads by "Strut-and-Tie" Models
The "strut-and-tie" models presented in the previous sections are developed for
members subjected to uniformly distributed load, although they can still be utilized
to predict the failure of the test specimens. In the prediction of the failure load of the
test specimens, the verticalloads are assumed to be applied through Nodes G and l in
the truss model shown in Fig. 4.9.
The analyses of the test specimens to determine the failure loads were carried out
in the following steps:-
1. Divide the half span of the bearn into truss panels of equal length plus one half
panel adjacent to the dapped end.
2. Guess which member of the truss will govern the failure. For example, if the
governing member is a tension tie then assign it a force level equal to the yield
force of the tension tie.
88
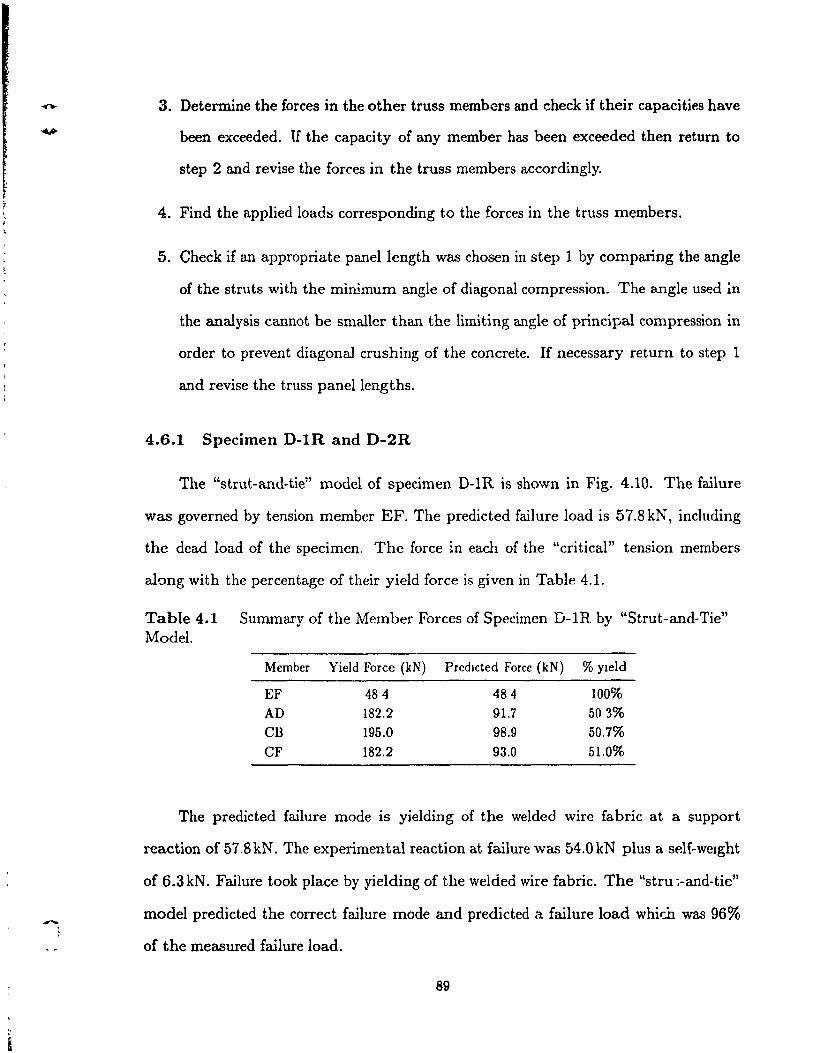
-
3. Determine the forces in the other truss membcrs and check if their capacities have
been exceeded. lf the capacity of any member has been exceeded then return to
step 2 and revise the forces in the truss members accordingly.
4. Find the applied load::; corresponding to the forces in the truss members.
5. Check if an appropriate panel length was chosen in step 1 by comparing the angle
of the struts with the minimum angle of diagonal compression. The angle used in
the analysis cannot be sm aller than the limiting angle of principal compression in
order to prevent diagonal crushing of the concrete. If necessary return to step 1
and revise the truss panellengths.
4.6.1 Specimen D-1R and D-2R
The "strut-and-tie" model of specimen D-1R is shown in Fig. 4.10. The failure
was governed by tension member EF. The predicted failure load is 57.8kN, including
the dead load of the specimen. The force in cach of the "critical" tension mcmbers
along with the percentage of their yield force is given in Table 4.1.
Table 4.1 Summary of the Member Forces of Specimen D-1R by "Strut-and-Tie" Model.
Member Yield Force (kN) Predlcted Force (kN) % yleld
EF 484 484 100%
AD 182.2 91.7 503%
CB 195.0 98.9 50.7%
CF 182.2 93.0 51.0%
The predicted failure mode is yielding of the welded wire fabric at a support
reaction of 57.8kN. The experimental reaction at failure was 54.0kN plus a self-welght
of 6.3 kN. Failure took place by yielding of t.he weldeà wire fabric. The "stru ~-and-tie"
model predicted the correct failure mode and predicted a failure load whici:t was 96%
of the measured failure load.
89
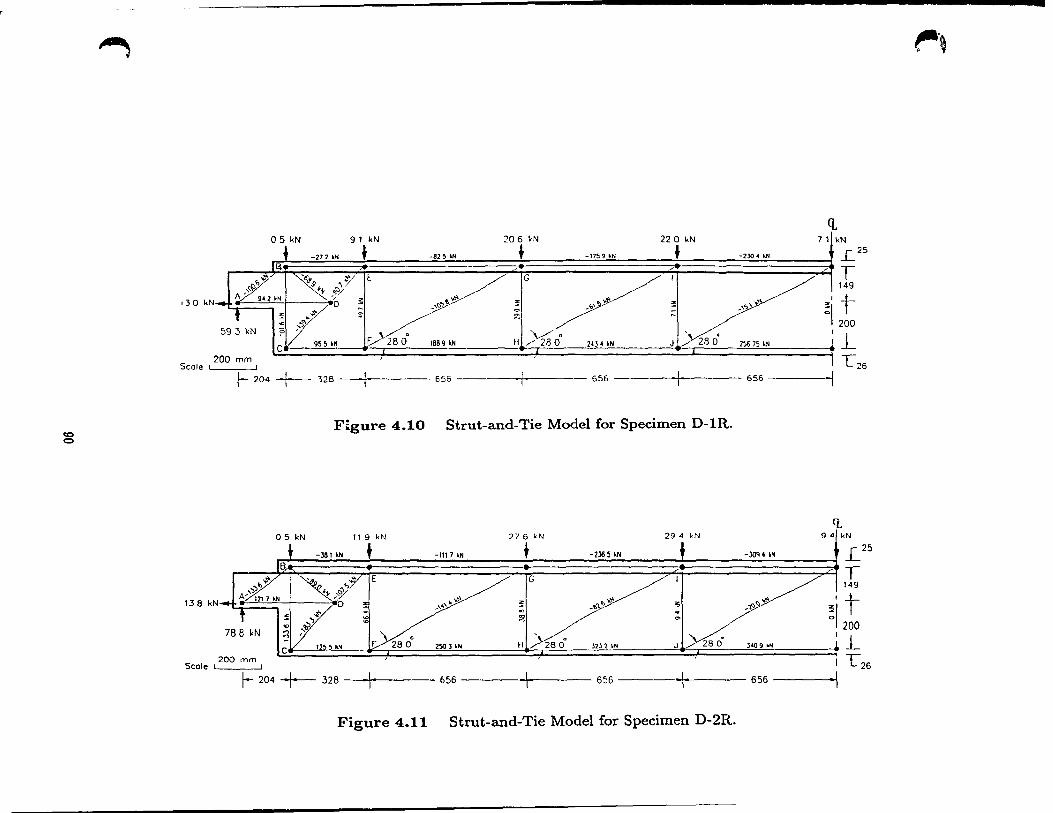
~
cc <:)
~
05 kN 91 kN ::>0 6 ~N 220 kN
-272 kN l- -SB ... + -1759 kN + -230 4 kN .... '6'3,9 - '\~/ E '/ ,3D kN--"e< ,"< "'1 ~,,!,/
<>"~ ..,; z ~
~.D ~ -' - <>' :, ~,?"' .... ' o -
~ . ~
i:o, ~o
955 kN V280° 1889 lN H/280 20~kN /'280· 251i 75 kN 1'" 1
200 mm Scole ,
/-- 204 +- 128 -j 656 656 - 656
Figure 4.10 Strut-and-Tie Mode! for Specimen D-IR.
05 kN 11 9 kN 276 kN 29 4 kN
-J8IkN + -1117kN + -2J65kN + -JQq4kN . _. • c· ""N-> ;-:"1 / l / ;1 -~.~
<D i' 788 kN l::l ,"
c _.t255kN l0so 250)'. HlXsoo 3232'. JLX80' ]4<J9>.
200 mm Scale l ,
1- 204 +- 328 ti56 -\ 656 -1- 656
Figure 4.11 Strut-and-Tie Mode! for Specimen D-2R.
CL 711 kN
L 25
T 149
~' -t-01200
L L Z6
-1
Ci 941 kN
L 25
T 149
~' t °/ 200
L L 26
_1
~.,
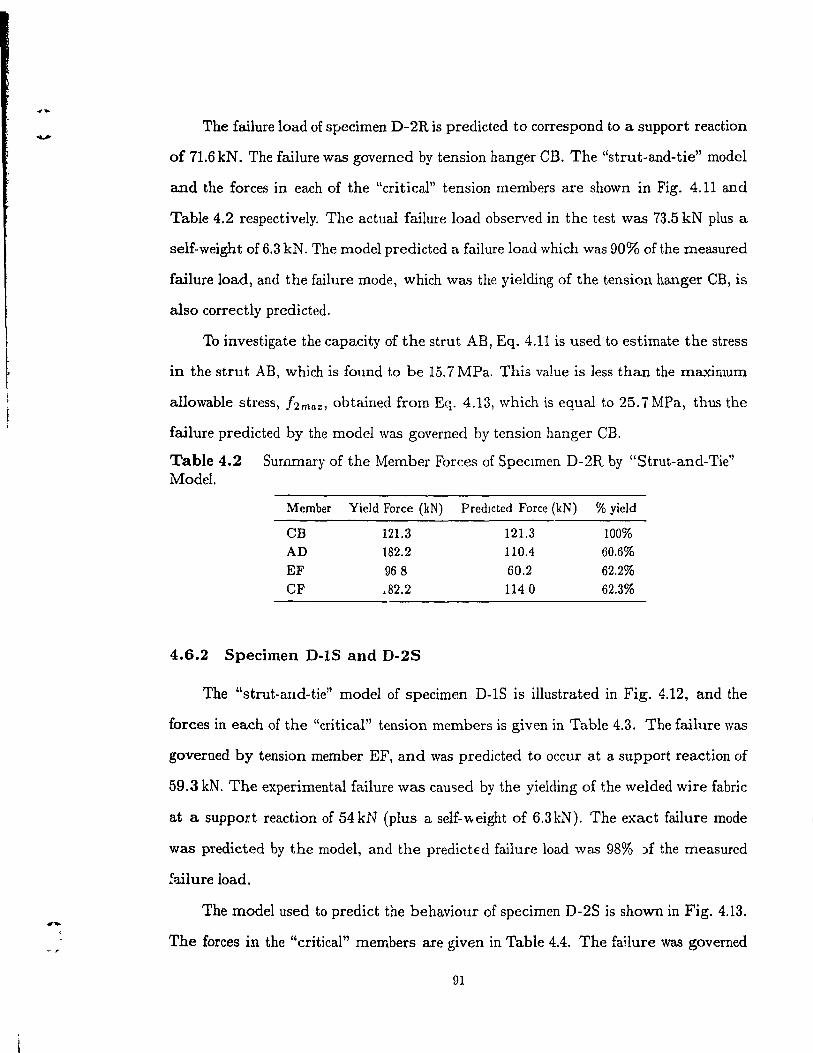
-
The failure load of specimen D-2R is predicted to correspond to a support reaction
of 71.6 kN. The failure was governed by tension hanger CB. The "strut~and-tie" modcl
and the forces in each of the "critical" tension members are shown in Fig. 4.11 and
Table 4.2 respectively. The actual failure load observed in the test was 73.5 kN plus a
self-weight of 6.3 kN. The model predicted a failure load which was 90% of the measured
failure load, and the failure mode, which was the yielding of the tension hauger CB, is
also correctly prcdicted.
To investigate the capacity of the strut AB, Eq. 4.11 is used to estimate the stress
in the strut AB, which is found to be 15.7 MPa. This value is less than the maximum
allowable stress, hmax, obtained from Eq. 4.13, which is equal to 25.7MPa, thus the
failure predicted by the model was governed by tension hanger CB.
Table 4.2 Summary of the Member Forces of Specunen D-2R by "Strut-and-Tie" Model.
Member Yield Force (kN) Predlcted Force (kN) % yield
CB 121.3 121.3 100%
AD 182.2 110.4 60.6%
EF 968 60.2 62.2%
CF ,82.2 1140 62.3%
4.6.2 Specimen D-IS and D-2S
The "strut-and~tie" model of specimen D-IS is illustrated in Fig. 4.12, and the
forces in each of the "critical" tension members is given in Table 4.3. The failure was
governed by tension member EF, and was predicted to occur at a support reaction of
59.3 kN. The experimental failure was cau'3ed by the yielding of the welded wire fabric
at a support reaction of 54 kN (plus a self-Vleight of 6.3 kN). The exact failure mode
was predicted by the model, and the predict€d failure load was 98% :>f the measured
~ailure load.
The model used to predict the behaviour of specimen D-2S is shown in Fig. 4.13.
The forces in the "critical" members are given in Table 4.4. The failure was governed
91
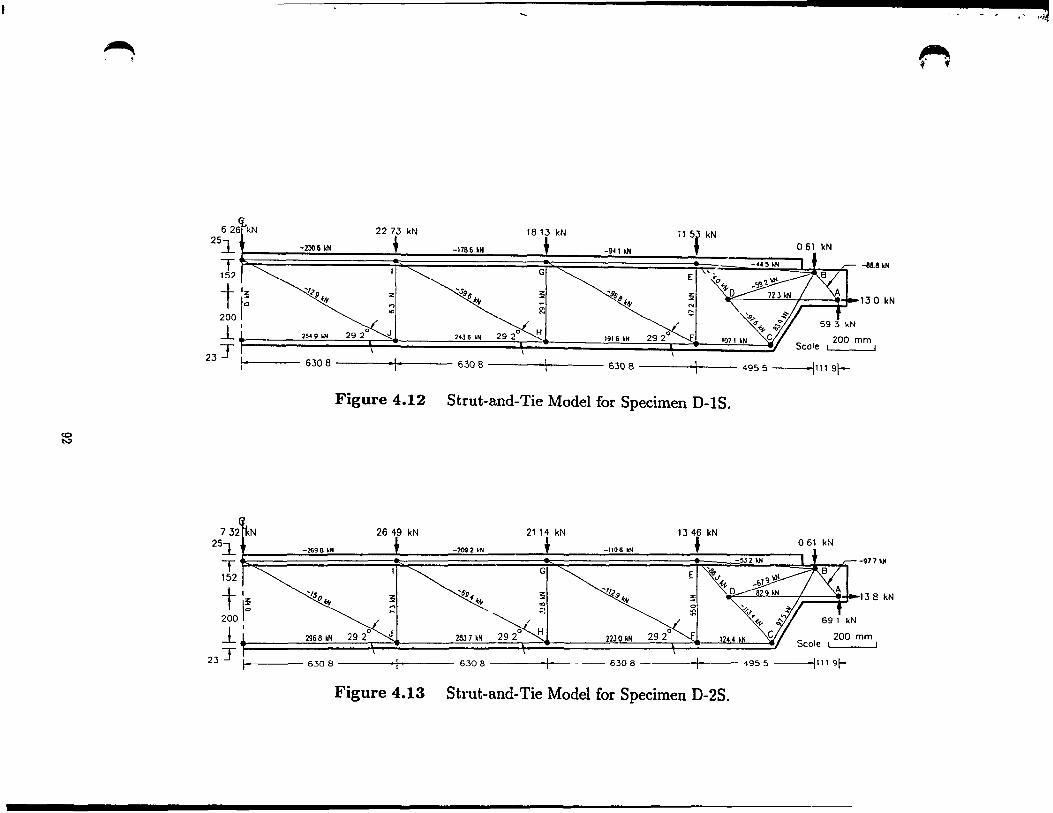
t· ,.~
~ , ~ ~
626 kN 2273 kN 1813 kN 11 Si kN 25l
-9~ 1 kil 061 kN -2~& ~H -1786 kN
+ T ~._45_kN r- -sae kN G
E 152
t '~ 'fi' z ~ :5 '.96'8 ~I -r , ~~130 kN .9 ~.y #.y - #", }
2001° -.......... ...,
g: '"
-L' 2549 IoN 292°' J 24J 6 kN .". '" 1916 kM 292 200 mm Seole L-- 1
23 T ,. 6308 6308 6308 ,\111 gf-
Figure 4.12 Strut-and-Tie Model for Specimen D-lS.
<C t.,;)
7.32 N 2649 kN 2114 kN 1346 kN 25l -2696 k. -209 2 .N -1106 kN +
T -53 2 IoN l , r--977I<H
G 152
t '~ 'f5 '6'.9 ~I ~ 'lil ~ D~~"'I'I 1 ~-f-13 8 kN o~ ~ ~~ .9 *", )
.... .,
200 1° ~ Po
~' 2968 kil 292°~ 28J 7 kN 292-~ 22J 0 kil 292-~ 124! ~~ YI 200 mm t Seole L- I
23 T 1 6308 1 6308 1 6308 1 4955 1'" gr-Figure 4.13 Stt'ut-and-Tie Model for Specimen D-2S.
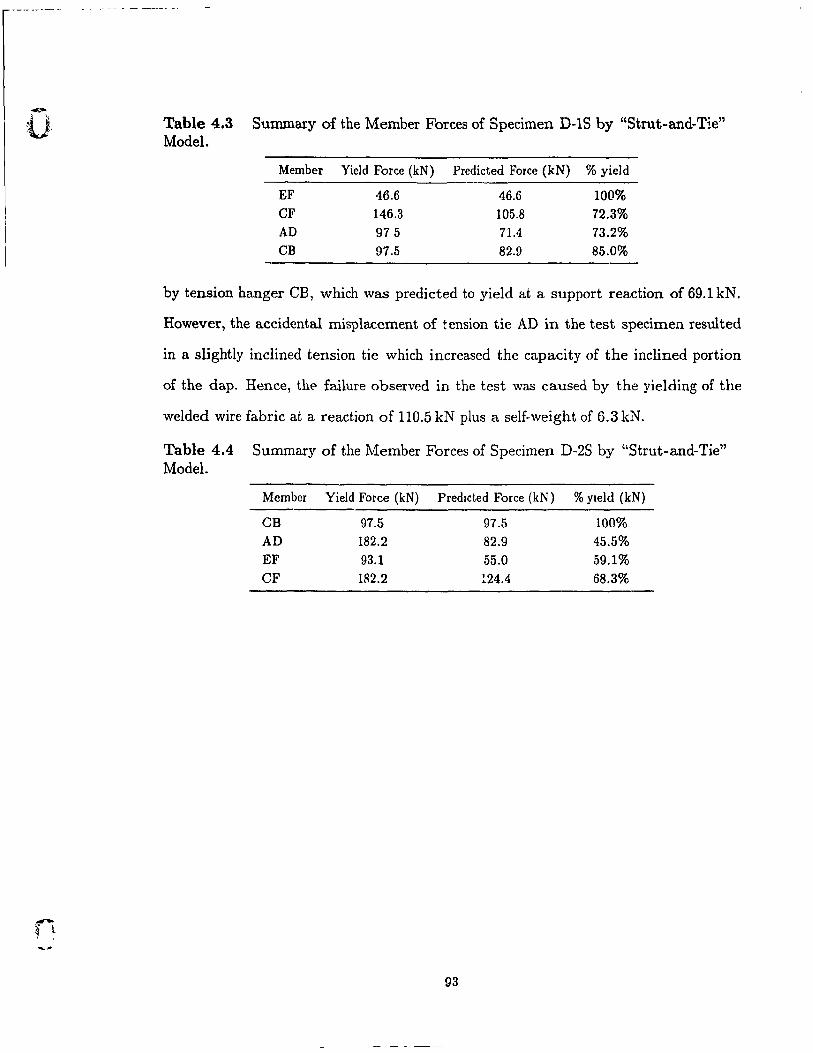
Table 4.3 Summary of the Member F'orces of Specimen D-1S by "Strut-and-Tie" Model.
Member Yield Force (kN) Predicted Force (kN) % yield
EF 46.6 46.6 100% CF 146.3 105.8 72.3% AD 975 71.4 73.2% CB 97.5 82.9 85.0%
by tension hanger CB, which was predicted to yield at a support reaction of 69.1 kN.
However, the accidental misplacement of tension tie AD in the test specimen resulted
in a slightly inclined tension tie which increased the capacity of the inclined portion
of the clap. Hence, th{' failure observed in the test was caused by the yielcling of the
welded wire fabric at a reaction of 110.5 kN plus a self-weight of 6.3 kN.
Table 4.4 Summary of the Member Forces of Specimen D-2S by "Strut-and-Tie" Model.
Member Yield Force (kN) Predlcted Force (kN) % yleld (kN)
CB 97.5 97.5 100% AD 182.2 82.9 45.5%
EF 93.1 55.0 59.1% CF 182.2 !24.4 68.3%
93
(
r
CHAPTER 5
Computer Models
5.1 Introduction
The "strut-and-tie" model is ideal for design or analysis. However, in order to
obtain a more accurate prediction of strength and also to obtain the complete response
of reinforced concrete members, a non-linear finite element analysis could be used. This
analysis should consider sorne important aspects, such as shear transfer along the crack,
compressive strain softening, and tension stiffening of concrete. The objective of the
second phase of this study is to analyze the dapped end specimens with the non-linear
finite element prograrn FIELDS.
5.2 Program FIELDS
FIELDS, which stands for FInite ELements for Disturbed Sections, is a non-linear
finite element prograrn developed by Cook and Mitche1l10 ,1l to predict the response of
reinforced concrete members. In this program, two-dimensional plane stress elements
are used to simulate the behaviour of reinforced concrete. Two types of isoparametric
elements, narnely CFTQ and CFTT elements, are available in the program FIELDS.
The compression field theory is used to predict the response of the elements. The CFTQ
element is a 9-node quadrilateral plane stress element, and the CFTT element is a 6-
Dode triangular element. Each element is capable of rnodeling two sets of reinforcement
94
in two arbitrary directions. The reinforcement and cracking that may occur are assumed
to be smeared uniformly. In addition to the isoparametric elements, a non-linear truss
element, TRUS, is also offered for modeling of support conditions and secondary steel
reinforcement.
Program FIELDS Îs basically limited to two-dimensional analysis. Spalling of con
crete and the devclopment lengths of reinforcement can be simulated indirectly in the
analysis by modifying the input properties of the elements. The effects of compressive
strain snftening and tension stiffening are included in the prograll1 to provide a more
accurate response of the member. In order to allow better flexibility in numbering
of the finite element mesh, the stiffness matrix is stored in "skyline format". The
main program is written in Miscrosoft FORTRAN 77, with sorne of the subroutines
written in 8086 assernbly language, which allows the program to be run on an IBM
personal computer, 50 that the results obtained from the analysis can be saved in files
for graphical post-processing and display.
5.3 Program Logic
Program FIELDS is executed according to the îollowing sequences:
(1). Read and verzfy the mput data - The input data includes (i) optional control
cards (e.g., title files, locations of input and output files), (ii) nodal coordinates
in x and y directions, (iii) material properties of concrete and reinforcement, (iv)
element connectivity data, and (v) load case data, such as self-weight, variable and
constant nodal loads. The data is then verified sequentially, and corresponding
error messages will be displayed if required.
(2). Input solution options - This step includes inputting (i) load case multipli-
ers for the variable nodal loads, (ii) repetition factor, (iii) maximum number of
iterations, (iv) solution methods, which allow the stiffness matrix to be set at con
stant or updated at each iteration, (v) convergence tolerance on displacements and
95

(
(
unbalanced load, (vi) relaxation factor to change t,he incremental displacementf.
(3). Determine the total applied load vector for the first load increment - The
applied load is determined based on the load case multiplier input in step (2), but
the program will adjust the increment automatically if divergence of solution is
sensed.
(4). Determine the element tangent stiffness and assemble the global stiffne33 matrix -
This step is performed only if the updated stiffness method is selected. With the
utilization of the compression field theory, :he element tangent stiffness matrix is
evaluated based on the displacement obtained from the last iteration.
(5). Determine the internai fore3 in the elements and assemble the global internai force
vector - These internai forces correspond to the current state of deformation
and strains.
(6). Determine the u.nbalanced force vector - The unbalanced force vector is eval-
uated by subtracting the total applied load vector from the global internai force
vector.
(7). Determine the incremental di3placements - The displacements are calculated
based on the updated stiffness matrix and on the unbalanced load vector.
(8). Update the total displacement vector.
(9). Check for convergence on displacements and unbalanced load - If the check is
not satisfied and the maximum number of iterations have not been exceeded, then
the program will go to step (4).
(10). Write the outpu.t on corresponding files - The output data, which includes the
current forces, displacements, strains, and stresses, is written to the files specified
in step (1).
(11). Go to step (2) if fu.rther loading is required.
96
-
-
5.4 Evaluation of Tangent Stiffness for CFTQ and CFTT Elements
Based on the compression field theory, two isoparametric elements, namely CFTQ
and CFTT, were developed by Cook and Mitchell10 ,l1 to model the behaviour of rein-
forced concrete. Each element is capable of modeling two sets of reinforcement in two
arbitrary directions, (J6X and (J6Y' and in the form of reinforcemem réüios, P6X and P6Y,
which are taken as the ratio of the area of the reinforcement to the tributary dimension
of concrete perpendicular to the reinforcement (e.g., equal to Avis for stirrups of area
Av and having a spacing of s).
In each element, the stresses are evaluated in a series of Gauss points, as shown
in Fig.5.1a. A maximum of four gauss points can be used in each direction. At each
Gauss point, the strains in different directions are determined using the relationship
established by Mohr's circle illustrated in Fig. 5.1 b. The basic relationship of the
principal tensile strain, El, the principal compressive strain, tz, the strains in x and y
directions, tx and ty, and the angle of inclination of the diagonal compression, (J, lS
described by Mohr's circle for strain. Th:; strain in each material is then determined by
compatibility as shown in Fig. 5.lc. Having detcrmined the strain, the corresponding
stress in the reinforcement is found directly from an a..c;sumed bi-linear stress-strain
relationship. A bi-linear relationship is used in order to include the effect of strain
hardening.
It is a lot more complicated to establish the stress-strain reiatiollship of diagonally
cracked concrete. Vecchio and Collins24 ,25 conducted a series of tests on cracked rein-
forced concrete, and based on the results, they suggested that the principal compressive
stress in the concrete, fz, is dependent on both the principal compressive strain, t2,
and the principal compressive strain, El, as illustrated in Fig. 5.2a. In addition, they
also recommended the stress-strain relationship shown in Fig. 5.2b to determine the
average tensile strength for concrete. The stress-strain relationship for concrete can be
summarized by the following equations:
97
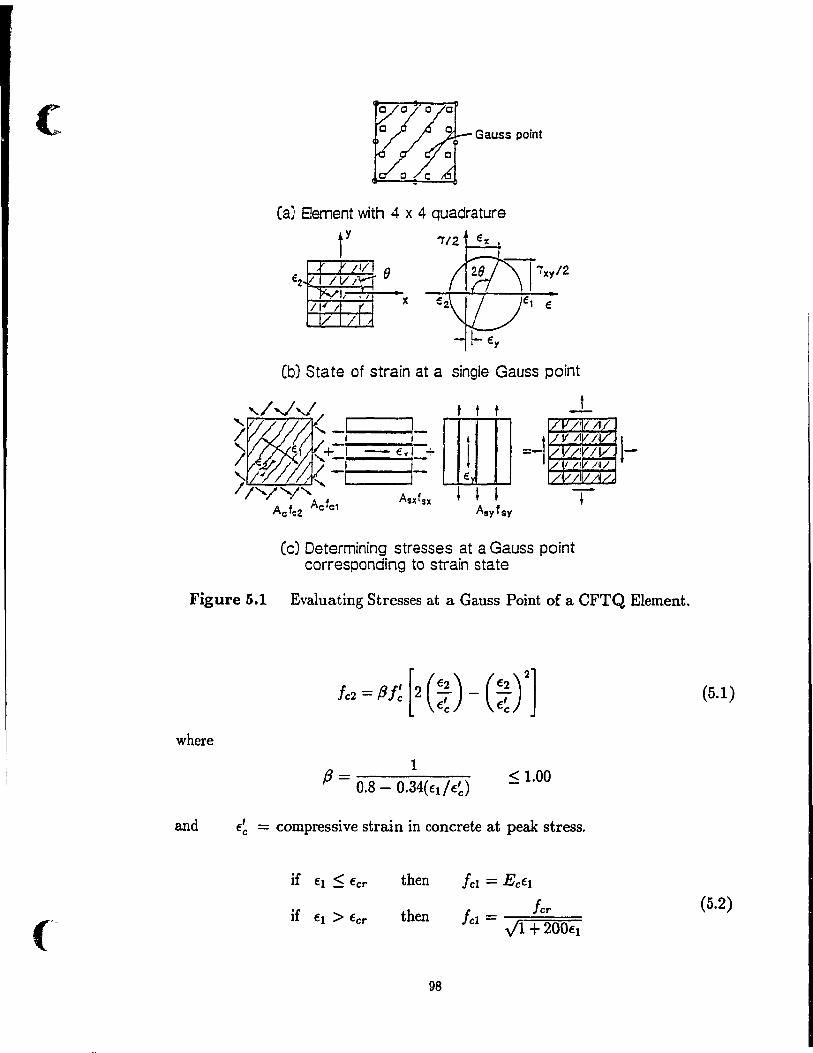
("-
Gauss point
Ca) Bement with 4 x 4 quadrature
""2 t:::t_ t1~\ï7,,/2
€2\l/Je1 ~
~ (b) State of strain at a single Gauss point
-
Cc) Determining stresses at a Gauss point corresponding to strain state
~
Figure 5.1 Evaluating Stresses at a Gauss Point of a CFTQ Element.
where
f3= 1 0.8 - 0.34( fI / f~)
< 1.00
and f~ = compressive strain in concrete at peak stress.
if fI < fer then leI = Eefl
if fI > fer then f, fer cl = Jl + 200fl
98
(5.1)
(5.2)
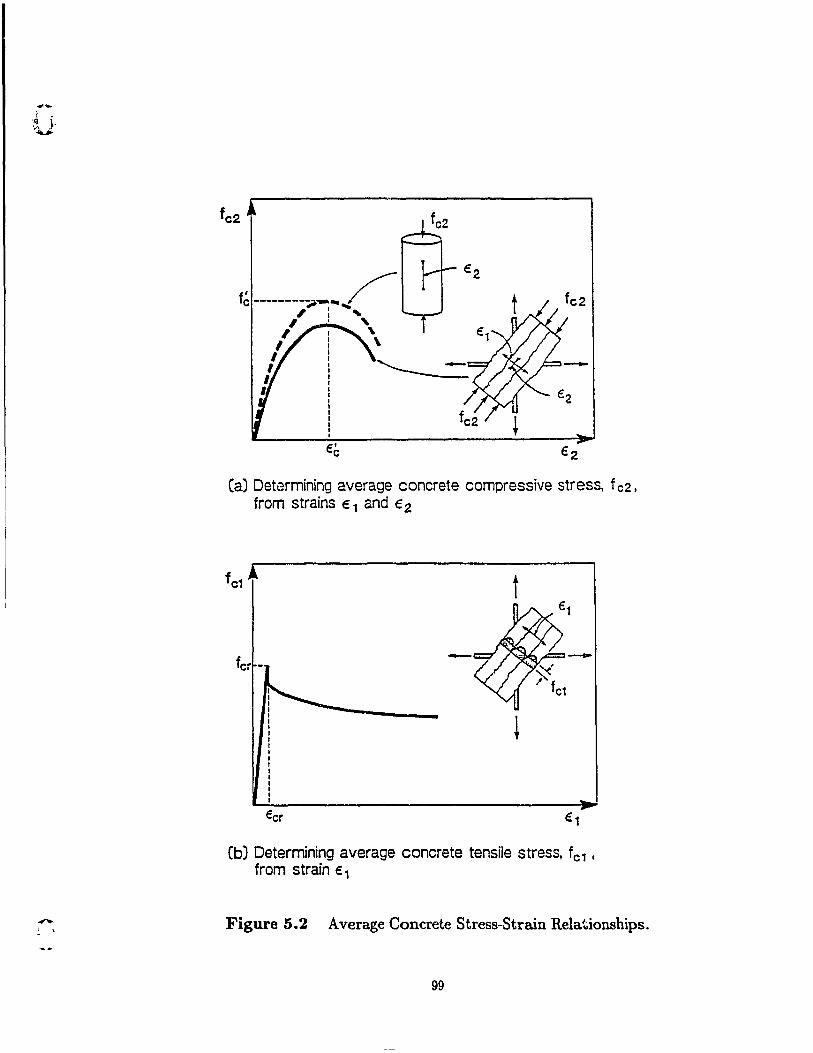
..,...
fe' -----------... / , .... , " _.-, " , " 1 \ 1 ,
1 l
€' e
Ca) Determining average concrete compressive stress. f c2 ,
fram strains € 1 and € 2
t
-
Ecr
(b) Determining average concrete tensile stress. fe1 '
fram strain € 1
Figure 5.2 Average Concrete Stress-Strain Relationships .
99
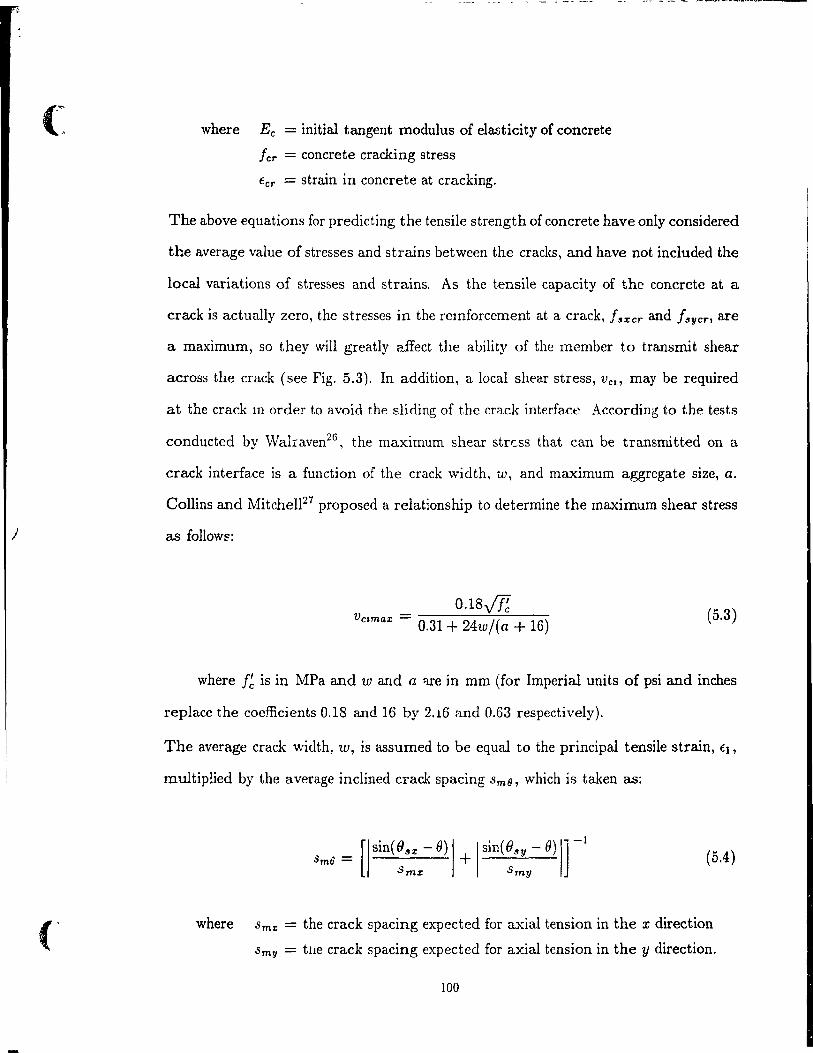
J
where Ee = initial tangent modulus of elasticity of concrete
fer = con crete cracking stress
€er = strain in concrete at cracking.
The above equations for predicting the tensile strength of concrete have only considered
the average value of stresses and strains between the cracks, and have not included the
local variations of stresses and strains. As the tensile capacity of the concrete at a
crack is actually zero, the stresses in the remforcement at a crack, f~xcr and f~ycn are
a maximum, so they will greatly affect the ability of the member to transmit shear
across the crack (see Fig. 5.3). In addition, a local shear stress, V el , may be required
at the crack III order to avoid the sliding of the crack interface According to the tests
conducted by Walraven26, the maximum shear stress that can be transmitted on a
crack interface is a function of the crack width, w, and maximum aggregate size, a.
Collins and Mitche1l27 proposed a relationship to de termine the maximum shear stress
as follow~:
O.lS.jH v - --------~------
clmax - 0.31 + 24w/(a + 16) (5.3)
where f~ is in MPa and w and a ~e in mm (for Imperial units of psi and inches
replace the coefficients 0.18 and 16 by 2.16 and 0.63 respectively).
The average crack width, w, is assumed to be equal to the principal tensile strain, €},
multip!ied by the average inclined crack spacing Sm6l, which is taken as:
(5.4)
where Smz: = the crack spacing expected for axial tension in the x direction
Smy = tlle crack spacing expected for axial tension in the y direction.
100
-....
l-,
,t T (a) Craeked relnforced
conerete e/ement
V,y lfy 1 - /
~Î[fl9 lel-v. y '-1 , t .l(
/ 1 + ISY
CC) Average stresses between cracks
(b) Transmlttlng shear across crack Interface
V,y Îl y
-
IV 2 + l,y cr
Cd) Stresses at crack Interface
Figure 5.3 Investigating Stresses at Crack Interface.
Based on Eqns. 5.2 to 5.4, Cook émd Mitchell10 ,11 developed expressions for predicting
the average tensile stress, icI, that will cause the yielding of the reinforcement or the
sliding of the crack interface uuder the following conditions:
(a). Concrete element with no reinforcement: Since the con crete is not reinforced, no
tensile strength will he availahle after cracking, thus the principal tensile stress, IcI,
must be zero.
(b). Concrete element reinforced in one direction: Based Ol! the relationship illustrated
in Fig. 5.3, the following equations are writ~en for elements reinforced in the x direction
(i.e. A .. y = 0) lo determine the maximum principal tensile rtress, lel, without causing
slip at the crack .
101
(5.5)
and the principal tensile stre~s causing the yielding of the reinforcement across the
crack, can be expressed as:
where t:l.1sr. = Iu:,er - lu: = the stress increase in the x reinforcement
at the crack.
(5.6)
(c). Concrete element reinforced in two directions: Due to the additional condition of
compatibility of strains in the reinforcement across the crRck, it is easier t,o examine the
crack slip and the yielding of the reinforcement together at the same time. Assuming
the crack to be formed in the direction of the principal tensile strain, €l, the following
expressions are developed:
and
where t:l./u: = In:,er - lu: = the stœss increase in the x reinforcement
at the crack
t:l.J~y = lay,er - lay = the stress increase in the y reinforcement
at the crack.
102
(5.7)
(5.8)
-,
If one set of reinfoJ."cement has yielded, then Eqns. 5.5 and 5.6 in case (b) above will
he applied to determine JcI. If both set of reinforcement have yielded, then JcI will he
zero if the reinforcement undergoes no strain hardening. If both sets of reinforcement
have not yielded, then the following relationships can be used to detcrmine Do/IX and
and
where Eu = modulus of elasticity of reinforcement in x direction
Eay = modulus of elasticity of reinforcement in y direction
Eq. 5.10 can be re-written as:
(5.9)
(5.10)
(5.11)
The principal tensile stress, IcI, ohtained from the expressions in the above cases are
then compared with the value determined using Eq. 5.2, and the lowest value will
govern for the maximum allowable tensile stress.
For a given state of strain, the incremental stress-strain constitutive matrix, D,
can be determined by evaluating the change of stress that is caused by an increment
of strain. The matrix, D, is then used to construct the incremental tangent stiffness
matrix, kT, of each element using numerical integration as shown in the following
equation:
(2-14)
103
c where B = the strain-displacement matrix
t = element thickness
A = element surface area.
5.5 Computer Models for the Test Specimens
In or der to predict the complete response of the test specimens, computer models
were devcloped for the rectangular and the inclined dapped ends. Due to the symmetry
about midspan, only one half of the specimen was modeled, and appropriate boundary
conditions were assigned, i.e. restraint of the horizontal displacement at midspan, and
vertical displacement at the support. Although the clap at both ends of the specimen is
different, the effect caused by this difference is negligible. The actual material properties
of thé specimens used in the analysis are summarized in Table 2.1, 2.~, and 2.3. In
addition, a Poisson's ratio of 0.10 and a weight density of 23.5kN/m3 were assumed
for concrete.
As the reinforcement is assumed to be smeared uniformly within each element, it
is necessary to develop a fini te element mesh that matches the details of the reinforce
ment, thus the elements are élrranged to be coïncident with the principal reinforcement.
Nominal rcinforcement amounts having a ratio of 1 x 10⁻⁵ were placed in the unrein
forced elements to a.void the instability of the solution that might be caused by extensive
cracking. In order to simulate the stiff $upport provided by the bearing angle, a series
of rigid truss elements, TRUS, were placed at the support in the form of two triangu
lar grids. The horizontal tension was applied through the centreline of the horizontal
triangular grid. Vertical concentrated loads were applied at a distance of 1000mm
and 2000 mm from the line of the support reaction. The vertical applied loads were
converted into nodal loads for the analysis.
The analysis was performed using an Olivetti M24 personal computer, with a
8.00 Ivlhz 8086 CPU and a 8.00 Mhz Math Chip, requiring an average of 24 hours to
104
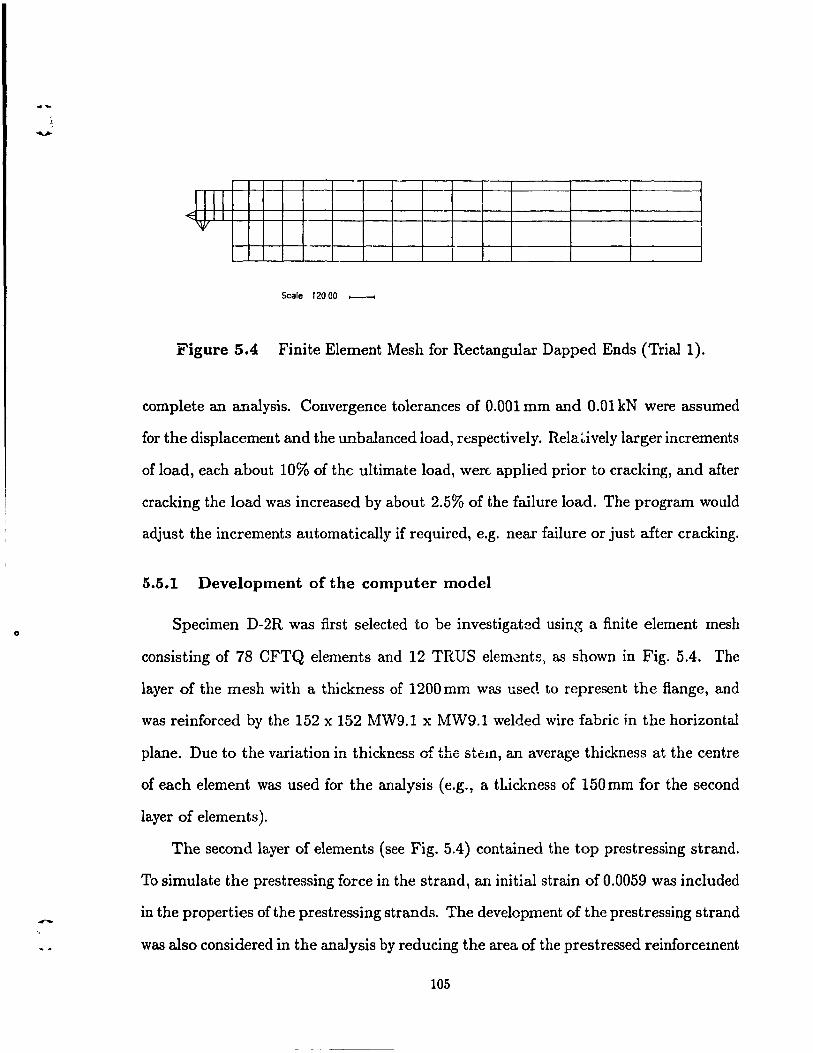
-
o
-
1 JI "'El ~J
\10
Scale 120 00 _____
Figure 5.4 Finite Element Mesh for Rectangular Dapped Ends (Trial 1).
complete an analysis. Convergence tolerances of 0.001 mm and 0.01 kN were assumed
for the displacement and the unbalanced load, respectively. Rela~ively larger increments
of load, each about 10% of the ultimate load, weI"(, applied prior to cracking, and after
cracking the load was increased by about 2.5% of the failure load. The program would
adjust the increments automatically if required, e.g. near failure or just after cracking.
5.5.1 Development of the computer model
Specimen D-2R was first selected to be investigated using a finite element mesh
consisting of 78 CFTQ elements and 12 TRUS elem~nts) as shown in Fig. 5.4. The
layer of the mesh with a thickness of 1200 mm was used to represent the flange, and
was reinforced by the 152 x 152 MW9.1 x MW9.1 welded wire fabric in the horizontal
plane. Due to the variation in thickness of the stêlO, an average thickness at the centre
of each element was used for the analysis (e.g., a tl.ickness of 150 mm for the second
layer of elements).
The second layer of elements (see Fig. 5.4) contained the top prestressing strand.
To simulate the prestressing force in the strand, an initial strain of 0.0059 was included
in the properties of the prestressing strands. The development of the prestressing strand
was also considered in the anaJysis by reducing the area of the prestressed reinforcement
105
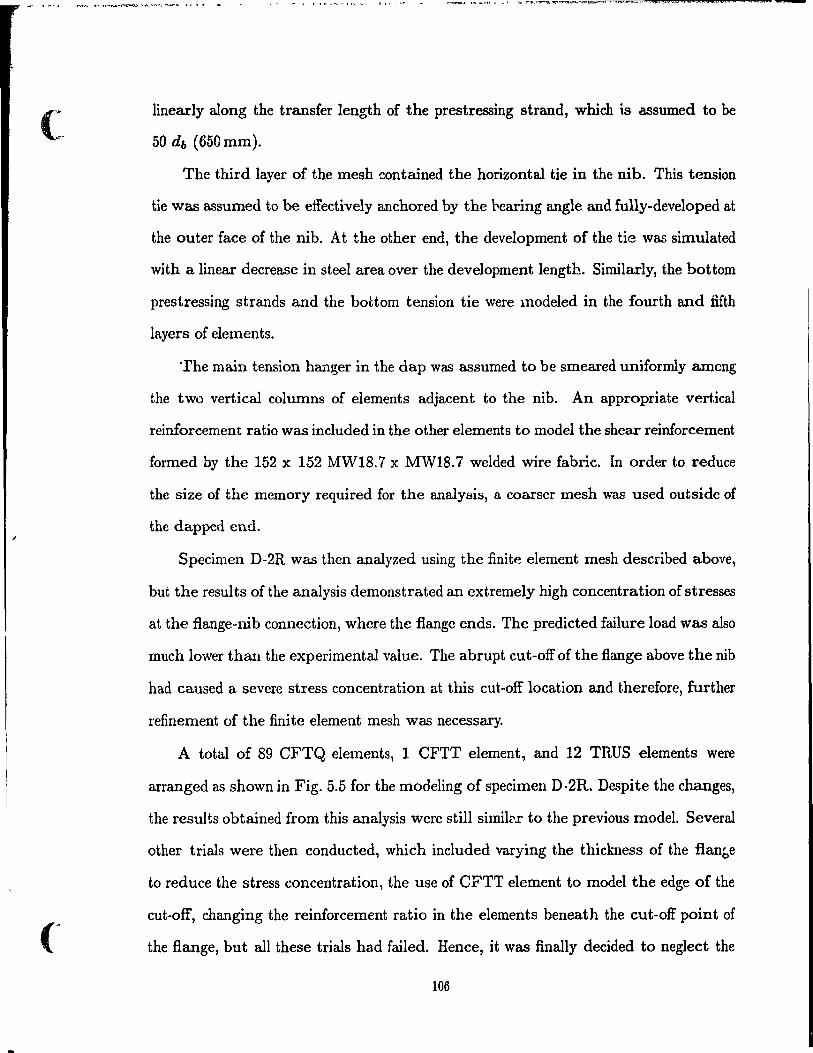
1
(~
linearly along the transfer length of the prestressing strand, which lS assumed to be
50 db (650mm).
The third layer of the mesh contained the horizontal tie in the nib. This tension
tie was assumed to be effectively anchored by the pearing angle and fully-developed at
the outer face of the nib. At the other end, the development of the tie was simulated
with a linear decrease in steel area over the development length. Similarly, the bot tom
prestressing strands and the bottom tension tie were modeled in the fourth and fifth
layers of elements.
'rhe main tension hanger in the clap was assumed to be smeared uniformly among
the two vertical columns of elements adjacent to the nib. An appropriate vertical
reinforcement ratio was included in the other elements to mode1 the shear reinforeement
formed by the 152 x 152 MW18.7 x MW18.7 welded wire fabric. In order to reduce
the size of the memory required for the analysis, a coarser mesh was used outside of
the dapped end.
Specimen D-2R was then analyzed using the finite element mesh deseribed above,
but the results of the analysis demonstrated an extremely high concentration of stresses
at the flange-nib connection, where the flange ends. The predieted failure load was also
much lower than the experimental value. The abrupt eut-off of the flange above the nib
had eaused a severe stress concentration at this eut-off location and therefore, further
refinement of the finite element mesh was necessary.
A total of 89 CFTQ elements, 1 CFTT element, and 12 TRUS elements were
arranged as shown in Fig. 5.5 for the modeling of specimen D ·2R. Despite the changes,
the results obtained from this analysis were still similé'x to the previous model. Severa!
other trials were then eonducted, whieh included varying the thiekness of the flané,e
to reduce the stress concentration, the use of CFTT element to model the edge of the
eut-off, changing the reinforcement ratio in the elements beneath the eut-off point of
the flange, but all these trials had failed. Renee, it was finally decided to neglect the
106
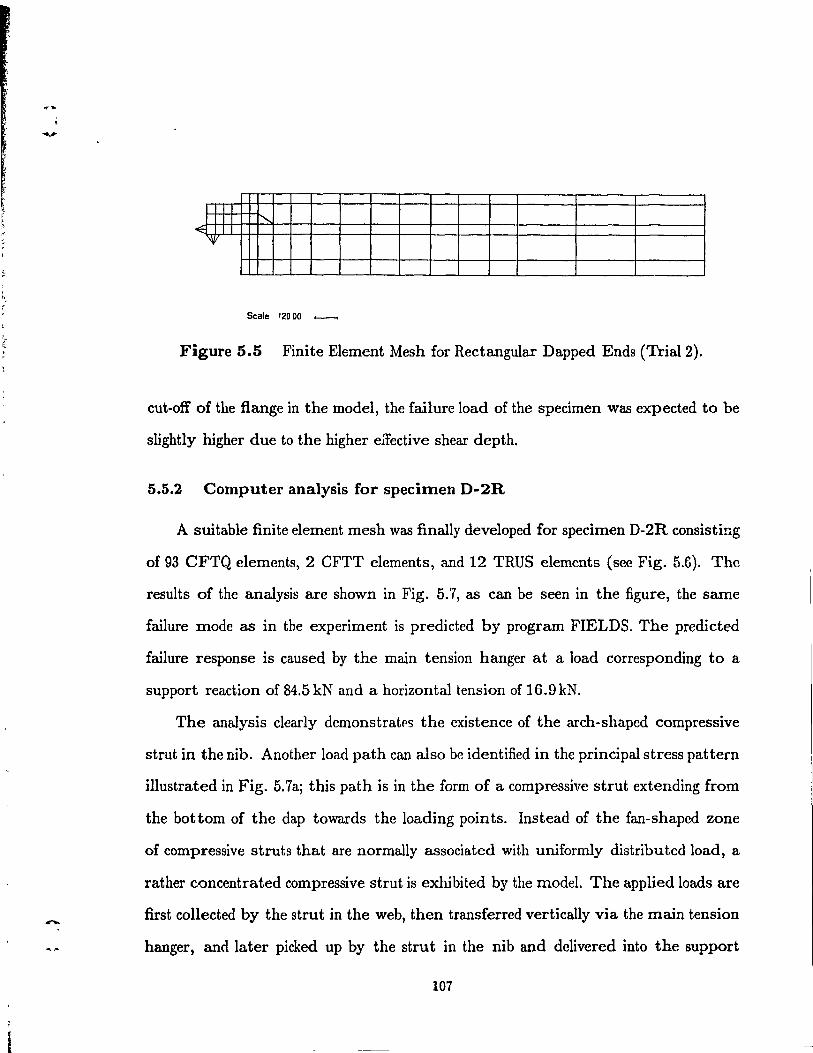
".
.-
1 Il "" ~
~
Scale 120 00 >---<
Figure 5.5 Finite Element Mesh for Rectangular Dapped Ends (Trial 2).
eut-off of the flange in the model, the failure load of the specimen was expeeted to be
slightly higher due to the higher eifective shear depth.
5.5.2 Computer analysis for specimen D-2R
A suitable finite element mesh was finally developed for specimen D-2R eonsisting
of 93 CFTQ elements, 2 CFTT elements, and 12 TRUS elements (see Fig. 5.6). The
results of the analysis are shown in Fig. 5.'7, as can he seen in the figure, the same
failure mode as in the experiment is predicted by program FIELDS. The predicted
failure response is caused by the main tension hanger at a load corresponding to a
support reaction of 84.5kN and a horizontal tension of 16.9kN.
The analysis clearly demonstratps the existence of the arch-shaped compressive
strut in the nib. Another load path can also he identified in the principal stress pattern
illustrated in Fig. 5.7aj this path is in the form of a compressive strut extending from
the hottom of the clap towards the loading points. Insteacl of the fan-shapecl zone
of compressive struts that are normally associated with uniformly distributed load, a
rather concentrated compressive strut is exhihited by the model. The applied loads are
first collected by the strut in the web, then transferred vertically via the main tension
hanger, ancllater picked up by the strut in the nib and delivered into the support
107
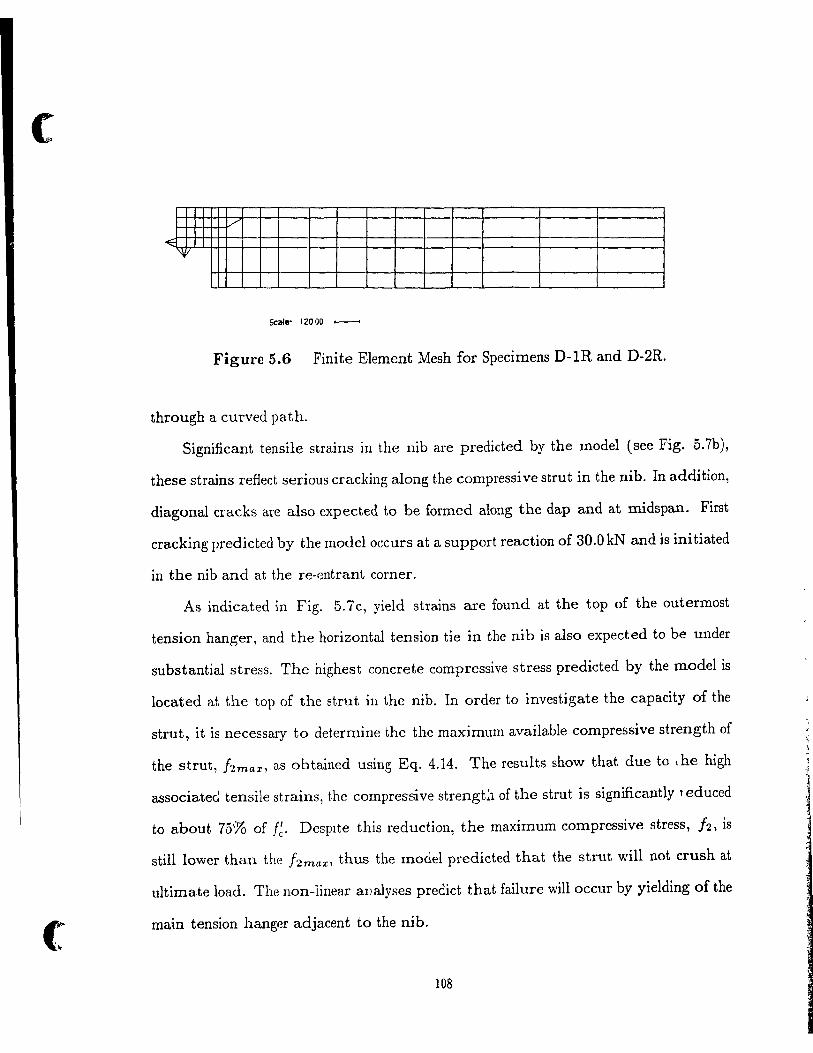
(
/'
-El \\j
Scala' 120 00 0---<
Figure 5.6 Finite Element Mesh for Specimens D-IR and D-2R.
through a curved path.
Significant tensile strains in the nib are predicted by the model (see Fig. 5. 7b),
these strains reflect serious cracking along the compressive strut in the nib. In addition,
diagonal cracks are also expected ta be formed along the dap and at midspan. First
cracking predicted by the model occurs at a support reaction of 30.0 kN and is initiated
in the nib and at the re-~ntranL corner.
As indicated in Fig. 5.7 c, yield strains are found at the top of the outerrnost
tension hauger, and the horizontal tension tie in the nib is also expected to be under
substantial stress. The highest concrete compressive stress predicted by the model is
located at the top of the strut in the nib. In arder to investigate the capacity of the
strut, it is necessary ta determine the the maximum available compressive strength of
the strut, hmax, as obtained using Eq. 4.14. The results show that due to \ he high
associatec! tensile strains, the compressive strengtl of the strut is signifieantly T educed
to about 75% of f~. Desplte this reduction, the maximum compressive stress, 12, is
still lower than the hmax, thus the model predicted that the strut will not crush at
ultimate load. The non-linear allalyses predict that failure will oecur by yielding of the
main tension hanger adjacent to the nib.
108
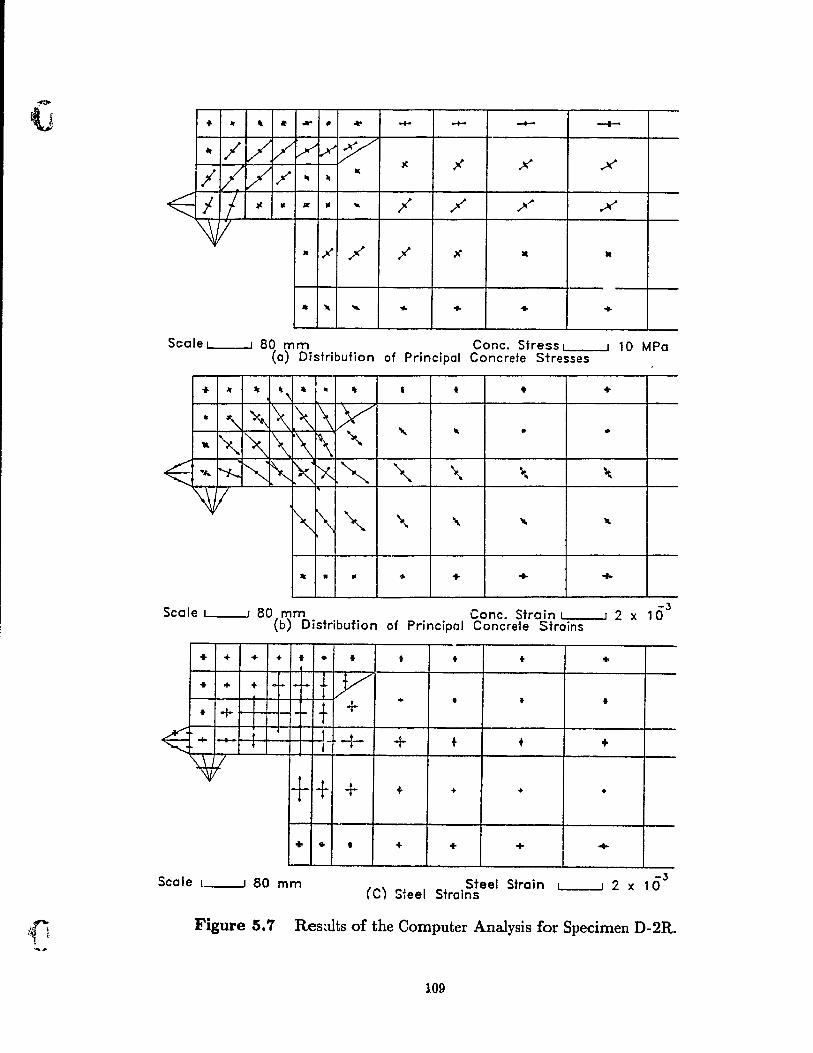
* .. , • ... - ... ..... ..... -+- --+-
" / V V v v IY [7 V
~ )t x x ;1 ./ '" .. 1(
~ 1 7 ~ Il X III - ;1 ./ / .x"
W .,t ;/ • ;< )( • -
.. lt. ... ~ ... ... ...
Scale 1-.' _---' 80 mm Conc. Stress 1-.' _---'
(a) Distribution of Principal Concrete Stresses 10 MPa
.. .If li: , ~ " • " 1 t • +
.. '\ ~ 1'\ [\ 1'\ IY .... .. • • • ~ ~ \ r\ r\ " ~ '"#.. 'f..-. 1" , >< rx " " \ \ \
~/
'" 1\ " " \ "- lt.
lt • • .,. ... ... ....
Scale 1-.' _---', 80 mm Cene. Stroin 1-.' _---'
(b) Distribution of Principal Cencrete Strains
-3 2 x 10
+ + + + • •
.. ... .. -1- 1-1- t 1 t + I·~ t T
~ ; 1 + -- T 1
'~ + + + •
Scale L __ -,' 80 mm
• • • • +
!y +
+
+
•
• • • •
+ t + +
+ + • •
+ + ... +-
-3 Steel Strain 1-.1 _--,' 2 x 10
(C) Steel Strains
Figure 5.7 Resalts of the Computer Analysis for Specimen D-2R.
109
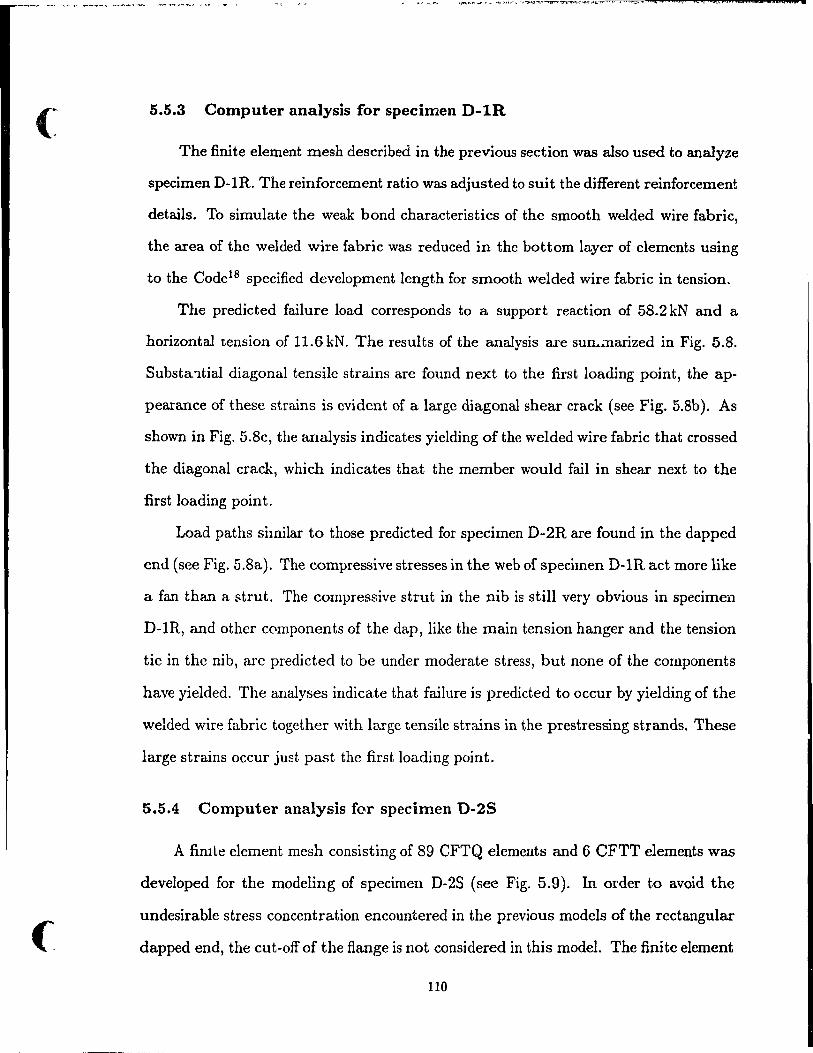
( 5.5.3 Computer analysis for specimen D-1R
The finite element mesh described in the previous section was also used to analyze
specimen D-IR. The reinforcement ratio was adjusted to suit the different reinforcement
details. To simulate the weak bond characteristics of the smooth welded wire fabric,
the area of the welded wire fabric was reduced in the bottom layer of elements using
to the Code1B specified development length for smooth welded wire fabric in tension.
The predicted failure load corresponds to a support reaction of 58.2 kN and a
horizontal tension of 11.6 kN. The results of the analysis are sun ... ;nanzed in Fig. 5.8.
Substa'1tial diagonal tensile strains are found next to the first loading point, the ap
pearance of these strains is evident of a large diagonal shear crack (see Fig. 5.8b). As
shown in Fig. 5.8c, the analysis indicates yielding of the welded wire fabric that crossed
the diagonal crack, which indicates that the member would fail in shear next to the
first loading point.
Load paths similar to those predicted for specimen D-2R are found in the dapped
end (see Fig. 5.8a). The compressive stresses in the web of specimen D-IR act more like
a fan than a strut. The compressive strut in the nib is still very obvious in specimen
D-IR, and other c0mponents of the dap, like the main tension hanger and the tension
tie in the nib, are predicted to be under moderate stress, but none of the components
have yielded. The analyses indicate that failure is predicted to occur by yielding of the
welded wire fabric together with large tensile strains in the prestressing strands. These
large straÎns occur just past the first loading point.
5.5.4 Computer analysis for specimen D-2S
A fimle element mesh consisting of 89 CFTQ elements and 6 CFTT elements was
developed for the modeling of specimen D-2S (see Fig. 5.9). In order to avoid the
undesirable stress concentration encountered in the previous models of the rectangular
dapped end, the eut-off of the Range is not considered in this mode!. The fini te element
110
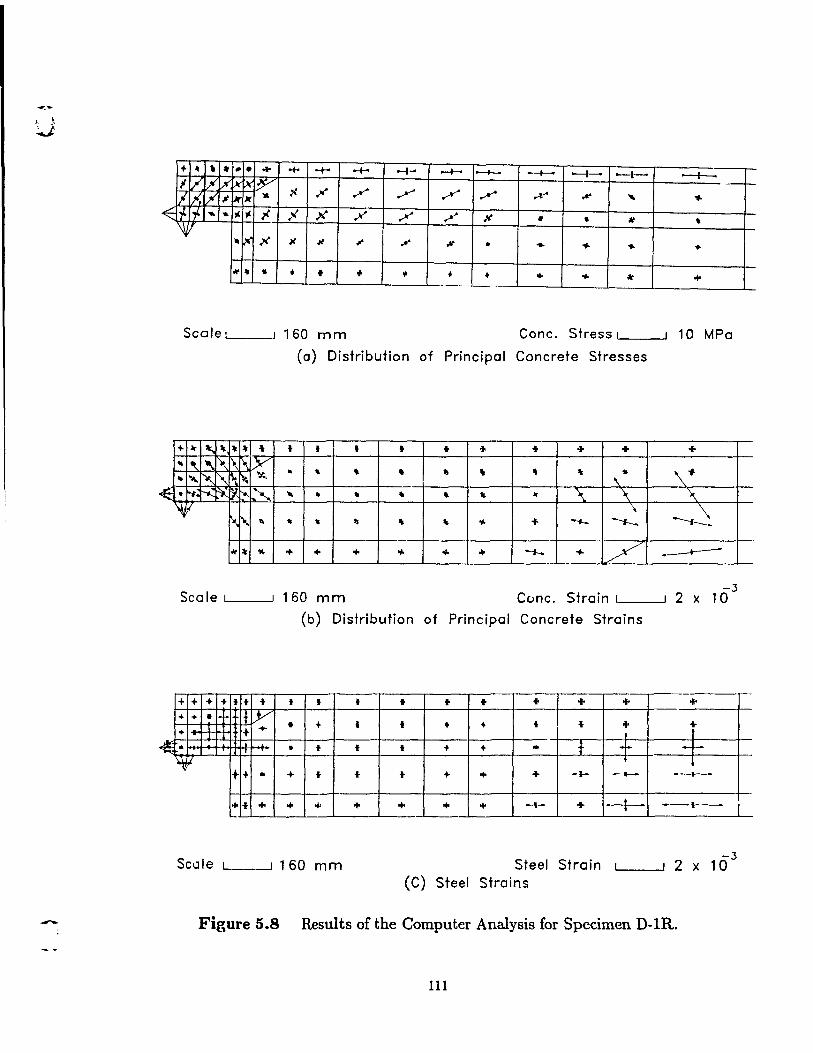
-
... .- , . • • ... IV ~ l'*' ~~ I~ Il 11< ~ Ill( J( •
.oE I~ I-,L .... ... )IIf. ,t
~ ,,~ )(
*' •
Scale LI __ -'
... .Ir %, % % % 't
~I, 1'\ ~ 1\1\ IX ,," ~ ~ t\~ ~
~ .~ r-: ~ tft- ~ ~
~"" " Jt% %
Scale 1...1 __ _
+ + ... + Il 1
... ... • 1+ ItL-Y'
... t 04-
~.
~~ t+ •
++ +
SC\Jle L~ __ -'
.... ...... -+- --t-- --+-- --- -+--- --1- -f--o --f--- -)l. ~ / / / ~ ~ ... ... ... }t )( ~ .x" / X • • Il • Il If ~ ... ,If • .. ... ... ... .,. t t .,. ... • ... .,. Il +
160 mm Cone. Stress LI __ -' 10 MPa
(a) Distribution of Principal Concrete Stresses
1 t • • • .. + + + +
• -- • , , , ,
'" • \+ \
" -- • • • % .Ir ~ '\ \ \ ~ .. .. 1> '" '\ --. of. -.-. ~
.,. ... .,. ... .,. + -..... ... L ~
160 mm Conc. Strain LI __ -'
(b) Distribution of Principal Concrete Strains
1 • • • ... • • 1 1
... 1 1
+ ... ...
160 mm
1 • t + +
1 • ... • t
1 ... ... • t 1 ... ... + -t-
... ... ... -1- +
Steel Strain (C) Steel Strains
+
+ 1
+ t ---
-+-- .
-3 2 x 10
+
r -=t---
1
-------1 .
-3 2 x 10
i
Figure 5.8 Results of the Computer Analysis for Specimen D-1R.
111
f-
-
-
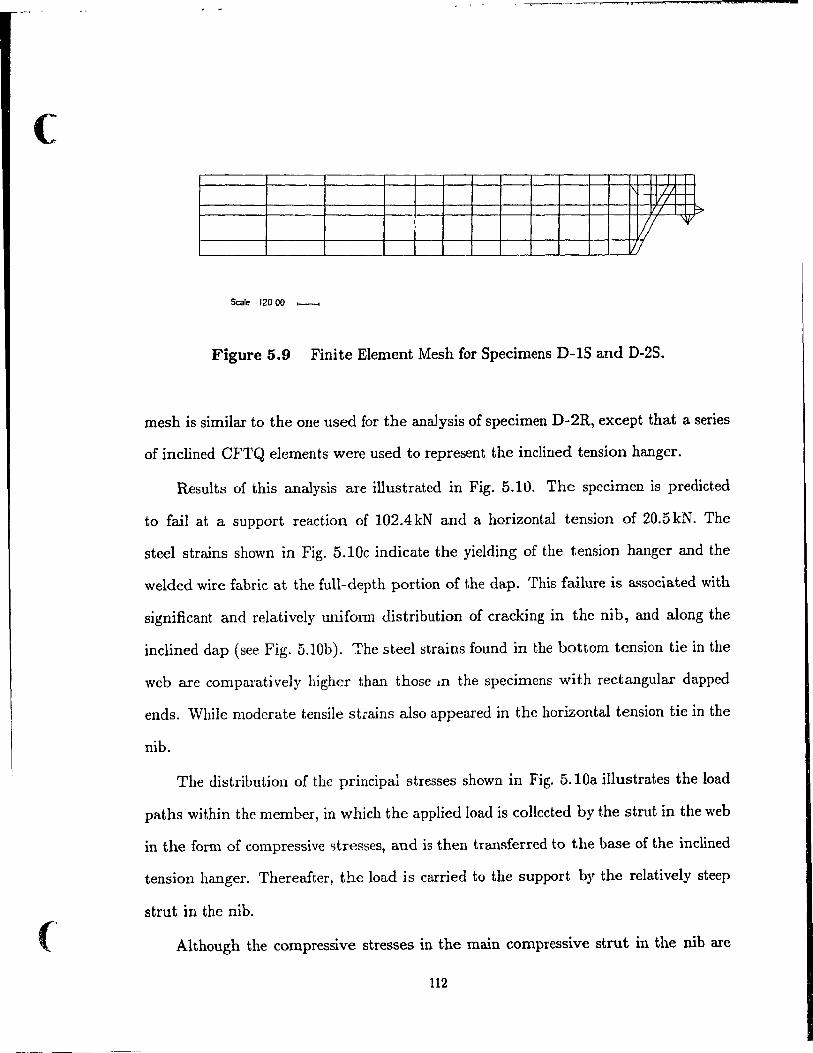
(
/ VI 'j ~
1 1/ i 1//
Scale 12000 --..
Figure 5.9 Finite Element Mesh for Specimens D-1S and D-2S.
mesh is similar to the one used for the analysis of specimen D-2R, except that a series
of inclined CFTQ elements were used to represent the inclined tension hanger.
Results of this analysis are illustrated in Fig. 5.10. The specimen is predicted
to fail at a support reaction of l02.4kN and a horizontal tension of 20.5kN. The
steel strains shown in Fig. 5.10c indicate the yielding of the tension hanger and the
welded wire fabric at the full-depth portion of the dap. This failure is associated with
significant and relatively unifonn distribution of cracking in the nib, and along the
inclined dap (sec Fig. 5.10b). 'l'he steel strains found in the bottom tension tie in the
web are comparatively highcr than those ln the specimens with rectangular dapped
ends. While moderate tensile strains also appeared in the horizontal tension tie in the
nib.
The distribution of the principal stresses shown in Fig. 5.10a illustrates the load
paths within the member, in which the applied load is colleded by the strut in the web
in the form of compressive stresses, and is then transferred to the base of the inclined
tension hanger. Thereafter, the load is carried to the support by the relatively steep
strut in the nib.
Although the compressive stresses in the main compressive strut in the nib are
112
-
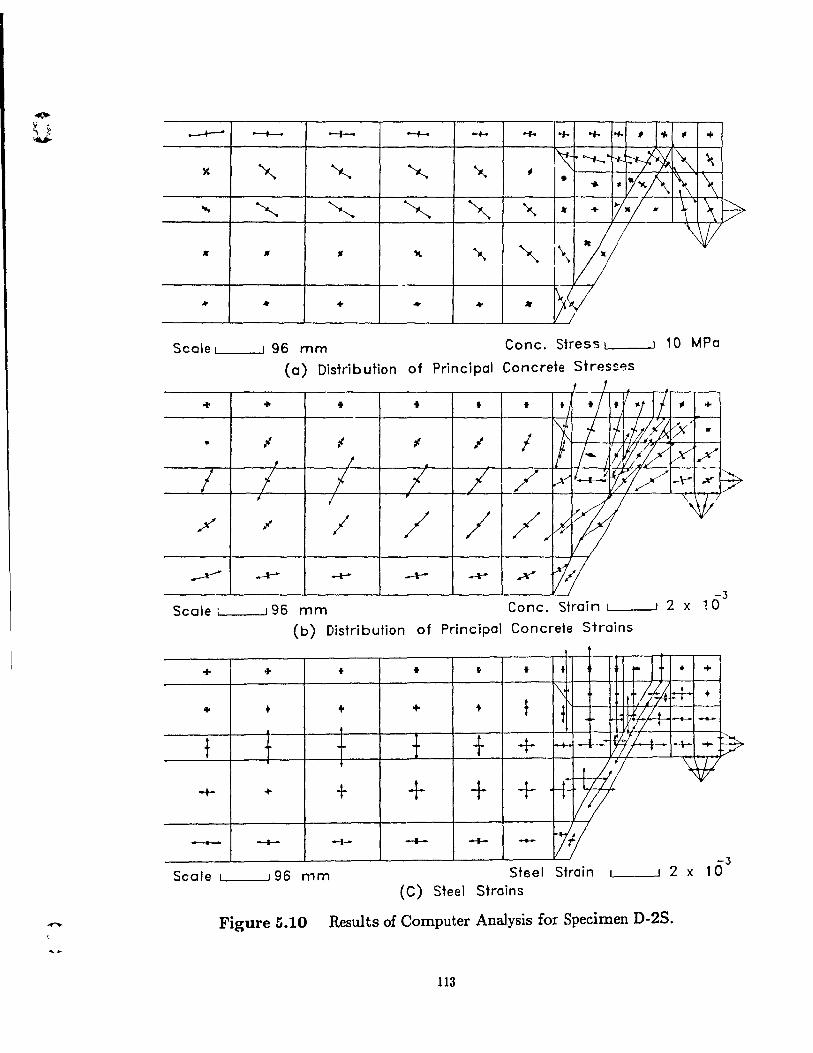
...-+--" --+- ---f- -f- -.... ..... ~ ~ ..,. , I~ # of.
)( ~ ~ ~ ~ ""--1-.... t--t-: ~ >\ \ ~ - " 'Ii~\ I~ '\ ...
... "- ~ ~ "--" ~ .t + 11-1 • ~ \ t7 Il • • ~ ... ~ 1\ lï5 W
- ----: .. ... ... ... ... "" Scale <-1 _----JI 96 mm Conc. StresSl L-_--.-J 10 MPa
(a) Distribution of Principal Concrete stresses
/ / ~ --t-"' -P --t-
Scale 1 196 mm (b) Distribution of
+ + t •
• + + +
t t l- f ..- + + +
----- -- -t- -t-
Scale ,-1 _----J196 mm
--P ..x'"
-3 Conc. Strain 1 2 x 10
Principal Concrete Strains
1
+
+ + ----
t f ~ It + +
"" ~/M :+ +
t f ~/ /1 '1 1 -- ---
+ t-+- -!f-.-- 71-+- -t- -t7
+ ~ W ~ -- 11/
-3 Steel Strain ,-1 _------"1 2 x 10
(C) Steel Strains
Figure :i.10 Results of Computer Analysis for Specimen D-2S.
113
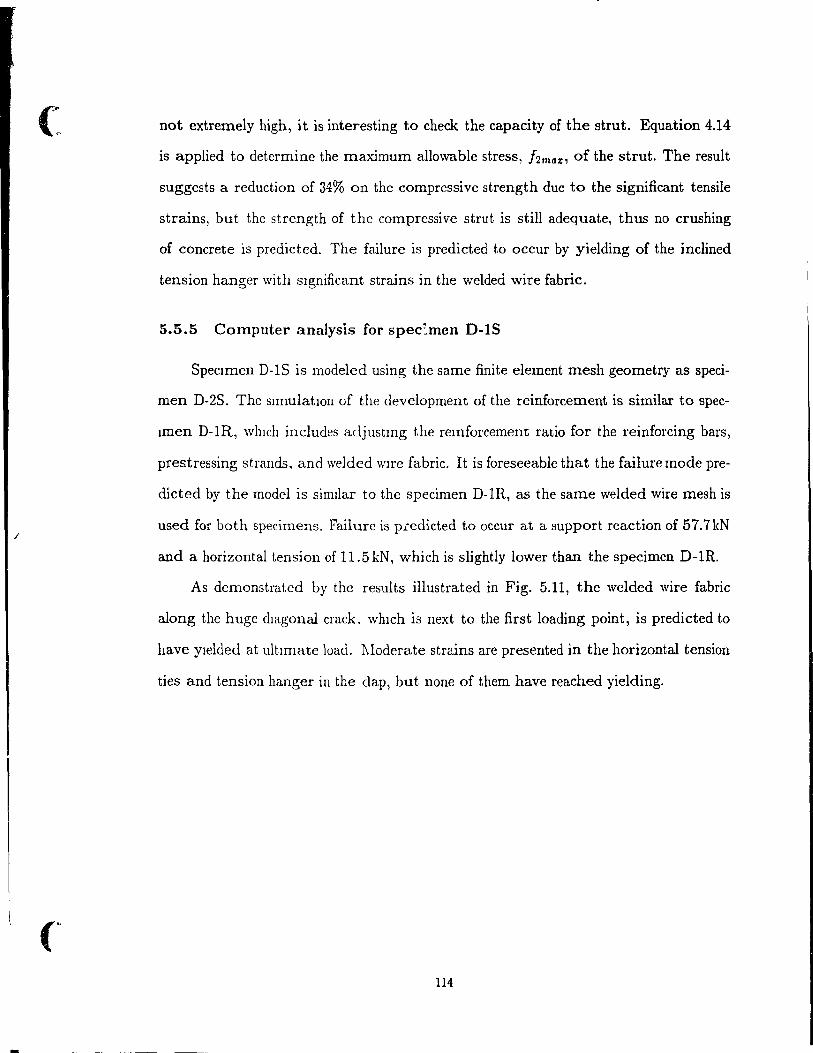
(.
1
not extremely high, it is interesting to check the capacity of the strut. Equation 4.14
is applied to determine the maximum allowable stress, hmax, of the strut. The result
suggests a reduction of 34% on the compressive strength due to the significant tensile
strains, but the strength of the compressive strut is still adequate, thus no crushing
of concrete lS predicted. The failure is predicted ta occur by yielding of the inclined
tension hanger with slgnificant strains in the welded wire fabric.
5.5.5 Computer analysis for spec:'men D-1S
SpecImen D-IS is modeled using the same finite element mesh geometry as speci
men D-2S. The sImulatIOn of the development of the reinforcement is similar to spec
Imen D-lR, whlch includes adjustmg the remforcement ratio for the reinforcing bars,
prestressing strands. and welded WIre fabric. It is foreseeable that the failure mode pre
dicted by the model is simllar to the specimen D-IR, as the same welded wire mesh is
used for both specimens. Failure is prcdicted to occur at a support l'eaction of 57.7kN
and a horizontal tension of 11.5kN, which is slightly lower than the specimen D-lR.
As demonstrated by the results illustrated in Fig. 5.11, the welded wire fabric
along the huge diagonal crack. whIch is llext to the first loading point, is predicted to
have Ylelded at ultJmate load. 1\loderate strains are presented in the horizontal tension
ties and tension hanger in the dap, but none of them have reached yielding.
114
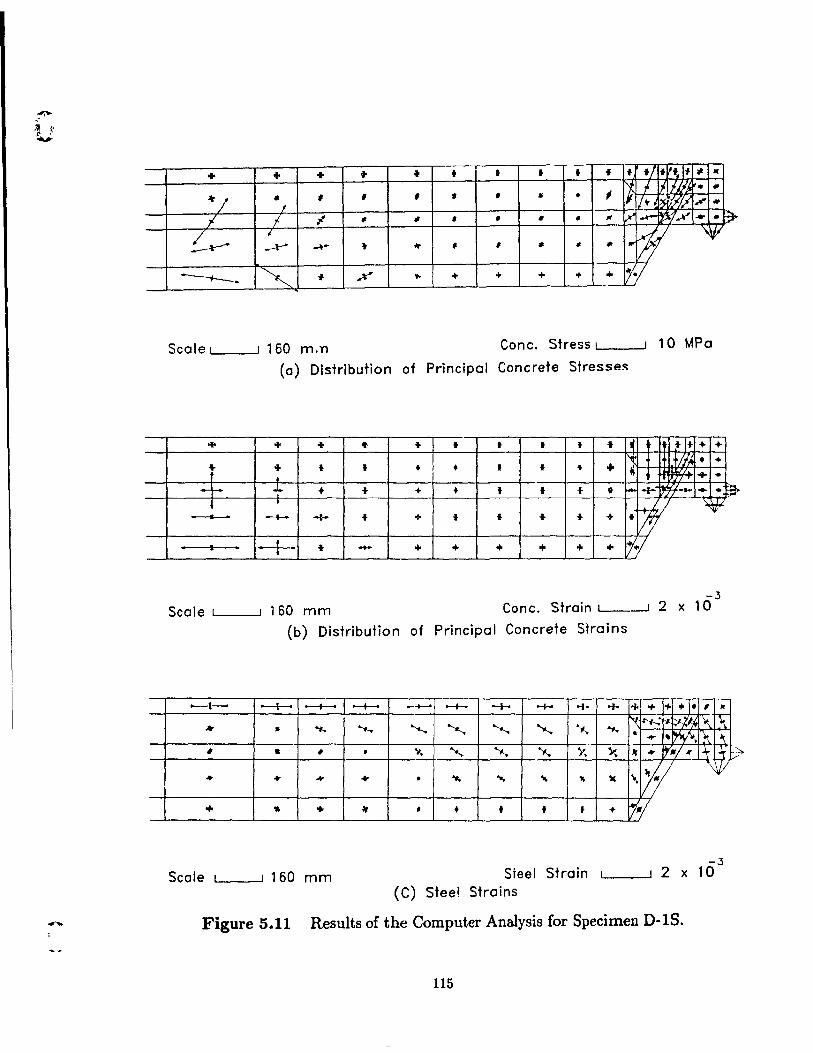
.......
+
~/
+ +
" , 1
, , 1 1 1 1
, • o
• • •
" 1 ".w \V'
--+--~------.-4~~---+---*~~~--~---~~--+--+--+--+--+--+-+~--+-+i-~)ILf
Scate 1....1 _---' 160 m.n Cone. Stress L..I _.--J 10 MPa
(a) Distribution of Principal Concrete Stresse!';
+ + + ... ... t , 1 t • ~ t +1'- + +
r + f- I ~ t ';/~ . .. • • 1 1 4 + • f '9'+ + •
+ + + + + • f 1 1 1 ....... ~ ..... ... -;;:. ~ t
·tf ~ ------- --- 04- 1 + 1 1 f- f- +
. 1 . -+-- • .... + + + + + + Iii
-3
Seale ,-1 _---' 160 mm Cone. Strain L..-~ 2 x 10
(b) Distribution of Principal Concrete Strains
-t- --i--o --+-- --t-
... • ..,. "f.,
# " • •
.. .. .... +-
... " ... #r
Seale L-I _---'1 160 mm
.........- ---i- -l- -+- ... ~ ~ ~ ~ ~
y. '" ~ ~ X
• .", ... " ~
, • • • f
Steel Strain (C) Steel Strains
...
.,.,.
~
1(
+
.,. '*' .,. ·1- , •
N ~-.. ~N'A 1 \', ~ . .... .~ "\ -~
" ... ~./ .... . 1- IJ(
\1# '0JI
R
-3 2 x 10
Figure 5.11 Results of the Computer Analysis for Specimen D-lS .
115
~
(
CHAPTER 6
Comparison of Experimental Results and Theoretical Predictions
6.1 Introduction
In the previous two chapters, the response of the test specimens were predicted
using the "strut-and-tie" model and the fini te element program FIELDS. In this chap
ter, the analytical results are compared with the actual responses of the test specimens
in or der to assess the accuracy of the above mentioned models. The experimental
and predicted failure load and the failure mode of each specimen are summarized in
Table 6.1.
6.2 Specimen D-IR
The failure of the specimen D-l R was caused by the yielding of the welded wire fab
ric, which occurred beneath the first loading point at a support reaction of 60.3 kN (all
failure loads reported in this chapter include the self-weight of the specimen, 6.3 kN).
As indicated in Table 6.1, both the "strut-and-tie" model and the computer model have
predicted the failure of the welded wire fabric with very good accuracy. The failure
load provided by the computer model is 64.5kN, which is 107% of the experimental
failure load. The failure load predicted by the "strut-and-tie" model is 57.8kN, that is
96% of the actual failure load.
116
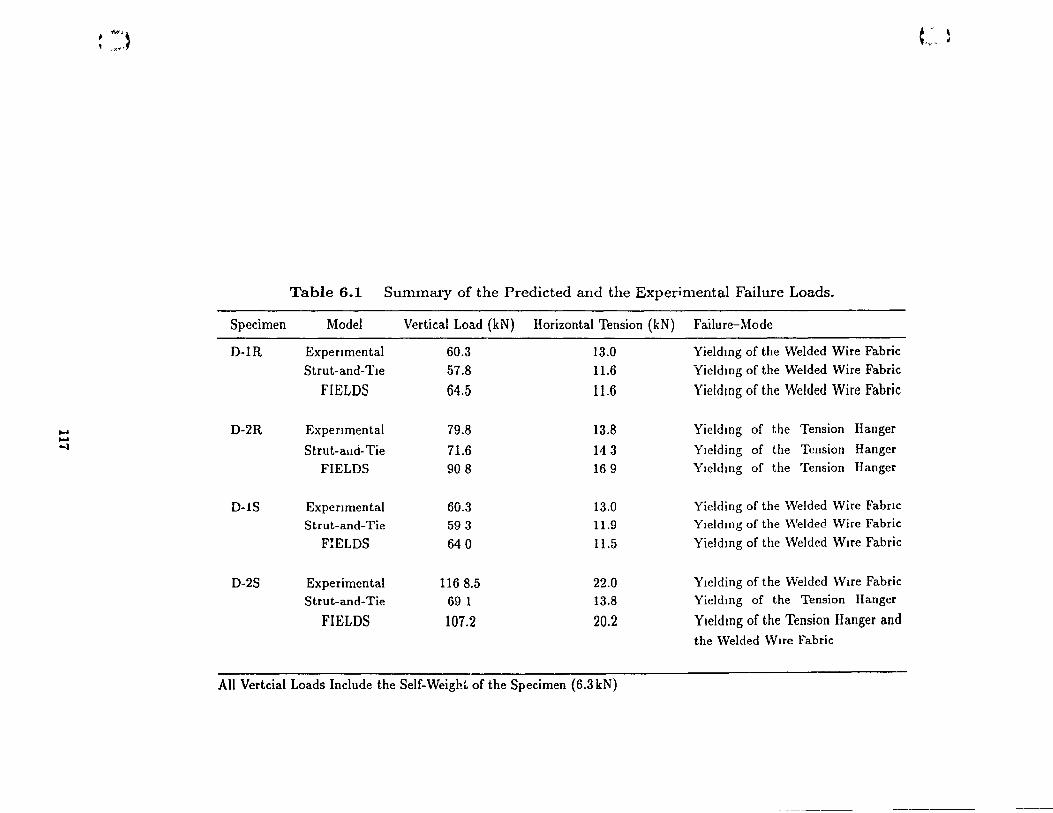
~ ~
'1
.... '\ "-,,,f L .
Table 6.1 Summary of the Predicted and the Experimental Failure Loads.
Specimen Model Vertical Load (kN) Horizontal Tension (kN) Failure-Mode
D-IR ExperImentai 60.3 13.0 Yieldmg of the Welded Wire Fabric
Strut-and-Tie 57.8 11.6 Yieldmg of the Welded Wire Fabric
FIELDS 64.5 11.6 YieldlOg of the Welded Wire Fabric
D-2R ExperImental 79.8 13.8 Yieldmg of the Tension Hanger
Strut-aild-Tie 71.6 143 Ylelding of the Tellsion Hanger
FIELDS 908 169 Yleldmg of the Tension Hanger
D-1S ExperImental 60.3 13.0 Yielding of the Welded Wire Fabnc
Strut-and-Tie 593 11.9 Yleldmg of the \Velded \-Vire Fabric
FIELDS 640 11.5 Yieldmg of the Welded WIre Fabric
D-2S Experimental 1168.5 22.0 YIelding of the Welded Wlre Fabric
Strut-and-Tie 69 1 13.8 Yieldmg of the Tension Hanger
FIELDS 107.2 20.2 YJeldlOg of the Tension Hanger and
the Welded Wlre Fabric
AlI Vert cial Loads Include the Self-Weigh~ of the Specimen (6.3kN)
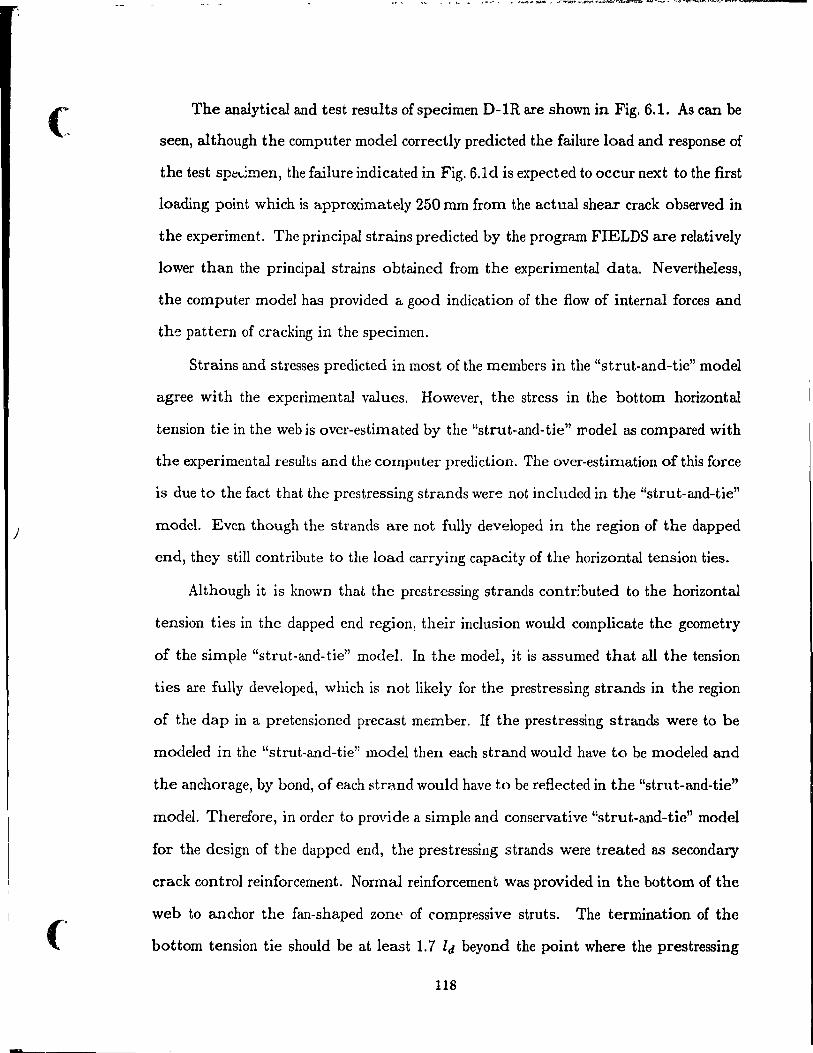
(
)
The analytical and test results of specimen D-IR are shown in Fig. 6.1. As can be
seen, although the computer model correctly predicted the failure load and response of
the test spedmen, the failure indicated in Fig. 6.1d is expected to occur next to the first
loading point which is approximately 250 mm from the actual shear crack observed in
the experiment. The principal strains predicted by the program FIELDS are relatively
lower than the principal strains obtained from the experimental data. Nevertheless,
the computer model has provided a good indication of the flow of internal forces and
the pattern of cracking in the specimen.
Strains and stresses predicted in most of the members in the "strut-and-tie" model
agree with the experimental values. However, the stress in the bot tom horizontal
tension tie in the web is over-estimated by the "strut-and-tie" wodel as compared with
the experimental results and the computer prediction. The over-estimation of this force
is due to the fact that the prestressing strands were not included in the "strut-and-tie"
mode!. Even though the strands are not fully developed in the region of the dapped
end, they still contribute to the load carrying capacity of the horizontal tension ties.
Although it is known that the prestressing strands contr:buted to the horizontal
tension ties in the dapped end region, their inclusion would complicate the geometry
of the simllle "strut-and-tie" model. In the model, it is assumed that all the tension
ties are full y developed, which is not likely for the prestressing strands in the region
of the dap in a pretensioned precast member. If the prestressing strands were to be
modeled in the "strut-and-tie" model then each strand would have to be modeled and
the anchorage, by bond, of each strand would have to be reflected in the "strut-and-tie"
mode!. Therefore, in order to provide a simple and conservative "strut-and-tie" model
for the design of the dapped end, the prestressing strands were treated as secondary
crack control reinforcement. Normal reinforcement was provided in the bottom of the
web to anchor the fan-shaped zont' of compressive struts. The termination of the
bot tom tension tie should be at least 1.7 ld beyond the point where the prestressing
118
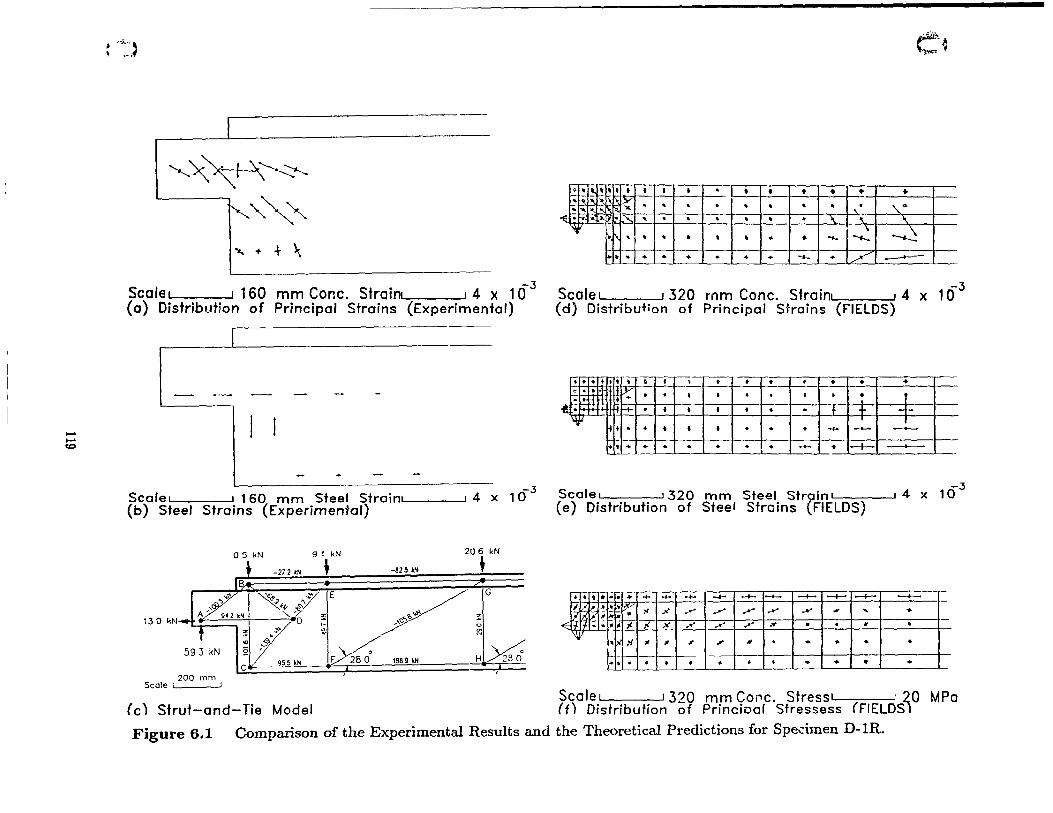
.... .... <0
j .-"",
\ ~.1
,,~~-+-\~~
~",~" ... + + ~
-3 Scale 1 1 160 mm Cane. Sfrainl 1 4 x 10 (a) Distribution of Principal Sfrains (Experimental)
--
-3 Scale' 1 160 mm Steel Strainl 1 4 x 10 (b) Steel Strains (Experimental)
05 kN 91 kN
-272 IN • ~d>g .~/ lE
'«,j- ~y
130 kN t"-- .. nï "?o ~ l • ~~ ~
593 kN
200 mm Scale
~
"'1 :-,<\ ê " c 955 'N
(c) Strut-and-Tie Model
F/28 0°
206 kN
-82 5 l~ • - .. /IG / i.
1889 kN Hl~
_~-'1. - ~ ~ .... ~ .. "' 1
, , • , ~ ~ · ~
, ... " '. , i • '" '" -1 ...
, , · • · · · • · · · , • • , , .. .. .. ..
e~
• • • • • • • • · ,'" 1
• · ~ "- "-" -:i .. • .... --..
.. -- + 1/ ~ 1
-3 Scale' 1 320 mm Cane. Sfrainl 1 4 x 10 (d) Distribution of Principal Stroins (FIELDS)
-,--.... + ... t .. • • , r---o • • • • • + ~ ... -1=1~ IP · · • • • · • 1 t . ffif!. . ... : . ..... · f • • • • · t + + ~ '1 ... . .. • • • .. .. .. of- .....- ~
+ ... .. .. .. .. .. . .. -... + -+-- -----3
Scale l '320 mm Steel Strain 1 1 4 x 10 (e) Distribution of Steel Strains (FIELDS)
.r.T'h'.'.' ... 1 ... 1 ... 1 ..... -f- 1 -+- 1-.- -- -+--1-..-. -f---
I%Rhl*f.I" l.of 1/ /1/1/ -'" '" " oEf,rr7[~;-jOf,i1 ]l [ ,0/ 1 x .... ...- 1 .... l.v
~ 'l>{1 .>l l " l " ... .JI 1 • .. " -~--~1~~~~-4--+--+--~-r----;-
""tl • ( • 1 • 1 1 • • ..
Scarel 1320 mm COI''Ic. Stress i 1 20 MPa (f) Distribution of Princiool Stressess (FIELDSl
Figure 6.1 Comparison of the Experimental Results and the Theoretical Predictions for Specimen D-IR.
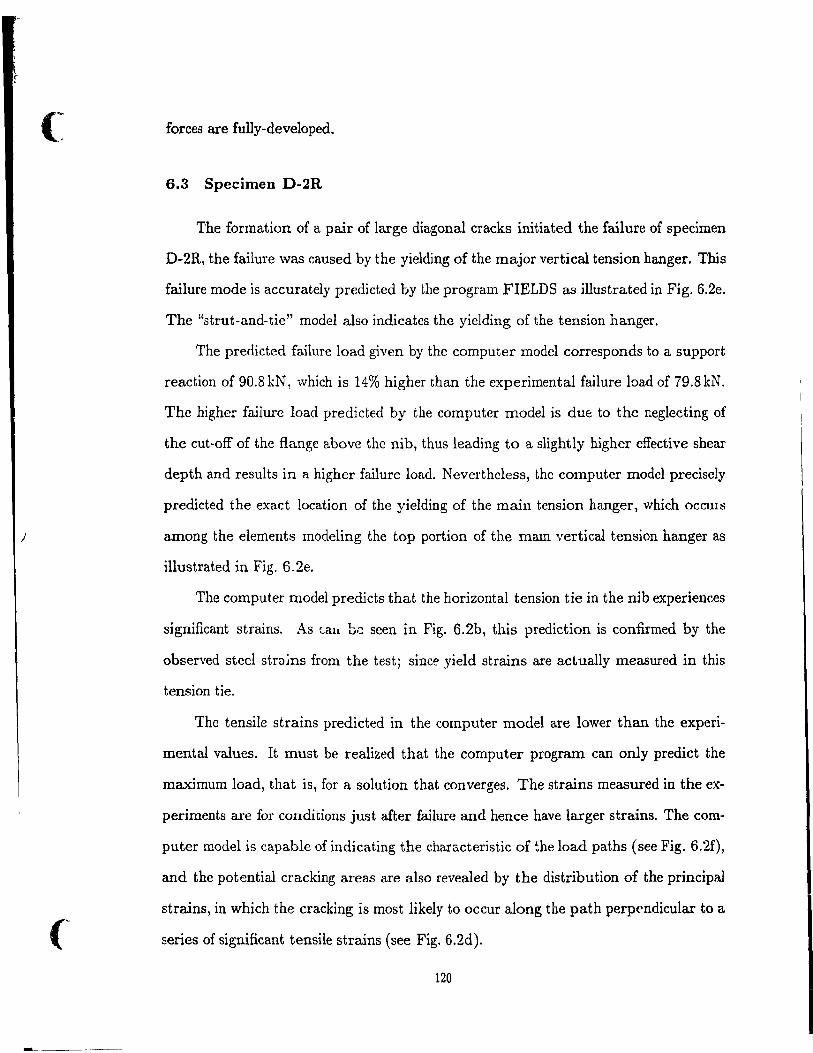
)
(~
forces are fully-developed.
6.3 Specimen D·2R
The formation of a pair of large diagonal cracks initiated the failure of specimen
D-2R, the failure was caused by the yielding of the major vertical tension hanger. This
failure mode is accurately predicted by the program FIELDS as illustrated in Fig. 6.2e.
The "strut-and-tie" model aiso indicates the yielding of the tension hanger.
The predicted failure load given by the computer model corresponds ta a support
reaction of 90.8kN, which is 14% higher than the experimental failure bad of 79.8kN.
The higher failure load predicted by the computer model is du€: to the neglecting of
the eut-off of the fiange above the nib, thus leading to a slightly higher effective shear
depth and results in a higher failure load. Nevertheless, the computer model precisely
predicted the exact location of the yielding of the main tension hanger, which OCCUIS
among the elements modeling the top portion of the mam vertical tension hanger as
illustrated in Fig. 6.2e.
The computer model predicts that the horizontal tension tie in the nib experiences
significant strains. As (ah hG seen in Fig. 6.2b, this prediction is confirmed by the
observed steel strajns from the test; sine!." yield strains are actually measured in this
tension tie.
The tensile strains predided in the computer mode! are lower than the experi
mental values. It must be realized that the computer program can only predict the
maximum load, that is, for a solution that converges. The strains measured in the ex
periments are for conditions just after failure and hence have larger strains. The com
puter model i5 capable of indicating the characteristic of the load paths (see Fig. 6.2f),
and the patential cracking areas are also revealed by the distribution of the principal
strains, in which the cracking is most likely to accur along the path perp('ndicular ta a
series of significant tensile strains (see Fig. 6.2d).
120
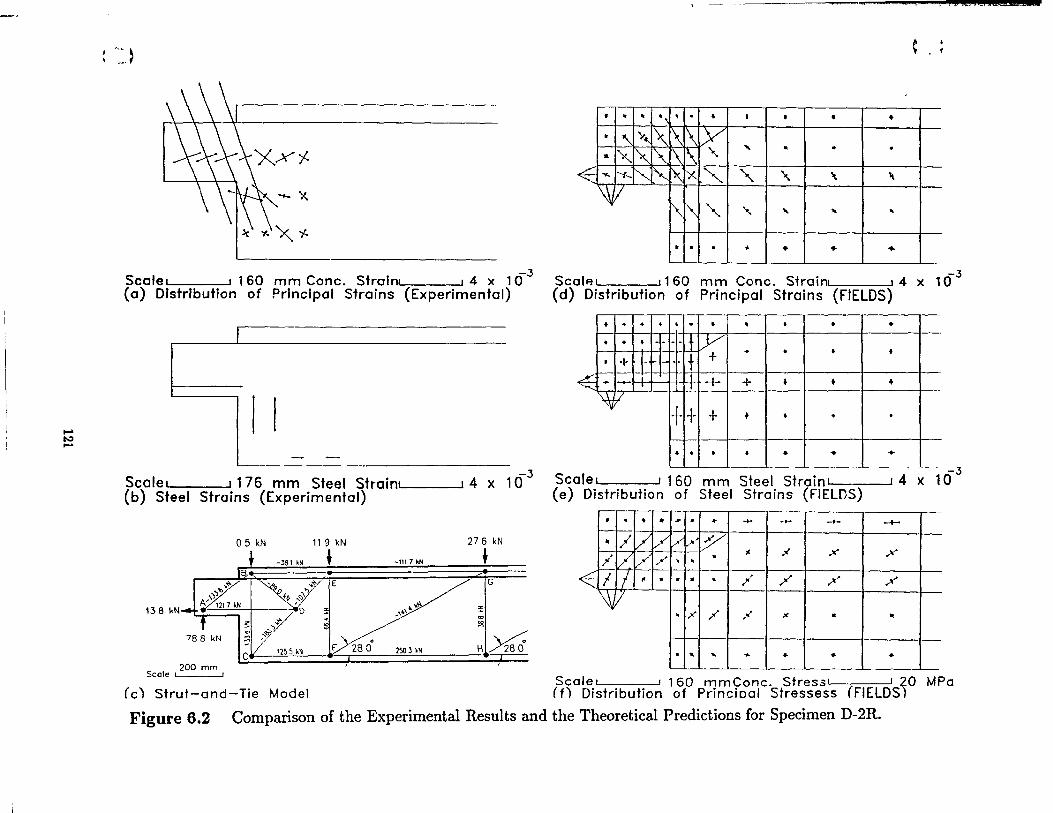
~ ~ ....
' .. ) (
· - · " · . • • • • •
· "'-Y..., 1\ r\ 1\ Y · · ~ 1" r\ 1\ "'- " ..
.~ ,-
" l' rç: C'" ""--1- rx "'- " '\ \ , ~r/
r'\ ['\ ""- "'- " " ..
• • · .. • + .. -
-,3 Scale! ! 160 mm Conc. Strain! ! 4 x 10 (a) Distribution of Principal Strains (Experimental)
-,3 Scalp.! ! 1 60 mm Conc. Strain ! 4 x 10 (d) Distribution of Principal Strains (FIELDS)
• • • • , · • , , • • • + • .. =~ ~ + · · 1 1
1 • .,. t - .. ~ i J + + f • +
~
, 1 ~/' ++ + + • • ·
+ · · • + + +
-3 Scale 1 1 176 mm Steel Sftain! ! 4 x 10 (b) Steel Strains (Experimental)
-,3 Scale! ! 160 mm Steel Strain L----.J 4 x 10 (e) Distribution of Steel Stroins (FIELDS)
* . • Ir ... · ... .... -... ->- ...f- I
05 kN 11 9 kN
+ 276 kN
+ .. / /' [/ V ~' Y l- .e ;~ x- X" ;1 V l--"" / • • ..
/1 ... ~ ... , .. ,,, ; 138 kN
::::1 1 ~ . . • · l' ,
/ / /
~V .;< / ,-' )t • •
:"i
'25 5 .~ 250) IN HI~ · " .. ... + + • Sco!e ! 200 mm
. Scale! ! 160 mmConc. stress! ! 20 MPo (c) Strut-and-Tle Madel (f) Distribution of Princioal Stressess (FIELDS)
Figure 6.2 Comparison of the Experimental Results and the Theoretical Predictions for Specimen D-2R.
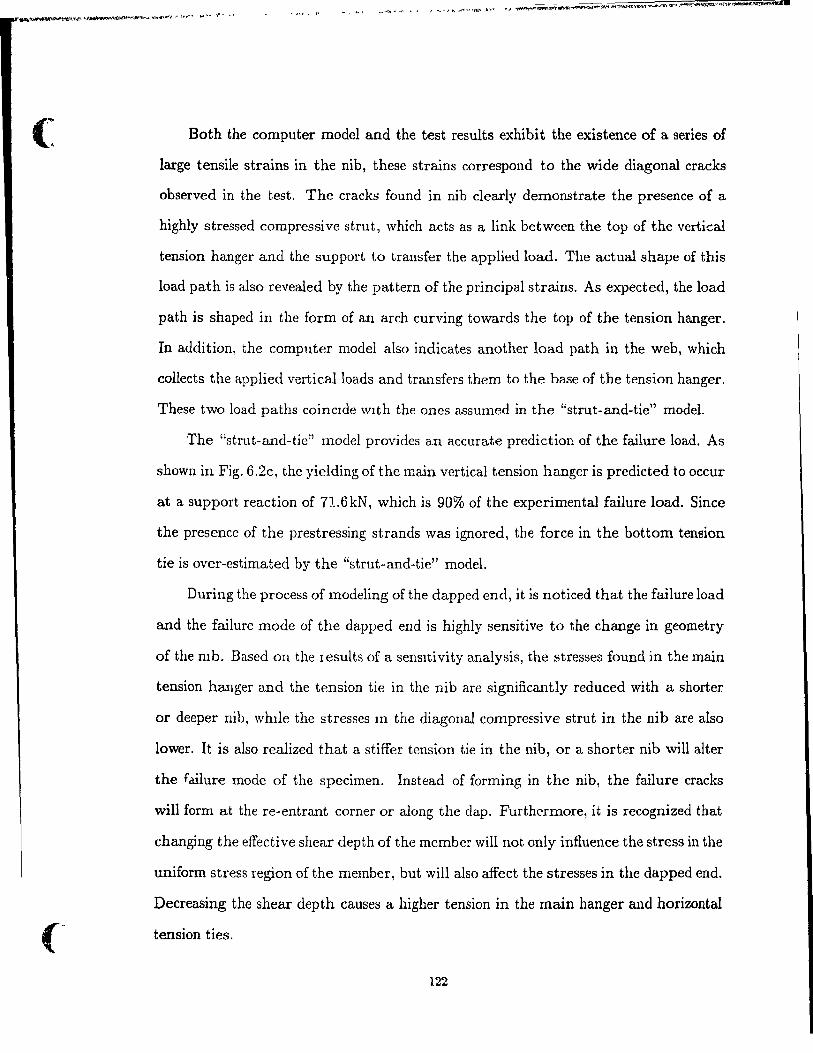
( Both the computer model and the test results exhibit the existence of a series of
large tensile strains in the nib, these strains correspond to the wide diagonal cracks
observed in the test. The cracks found in nib clearly demonstrate the presence of a
highly stressed compressive strut, which acts as a link between the top of the vertical
tension hanger and the support to transfer the applied load. The actual shape of this
load path is also revealed by the pattern of the principal strains. As expected, the load
path is shaped in the form of an arch curving towards the top of the tension hanger.
In addition, the computer model also indicates another load path in the web, which
collects the applied verticalloads and transfers them to the base of the tension hanger.
These two load paths coïnCIde \VIth the on es assumed in the "strut-and-tie" model.
The "strut-and-tie" model provides an accurate prediction of the failure load. As
shown in Fig. 6.2c, the yielding of the main vertical tension hanger is predicted to occur
at a support reaction of 7L6kN, which is 90% of the experimental failure load. Since
the presence of the prestressing strands was ignored, the force in the bottom tension
tie is over-estimated by the "strut-and-tie" model.
During the process of modeling of the dapped end, it is noticed that the failure load
and the failure mode of the dapped end is highly sensitive to the change in geometry
of the mb. Based on the results of a sensltivity analysis, the stresses found in the main
tension hanger and the tension tie in the nib are significantly reduced with a shorter
or deeper nib, whIle the stresses III the diagonal compressive strut in the nib are aiso
lower. It is also realized that a stiffer tension tie in the nib, or a shorter nib will alter
the failure mode of the specimen. Instead of forming in the nib, the failure cracks
will form at the re-entrant corner or along the clap. Furthermore, it is recognized that
changing the effective shear depth of the member will not only influence the stress in the
uniform stress region of the member, but will also affect the stresses in the dapped end.
Decreasing the shear depth causes a higher tension in the main hanger and horizontal
tension ties.
122
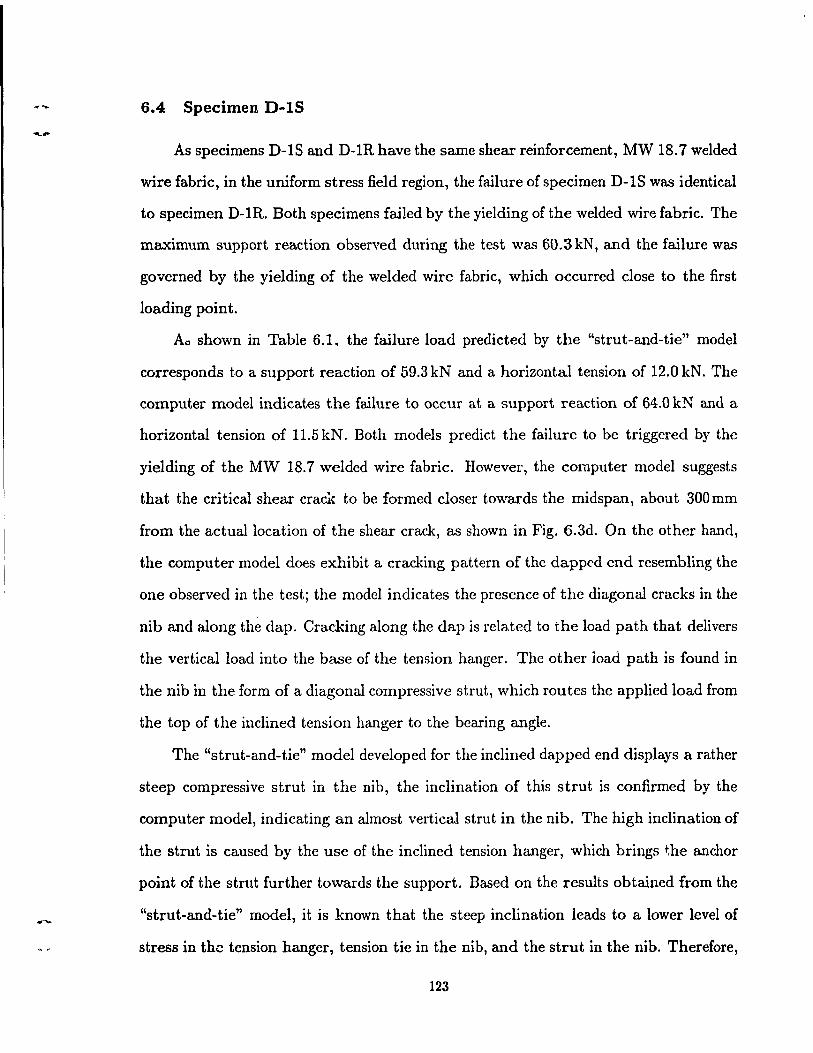
6.4 Specimen D-lS
As specimens D-1 S and D-1R have the same shear reinforcement, MW 18.7 welded
wire fabric, in the uniform stress field region, the failure of specimen D-1S was identical
to specimen D-1R. Both specimens failed by the yielding of the welded wire fabric. The
maximum support reaction observed during the test was 60.3 kN, and the failure was
governed by the yi el ding of the welded wire fabric, which occurred close to the first
loading point.
A" shown in Table 6.1. the failure load predicted by the "strut-and-tie" model
corresponds to a support reaction of 59.3 kN and a horizontal tension of 12.0 kN. The
computer model indicates the failure to occur at a support reaction of 64.0 kN anù a
horizontal tension of 11.5 kN. Both models predict the failure to be triggered by the
yie1ding of the MW 18.7 welded wire fabric. However, the computer model suggests
that the critical shear crack to be formed closer towards the rnidspan, about 300 mm
from the actuallocation of the shear crack, as shown in Fig. 6.3d. On the other hand,
the computer model does exhibit a cracking pattern of the dappeù end resembling the
one observed in the test; the model indicates the presence of the diagonal cracks in the
nib and along the dap. Cracking along the dap is related to the load path that delivers
the vertical load into the base of the tension hanger. The other load path is found in
the nib in the form of a diagonal compressive strut, which routes the applied load from
the top of the inclined tension hanger to the bearing angle.
The "strut-and-tie" model developed for the inclined dapped end displays a rather
steep compressive strut in the nih, the inclination of this strut is confirmed by the
computer model, indicating an almost vertical strut in the nib. The high inclination of
the strut is caused by the use of the inclined tension hanger, which brings t,he anchor
point of the strut further towards the support. Based on the results obtained from the
"strut-and-tie" model, it is known that the steep inclination leads to a lower level of
stress in the tension hanger, tension tie in the nib, and the strut in the nib. Therefore,
123
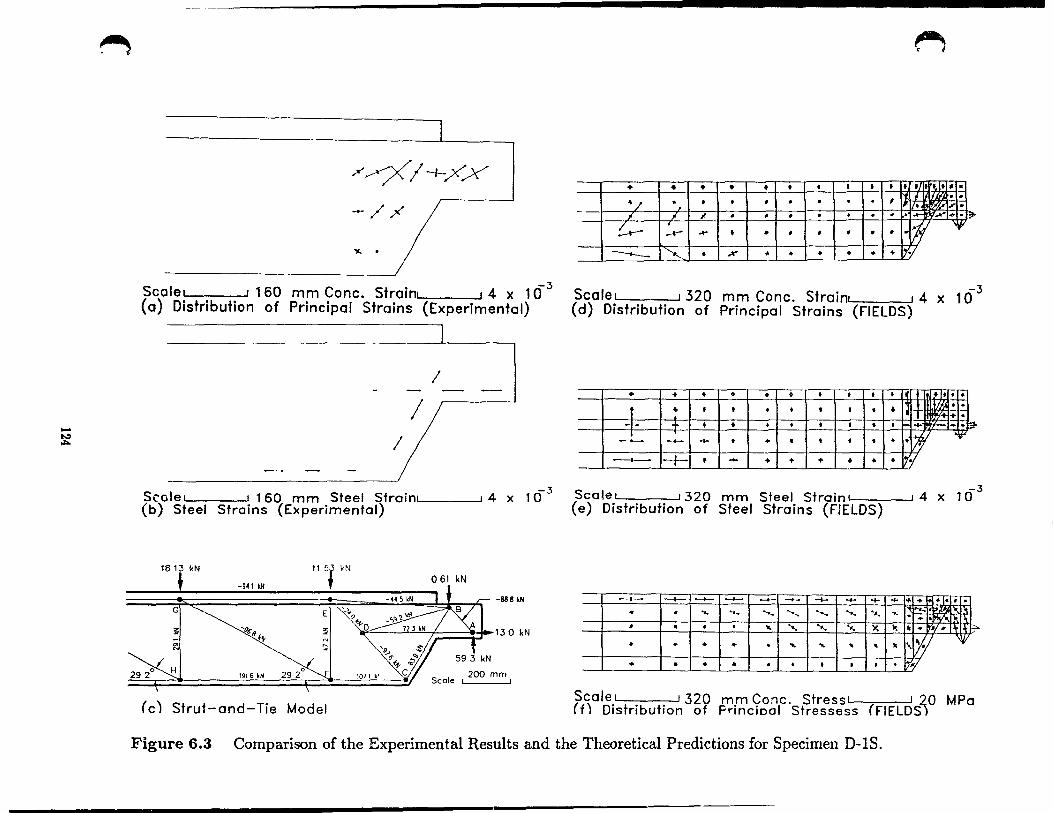
.... ~
""
~ ~
+ + • • • • • 1 1 t 1 ïI f Ü' -. "/ " • • • · · · · 1 'f.7 .fFJ · .
• IW' .... .... - 7" ~ " · , • · · · · I~ ..... .. J;t.
?--,
I.:~ Vi ~ ..... t "
, • • • • ,..
------ ~. • .X' .. + + + • ~~i -
-3 Scale. , 160 mm Cone. Sfrain. • 4 x 10 (0) Distribution of Principal Sfrains (Experimental)
-3 Scola. , 320 mm Cone. Sirainl , 4 x 10 (d) Distribution of Principal Strains (FIELDS)
/ + + + • • • • • • • t •• • •
/ t • t t • 1 1 + it W · . • • J ~ + •
+ + 1 • • • 1 1 1 • .... - ··3
/ -!- -- ..... • + • • • • • 'lir ~
-t--- --+1 t - • • • + + • ~.;
-3 Scole. , 160 mm Steel Sirain' , 4 x 10 (b) Steel Strains (Experimental)
-3 Scala. , 320 mm Steel Strain. , 4 x 10 (e) Distribution of Steel Strains (FIELDS)
1813 kN
t -941 kN 061 kN
~ _ 8 ft g:
-88 8 kN
~ "H"j, ~;-1.3 0 kN
--+- -t- -t- -<- -- -+- -f- ..... .... + ... + + • , •
... -.... '0.... ....... -... .... "-Ii'<:: ~ ... · ..... . .. ;~n;:
• • • · ... .... .... .... ~ lt - ...
'''of'' Il,. I? ... ... .. ... · ... ... " " • 'lil
292°~1 '916 !tH Scale 200 mm
+ -1..-- • .. · • • • • -@ --
(c) Struf-and-Tie Model Scale. 1320 mm Cane. Stress' '?O MPa (t) Distribution of Princiool Stressess (FIELDS)
Figure 6.3 Comparison of the Experimental Results and the Theoretical Predictions for Specimen D-IS.

the inclined tension hanger arrangement is more favourable than the vertical stirrups
used in rectangular dapped ends since a smaller amount of reinforcement is required
for the reinforcement scheme of inclined dapped ends.
6.5 Specimen D-2S
As shown in Fig. 6Ae, the computer model of specimen D-2S indicates the failure
of specimen D-2S is governed by both the incJined tension hanger and the welded
wire fabric. The failure is predicted to occur at a support reaction of 107.2 kN and a
horizontal tension of 20.2 kN with the yielding of the inclined tension hanger and welded
wire fabric. The actual failure load observed in the test of specimen D-2S corresponds
to a support readion of 116.8 kN and a horizontal tension tension of 22 kN, which was
induced by the yielding of the welded wire fabric un der the first loading point.
The difference in the experimental failure load and the predictcd failure load pro-
vided by the computer mode! is 8%. The location of the critical diagonal shear crack
predicted by the computer model is quite close to the actual one observed in the test;
the predict shear crack is approximately 100 mm from the observed crack. As the
strength of the inclined tel.sion hanger wa..c;; enhanced by the misplacement of the ten
sion tie in the nib, this delayed the yielding of the tension tie until close t.o failure of
the specimen. The finite clement model, which did not include this misplacement of
steel predicts yielding of the tension hanger at a smaller load than that experienced in
the test.
In addition, the computer model correctly predicts the formation of a series of
short vertical flexural bond cracks along the bottom of the web. The existence of these
cracks are demonstrated by the series of horizontal tensilc strains found in the bottom
layer of \~lements in the computer modeL This pattern of cracking was identical to the
one observed in the test prior to the failure of the specimen.
Two dir.tinct load paths are found in the dapped end. As can be seen in the pattern
125
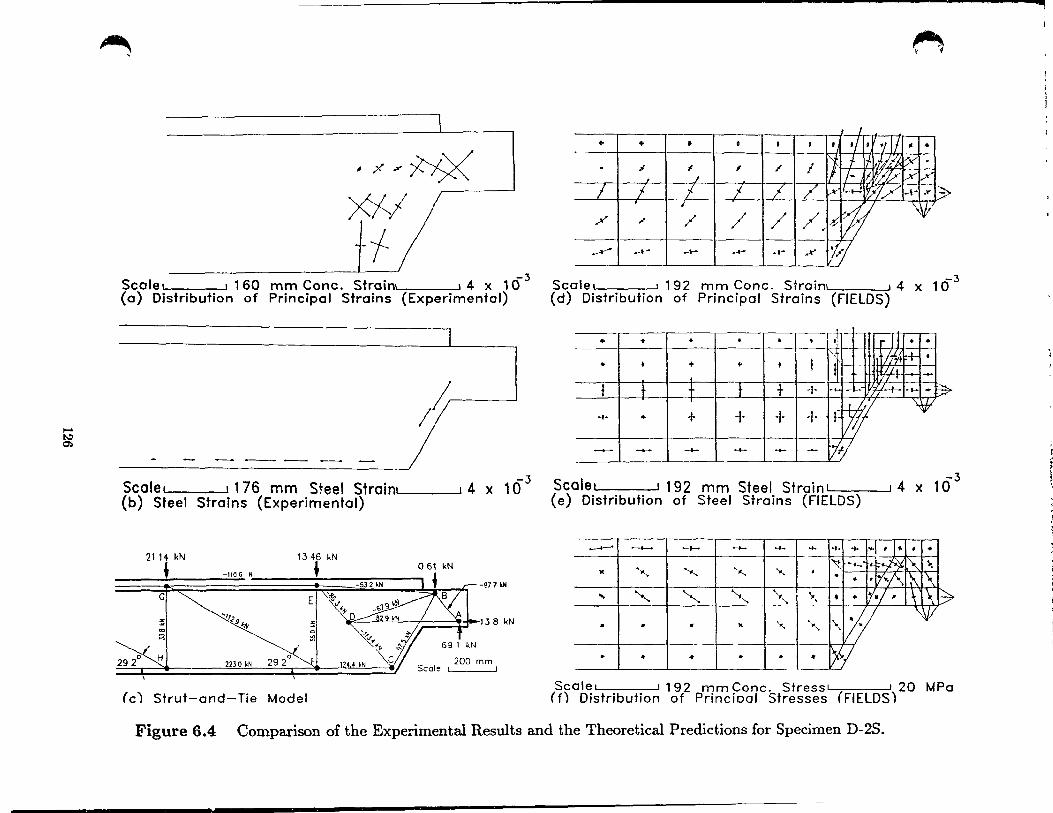
..... t-' 0)
~ ,
,;<x~ #/ ,.-------'
1
f -3
Scale. .160 mm Conc. Sfroin\ \ 4 x 10 (a) Distribution of Principal Strains (Experimental)
/!
-3 Scalel ! 176 mm Steel Straint 1 4 x 10 (b) Steel Strains (Experimental)
2114 kN 1346 kN
i • 061 kN -1106 N
2r"· :r~. J :=::~''''" "" ::l
292°0 2230 kN 292v~ IZ!! kN YI 200 mm Scale 1 J
(c) Strut-and-Tie Model
--~ --- ----..,
~ V
-3 Scole! 1 192 mm Conc. Strain, ,4 x 10 (d) Distribution of Principal Strains (FIELDS)
+ • •
• + +
t 1 t 1 t t
~ 1--1 • , • r -/l, • , ..
+ + ~1~1~1;;l:I:' ~ -f-
-3 Scalel 1 192 mm Steel Strain 1 1 4 x 10 (e) Distribution of Steel Strains (FIELDS)
...-.-- -- -1- --+- ~ of- a. ... ~ of. , 1" 1 ..
I~ ~-t--. '-jO~ l"\ \ '" '-... "'- ~"-. ..... • .
'Ii'v/\ 1\ \ • ... "- "- " ..... "'-. '., • + I~;; , \ ïI\~
',,- "" ~W ,V! .. . . "
.. ... ... .. . . ~I Scale. • 192 mm Conc. StresSI 1 20 MPa (f) Distribution of Princioal stresses (FIELDS)
Figure 6.4 Comparison of the Experimental Results and the Theoretical Predictions for Specimen D-2S.
j j ~
l
of principal stresses provided by the computer model, due ta the substantial cracking
in the dapped end, the applied load is transmitted ta the support via two concentrated
la ad paths. The first one, which can be found in the web, collects the applied load and
carries the load ta the bottom of the hanger. The second one, which is the compressive
strut in the nib, transfers the load down to the support The substantial cracking in the
dapped end has sigmficantly reduced the tensile streng,th of the concrete between the
cracks. In sorne elements of the computer model tension between the cracks is xeduced
to zero at failure (see Fig. 6.4f).
The "strut-and-tie" modcl predicts the yielding of the main tension hanger to occur
at a support readIOn of a 6~1.1 kN and a horizontal tension of 138 kN. These values
are cOll!',iderably lower than the expenmental failure loads and the ones predicted by
the computer model In the test, yield strams were measured in the inclined tension
hanger at a support reaction of 99.4 kN. The difference in the results provided by the
"strut-and-tie" model and the experimental might be partially due to the enhancement
of strength of the inclined tensIOn hanger caused by the mispla~ement of the horizontal
tension tie in the nib.
6.6 Comments on the Modeling of the Specimens
The "strut-and-tie" model and fini te element program FIELDS are utilized to
predict the response of the test specimens. There are sever al advantages of using the
computer model to predict the response of the specimens. First, the details of the spec
imens are simulated in the model, which include the development and strain hardening
of the reinforcement, the prestressing force ln the strands, the support conditions, and
the cracking of the specimens The computer model is capable of providmg a com
plete and reasonably accuratc response of the speCImens provIded that care is taken
in realistically rnodeling all of the Important details. Moreover, many details of the
failure condition of the specimens are revealed by the computer analysis with the help
127

of graphlcal processing, for example, the yielding location of the tension hanger in
specimen D-2R and the fiexurai bond cracks observed in specimen D-2S are accura.tely
indicated in the mode!. Furthermore, program FIELDS aIso supplies a clear picture
of the flow of internaI forces in the dapped end, in which two distinct load paths are
evident J (one in the web and one III the nih). These load paths coincide with the ones
assumed in the "strut-and-tie" rnodel.
Since program FIELDS is developed for two-dimensional analyses, it can not han
dle the abrupt change in stiffness that created by the eut-off of the Range. Attempts
were made ta model this abrupt change by varying the width of the Range. As shawn
by the sensitivlty analysis, a higher shear depth will reducc the stress in the tension
hanger, thus a hlgher failure load is expected. So the failure loads predicted by pro gram
FIELDS are generally higher than the experimental failure loads, differences range from
7% ta 14%.
For a quick estimation of the internaI forces in the dapped end, as in the design of
the specimen, the "strut-and-tie" model may be the best tool available. As can be seen
in the results of the analysis, in the maJority of the cases, the "strut-and-tie" model can
provide an accurate prediction of the failure load and the failure mode of the specimen.
The model is Simple and flexible. However, due ta the basIC assumptlOns of the model,
it is not capable of modeling the effect of the prestressing strands of a pre-tensioned
member. Therefore, the force III the bot tom tie of the test specimens is over-estimated
by the mode!.
During the modeling of the specimens, it 1S noticed that bath the "strut-and-tie"
model and the computer mode! are highly sensitive to the change in the geometry of the
specimen. A change in the length or depth of the nib, or the change in the shear depth
will result in a significant variation of the stress in the dapped end, sa it is important
to model the reinforcement detalls and the support condition carefully.
128
......
CHAPTER 7
Summary and Conclusions
In this research programme, the behaviour of thin stemmed precast concrete mem-
bers with dapped ends was investigated. Two different reinforcement schemes in the
form of removable reinforcing "cages" were developed for rectangular and inclined
dapped ends, respectively. In order to study these reinforcement schemes, two sim-
ply supported prestressed concrete members, each representing one half of a standard
double-tee section and consisting of four different dapped end specimens, were tested
un der both vertical load and horizontal tension.
The failure response of specimens D-IR and D-lS was dominated by the yielding
of the welded wire fabric that was used as shear reinforcement in the region of uniform
compressive stresses. The yielding of the main tension hanger, which consisted of two
#3 stirrups, constituted the failure response of specimen D-2R If the horizontal tension
tie in the nib of specimen D-2S had not become slightly inclined during casting, it is
believed that the failure would be caused by the yielding of the inclined tension hanger.
Unfortunately due to the misalignment of the tension tie, the failure mode observed in
specimen D-2S was the yielding of the welded wire fabric f')llowed closely by yielding
of the inclined tension hanger.
Two different "strut-and-tie" models were developed, and used in the design of the
dapped end specimens. The general design procedure along with two numerical design
129

(~ examples for both rectangular and inclined dapped ends were detailed in Chapter 4.
The "strut-and-tie" models were then used to predict the response of the test specimens.
In general, the "strut-and-tie" model is capable of providing an accurate estimation of
the failure load of the test specimens. In the majority of the cases, the failure modes
were correctly predicted. However, since the contribution of the prestressing strands
was not included, the force in the bottom tension tie in the web was over-estimated by
the "strut-and-tie" model.
The non-linear finite element program FIELDS was utilized for prediction of the
response of the test specimens. Results of the computer analysis cleariy demonstrated
the flow of internaI forces in the test specimens, in which the existence of the diagonal
compressive struts in the nib and in the web were observed, as expected. These find
ings along with the experimental results, confirm the basic load paths assumed in the
development of the "strut-and-tie" model.
Program FIELDS accurately indicated the failure modes of the test specimens. In
addition, details of the failure, such as the location of the yielding of the tension hanger
in specimen D-2R, were predicted by the computer program.
The following conclusions are based on the experimental and analytical work con
ducted in this research programme:
1. The reinforcement schemes developed were proven to be suitable for the thin
stemmed precast concrete members, such as the standard double tee section. The
removable reinforcing cage is a simple and effective tool for controlling the crack
ing in the dapped end. The various mechanical anchorages used in the reinforcing
cages provided adequate confinement of the concrete within the nodal zones and
served to anchor the reinforcing bars.
2. The "strut-and-tie" models developed for rectangular and inclined dapped ends
are capable of providing a quick and reasonably accurate estimate of the failure
load of a dapped end. To ensure proper anchorage of the free ends of the horizontal
130

l' ! -tension tie in the nib, the reinforcing bars should be carried at least a distance
of 1. 7ld beyond the node assumed to be the anchor point in the "strut-and-tie"
mode!. In addition, the reinforcing bars used as the bottom tension tie in the web
should be extended at leabt 1. 71d beyond the point where the prestressing strands
fully develop their strength.
3. As the ultimate capacity of dapped ends is highly sensitive ta the change in the
geometry of the nib, ït is necessary to model the reinforcement details and the
support conditions carefully.
4. The use of two layers of symmetrically placed weldeà wirè fnbric, which served as
the shear reinforcement in the region of uniform compressive stress fields, notably
improves the ductility of the dapped end.
5. Compared with the rectangular dapped end, the inclined dapped end is more
efficient. A relatively smaller amount of reinforcement is required due to the lower
stress level resulting from the high inclination of the strut in the nib created by
the inclined tension hanger.
Due to the small number of specimens involved in this study, further im.restigation
on the influence of the prestressing strands on the fiow of internaI forces in dapped
ends is recommended to providc a better understal1ding of the interaction between the
prestressing strands and the horizontal tension ties, and eventually to include the effect
of the prestressing force in the "strut-and-tie" mode!.
131
REFERENCES
1. Hahn, V. V., "Das hochgezogene Aufiager im Betonfertigteilbau", Aus Tbeorie und Praxis des Stahlbetonbaues, Verlag Von Wilhelm Ernst & Sohn, Berlin, 1969.
2. Reynolds, G. C., "The Strength of Half-Joints in Reinforced Concrete Beams" , TRA 415, Cement and Con crete Association, London, England, June 1969,9 pp.
3. Werner, M. P. and Dilger, W. H., "Shear Design of Prestressed Concrete Stepped Beams", PCI Journal, V. 18, No. 4, July-August 1973, pp. 37-49.
4. Hamoudi, A. A., Phang, M. K. S., and Bierweiler, R. A., "Diagonal Shear in Prestressed Concrete Dapped Beams", ACI Journal, V. 72, No. 7, July 1975, pp. 347-350.
5. Matto<:k, A. H. and Chan, T. C., "Design and Behavior of Dapped End Beams" , PCI Journal, V. 24, No. 6, November-December 1979, pp. 28-45.
6. Mattock, A. H. and Theryo, T. S., "Strength of Precast Prestressed Concrete Members with Dapped Ends", PCI Journal, V. 31, No. 5, September-October 1986, pp. 58-75.
7. ACI Commit tee 318, "Building Code Requirements for Reinforced Con crete (ACI 318-83)\ American Concrete Institute, Detroit, 1983, 111 pp.
8. Heywood, R. J., "Towards a Better Understanding of Reinforced-Concrete Halving Joints", lOth Australasian Conference on the Mechanics of Structures and Materials, University of Adelaide, 1986.
9. Heywood, R. J., "Theories for the Design of Reinforced Concrete Halving-Joints", First National Structural Engineering Conference, Melbourne, August 1987.
10. Cook, W. D. and Mitchell, D., "Studies of Disturbed Regions near Discontinuities in Reinforced Concrete Members", ACI Journal, V. 85, No. 2. March-April1988, pp. 206-216.
11. Cook, W. D. and Mitchell, D., "Studif's of Disturbed Regions near Disconi.inuities", Structural Engineering Research Series Report No. 87-3, Departm~:1t of Civil Engineering and Applied Mechanic3, McGill University, December 1987, 153 pp.
12. Ritter, W., Die Bauweise Henr2bique (Construction Tecbniques of Hennebique), Schwe!zerische Bauzeitung, Zürich, February 1899.
13. Morsch, E., Concrete-Steel Construction, English Translation by E.P. Goodrich, McGraw-Hill Book Company, New York, 1909, 368 pp. (Translation from third editioll of Der Eisenbetonbau, n.rst edition, 1902).
14. CEB-FIP, Model Code for Concrete Structures, CEB-FIP International Recommendations, Third Edition, Comité Euro-International du Béton, Paris, 1978, 384 pp.
15. Thür1imann, B., Marti, P., Pralong, J., Ritz, P. and Zimmerli, B., Anwendung der Plastizitaetstbeorie auf Stahlbeton (Application of tbe Tbeory of Plasticity
132
to Reinforced Concrete), Institute for Structurl!~ Engineering, ETH Zürich, 1983, 252 pp.
16. Marti, P., "Basic Tools of Reinforced CCllcrete Bearn Design", ACI Journal, V. 82, No. 1, Jannary-February 1985, pp. 46-56.
17. Schlaich, J., Schafer, K. and Jennewein, M., "Towards a Consistent Design of Reinforced Concrete Structures", PCI Journal, V. 32, No. 3, May-June 1987, pp. 74-150.
18. "Design of Concrete Structures for Buildings (CAN3-A23.3-M84)", Canadian Standard Association, Rexdale, 1984, 281 pp.
19. Collins, M.P. and Mitchell, D., "A Rational Approach to Shear Design - The 1984 Canadian Code Provisions", ACI Journal, V. 83, No. 6, November-December 1986, pp. 925-933.
20. Ngo, D., and Scordelis, A. C., "Finite Element Analysis of Reinforced Concrete Bearns", ACI Journal, V. 64, No. 3, March 1967, pp. 152-163.
21. AS CE Task Force, "State-of-the-Art Report on Finite Element Analysis of Reinforced Concrete", Aœerican Society of Civil Engineers, New York, 1981, 545 pp.
22. Adeghe, L. N., and Collins, M. P., "A Finite Element Model for Studying Reinforced Concrete Detailing Problems", Dept. of Civil Engineering Publication No. 86-12, University of Toronto, October 1986, 267 pp.
23. CPCI, "Metric Design Manual - Precast and Prestressed Concrete", Canadian Prestressed Concrete Institute, Ottawa, 1987.
24. Vecchio, F.J. and Collins, M.P., "The Response of Reinforced Concrete to In-Plane Shear and Normal Stresses", University of Toronto, Dept. of Civil Engineering, Publication No. 82-03, March 1982, 332 pp.
25. Vecchio, F.J. and Collins, M.P., "The Modified Compression-Field Theory for Reinforced Concrete Elements Subjected to Shear", ACI Journal, V. 83, No. 2, March-April 1986, pp. 219-231.
26. Walraven, J.C., "F\mdamental Analysis of Aggregate Interlock", Journal for the Structural Division, ASCE, V. 107, ST] 1, November 1981, pp. 2245-2270.
27. Collins, M.P. and Mitchell, D., "Evaluating Existing Bridge Structures Using the Modified Compression Field Theory", Strength Evaluation of Existing CO!lcrete Bridges, SP-88, American Concret.e Institute, Detroit, 1985, 268pp.
28. Collins, M.P. and Mitchell, D., "Chapter 4 - Shear and Torsion", CPCA Concrete Design Handbook, Canadian Portland Cement Association, Ottawa, 1985, pp. 4-1-4-51.
29. Jolliffe, M. J. A. H., "Construction Technique for Large Precast Prestressed Concrete Decks over Air Rights", PCI Journal, V. 20, No. 2, March-April 1975.
30. Ghosh, S. K., "Shear Reinforcement Requirements for Precast Prestressed DoubleTee Members", ACI Journal, V. 84, No. 4, July- August 1987, pp. 28ï-292.
133
31. Marti, P., "Staggered Shear Design of Simply Supported Concrete Beams", ACI Journal, V. 83, No. 1, January-Fehruary 1986, pp. 36-42.
32. Hsu, T. T. C., "ls the 'Staggering Concept' of Shear Design Safe ?", ACI Journal, V. 79, No. 6, November-December 1982, pp.435-443.
33. Collins, M. P., and Mitchell D., "Prestressed Concrete Basics", Canadian Prestressed Concrete lnstitute, Ottawa, 1987, 614 pp.
134
APPENDIX A
EXPERIMENTAL DATA
A.l Introduction
The experimental data for specimens Dl·R, D-2R, D-IS, and D-2S are presented
in this appendix. The behaviour of these specimens is described in Chapter 3. The
test set-up and instrumentation details are given in Chapter 2. The locations of the
strain targets are shawn in Fig. Al and A2. Two zero readings were taken prior to the
loading. Loading was applied to the specimen until failure took place at one of the two
dapped ends. Then the test set-up was adjusted, and the specimen was reloaded until
fallure occured at the other dapped end. All dial gauges used for the measurement of
deflections were reset to zero before each reloading.
135
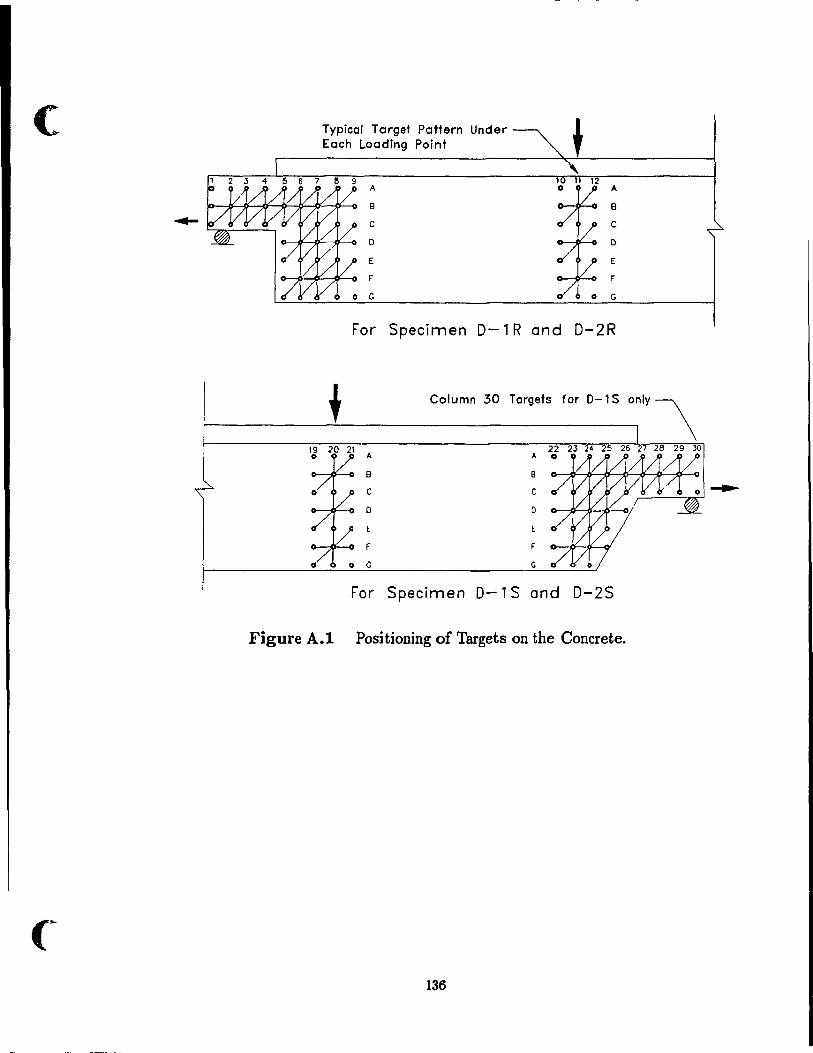
Typical Target Pattern Under Each Loading Point
A
8
C
o
E
r
A
8
C
D
E
r
For Specimen D-1 Rand D-2R
B
C
f
Column 30 Ta,.,I. fa' 0-' S anly \
22 A 0
8
C
o
c
For Specimen D-1 Sand D-2S
Figure A.t Positioning of Targets on the Concrete.
136
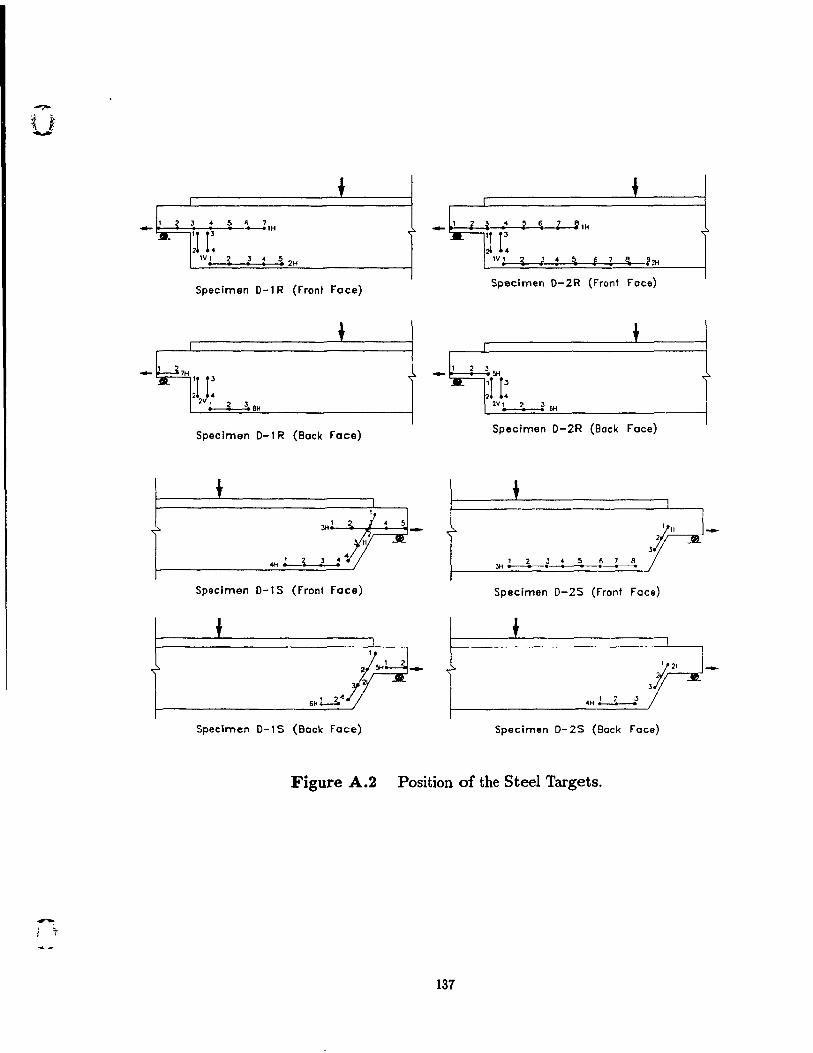
Specimen 0-1 R (Front Face)
---
Specimen 0-1 R (Bock Face)
Specimen 0-1 S (Front Face)
Specimen 0-1 S (Bock Face)
Figure A.2
-
Specimen 0-2R (Front Foce)
Specimen 0-2R (Bock Face)
, 3110
J 4 . . Specimen 0-2S (Front Face)
Specimen 0- 2S (Bock Face)
Position of the Steel Targets.
137
-
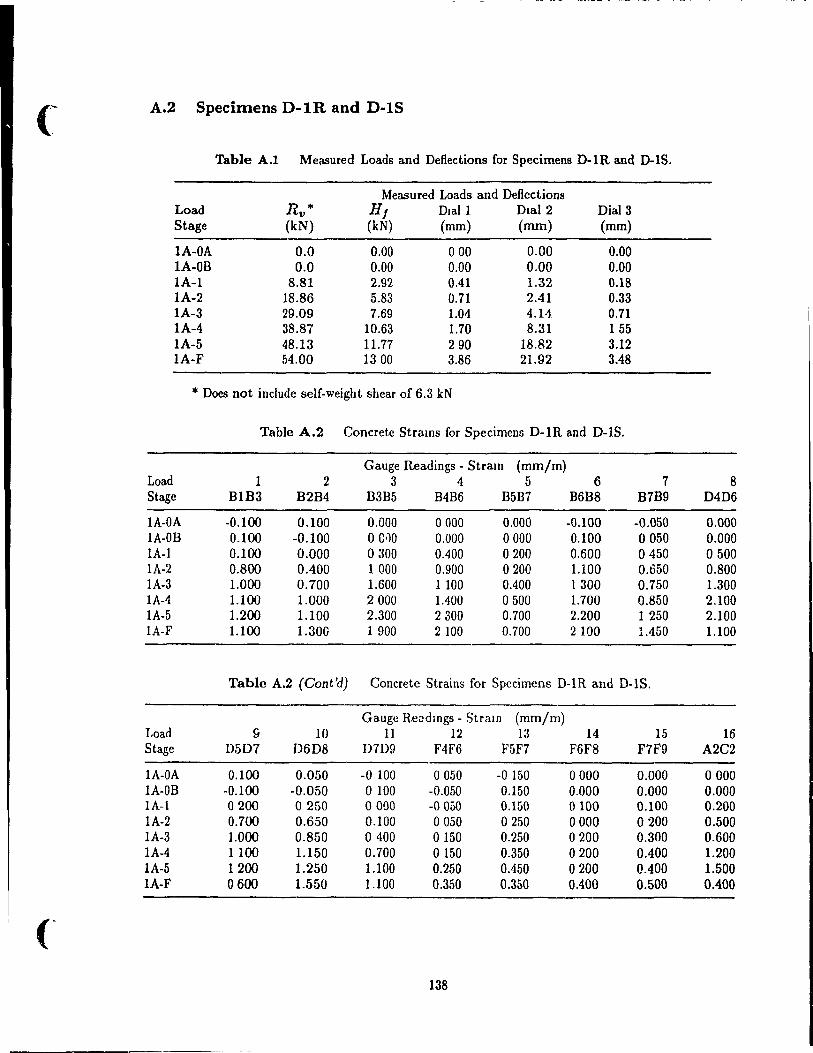
(~ A.2 Specimens D-IR and D-IS
Table A.l Measured Loads and Deflections for Specimens D-1R and D-1S.
Measured Loads and Deflections Load Ru· Hf DlaIl Dlal2 Dial3 Stage (kN) (kN) (mm) (mm) (mm)
lA-OA 0.0 0.00 000 0.00 0.00 lA-OB 0.0 0.00 0.00 0.00 0.00 lA-l 8.81 2.92 0.41 1.32 0.18 lA-2 18.86 5.83 0.71 2.41 0.33 1A-3 29.09 7.69 1.04 4.14 0.71 1A-4 38.87 10.63 1.70 8.31 155 lA-5 48.13 11.77 290 18.82 3.12 lA-F 54.00 1300 3.86 21.92 3.48
* Does not include self-weight shear of 6.3 kN
Table A.2 Con crete Strams {or Specimens 0-IR and 0-IS.
Gauge Readings - Stram (mm/m) Load 1 2 3 4 5 6 7 8 Stage B1B3 B2B4 B3B5 B4B6 B5B7 B6B8 B7B9 D4D6
IA-OA -0.100 0.100 0.000 a 000 0.000 -0.100 -0.050 0.000 lA-OB 0.100 -0.100 o C·)O 0.000 0000 0.100 0050 0.000 lA-l 0.100 0.000 0300 00400 0200 0.600 0450 0500 lA-2 0.800 00400 1000 0.900 0200 1.100 0.650 0.800 lA-3 1.000 0.700 1.600 1100 00400 1300 0.750 1.300 IA-4 1.100 1.000 2000 1.400 0500 1.700 0.850 2.100 lA-5 1.200 1.100 2.300 2300 0.700 2.200 1 250 2.100 IA-F 1.100 1.300 1900 2100 0.700 2100 1.450 1.100
Table A.2 (Cont'd) Concrete Strains for Specimens D-IR and D-lS.
Gaugc Reudmgs - StraIn (mm/m) Load 9 10 11 12 13 14 15 16 Stage D507 0608 07D9 F4F6 F5F7 F6F8 F7F9 A2C2
lA-DA 0.100 0.050 -0 100 0050 -0150 0000 0.000 0000 lA-OB -0.100 -0.050 o 100 -0.050 0.150 0.000 0.000 0.000 IA-1 0200 0250 0000 -0050 0.150 0100 0.100 0.200 lA-2 0.700 0.650 0.100 0050 0250 0000 0200 0.500 lA-3 1.000 0.850 0400 0150 0.250 0200 0.300 0.600 lA-4 1100 1.150 0.700 0150 0.350 0200 0.400 1.200 1A-5 1200 1.250 1.100 0.250 0.450 0200 0.400 1.500 1A-F 0600 1.550 1.100 0.350 0.350 00400 0.500 0.400
('
138
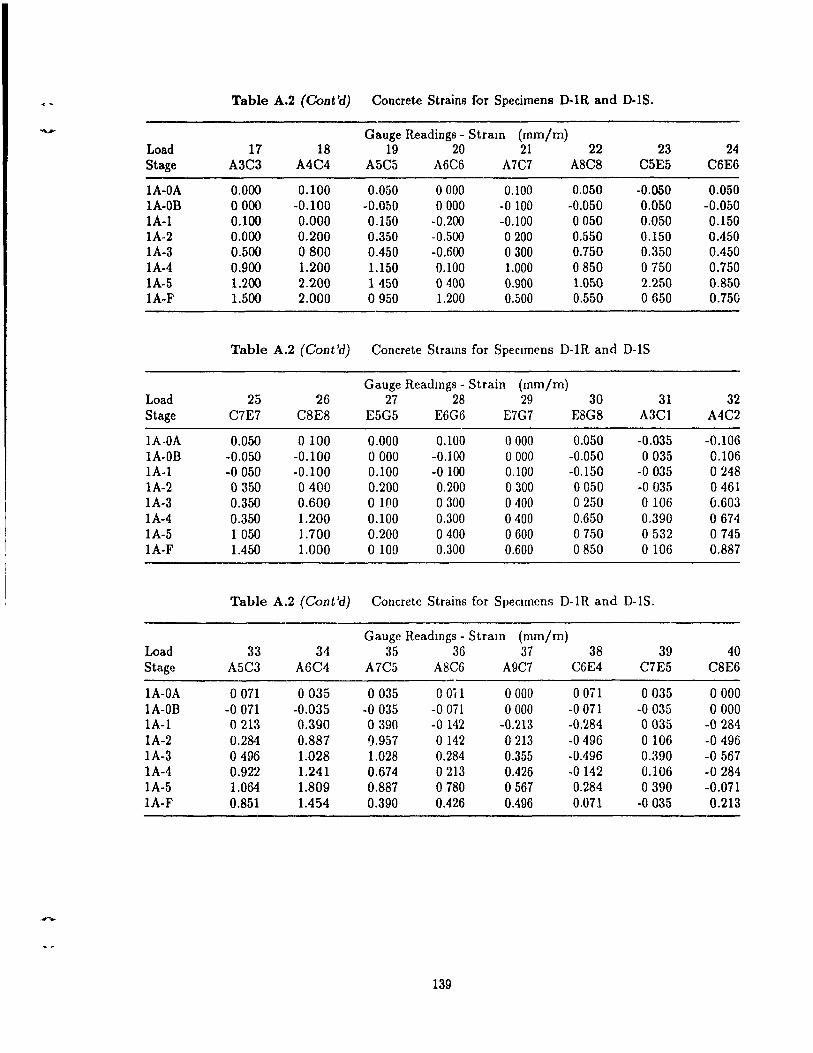
Table A.2 (Cont'd) Concrete Strains for Specimens D-lR and D-lS.
""'"' Gauge Readings - Stram {mm/m} Load 17 18 19 20 21 22 23 24 Stage A3C3 A4C4 A5C5 A6C6 A7C7 ASCS C5E5 C6E6
lA-DA 0.000 0.100 0.050 0000 0.100 0.050 -0.050 0.050 lA-OB 0000 -0.100 -0.0&0 0000 -0100 -0.050 0.050 -0.050 lA-l 0.100 0.000 0.150 -0.200 -0.100 0050 0.050 0.150 lA-2 0.000 0.200 0.350 -0.500 0200 0.550 0.150 0.450 lA-3 0.500 0800 0.450 -0.600 0300 0.750 0.350 0.450 lA-4 0.900 1.200 1.150 0.100 1.000 0850 0750 0.750 1A-5 1.200 2.200 1450 0400 0.900 1.050 2.250 0.850 1A-F 1.500 2.000 0950 1.200 0.500 0.550 0650 0.750
Table A.2 (Cont'd) Con crete Strams for SpeCimens D-1R and D-1S
Gauge Readmgs - Strain (mm/m) Load 25 26 27 28 29 30 31 32 Stage C7E7 C8E8 E5G5 E6G6 E7G7 E8G8 A3Cl A4C2
lA·OA 0.050 0100 0.000 0.100 0000 0.050 -0.035 -0.106 lA-OB -0.050 -0.100 0000 -0.100 0000 -0.050 0035 0.106 1A-l -0050 -0.100 0.100 -0100 0.100 -0.150 -0035 0248 lA-2 0350 0400 0.200 0.200 0300 0050 -0035 0461 lA-3 0.350 0.600 o 1P0 0300 0400 0250 0106 0.603 lA-4 0.350 1.200 0.100 0.300 0400 0.650 0.390 0674 lA-5 1 050 1.700 0.200 0400 0600 0750 0532 0745 lA-F 1.450 1.000 o 100 0.300 0.600 0850 0106 0.887
Table A.2 (Cont'd) Concrete Strains for Specimens D-I Rand D-1S.
Gauge Readmgs - Stram {mm/m} Load 33 34 35 36 37 38 39 40 Stage A5C3 A6C4 A7C5 A8C6 A9C7 C6E4 C7E5 C8E6
lA-OA 0071 0035 0035 o Oi 1 0000 o Oïl 0035 0000 lA-OB -0071 -0.035 -0035 -0071 0000 -0071 -0035 0000 1A-l 0213 0.390 0390 -0142 -0.213 -0.284 0035 -0284 1A-2 0.284 0.887 1).957 0142 0213 -0496 o 106 -0496 lA-3 0496 1.028 1.028 0.284 0.355 -0.496 0.390 -0567 1A-4 0.922 1.241 0.674 0213 0.426 -0142 0.106 -0284 1A-5 1.064 1.809 0.887 0780 0567 0.284 0390 -0.071 lA-F 0.851 1.454 0.390 0.426 0.496 0.071 -0035 0.213
139
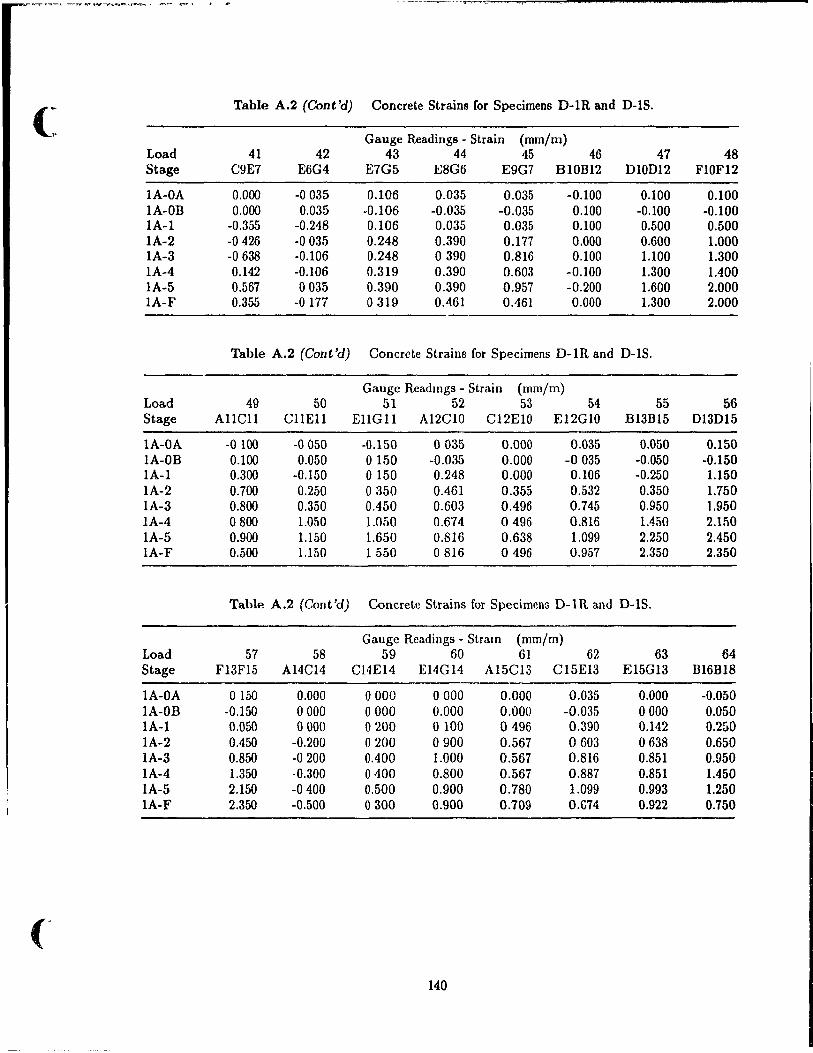
F{
(~ Table A.2 (Cont'd) Con crete Strains for Specimens D-IR and D-lS.
Gauge Readings - Strain (mm/m) Load 41 42 43 44 45 46 47 48 Stage C9E7 E6G4 E7G5 E8G6 E9G7 B10B12 DlOD12 FlOF12
lA-OA 0.000 -0035 0.106 0.035 0.035 -0.100 0.100 0.100 lA-OB 0.000 0.035 -0.106 -0.035 -0.035 0.100 -0.100 -0.100 lA-l -0.355 -0.248 0.106 0.035 0.035 0.100 0.500 0.500 1A-2 -0426 -0035 0.248 0.390 0.177 0.000 0.600 1.000 lA-3 -0638 -0.106 0.248 0390 0.816 0.100 1.100 1.300 lA-4 0.142 -0.106 0.319 0.390 0.603 -0.100 1.300 1.400 lA-5 0.567 0035 0.390 0.390 0.957 -0.200 1.600 2.000 1A-F 0.355 -0177 0319 0.461 0.461 0.000 1.300 2.000
Table A.2 (Cont'd) Con crete Strains for Specimens D-lR and D-lS.
Gauge Readmgs - Strain (mm/m) Load 49 50 51 52 53 54 55 56 Stage AllCll CllEll EllGll A12C10 C12E10 E12GIO Bl3BI5 D13Dl5
lA-OA -0100 -0050 -0.150 0035 0.000 0.035 0.050 0.150 lA-OB 0.100 0.050 0150 -0.035 0.000 -0035 -0.050 -0.150 lA-l 0.300 -0.150 0150 0.248 0.000 0.106 -0.250 1.150 lA-2 0.700 0.250 0350 0.461 0.355 0.532 0.350 1.750 lA-3 0.800 0.350 0.450 0.603 0.496 0.745 0.950 1.950 lA-4 0800 1.050 L050 0.674 0496 0.816 1.450 2.150 lA-5 0.900 1.150 1.650 0.816 0.638 1.099 2.250 2.450 lA-F 0.500 1.150 1550 0816 0496 0.957 2.350 2.350
Table A.2 (Cant 'd) Con crete Strains for Specimens D-l Rand D-lS.
Gauge Readings - Stram (mm/m) Load 57 58 59 60 61 62 63 64 Stage Fl3F15 A14C14 C14E14 E14G14 A15C13 C15E13 E15G13 B16B18
lA-OA 0150 0.000 0000 0000 0.000 0.035 0.000 -0.050 lA-OB -0.150 0000 0000 0.000 0.000 -0.035 0000 0.050 lA-! 0.050 0000 0200 0100 0496 0.390 0.142 0.250 1A-2 0.450 -0.200 0200 0900 0.567 0603 0638 0.650 lA-3 0.850 -0200 0.400 1.000 0.567 0.816 0.851 0.950 lA-4 1.350 -0.300 0400 0.800 0.567 0.887 0.851 1.450 lA-5 2.150 -0400 0.500 0.900 0.780 1.099 0.993 1.250 1A-F 2.350 -0.500 0300 0.900 0.709 0.G74 0.922 0.750
140
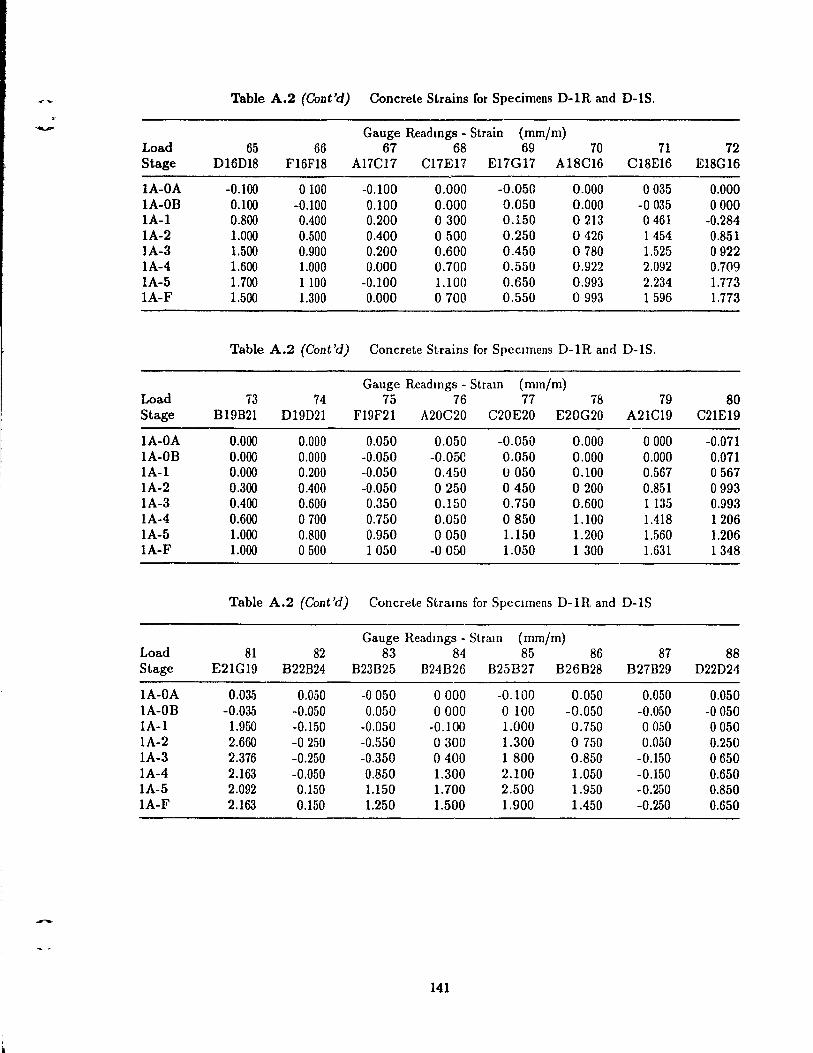
Table A.2 (Gont 'd) Con crete Strains for Specimens D-IR and D-1S.
- Gauge Readmgs - Strain (mm/m) Load 65 66 67 68 69 70 71 72 Stage D16D18 F16F18 A17C17 CI7E17 E17G17 A18C16 C18E16 E18G16
1A-OA -0.100 0100 -0.100 0.000 -0.050 0.000 0035 0.000 lA-OB 0.100 -0.100 0.100 0.000 0.050 0.000 -0035 0000 1A-l 0.800 0.400 0.200 0300 0.150 0213 0461 -0.284 lA-2 1.000 0.500 0.400 0500 0.250 0426 1454 0.851 lA-3 1.500 0.900 0.200 0.600 0.450 0780 1.525 0922 1A-4 1.600 1.000 0.000 0.700 0.550 0.922 2.092 0.709 1A-5 1.700 1100 -0.100 1.100 0.650 0.993 2.234 1.773 lA-F 1.500 1.300 0.000 0700 0.550 0993 1596 1.773
Table A.2 (Gont'd) Concrete Strains for Speclmens D-IR and D-15.
Gauge Readmgs - Stram (mm/m) Load 73 74 75 76 77 78 79 80 Stage B19B21 D19D21 F19F21 A20C20 C20E20 E20G20 A21C19 C21E19
lA-OA 0.000 0.000 0.050 0.050 -0.050 0.000 0000 -0.071 lA-OB 0.000 0.000 -0.050 -O.ose 0.050 0.000 0.000 0.071 lA-l 0.000 0.200 -0.050 0.450 0050 0.100 0.567 0567 lA-2 0.300 00400 -0.050 0250 0450 0200 0.851 0993 lA-3 0.400 0.600 0.350 0.150 0.750 0.600 1 135 0.993 lA-4 0.600 0700 0.750 0.050 0850 1.100 1.418 1206 lA-5 1.000 0.800 0.950 0050 1.150 1.200 1.560 1.206 lA-F 1.000 0500 1050 -0050 1.050 1 300 1.631 1348
Table A.2 (Gont'd) Concrete Strams for Speclmens D-IR and D-lS
Gauge Readlllgs - Stram (mm/m) Load 81 82 83 84 85 86 87 88 Stage E21G19 B22B24 B231325 B24B26 B25B27 B26B28 B27B29 D22D24
lA-OA 0.035 0.050 -0050 0000 -0.100 0.050 0.050 0.050 lA-OB -0.035 -0.050 0.050 0000 o 100 -0.050 -0.050 -0050 lA-l 1.950 -0.150 -0.050 -0.100 1.000 0.750 0050 0050 lA-2 2.660 -0250 -0.550 0300 1.300 0750 0.050 0.250 lA-3 2.376 -0.250 -0.350 0400 1 800 0.850 -0.150 0650 lA-4 2.163 -0.050 0.850 1.300 2.100 1.050 -0.150 0.650 lA-5 2.092 0.150 1.150 1.700 2.500 1.950 -0.250 0.850 lA-F 2.163 0.150 1.250 1.500 1.900 1.450 -0.250 0.650
141
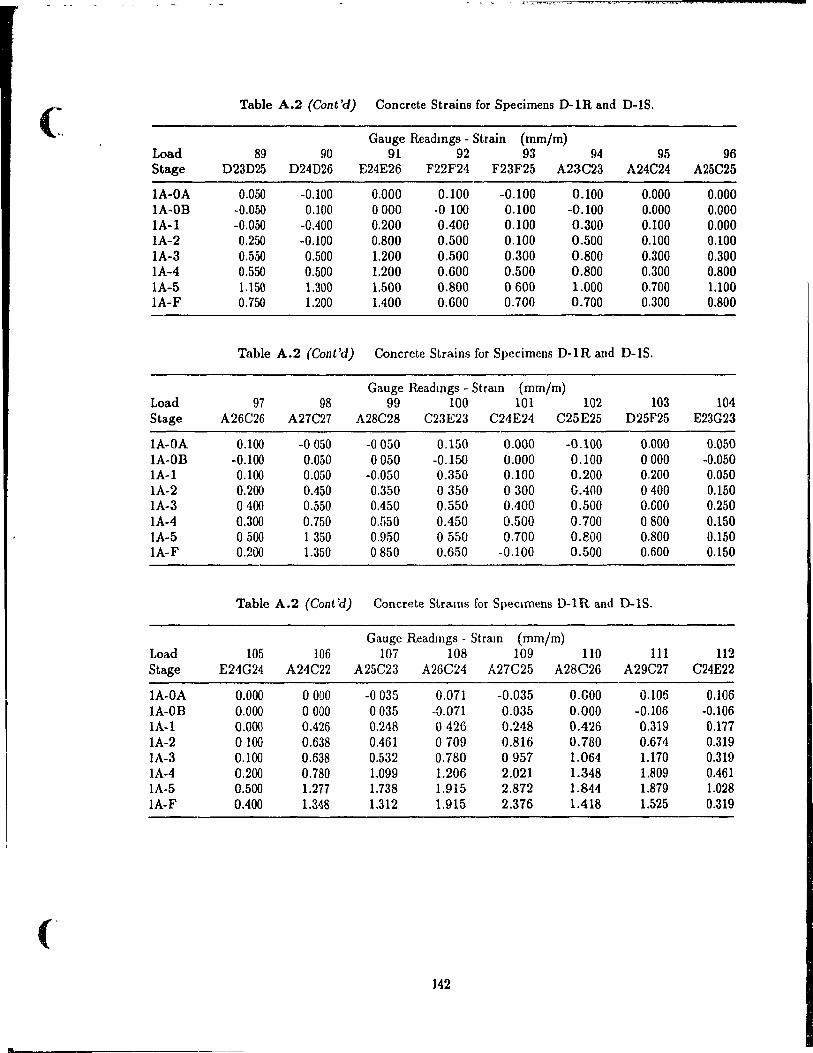
· _ - - .-~ __ • ,=_.~., ---",.,~~ ............ ,.... ....... c..." ,_ ....... , • ______ _
(. Table A.2 (Cont'd) Con crete 8trains for Specimens D-IR and D-18.
Gauge Readmgs - Strain (mm/m) Load 89 90 91 92 93 94 95 96 Stage D23D25 D24D26 E24E26 F22F24 F23F25 A23C23 A24C24 A25C25
lA-DA 0.050 -0.100 0.000 0.100 -0.100 0.100 0.000 0.000 lA-OB -0.050 0.100 0000 -0 100 0.100 -0.100 0.000 0.000 lA-! -0.050 -0.400 0.200 00400 0.100 0.300 0.100 0.000 1A-2 0.250 -0.100 0.800 0.500 0.100 0.500 0.100 0.100 1A-3 0.550 0.500 1.200 0.500 0.300 0.800 0.300 0.300 lA-4 0.550 0.500 1.200 0.600 0.500 0.800 0.300 0.800 1A-5 1.150 1.300 1.500 0.800 0600 1.000 0.700 1.100 1A-F 0.750 1.200 1.400 0.600 0.700 0.700 0.300 0.800
Table A.2 (Cont'd) Concrete Strains for Specimens D-1R and D-lS.
Gauge Readmgs - Stram {mm/m} Load 97 98 99 100 101 102 103 104 Stage A26C26 A27C27 A28C28 C23E23 C24E24 C25E25 D25F25 E23G23
lA-DA 0.100 -0050 -0050 0.150 0.000 -0.100 0.000 0.050 lA-OB -0.100 0.050 0050 -0.150 0.000 0.100 0000 -0.050 lA-l 0.100 0.050 -0.050 0.350 0.100 0.200 0.200 0.050 lA-2 0.200 0.450 0.350 0350 0300 GAOO 0400 0.150 1A-3 0400 0.550 0.450 0.550 00400 0.500 0.600 0.250 1A-4 0.300 0.750 0':150 0.450 0.500 0.700 0800 0.150 1A-5 0500 1 350 0.950 0550 0.700 0.800 0.800 0.150 lA-F 0.200 1.350 0850 0.650 -0.100 0.500 0.600 0.150
Table A.2 (Cont 'd) Concrete Strams for Specimens D-1R and D-1S.
Gauge Readmgs - Stram (mm/m) Load 105 106 107 108 109 110 111 112 Stage E24G24 A24C22 A25C23 A26C24 A27C25 A28C26 A29C27 C24E22
lA-OA 0.000 0000 -0035 0.071 -0.035 O.GOO 0.106 0.106 lA-OB 0.000 0000 0035 -0.071 0.035 0.000 -0.106 -0.106 1A-l 0.000 0.426 0.248 0426 0.248 0.426 0.319 0.177 1A-2 0100 0.638 0.461 0709 0.816 0.780 0.674 0.319 1A-3 0.100 0.638 0.532 0.780 0957 1.064 1.170 0.319 1A-4 0.200 0.780 1.099 1.206 2.021 1.348 1.809 0.461 lA-5 0.500 1.277 1.738 1.915 2.872 1.844 1.879 1.028 lA-F 0.400 1.348 1.312 1.915 2.376 1.418 1.525 0.319
142
.
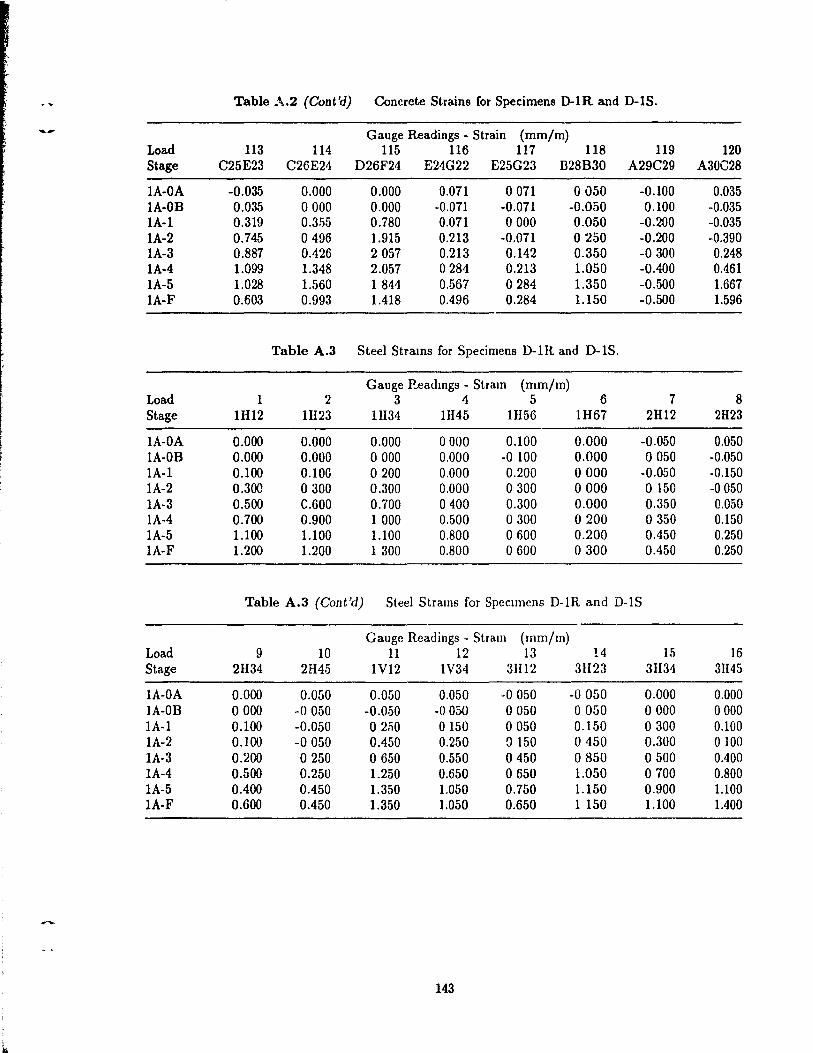
Table .\.2 (Cont'd) Con crete Strains for Specimens D-1R and D-1S.
.....- Gauge Readings - Strain (mm/m) LoOO 113 114 115 116 117 118 119 120 Stage C25E23 C26E24 D26F24 E24G22 E25G23 B28B30 A29C29 A30C28
1A-OA -0.035 0.000 0.000 0.071 0071 0050 -0.100 0.035 lA-OB 0.035 0000 0.000 -0.071 -0.071 -0.050 0.100 -0.035 1A-l 0.319 0.355 0.780 0.071 0000 0.050 -0.200 -0.035 1A-2 0.745 0496 1.915 0.213 -0.071 0250 -0.200 -0.390 1A-3 0.887 0.426 2057 0.213 0.142 0.350 -0300 0.248 1A-4 1.099 1.348 2.057 0284 0.213 1.050 -0.400 0.461 1A-5 1.028 1.560 1 844 0.567 0284 1.350 -0.500 1.667 1A-F 0.603 0.993 1.418 0.496 0.284 1.150 -0.500 1.596
Table A.3 Steel Strams for Specimens D-1R and D-1S.
Gauge Readmgs - Stram (mm/m) Load 1 2 3 4 5 6 7 8 Stage 11I12 IH23 1H34 1H45 IH56 IH67 2H12 2H23
1A-OA 0.000 0.000 0.000 0000 0.100 0.000 -0.050 0.050 lA-OB 0.000 0.000 0000 0.000 -0 100 0.000 0050 -0.050 1A-l 0.100 0.10G 0200 0.000 0.200 0000 -0.050 -0.150 1A-2 0.300 0300 0.300 0.000 0300 0000 o 150 -0050 1A-3 0.500 C.600 0.700 0400 0.300 0.000 0.350 0.050 1A-4 0.700 0.900 1000 0.500 0300 0200 0350 0.150 1A-5 1.100 1.100 1.100 0.800 0600 0.200 0.450 0.250 1A-F 1.200 1.200 1300 0.800 0600 0300 0.450 0.250
Table A.3 (Cont'd) Steel Strams for Specimens D-1R and D-1S
Cauge Readings - Stram (mm/m) Load 9 10 11 12 13 14 15 16 Stage 2H34 2H45 IV12 1V34 3Hl2 31123 31134 31145
lA-DA 0.000 0.050 0.050 0.050 -0050 -0050 0.000 0.000 lA-OB 0000 -0050 -0.050 -0050 0050 0050 0000 0000 1A-1 0.100 -0.050 0250 0150 0050 0.150 0300 0.100 1A-2 0.100 -0050 0.450 0.250 G 150 0450 0.300 0100 1A-3 0.200 0250 0650 0.550 0450 0850 0500 0.400 1A-4 0.500 0.250 1.250 0.650 0650 1.050 0700 0.800 1A-5 0.400 0.450 1.350 1.050 0.750 1.150 0.900 1.100 lA-F 0.600 0.450 1.350 1.050 0.650 1 150 1.100 1.400
143
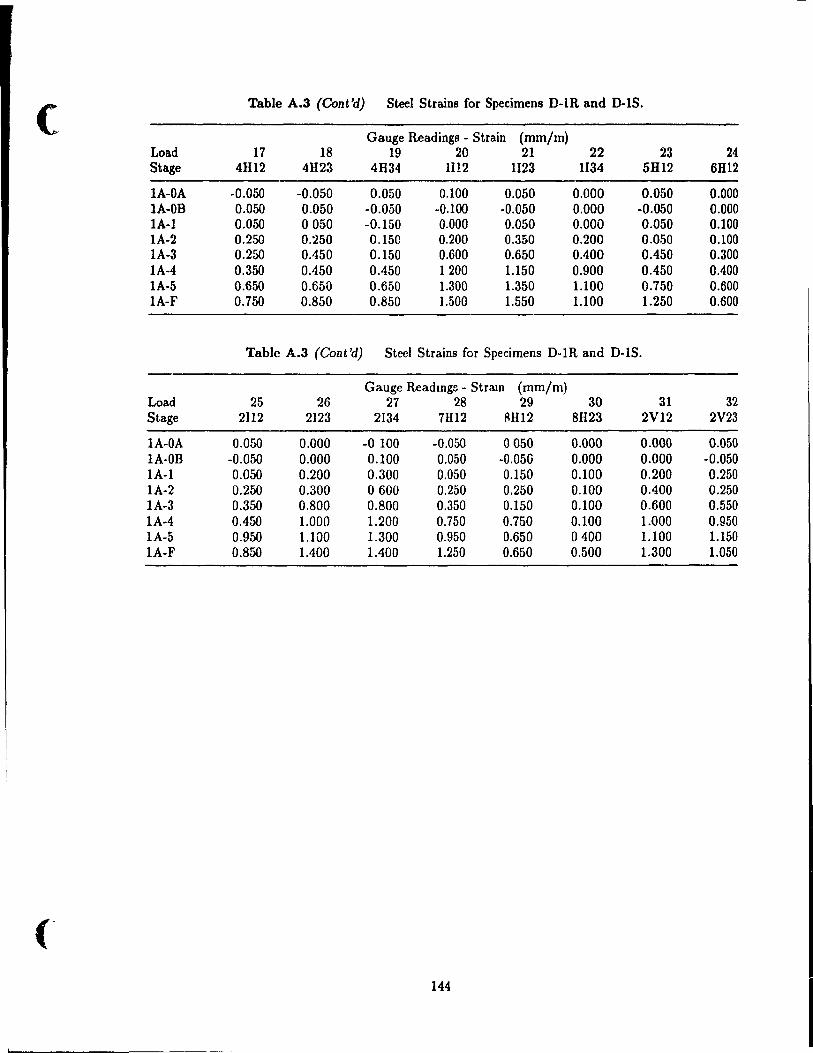
( Table A.3 (Cont'd) Steel StraÎns for Specimens D-iR and D-1S.
Gauge Readings - Strain (mm/m) Load 17 18 19 20 21 22 23 24 Stage 4H12 4H23 4H34 1I12 1123 1134 5H12 6H12
lA-DA -0.050 -0.050 0.050 0.100 0.050 0.000 0.050 0.000 lA-OB 0.050 0.050 -0.050 -0.100 -0.050 0.000 -0.050 0.000 IA-1 0.050 0050 -0.150 0.000 0.050 0.000 0.050 0.100 lA-2 0.250 0.250 0.150 0.200 0.350 0.200 0.050 0.100 IA-3 0.250 0.450 0.150 0.600 0.650 00400 0.450 0.300 IA-4 0.350 0.450 0.450 1200 1.150 0.900 0.450 00400 lA-5 0.650 0.650 0.650 1.300 1.350 1.100 0.750 0.600 IA-F 0.750 0.850 0.850 1.500 1.550 1.100 1.250 0.600
Table A.3 (Cont'd) Steel Strains for Specimens D-IR and D-IS.
Gauge ReadmgG - Stram (mm/m) Load 25 26 27 28 29 30 31 32 Stage 2112 2123 2134 7H12 8H12 8H23 2V12 2V23
IA-OA 0.050 0.000 -0 100 -0.050 0050 0.000 0.000 0.050 lA-OB -0.050 0.000 0.100 0.050 -0.050 0.000 0.000 -0.050 lA-1 0.050 0.200 0.300 0.050 0.150 0.100 0.200 0.250 lA-2 0.250 0.300 0600 0.250 0.250 0.100 00400 0.250 IA-3 0.350 0.800 0.800 0.350 0.150 0.100 0.600 0.550 IA-4 0.450 1.000 1.200 0.750 0.750 0.100 1.000 0.950 IA-5 0.950 1.100 1.300 0.950 0.650 0400 1.100 1.150 IA-F 0.850 1.400 1.400 1.250 0.650 0.500 1.300 1.050
144
1
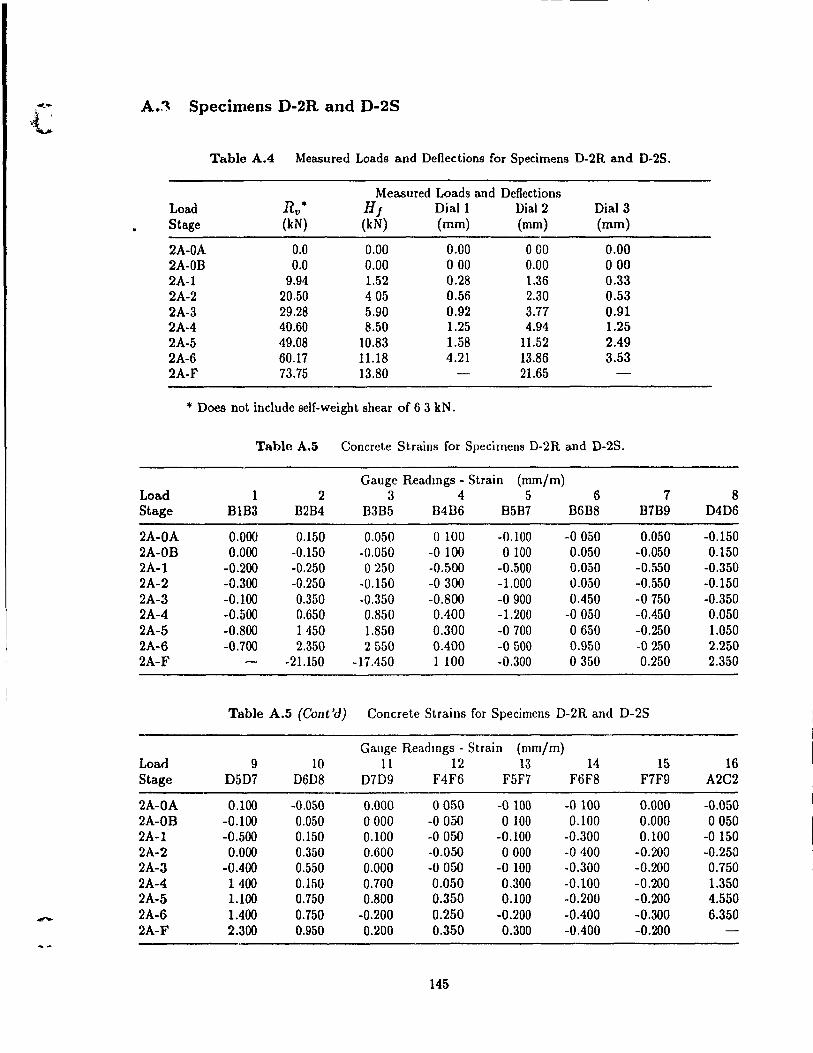
~~ A.3 Specimens D-2R and D-2S ~
Table A.4 Measured Loads and Deflections for Specimens D-2R and D-2S.
Measured Loads and Deflections Load Ru· Hf Dial1 Dial2 Dial3 Stage (kN) (kN) (mm) (mm) (mm)
2A-OA 0.0 0.00 0.00 000 0.00 2A-OB 0.0 0.00 000 0.00 000 2A-l 9.94 1.52 0.28 1.36 0.33 2A-2 20.50 405 0.56 2.30 0.53 2A-3 29.28 5.90 0.92 3.77 0.91 2A-4 40.60 8.50 1.25 4.94 1.25 2A-5 49.08 10.83 1.58 11.52 2.49 2A-6 60.17 11.18 4.21 13.86 3.53 2A-F 73.75 13.80 21.65
* Does not include self-weight shear of 6 3 kN.
Table A.a Con crete Strains for Specimens D-2R and D-2S.
Gauge Readmgs - Strain (mm/m) Load 1 2 3 4 5 6 7 8 Stage B1B3 B2B4 B3B5 B4B6 B5B7 B6B8 B7B9 D4D6
2A-OA 0.000 0.150 0.050 o 100 -0.100 -0050 0.050 -0.150 2A-OB 0.000 -0.150 -0.050 -0 100 0100 0.050 -0.050 0.150 2A-l -0.200 -0.250 0250 -0.500 -0.500 0.050 -0.550 -0.350 2A-2 -0.300 -0.250 -0.150 -0 300 -1.000 0.050 -0.550 -0.150 2A-3 -0.100 0.350 -0.350 -0.800 -0900 0.450 -0750 -0.350 2A-4 -0.500 0.650 0.850 0.400 -1.200 -0050 -0.450 0.050 2A-5 -0.800 1450 1.850 0.300 -0700 0650 -0.250 1.050 2A-6 -0.700 2.350 2550 00400 -0500 0.950 -0250 2.250 2A-F -21.150 -17.450 1100 -0.300 0350 0.250 2.350
Table A.5 (Cont'd) Concrete Strains for Specimens D-2R and D-2S
Gauge Readmgs - Strain (mm/m) Load 9 10 11 12 13 14 15 16 Stage D5D7 D6D8 D7D9 F4F6 F5F7 F6F8 F7F9 A2C2
2A-OA 0.100 -0.050 0.000 0050 -0 100 -0100 0.000 -0.050 2A-OB -0.100 0.050 0000 -0050 0100 0.100 0.000 0050 2A-1 -0.500 0.150 0.100 -0050 -0.100 -0.300 0.100 -0150 2A-2 0.000 0.350 0.600 -0.050 0000 -0400 -0.200 -0.250 2A-3 -0.400 0.550 0.000 -0050 -0 100 -0.300 -0.200 0.750 2A-4 1400 0.150 0.700 0.050 0.300 -0.100 -0.200 1.350 2A-5 1.100 0.750 0.800 0.350 0.100 -0.200 -0.200 4.550
- 2A-6 1.400 0.750 -0.200 0.250 -0.200 -00400 -0.300 6.350 2A-F 2.300 0.950 0.200 0.350 0.300 -00400 -0.200
145
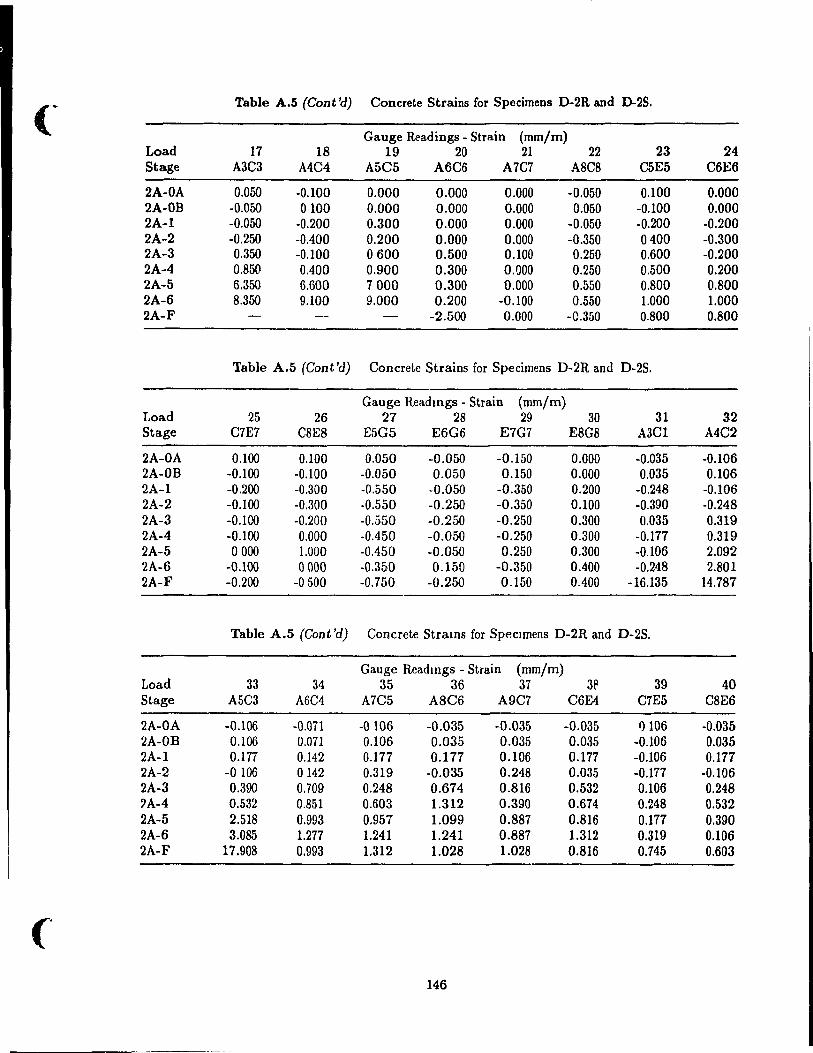
(~ Table A.5 (Cont'd) Con crete Strains for Specimens D-2R and D-25.
Gauge Readings - Strain (mm/m) Load 17 18 19 20 21 22 23 24 Stage A3C3 A4C4 A5C5 A6C6 A7C7 A8C8 C5E5 C6E6
2A-OA 0.050 -0.100 0.000 0.000 0.000 -0.050 0.100 0.000 2A-OB -0.050 0100 0.000 0.000 0.000 0.050 -0.100 0.000 2A-1 -0.050 -0.200 0.300 0.000 0.000 -0.050 -0.200 -0.200 2A-2 -0.250 -0.400 0.200 0.000 0.000 -0.350 0400 -0.300 2A-3 0.350 -0.100 0600 0.500 0.100 0.250 0.600 -0.200 2A-4 0.850 0.400 0.900 0.300 0.000 0.250 0.500 0.200 2A-5 6.350 6.600 7000 0.300 0.000 0.550 0.800 0.800 2A-6 8.350 9.100 9.000 0.200 -0.100 0.550 1.000 1.000 2A-F -2.500 0.000 -0.350 0.800 0.800
Table A.5 (Cont'd) Concrete Strains for Specimens D-2R and D-2S.
Gauge Readmgs - Strain (mm/m) Load 25 26 27 28 29 30 31 32 Stage C7E7 C8E8 E5G5 E6G6 E7G7 E8G8 A3C1 A4C2
2A-OA 0.100 0.100 0.050 -0.050 -0.150 0.000 -0.035 -0.106 2A-OB -0.100 -0.100 -0.050 0.050 0.150 0.000 0.035 0.106 2A-l -0.200 -0.300 -0.550 -0.050 -0.350 0.200 -0.248 -0.106 2A-2 -0.1 00 -0.300 -0.550 -0.250 -0.350 0.100 -0.390 -0.248 2A-3 -0.100 -0.200 -0.550 -0.250 -0.250 0.300 0.035 0.319 2A-4 -0.1 00 0.000 -0.450 -0.050 -0.250 0.300 -0.177 0.319 2A-5 o 000 1.000 -0.450 -0.050 0.250 0.300 -0.106 2.092 2A-6 -0.100 0000 -0.350 0.150 -0.350 00400 -0.248 2.801 2A-F -0.200 -0500 -0.750 -0.250 0.150 0.400 -16.135 14.787
Table A.5 (Cont 'd) Concrete Strams for Specimens D-2R and D-2S.
Gauge Readmgs - Strain (mm/m) Load 33 34 35 36 37 3~ 39 40 Stage A5C3 A6C4 A7C5 A8C6 A9C7 C6E4 C7E5 C8E6
2A-OA -0.106 -0.071 -0106 -0.035 -0.035 -0.035 1) 106 -0.035 2A-OB 0.106 0.071 0.106 0.035 0.035 0.035 -0.106 0.035 2A-1 0.177 0.142 0.177 0.177 0.106 0.177 -0.106 0.177 2A-2 -0106 0142 0.319 -0.035 0.248 0.035 -0.177 -0.106 2A-3 0.390 0.709 0.248 0.674 0.816 0.532 0.106 0.248 ?A-4 0.532 0.851 0.603 1.312 0.390 0.674 0.248 0.532 2A-5 2.518 0.993 0.957 1.099 0.887 0.816 0.177 0.390 2A-6 3.085 1.277 1.241 1.241 0.887 1.312 0.319 0.106 2A-F 17.908 0.993 1.312 1.028 1.028 0.816 0.745 0.603
146
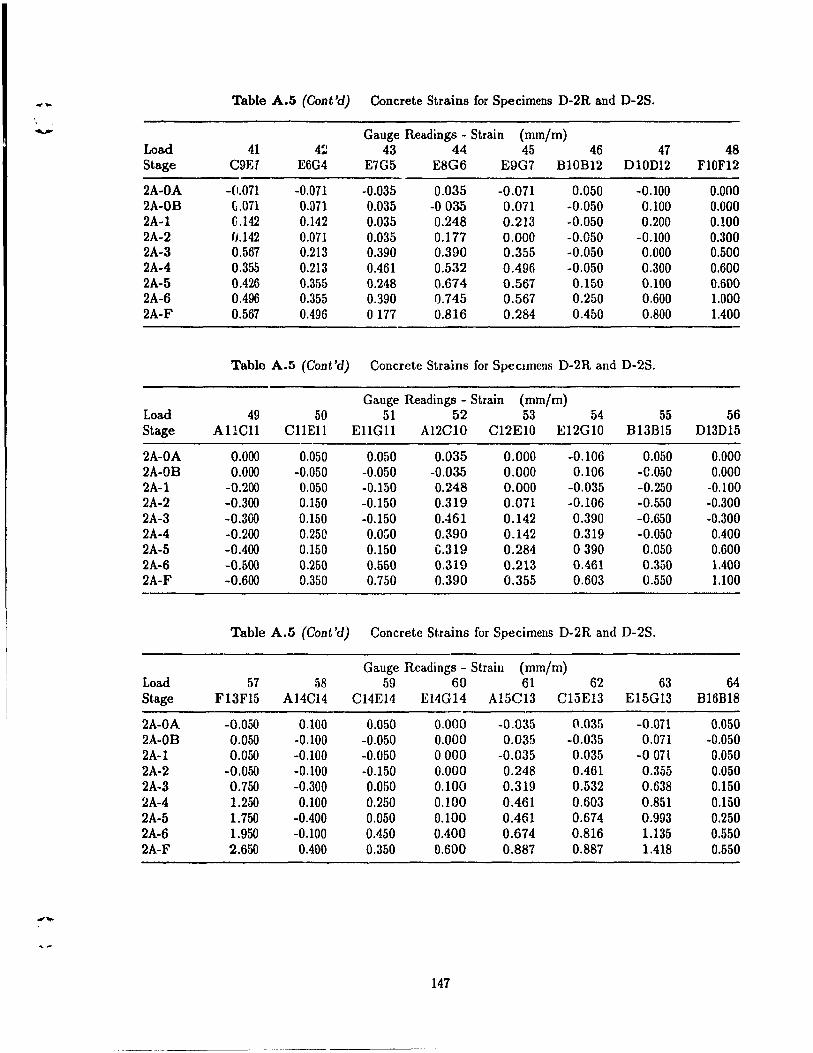
Table A.5 (Gont'd) Con crete Strains for Specimens D-2R and D-2S.
- Gauge Reaclings - Strain (mm/m) Load 41 4~ 43 44 45 46 47 48 Stage C9ET E6G4 E7G5 E8G6 E9G7 BI0B12 D10Dl2 FlOF12
2A-OA -(1.071 -0.071 -0.035 0.035 -0.071 0.050 -0.100 0.000 2A-OB (j.071 0.071 0.035 -0035 0.071 -0.050 0.100 0.000 2A-l C.142 0.142 0.035 0.248 0.213 -0.050 0.200 0.100 2A-2 (J.142 0.071 0.035 0.177 0.000 -0.050 -0.100 0.300 2A-3 0.567 0.213 0.390 0.390 0.355 -0.050 0.000 0.500 2A-4 0.355 0.213 00461 0.532 0.496 -0.050 0.300 0.600 2A-5 0.426 0.355 0.248 0.674 0.567 0.150 0.100 0.600 2A-6 00496 0.355 0.390 0.745 0.567 0.250 0.600 1.000 2A-F 0.567 0.496 0177 0.816 0.284 OAbO 0.800 1.400
Table A.5 (Gont'd) Con crete Strains for SpeCImens D-2R and D-2S.
Gauge Readings - Strain (mmfm) Load 49 50 51 52 53 54 55 56 Stage AllCU CllEU EllGll A12ClO C12E10 B12G10 B13B15 D13D15
2A-OA 0.000 0.050 0.050 0.035 0.000 -0.106 0.050 0.000 2A-OB 0.000 -0.050 -0.050 -0.035 0.000 0.106 -C.050 0.000 2A-l -0.200 0.050 -0.150 0.248 0.000 -0.035 -0.250 -0.100 2A-2 -0.300 0.150 -0.150 0.319 0.071 -0.106 -0.550 -0.300 2A-3 -0.300 0.150 -0.150 0.461 0.142 0.390 -0.650 ~0.300
2A-4 -0.200 0.250 O.OW 0.390 0.142 0.319 -0.050 0.400 2A-5 -00400 0.150 0.150 G.319 0.284 0390 0.050 0.600 2A-6 -0.500 0.250 0.550 0.319 0.213 0.461 0.350 1.400 2A-F -0.600 0.350 0.750 0.390 0.355 0.603 0.550 1.100
Table A.5 (Gont'd) Con crete Strains for Specimens D-2R and D-2S.
Gauge Rcadings - Straill (mmfm) Load 57 58 59 60 61 62 63 64 Stage F13F15 A14C14 C14E14 E14G14 A15C13 C15E13 E15G13 B16B18
2A-OA -0.050 0.100 0.050 0.000 -0.035 0.035 -0.071 0.050 2A-OB 0.050 -0.100 -0.050 0.000 0.035 -0.035 0.071 -0.050 2A-l 0.050 -0.100 -0.050 0000 -0.035 0.035 -0 on 0.050 2A-2 -0.050 -0.100 -0.150 0.000 0.248 0.461 0.355 0.050 2A-3 0.750 -0.300 0.050 0.100 0.319 0.532 0.638 0.150 2A-4 1.250 0.100 0.250 0.100 0.461 0.603 0.851 0.150 2A-5 1.750 -0.400 0.050 0.100 0.461 0.674 0.993 0.250 2A-6 1.950 -0.100 0,450 00400 0.674 0.816 1.135 0.550 2A-F 2.650 0.400 0.350 0.600 0.887 0.887 1.418 0.550
147
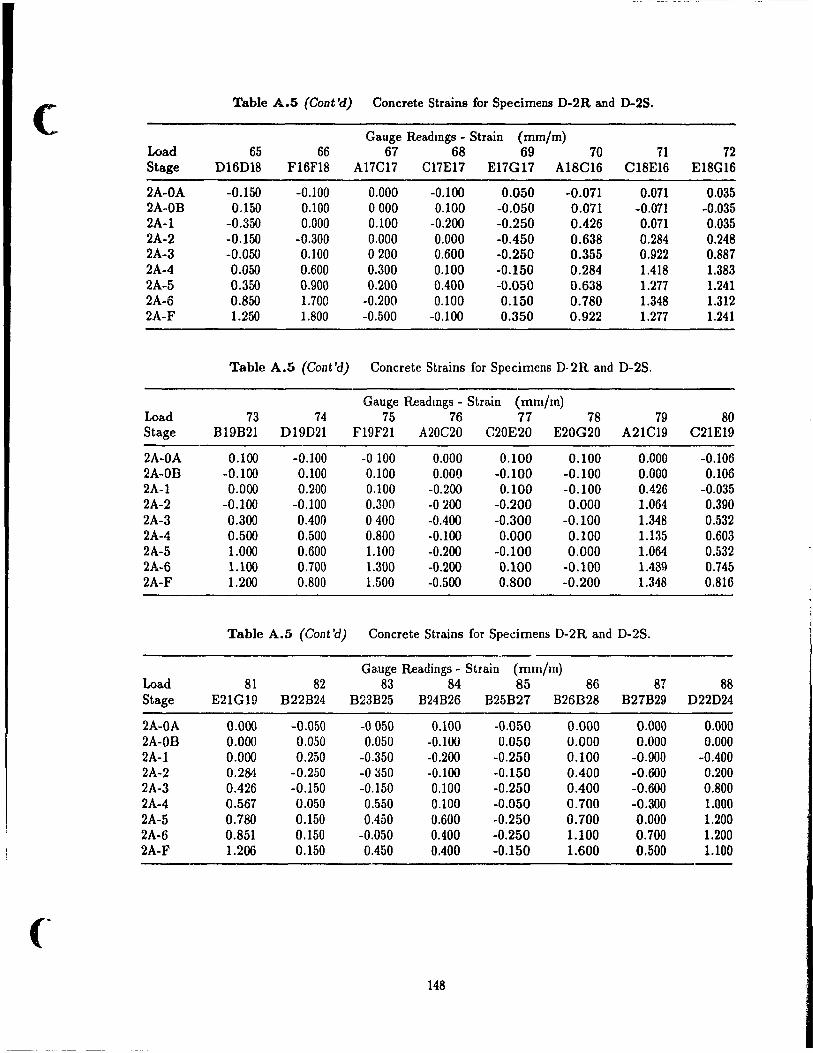
( Table A.5 (Cont'd) Concrete Strains for Specimens 0-2R and 0-25.
Gauge Readmgs - 5train (mm/m) Load 65 66 67 68 69 70 71 72 Stage D16D18 F16F18 A17C17 C17E17 E17G17 A18C16 C18E16 E18G16
2A-OA -0.150 -0.100 0.000 -0.100 0.050 -0.071 0.071 0.035 2A-OB 0.150 0.100 0000 0.100 -0.050 0.071 -0.071 -0.035 2A-1 -0.350 0.000 0.100 -0.200 -0.250 0.426 0.071 0.035 2A-2 -0.150 -0.300 0.000 0.000 -0.450 0.638 0.284 0.248 2A-3 -0.050 0.100 0200 0.600 -0.250 0.355 0.922 0.887 2A-4 0.050 0.600 0.300 0.100 -0.150 0.284 1.418 1.383 2A-5 0.350 0.900 0.200 0.400 -0.050 0.638 1.277 1.241 2A-6 0.850 1.700 -0.200 0.100 0.150 0.780 1.348 1.312 2A-F 1.250 1.800 -0.500 -0.100 0.350 0.922 1.277 1.241
Table A.5 (Cont'd) Concrete Strains for Specimens D· 2R and 0-2S.
Gauge Readmgs - Strain (mm/m) Load 73 74 75 76 77 78 79 80 Stage B19B21 D19D21 F19F21 A20C20 C20E20 E20G20 A21C19 C21E19
2A-OA 0.100 -0.100 -0100 0.000 0.100 0.100 0.000 -0.106 2A-OB -0.100 0.100 0.100 0.000 -0.100 -0.100 0.000 0.106 2A-l 0.000 0.200 0.100 -0.200 0.100 -0.100 0.426 -0.035 2A-2 -0.100 -0.100 0.300 -0200 -0.200 0.000 1.064 0.390 2A-3 0.300 00400 0400 -00400 -0.300 -0.100 1.348 0.532 2A-4 0.500 0.500 0.800 -0.100 0.000 0.100 1.135 0.603 2A-5 1.000 0.600 1.100 -0.200 -0.100 0.000 1.064 0.532 2A-6 1.100 0.700 1.300 -0.200 0.100 -0.100 1.489 0.745 2A-F 1.200 0.800 1.500 -0.500 0.800 -0.200 1.348 0.816
Table A.5 (Cont'd) Con crete Strains for Specimens D-2R and D-28.
Ga.uge Readings - 8train (mm/m) Load 81 82 83 84 85 86 87 88 Stage E21G19 B22B24 B23B25 B24B26 B25B27 B26B28 B27B29 D22D24
2A-OA 0.000 -0.050 -0050 0.100 -0.050 0.000 0.000 0.000 2A-OB 0.000 0.050 0.050 -0.100 0.050 0.000 0.000 0.000 2A-l 0.000 0.250 -0.350 -0.200 -0.250 0.100 -0.900 -0.400 2A-2 0.284 -0.250 -0 :150 -0.100 -0.150 0.400 -0.600 0.200 2A-3 0.426 -0.150 -0.150 0.100 -0.250 0.400 -0.600 0.800 2A-4 0.567 0.050 0.550 0.100 -0.050 0.700 -0.300 1.000 2A-5 0.780 0.150 0.450 0.600 -0.250 0.700 0.000 1.200 2A-6 0.851 0.150 -0.050 0.400 -0.250 1.100 0.700 1.200 2A-F 1.206 0.150 0.450 0.400 -0.150 1.600 0.500 1.100
148
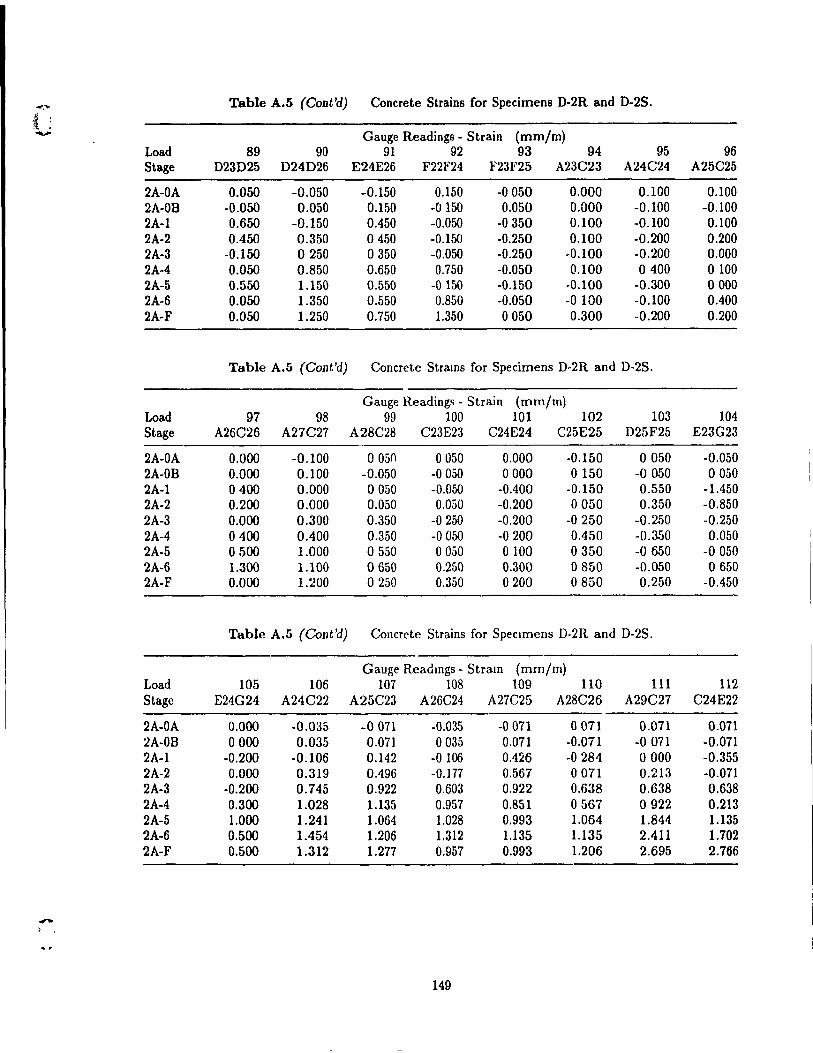
4'"'" Table A.5 (Gont'd) Concrete Strains for Specimens D-2R and D-2S. ( : , . - Gauge Readings - Strain (mm/m)
Load 89 90 91 92 93 94 95 96 Stage D23025 024026 E24E26 F22F24 F23F25 A23C23 A24C24 A25C25
2A-OA 0.050 -0.050 -0.150 0.150 -0050 0.000 0.100 0.100 2A-OB -0.050 0.050 0.150 -0150 0.050 0.000 -0.100 -0.100 2A-l 0.650 -0.150 0.450 -0.050 -0350 0.100 -0.100 0.100 2A-2 0.450 0.350 0450 -0.150 -0.250 0.100 -0.200 0.200 2A-3 -0.150 0250 0350 -0.050 -0.250 -0.100 -0.200 0.000 2A-4 0.050 0.850 0.650 0.750 -0.050 0.100 0400 0100 2A-5 0.550 1.150 0.550 -0150 -0.150 -0.100 -0.300 0000 2A-6 0.050 1.350 0.550 0.850 -0.050 -0100 -0.100 0.400 2A-F 0.050 1.250 0.750 1.350 0050 0.300 -0.200 0.200
Table A.5 (Gont'd) Con crete Strams for Specimens D-2R and D-2S.
Gauge Readings - Strain (mm/m) Load 97 98 99 100 101 102 103 104 Stage A26C26 A27C27 A28C28 C23E23 C24E24 C25E25 D25F25 E23G23
2A-OA 0.000 -0.100 o 05() 0050 0.000 -0.150 0050 -0.050 2A-OB 0.000 0.100 -0.050 -0050 0000 0150 -0050 0050 2A-l 0400 0.000 0050 -0.050 -0.400 -0.150 0.550 -1.450 2A-2 0.200 0.000 0.050 0.050 -0.200 0050 0.350 -0.850 2A-3 0.000 0.300 0.350 -0250 -0.200 -0250 -0.250 -0.250 2A-4 0400 0.400 0.350 -0050 -0200 0.450 -0.350 0.050 2A-5 0500 1.000 0550 0050 0100 0350 -0650 -0050 2A-6 1.300 1.100 0650 0.250 0.300 0850 -0.050 0650 2A-F 0.000 1.200 0250 0.350 0200 0850 0.250 -0.450
Table A.5 (Gont'd) Concrete Strains for Specimens D-2R and D-2S.
Gauge Readmgs - Stram (mm/m) Load 105 106 107 108 109 110 111 112 Stage E24G24 A24C22 A25C23 A26C24 A27C25 A28C26 A29C27 C24E22
2A-OA 0.000 -0.035 -0 071 -0.035 -0 071 0071 0.071 0.071 2A-OB 0000 0.035 0.071 0035 0.071 -0.071 -0071 -0.071 2A-l -0.200 -0.106 0.142 -0106 0.426 -0284 0000 -0.355 2A-2 0.000 0.319 0.496 -0.177 0.567 0071 0.213 -0.071 2A-3 -0.200 0.745 0.922 0.603 0.922 0.638 0.638 0.638 2A-4 0.300 1.028 1.135 0.957 0.851 0567 0922 0.213 2A-5 1.000 1.241 1.064 1.028 0.993 1.064 1.844 1.135 2A-6 0.500 1.454 1.206 1.312 1.135 1.135 2.411 1.702 2A-F 0.500 1.312 1.277 0.957 0.993 1.206 2.695 2.766
, . ,
149
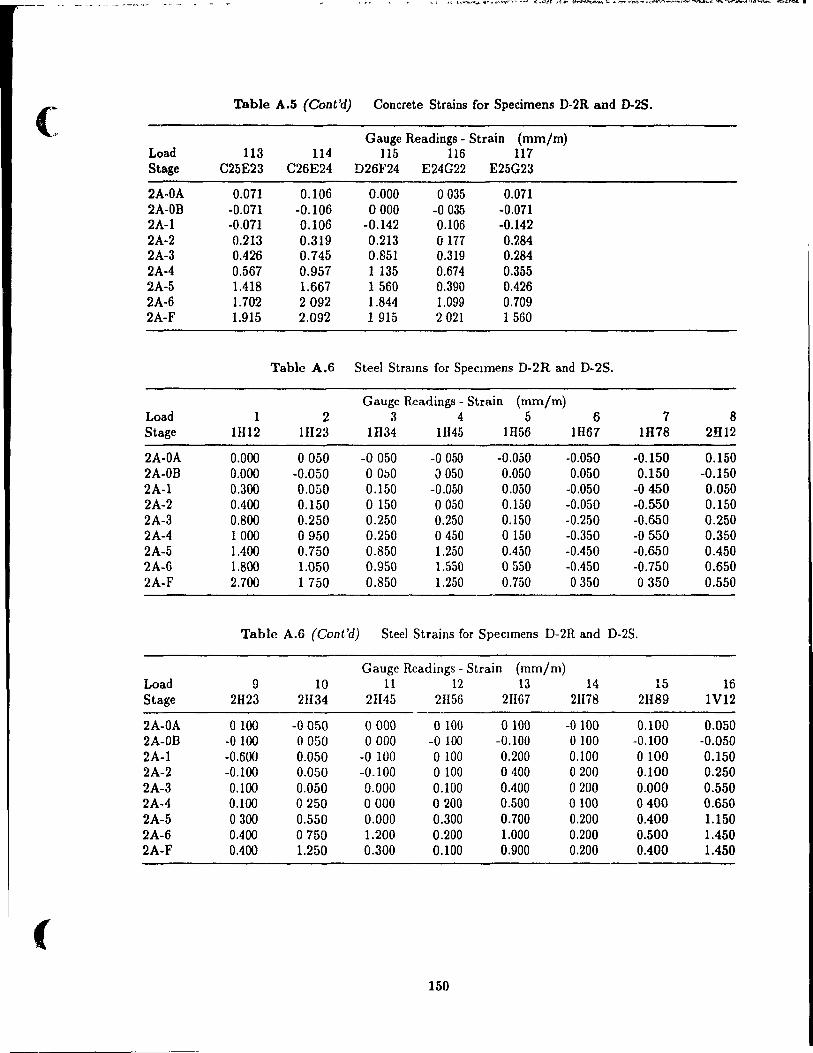
<: Table A.5 (Cont'd) Concrete Strains for Specimens D-2R and D-2S.
Gauge Readings - Strain (mm/m) Load 113 114 115 116 117 Stage C25E23 C26E24 D26F24 E24G22 E25G23
2A-OA 0.071 0.106 0.000 0035 0.071 2A-OB -0.071 -0.106 0000 -0035 -0.071 2A-l -0.071 0.106 -0.142 0.106 -0.142 2A-2 0.213 0.319 0.213 0177 0.284 2A-3 0.426 0.745 0.851 0.319 0.284 2A-4 0.567 0.957 1135 0.674 0.355 2A-5 1.418 1.667 1 560 0.390 0.426 2A-6 1.702 2092 1.844 1.099 0.709 2A-F 1.915 2.092 1 915 2021 1560
Table A.6 Steel Strams for Specimens D-2R and D-2S.
Gauge Readings - Strain (mm/m) Load 1 2 3 4 5 6 7 8 Stage IH12 IH23 1H34 1H45 1H56 1H67 IH78 2H12
2A-OA 0.000 0050 -0050 -0050 -0.050 -0.050 -0.150 0.150 2A-OB 0.000 -0.050 o 0t>0 \) 050 0.050 0.050 0.150 -0.150 2A-l 0.300 0.050 0.150 -0.050 0.050 -0.050 -0450 0.050 2A-2 0.400 0.150 o 150 0050 0.150 -0.050 -0.550 0.150 2A-3 0.800 0.250 0.250 0.250 0.150 -0.250 -0.650 0.250 2A-4 1000 0950 0.250 0450 0150 -0.350 -0550 0.350 2A-5 1.400 0.750 0.850 1.250 0.150 -0.450 -0.650 0.450 2A-6 1.800 1.050 0.950 1.550 0550 -0.450 -0.750 0.650 2A-F 2.700 1 750 0.850 1.250 0.750 0350 0350 0.550
Table A.6 (Cont 'd) Steel Strains for Specimens D-2R and D-2S.
Gauge Readings - Strain (mm/m) Load 9 10 11 12 13 14 15 16 Stage 2H23 2H34 21145 2I156 2II67 2II78 2H89 IV12
2A-OA 0100 -0050 0000 0100 0100 -0100 0.100 0.050 2A-OB -0100 0050 0000 -0100 -0.100 0100 -0.100 -0.050 2A-l -0.600 0.050 -0 100 0100 0.200 0.100 0100 0.150 2A-2 -0.100 0.050 -0.100 o 100 0400 0200 0.100 0.250 2A-3 0.100 0.050 0.000 0.100 0.100 0200 0.000 0.550 2A-4 0.100 0250 0000 0200 0.500 0100 0400 0.650 2A-5 0300 0.550 0.000 0.300 0.700 0.200 0.100 1.150 2A-6 0.400 0750 1.200 0.200 1.000 0.200 0.500 1.450 2A-F 0.400 1.250 0.300 0.100 0.900 0.200 0.400 1.450
(
150
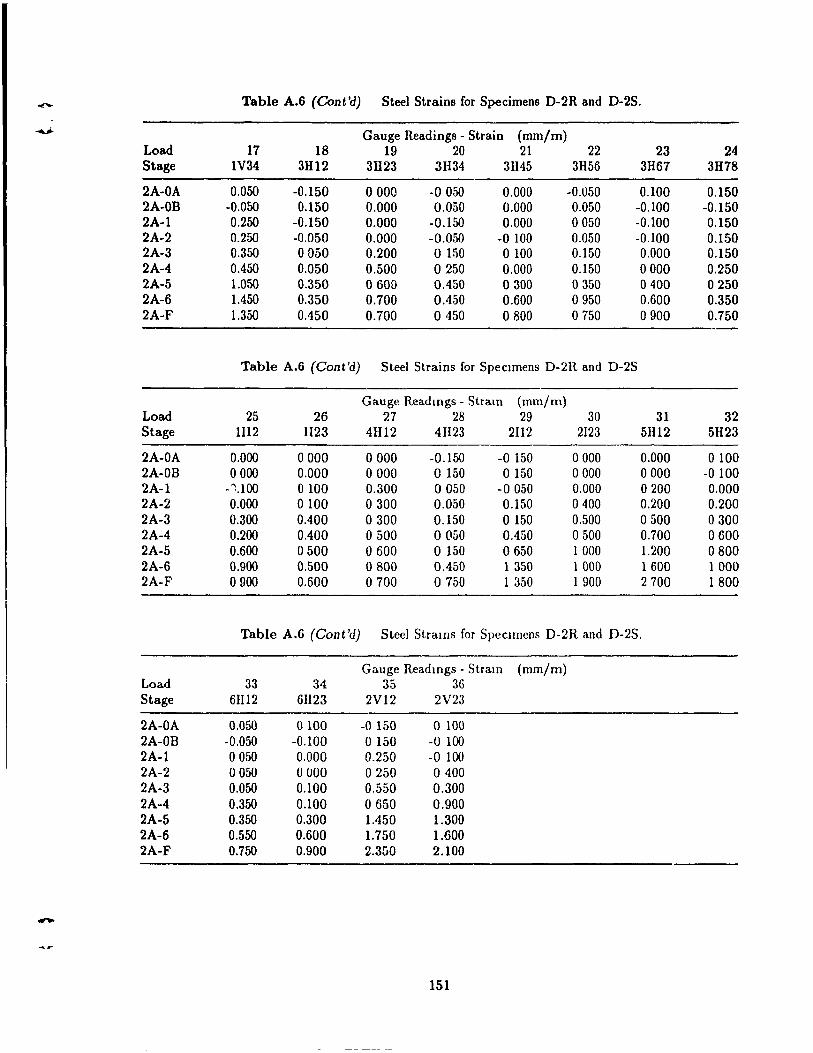
- Table A.6 (Cont'd) Steel Strains for Specimens D-2R and D-2S.
..... Gauge Readings - Strain (mm/m) Load 17 18 19 20 21 22 23 24 Stage IV34 3H12 3H23 3H34 31145 31156 31167 3H78
2A-OA 0.050 -0.150 0000 -0 050 0.000 -0.050 0.100 0.150 2A-OB -0.050 0.150 0.000 0.050 0.000 0.050 -0.100 -0.150 2A-l 0.250 -0.150 0.000 -0.150 0.000 0050 -0.100 0.150 2A-2 0.250 -0.050 0.000 -0.050 -0 100 0.050 -0.100 0.150 2A-3 0.350 0050 0.200 o 150 0100 0.150 0.000 0.150 2A-4 00450 0.050 0.500 0250 0.000 0.150 0000 0.250 2A-5 1.050 0.350 0600 0.450 0300 0350 0400 0250 2A-6 1.450 0.350 0.700 0.450 0.600 0950 0.600 0.350 2A-F 1.350 00450 0.700 0450 0800 0750 0900 0.750
Table A.6 (Cont'd) Steel Strains for Specimens D-2R and D-2S
Gauge Readmgs - Stram (mm/m) Load 25 26 27 28 29 30 31 32 Stage 1112 1I23 41112 41123 2112 2123 51112 5H23
2A-OA 0.000 0000 0000 -0.150 -0 150 0000 0.000 0100 2A-OB 0000 0.000 0000 o 150 a 150 0000 0000 -0100 2A-l -'\100 0100 0.300 0050 -0050 0.000 0200 0.000 2A-2 0.000 0100 0300 0.050 0.150 0400 0.200 0.200 2A-3 0.300 00400 0300 0.150 0150 0.500 0500 0300 2A-4 0.200 00400 0500 0050 0.450 0500 0.700 0600 2A-5 0.600 0500 0600 o 150 0650 1000 1.200 0800 2A-6 0.900 0.500 0800 0.450 1 350 1000 1600 1000 2A-F 0900 0.600 0700 0750 1 350 1 900 2700 1800
Table A.6 (Cont'd) Steel Strams for Specimens D-2R and D-2S.
Gauge Readmgs - Stram (mm/m) Load 33 34 35 36 Stage 6II12 61123 2V12 2V23
2A-OA 0.050 0100 -0 150 a 100 2A-OB -0.050 -0.100 0150 -0 100 2A-l 0050 0.000 0.250 -0 100 2A-2 0050 0000 0250 0400 2A-3 0.050 0.100 0.550 0.300 2A-4 0.350 0.100 0650 0.900 2A-5 0.350 0.300 1.450 1.300 2A-6 0.550 0.600 1.750 1.600 2A-F 0.750 0.900 2.350 2.100
-151
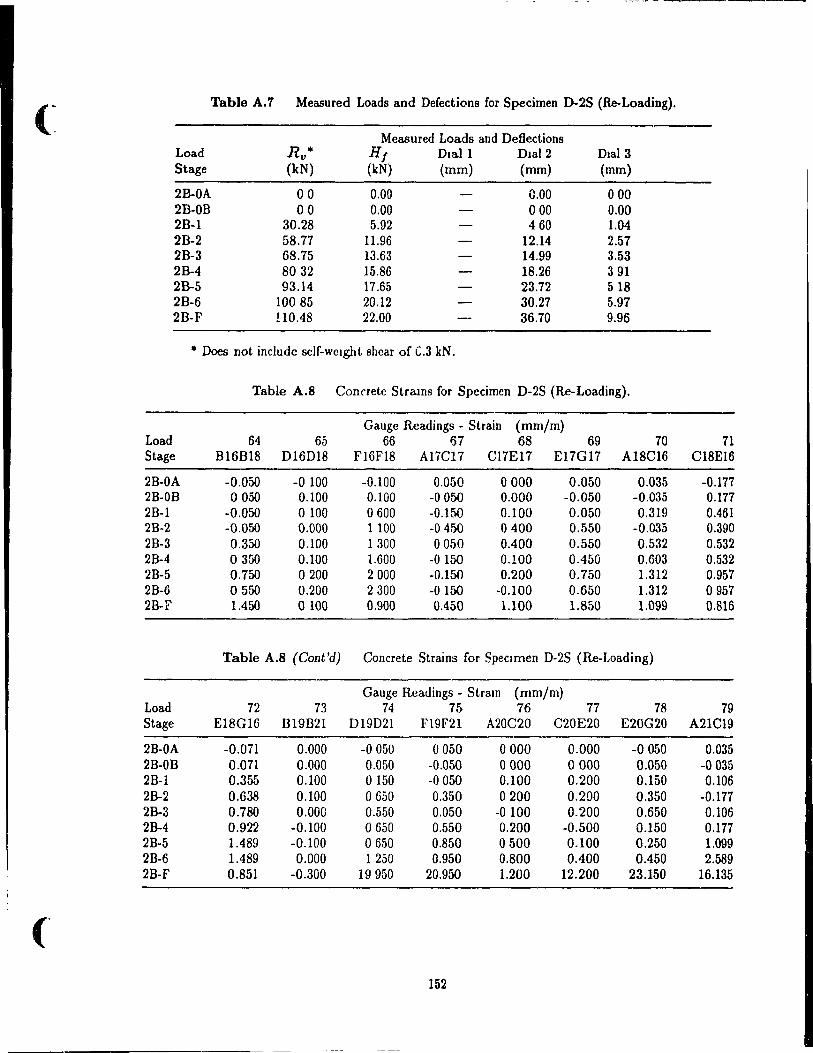
(~ Table A.7 Measured Loads and Defections for Specimen D-2S (Re-Loading).
Measured Loads and DeBections Load Rv· Hf Dlall Dlal2 Dlal3 Stage (kN) (kN) (mm) (mm) (mm)
2B-OA 00 0.00 0.00 000 2B-OB 00 0.00 000 0.00 2B-l 30.28 5.92 460 1.04 2B-2 58.77 11.96 12.14 2.57 2B-3 68.75 13.63 14.99 3.53 2B-4 8032 15.86 18.26 391 2B-5 93.14 17.65 23.72 518 2B-6 10085 20.12 30.27 5.97 2B-F 110.48 22.00 36.70 9.96
* Does not include self-welght shear of G.3 kN.
Table A.8 Conrrete Strams for Specimen D-2S (Re-Loading).
Gauge Readings - Strain (mm/m) Load 64 65 66 67 68 69 70 71 Stage B16B18 D16Dl8 F16F18 A17C17 C17E17 E17G17 A18C16 C18E16
2B-OA -0.050 -0100 -0.100 0.050 0000 0.050 0.035 -0.177 2B-OB 0050 0.100 0.100 -0050 0.000 -0.050 -0.035 0.177 2B-l -0.050 0100 0600 -0.150 0.100 0.050 0.319 0.461 2B-2 -0.050 0.000 1 100 -0450 0400 0.550 -0.035 0.390 2B-3 0.350 0.100 1300 0050 0.400 0.550 0.532 0.532 2B-4 0350 0.100 1.600 -0150 0.100 0.450 0.603 0.532 2B-5 0.750 0200 2000 -0.150 0.200 0.750 1.312 0.957 2B-6 0550 0.200 2300 -0150 -0.100 0.650 1.312 0957 2B-F 1.450 0100 0.900 0.450 1.100 1.850 1.099 0.816
Table A.8 (Cont'd) Con crete Strains for Specimen D-2S (Re-Loading)
Gauge Readings - Stram {mm/m} Load 72 73 74 75 76 77 78 79 Stage E18G16 B19B21 D19D21 Fl9F21 A20C20 C20E20 E20G20 A21C19
2B-OA -0.071 0.000 -0050 0050 0000 0.000 -0050 0.035 2B-OB 0.071 0.000 0.050 -0.050 0000 0000 0.050 -0035 2B-1 0.355 0.100 0150 -0050 0.100 0.200 0.150 0.106 2B-2 0.638 0.100 0650 0.350 0200 0.200 0.350 -0.177 2B-3 0.780 0.000 0.550 0.050 -0100 0.200 0.650 0.106 2B-4 0.922 -0.100 0650 0.550 0.200 -0.500 0.150 0.177 2B-5 1.489 -0.100 0650 0.850 0500 0.100 0.250 1.099 2B-6 1.489 0.000 1250 0.950 0.800 0.400 0.450 2.589 2B-F 0.851 -0.300 19950 20.950 1.200 12.200 23.150 16.135
('
152
-------------- ------
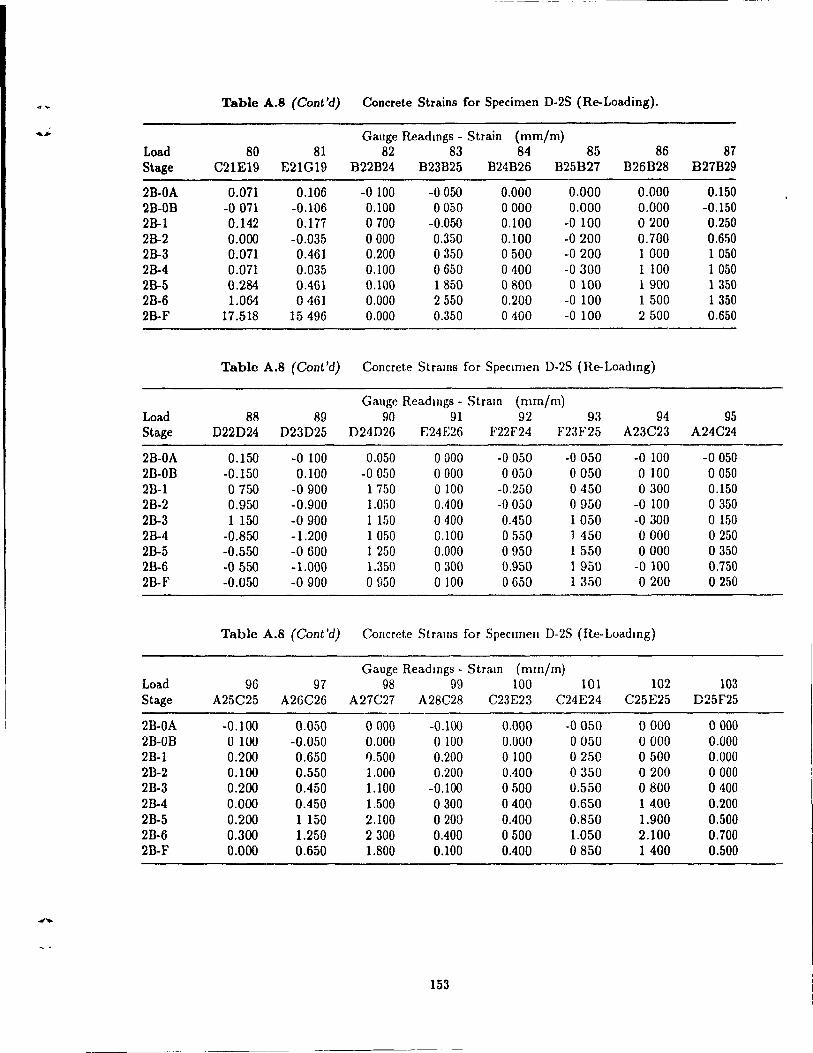
------ -- ~~~~~~-~~~~~~
Table A.8 (Cont'd) Concrete Strains for Specimen D-2S (Re-Loading).
...... Gauge ReadlOgs - Strain (mm/m) Load 80 81 82 83 84 85 86 87 Stage C21E19 E21G19 B22B24 B23B25 B24B26 B25B27 B26B28 B27B29
2B-OA 0.071 0.106 -0100 -0050 0.000 0.000 0.000 0.150 2B-OB -0071 -0.106 0.100 0050 0000 0.000 0.000 -0.150 2B-1 0.142 0.177 0700 -0.050 0.100 -0100 0200 0.250 2B-2 0.000 -0.035 0000 0.350 0.100 -0200 0.700 0.6liO 2B-3 0.071 0.461 0.200 0350 0500 -0200 1 000 1050 2B-4 0.071 0.035 0.100 0650 0400 -0300 1 100 1050 2B-5 0.284 0.461 0.100 1850 0800 0100 1900 1350 2B-6 1.064 0461 0.000 2550 0.200 -0 100 1 500 1350 2B-F 17.518 15496 0.000 0.350 0400 -0 100 2500 0.650
Table A.8 (Cont'd) Con crete Strams for Specimen D-2S (Re-Loadmg)
Gauge Readmgs - Stram (mm/m) Load 88 89 90 91 92 93 94 95 Stage D22D24 D23D25 D24D26 E24E26 F22F24 F23F25 A23C23 A24C24
2B-OA 0.150 -0 100 0.050 0000 -0050 -0050 -0 100 -0050 2B-OB -0.150 0.100 -0050 0000 0050 0050 o 100 0050 2B-l 0750 -0900 1 750 0100 -0.250 0450 0300 0.150 2B-2 0.950 -0.900 1.01iO 0.400 -0050 0950 -0 100 0350 2B-3 1 150 -0900 1 HiO 0400 0.450 1050 -0300 0150 2B-4 -0.850 -1.200 1050 0.100 0550 J 450 0000 0250 2B-5 -0.550 -0600 1 250 0.000 0950 1 550 0000 0350 2B-6 -0550 -1.000 1.350 0300 0.950 1950 -0 100 0.750 2B-F -0.050 -0900 0930 0100 0650 1350 0200 0250
Table A.8 (Cont'd) Concrete Strams for Specimen D-2S (Re-Loadmg)
Gauge Readlllgs - Stram (mm/m) Load 96 97 98 99 100 101 102 103 Stage A25C25 A26C26 A27C27 A28C28 C23E23 C24E24 C25E25 D25F25
2B-OA -0.100 0.050 0000 -0.100 0.000 -0050 0000 0000 2B-OB 0100 -0.050 0.000 0100 0.000 0050 0000 0.000 2B-l 0.200 0.650 iJ.500 0.200 0100 0250 0500 0.000 2B-2 0.100 0.550 1.000 0.200 00400 0350 0200 0000 2B-3 0.200 0.450 1.100 -0.l00 0500 0.550 0800 0400 2B-4 0.000 0.450 1.500 0300 0400 0.650 1400 0.200 2B-5 0.200 1 150 2.100 0200 0.400 0.850 1.900 0.500 2D-6 0.300 1.250 2300 0.400 0500 1.050 2.100 0.700 2B-F 0.000 0.650 1.800 0.100 0.400 0850 1400 0.500
153
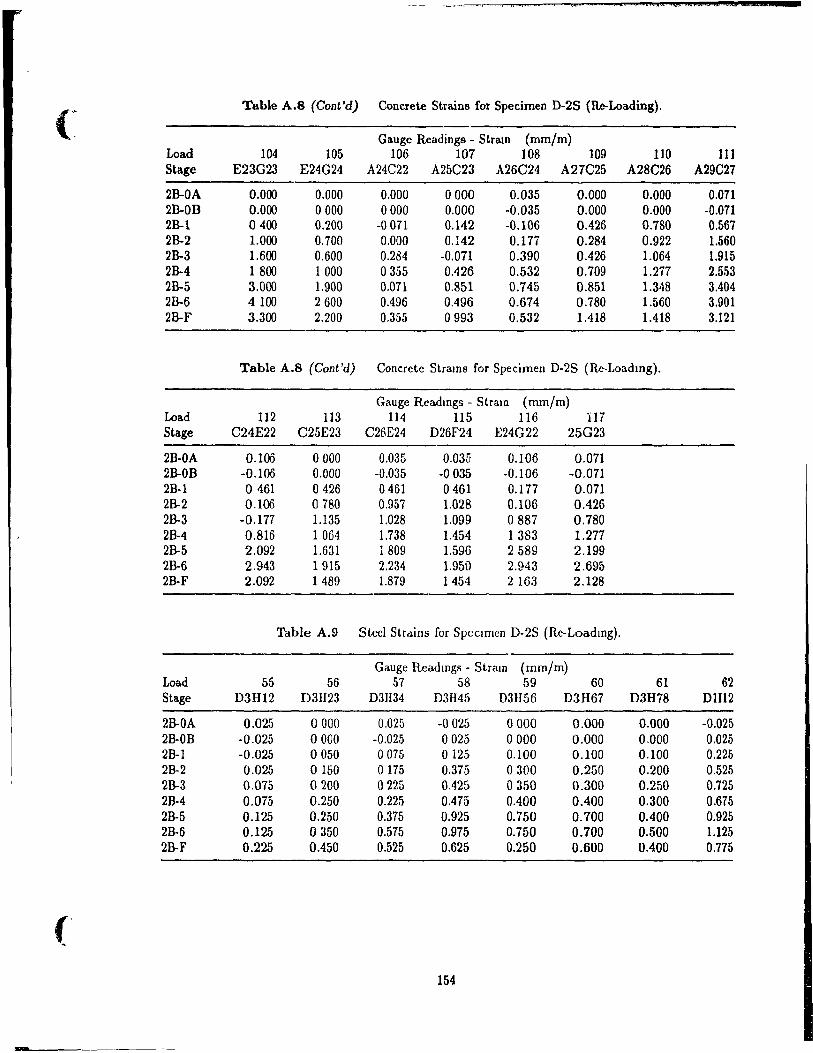
cc , e Al! ot "PnOM œs $
{~ Table A.8 (Cont'd) Concrete Strains for Specimen D-2S (Re-Loading).
Gauge Readings - Stram (mm/m) Load 104 105 106 107 108 109 110 111 Stage E23G23 E24G24 A24C22 A25C23 A26C24 A27C25 A28C26 A29C27
28-0A 0.000 0.000 0.000 0000 0.035 0.000 0.000 0.071 2B-OB 0.000 0000 0000 0.000 -0.035 0.000 0.000 -0.071 28-1 0400 0.200 -0071 0.142 -0.106 0.426 0.780 0.567 28-2 1.000 0.700 0.000 0.142 0.177 0.284 0.922 1.560 28-3 1.600 0.600 0.284 -0.071 0.390 0.426 1.064 1.915 28-4 1800 1000 0355 0.426 0.532 0.709 1.277 2.553 28-5 3.000 1.900 0.071 0.851 0.745 0.851 1.348 3.404 2B-6 4100 2600 0.496 0.496 0.674 0.780 1.560 3.901 28-F 3.300 2.200 0.355 0993 0.532 1.418 1.418 3.121
Table A.8 (Cont'd) Concrete Strams for Specimen D-2S (Re-Loadmg).
Gauge Readmgs - Stram (mm/m) Load 112 113 114 115 116 117 Stage C24E22 C25E23 C26E24 D26F24 E24G22 25G23
28-0A 0.106 0000 0.03& 0.035 0.106 0.071 28-0B -0.106 0.000 -0.035 -0035 -0.106 -0.071 28-1 0461 0426 0461 0461 0.117 0.071 28-2 0.106 0780 0.957 1.028 0.106 0.426 28-3 -0.177 1.135 1.028 1.099 0887 0.780 2B-4 0.816 1064 1.738 1.454 1383 1.277 28-5 2.092 1.631 1809 1.596 2589 2.199 2B-6 2.943 1915 2.234 1.950 2.943 2.695 2B-F 2.092 1489 1.879 1454 2163 2.128
Table A.9 Steel Sttains for Specimen D-2S (Re-Loadmg).
Gauge Readmgs - Stram (mm/m) Load 55 56 57 58 59 60 61 62 Stage D3H12 D3H23 D3H34 D3H45 D31I56 D3H67 D3H78 D1I12
2B-OA 0.025 0000 0.025 -002.5 0000 0.000 0.000 -0.025 28-0B -0.025 0000 -0.025 0025 0000 0.000 0.000 0.025 2B-1 -0.025 0050 0075 0125 0.100 0.100 0.100 0.225 28-2 0.025 0150 0175 0.375 0300 0.250 0.200 0.525 28-3 0.075 0200 0225 0,425 0350 0.300 0.250 0.725 28-4 0.075 0.250 0.225 0.475 0.400 0.400 0.300 0.675 2B-5 0.125 0.250 0.375 0.925 0.750 0.700 0.400 0.925 2B-6 0.125 0350 0.575 0.975 0.750 0.700 0.500 1.125 28-F 0.225 0.450 0.525 0.625 0.250 0.600 0.400 0.775
154
-
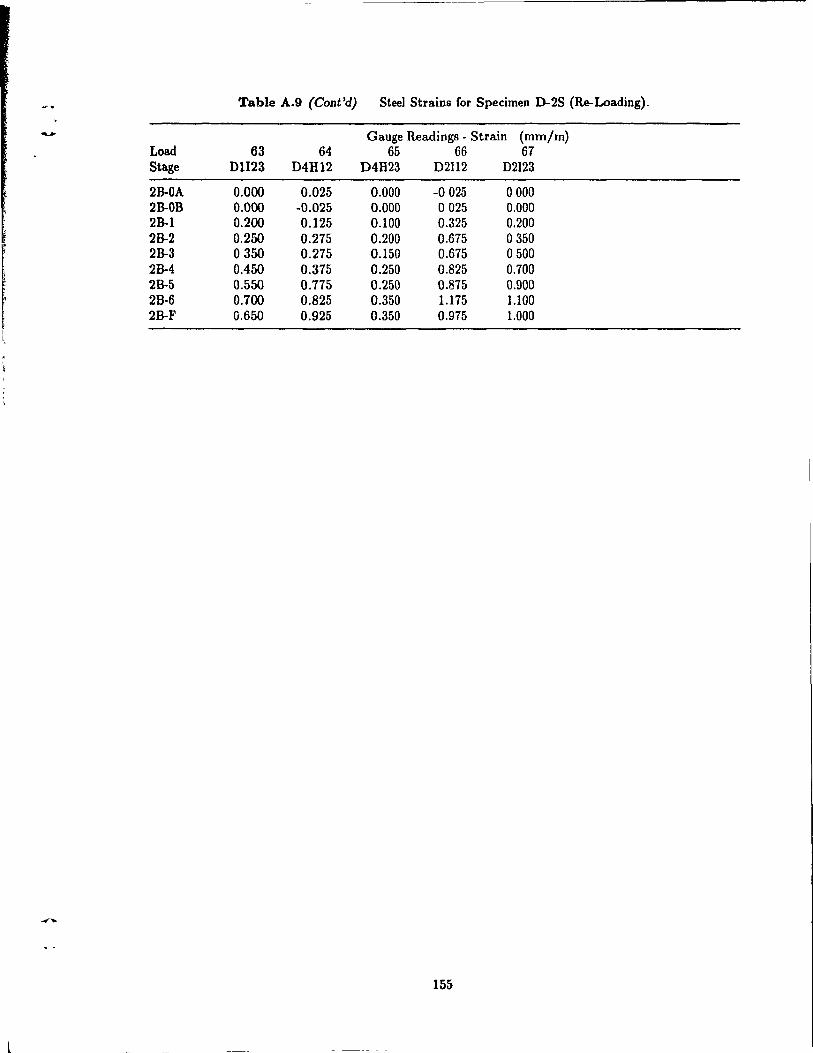
Table A.9 (Cont'd) Steel Straios for Specimen D-2S (Re-Loading).
..., Gauge Readings - Strain (mm/m) Load 63 64 65 66 67 Stage D1I23 D4H12 D4H23 D2112 D2123
2B-OA 0.000 0.025 0.000 -0025 0000 28-0B 0.000 -0.025 0.000 0025 0.000 28-1 0.200 0.125 0.100 0.325 0.200 28-2 0.250 0.275 0.200 0.675 0350 28-3 0350 0.275 0.150 0.675 0500 28-4 0.450 0.375 0.250 0.825 0.700 2B-5 0.550 0.775 0.250 0.875 0.900 28-6 0.700 0.825 0.350 1.175 1.100 2B-F 0.650 0.925 0.350 0.975 1.000
155