the benefits of growth · marlon g. boarnet marlon g. boarnet earned his phd from princeton...
TRANSCRIPT

A ULI Working Paper on Land Use Policy
$ Urban Land Institute
The Benefitsof Growth
$ Urban Land Institute
The Benefitsof Growth
Robert W. WassmerMarlon G. Boarnet
About ULI–the Urban Land InstituteULI–the Urban Land Institute is a nonprofit education and research institute that is supported by its members. Its mis-sion is to provide responsible leadership in the use of land in order to enhance the total environment.
ULI sponsors education programs and forums to encourage an open international exchange of ideas and sharing ofexperiences; initiates research that anticipates emerging land use trends and issues and proposes creative solutionsbased on that research; provides advisory services; and publishes a wide variety of materials to disseminate informationon land use and development. Established in 1936, the Institute today has more than 16,000 members and associatesfrom more than 60 countries representing the entire spectrum of the land use and development disciplines.
ULI Working Papers on Land Use Policy. ULI is in the forefront of national discussion and debate on the leading landuse policy issues of the day. To encourage and enrich that dialogue, ULI publishes summaries of its forums on land usepolicy topics and commissions papers by noted thinkers in land use on a range of topics relevant to its research andeducation agenda. Through its Working Papers on Land Use Policy series, the Institute hopes to increase the body ofknowledge and offer useful insights that contribute to improvements in the quality of land use policy and real estatedevelopment practice throughout the country.
Richard M. RosanPresident

About This PaperThe Urban Land Institute is recognized as the leading realestate and land use research and education organization inthe United States. For more than 60 years, we have servedas a forum for discussion among diverse interests on a hostof issues relating to real estate practice and land use policy.
The Benefits of Growth is the first in a series of papers bynoted authors that ULI hopes to publish on land use policyissues of pressing concern to our members and the broaderreal estate and land use community. In this paper, wehave asked Professors Robert W. Wassmer and Marlon G.Boarnet to share their thinking on the benefits of growthas a way to understand better why communities shouldconsider accommodating growth rather than opposing it.The ideas and insights in this paper are those of theauthors and do not necessarily represent the views of allULI members.
We believe that by publishing this paper and others like itin our series ULI Working Papers on Land Use Policy, wecontinue to raise and illuminate topics of interest andimportance to our members. We hope this paper andothers to follow accomplish that goal.
As always, your comments and insights are welcome.
Richard M. RosanPresident
ULI Project StaffRachelle L. LevittSenior Vice President, Policy and PracticePublisher
Marta V. GoldsmithVice President, Land Use PolicyProject Director
Nancy H. StewartDirector, Book Program
James A. MulliganManaging Editor
Laura Glassman, Publications Professionals, LLCCopy Editor
Betsy VanBuskirkArt Director
Meg BatdorffGraphic Designer
Diann Stanley-AustinDirector, Publishing Operations
Gwen McCallAdministrative Assistant, Land Use Policy
Cover: Aerial perspective of Addison Circle,Addison, Texas, RTKL, 1999
Recommended bibliographic listing:Wassmer, Robert W., and Marlon G. Boarnet. The Benefits of Growth.Washington, D.C.: ULI–the Urban Land Institute, 2001.
ULI Catalog Number: 664
©2002 by ULI–the Urban Land Institute1025 Thomas Jefferson Street, N.W.Suite 500 WestWashington, D.C. 20007-5201
Printed in the United States of America. All rights reserved. No part ofthis report may be reproduced in any form or by any means, electronicor mechanical, including photocopying and recording, or by any infor-mation storage and retrieval system, without written permission of thepublisher.
ii The Benefits of Growth
About the Authors
Robert W. WassmerRobert W. Wassmer is a professor of public policy andeconomics in the Graduate Program in Public Policy andAdministration at California State University, Sacramento.He earned his PhD in economics from Michigan StateUniversity in 1989 and previously taught at Wayne StateUniversity and Eastern Michigan University. ProfessorWassmer’s research and teaching interests are policy-oriented microeconomic analysis, state and local publicfinance, and urban economics. He has authored or co-authored more than 20 published articles on those sub-jects as well as two books: Readings in Urban Economics:Issues and Public Policy (Blackwell, 2000) and Bidding forBusiness: The Efficacy of Local Economic DevelopmentIncentives in a Metropolitan Area (with coauthor JohnAnderson, W.E. Upjohn Institute, 2000). For 2000 to 2002,he is serving as a visiting consultant to the CaliforniaSenate Office of Research. As the coordinator of the systemwide California State University Faculty ResearchFellows Program, he also manages a group of academicpublic policy consultants to the state of California. In fall 2000, Dr. Wassmer received the President’s Award for Research and Creative Activity from SacramentoState. Visit his Web site at: http://www.csus.edu/indiv/w/wassmerr.
Marlon G. BoarnetMarlon G. Boarnet earned his PhD from Princeton Uni-versity and is an associate professor of urban and regionalplanning and economics and a research associate of theInstitute of Transportation Studies at University of Cali-fornia (UC), Irvine. He is currently the faculty director of the master’s and PhD degrees in Urban and RegionalPlanning at UC-Irvine. His research interests include theeconomic and urban development impacts of highwayinfrastructure, the links between urban design and travelbehavior, and the determinants of population and em-ployment growth patterns within metropolitan areas.Professor Boarnet has authored or coauthored more than20 published articles on those topics, including the bookTravel by Design: The Influence of Urban Form on Travel(with coauthor Randall Crane, Oxford University Press,2001). He won the Best of ACSP award for one of threepapers presented at the 1997 meetings of the Associationof Collegiate Schools of Planning (ACSP) and the FannieMae Foundation prize for best paper on a housing andcommunity development topic presented at the 2000meetings of the ACSP. Professor Boarnet serves on theeditorial boards of the Journal of Regional Science andPapers in Regional Science. Visit his Web site at: http://www.seweb.uci/faculty/boarnet.htm.
A ULI Working Paper on Land Use Policy iii
AcknowledgmentsThe authors wish to thank the Urban Land Institute’s1999–2001 Chairman J. Ronald Terwilliger and ULIPresident Rick Rosan for the initial concept of this proj-ect and Marta Goldsmith, vice president for land usepolicy at ULI, for her guidance and many of the ideascontained in this paper. We also thank the participants of a one-day forum on the topic held on December 12,2000, that yielded and refined many of the ideas put forthhere. The participants in that forum included MichaelBeyard, Marlon Boarnet, William Bogart, Randall Crane,Robert Dunphy, William Fischel, Edward Glaeser, MartaGoldsmith, Jill Gottdiener, William Hudnut, Helen Ladd,Arthur Nelson, Douglas Porter, Richard Voith, RobertWassmer, and Smedes York. We also benefited fromcomments provided by Anthony Downs, Barbara Faga,David O’Neill, Ronald Silverman, and the discussionleaders (Terwilliger, James DeFrancia, Daniel Van Epp,and James Chaffin) and participants in breakout sessionson this topic held at the annual ULI leadership meeting on January 20, 2001. This project draws its financial sup-port from the Urban Land Institute.
iv The Benefits of Growth

Executive SummaryCommunities around the country often take a slow-growthor, in some cases, no-growth stance toward increases inpopulation or development, appearing to assume thatfurther growth is neither desirable nor inevitable. Yet,population growth in most parts of the United States isprojected to rise steadily over the next 25 years. Why isgrowth important, and what are its benefits? Growthgenerates new jobs, income, and tax revenue, and raisesproperty values, offering residents more choices anddiversity. Examining more closely the benefits of growthoffers insights into how to promote smart growth, tomanage better the impacts of growth, and to respond to local resistance.
This paper focuses on the short- and long-term benefitsof growth to local communities and larger regions. Growthis defined as an increase in population, employment, andnumber of housing units or nonresidential structures.The authors intentionally exclude detailed discussion ofthe costs of growth or strategies to minimize these costs.
The authors identify five short-term benefits and threelong-term benefits of growth.
In the short term, growth:
"Maintains the current standard of living, at a mini-mum;" Accommodates the steadily growing population of theUnited States that results from annual birthrates and im-migration levels that continue to outpace the number ofdeaths and the rate of out-migration;" Provides additional choices of where to live and work;" Generates new jobs, new income, new tax revenue, andhigher property values; and" Stimulates greater opportunities for the revitalizationof urban areas.
In the long term, growth:
" Lowers the costs of goods and services through greatereconomies of scale in production;" Allows businesses and people to shares resources moreefficiently through greater economies of scale from geo-graphic clustering; and" Provides more consumer choices, employment options,and social diversity.
To consider whether the benefits of growth outweigh thecosts, this paper compares scores calculated by the PlacesRated Almanac for eight quality-of-life factors in selected
high- and low-growth metropolitan areas in the UnitedStates. This comparison shows that growth clearly bene-fits metropolitan regions: the fastest-growing and mostpopulated metropolitan areas score higher on averagethan their slowest-growing and least populated counter-parts in most categories, including transportation, employ-ment, education, the arts, and recreation. However, thefastest-growing and most populated metropolitan areasscore lower on average on indicators for crime and costof living. On health care, though, the fastest-growing andleast populated metropolitan areas score lower.
A closer analysis reveals that while the benefits of growthapply to a region as a whole, the costs of regional growthare often borne by specific localities. Thus, communitiesmay seek to reject growth locally in order to enjoy theregional benefits while not having to bear its costs. Therisk is that if a majority of communities in a metropoli-tan area reject growth, the region as a whole is unlikely to grow and many of the benefits of growth will be lost.
The authors suggest ways to counteract this risk. In somecases, local resistance to growth may be dissipated by edu-cation about its benefits. However, for a region to realizethe full benefits of growth and to overcome local resistanceto it, the local benefits must outweigh the local costs. Publicpolicy can help ensure that this is the case through:
" State encouragement of regional cooperation or gover-nance; and" Appropriate fees that reflect the full social and publiccosts that growth in outlying, fringe suburban areas im-poses upon the entire metropolitan area. Such fees wouldencourage higher-density development in existing urban-ized areas that are better equipped to absorb growth.
Communities implementing policies that help all locali-ties in a metropolitan area to bear growth’s costs moreequitably will profit in the long term from the sharedbenefits of that growth.
A ULI Working Paper on Land Use Policy 1
Why Do We Need a Paperon the Benefits of Growth?Smart growth has never meant zero growth. The inher-ent principle of the smart-growth movement is planningfor the growth that will occur in a region in a mannerthat maximizes the benefits derived from this growthwhile minimizing its costs. For growth to be smart, acareful consideration of the benefits it produces, as wellthe costs, is necessary. In this paper, our intent is to offera description of only the benefits of growth that accrueto a region or locality experiencing growth. We purpose-fully do not discuss in detail the costs of growth or thestrategies that minimize those costs. In so doing, we real-ize that we cover only half the material needed to makeplanning decisions that result in smart growth. However,in many instances, the costs of growth have been clearlyarticulated, and a focus on benefits is needed to keep thepolicy discussion more balanced.
The prevailing assumption at ULI and elsewhere hasbeen that individuals and communities intuitively recog-nize the value of growth and, therefore, little need existsto enumerate or discuss those benefits. Yet, local resis-tance to growth, as well as other not-in-my-backyard(NIMBY) attitudes, continues throughout the UnitedStates. Increasingly, many communities are taking a slow-growth or, at times, no-growth stance. Such communitiesappear to believe that further growth is neither desirablenor inevitable. Thus, we see that a practical need exists toproduce a document that explores the local and regionalbenefits of growth. Growth, for most parts of the UnitedStates in the coming years, will be inevitable. So that thisinevitable growth can proceed in the “smartest” way pos-sible, policy makers and the private sector need to under-stand both what the costs and benefits of growth are andhow public and private decisions can influence the sizeand distribution of those costs and benefits.
In this paper, ULI has asked us to concentrate on thebenefits of growth, both to complement its earlier workon managing the costs of growth and to illustrate thatgrowth, when well managed, brings many benefits tolocal communities and larger regions. This paper describesthe benefits that arise from growth, provides quality-of-life comparisons of selected U.S. regions and cities thathave grown relative to those that have not, and discussesthe disconnect that often exists between the benefits thata region receives from further growth and the benefits
that accrue to a particular community in the regionwhere the growth actually occurs.
What FollowsIn the next section, we clarify what we mean by growthand why it is helpful to consider growth from both ashort- and long-term perspective; we then offer evidenceof the inevitability of growth in America’s future. Next,we offer five facts related to the short-term benefits ofgrowth, and three different facts on the long-term bene-fits of growth. By “facts,” we mean that the points we dis-cuss are supported by both theory and a large amount ofevidence. Although one might be able to cite exceptionsto some of the facts that follow, a large body of evidencesuggests that those are exceptions and not the norm.
We support these facts with simple explanations andreal-world examples. We also compare quality-of-lifeindicators between U.S. metropolitan regions that haveexperienced some of the greatest growth during the 1990sand similar metropolitan regions that have experiencedsubstantially less growth in recent years. We make thesame comparison between the most populated metro-politan areas in the United States and the least populated.In addition, we offer a comparison of the same quality-of-life indicators for pairs of metropolitan regions through-out the United States that were very similar in population30 years ago, but in which one of the pair experienced asignificant growth in population while the other did not(for instance, Austin, Texas, and Baton Rouge, Louisiana).
Next, we categorize a list of benefits of growth accordingto those that are primarily regional and those that areconfined to jurisdictions within the region. This analysisillustrates the point that NIMBYism often arises becausethe benefits of growth are more likely to be dispersedthroughout an entire region, rather than to be confinedto a specific jurisdiction, whereas the costs of growthmay be more localized. Finally, we describe how the basictenets of smart growth, the use of appropriate local feesand subsidies, and regional coordination can and havebeen used to overcome local resistance to growth and toprovide growth that benefits a broad spectrum of per-sons and businesses within a metropolitan area.
2 The Benefits of Growth
Defining andUnderstanding GrowthWebster’s New World College Dictionary (3rd edition,1996) defines growth as the process of growing or devel-oping. Most would point first to an increase in popula-tion as the best example of growth in a region or a com-munity. However, even without an increase in the num-ber of people, growth occurs in a place if the number ofpeople employed, number of houses, number of stores,or number of other nonresidential structures increase.Thus, we consider increases in any or all of these place-based measures as indicators of growth.
As Webster’s points out, growth is a process that results in an entity’s changing from a smaller to a larger size. Wetherefore define place-based growth in terms of both theshort-term process of what causes a place to grow andthe long-term implications of what becoming a placewith significantly more people, jobs, houses, or nonresi-dential structures means. Later, we use this way of think-ing about the short-term process of growth and the long-term implications of becoming larger to offer facts on thebenefits of growth derived from each.
Short-Term Process of GrowthNot growing is not staying the same. Places that do notgrow become smaller and, often, less vibrant. Residentsdie or migrate. Businesses move or close. Local structuresand infrastructure depreciate and eventually must be re-placed. Without replacement growth, a place shrinks inscale. Although no-growth policies might be popular inparticular places at particular times, in the long run, theyare a recipe only for stagnation. The year-to-year changesin population, businesses, buildings, and infrastructurethat are required for replacement growth are all part, butoften only part, of the short-term process of growth.
In the short term, places in the United States grow toaccommodate population increases caused by our coun-try’s birthrate being greater than its death rate. In addi-tion, because more people enter the United States eachyear than leave it, short-term growth needs to occursomewhere in the country to accommodate these newresidents. Finally, even without an increase in U.S. pop-ulation, some regions or communities grow from year to year to accommodate the internal migration of peopleand businesses. Americans value their freedom to livewhere they want. Over time, some areas of the country—
and even places within a metropolitan area—have gainedin popularity, while others have lost favor. The accommo-dation of these preferences, through growth in popularresidential or business locations, is also an importantpart of the short-term process of growth.
The short-term process of growth occurs so that (1) placescan remain the same size, compensating for the naturalloss of people and businesses, (2) increases in populationthrough birthrates and immigration can be accommo-dated, and (3) desired movement within the country bypeople and businesses can be accommodated. We lateroffer facts about the benefits that arise from each of thesethree components of the short-term process of growth.A couple of facts are also mentioned about the overallbenefits of new jobs, new income, new local tax revenue,and increased property values, as well as the opportunitiesfor revitalization that the short-term process of growthgenerates for a region or a community.
Long-Term Implications of GrowthShort-term growth, or the year-to-year process of increas-ing in size, will eventually lead to a place being larger interms of people, businesses, homes, and nonresidentialstructures. A region or community of 100,000 peoplewhose population grows at an annual rate of 3 percentwill have a population of 134,392 in ten years and 180,611in 20 years. Increase the annual growth rate to 6 percent,and the region or community’s population will be 179,085in ten years and an astounding 320,714 in 20 years. Theshort-term process of growth leads to a place that in thelong term is much larger in scale.
A larger place has more people, more businesses, morebuildings, and greater infrastructure. Often, the locallyproduced goods and services that this increased numberof people and businesses want to buy require large fixedcosts to produce. Large fixed costs mean the total cost toproduce something is nearly identical whether 100, 1,000,or 10,000 people purchase it. As examples, think of ameni-ties such as recreational, sporting, educational, retail,entertainment, and cultural activities. If a place containsmore people (consumers), then the price charged perindividual use of these activities can be less because theper-person cost to produce the activities has fallen.
The fact that a place has more people, businesses, andstructures also means that greater choices exist for allwho live there in terms of where and how they want tolive, work, and shop. In addition, more people, more
A ULI Working Paper on Land Use Policy 3

businesses, and more local governments in a region meangreater competition in the private and public productionof goods and services that people and businesses want topurchase. Greater competition means lower prices andgreater selection for the region’s consumers and business-es that purchase these goods.
A long-term implication of growth in size is not onlythat a place has more people, but also that it has a morediverse mix of residents. Because immigration and higherbirthrates among minority populations drive much ofthe growth in the U.S. population, diversity comes in theform of greater variation in the racial and ethnic makeupof a place’s population and a greater percentage of youngpeople. Furthermore, growth often assists in the revital-ization of distressed urban neighborhoods. In some fast-growing cities, shortages in developable land have causedboth the private and public sectors to turn their attentionto previously neglected and stagnated neighborhoods.Revitalization often accompanies growth in those places.
Some of the long-term results of a place being signifi-cantly larger than it once was are (1) many of the thingsthat people and business want to purchase can be pro-duced by both the public and private sectors at a lowercost per person; (2) greater choices are available in resi-dence, shopping, and employment; and (3) greater diver-sity exists in population and the economy. Facts aboutthe benefits that arise from each of these three compo-nents of the long-term results of a place being larger aredescribed later.
The Inevitability of Growthin the United StatesAccording to the U.S. Census Bureau, growth in the pop-ulation of the United States is inescapable. The CensusBureau’s middle-range projection indicates that thecountry’s population will rise from 275 million in 2000 to 288 million in 2005, 312 million in 2015, and 338 mil-lion in 2025. The population of the United States is pro-jected to grow by 23 percent over the next 25 years.
Importantly, in thinking about this growth on a regionalor local basis, we must understand that it will not occurevenly across the states. Factors that drive the short-termprocess of growth (replacement population, accommo-dation of births and immigration, and popularity ofplace) differ by state. Table 1 (see pages 5 and 6) offersthe population projections made by the Census Bureau
for each of the 50 states and the District of Columbia, andthe percentage increase in a state’s population expectedto occur between 2000 and 2025.
As Table 1 indicates, expected population growth between2000 and 2025 clearly varies by state. At the low end, WestVirginia’s population is expected to increase by only 0.2percent, while Hawaii is at the other extreme with anexpected population increase of 44 percent. Hawaii’s highpercentage growth rate is from a base population—1.3million—lower than that of most U.S. states. However,already highly populated places like Texas (20.1 millionin 2000), Florida (15.2 million in 2000), and California(35.5 million in 2000) are expected to grow by 35, 36,and 39 percent, respectively.
Given that 80 percent of the U.S. population currentlylives in metropolitan areas, we may reasonably expect themajority of a state’s population growth over the next 25years to occur in already established metropolitan areas.With the exception of perhaps Portland, and some othermetropolitan areas in Oregon, Florida, and Washingtonthat have metropolitan-wide urban growth boundariesin place, most U.S. metropolitan areas lack the overallcoordinated regional policy to alter the total amount ofgrowth that occurs in a region. (For instance, a regionthat adopts a regionwide urban growth boundary thattries to squeeze a given amount of future developmentinto a limited area may raise the price of land and build-ings within the urban growth boundary and effectivelyreduce the total amount of future development and pop-ulation in the region.) Nevertheless, individual jurisdic-tions within a metropolitan area can try to limit growthlocally and many times are successful at restricting growthwithin their boundaries. Local growth restrictions aretypically of little use in slowing overall regional (or met-ropolitan area) growth, but local jurisdictions still some-times seek to deflect the region’s growth away from theirmunicipality. Because communities often attempt to con-trol growth, possibly without understanding the benefitsof growth, we next offer five facts about the overall short-term benefits of growth to a community or a region, andthree facts about the long-term benefits that arise from acommunity or region being larger.
4 The Benefits of Growth

TABLE 1: U.S. POPULATION PROJECTIONS BY STATE AND DISTRICT, IN THOUSANDS
Percentage Growth,State 2000 2005 2015 2025 2000–2025
Alabama 4,451 4,631 4,956 5,224 17.3%
Alaska 653 700 791 885 35.5
Arizona 4,798 5,230 5,808 6,412 33.6
Arkansas 2,631 2,750 2,922 3,055 16.1
California 35,521 34,441 41,373 49,285 38.7
Colorado 4,168 4,468 4,833 5,188 24.5
Connecticut 3,284 3,317 3,506 3,739 13.9
Delaware 768 800 832 861 12.1
District of Columbia 523 529 594 655 25.2
Florida 15,233 16,279 18,497 20,710 36.0
Georgia 7,875 8,413 9,200 9,869 25.3
Hawaii 1,257 1,342 1,553 1,812 44.2
Idaho 1,347 1,480 1,622 1,739 29.1
Illinois 12,051 12,266 12,808 13,440 11.5
Indiana 6,045 6,215 6,404 6,546 8.3
Iowa 2,900 2,941 2,994 3,040 4.8
Kansas 2,668 2,761 2,939 3,108 16.5
Kentucky 3,995 4,098 4,231 4,314 8.0
Louisiana 4,425 4,535 4,840 5,133 16.0
Maine 1,259 1,285 1,362 1,423 13.0
Maryland 5,275 5,467 5,862 6,274 18.9
Massachusetts 6,199 6,310 6,574 6,902 11.3
Michigan 9,679 9,763 9,917 10,078 4.1
Minnesota 4,830 5,005 5,283 5,510 14.1
Mississippi 2,816 2,908 3,035 3,142 11.6
Missouri 5,540 5,718 6,005 6,250 12.8
Montana 950 1,006 1,069 1,121 18.0
Nebraska 1,705 1,761 1,850 1,930 13.2
Nevada 1,871 2,070 2,179 2,312 23.6
New Hampshire 1,224 1,281 1,372 1,439 17.6
New Jersey 8,178 8,392 8,924 9,558 16.9
continued on the following page
A ULI Working Paper on Land Use Policy 5

Facts about the Benefits of GrowthIn the short term, the benefits of growth result from theyear-to-year process of a community or region’s growthto a larger size. In the long term—that is, once a placehas grown larger—an increase in scale offers benefits. Inan effort to clarify all of these benefits, we next describethem in the form of eight widely accepted facts abouthow a community or region benefits from growth.
Short-Term Benefits Derived from theProcess of GrowthFact #1: Growth Is Necessary Just to Remain the Same. In any city or region, unfortunately, people pass away,businesses close, and houses and nonresidential struc-tures wear out. For a place to stay the same size, people,businesses, and structures must be replaced. Somegrowth is replacement growth.
TABLE 1: U.S. POPULATION PROJECTIONS BY STATE AND DISTRICT, IN THOUSANDS (continued)
Percentage Growth,State 2000 2005 2015 2025 2000–2025
New Mexico 1,860 2,016 2,300 2,612 40.4%
New York 18,146 18,250 18,916 19,830 9.3
North Carolina 7,777 8,227 8,840 9,349 20.2
North Dakota 662 677 704 729 10.1
Ohio 11,319 11,428 11,588 11,744 3.8
Oklahoma 3,373 3,491 3,789 4,057 20.3
Oregon 3,397 3,613 3,992 4,349 28.0
Pennsylvania 12,202 12,281 12,449 12,683 3.9
Rhode Island 998 1,012 1,070 1,141 14.3
South Carolina 3,858 4,033 4,369 4,645 20.4
South Dakota 777 810 840 866 11.5
Tennessee 5,657 5,966 6,365 6,665 17.8
Texas 20,119 21,487 24,280 27,183 35.1
Utah 2,207 2,411 2,670 2,883 30.6
Vermont 617 638 662 678 9.9
Virginia 6,997 7,324 7,921 8,466 21.0
Washington 5,858 6,258 7,058 7,808 33.3
West Virginia 1,841 1,849 1,851 1,845 0.2
Wisconsin 5,236 5,479 5,693 5,867 12.1
Wyoming 525 568 641 694 32.2
Source: U.S. Census Bureau at www.census.gov.population/www/projections/stproj.html.
6 The Benefits of Growth

Examples. Consider a hypothetical U.S. city of 100,000residents and 1,000 businesses. Because the average house-hold size in the United States in 1998 was about 2.5 per-sons, this city has about 40,000 households. (All data arefrom various editions of The Statistical Abstract of theUnited States.) If this city were truly average for the UnitedStates, about one-third of its residents (13,333) wouldlive in rental units, and two-thirds (26,667) would owntheir home. Because the death rate per 1,000 Americansin 1998 was 8.6, this city would require 860 new residentseach year just to maintain its population of 100,000.Because the failure rate per 1,000 businesses in the UnitedStates in 1998 was 7.6, this city would also require abouteight new business startups to replace the businesses lostin the previous year.
The replacement number of new housing units and non-residential structures required to remain the same is notas easy to calculate. If the average structure lasts 100 yearswith maintenance, and the building of structures in thecity occurred evenly over the last 100 years, about 1 percentwould require replacement each year. For our averagecity of 100,000 residents and 1,000 businesses to remainthe same, each year it requires growth in the form of 133new rental units, 267 new owner-occupied homes, andten new business structures (assuming that each businessoccupies one structure).
In the short term of one year, replacement growth is nec-essary so that every city and region can just remain thesame. A hard-line, no-growth policy results in more thanjust stagnation; it results in a place that shrinks to a smallersize. Over the course of many years, this policy can resultin places being significantly smaller than when they begantheir no-growth, or even slow-growth, policy.
Growth is necessary to avoid stagnation.
The population growth trends of the cities of Detroit andLos Angeles, shown in Figure 1, illustrate Fact #1. In 1900,both Detroit and Los Angeles were medium-sized cities.Even at that time, the larger of the two (Detroit) was notamong the ten largest cities in the United States. Both grewrapidly in the first half of the 1900s, but after 1950, theirgrowth paths diverged. As Detroit’s economy declined, pop-ulation growth reversed, whereas Los Angeles continued togrow, and its economy remained robust through the end ofthe past century. Certainly, this association is both causeand effect—persons left Detroit, in part, due to the declin-ing economic fortunes there—and economic factors are not
the only explanation for the growth and decline of thesetwo cities. But the broad correlation between populationgrowth and a growing city economy is unmistakable.
CHART 1: POPULATION—DETROIT AND LOS ANGELES
Source: U.S. Census Bureau, The Statistical Abstract of the United States (Washing-ton, D.C.: U.S. Census Bureau, various editions).
Fact #2: Growth Accommodates Federal ImmigrationPolicy and a Birthrate that Exceeds a CorrespondingDeath Rate. Americans, throughout most of their history, have hadmore children in a given year than the number of peoplewho have died. A birthrate that is greater than the deathrate necessarily means that each year more Americansrequire a new place to live and eventually to work. Inaddition, the United States prides itself on a history ofmaintaining a reasonable, and relatively liberal, immigra-tion policy. Our country’s immigration policy has been ayearly source of new residents who need a place to liveand work. An individual’s choice to have children andthe federal government’s public policy choices regardingimmigration confer obvious benefits on parents, newimmigrants and their families, and the U.S. economy.Without accommodating these new people through theshort-term process of growth of places in the UnitedStates, those benefits would not exist.
Examples. In 1998, the United States experienced a yearlyaverage of 14.6 births and 8.6 deaths per 1,000 persons.Thus, for every 1,000 persons in the United States, popu-lation in 1998 grew by six just because more people wereborn than died. After one year, our hypothetical U.S. cityof 100,000 residents would thus need to grow by 600 res-idents to accommodate this natural growth in existingresidents. In addition, for every year between 1991 and1998, 24 new immigrants entered the United States forevery 1,000 residents already here. To accommodate itsshare of these new immigrants, after one year, the hypo-thetical city of 100,000 would need to grow by 2,400 new
1900
1920
1940
1960
1980
1999
Popu
latio
n
Detroit
Los Angeles
4 million
3 million
2 million
1 million
0
Year
A ULI Working Paper on Land Use Policy 7

residents. This growth must go somewhere. Short-termgrowth in a place accommodates such population increasesand allows the continuation of the personal and economicbenefits that births and immigration produce for theUnited States. We would not need to accommodate suchgrowth somewhere in the United States only if Americanswere to stop having as many children or to start dyingyounger, or if the federal requirements for immigrationinto our country became stricter. Most Americans wouldbe against at least two of those three things occurring.
Immigration has been an important compo-nent of growth in some U.S. cities.
From 1960 to 1970, the population of Miami, Florida, in-creased from 292,000 to 335,000, due in part to immigra-tion from Cuba. From 1980 to 1990, the population ofSanta Ana, California, increased from 203,713 to 293,742,due in large part to in-migration of persons from Mexicoand Central America. Other areas that might have experi-enced stagnating or declining populations, such as the west-ern San Gabriel Valley in the Los Angeles area, have hadrecent periods of vibrant population and economic growth,partly due, in the case of the San Gabriel Valley, to in-migration of persons from Asia.
Source: U.S. Census Bureau, The Statistical Abstract of the United States (Washing-ton, D.C.: U.S. Census Bureau, various editions).
Fact #3: Growth Accommodates Changes in WhereWe Wish to Live and Work. Residents and businesses of the United States have alwaysvalued their ability to pick up and move to a new locationof their choice. People move for various reasons, but wemay reasonably assume that people who move of theirown free will—and not because of loss of employmentor a change in family responsibilities, for example—con-sider themselves better off in their new location than intheir old one. Businesses in the United States also enjoythe flexibility of moving to where they think they canenjoy the highest profit. In turn, business mobility bene-fits consumers by allowing the provision of demandedgoods and services at a price and level of selection that isa key component to the United States’s high standard ofliving. The nearly unhindered mobility that people andbusinesses enjoy in the United States, and the benefits itconfers upon them, requires that popular locations grow toaccommodate the desires of those wishing to move there.
Examples. The United States in 1998 contained approxi-mately 104 million households. In that year alone, anastonishing 15.6 million households (or about 15 percentof the total) changed their place of residence. Most ofthose moves (60 percent) were within the same county ofresidence, while 20 percent of the moves were within thestate. The remaining 20 percent resulted in householdsmoving out of state. Households in the western UnitedStates and southern United States (as defined by the U.S.Census Bureau) were even more mobile. In 1998, 18 per-cent of all western households and 17 percent of allsouthern households moved.
If all destinations in the United States placed a moratori-um on growth, residential and business mobility couldby no means continue at its current rate. The allowancefor growth accommodates the free movement of peopleand businesses. Personal and business mobility, in turn,helps produce the level of personal satisfaction and effi-cient business operations that Americans desire.
American cities, and cities throughout theworld, have been decentralizing for at least a century.
Brooklyn, New York, developed in the early 1800s as one ofthe earliest suburbs of Manhattan. Similar central locationsin other metropolitan areas were, in earlier times, residentialsuburbs. As cities decentralize, firms follow persons to thesuburbs. This movement of persons and firms has createdvibrant new economic centers, called “edge cities” by some.In many locations, such as the Post Oak–Galleria area ofHouston, Texas, or South Coast Metro in Orange County,California, these edge cities are employment centers thatrival downtown. Some of these edge cities, which were ini-tially located on the urban fringe, are now far interior to the edge of the metropolitan boundary and have, over time,developed into dense urban settings in their own right.
Source: Joel Garreau, Edge City: Life on the New Frontier (New York: Doubleday,1991; reprint, New York: Anchor Books, 1992).
Fact #4: Growth Generates New Jobs, New Income,New Tax Revenue, and Higher Property Values. The short-term process of growth in a city or regionoccurs to replace worn out buildings and to accommo-date a birthrate greater than its death rate, federal immi-gration policy, and the changing desires of where peopleand firms wish to live and do business. When the popu-
8 The Benefits of Growth
lation of a place increases, new residents require newhouses and the new production of other goods and ser-vices. Growth in a place results in a local and regionalbuilding boom, the creation of new jobs to produce thegoods and services desired by the new residents, and thegeneration of new local tax revenues. If we assume thatthe new residents contribute more in taxes than it coststo provide them with local government services, growthresults in additional revenue that can be used to providemore local government services or to cut the local taxes topregrowth residents. Growth, and the increased demandfor local and regional land to accommodate it, also raisesthe market value of property to people who own it. All ofthese occurrences are part of the fourth fact, which holdsthat the short-term process of growth clearly generateseconomic benefits for the place that experiences it.
Examples. As a tangible example of the employmentbenefits derived from statewide growth, consider that,between 1995 and 1999, the populations of West Virginiaand North Dakota grew the least of all states in percentageterms (-0.7 and -1.2 percent, respectively). The popula-tions of Arizona and Nevada increased the most in per-centage terms (10.9 and 18.6 percent, respectively). Pop-ulation growth spurs development, and developmentrequires construction workers. In 1999, only 4.7 percentof West Virginia’s workforce was in construction. The fig-ure for North Dakota was 5.3 percent. Alternatively, in thehigh-population-growth states of Arizona and Nevada,respectively 7.2 and 9.2 percent of the total workforce wasin construction. If we consider that in 1999 the medianweekly income from a construction job was $571, whilein a service-sector job (a reasonable alternative to con-struction employment) it was only $402, we can see thatgreater construction activity in a place can provide eco-nomic benefits.
In many metropolitan areas, sectors associatedwith growth are vital to the economy.
Construction, housing, and real estate all provide a sourceof jobs. Often, as noted previously, those jobs pay well com-pared to other employment opportunities. For example, inCalifornia, average hourly earnings in construction for gen-eral building contractors were $23.48 in 1999. Average hourlyearnings in retail trade were $10.88 in 1999.
Source: California Department of Finance, California Statistical Abstract (Sacramen-to: California Department of Finance, 2000).
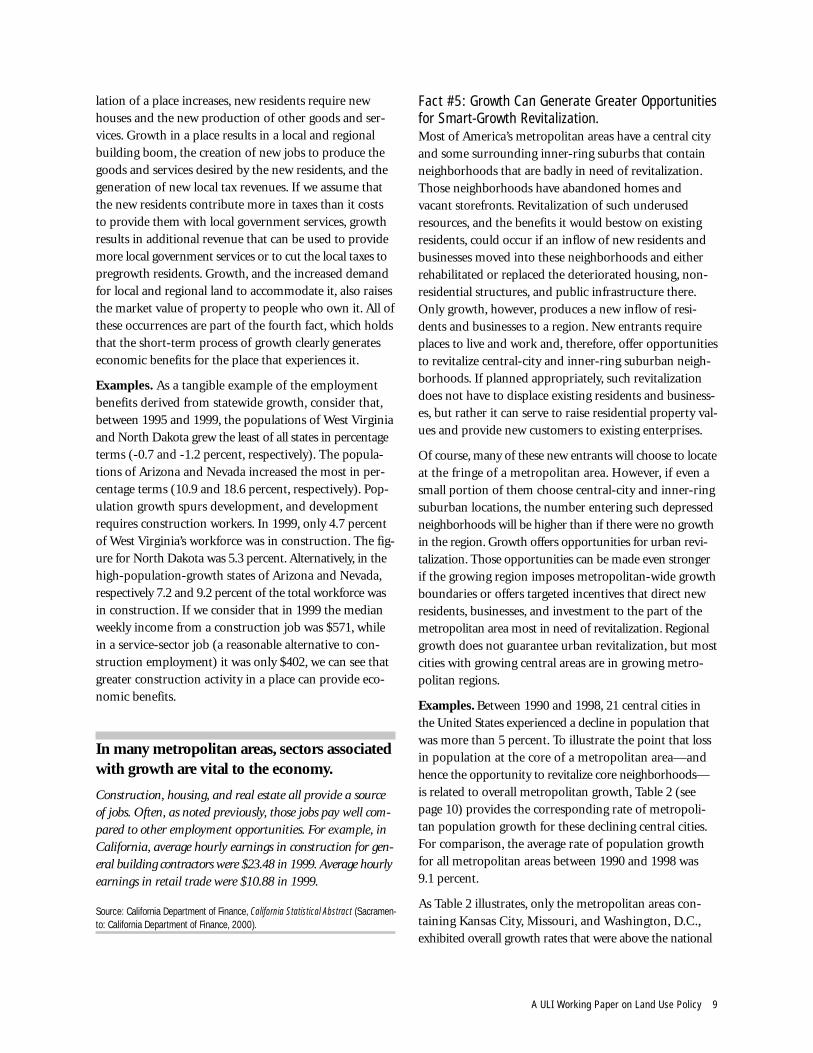
Fact #5: Growth Can Generate Greater Opportunitiesfor Smart-Growth Revitalization. Most of America’s metropolitan areas have a central cityand some surrounding inner-ring suburbs that containneighborhoods that are badly in need of revitalization.Those neighborhoods have abandoned homes andvacant storefronts. Revitalization of such underusedresources, and the benefits it would bestow on existingresidents, could occur if an inflow of new residents andbusinesses moved into these neighborhoods and eitherrehabilitated or replaced the deteriorated housing, non-residential structures, and public infrastructure there.Only growth, however, produces a new inflow of resi-dents and businesses to a region. New entrants requireplaces to live and work and, therefore, offer opportunitiesto revitalize central-city and inner-ring suburban neigh-borhoods. If planned appropriately, such revitalizationdoes not have to displace existing residents and business-es, but rather it can serve to raise residential property val-ues and provide new customers to existing enterprises.
Of course, many of these new entrants will choose to locateat the fringe of a metropolitan area. However, if even asmall portion of them choose central-city and inner-ringsuburban locations, the number entering such depressedneighborhoods will be higher than if there were no growthin the region. Growth offers opportunities for urban revi-talization. Those opportunities can be made even strongerif the growing region imposes metropolitan-wide growthboundaries or offers targeted incentives that direct newresidents, businesses, and investment to the part of themetropolitan area most in need of revitalization. Regionalgrowth does not guarantee urban revitalization, but mostcities with growing central areas are in growing metro-politan regions.
Examples. Between 1990 and 1998, 21 central cities inthe United States experienced a decline in population thatwas more than 5 percent. To illustrate the point that lossin population at the core of a metropolitan area—andhence the opportunity to revitalize core neighborhoods—is related to overall metropolitan growth, Table 2 (seepage 10) provides the corresponding rate of metropoli-tan population growth for these declining central cities.For comparison, the average rate of population growthfor all metropolitan areas between 1990 and 1998 was 9.1 percent.
As Table 2 illustrates, only the metropolitan areas con-taining Kansas City, Missouri, and Washington, D.C.,exhibited overall growth rates that were above the national
A ULI Working Paper on Land Use Policy 9
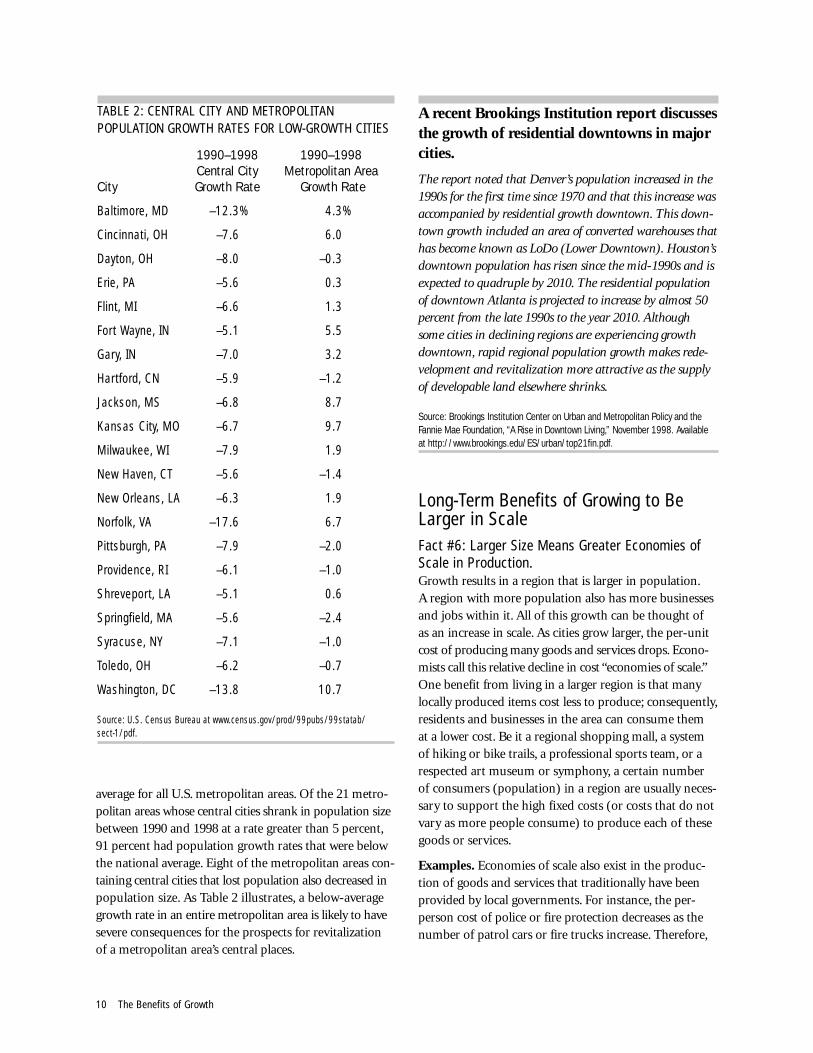
average for all U.S. metropolitan areas. Of the 21 metro-politan areas whose central cities shrank in population sizebetween 1990 and 1998 at a rate greater than 5 percent,91 percent had population growth rates that were belowthe national average. Eight of the metropolitan areas con-taining central cities that lost population also decreased inpopulation size. As Table 2 illustrates, a below-averagegrowth rate in an entire metropolitan area is likely to havesevere consequences for the prospects for revitalization of a metropolitan area’s central places.
A recent Brookings Institution report discussesthe growth of residential downtowns in majorcities.
The report noted that Denver’s population increased in the1990s for the first time since 1970 and that this increase wasaccompanied by residential growth downtown. This down-town growth included an area of converted warehouses thathas become known as LoDo (Lower Downtown). Houston’sdowntown population has risen since the mid-1990s and isexpected to quadruple by 2010. The residential populationof downtown Atlanta is projected to increase by almost 50percent from the late 1990s to the year 2010. Althoughsome cities in declining regions are experiencing growthdowntown, rapid regional population growth makes rede-velopment and revitalization more attractive as the supplyof developable land elsewhere shrinks.
Source: Brookings Institution Center on Urban and Metropolitan Policy and theFannie Mae Foundation, “A Rise in Downtown Living,” November 1998. Available at http://www.brookings.edu/ES/urban/top21fin.pdf.
Long-Term Benefits of Growing to BeLarger in ScaleFact #6: Larger Size Means Greater Economies ofScale in Production. Growth results in a region that is larger in population.A region with more population also has more businessesand jobs within it. All of this growth can be thought ofas an increase in scale. As cities grow larger, the per-unitcost of producing many goods and services drops. Econo-mists call this relative decline in cost “economies of scale.”One benefit from living in a larger region is that manylocally produced items cost less to produce; consequently,residents and businesses in the area can consume them at a lower cost. Be it a regional shopping mall, a systemof hiking or bike trails, a professional sports team, or arespected art museum or symphony, a certain numberof consumers (population) in a region are usually neces-sary to support the high fixed costs (or costs that do notvary as more people consume) to produce each of thesegoods or services.
Examples. Economies of scale also exist in the produc-tion of goods and services that traditionally have beenprovided by local governments. For instance, the per-person cost of police or fire protection decreases as thenumber of patrol cars or fire trucks increase. Therefore,
TABLE 2: CENTRAL CITY AND METROPOLITANPOPULATION GROWTH RATES FOR LOW-GROWTH CITIES
1990–1998 1990–1998Central City Metropolitan Area
City Growth Rate Growth Rate
Baltimore, MD –12.3% 4.3%
Cincinnati, OH –7.6 6.0
Dayton, OH –8.0 –0.3
Erie, PA –5.6 0.3
Flint, MI –6.6 1.3
Fort Wayne, IN –5.1 5.5
Gary, IN –7.0 3.2
Hartford, CN –5.9 –1.2
Jackson, MS –6.8 8.7
Kansas City, MO –6.7 9.7
Milwaukee, WI –7.9 1.9
New Haven, CT –5.6 –1.4
New Orleans, LA –6.3 1.9
Norfolk, VA –17.6 6.7
Pittsburgh, PA –7.9 –2.0
Providence, RI –6.1 –1.0
Shreveport, LA –5.1 0.6
Springfield, MA –5.6 –2.4
Syracuse, NY –7.1 –1.0
Toledo, OH –6.2 –0.7
Washington, DC –13.8 10.7
Source: U.S. Census Bureau at www.census.gov/prod/99pubs/99statab/sect-1/pdf.
10 The Benefits of Growth
a larger region, which on average has larger local govern-ments providing police or fire services, can produce thedesired level of protection at a lower per-person cost.A second example is a desirable system of mass transit.Much evidence shows that cities with greater populationdensity are better able to support more cost-effectivemass transit.
The largest urban centers appear to be unique-ly poised to support the arts and culture.
The great museums, opera houses, and performing artscompanies overwhelmingly tend to be located in the nation’sand the world’s largest cities, because to survive those artsneed to draw on a large population of patrons and customers.Smaller communities often find it more difficult to sustainnot only a range of artistic and cultural events, but alsopublicly funded amenities such as parks, zoos, and otherattractions.
Fact #7: Larger Size Means Economic BenefitsDerived from Clustering. After growth occurs in a given size area, groups of peopleor businesses are more likely to be clustered together.Benefits, separate from economies of scale, arise from agreater number of people or activities locating near eachother. The benefits of businesses locating near each otherare demonstrated by the clustering of high-technologyfirms in a few areas, such as Silicon Valley in NorthernCalifornia; Research Triangle in North Carolina; andsimilar high-tech clusters in Boston, Austin, Ann Arbor,Boulder, Seattle, and Portland.
Clustering benefits also extend beyond high technology.Retail stores cluster in districts and shopping centers tobenefit from increased traffic created by proximity. Thisclustering not only results in more customers per store,but also allows greater comparison shopping by customers.In addition, clustered businesses can share a sophisticat-ed network of suppliers, service providers, and a skilledlabor pool, none of which is likely to be as readily avail-able in smaller regions. These benefits of clustering aresometimes referred to as “agglomeration economies.”
The clustering of people, which is more likely to occur asa place grows to a larger population, should also be con-sidered a benefit of growth. The spatial concentration oflarge groups of people permits more personal interac-tion, which in turn generates more new ideas, products,
and processes. The advantages of clustering people andbusinesses together in a large metropolitan area also makeit easier to attract and keep highly skilled workers andthe businesses that employ them. This factor produces acompetitive advantage for a larger region and can makeit less susceptible to economic downturns.
Examples. Perhaps an often-told anecdote is in orderhere. Consider a small town that currently has a court-room and only one practicing lawyer. Such a situation islikely to produce more free time for the lawyer than ifone, two, or multiple lawyers moved into town and beganpracticing their craft. The nature of not only legal activities,but also economic, social, and even learning activities bene-fits from, and even requires, multiple interactions betweenmultiple people. Growth offers the larger number of peoplethat usually makes such essential activities more efficientfrom both a personal and social perspective.
Currently, places with high-tech agglomerations,or “cyber cities,” are where fast job growth, risingwages, and profits are producing prosperity-inducing income increases.
The large existing agglomerations of high-tech industries inSan Jose, Boston, Chicago, Washington, D.C., and Dallashave been sustaining fast job growth as older firms growand new firms are born faster than recent startups die. . . .Another factor is the number of competitive businesses inthe mix of the economic base. San Francisco, for example,has strong attractions that maintain the strength of avibrant visitor industry, along with high-tech and strongservice industries. To date, this critical mass of agglomera-tions has been strong enough to offset the missing pillar ofaffordable housing. . . .
Source: Gruen Gruen + Associates, “Pillars of Regional Prosperity,” Trends E-mailnewsletter, January 2001.
Fact #8: Larger Size Means Greater Choices andDiversity. The last, but certainly not least, fact on the benefits ofgrowth to a larger size is the increased choices availableto consumers and laborers in the now larger place. Byconsumer choices, we refer to both greater options inwhere to live and shop—the increased diversity in thetype of housing and local government services thatcomes with choice of residence—and greater optionsregarding recreational, sporting, and cultural activities
A ULI Working Paper on Land Use Policy 11

within a region. In addition, an increase in regional pop-ulation, and the subsequent economic activity that itgenerates, creates greater employment choices and evenemployment security for existing residents. Finally, thebenefits of greater social diversity (which could includegreater tolerance and respect for others; greater choicesin cultural, retail, and restaurant experiences; or greaterlikelihood of new and innovative ideas) are far more like-ly to occur in a region after it experiences populationgrowth and grows to a larger size.
Examples. Economists have long recognized that con-sumers of a good or service are better off when moreproducers exist. The same is true regarding the provisionof local government services. A person wishing to buy acertain type of home within a given price range will beworse off if forced to live in just one community thatoffers it. In such a situation, both the private provider ofhomes and the public provider of local government ser-vices hold a degree of monopoly power that they can useto the consumer’s disadvantage. Also, the more populateda given region is, the more likely it is that it offers greaterchoices in the number of potential employers to workfor. This employment diversity gives an individual a bet-ter chance of finding job opportunities within the metro-politan region.
The proliferation of municipalities in largemetropolitan areas allows cities to specialize.
In most metropolitan areas, some cities actively seek toattract business or industrial development, while othercities seek to preserve a residential character and zone outindustry. Often, cities similarly specialize in the tax andservice packages that they offer. Residents have more choice of where to live in these specialized metropolitan areas.Local specialization is also, at times, counter to a need forregional coordination, and so can be detrimental in certaininstances. However, specialization, when it provides morechoice, can be beneficial to citizens and firms.
Quality-of-Life Differencesin High- and Low-GrowthU.S. Metropolitan AreasIn the previous section we offered five facts on the bene-fits of growth that arise from the process of growth itselfand three facts on the benefits of growth that result frombeing larger. Different facts exist, of course, on the costsof a place’s growing and becoming larger. As mentionedearlier, we will not discuss those in detail here, but the costsof growth can include traffic congestion, more crowdedpublic facilities, loss of open spaces, higher tax burdensfor new residents, and greater pollution. Because the pro-cess of growth and the fact of being larger result in bothbenefits and costs to a place, the important issue to con-sider is whether the benefits outweigh the costs, or whetherfaster-growing and larger areas are on average better offthan slow-growing or smaller areas. Answering this ques-tion requires an acceptable measure of what is meant by“better off.” In this section, we use the quality-of-life rat-ings provided in the 2000 edition of David Savageau andRalph D’Agostino’s Places Rated Almanac to comparehigh-growth and low-growth metropolitan areas.
MethodThe Places Rated Almanac (PRA), now in its fifth edition,is a quantitative attempt to rank the relative desirabilityof the 354 metropolitan areas that exist in the UnitedStates and southern Canada as of 1999. The PRA estab-lishes rankings by assigning a score to each metropolitanarea in nine factors: (1) cost of living, (2) transportation,(3) jobs, (4) education, (5) crime, (6) climate, (7) arts,(8) health care, and (9) recreation. The choice of thesecategories, and how scores are calculated for desirabilityin each of them, is laden with value judgments. We recog-nize this potential for bias, but still use the PRA becauseof its proven acceptability, which is demonstrated by afifth edition, and because the PRA offers one of the onlyavailable calculations of this sort.
Our method is first to find the ten U.S. metropolitanareas that had the largest percentage growth rate in pop-ulation between 1990 and 1997 and the ten that had thelowest percentage growth rates over the same period. Wealso find the ten most populated and ten least populatedmetropolitan areas in the United States in 1997. For these40 metropolitan areas, we then note the scores calculatedby the PRA in eight of the nine desirability categories and
12 The Benefits of Growth
look for systematic differences between the two sets of20 metropolitan areas. The score in climate is excludedbecause more or less growth does nothing to change it.This method of comparison is also repeated for fourpairs of cities—one drawn from each of the four majorcensus regions in the United States (west, northwest,south, and northeast)—which are chosen for havingsimilar population levels in 1970 but significantly differ-ent ones in 1997.
Before we report our findings, we must explain a bitabout how the scores in each category are calculated.Consider the cost-of-living category as an example. ThePRA calculates what a household with a typical incomewould pay in state and local taxes and for housing, food,health care, transportation, and recreation in each met-ropolitan area. These costs are then ranked from lowestto highest and assigned a score such that 100 representsthe least expensive (most desirable) and zero representsthe most expensive (least desirable). For transportation,a similar scoring system is used that rates connectivity,commute time, and centrality. Growth rate of jobs, num-ber of new jobs, and number of high-paying jobs makeup the score for the jobs category. The education score isbased on dollar support for public schools, library popu-larity, number enrolled in college, and college options.The score in the crime category is based on violent crimesand property crimes reported per person, with propertycrimes receiving one-tenth the weight of violent crimes.The score in the arts category comes from looking at thenumber of art museums; museum attendance; and ballet,touring artists, opera, professional theater, and symphonyperformances. The PRA produces its health care score onthe basis of the number of general medical practitioners,specialists, and surgeons per 100,000 persons; availablehospital beds; and physician residency programs. Finally,the recreation score is derived from the number and sizeof activities, recreational land available, and quality ofavailable recreation.
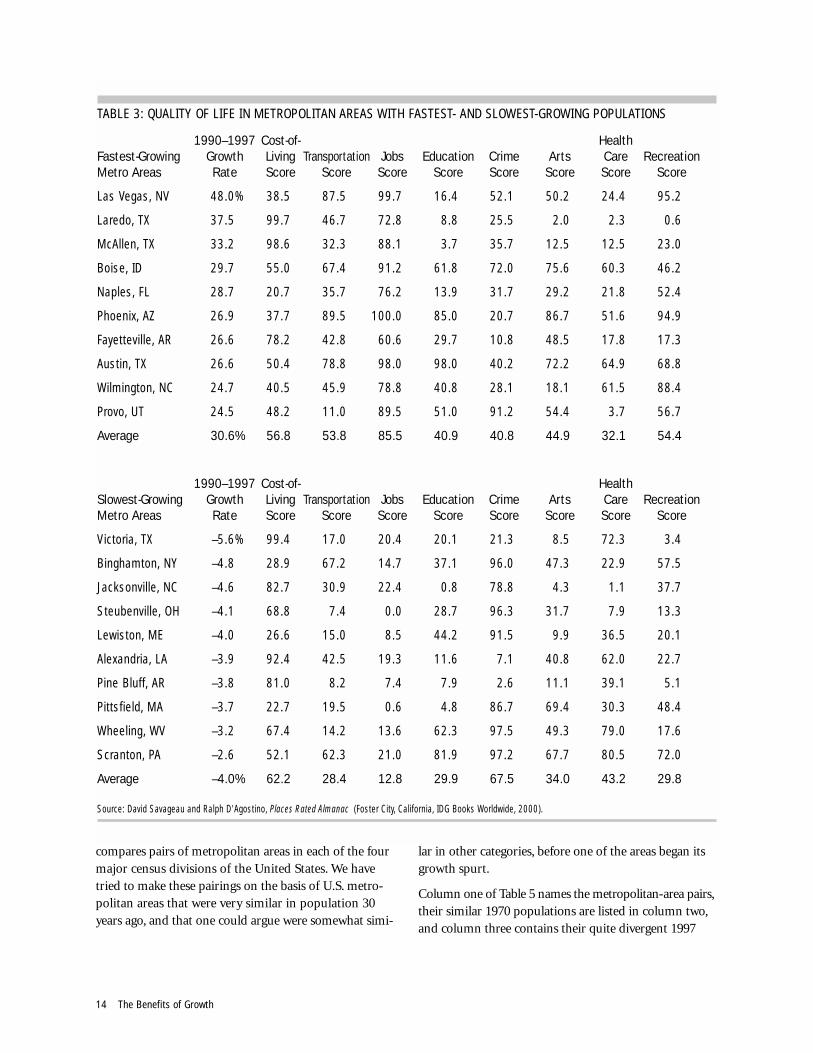
ComparisonsTable 3 (see page 14) offers data drawn from the ten U.S.metropolitan areas whose population increased the mostbetween 1990 and 1997 (at an average rate of nearly 31percent) and the ten areas whose population increasedthe least (at an average rate of -4 percent). Recall that 100is the highest score that the PRA assigns in any category,and zero the lowest. The average scores for each of thetwo groups of metropolitan areas in each of the relevant
categories are provided at the foot of the city lists. Forfive of the eight quality-of-life categories, the averages forthe fastest-growing metropolitan areas are larger than theaverages for the slowest-growing metropolitan areas. Inparticular, compare the high average jobs score of nearly86 in the country’s fastest-growing areas to the very lowaverage jobs score of about 13 for the slowest-growingareas. Only the average quality-of-life scores for cost ofliving, crime, and health care are lower in the fastest-growing cities.
The low cost-of-living and health scores in fast-growingareas may be due, in part, to the supply of goods andservices not being able to keep up with rapidly increas-ing demand in fast-growing areas. Over time, some ofthis shortfall of goods and services could be expected todiminish. Because housing cost is a large component of thecost of living, the lower cost-of-living score in the fastest-growing areas is not surprising. But note that higher hous-ing costs also mean greater increases in property valuesfor existing property owners, although renters are stillplaced at a significant disadvantage.
Table 4 (see page 15) is like Table 3 except it contains thePRA quality-of-life scores for the ten most populated andthe ten least populated metropolitan areas in the UnitedStates in 1997. For this comparison, the average cost-of-living and crime scores for the most populated metro-politan areas were again lower than the average scores forthe least populated areas. However, unlike the advantagethat slow-growth metropolitan areas exhibit in healthcare, large metropolitan areas on average score better inthis category than small metropolitan areas.
Tables 3 and 4 demonstrate that observable quality-of-lifebenefits accrue to fast-growing U.S. metropolitan areas andin large U.S. areas in general. The only clear exception isthe higher rates of violent and property crime that peo-ple and businesses in fast-growing and large metropoli-tan areas must tolerate. By the measures chosen by thePRA to account for the degree of ease in getting aroundan area, finding a quality job, obtaining a superior educa-tion, enjoying world-class art, and benefiting from amplerecreational opportunities, the winners in this quality-of-life assessment are clearly the fastest-growing and largestmetropolitan areas in the United States.
Another way to approach a quality-of-life comparison isto pick pairs of metropolitan areas that were similar inpopulation size a number of years ago, but in which onehas grown much faster and consequently now has a muchlarger population than the other. Table 5 (see page 16)
A ULI Working Paper on Land Use Policy 13
compares pairs of metropolitan areas in each of the fourmajor census divisions of the United States. We havetried to make these pairings on the basis of U.S. metro-politan areas that were very similar in population 30years ago, and that one could argue were somewhat simi-
lar in other categories, before one of the areas began itsgrowth spurt.
Column one of Table 5 names the metropolitan-area pairs,their similar 1970 populations are listed in column two,and column three contains their quite divergent 1997
14 The Benefits of Growth
TABLE 3: QUALITY OF LIFE IN METROPOLITAN AREAS WITH FASTEST- AND SLOWEST-GROWING POPULATIONS
1990–1997 Cost-of- Health Fastest-Growing Growth Living Transportation Jobs Education Crime Arts Care RecreationMetro Areas Rate Score Score Score Score Score Score Score Score
Las Vegas, NV 48.0% 38.5 87.5 99.7 16.4 52.1 50.2 24.4 95.2
Laredo, TX 37.5 99.7 46.7 72.8 8.8 25.5 2.0 2.3 0.6
McAllen, TX 33.2 98.6 32.3 88.1 3.7 35.7 12.5 12.5 23.0
Boise, ID 29.7 55.0 67.4 91.2 61.8 72.0 75.6 60.3 46.2
Naples, FL 28.7 20.7 35.7 76.2 13.9 31.7 29.2 21.8 52.4
Phoenix, AZ 26.9 37.7 89.5 100.0 85.0 20.7 86.7 51.6 94.9
Fayetteville, AR 26.6 78.2 42.8 60.6 29.7 10.8 48.5 17.8 17.3
Austin, TX 26.6 50.4 78.8 98.0 98.0 40.2 72.2 64.9 68.8
Wilmington, NC 24.7 40.5 45.9 78.8 40.8 28.1 18.1 61.5 88.4
Provo, UT 24.5 48.2 11.0 89.5 51.0 91.2 54.4 3.7 56.7
Average 30.6% 56.8 53.8 85.5 40.9 40.8 44.9 32.1 54.4
1990–1997 Cost-of- Health Slowest-Growing Growth Living Transportation Jobs Education Crime Arts Care RecreationMetro Areas Rate Score Score Score Score Score Score Score Score
Victoria, TX –5.6% 99.4 17.0 20.4 20.1 21.3 8.5 72.3 3.4
Binghamton, NY –4.8 28.9 67.2 14.7 37.1 96.0 47.3 22.9 57.5
Jacksonville, NC –4.6 82.7 30.9 22.4 0.8 78.8 4.3 1.1 37.7
Steubenville, OH –4.1 68.8 7.4 0.0 28.7 96.3 31.7 7.9 13.3
Lewiston, ME –4.0 26.6 15.0 8.5 44.2 91.5 9.9 36.5 20.1
Alexandria, LA –3.9 92.4 42.5 19.3 11.6 7.1 40.8 62.0 22.7
Pine Bluff, AR –3.8 81.0 8.2 7.4 7.9 2.6 11.1 39.1 5.1
Pittsfield, MA –3.7 22.7 19.5 0.6 4.8 86.7 69.4 30.3 48.4
Wheeling, WV –3.2 67.4 14.2 13.6 62.3 97.5 49.3 79.0 17.6
Scranton, PA –2.6 52.1 62.3 21.0 81.9 97.2 67.7 80.5 72.0
Average –4.0% 62.2 28.4 12.8 29.9 67.5 34.0 43.2 29.8
Source: David Savageau and Ralph D’Agostino, Places Rated Almanac (Foster City, California, IDG Books Worldwide, 2000).

populations. The respective quality-of-life scores are incolumns four through 11, and the last column is an averageof all quality-of-life scores for a given area. The first thingto notice is that the average scores for the now higher-population metropolitan areas are all greater than for thenow lower-population areas. Only three of the specific
quality-of-life indicators are lower in the now higher-population metropolitan areas. These include the educa-tion score for Las Vegas, Nevada, and the cost-of-livingscores for Austin, Texas, and Grand Rapids, Michigan.But again, because housing is a major component of thePRA’s cost-of-living score, and population growth in a
TABLE 4: QUALITY OF LIFE IN MOST POPULATED AND LEAST POPULATED METROPOLITAN AREAS
1997 Cost-of- Health Most Populated Population Living Transportation Jobs Education Crime Arts Care RecreationMetro Areas (1,000s) Score Score Score Score Score Score Score Score
Los Angeles, CA 9,117 5.7 93.5 48.2 77.1 1.1 99.4 68.0 92.6
New York, NY 8,650 0.0 99.4 41.9 94.6 0.6 100.0 92.1 92.4
Chicago, IL 7,883 9.4 100.0 87.0 98.9 2.3 99.2 81.3 97.2
Philadelphia, PA 4,940 10.2 95.8 78.2 89.8 45.3 98.3 85.6 74.8
Washington, DC 4,609 4.5 97.2 92.9 97.7 38.3 99.7 98.3 88.7
Detroit, MI 4,469 14.7 98.9 80.7 70.5 17.0 95.2 49.0 96.6
Houston, TX 3,847 59.5 94.3 94.9 71.1 24.7 89.8 65.4 85.3
Atlanta, GA 3,634 39.4 98.3 99.2 82.7 12.2 94.7 57.2 76.2
Boston, MA 3,273 1.1 94.6 49.0 99.7 46.7 98.6 94.9 77.1
Dallas, TX 3,123 49.3 95.5 95.2 90.0 9.4 93.2 48.2 89.0
Average 5,355 19.4 96.8 76.7 87.2 19.8 96.8 74.0 87.0
1997 Cost-of- Health Least Populated Population Living Transportation Jobs Education Crime Arts Care RecreationMetro Areas (1,000s) Score Score Score Score Score Score Score Score
Enid, OK 57 90.4 26.1 2.3 4.0 26.9 11.3 33.7 1.7
Casper, WY 63 90.7 38.9 12.7 9.1 57.2 42.5 35.1 11.0
Pocatello, ID 74 65.2 40.8 33.7 30.9 69.1 14.5 40.8 14.7
Jonesboro, AR 77 73.7 25.5 24.9 22.9 67.1 7.4 78.5 5.7
Cheyenne, WY 78 85.8 38.0 11.3 12.5 85.0 25.8 22.4 5.9
Great Falls, MT 79 76.5 58.4 2.5 2.5 64.3 15.0 30.6 9.3
Victoria, TX 82 99.4 17.0 20.4 20.1 21.2 8.5 72.5 3.4
Pine Bluff, AR 82 81.0 8.2 7.4 7.9 2.6 11.1 39.1 5.1
Rapid City, SD 87 86.7 55.0 29.7 22.4 65.2 9.1 51.3 19.8
Dubuque, ID 88 63.5 54.4 8.8 80.2 92.1 46.8 24.9 19.5
Average 77 81.3 36.2 15.4 21.3 55.1 19.2 42.9 9.6
Source: David Savageau and Ralph D’Agostino, Places Rated Almanac (Foster City, California, IDG Books Worldwide, 2000).
A ULI Working Paper on Land Use Policy 15

region drives up property values, this score in part repre-sents a benefit of growth to residents who owned proper-ty before the period of rapid population growth in Austinand Grand Rapids.
Categorizing the Local andRegional Benefits of GrowthThe quality-of-life indicators discussed in the previoussection are calculated for an entire metropolitan region.Using these indicators, we have shown that measurablebenefits accrue to a region when it grows. But the growthof an entire region can occur through the growth of somelocalities within the region, while other localities remainthe same or even shrink in size. In fact, this pattern isoften observed in the United States. An entire metropoli-tan area will grow, but many communities within thearea have adopted no- or slow-growth land use policies.Table 6 is intended as a tool to better understand whythis local NIMBYism may arise.
Table 6 (see pages 17 and 18) lists 14 possible benefitsthat can arise from a region’s growing larger. In one wayor another, these benefits have all been covered earlier inthis paper. Table 6 also categorizes these benefits accord-ing to whether they apply to the entire region or only tothe specific locality in which growth occurs. A quick glanceat this table shows that all but one of the possible 14 ben-efits of growth apply to an entire region. Because substatetaxes are almost exclusively raised at the local level in theUnited States, growth will generate greater tax revenue only
in the locality in which it occurs. Conversely, numerousbenefits of growth offer few specific benefits to the locali-ty in which the growth occurred. We believe that nine ofthe 14 benefits listed in Table 6 fit this category.
Understanding that the benefits of growth in a regionaccrue primarily to the region as a whole, and that many of the costs of growth in a region fall on the specificlocalities in which the growth occurs, goes a long waytoward explaining why many communities throughoutthe United States have tried to reject growth. If a com-munity’s residents and businesses can enjoy the regionalbenefits of growth and not have to bear its costs, then itis rational for their policy makers to aim for this goal.The solution, of course, is to try to change such locallyoptimal, but regionally and even nationally nonoptimal,behavior. After all, if a majority of communities in a met-ropolitan area rejects growth, then none of them canenjoy the benefits that growth offers to the entire region.
Overcoming LocalResistance to GrowthAs is well known and widely discussed, population growthalso imposes costs on citizens and businesses in a region.Therefore, when accounting for whether a communityembraces or rejects population growth, we need to con-sider both the local benefits of growth and the local costs.The purpose of this paper has been to shed further lighton the benefit side of growth. Of utmost importance areregional versus local disjunctions in these benefits and
TABLE 5: QUALITY-OF-LIFE COMPARISONS BETWEEN SIMILAR FAST- AND SLOW-GROWING METROPOLITAN AREAS
Metro Areas with 1970 1997 Cost-of- HealthSimilar Populations Population Population Living Transportation Jobs Education Crime Arts Care Recreationin 1970 (1,000s) (1,000s) Score Score Score Score Score Score Score Score Average
Austin, TX 360 1,070 50.4 78.8 98.0 98.3 40.2 72.2 64.9 68.8 71.5Baton Rouge, LA 376 571 68.3 57.2 82.4 39.1 1.7 45.9 57.5 57.8 51.2
Grand Rapids, MI 539 1,028 52.7 77.3 90.4 79.3 57.0 77.1 27.2 99.4 70.0Youngstown, OH 537 595 70.3 49.0 65.4 58.6 50.7 21.8 20.4 73.7 51.2
Las Vegas, NV 273 1,262 38.5 87.5 99.7 16.4 16.7 50.2 24.4 95.2 53.6Stockton, CA 291 540 23.8 1.4 64.9 24.6 11.1 36.8 16.1 32.3 26.4
Washington, DC 2,910 4,609 4.5 97.2 92.9 97.7 38.3 99.7 98.3 88.7 77.2Newark, NJ 2,057 1,943 4.0 96.0 32.6 93.8 18.1 96.6 88.4 76.5 63.3
Source: David Savageau and Ralph D’Agostino, Places Rated Almanac (Foster City, California, IDG Books Worldwide, 2000).
16 The Benefits of Growth

TABLE 6: DIVISION OF BENEFITS OF GROWTH BETWEEN REGION AND LOCALITIES
Does this benefit apply to the entire Does this benefit apply to the specificPossible Benefits of Growth region in which growth occurs? locality in which growth occurs?
1. Replacement to remain the Yes; the character of a region is made Yessame up of the character of each locality. If
replacement does not occur in a locality,then the region does not stay the same.
2. Accommodation of births Yes; births being greater than deaths Not Muchgreater than deaths is best thought of as a regional or
even national issue.
3. Accommodation of immigration Yes; immigration into the United States Not Muchis best thought of as a regional or even national issue.
4. Accommodation of location Yes; people and businesses from Yes; people and businesses in thedecisions outside the region choose to move to region can also choose to move within
the region because of its overall the region.attractiveness.
5. Generation of new jobs Yes; the labor market is region wide. Not Much; in the sense of providingCreating a job anywhere in the region jobs for residents of a locality. In a allows someone from anywhere in the region, people do not need to live and region to take it. work in the same locality.
6. Generation of new income Yes; new income earned by a region’s Not Much; a resident’s income does residents is spent throughout the region. not need to be spent in the locality
where it is generated or where the person lives.
7. Generation of new tax revenue Some; nearly all local tax revenue is Yescollected by the jurisdiction in which the tax base is located or generated, but a locality’s sales or income tax revenue (if relevant) can grow if population growth occurs elsewhere in the metropolitan area.
8. Generation of higher property Yes; growth in an entire region can raise Yesvalues the demand for existing development
within all of the region’s localities, even if some of them do not allow growth.
9. Smart growth revitalization Yes; the revitalization of a region’s de- Yespressed areas can offer benefits to theentire region in the form of improving its overall image.
10. Economies of scale in Yes; a larger region can produce private Not Much; a locality that grows larger production and public goods that enjoy economies can produce local government goods
of scale in production and can be sold such as police and fire protection,at a lower cost. People and businesses libraries, parks, etc., at a lower per-throughout the region can consume most citizen cost if the locality gains moreof these things, even though they each residents or businesses. If the con-need to be produced in a specific locality. sumption of these goods or services
requires local residency, then thebenefit of growth is only local.
continued on following page
A ULI Working Paper on Land Use Policy 17

costs. Many of the benefits described above fall upon anentire region, whereas many of the costs of populationgrowth (such as loss of small-town character, increasedcongestion, and loss of local open space) are local. Perceivedlocal benefits are usually weighed against perceived localcosts only, and if these local costs are greater than localbenefits, growth is locally unwelcome. If growth is locallyunwelcome in many places in a metropolitan area, thenthe area as a whole might not be able to grow, and manyof the benefits of growth discussed earlier will be lost.
Four Factors to ConsiderBesides the important disconnect between the regionalbenefits and local costs of growth, we need to considerfour other factors when accounting for the benefits ofgrowth: population density before growth, pace of growth,long-run versus short-run considerations, and growthbenefits to existing versus new residents. We summarizeour thinking on each of these points next.
Population Density before Growth Two of the benefits of population growth, greater cluster-ing and choices, result from an increased concentrationof persons and economic activity. This increase in densi-ty might bring the largest benefits to regions that are ini-tially relatively less dense. However, the costs of popula-tion growth are also related to initial population density.One implication of that fact is that growth in alreadydense places might bring more costs than benefits. Yet,
concluding that growth is more beneficial in sparselypopulated regions ignores the rapid and likely highlybeneficial growth in already dense locations such as theSan Francisco Bay area and several other large U.S. cities.More properly stated, the benefits and costs of increasingdensity differ depending on the initial density of a placeor region, and strong clustering benefits can offset con-siderable costs. This relationship does not suggest that weignore the costs of growth, but it highlights the impor-tance of analyzing both costs and benefits.
Some high-density cities experienced vibranteconomic growth.
San Francisco and Boston, for example, are the second-and sixth-densest cities in the United States, but both havedeveloped strong employment growth in sectors that in-clude, among other things, high-technology businesses. Yet,some dense cities have more stagnant economies, such asJersey City and Newark, New Jersey, the third- and seventh-densest cities in the United States. In some places, densityproduces economic benefits, but density by itself is not theonly element of a vibrant economy. The link between densi-ty and economic growth is less ambiguous when one con-siders the least dense cities in the United States. Of citieswith more than 200,000 persons, the ten least dense cities,in order of increasing density, are Anchorage, Alaska; Okla-homa City, Oklahoma; Lexington, Kentucky; Jacksonville,Florida; Nashville, Tennessee; Kansas City, Missouri; Colorado
18 The Benefits of Growth
TABLE 6: DIVISION OF BENEFITS OF GROWTH BETWEEN REGION AND LOCALITIES (continued)
11. Economies of clustering Yes; the benefits to be derived from the Not Muchin production clustering of people and businesses that
a larger region allows spill over local boundaries.
12. Greater choices Yes; the benefits to be derived from the Not Muchgreater choices that a larger region allows spill over local boundaries.
13. Greater diversity Yes; the benefits to be derived from the Not Muchgreater diversity that a larger region allows spill over local boundaries.
14. Greater transportation, Yes; the benefits to be derived from all Not Mucheducation, arts, health care, of these amenities are best considered and recreation resources and regional because they spill over local opportunities boundaries.
Springs, Colorado; Fort Worth, Texas; Virginia Beach, Vir-ginia; and Mobile, Alabama. Few of these places are citiesthat one would consider to be either a technology center ora more general growth pole.
Source: U.S. Census Bureau, The Statistical Abstract of the United States (Washing-ton, D.C.: U.S. Census Bureau, various editions).
Pace of Growth Perceptions regarding the benefits and costs of populationgrowth are also a function of how fast the growth is occur-ring. Institutions, infrastructure and other governmentservices, politicians, and existing residents are less likelyto support growth the faster that it occurs. Citizens andpolicy makers are also far more likely to lament the loss of“community character” the faster that character changes.
From 1990 to 2000, the United States popula-tion, as a whole, grew at an annual rate ofslightly faster than 1 percent per year.
Some persons suggest that rapid local growth is growth thatsubstantially exceeds the 1 percent per year national aver-age. Rapid local growth can, at times, overwhelm the abili-ty of local and metropolitan officials to plan for growth,provide public services and infrastructure in a timely fash-ion, and cope with the costs of growth. Although it is diffi-cult, and likely unwise, to attempt to slow growth in fast-growing metropolitan regions, public officials might recog-nize that rapid growth, especially growth well in excess ofthe national growth rate, brings short-term stresses, even ifthe long-run benefits can be substantial. More attention tothe short-term “adjustment costs” associated with fast growthwill help provide more balanced policy treatment of theissue of growth in general.
Long-Run versus Short-Run Considerations The focus of people and politicians—especially Americans—is on the short term. Because a community or region ismore likely to slowly realize the benefits of growth, whilethe costs are immediate, political processes and publicopinion give disproportionate weight to short-run costs.For instance, growth and maturation of a city come withthe short-run cost of unsightly leapfrog developmentthat may later fill in to form a more complete and desir-able city.
Existing versus New Residents Often, a debate on the merits of growth will highlight thediffering perspectives of current and future residents. Ifthe costs of growth outweigh the benefits for current res-idents, but potential immigrants to the community gainmore than current residents lose, growth that could increasesocial welfare in the entire region is not welcome locally.
Economic and migration theory both suggestthat persons who move to a new city or metro-politan area are better off in their new locationthan in their old location.
Yet, existing residents might oppose growth if they perceivethat growth might, for example, create congestion that willreduce their quality of life. Thus, growth opponents some-times are arguing that benefits for existing residents shouldbe preserved at the expense of providing benefits for possiblenew residents. To some extent, these arguments might over-look the broad-based benefits of growth discussed in thispaper, and education on how growth is healthy for a metro-politan area might alleviate these concerns.
Policies to Balance Better the LocalBenefits and Costs of GrowthAs previously described, the purpose of this explorationis a better understanding of the benefits that populationgrowth brings to a region or a locality. If the local plusregional benefits of population growth are truly less thanthe local plus regional costs, then it is socially appropriatefor a jurisdiction to reject growth. If the local benefits ofgrowth are truly greater than the local costs, and a juris-diction still rejects growth, then a policy response mightinclude further education regarding the local benefits of
A ULI Working Paper on Land Use Policy 19
Los Angeles is considered by many to be thequintessential sprawling city, and in its earlyyears, development in the city did often pro-ceed in a leapfrog fashion.
Yet, as the city and metropolitan area have become builtout, previously undeveloped plots of land have been devel-oped—often at higher densities than surrounding, earlier,development. Now, very few undeveloped parcels are left inmany parts of Los Angeles.
growth. It is our hope that this paper assists in educatingothers on the benefits of growth.
If a jurisdiction rejects growth because the local benefitsto be derived from it are truly less than the local costs, butthe local and regional benefits of the growth are greaterthan the local and regional costs, then it is appropriate to suggest public policies to try to overcome this locallyrational, but regionally irrational, NIMBYism. We nextoffer some public policies suggested by experts.
State Encouragement of Regional Cooperation The obvious solution to this problem is somehow toraise the direct benefits that a jurisdiction experiencesfrom growth or to reduce a jurisdiction’s direct costsfrom growth. Because regional governance of the sortnecessary to make these changes does not exist in mostmetropolitan areas in the United States, state govern-ments must devise appropriate subsidy or intergovern-mental revenue-sharing formulas or put in motion legis-lation that encourages greater interjurisdictional cooper-ation or appropriate regional government structures thatcould undertake these tasks.
A handful of metropolitan areas have movedtoward more effective regional governance.
Examples include the unified city-county government in theIndianapolis, Indiana, metropolitan area; regional tax-basesharing in Minneapolis–St. Paul, Minnesota; and Portland,Oregon’s regional growth boundary. The experiences inthese places are generally cited as favorable. Greater metro-politan cooperation provides a framework for more effec-tively sharing in the benefits of regional growth.
Appropriate Fees and Charges Another related issue, one that is the mantra of antisprawlactivists, is that the benefits of population growth to aregion would be greater if more of the developmentoccurred within existing urbanized areas and at higherdensities. According to one version of this thinking,excessive growth at the urban fringe occurs because ofmarket failures: a market price for urban fringe land thatdoes not account for its social value, prices for privateautomobile use that exclude public costs (such as conges-tion and lower air quality), and public infrastructureconstruction costs that are less than fully paid for by thedevelopment that requires it. The solution may again bevarious forms of charges and fees that force the appro-
priate economic actors to consider the true social costs oftheir actions. The imposition of an urban growth bound-ary may achieve the same results, but the difficulty in plac-ing it appropriately and the additional costs that growthboundaries generate in metropolitan areas (likely higherhome and land prices within the boundary) make themless than an optimal policy instrument, according to mosteconomists and some planners who have studied theoutcomes associated with growth boundaries.
Motivated in part by a shortfall of traditionalhighway revenues, some localities in Californiabegan experimenting with user fees and locallygenerated funding for street and highwayimprovements.
More than 50 new centerline miles of highway capacity inOrange County, California, have been built as toll roads,and tolls have also been used in a privately financed high-way project in Orange County and in a previously under-used carpool lane in San Diego County. Many transporta-tion and urban experts argue that more optimal use ofhighway tolls, with other infrastructure charges that betterincorporate the costs of accommodating growth, has thepotential to contribute to more centralized, or less sprawl-ing, urban development. Although the extent to which bet-ter pricing of infrastructure can change urban growth pat-terns is still incompletely understood, localities seem will-ing, under certain circumstances, to experiment with pric-ing schemes that better apportion the costs of growth to thepersons that benefit from such growth. Experiments, suchas the use of toll lanes in southern California, can helppoint the way.
20 The Benefits of Growth
ConclusionGrowth brings both costs and benefits. In many placesand at many times the benefits of growth outweigh thecosts. Local opposition to growth is often based on sever-al factors that include a misunderstanding of the regionalbenefits of growth, a mismatch between predominantlylocal costs and regional benefits, concern about the paceof growth, or a focus on either the short-run effects ofgrowth or the effect on current, rather than new, resi-dents. Education about the process of growth can helpalleviate some of these local concerns. Other local con-cerns, most notably mismatches between local costs andregional benefits as well as adjustment costs caused byrapid growth, should be addressed by policy. Policies tohelp all localities in a metropolitan area better share inthe benefits of growth, and attention to managing thecosts of growth, will help ensure that the economic andsocial benefits of growth continue in urban areas through-out the United States.
This paper has served its purpose if it has clarified thebenefits that can be derived from growth. Our hope isthat we have spurred the reader’s further interest andthought on this topic and helped to inform the continu-ing debate on what constitutes truly smart growth andthe best practical ways to implement it.
References and FurtherReadingCalifornia Department of Finance. California StatisticalAbstract. Sacramento, Calif.: State of California, 2000.
Downs, Anthony. Growing to Greatness. Herndon, Va.:NAIOP–the National Association of Industrial and OfficeProperties, 1999.
Garreau, Joel. Edge City: Life on the New Frontier. NewYork: Doubleday, 1991. Reprint, New York: AnchorBooks, 1992.
Gruen Gruen + Associates. “Pillars of RegionalProsperity.” Trends E-mail newsletter, January 2001.
O’Neill, David. The Smart Growth Tool Kit. Washington,D.C.: ULI–the Urban Land Institute, 2000.
O’Neill, David. Smart Growth: Myth and Fact.Washington, D.C.: ULI–the Urban Land Institute, 1999.
Savageau, David, and Ralph D’Agostino. Places RatedAlmanac. Foster City, Calif.: IDG Books Worldwide,2000.
U.S. Census Bureau. The Statistical Abstract of the UnitedStates. Washington, D.C.: U.S. Census Bureau, variouseditions. Available at: http://www.census.gov/statab.
A ULI Working Paper on Land Use Policy 21

$ULI–the Urban Land Institute1025 Thomas Jefferson Street, N.W.Suite 500 WestWashington, D.C. 20007-5201www.uli.org