the benefits of option use by mutual...
TRANSCRIPT

The benefits of option use by mutual funds
MARKUS NATTER1, MARTIN ROHLEDER2, DOMINIK SCHULTE3, and MARCO
WILKENS4
University of Augsburg
February 18, 2015
Abstract. This is the first paper presenting consistent and convincing evidence on the
benefits of mutual fund option use. Our analysis using a comprehensive and previously
unused set of the SEC's own N-SAR filings from 1998 to 2013 reveals that option users have
higher risk-adjusted performance. This is based on superior skill and not only due to
mechanical effects. Option user funds show significantly less systematic risk because they use
options mainly for hedging strategies. Thus, mutual fund option use is beneficial for investors
and reduces systematic risk.
JEL Classification: G11, G20, G23
Keywords: Mutual funds, performance, options, hedging.
___________
* We are grateful for helpful comments and suggestions by Matthias Bank, Oliver Entrop, Hendrik Scholz, and
participants of the 2014 International doctoral seminar at the University of Innsbruck. We acknowledge financial
support by the Research Center Global Business Management of the University of Augsburg. All remaining
errors are our own. 1 Markus Natter, University of Augsburg, Chair of Finance and Banking, Universitaetsstr. 16, D-86159
Augsburg, Germany, phone: +49 821 598 4497, email: [email protected].
2 Martin Rohleder, University of Augsburg, Chair of Finance and Banking, Universitaetsstr. 16, D-86159
Augsburg, Germany, phone: +49 821 598 4120, email: [email protected].
(Corresponding author)
3 Dominik Schulte, University of Augsburg, Chair of Finance and Banking, Universitaetsstr. 16, D-86159
Augsburg, Germany, phone: +49 821 598 4122, email: [email protected].
4 Marco Wilkens, University of Augsburg, Chair of Finance and Banking, Universitaetsstr. 16, D-86159
Augsburg, Germany, phone: +49 821 598 4124, email: [email protected].

The benefits of option use by mutual funds
Abstract. This is the first paper presenting consistent and convincing evidence on the
benefits of mutual fund option use. Our analysis using a comprehensive and previously
unused set of the SEC's own N-SAR filings from 1998 to 2013 reveals that option users have
higher risk-adjusted performance. This is based on superior skill and not only due to
mechanical effects. Option user funds show significantly less systematic risk because they use
options mainly for hedging strategies. Thus, mutual fund option use is beneficial for investors
and reduces systematic risk.
JEL Classification: G11, G20, G23
Keywords: Mutual funds, performance, options, hedging.

1 Introduction and Literature Overview
This is the first paper presenting consistent and convincing evidence on the question whether
the use of options by mutual funds is beneficial or not. The vital importance of this question
is documented by the release of a SEC concept paper in 2011 requesting comments on this
matter.1 Moreover, the SEC's agenda for 2015 includes preparing stricter regulation of mutual
fund derivative use to limit potential risks posed to the financial system or the broader
economy.2 Our analysis is based on a large, comprehensive and previously unused set of the
SEC's own N-SAR filings on US equity mutual funds from 1998 to 2013 and reveals i) that
option users have higher risk-adjusted performance compared to nonuser funds which ii) is
based on superior skill and not due to purely mechanical effects . Moreover, option user funds
iii) have significantly less systematic risk because iv) they use options mainly for hedging
strategies and not for speculation. Thus, our comment on mutual fund option use is that it is
beneficial for investors and reduces systematic risk, contrary to the SEC's fear.
Previous research on mutual fund option use has not offered such clear evidence.
Lynch-Koski and Pontiff (1999) are the first to examine mutual fund derivative use. They
find no significant differences in performance and risk characteristics of users and nonusers.
However, their study is based on a telephone survey of only a small sample of funds for the
short period from 1992 to 1994.3 Since then capital markets experienced dramatic growth,
saw some major booms and crises and new regulation like the repealing of the short-short rule
in 1997 which necessitates a reassessment of the matter. Cao et al. (2011) find significantly
higher raw returns of heavy derivative users during the Russia crisis of August 1998.
However, they consider only raw returns so that higher return might simply be a function of
higher risk. They allow no assessment as to whether funds use derivatives for speculation or
for hedging. Furthermore, the Russia crisis is limited to only one month, so that this result is
hardly representative. Chen (2011) as well as Aragon and Martin (2012) find superior
1 http://www.sec.gov/rules/concept/2011/ic-29776.pdf (accessed 2/13/2015)
2 http://www.wsj.com/articles/sec-preps-mutual-fund-rules-1410137113 (accessed 2/13/2015).
3 In addition, the authors admit that managers' answers to the survey are not reliable.
3

performance of option using hedge funds which seem better capable of exploiting the
potentially more efficient information pricing on options markets to generate higher
performance at lower risk (e.g., Black, 1975; Cao et al., 2005; Pan and Poteshman, 2006).
However, as hedge funds are not subject to SEC regulation and thus less restricted in their
use of options these findings cannot automatically be transferred to mutual funds.
In the study most closely related to our own, Cici and Palacios (2015) find no
significant differences between option users and nonusers except for funds that excessively
write puts. However, written puts are the least important option type in their dataset as they
account for only 10% of all identified option positions. For 90% of option positions they find
no significant effects. Moreover, their results potentially suffer from severe limitations using
only information on the funds' holdings of exchange-traded options from 2003 to 2010 which
they obtain from Morningstar. They may underestimate option-usage due to i) window
dressing in holding reports to make portfolios appear less risky (Musto, 1997 and 1999; Morey
and O'Neal, 2006; Agarwal et al., 2014), ii) by neglecting the important market of OTC-
traded options,4 and iii) relying on string searching algorithms to identify option positions
from the holdings' names. As a consequence, Cici and Palacios (2015) identify only 250 funds
(10% of their sample funds) as option users whereas the information contained in the SEC's
mandatory N-SAR filings allows us to identify 612 (24% of our sample) mutual funds as users
of options.5
The contribution of this paper is manifold. i) Regarding the literature on the benefits
of mutual fund derivative use, we are, to the best of our knowledge, the first to find
significant and consistent cross-sectional differences in risk-adjusted performance between
4 In 2013, the dollar volume of options traded on the Chicago Board Options Exchange (CBOE) reached an amount of over $560 billion. On the over-the-counter (OTC) market, over $4,207 billion were traded. See CBOE (2013) Market Statistics and BIS (2014).
5 In unreported tests, we match our N-SAR/CRSP sample to Morningstar portfolio holdings. On the matched sample we use a similar string searching algorithm as described in Cici and Palacios (2015). In their sample period from 2003 to 2010 the holdings identify 199 funds (10.0%) as option users while N-SAR identifies 400 funds (20.1%). In our sample period from 1998 to 2013 the holdings identify 279 funds (13.5%) as option users while N-SAR identifies 505 funds (24.5%). Thus, Morningstar portfolio holdings severely underestimate mutual fund option use compared to the information contained in the SEC's mandatory N-SAR filings.
4

option users and nonusers. Specifically, funds that use at least one option of some kind during
their existence outperform nonusers by economically and statistically significant 0.48% p.a. on
a risk-adjusted basis, controlling for a wide range of other fund characteristics. Additionally,
our cross-sectional analysis shows that option users have significantly lower market betas
than nonusers and are thus less risky.
ii) We contribute to the literature on fund manager skill by showing that this
outperformance is not a mechanical effect, but the result of superior managerial ability.
Specifically, in contrast to most previous studies, we analyze mutual fund option use over
time using panel regressions. We demonstrate that option users outperform in times when
they actually employ options (0.72% p.a.) as well as when they actively choose to not employ
options (0.48% p.a.). The risk-reducing effect of option use, however, is observable exclusively
during times of actual option employment. During times of tactical nonuse there is no risk-
reducing effect. Thus, option users are not per se less risky but the option strategies employed
mechanically reduce risk. Therefore, option users are overall more skilled than nonusers.
iii) We also contribute to the literature on mutual funds' option investment strategies.
Our panel regression methodology and the information on long and short options positions
contained in the N-SAR filings allow us to infer the source of the options' impact on mutual
funds. The performance-enhancing effect described above is mainly driven by user funds'
short option positions which show a performance enhancement of 168 percentage points p.a.
This is consistent with an income generation strategy via option premiums. The risk-reducing
effect is predominantly driven by option users' long positions in options, consistent with a
hedging strategy. Overall, our results indicate that mutual funds use mainly covered call and
protective put strategies.
iv) We contribute to the literature on mutual fund performance measurement in
general by introducing a new investable factor that controls for option exposures in mutual
fund returns. Goetzmann et al. (2007), among others, show that classic linear performance
measures can be biased or even manipulated using options. To control for any such caveat,
our new \5-factor investable option strategy (IOS)"-model augments the Carhart (1997) 4-
5

factor model with the excess return of the CBOE S&P 500 BuyWrite Index. In contrast to
related approaches (e.g., Agarwal and Naik, 2004), the IOS factor represents returns of a
passive option strategy which is readily investable via index funds and ETFs.6
The remainder of this paper is organized as follows. Section 2 develops our research
hypotheses. Section 3 introduces the regulatory environment for mutual fund options use,
presents our dataset and describes performance models. Section 4 presents our empirical
results. Section 5 presents alternative explanations for our findings and comments on further
robustness checks. Section 6 concludes.
2 Research Hypotheses
In our study we examine four main hypotheses. The first two concentrate on the impact of
option use on mutual fund performance and on associated risk. The remaining hypotheses
concentrate on the sources of this relation. They test if the effects are mechanical or based on
skill and if options are used for hedging or for speculation purposes.
Specifically, our performance hypothesis tests whether option use results in higher
risk-adjusted performance or not. Arguments for a negative performance effect include higher
administration costs as option use might require more sophisticated information and risk
management systems (Lynch-Koski and Pontiff, 1999). Further, options are complex
instruments requiring more experienced fund managers with higher management expense
demands (Chevalier and Ellison, 1999). Bollen and Whaley (2004) argue that due to
increased buy pressure by portfolio insurers, options used for hedging are mispriced which
could diminish returns. A positive performance effect of option use may arise because of lower
transaction costs (Merton, 1995) or the facilitation of altering portfolio risk and return
profiles (Merton et al., 1978 and 1982). Mutual funds may profit from the more efficient
information pricing on option markets shown by Black (1975), Cao et al. (2005), and Pan and
Poteshman (2006). Guasoni et al. (2011) provide theoretical evidence that fund managers can
6 Cremers et al. (2013) show that it is important for benchmark factors to be investable in order to generate realistic performance estimates.
6
generate abnormal returns using option strategies. This is grounded in the fact that traded
option prices deviate from model-implied prices due to market incompleteness.7 This is
especially true with respect to single stock options. Further, selling options generates steady
option premium income. Thus, there are more arguments in favor of a positive performance
effect so that we hypothesize:
Option users have higher risk-adjusted performance (performance hypothesis).
Our risk hypothesis tests if option use results in higher risk due to the leverage inherent in
options. The collapses of Barings Bank and Long Term Capital Management show that
investing in options may lead to large losses. On the other hand, mutual funds may also
employ options for hedging purposes to lower fund risk. Moreover, summary statistics by Cici
and Palacios (2015) show that the most important option type used by mutual funds are
written calls (60% identified of option positions) which generate steady option premia at low
risk. Therefore, we hypothesize:
Option users have lower systematic risk (risk hypothesis).
Our skill hypothesis tests if any performance effect found under the performance hypothesis
is a result of superior (or inferior) fund skill. Alternatively, it may be a purely mechanical
effect resulting from nonlinearities and asymmetries associated with option returns.
Arguments in favor of the mechanical effect are presented by Leland (1999), Lhabitant
(2000), Whaley (2002), and Goetzmann et al. (2007) who show that performance measures
can be biased or even manipulated by using options. On the other hand, if only mutual fund
managers with more sophisticated information and risk management systems in place use
options (Cao et al., 2005), than they generate higher risk-adjusted performance even during
times when they are not employing options. Therefore, we hypothesize:
Option users are skilled (skill hypothesis).
7 Option pricing models as the Black and Scholes (1977) model assume continuous stochastic processes for the underlying asset as well as continuous rebalancing of a duplication portfolio in order to price options. This is not feasible in practice.
7

Lastly, our option strategy hypothesis tests if the effects on performance and risk shown
under the first three hypotheses are predominantly driven by short or long option positions of
mutual funds. Summary statistics in Cici and Palacios (2015) show that covered call (short),
which is a strategy for income generation, and protective put (long), which is a hedging
instrument, are the most prevalent option types held by mutual funds. Therefore, following
from our performance hypothesis, that option users have higher risk-adjusted performance,
and from our risk hypotheses, that option use reduces risk, we hypothesize:
The performance effect is mainly driven by short option positions, i.e. covered calls,
while the risk effect is mainly driven by long option positions, i.e. protective puts
(option strategy hypothesis).
3 Data and Performance Measurement
3.1 REGULATORY FRAMEWORK AND MANDATORY REPORTING
Any mutual fund registered in the US is regulated by the SEC. Mutual fund option use is
codified in the Securities Act of 1933 and the Investment Company Act of 1940 (ICA).
According to Section 18(f) ICA, mutual funds are generally prohibited from obtaining any
kind of leverage. Uncovered written options can bear unlimited downside risk and are thus
understood as leverage. Mutual funds nevertheless have the permission to sell options if they
fulfill the SEC's asset coverage requirement, i.e. if the fund's total net assets (TNA) plus the
options' market value divided by the options' market value is greater than 300%. There are
three ways to short options: i) selling an option on an underlying asset the fund already owns,
ii) selling an option on an underlying asset, for which the fund already owns an offsetting
option position, iii) holding highly liquid assets, e.g. cash, treasuries, corporate bonds, or
liquid stocks, covering the option's market value in a segregated account. Long option
positions are limited in their downside risk and therefore not treated as leverage.
In either case, the SEC requires mutual funds to disclose their options use in
mandatory semiannual N-SAR filings. This makes them an optimal source for our study. The
filings provide rich information on investment practices, i.e. about the permission to use and
8

the actual usage of different types of options, such as single stock options (Item 70B), debt
options (70C), stock index options (70D), options on futures (70G), and options on stock
index futures (70H). Our option usage variables are based on all of these option types.8 In
addition, the filings provide balance sheet data on option positions, i.e. the dollar amounts of
purchased equity options (74G) and options on futures (74H) as well as on written options
(74R3). This enables us to distinguish between long and short option positions.
3.2 SAMPLE CONSTRUCTION
The mutual fund data used in our study stem from different sources. We obtain over 129,000
individual N-SAR filings in unformatted text files from the SEC's EDGAR9 database. These
are processed into a formatted table. In order to obtain the final dataset this table is matched
to the CRSP mutual fund database. Since there is no identifier that matches funds uniquely,
we employ algorithmic string matching techniques to match N-SAR and CRSP funds by their
names. This requires extensive manual corrections of incorrect or inconsistent fund names in
N-SAR. Any potentially false matches are rigorously removed by several screening techniques
further described in the Appendix.10 Electronic N-SAR filings are available since 1996.
However, as the repealing of the short-short-rule with the Taxpayer Relief Act of 1997
represents a structural break in the regulation of mutual fund derivative use, we limit our
sample to the period from 1998 to 2013.
The mutual fund data in N-SAR are at the fund level whereas the data obtained from
CRSP are at the share class level. Therefore, we aggregate most variables to fund level by
value-weighting according to share class TNA. Fund level TNA is defined as the sum of the
share classes' TNA, fund age is the age of the longest existing share class, and the load
variable contains load information of the largest share class. We exclude funds before they
first surpass the threshold of 5 million US$ in TNA as in Fama and French (2010) to mitigate
8 In additional checks, we show that our results are consistent when only looking at equity options. 9 http://www.sec.gov/edgar.shtml.
10 Table A in the Appendix shows no significant deviations of our matched sample from the complete CRSP sample of actively managed domestic equity funds with respect to major fund characteristics.
9

incubation bias (Evans, 2010).11 As we estimate performance measures via Regression
analysis, we also exclude funds with less than 24 monthly observations in order to obtain
reliable results.12 The final sample consists of 2,576 actively managed domestic equity mutual
funds with 231,641 monthly data points. To our best knowledge, this is the largest matched
N-SAR/CRSP dataset used in the mutual fund derivative literature to date.
3.3 OPTION VARIABLES
The main explanatory variable in our cross-sectional regressions, Useri, is a dummy variable
which equals one if a fund uses options of some kind at least once during our sample period
and zero otherwise.13 Panel A of Table I reports summary statistics on cross-sectional option
permission and usage. 94% of funds are allowed to purchase and write options but only a
fraction of them actually makes use of this permission.14 24% of all funds use some kind of
option at least once. This is consistent with Almazan et al. (2004) who show that mutual
funds fixate permissions in their fundamental investment policies to ensure the greatest
possible scope for investment practices, regardless of their inclination of actually using them.
The underlying securities of our options are mainly stocks and stock indexes. This is not
surprising because our sample consists solely of equity funds. Deli and Varma (2002) and
Chen (2011) interpret the suitability of the options to the respective investment style as
evidence that funds try to mitigate transaction costs by using derivatives. Panel A further
reports the average percentage of time the funds actually use options, which is only 40% of
the time.
11 The results remain qualitatively the same for thresholds of 15 and 50 million US$ in TNA.
12 The results stay qualitatively unchanged for 48 fund months as minimum sample size per fund.
13 In additional tests, we alternatively define Useri as a fund that used some kind of options at least, 10%, 20%, or 30% of the time. The results become weaker with stricter requirements because more and more users are transferred to the group of nonusers, thereby diluting the differences between the groups. In our panel analysis, we implicitly control for the frequency of option use by individual funds.
14 If funds that have permission to use options differ severely from those funds that are not allowed to use options our results may be spurious. However, in unreported analyses our results are not affected by looking only at those funds that have permission to use options.
10

[Insert Table I here.]
The main explanatory variable in our panel regressions, Usingi;t, is a dummy variable which
equals one in each month a user fund employs some kind of option and zero otherwise. Panel
B of Table I shows statistics on option permissions and usage from our panel analysis. In 89%
of all monthly fund observations funds are permitted to use at least one kind of option.
However, options are actually used in only 9% of all observations. Hence, the decision to
employ options might be made tactically by fund managers. To capture this effect, we define
the dummy variable Active_non_usingi;t which equals one if a user fund does not use
options in a specific month, and zero otherwise.15
t
The variable is used in combination
with Usingi; and measures the impact of a fund's active tactical decision to not employ
options in the respective month, although it generally uses options. This enables us to
distinguish between the mechanical effects of option use on performance and risk and any
effect based on skill.
In addition we use balance sheet data on long and short option dollar amounts to infer
actual fund option strategies, i.e. if funds use options for hedging or for speculation purposes.
To differentiate between the effects of long option positions and short option positions on
performance and risk we define two new dummy variables. Longi;t equals one in all periods a
fund has a net long position in options and zero otherwise. Analogously, tShorti; equals one if
the fund has a net short position in options and zero otherwise.
3.4 PERFORMANCE MEASUREMENT
To measure fund performance and risk we use fund gross returns. Fama and French (2010) as
well as Pastor and Stambaugh (2014a) argue that gross returns are more appropriate for the
measurement of skill because they represent the returns generated by manager's investment
decisions. Our baseline performance model is Carhart's (1997) 4-factor model as it is the
15 In additional tests, we define funds as option users only after they first used options. The results are the same.
11
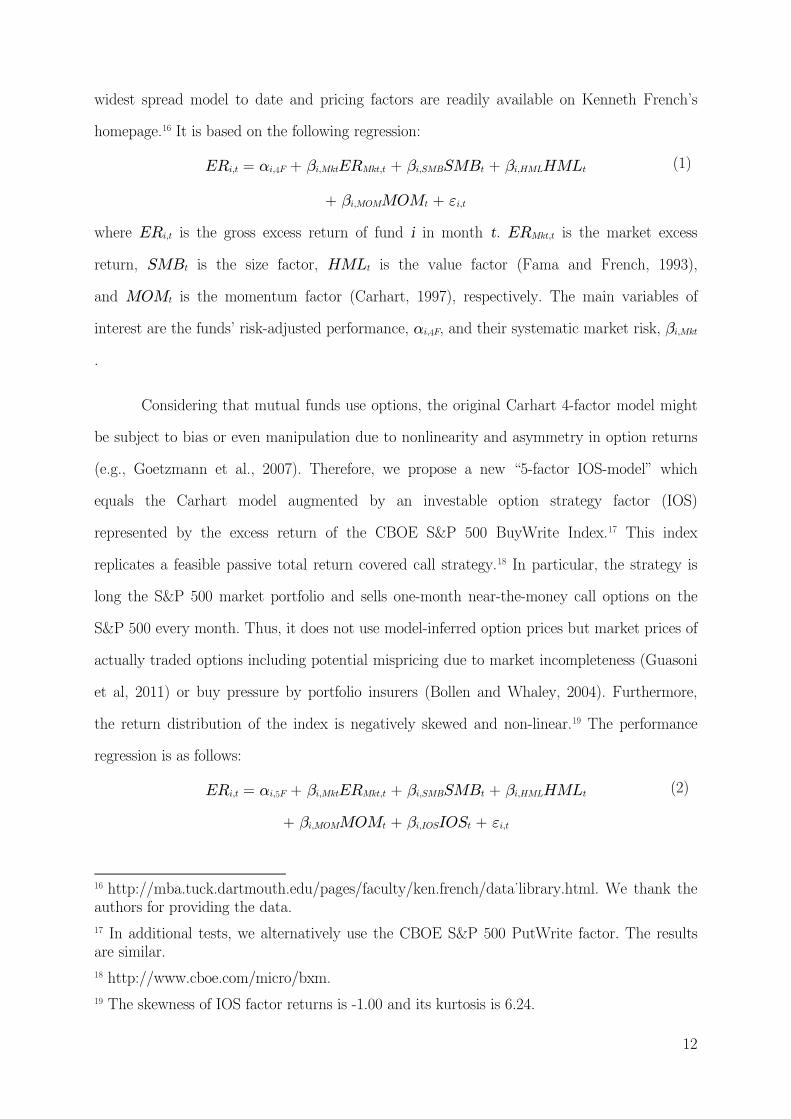
widest spread model to date and pricing factors are readily available on Kenneth French's
homepage.16 It is based on the following regression:
ERi;t = F®i;4 + ¯i;MktERMkt;t + ¯i;SMBSMBt + ¯i;HMLHMLt
+ ¯i;MOMMOMt + t "i;
(1)
where ERi;t is the gross excess return of fund i in month t. ERMkt;t is the market excess
return, SMBt is the size factor, HMLt is the value factor (Fama and French, 1993),
and MOMt is the momentum factor (Carhart, 1997), respectively. The main variables of
interest are the funds' risk-adjusted performance, F®i;4 , and their systematic market risk, ¯i;Mkt
.
Considering that mutual funds use options, the original Carhart 4-factor model might
be subject to bias or even manipulation due to nonlinearity and asymmetry in option returns
(e.g., Goetzmann et al., 2007). Therefore, we propose a new \5-factor IOS-model" which
equals the Carhart model augmented by an investable option strategy factor (IOS)
represented by the excess return of the CBOE S&P 500 BuyWrite Index.17 This index
replicates a feasible passive total return covered call strategy.18 In particular, the strategy is
long the S&P 500 market portfolio and sells one-month near-the-money call options on the
S&P 500 every month. Thus, it does not use model-inferred option prices but market prices of
actually traded options including potential mispricing due to market incompleteness (Guasoni
et al, 2011) or buy pressure by portfolio insurers (Bollen and Whaley, 2004). Furthermore,
the return distribution of the index is negatively skewed and non-linear.19 The performance
regression is as follows:
ERi;t = F®i;5 + ¯i;MktERMkt;t + ¯i;SMBSMBt + ¯i;HMLHMLt
+ ¯i;MOMMOMt + ¯i;IOSIOSt + t "i;
(2)
16 http://mba.tuck.dartmouth.edu/pages/faculty/ken.french/data_library.html. We thank the authors for providing the data.
17 In additional tests, we alternatively use the CBOE S&P 500 PutWrite factor. The results are similar.
18 http://www.cboe.com/micro/bxm.
19 The skewness of IOS factor returns is -1.00 and its kurtosis is 6.24.
12

To control for higher moments in fund returns, especially in those of option users, we
additionally use Leland's alpha. Leland (1999) argues that long option positions generate
positive skewness due to limited downside risk and lead to negatively biased alphas. Short
option positions conversely generate negative skewness due to limited upside potential and
therefore lead to positively biased alphas. Thus, we control for higher moments in fund
returns by using the following model where E(ri) is the expected gross return of fund i
and E(rMkt) is the expected market return to measure performance:
® L;i = E(ri) { BL;i[ E(rMkt) { rf] { fr ,
where: BL;i = {(1 + rMkt){b]cov[ri, {(1 + rMkt){b]cov[rMkt,
with b = ln[E(1 + rMkt)] { ln(1 + rf)
var[ln(1 + rMkt)]
(3)
Furthermore, symmetric CAPM-based performance models may also be inadequate because
options generate asymmetric payoff profiles. Bawa and Lindenberg (1977) argue that
downside risk is more relevant. Thus, we use the Bawa/Lindenberg-alpha which considers the
semi-variance instead of the symmetric variance to measure performance:
® BL;i = E(ri) { BBL;i[ E(rMkt) { rf] { fr ,
where: BBL;i = cov[ri, rMkt | rMkt < 0] var[rMkt | rMkt < 0]
(4)
As the models by Leland (1999) and Bawa and Lindenberg (1977) are based on the CAPM,
they consider only the market factor. To control for size, value and momentum we
orthogonalize fund and market returns against the remaining Carhart factors using a similar
transition as in Rohleder et al. (2011) and Cici and Palacios (2015).20
20 In additional analyses, we use the classic CAPM model without orthogonalization. The results are the same.
13

4 Empirical Results
4.1 DESCRIPTIVE STATISTICS
Table II reports cross-sectional summary statistics on mutual fund characteristics separately
for option users and nonusers. Option users are bigger on average but smaller in the median.
This means that there are a large number of small option users and only a small number of
large option users. Option users are older on average but younger in the median so that a
large number of users is rather young which Pastor et al. (2014a) associate with a higher level
of skill. User funds have higher turnover both on average and in the median. This could be
due to more active management of user funds which, e.g., Amihud and Goyenko (2013) and
Pastor et al. (2014b) associate with higher skill. Option users charge higher expense ratios
and the fraction of load funds is higher consistent with Lynch-Koski and Pontiff (1999).
Higher fees could be charged to compensate for higher costs associated with more
sophisticated information and risk management systems as well as more experienced fund
managers. However, there is no significant difference in manager tenure between option users
and nonusers. Users hold more cash on average which could be associated with the
requirement of holding liquid assets in a segregated account. Besides, user funds experience
smaller amounts of net flows on average. We use all of the fund characteristics as control
variables in our further analyses (e.g., Almazan et al., 2004; Ferreira et al., 2012).
[Insert Table II here.]
Regarding gross excess returns, user funds tend to have lower returns on average (0.48% vs.
0.52%). However, the difference is not statistically significant. Total risk, as measured by the
standard deviation of returns, does not differ between users and nonusers. Regarding the
return distribution's higher moments, there are no significant differences between users and
nonusers, except for slightly less negative skewness of users. This could be due to more long
option positions such as protective puts (e.g., Leland, 1999) used for hedging purposes. The
statistics on risk-adjusted performance present first evidence in favor of our performance
hypothesis as user funds have significantly higher alphas according to all four performance
14

models compared to nonusers (e.g., 0.72% vs. 0.12% p.a. in case of the Carhart model).21
Market betas associated with the four performance models offer first evidence in favor of our
risk hypothesis. They are significantly lower for option users than for nonusers (95.84% vs.
99.07% in case of the Carhart model).
4.2 CROSS-SECTIONAL REGRESSION ANALYSIS
To test our performance hypothesis, that option use enhances risk-adjusted performance we
run the following cross-sectional regression:
E A + A´ Eiperformancei = Á0 + Á 1Useri + §
Jj=2 Á jControlsj (5)
where AperformanceEi A is defined as fund i's risk-adjusted performance measured with either of
the four performance models described in Section 3.4 using monthly gross returns over the
entire sample period for each fund. The variable of interest, AUserEi A, is defined as in sub-section
3.3 and is one if a fund uses options of some kind at least once and zero otherwise. Table III
reports the results. The AUserEi A dummy has significantly positive influence on the Carhart 4-
factor alpha supporting our performance hypothesis. If a fund uses options at least once
during its existence, it offers superior risk-adjusted performance on average compared to a
nonuser fund. Similar results are displayed for the other measures explicitly controlling for
option-specifics in fund returns. Hence, the performance-enhancing effect is not due to any
mechanical bias.
The coefficients on the control variables indicate that larger funds with more
experienced fund managers generate significantly higher performance. Higher turnover on the
other hand reduces performance which is in line with higher transaction costs associated with
more intensive trading (e.g., Carhart, 1997) or with overconfidence (e.g., Puetz and Ruenzi,
2011). Management fees have a negative impact on fund performance in line with results of
Carhart (1997). The coefficients for loads and for net fund flows have positive signs, although
21 In additional analyses, we measure performance using net returns. In these tests, funds underperform their benchmark, which is in line with the literature on mutual fund performance (e.g., Jensen, 1968; Carhart, 1997; Pastor and Stambaugh, 2002). Other than that, the results are the same.
15

only the latter is statistically significant. Older funds have a slightly lower risk-adjusted
performance consistent with Pastor et al. (2014a). Funds that hold more cash have higher
performance in line with Simutin's (2013) findings.
[Insert Table III here.]
To test our risk hypothesis, that option users have lower risk, we run a second cross-
sectional regression where the dependent variable Ariski E A is defined as the market beta of fund i
according to either of the four performance models:
AriskEi A = AÁ0 E A + AÁ 1Useri E A + A§
JAEj=2E AÁ jControlsj E A + A´ Ei (6)
Table IV shows significantly negative effects of option use on systematic risk so that option
users have lower market betas compared to nonusers. This risk-reducing effect is similar for
all four performance models, however insignificant for the Bawa/Lindenberg beta which
considers only downside risk. On the other hand, the effect is strongest for our new 5-factor
IOS model. The control variables indicate that more experienced fund managers have lower
market risk in line with Chevalier and Ellison (1999). Funds with higher expense ratios have
significantly higher market risk. Loads and net flow are negatively correlated with market
risk. The loadings of cash positions are negative as cash, by definition, creates no market risk
exposure.
[Insert Table IV here.]
Overall, the results of our cross-sectional regressions confirm our first two research hypothesis,
the performance hypothesis and the risk hypothesis, in showing that option use enhances
risk-adjusted performance while at the same time reducing systematic risk. This is in contrast
to the SEC's worries that mutual fund option use could pose risk to the financial system or
the broader economy. In the following we analyze the sources of these effects in more detail.
4.3 PANEL ANALYSIS OF SKILL
Our cross-sectional regressions show that option use has a performance-enhancing effect for
mutual funds. This could be a mechanical effect arising from option characteristics. On the
16

other hand, option users may be more sophisticated than nonuser funds. If the positive
relation between option users and fund performance is also observable in months when user
funds tactically choose not to employ options, we can rule out a mechanical effect of options
on performance. Rather, option user funds would possess skill. To test this skill hypothesis,
we run the following panel regression explaining performance with time-variable option use
variables and control variables including style- and time-fixed effects:
performancei;t = Á0 + Á1Usingi; t + Á2Active_non_usingi; t
+ §Jj=3 ÁjControlsi;j;t + t ´i;
(7)
Here, performancei;t is the risk-adjusted performance of fund i in month t measured using
daily gross returns via either of the four performance models described in sub-section 3.4.22,23
The variables of interest, Usingi;t and Active_non_usingi; t, are defined as in sub-section 3.3
and indicate if a fund uses options in a specific month or if a user fund actively decides not to
use options in a specific month, respectively. If the performance-enhancing effect of option use
is purely mechanical then exclusively Usingi,t should display a positive impact on
performance. If, on the other hand, the effect is partly due to superior skill
then Active_non_usingi; t should also have a positive and significant coefficient.
In Panel A of Table V the coefficient on Usingi,t shows that option employment
generates an outperformance of 0.72% p.a. on average (Carhart). This result holds for all of
our four performance measures and is further evidence in favor of our performance
hypothesis.24 More interestingly, the coefficient for Active_non_usingi; t is also positive and
highly significant for all four performance models, except for Bawa/Lindenberg. This means
that user funds that actively decide not to use options in a given month exhibit an
22 In additional analyses we alternatively use the approach proposed by Dimson (1979) to control for any bias caused by non-synchronous trading in daily returns. The results are qualitatively the same.
23 In additional analyses we also calculate monthly alphas using monthly returns via rolling window regressions for 12- and 36-months windows, both overlapping and non-overlapping. The results are qualitatively the same.
24 In additional analyses, we use Usingi,t exclusively. The performance-enhancing effect of option use is the same.
17

outperformance of 0.48% p.a. compared to nonusers. Hence, we conclude that the superior
performance of user funds has its roots at least partly in valuable selection or timing skills of
fund managers lending strong support to our skill hypothesis.25
[Insert Table V here.]
As the cross-sectional regressions have shown that option users have lower market risk, these
findings could, however, be spurious if option users have per se lower risk. Therefore, we run
the following panel regression analog to Regression (7) explaining risk:
riski;t = Á0 + Á1Usingi; t + Á2Active_non_usingi; t
+ §Jj=3 ÁjControlsi;j;t + t ´i;
(8)
where riski;t is the market beta of fund i in month t measured by either of the four
performance models using daily data. The coefficient on tUsingi, in Panel B of Table V shows
that option use leads to significantly lower market risk as beta is reduced by 10 percentage
points on average. The results hold for all four models consistent with our risk hypothesis.
More importantly, the coefficients for Active_non_usingi; t are insignificant and near-zero.
Thus, the risk-reducing effect of option use is purely mechanical. This presents further
evidence that the performance-enhancing effect shown in Panel A is not based on structural
risk differences between users and nonusers per se. Thus, the strong performance-enhancing
effect combined with the non-existing risk-reducing effect of Active_non_usingi; t confirms
our skill hypothesis that option user funds exhibit more skill compared to nonusers.
4.4 PANEL ANALYSIS OF OPTION STRATEGIES
In the following, we analyze which option strategies predominantly drive the performance-
enhancing effect documented under our performance hypothesis and which option strategies
drive the risk-reducing effect documented under our risk hypothesis. Our option strategy
25 In additional analyses, we test if this result holds for funds exclusively using single stock options as one could argue that picking single stock options requires more skill. Moreover, single stock options should exhibit more mispricing and picking potential compared to index options due to market incompleteness (e.g. Guasoni et al., 2011). The results to this test are qualitatively the same.
18

hypothesis thus states that the performance effect is mainly driven by short option positions,
consistent with an income generating strategy via option premiums. On the other hand, the
risk effect is mainly due to funds' long positions in options, consistent with a hedging
strategy. To test this hypothesis, we run the following panel regressions explaining
performance and risk with dummy variables indicating net long and short positions in options
as well as control variables including style- and time-fixed effect:26
performancei;t = Á0 + Á1Longi; t + Á2Shorti; t + §Jj=3 ÁjControlsi;j;t + t ´i; (9)
riski;t = Á0 + Á1Longi; t + Á2Shorti; t + §Jj=3 ÁjControlsi;j;t + t ´i; (10)
Panel A of Table VI presents the results for Regressions (9) and shows that the performance-
enhancing effect of option use is mainly due to short positions in options. These show a
positive and significant effect of 1.68 percentage points (Carhart), consistent with our
hypothesis. The effect is consistent for all performance models. Long positions in options have
also a positive but statistically insignificant impact on performance except for Leland's alpha
where the effect is significant. This is explained by the fact that Leland's (1999) model
considers skewness in fund returns, which corrects alphas on short positions downwards and
alphas on long positions upwards. In summary, both long and short option positions lead to
higher risk-adjusted performance.
Panel B in Table VI reports the results for Regression (10). The results indicate that
the risk-reducing effect is mainly due the funds' long option positions. These reduce market
beta significantly by 21.73 percentage points (Carhart). This is consistent for the other
performance models. Short positions in options also show a significant reducing effect on
market risk of 10.45 percentage points, but not as strong as the long positions. The results are
similar for other market betas.
[Insert Table VI here.]
26 Untabulated statistics show that option users are net long in 19% of the using months and net short in 36% of the using months. In the remaining using months they have net zero options positions and are treated as nonusers. In additional tests, we exclude all net zero user fund months from the sample. The results are the same.
19

Regarding the specific option types used by mutual funds, lower systematic risk can only be
achieved via long options if funds purchase puts. This has the effect of indirectly selling
exposure to the option's underlying. It is now logical to assume that option users' long
positions in options are predominantly protective puts as introduced by Merton et al. (1982).
Further, the risk-reducing effect documented also for short positions in options can only be
achieved if funds write calls and thereby indirectly sell exposure to the option's underlying.
As the SEC requires all short positions in options to be covered, the predominant short
option strategy employed by option users must be a covered call strategy. This confirms our
option strategy hypothesis, that option user funds use protective put strategies for hedging
purposes in combination with covered calls to generate steady income through option
premiums. It is also consistent with summary statistics in Cici and Palacios (2015), who in
sharp contrast to our clear findings, find no significant effect of these option types on
performance or risk.
5 Alternative Explanations and Robustness
5.1 LEVERAGE EFFECT
Performance as measured by linear regression models is a function of systematic risk. Hence,
any non-zero alpha can be scaled up and down the security market line using leverage (e.g.,
Rudd and Clasing, 1988; Scholz and Wilkens, 2005). In case of mutual funds, a manager who
generates a non-zero alpha could increase or decrease it by leveraging the alpha generating
holdings. As options are leveraged investments in the underlying asset, the performance-
enhancing effect of using options could be a consequence of the leverage effect inherent in
options. To rule out this explanation, we run additional analyses similar to Regressions (5)
and (7) including market beta as an additional control variable. Results indicate that the
impact of systematic risk on performance is negative but insignificantly so, while our main
20
finding that option use enhances performance both in the cross-section and in the panel
remains the same.27
To further control for any biases that might occur because of leverage we estimate the
\market-risk-adjusted performance" measure proposed by Scholz and Wilkens (2005) and the
\manipulation proof performance" measure proposed by Goetzmann et al. (2007). The results
are qualitatively the same as in our main analysis. Thus, leverage cannot explain our results.
5.2 MARKET TIMING
Classic market timing approaches such as the Treynor and Mazuy (1966) model are often
criticized because any loadings on the squared market factor intended to measure timing-
activity could also represent other sources of nonlinearity such as options (e.g., Jagannathan
and Korajczyk, 1986). Using the reverse argumentation, our findings regarding the effect of
option use on performance and risk could be driven by option users' market timing activities.
Therefore, in additional analyses, we include a Treynor and Mazuy (1966) timing term in the
Carhart (1997) model. The results are the same as in our main analysis.
To further control for conditional market timing based on publicly available
information, we also recalculate performance and risk measures using a Carhart (1997) model
where the market beta is measured conditional on the factors proposed by Ferson and Schadt
(1996). The results are qualitatively the same as in our main analysis. Thus, market timing
also cannot explain our results.
5.3 ALTERNATIVE RISK MEASURES
In our main analysis, we measure risk using the market beta from either of the four
performance models. However, the results regarding risk-reducing effects of option use might
be spurious if risk is simply shifted to other risk factors. Therefore, in additional tests, we
estimate Regressions (6) and (8) using total risk as measured by funds' return volatility
instead of beta. The results are similar to those in our main analysis.
27 For brevity, the tables for this section are not reported, but available from the authors upon request.
21

To test further if any of the higher moments in option user returns can explain the
risk-reducing effect compared to nonusers, we estimate Regressions (6) and (8) using skewness
and kurtosis instead of market beta. The effect on skewness is negative and on kurtosis
positive, although not statistically significant at conventional levels. Overall, the use of
alternative risk measures and higher moments of the return distribution cannot explain the
results in our main analysis lending further confidence to the validity of our main results.
5.4 FURTHER ROBUSTNESS CHECKS
To rule out that our choice of Carhart's (1997) model as our baseline model drives our
results, we estimate fund performance and risk using the CAPM and the Fama and French
(1993) 3-factor model as our baseline model. Further, as performance could be driven by
premia on illiquid securities, we use the Carhart (1997) model augmented with the market
illiquidity factor from Pastor and Stambaugh (2003) as our baseline model. The results on
these tests are similar to those in our main analysis.
Moreover, Cremers et al. (2013) introduce a novel approach of measuring performance
with easily investable, feasible benchmarks. They argue that the Fama and French (1993)
and Carhart (1997) factors suffer from several biases, especially that they produce non-zero
alphas on average. Therefore, in additional tests, we employ the index-based 4-factor and 7-
factor proposed by Cremers et al. (2013). Results are similar to those in our main analysis.
Our sample period from 1998 to 2013 covers a long time span of 15 years which saw
some major booms and crises. Despite the inclusion of time-fixed effects in our panel
Regressions, we split our data set into two separate sub-periods to analyze if the performance-
enhancing and risk-reducing effects are sub-period specific. The sub-samples cover the years
from 1998 to 2004 and from 2005 to 2013, respectively. While qualitatively the same during
both sub-periods, our findings are stronger in the earlier period and weaker during in the later
period.
22

6 Conclusion
We show that the use of options by mutual funds yields higher risk-adjusted performance
compared to nonuser funds. This is not only due to mechanical effects but also based on
superior skill of option user funds' managers. Moreover, option user funds show significantly
less systematic risk because they use options mainly for hedging strategies and not for
speculation. Previous research on mutual fund option use has not offered such clear evidence
as most of these studies suffer from severe data limitations whereas we are able to base our
analysis on a large, comprehensive and previously unused sample of the SEC's mandatory N-
SAR filings. We thereby contribute to several streams in mutual fund research. Specifically,
we add to the literature on the benefits of mutual fund derivative use by showing a
performance-enhancing and risk-reducing effect of option use and to the literature on fund
manager skill by showing that option users are more skilled than nonusers. Further, we
contribute to the literature on mutual fund option investment strategies by showing that the
performance-enhancing effect is, consistent with covered call strategies for income generation,
predominantly driven by funds' short positions. The risk-reducing effect of options is mainly
driven by funds' long option positions, consistent with protective put strategies for hedging.
Lastly, we contribute to the literature on performance measurement in general by introducing
the new 5-factor IOS-model, which controls for option exposure in mutual fund returns using
a feasible option strategy based on actually traded investment alternatives.
Overall, this paper helps answer the vital question if derivative use by mutual funds is
beneficial or not released onto the public in a concept paper by the SEC in 2011 and
currently leading to the preparation of new regulation by the SEC in fear of any risk posed to
the financial system or the broader economy. However, our results indicate that such fears
might be unjustified as mutual fund option usage enhances their performance and reduces
their systematic risk.
23

Appendix: N-SAR-CRSP Matching and Data Screening
From the SEC's EDGAR online database we obtain 129,318 individual N-SAR-filings for the
period from 1998 to 2013 in unformatted text format which are parsed into a formatted table
using regular expressions under Linux. In addition, we extract ticker symbols from the header
sections of the filings. To construct our final dataset, this table must be matched to the funds
in the CRSP database. Unfortunately, there is no common identifier in CRSP and N-SAR.
Even worse, in N-SAR there is no consistent fund identifier over time. Although the general
instructions of the SEC urge registrants to use consistent information, the company
identification key (CIK) and series numbers change over time for a substantial number of
funds. Consequently, we match N-SAR and CRSP using the funds’ names for each reporting
date. For entries where ticker information is available in both CRSP and N-SAR filings, we
additionally use the ticker symbols to match the funds. To improve our matching accuracy
we clean fund names in CRSP and N-SAR by hand, i.e. by deleting special characters such as
\," and \:" and standardize abbreviations (e.g., \Small CP" or \Small Capitalization"
becomes \Small Cap"). Furthermore, as fund name entries in N-SAR are often erroneous we
correct them manually. The actual matching of fund names is conducted with Winkler's
(1990) Jaro-Winkler string distance metric as implemented in the SimMetrics open source
library. In tests with our database, we find the Jaro-Winkler algorithm to be superior to other
string matching techniques in the SimMetrics library regarding speed and matching accuracy.
Since algorithmic string matching techniques can lead to false positive matches, all
matches are checked manually for plausibility. In the following step, the match sample is
cleaned from further false positives as in Chen et al. (2013). Funds with discrepancies of more
than 10% for net assets reported in N-SAR and CRSP in more than 25% of the reported
months are rigorously discarded from our sample.
Table A presents cross-sectional statistics of fund characteristics for both the matched
N-SAR/CRSP sample and from the complete actively managed domestic equity fund
universe from CRSP to check for any systematic biases in our sample. However, there is no
significant difference in the main fund characteristics. Thus, we conclude that our sample is
representative for the universe of all active U.S. domestic equity funds.
24

Table A: Comparison of CRSP and N-SAR samples by year
This table compares average fund characteristics for two samples of actively managed domestic equity funds by year during the period 1998-2013. Panel A shows the relevant variables for funds with entries in both the N-SAR filings and the CRSP mutual fund database. Panel B shows the relevant variables for funds available in the CRSP mutual fund database. All variables are taken from the CRSP mutual fund database.
Panel A: N-SAR Matched Data Panel B: CRSP Data
Year Funds TNA Expense ratio
Turnover ratio
Age Excess return
Funds TNA Expense ratio
Turnover ratio
Age Excess return
1998 438 1,812 0.0126 0.9460 8.75 0.0213
1,734 993 0.0128 0.9310 8.6470 0.0152
1999 876 1,608 0.0126 0.9910 8.65 0.0387
1,908 1,114 0.0129 1.0100 8.7940 0.0244
2000 1,028 1,559 0.0127 1.0610 8.40 0.0012
2,132 1,209 0.0131 1.1150 8.8280 0.0012
2001 1,143 1,217 0.0131 1.1720 8.66 -0.0048
2,270 966 0.0133 1.2400 9.0220 -0.0053
2002 1,334 947 0.0134 1.2300 8.97 -0.0185
2,379 800 0.0136 1.2470 9.4020 -0.0188
2003 1,426 926 0.0137 1.1450 9.38 0.0244
2,456 785 0.0139 1.1680 9.8120 0.0242
2004 1,508 1,102 0.0135 1.0010 9.84 0.0113
2,470 983 0.0137 1.0060 10.3100 0.0101
2005 1,853 1,157 0.0129 0.8960 10.54 0.0073
2,539 1,074 0.0131 0.9370 10.4900 0.0059
2006 1,933 1,189 0.0123 0.8340 10.52 0.0106
2,632 1,172 0.0126 0.8950 10.5700 0.0104
2007 1,979 1,303 0.0117 0.8450 10.80 0.0050
2,668 1,298 0.0120 0.9010 10.8000 0.0052
2008 1,994 1,044 0.0114 0.8830 11.31 -0.0376
2,665 1,073 0.0116 0.9130 11.2300 -0.0372
2009 1,964 799 0.0112 1.0010 11.87 0.0239
2,629 842 0.0114 1.0240 11.7700 0.0231
2010 1,940 979 0.0112 0.8950 12.33 0.0160
2,547 1,041 0.0113 0.9220 12.3100 0.0154
2011 1,905 1,134 0.0109 0.7870 12.70 -0.0004
2,525 1,183 0.0109 0.7970 12.7600 -0.0003
2012 1,810 1,243 0.0106 0.7570 13.72 0.0123
2,380 1,274 0.0105 0.7600 13.5500 0.0122
2013 1,645 1,567 0.0104 0.7290 14.70 0.0233 2,248 1,611 0.0104 0.7280 14.6400 0.0239
25

References
Agarwal, V. and Naik, N. Y. (2004) Risks and portfolio decisions involving hedge funds. Review of Financial Studies 17 (1), 63{98.
Agarwal, V., Gay, G. D., and Ling, L. (2014) Window Dressing in Mutual Funds. Review of Financial Studies 27 (11), 3133{3170.
Almazan, A., Brown, K. C., Carlson, M., and Chapman, D. A. (2004) Why constrain your mutual fund manager? Journal of Financial Economics 73 (2), 289{321.
Amihud, Y., Goyenko, R. (2013). Mutual fund's R2 as predictor of performance. Review of Financial Studies 26 (3), 667{694.
Aragon, G. O. and Martin, S. J. (2012) A unique view of hedge fund derivatives usage: Safeguard or speculation? Journal of Financial Economics 105 (2), 436{456.
Bawa, V. S. and Lindenberg, E. B. (1977) Capital market equilibrium in a mean-lower partial moment framework. Journal of Financial Economics 5 (2), 189{200.
Bank for International Settlements (2014) Derivatives Statistics, http://www.bis.org/statistics/dt1920a.pdf.
Berk, J. B. and Green, R. C. (2004) Mutual fund flows and performance in rational markets. Journal of Political Economy 112, 1269{1295.
Black, F. and Scholes, M. (1973) The Pricing of Options and Corporate Liabilities. Journal of Political Economy 81 (3), 637{654.
Black, F. (1975) Fact and fantasy in the use of options. Financial Analysts Journal 31 (4), 36{72.
Bollen, N. P. B. and Whaley, R. E. (2004) Does net buying pressure affect the shape of implied volatility functions? Journal of Finance 59 (2), 711{753.
Cao, C., Chen, Z., and Griffin, J. M. (2005) Informational content of option volume prior to takeovers. Journal of Business 78 (3), 1073{1109.
Cao, C., Ghysels, E., and Hatheway, F. (2011) Derivatives do affect mutual fund returns: Evidence from the financial crisis of 1998. Journal of Futures Markets 31 (7), 629{658.
Carhart, M. M. (1997) On persistence in mutual fund performance. Journal of Finance 52 (1), 57{82.
Chicago Board Options Exchange (2013) Annual Market Statistics, http://www.cboe.com/data/marketstats-2013.pdf
Chen, Y. (2011) Derivatives use and risk taking: Evidence from the hedge fund industry. Journal of Financial and Quantitative Analysis 46 (4), 1073{1106.
Chen, H., Desai, H., and Krishnamurthy, S. (2013) A First Look at Mutual Funds That Use Short Sales. Journal of Financial and Quantitative Analysis 48 (3), 761-787.
Chevalier, J. and Ellison, G. (1999) Are some mutual fund managers better than others? Cross-Sectional Patterns in Behavior and Performance. Journal of Finance 54 (3), 875{899.
Cici, G. and Palacios, L. F. (2015) On the use of options by mutual funds: Do they know what they are doing? Journal of Banking and Finance 50, 157{168.
26

Cremers, M., Petajisto, A., and Zitzewitz, E. (2013) Should benchmark indices have alpha? Revisiting Performance Evaluation. Critical Finance Review 2 (1), 1{48.
Deli, D. N. and Varma, R.(2002) Contracting in the investment management industry. Journal of Financial Economics 63 (1), 79{98.
Dimson, E. (1979) Risk measurement when shares are subject to infrequent trading. Journal of Financial Economics 7, 197{226.
Evans, R. B. (2010) Mutual fund incubation. Journal of Finance 65 (4), 1581{1611.
Fama, E. F. and French, K. R. (1993) Common risk factors in the returns on stocks and bonds. Journal of Financial Economics 33 (1), 3{56.
Fama, E. F. and French, K. R. (2010) Luck versus skill in the cross-section of mutual fund returns. Journal of Finance 65 (5), 1915{1947.
Ferreira, M. A., Keswani, A., Miguel, A. F., and Ramos, S. B. (2012) The determinants of mutual fund performance: A cross-country study. Review of Finance 17 (2), 483{525.
Ferson, W. E. and Schadt, R. W. (1996) Measuring fund strategy and performance in changing economic conditions. Journal of Finance 51 (2), 425{461.
Goetzmann, W., Ingersoll, J., Spiegel, M., and Welch, I. (2007) Portfolio performance manipulation and manipulation-proof performance measures. Review of Financial Studies 20 (5), 1503{1546.
Guasoni, P., Huberman, G., Wang, Z. (2011): Performance maximization of actively managed funds. Journal of Financial Economics 101 (3), 574-595.
Jagannathan, Ravi, and Robert A. Korajczyk (1986) Assessing the Market Timing Performance of Managed Portfolios. Journal of Business 59 (2), 217{235.
Jensen, M. C. (1968) The Performance of Mutual Funds in the Period 1945-1964. Journal of Finance 23 (2), S. 389-416.
Leland, H. E. (1999) Beyond mean-variance: Performance measurement in a nonsymmetrical world. Financial Analysts Journal 55 (1), 27{36.
Lhabitant, F. S. (2000) Derivatives in portfolio management: Why beating the market is easy. Derivatives Quarterly 7 (2), 39{45.
Lynch-Koski, J. and Pontiff, J. (1999) How are derivatives used? Evidence from the mutual fund industry. Journal of Finance 54 (2), 791{816.
Merton, R. C. (1995) Financial innovation and the management and regulation of financial institutions. Journal of Banking & Finance 19 (3-4), 461{481.
Merton, R. C., Scholes, M. S., and Gladstein, M. L. (1978) The returns and risk of alternative call option portfolio investment strategies. Journal of Business 51 (2), 183{242.
Merton, R. C., Scholes M. S., and Gladstein, M. L. (1982) The returns and risks of alternative put-option portfolio investment strategies. Journal of Business 55 (1), 1{55.
Morey, M. R. and O'Neal, E. S. (2006) Window dressing in bond mutual funds. Journal of Financial Research 29 (3), 325-{347.
Musto, D. K. (1997) Portfolio disclosures and year-end price shifts. Journal of Finance 52 (4), 1563{1588.
Musto, D. K. (1999) Investment decisions depend on portfolio disclosures. Journal of Finance 54 (3), 935{952.
27

Pan, J. and Poteshman, A. M. (2006) The information in option volume for future stock prices. Review of Financial Studies 19 (3), 871{908.
Paµstor, L. and Stambaugh, R. F. (2002) Investing in equity mutual funds. Journal of Financial Economics 63 (3), 351-380.
Paµstor, L. and Stambaugh, R. F. (2003) Liquidity risk and expected stock returns. Journal of Political Economy 111 (3), 642-685.
Paµstor, L., Stambaugh, R. F., and Taylor, L. A. (2014a) Scale and skill in active management. Journal of Financial Economics, forthcoming.
Pastor, L., Stambaugh, R. F., and Taylor, L. A. (2014b) Do funds make more when they trade more? Working paper. University of Chicago and University of Pennsylvania.
Puetz, A. and Ruenzi, S. (2011) Overconfidence among mutual fund managers. Journal of Business Finance and Accounting 38, 674{712.
Rohleder, M., Scholz, H., and Wilkens, M. (2011) Survivorship bias and mutual fund performance: Relevance, significanc, and methodical differences. Review of Finance 15 (2), 441{474.
Rudd, A. and Clasing, H. K. (1988) Modern portfolio theory. The principles of investment management. Orinda, California: Andrew Rudd.
Scholz, H. and Wilkens, M. (2005) A jigsaw puzzle of basic risk-adjusted performance measures. Journal of Performance Measurement 57, 57{64.
Simutin, M. (2014) Cash holdings and mutual fund performance. Review of Finance 18 (4), 1425{1464.
Treynor, J. L. and Mazuy, K. K. (1966) Can mutual funds outguess the market? Harvard Business Review 44 (4), 131{136.
Whaley, R. E. (2002) Return and risk of CBOE Buy Write monthly index. Journal of Derivatives 10 (2), 35{42.
White, H. (1980) A heteroskedasticity-consistent covariance matrix estimator and a direct test for heteroskedasticity. Econometrica 48 (4), 817{838.
Winkler, W. E. (1990) String comparator metrics and enhanced decision rules in the fellegi-sunter model of record linkage, proceedings of the section on survey research, 354{359.
28

Table I: Option permission and usage This table shows descriptive statistics on the permission and usage of options by mutual funds. The sample consists of actively managed U.S. domestic equity funds over the period 1998-2013 with N-SAR filings and entries in CRSP. In Panel A permitted reports the percentage of all funds that are allowed to use options at least once during the sample period. The second column indicates the fraction of funds that actually use an option at least once. The last two columns report the average time (percentage of time) a user fund employs options in its portfolio. Panel B contains descriptive statistics from our pooled panel dataset. Permitted (used) indicates the percentage of all observations when funds (are permitted to) use options. The last two columns contain the absolute number of fund months when funds (are permitted to) use options, respectively.
Panel A. Cross-sectional analysis
Permitted Used # Months used % Time used
All options 0.9406 0.2376 36.0 0.3959
Equity options 0.9321 0.1960 31.0 0.3316
Debt options 0.8218 0.0136 1.0 0.0109
Stock index options 0.9130 0.0641 6.7 0.0870
Futures options 0.8587 0.0206 1.8 0.0200
Stock index futures options 0.8599 0.0303 2.6 0.0313 Panel B. Pooled panel analysis
Permitted Used # Months permitted # Months used
All options 0.8882 0.0938 208,441 22,012
Equity options 0.8747 0.0807 205,275 18,944
Debt options 0.7091 0.0025 166,421 583
Stock index options 0.8435 0.0175 197,944 4,104
Futures options 0.7839 0.0048 183,966 1,117
Stock index futures options 0.7900 0.0067 185,391 1,565
29

Table II: Summary statistics
This table reports descriptive statistics for 612 user and 1,964 nonuser funds. The sample consists of actively managed U.S. domestic equity funds over the period 1998-2013 with N-SAR filings and entries in CRSP. User funds use an option at least once and nonusers completely avoid investing in options. ***, **, * indicate significantly different means (medians) from two-sided t-tests in means (Wilcoxon rank-sum tests for differences in medians) at the 1%, 5%, and 10% level, respectively.
Mean
Median
User Nonuser
User { Nonuser
User Nonuser User {
Nonuser
TNA ($mil) 1,172 866 306 **
145 301 -156 ***
Age (years) 12.21 9.73 2.48 ***
6.87 8.77 -1.90 ***
Turnover ratio (% TNA, p.a.) 1.3680 0.8886 0.4794 ***
0.8389 0.6566 0.1823 ***
Expense ratio (% TNA, p.a.) 0.0139 0.0117 0.0022 ***
0.0133 0.0117 0.0016 ***
Load dummy 0.7745 0.6349 0.1396 *** 1.0000 1.0000 0.0000
Manager tenure (years) 5.72 5.81 -0.09 4.56 4.53 0.03
Cash (% TNA) 0.0588 0.0394 0.0194 *** 0.0332 0.0252 0.0080 ***
Net flow (% TNA) 0.0143 0.0188 -0.0045 * 0.0036 0.0060 -0.0024 **
Excess gross return 0.0048 0.0052 -0.0006 0.0052 0.0058 -0.0006 **
Volatility 0.0528 0.0523 0.0005 0.0509 0.0502 -0.0007
Skewness -0.4464 -0.4817 0.0357 * -0.4682 -0.4940 0.0258 *
Kurtosis 4.2507 4.1682 0.0825
4.0316 4.0103 0.0213
Carhart 4-factor alpha 0.0006 0.0001 0.0005 ***
0.0006 0.0001 0.0005 ***
5-factor IOS alpha 0.0005 0.0001 0.0004 ***
0.0006 0.0001 0.0005 ***
Leland alpha 0.0005 0.0001 0.0004 ***
0.0006 0.0001 0.0005 ***
Bawa/Lindenberg alpha 0.0005 0.0000 0.0005 *** 0.0005 0.0001 0.0004 ***
Carhart 4-factor market beta 0.9584 0.9907 -0.0323 *** 0.9937 0.9967 -0.0030
5-factor IOS market beta 0.9316 0.9763 -0.0447 ***
0.9698 0.9771 -0.0073
Leland market beta 0.9593 0.9915 -0.0322 ***
0.9936 0.9978 -0.0042
Bawa/Lindenberg market beta 0.9942 1.0216 -0.0274 **
1.0096 1.0208 -0.0112
30
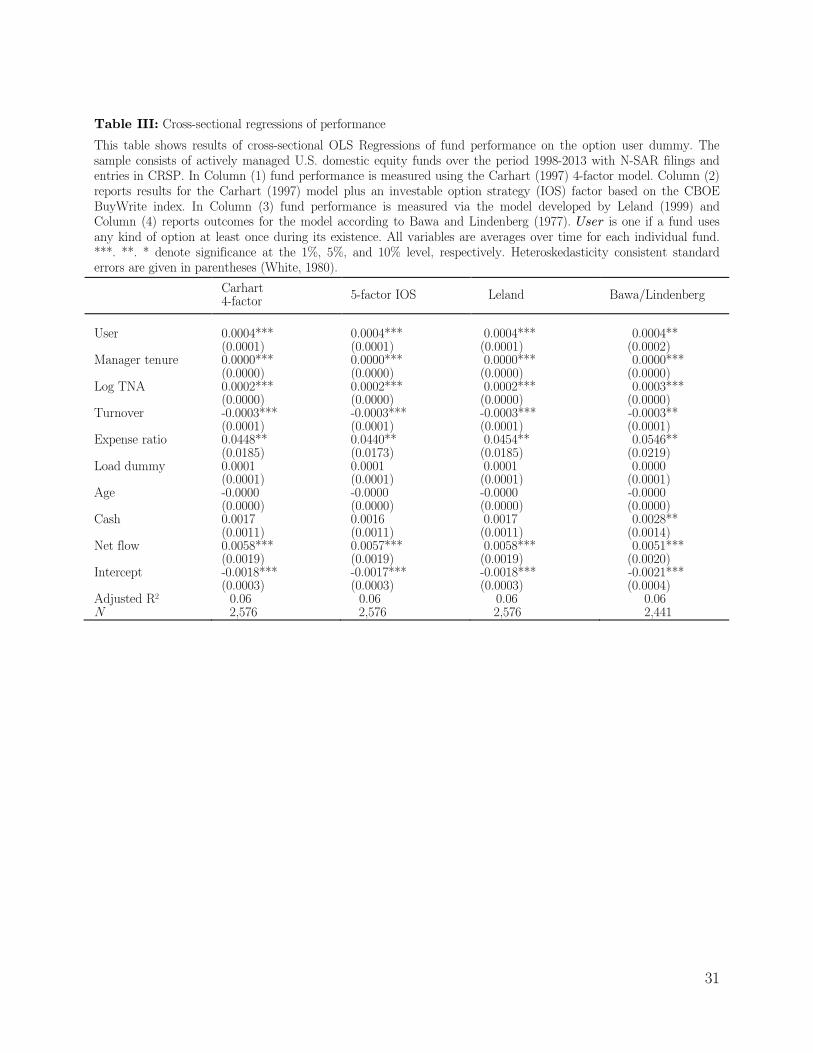
Table III: Cross-sectional regressions of performance
This table shows results of cross-sectional OLS Regressions of fund performance on the option user dummy. The sample consists of actively managed U.S. domestic equity funds over the period 1998-2013 with N-SAR filings and entries in CRSP. In Column (1) fund performance is measured using the Carhart (1997) 4-factor model. Column (2) reports results for the Carhart (1997) model plus an investable option strategy (IOS) factor based on the CBOE BuyWrite index. In Column (3) fund performance is measured via the model developed by Leland (1999) and Column (4) reports outcomes for the model according to Bawa and Lindenberg (1977). User is one if a fund uses any kind of option at least once during its existence. All variables are averages over time for each individual fund. ***. **. * denote significance at the 1%, 5%, and 10% level, respectively. Heteroskedasticity consistent standard errors are given in parentheses (White, 1980).
Carhart 4-factor 5-factor IOS Leland Bawa/Lindenberg
User 0.0004*** 0.0004*** 0.0004*** 0.0004** (0.0001) (0.0001) (0.0001) (0.0002) Manager tenure 0.0000*** 0.0000*** 0.0000*** 0.0000*** (0.0000) (0.0000) (0.0000) (0.0000) Log TNA 0.0002*** 0.0002*** 0.0002*** 0.0003*** (0.0000) (0.0000) (0.0000) (0.0000) Turnover -0.0003*** -0.0003*** -0.0003*** -0.0003** (0.0001) (0.0001) (0.0001) (0.0001) Expense ratio 0.0448** 0.0440** 0.0454** 0.0546** (0.0185) (0.0173) (0.0185) (0.0219) Load dummy 0.0001 0.0001 0.0001 0.0000 (0.0001) (0.0001) (0.0001) (0.0001) Age -0.0000 -0.0000 -0.0000 -0.0000 (0.0000) (0.0000) (0.0000) (0.0000) Cash 0.0017 0.0016 0.0017 0.0028** (0.0011) (0.0011) (0.0011) (0.0014) Net flow 0.0058*** 0.0057*** 0.0058*** 0.0051*** (0.0019) (0.0019) (0.0019) (0.0020) Intercept -0.0018*** -0.0017*** -0.0018*** -0.0021*** (0.0003) (0.0003) (0.0003) (0.0004) Adjusted R2 0.06 0.06 0.06 0.06 N 2,576 2,576 2,576 2,441
31

Table IV: Cross-sectional regressions of risk
This table shows results of cross-sectional OLS Regressions of fund systematic market risk on the option user dummy. The sample consists of actively managed U.S. domestic equity funds over the period 1998-2013 with N-SAR filings and entries in CRSP. In column (1), systematic risk is measured using the Carhart (1997) 4-factor model. Column (2) reports results for the Carhart (1997) model plus an investable option strategy (IOS) factor based on the CBOE BuyWrite index. In Column (3), market risk is measured via the model developed by Leland (1999) and Column (4) reports outcomes for the model according to Bawa and Lindenberg (1977). User is one if a fund uses any kind of option at least once during its existence. All variables are averages over time for each individual fund. ***. **. * denote significance at the 1%, 5%, and 10% level, respectively. Heteroskedasticity consistent standard errors are given in parentheses (White, 1980).
Carhart 4-factor 5-factor IOS Leland Bawa/Lindenberg
User -0.0268** -0.0469*** -0.0262** -0.0183 (0.0123) (0.0134) (0.0123) (0.0146) Manager tenure -0.0042*** -0.0046*** -0.0042*** -0.0045*** (0.0011) (0.0012) (0.0011) (0.0013) Log TNA 0.0049 0.0049 0.0049 0.0026 (0.0033) (0.0035) (0.0033) (0.0041) Turnover ratio -0.0020 0.0079 -0.0021 -0.0027 (0.0090) (0.0106) (0.0089) (0.0101) Expense ratio 9.0735*** 10.4646*** 9.0036*** 9.3126*** (1.4119) (1.5887) (1.4066) (1.8713) Load dummy -0.0313*** -0.0391*** -0.0316*** -0.0233 (0.0110) (0.0118) (0.0110) (0.0142) Age 0.0010** 0.0009* 0.0010** 0.0001 (0.0005) (0.0005) (0.0004) (0.0006) Cash -1.3780*** -1.3261*** -1.3801*** -1.4319*** (0.2560) (0.2547) (0.2549) (0.2778) Net flow -0.1883 -0.2305* -0.1849 -0.1054 (0.1252) (0.1394) (0.1241) (0.1233) Intercept 0.9546*** 0.9223*** 0.9568*** 1.0004*** (0.0236) (0.0249) (0.0235) (0.0301) Adjusted R2 0.25 0.21 0.25 0.19 N 2,576 2,576 2,576 2,441
32

Table V: Panel regressions – Using vs. active non using
This table reports results of pooled panel Regressions of fund performance and systematic risk on different specifications of option user dummy variables. The sample consists of actively managed U.S. domestic equity funds over the period 1998-2013 with N-SAR filings and entries in CRSP. The dependent variables, fund performance and market risk, are measured using the Carhart (1997) 4-factor model in column (1). Column (2) reports results for the Carhart (1997) model plus an investable option strategy (IOS) factor based on the CBOE BuyWrite index. In Column (3), fund performance is measured via the model developed by Leland (1999) and Column (4) reports outcomes for the model according to Bawa and Lindenberg (1977). All performance and risk measures are calculated for each fund and month individually using daily return data. Panel A displays the results for performance and Panel B for risk, respectively. The dependent variables are regressed on the dummy pair Using and Active non using. Using is one if a user fund invests in options in the respective month and zero otherwise. Active non
using is unity if a user fund does not use options in the respective month and in all other cases zero. All variables are monthly. ***, **, * denote significance at the 1%, 5%, and 10% level, respectively. The standard errors are clustered by fund and given in parentheses.
Panel A. Performance Panel B. Risk
Carhart 4-factor
5-factor IOS Leland Bawa & Lindenberg
Carhart 4-factor
5-factor IOS Leland Bawa & Lindenberg
Using 0.0006*** 0.0005** 0.0007*** 0.0005** -0.0920*** -0.0917*** -0.0859*** -0.0791*** (0.0002) (0.0002) (0.0002) (0.0002) (0.0196) (0.0198) (0.0208) (0.0212) Active non using 0.0004*** 0.0005*** 0.0003*** 0.0002 -0.0017 0.0023 -0.0018 0.0003 (0.0001) (0.0001) (0.0001) (0.0002) (0.0071) (0.0078) (0.0079) (0.0078) Manager Tenure -0.0000 -0.0000 -0.0000 -0.0000* -0.0025*** -0.0028*** -0.0032*** -0.0031*** (0.0000) (0.0000) (0.0000) (0.0000) (0.0008) (0.0008) (0.0008) (0.0008) Log TNA -0.0001 -0.0000 -0.0000 -0.0000 0.0022 0.0056*** 0.0038* 0.0033 (0.0000) (0.0000) (0.0001) (0.0001) (0.0021) (0.0021) (0.0022) (0.0022) Turnover -0.0003*** -0.0002*** -0.0002*** -0.0002*** -0.0054 -0.0022 -0.0024 -0.0012 (0.0001) (0.0001) (0.0001) (0.0001) (0.0046) (0.0051) (0.0052) (0.0055) Expense Ratio 0.0197 0.0366** 0.0302* 0.0022 -0.4463 0.7517 1.3343 2.1686** (0.0170) (0.0164) (0.0166) (0.0197) (0.8412) (0.8833) (0.8649) (0.8624) Load dummy -0.0001 -0.0001 -0.0002 -0.0001 -0.0143** -0.0187** -0.0211*** -0.0224*** (0.0001) (0.0001) (0.0001) (0.0002) (0.0070) (0.0074) (0.0078) (0.0077) Age -0.0000 -0.0000* -0.0000** -0.0000 0.0021*** 0.0019*** 0.0022*** 0.0020*** (0.0000) (0.0000) (0.0000) (0.0000) (0.0003) (0.0003) (0.0003) (0.0003) Cash 0.0008 0.0008 0.0012 0.0008 -0.3675** -0.3619** -0.3846** -0.3741** (0.0007) (0.0008) (0.0007) (0.0008) (0.1525) (0.1503) (0.1588) (0.1545) Net flow 0.0001 0.0002 0.0003 0.0002 -0.0066* -0.0071* -0.0067* -0.0066* (0.0003) (0.0002) (0.0003) (0.0003) (0.0036) (0.0043) (0.0035) (0.0034) Intercept 0.0005 -0.0004 -0.0004 -0.0009* 1.0169*** 0.9355*** 0.9905*** 0.9994*** (0.0004) (0.0004) (0.0005) (0.0006) (0.0362) (0.0443) (0.0323) (0.0289) Style fixed effects Yes Yes Yes Yes Yes Yes Yes Yes Time fixed effects Yes Yes Yes Yes Yes Yes Yes Yes Adjusted R2 0.03 0.05 0.04 0.04 0.03 0.05 0.03 0.04 N 231,641 231,641 231,634 231,641 231,641 231,641 231,634 231,641
33

Table VI: Panel regressions – Long options vs. short options
This table reports results of pooled panel Regressions of fund performance and systematic risk on different specifications of option user dummy variables. The sample consists of actively managed U.S. domestic equity funds over the period 1998-2013 with N-SAR filings and entries in CRSP. The dependent variables, fund performance and market risk, are measured using the Carhart (1997) 4-factor model in column (1). Column (2) reports results for the Carhart (1997) model plus an investable option strategy (IOS) factor based on the CBOE BuyWrite index. In Column (3), fund performance is measured via the model developed by Leland (1999) and Column (4) reports outcomes for the model according to Bawa and Lindenberg (1977). All performance and risk measures are calculated for each fund and month individually using daily return data. Panel A displays the results for performance and Panel B for risk, respectively. The dependent variables are regressed on the dummy pair Long and Short. Long is one if a user fund is net long options in the respective month and zero otherwise. Short is unity if a user fund is predominantly writing options in the respective month and in all other cases zero. All variables are monthly. ***, **, * denote significance at the 1%, 5%, and 10% level, respectively. The standard errors are clustered by fund and given in parentheses.
Panel A. Performance Panel B. Risk
Carhart 4-factor
5-factor IOS Leland Bawa & Lindenberg
Carhart 4-factor
5-factor IOS Leland Bawa & Lindenberg
Long 0.0004 0.0005 0.0011** 0.0005 -0.2173*** -0.1935*** -0.2044*** -0.2003*** (0.0005) (0.0005) (0.0005) (0.0006) (0.0707) (0.0703) (0.0743) (0.0766) Short 0.0014*** 0.0013*** 0.0010*** 0.0009*** -0.1045*** -0.1193*** -0.1021*** -0.0969*** (0.0003) (0.0003) (0.0002) (0.0003) (0.0190) (0.0199) (0.0193) (0.0200) Manager Tenure -0.0000 -0.0000* -0.0000 -0.0000** -0.0024*** -0.0028*** -0.0031*** -0.0030*** (0.0000) (0.0000) (0.0000) (0.0000) (0.0007) (0.0007) (0.0008) (0.0008) Log TNA -0.0000 0.0000 0.0000 -0.0000 0.0019 0.0054*** 0.0035 0.0031 (0.0000) (0.0000) (0.0001) (0.0001) (0.0020) (0.0021) (0.0022) (0.0022) Turnover -0.0003*** -0.0002*** -0.0002*** -0.0002*** -0.0053 -0.0022 -0.0023 -0.0010 (0.0001) (0.0001) (0.0001) (0.0001) (0.0045) (0.0050) (0.0052) (0.0055) Expense Ratio 0.0235 0.0401** 0.0344** 0.0050 -0.4850 0.7475 1.3151 2.2056** (0.0169) (0.0162) (0.0166) (0.0196) (0.8629) (0.9004) (0.8818) (0.8786) Load dummy -0.0001 -0.0001 -0.0002 -0.0001 -0.0143** -0.0185** -0.0210*** -0.0222*** (0.0001) (0.0001) (0.0001) (0.0002) (0.0069) (0.0074) (0.0077) (0.0077) Age -0.0000 -0.0000 -0.0000** -0.0000 0.0021*** 0.0019*** 0.0021*** 0.0019*** (0.0000) (0.0000) (0.0000) (0.0000) (0.0003) (0.0003) (0.0003) (0.0003) Cash 0.0009 0.0008 0.0012 0.0008 -0.3669** -0.3612** -0.3839** -0.3731** (0.0007) (0.0008) (0.0007) (0.0008) (0.1519) (0.1497) (0.1582) (0.1538) Net flow 0.0001 0.0002 0.0003 0.0002 -0.0064* -0.0070 -0.0065* -0.0065* (0.0003) (0.0002) (0.0003) (0.0003) (0.0035) (0.0042) (0.0034) (0.0033) Intercept 0.0003 -0.0005 -0.0005 -0.0010* 1.0198*** 0.9375*** 0.9930*** 1.0007*** (0.0004) (0.0004) (0.0004) (0.0005) (0.0356) (0.0438) (0.0316) (0.0281) Style fixed effects Yes Yes Yes Yes Yes Yes Yes Yes Time fixed effects Yes Yes Yes Yes Yes Yes Yes Yes Adjusted R2 0.03 0.05 0.04 0.04 0.03 0.05 0.03 0.04 N 231,641 231,641 231,634 231,641 231,641 231,641 231,634 231,641
34