the benefits of solar home systems
TRANSCRIPT

Policy Research Working Paper 6724
The Benefits of Solar Home Systems
An Analysis from Bangladesh
Hussain A. SamadShahidur R. Khandker
M. AsaduzzamanMohammad Yunus
The World BankDevelopment Research GroupAgriculture and Rural Development TeamDecember 2013
WPS6724P
ublic
Dis
clos
ure
Aut
horiz
edP
ublic
Dis
clos
ure
Aut
horiz
edP
ublic
Dis
clos
ure
Aut
horiz
edP
ublic
Dis
clos
ure
Aut
horiz
ed
Produced by the Research Support Team
Abstract
The Policy Research Working Paper Series disseminates the findings of work in progress to encourage the exchange of ideas about development issues. An objective of the series is to get the findings out quickly, even if the presentations are less than fully polished. The papers carry the names of the authors and should be cited accordingly. The findings, interpretations, and conclusions expressed in this paper are entirely those of the authors. They do not necessarily represent the views of the International Bank for Reconstruction and Development/World Bank and its affiliated organizations, or those of the Executive Directors of the World Bank or the governments they represent.
Policy Research Working Paper 6724
The Government of Bangladesh, with help from the World Bank and other donors, has provided aid to a local agency called Infrastructure Development Company Limited and its partner organizations to devise a credit scheme for marketing solar home system units and making these an affordable alternative to grid electricity for poor people in remote areas. This paper uses household survey data to examine the financing scheme behind the dissemination of these solar home systems, in particular the role of the subsidy; the factors that determine the adoption of the systems in rural Bangladesh; and the welfare impacts of such adoption. The paper finds that while the subsidy has been declining over time, the demand for solar home systems has seen phenomenal growth, mostly because of
This paper is a product of the Agriculture and Rural Development Team, Development Research Group. It is part of a larger effort by the World Bank to provide open access to its research and make a contribution to development policy discussions around the world. Policy Research Working Papers are also posted on the Web at http://econ.worldbank.org. The authors may be contacted at [email protected].
technological developments that have made the systems increasingly more affordable. Households with better physical and educational endowments are more likely to adopt solar home systems than poor households. The price of the system matters in household decision making—a 10 percent decline in the price of the system increases the overall demand for a solar panel by 2 percent. As for the benefits, adoption of a solar home system improves children’s evening study time, lowers kerosene consumption, and provides health benefits for household members, in particular for women. It is also found to increase women’s decision-making ability in certain household affairs. Finally, it is found to increase household consumption expenditure, although at a small scale.
The Benefits of Solar Home Systems:
An Analysis from Bangladesh
Hussain A. Samada, Shahidur R. Khandkerb*,
M. Asaduzzamanc, Mohammad Yunusd
JEL classification: Q41, Q42, I31
Keywords: Electrification impacts, Solar home system, Rural electrification, Bangladesh
Sector Board: Poverty
aConsultant, DECAR, World Bank, bLead Economist, DECAR, World Bank, cFormer Research Director, Bangladesh Institute of Development Studies, dSenior Research Fellow, Bangladesh Institute of Development Studies. This study was funded by World Bank Global Partnership of Output-Based Aid (GPOBA), and supported by South Asia Region (SASDE). The authors acknowledge with thanks Zubair Sadeque of SASDE, Luisa Mimmi and Wajiha Ahmed of GPOBA for their support in carrying out this study, and Will Martin (DECAR) for providing valuable comments to improve the paper. Finally, the authors thank Kelley Smith for editing the paper. The views expressed in this paper are entirely those of the authors and do not reflect those of the World Bank, Bangladesh Institute of Development Studies or their affiliated organizations.

2
The Benefits of Solar Home Systems: An Analysis from Bangladesh
1. Introduction
Provision of electricity is a recognized development agenda item and one of the key pillars of the Sustainable
Energy for All (SE4ALL) Initiative of the United Nations. According to a World Bank report, some 1.2
billion people do not have access to electricity, which limits their opportunities to improve their welfare. Most
of these people are residents of 20 developing countries in Asia and Sub-Saharan Africa, and about 80
percent live in rural areas in those countries (World Bank 2013). Electricity is in fact an integral component
of socio-economic development, with benefits ranging from enhanced income, productivity and employment
due to access to electronic media and improved household lighting (Cabraal, Barnes, and Agarwal, 2005;
Dinkelman, 2011; Khandker et al., 2012). Lacking access to electricity is therefore considered a major
impediment to development.
But efforts to provide modern energy such as electricity for lighting, heating, cooking, and other
production purposes face enormous challenges. Poor households in most countries typically have limited
access as well as limited ability to pay for quality energy services. Better access to modern energy means being
able to afford and use electricity. Despite national efforts with donor support, expansion of the national
electricity grids in many poor countries such as Bangladesh is very slow, mostly because of limited electric
generation and supply resulting from the lack of price and institutional reforms in the power sector (Barnes,
2007; Zerriffi, 2011).
With increasing technology development via alternative sources of electricity generation such as solar
power, off-grid electrification becomes a viable alternative to the conventional approaches to electrification
(Jacobson, 2007; Wamukonya, 2007; Zerriffi, 2011; Brass et al., 2012). A decentralized energy generation
mechanism based on solar photovoltaics, for example, has gained currency in recent years for promoting
solar power as part of achieving universal electrification in the developing world. However, the success of

3
off-grid electrification models has also been limited as it depends critically on consumer demand. Lack of
income is a serious bottleneck toward adopting solar home systems (SHS). Poor households must use their
limited income to pay for electricity in addition to other essential livelihood items, and thus, the spread of
SHS has proved challenging (Nieuwenhout et al., 2001; Friebe, von Flotow, and Täube, 2013).
How can the spread of these new technologies such as solar panels be promoted? What could
promote SHS adoption, given limited household income and knowledge about solar panel technology?
Although the importance of solar home systems has been recognized for decades (Nieuwenhout et al., 2001),
there is not much research addressing how and when such technology can be promoted. There are a few
studies found in the literature that explored the key determinants of early adoption of SHS when such
technologies are made available (Lay, Ondraczek, and Stoever, 2012; Rebane and Barham, 2011; Komatsu et
al., 2011). Household income matters a lot, as do other factors such as cost and technology. Because income
is limited, any price support toward reducing the cost of SHS purchase and maintenance appears to be an
option for accelerating SHS adoption in the poor countries.
Bangladesh’s example of SHS expansion to more than 1.9 million households in rural areas has
drawn the attention of both donors and governments of other countries. The phenomenal coverage of such
expansion within a short period of time has been possible in part because of the subsidy provided by donors
to facilitate SHS adoption in remote and off-grid areas. Provision of affordable SHS with maintenance
services has become a national program of the government supported by the World Bank and other donors
by establishing an autonomous and independent body known as the Infrastructure Development Company
Limited (IDCOL). Despite national efforts for promoting electrification, Bangladesh’s electrification rate has
been only 55 percent for the nation as a whole and only 42.5 percent in rural areas. One possible solution,
perhaps a stop-gap one, is thus to supply electricity through solar photovoltaic units under a specialized
financing scheme introduced through IDCOL.
Bangladesh’s SHS expansion program is run by IDCOL and its collaborating partner organizations
(POs). But although 1.9 million SHS panels have been installed, this figure represents no more than 5 percent
of the off-grid households. That means there is still enough scope for SHS expansion, particularly given that

4
the supply of grid electricity at present faces enormous constraints including the limited supply and high cost
of primary fuel, particularly oil, and lack of funds. How to provide electricity to people, even in a limited
manner, while demand is increasing remains a challenge to policy makers. Much information is needed; in
particular one must know the reach and effectiveness of the SHS technology, particularly in terms of serving
the needs of the people by improving the quality of life as well as meeting electricity needs for productive
purposes, wherever applicable. Additionally, it is necessary to know whether the observed impacts of SHS on
household welfare recommend its expansion to reach more people in the off-grid areas.
The installation of an SHS on the rooftop of a house can have immediate impacts: it enables the
household to have light after nightfall, makes study easier in the evenings, allows people to watch TVs and be
informed of many useful and socially desirable things that are happening around them and perhaps be
inspired to take part in such activities. Furthermore, it can lower indoor pollution levels as the household
reduces its use of kerosene, and households may even earn some money by renting mobile phone charging
services. Solar electricity also has possibly the positive externality of substituting for fossil fuels in generation
of electricity and thus contributing to lowering of emission of carbon dioxide and harmful effects of climate
change. The objectives of the present study are as follows: (a) Identify which rural households in off-grid
areas adopt solar home systems and why; (b) Assess the direct and indirect effects of SHS adoption on the
households and its members, in particular, children and women; and (c) Investigate the cost-effectiveness of
the system for the adopters.
The paper is organized as follows. Section 2 presents a description of the SHS market and its size as
well as the policies of IDCOL in promoting SHS adoption and expansion. Section 3 discusses the data and
provides a descriptive analysis of various indicators relevant to the energy consumption from SHS units,
appliances used, energy consumption patterns by SHS capacity, and the distribution of household wealth,
which is a major factor influencing the adoption of SHS in rural areas. Section 4 presents an econometric
framework for estimating the demand for SHS and its effect on household and intra-household welfare.
Section 5 discuses the determinants of SHS adoption and identifies the role of price, income and non-price
factors that have spurred the phenomenal growth in SHS expansion in rural Bangladesh. Section 6 reports

5
the estimated effects of SHS adoption on household and intra-household outcomes using propensity score
weighted regression given the cross-sectional nature of post-intervention impact evaluation. Section 7
examines whether SHS adoption is cost-effective and Section 8 concludes the paper.
2. The Bangladesh SHS Market: Growth, Price and Subsidy Policy
Solar Home Systems have been introduced as the solution to the demand for electricity in off-grid areas.
However, this will probably be an interim solution given the existing technology and affordability, as an SHS
unit cannot satisfy the whole range of a household’s electricity demands. Still, SHS is a vastly superior
alternative to using traditional fossil fuels to meet energy demand, not to mention that people on the grid may
also want it as a back-up in case of power failures. Apart from the social considerations related to renewable
energy and carbon emission issues, people demand more assured and cost-effective energy. The question
therefore is whether SHS is the best available mechanism to provide ‘light’ to rural households who are not
likely to get grid electricity in the near future. Also, it is important to examine whether the approach (of
promoting SHS in remote villages) is cost-effective for households.
IDCOL has been pivotal in promoting SHS in Bangladesh through its partner organizations (POs),
four of which account for most of the SHSs installed so far – Grameen Shakti, Srizony, RSS, and BRAC, with
Grameen Shakti responsible for 58% of the units. POs are not only responsible for selling SHS units, but are
also expected to develop a robust market chain for SHS systems so that it sustains beyond the period of
intervention by IDCOL.
The IDCOL program has been supported by the World Bank, German Development Cooperation
(GIZ), Kreditanstalt für Wiederaufbau (Reconstruction Credit Institute of Germany), EU, ADB, IDB and a
multi-donor trust fund, GPOBA. The Rural Electrification Board (REB) also has its own SHS program but
its numbers are comparatively few. Besides, unlike the IDCOL system, SHSs installed by REB are owned by
REB itself, while the users only pay a fixed monthly fee for using the system.
6
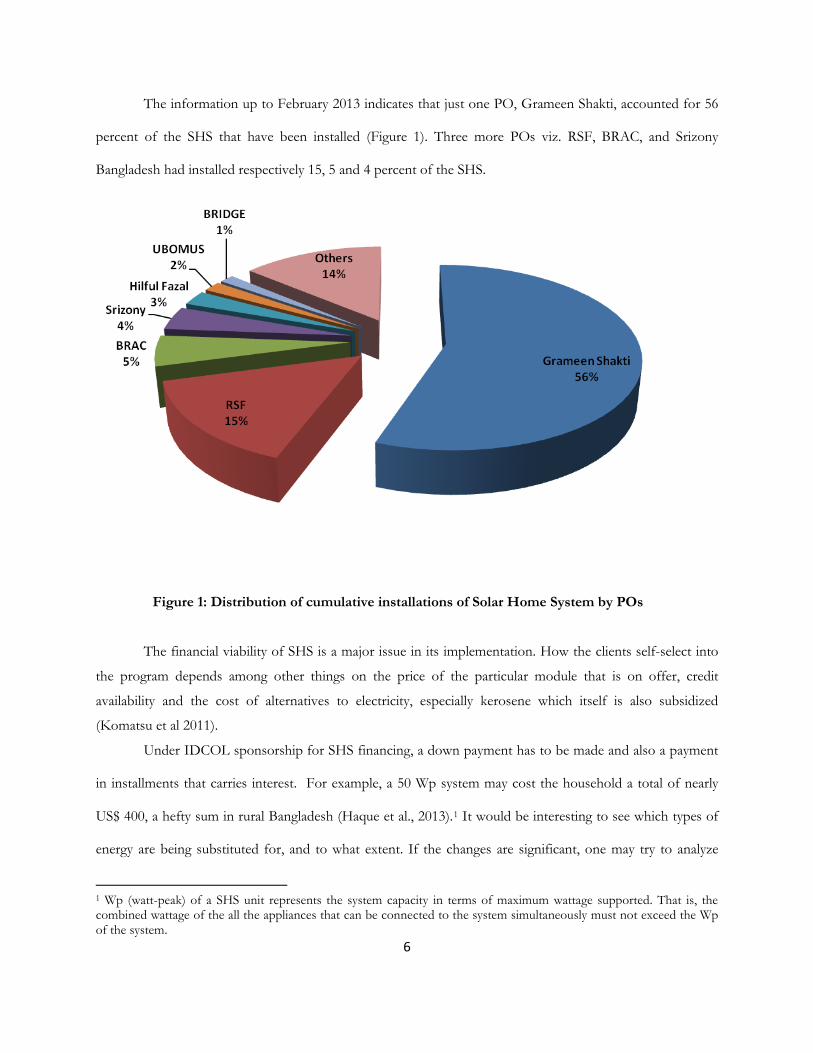
The information up to February 2013 indicates that just one PO, Grameen Shakti, accounted for 56
percent of the SHS that have been installed (Figure 1). Three more POs viz. RSF, BRAC, and Srizony
Bangladesh had installed respectively 15, 5 and 4 percent of the SHS.
Figure 1: Distribution of cumulative installations of Solar Home System by POs
The financial viability of SHS is a major issue in its implementation. How the clients self-select into
the program depends among other things on the price of the particular module that is on offer, credit
availability and the cost of alternatives to electricity, especially kerosene which itself is also subsidized
(Komatsu et al 2011).
Under IDCOL sponsorship for SHS financing, a down payment has to be made and also a payment
in installments that carries interest. For example, a 50 Wp system may cost the household a total of nearly
US$ 400, a hefty sum in rural Bangladesh (Haque et al., 2013).1 It would be interesting to see which types of
energy are being substituted for, and to what extent. If the changes are significant, one may try to analyze
1 Wp (watt-peak) of a SHS unit represents the system capacity in terms of maximum wattage supported. That is, the combined wattage of the all the appliances that can be connected to the system simultaneously must not exceed the Wp of the system.

7
their (unintended) implications. It is necessary at least to find out if expenditures for energy services have
changed for households with SHS, particularly for lighting services and storage electricity of various types that
may be used for running a TV and other services. In extreme cases, various other expenditures may also
change. Thus an attempt may be made to find out the general expenditure patterns for households with SHS
and those without.
The impact on households would depend on what prices they actually pay, which depends on the
behavior of the POs, given that there are several incentives that are on offer to them. The POs are provided
several incentives. These are: (a) A buy-down grant (on average about 10 percent of the original cost of SHS)
provided by the EU is designed to help POs reduce the cost of SHS at the household level and also to
promote SHS in remote areas; (b) Refinancing of their initial capital from IDCOL (80 percent of the credit
extended to customers by the POs) at a flat rate of interest of 6 percent for a period of 6-8 years; and (c) A
grant from the EU for ‘Institutional Development’ which is about 18 percent of the POs’ contribution to the
credit facilities (i.e. 20 percent of the credit provided by POs to customers). Against such direct incentives to
POs, households receive the solar home system on credit for 3 years at a flat rate of 12 percent, thus
providing further incentives to POs to reap the benefits from both the interest spread and the repayment
period. Of course, that depends on specific circumstances, particularly the competition from other POs.
There is also a provision for buy back of batteries and battery replacement when their life is over.
The objectives for such grants are to encourage the POs to pass on the subsidy as much as possible
to the clients so that rural households receive SHS at a cheaper price and that a robust and regulated market
chain is established at the rural level that ensures (a) quality of products, (b) environmental safety, (c)
availability of facilities for repair and maintenance and (d) supply of spares, bulbs, etc. at the local level.
The rate of interest charged to SHS buyers by POs varies between 6 percent and 12 percent and the
duration of loan is 3 years in most cases. At the same time, POs have also established a system through
which buyers can buy SHS at discounted prices if the loan repayment period is reduced and/or buyers

8
purchase the system using cash on delivery and installation. There is, within an apparently regulated marketing
system, thus scope for flexibilities, making effective prices vary by PO and also by the nature of demand from
the client.
Growth of SHS units based on aggregate IDCOL data and household survey data
BIDS with the help of World Bank conducted a household survey in 2012 in both SHS adopted villages and
control villages in order to study the role of IDCOL and its POs in the adoption of SHS and its effect on
household and intra-household (more on the data in Section 3 below). The distribution of sample household
data of 2,000 adopters of solar panels of different capacity over 2003-2012 is presented in Figure 2. The
growth pattern of SHS adoption over the years shows that the household demand in the early years of
marketing solar panels is much lower than that in later years, implying a market expansion only after a certain
number of years of market experience with the solar panels.
Source: BIDS-World Bank survey, 2012
Figure 2: Yearly growth of SHS adoption from survey data

9
Interestingly, the national-level installation figures provided by IDCOL also mirror a distribution
similar to what is observed from the household survey data (Figure 3). The expansion in the market actually
took place after 2008 with exponential growth in the sale of SHS units. This shows that technology adoption
always takes some years of experimentation and customer experience before it is accepted widely. For
example, although IDCOL started to experiment marketing SHS around 2003, the total sales of SHS units
was only 200,000 or so until 2008, after which it increased to 1.4 million in 2011. It is important to see what
triggered this phenomenal growth in SHS adoption over a relatively short period of time.
Source: IDCOL
Figure 3: Yearly installations of SHS in rural Bangladesh (national figures)
SHS price and subsidy over time
It is important to note that the solar panels marketed by IDCOL’s POs were subsidized. Thus, grant and
subsidized loan policies were introduced around 2003. Although the extent of the grant per unit solar panel
has declined over time, the subsidy was nonetheless instrumental in pushing the frontier by shifting market
demand through entry of small NGOs marketing various types of solar panels. With both PO competition
and increased market demand, the price of SHS has declined despite the decline in subsidy. As Figure 4
suggests,

10
Source: BIDS-World Bank survey, 2012
Figure 4: Change in SHS price and subsidy over time
both the price offered to consumers and the subsidy offered to POs per unit of Wp have declined over time.2
For example, in 2004, the offered price to the consumer per unit of Wp was close to Tk. 385 and the grant
subsidy was Tk.95 per unit of Wp. By 2012, the unit price had dropped to Tk.256 and the grant subsidy to
POs to Tk.25 per unit of Wp. This is an interesting scenario, as the prices of solar panels declined despite the
decline in the grant subsidy given to POs. As Figure 4 suggests, the subsidy declined more rapidly than the
price itself. In fact, as Figure 5 shows, the subsidy was about 25 percent of the SHS unit price in 2004 and
dropped to less than 10 percent by 2012. Interestingly, despite the decline in subsidy and price support by
IDCOL and its donors, the demand for SHS continued to increase. This was in part because of a steeper
decline in the prices of solar units, thanks to technological advances in solar panels over time.
2 The price per Wp is calculated by dividing the price of the system as offered to a rural customer by the capacity of the adopted system. The subsidy, on the other hand, has remained the same for all systems adopted in a single year and varied only by the year of adoption. So, subsidy per Wp is calculated by dividing the year-specific subsidy by the capacity of the system adopted by a customer. Finally, since rural households adopted SHS during different years the price and subsidy have been adjusted by the annual CPI (with base year 2000) to make these figures comparable across years.

11
Source: BIDS-World Bank survey, 2012
Figure 5: Change in subsidy as % of SHS price over time
3. SHS Adoption and Its Benefits: Descriptive Analysis
The study designed a large household survey among SHS adopters and non-adopters to examine the benefits
and cost of SHS, as well as a survey of branch offices of the POs and a community survey to investigate the
effectiveness of the technology and its delivery system on the cost-effectiveness of the systems to those who
adopted them. A total of 4,000 households were surveyed in 128 villages evenly split between villages with an
existing SHS supply (treatment) and those without SHS (control). (There were 1,600 SHS households and 400
non-SHS households in treatment villages, and 2,000 non-SHS households in control villages). The sample of
treatment households was selected from a database of nationwide SHS customers maintained by IDCOL.
(Table 1).

12
Table 2 shows the distribution of SHS adopters across seven divisions.3 We see that the total
number of treated households (2,000) sampled represent only 4.5 percent of the total population with Barisal
division having the highest concentration of SHS users (13.4 percent), followed by Sylhet division (8 percent)
and other divisions.
Energy consumption in SHS and non-SHS households
Households, regardless of their SHS adoption, are primarily dependent on kerosene and biomass for their
energy requirements. About 80 percent of the households use fuel wood or non-fuel wood biomass for
cooking and related activities (Table 3). While 62 percent of the SHS households use kerosene, the incidence
is significantly higher, at 99 percent, among the non-SHS households. In contrast, uses of other sources of
energy vary between 53 percent among the SHS households to 64 percent among the non-SHS households.
Although a large share of households uses other sources, energy consumption from these sources is very low.
Insofar as the analysis based on the above percentage may be misleading, the actual energy
consumption (in kgOE/month) was compared between SHS households and those without SHS. The results
presented in Table 4 show that SHS households consume about 64 kgOE/month of energy from fuel wood
vis-à-vis 51 kgOE/month for households without the SHS, and this difference is statistically significant.
Similarly, SHS households consume 62 kgOE/month of energy from non-fuel wood biomass vis-à-vis 65
kgOE/month for households without the SHS. However, these empirical findings on biomass consumption
are not important per se as the ownership of an SHS does not substitute these types of energy consumption.
However, it may be noted that ownership of the SHS replaces consumption of fossil fuels such as kerosene
among the SHS households. For example, SHS households consume less than 1 liter of kerosene per month,
compared to almost 3 liters per month consumed by the non-adopters (Figure 3). This means that SHS
adoption has probably reduced average household consumption of kerosene by 2 liters per month. The
difference in the level of consumption of kerosene is statistically significant. But the overall consumption of
3 The distribution figures in the sample are weighted to represent the national distribution of SHS users in rural Bangladesh.

13
energy does not differ significantly between SHS adopters and non-adopters, and hence, one can surmise that
the use of SHS only changes the composition of energy consumption.
The substitution of kerosene
One of the main uses of the SHS is for lighting. Depending on the capacity of the SHS panels, households
would have 2-5 lighting points. The more lighting points a household has, the lower the use of kerosene for
lighting, which is mainly used in rural areas. While other possible uses of kerosene include cooking, this is a
costly alternative to biomass cooking fuel and hence is rarely seen in rural households. Given that there are
about 1.9 million SHS households in rural Bangladesh, the decrease in kerosene consumption amounts to
over 40 million liters of kerosene saved annually due to SHS adoption.
SHS and appliance use
Even though the POs offer SHS of different Wp levels, most households choose 20, 40, 50, or 65 Wps. The
most popular choice appears to be the 50 Wp size. As expected, there is a positive correlation between the
size of the system and the number of lights that it supports; while only one lightbulb is used in a 20 Wp size,
as many as 5 lightbulbs are used in an 75 to 90 Wp size unit of SHS (Table 5). Charger lights, one of the most
common appliances, are used by 13 percent of all SHS adopters. Thirty-seven percent of the SHS households
use SHS-powered electricity to run a television.
Energy consumption and SHS capacity
As Figure 6 suggests, energy consumption from the SHS panel increases with Wp size. This means
consumption of energy form SHS must have alternative uses besides lighting. For example, with a higher-
capacity SHS unit, households often purchase a TV, a source of entertainment and information for enhancing
the productivity of inputs used in household production. Thus, the time use pattern of household members
may change toward productivity-enhancing activities to boost their income. On the other hand, knowledge
about health and education through TV programs can improve outcomes in these domains as well as give
advantages to household members, especially women in SHS households, compared with those in non-SHS

14
households. These changes are expected to contribute to improved welfare for all members of rural
households in Bangladesh.
Source: BIDS-World Bank survey, 2012
Figure 6: HH energy consumption from SHS by SHS capacity
Energy consumption by wealth
The average price of SHS per Wp is approximately Tk.400 and the minimum size to purchase is 20 Wp,
which costs Tk.8,000. This amount of money to be spent in purchasing this solar panel of minimum size is a
lot of money for many rural households. Hence, those who can afford to purchase SHS panels are relatively
wealthy households. In rural areas, landholding is a proxy for wealth. As Figure 7 suggests, energy
consumption from SHS is higher with greater landholding, implying energy consumption is an increasing
function of landholding. This implies that, as electricity/energy produced per unit of SHS is given, both
household adoption of solar panels and panel capacity are positively related to landholding.

15
Source: BIDS-World Bank survey, 2012
Figure 7: HH energy consumption from SHS by landholding
4. Estimating SHS Demand and Its Effect on Welfare: An Econometric Framework
Several modules of the solar home system are on offer. A household or any other entity purchasing the solar
home system from a PO may choose from models ranging from 10 Wp to 130 Wp. The most popular one is
the 50 Wp model. While there is a wide range of uses of SHS, in a typical case, solar lights usually replace
kerosene lamps or lanterns of various types. The most primitive of these lighting devices is a kupi (a one-wick
lamp) used mostly in poorer households and also used by women in kitchens. Not only does the kupi emit
heavy smoke inside the house as well as cause de-coloration of ceiling, walls, and other materials exposed to
its surroundings, but it provides the dimmest of light. In general, the replacement of kerosene lamps reduces
indoor air pollution and thus generates health benefits for households, in particular for women and children,
who spend most of their time indoors. Therefore, the replacement of kupi compared to other kerosene lamps
like lanterns may be especially advantageous for these households.
There are several packages of SHS on offer and the major difference among them is in terms of
number of connection points. The more points there are, the more are the substitution scopes away from
16
kerosene. On the other hand, the higher-output packages on offer are costlier and may be demanded mainly
by comparatively well-off households. This hypothetically creates a differentiation in impact across
households ranked by economic condition (wealth, assets, income, etc.). One needs to understand if this is
the case; and if there are such differentials in impact, how pronounced they are. In any case, such
differentiation also means that better-off households may be less exposed to indoor pollution and its
consequences.
Very poor households may not have any designated covered spaces, as kitchen and cooking may be
done in open space. Lighting from solar home systems is of little relevance in the context of indoor pollution
in such cases. On the other hand, where there is a separate covered space such as a kitchen, in some cases it is
located at a distance from the main rooms. As the normal solar home system operates well only within a
given distance from the charge controller, which is usually located in one of the main rooms, kitchens that are
located farther may go without any SHS lighting. Also, as the most popular modules usually offer only a few
connection points, kitchens may again often go without lighting from solar electricity. In any case, this
illustrates the importance of understanding both the number and the location of points of connection for
lighting. The scope for kitchen lighting with solar electricity thus may be somewhat problematic.
The new lighting facility immediately extends waking and working hours in the evening and may have
several types of benefits. Better lighting provides more time to do household chores and/or productive works
probably at a somewhat unhurried pace. The better lighting facility may also provide more time for reading
and study by students as well as non-students. Social interactions may increase, as may the sense of security
due to lighting. Longer daylight hours may alter the time use pattern of both men and women, but possibly
more for women. Some of these issues need to be investigated, keeping in mind the seasonal variations in
daylight.
The provision of enough electricity for running a black and white TV may provide scope for
entertainment as well as information which may be of value. Again, time use data will reveal if time for
amusements has increased. One other potential benefit is that mobile phones, which are now ubiquitous even
in villages, may now be charged at home. Prior to electrification, the owners of mobile phones would have to

17
charge them at specific places and the frequency of commute perhaps would have been less had there been
solar electricity in hitherto non-electrified houses. This also saves money for charging the mobile phones
while providing an opportunity to earn an income by charging other people’s mobiles.
The consumer surplus approach has been used to calculate and present the immediate effect of SHS
adoption in terms of cost savings from forgoing alternative sources of energy such as kerosene that are
replaced by an SHS panel. This method estimates the very short-run direct benefits of SHS. However, better
light because of SHS provides other benefits, such as longer duration of study and income-generating
activities during the evening hours. SHS power also provides other benefits by facilitating information flows
for both consumption and production because of TV, which can be run with electricity generated by SHS.
Thus, the benefits induced by SHS are much broader than the benefits induced simply by replacing kerosene
for lighting. Therefore, the identification of wider benefits of SHS is a priority for policy makers to justify the
subsidy used for promoting SHS. In other words, if the subsidy is large and the induced benefits of SHS in
terms of cost savings of kerosene replaced are not enough to cover the subsidy, the project of subsidizing
SHS will not be worth supporting. But if SHS adoption helps induce other measurable benefits such as better
schooling, higher school enrollment (especially among girls), income generated during evening hours or
improved health because of information flows via TV, a proposal for subsidizing SHS that has wider benefits
will then be worth supporting.
The question arises: How do we measure the benefits induced by SHS adoption? To conceptualize
the basic problem of identifying the benefits of SHS, consider the following household production function
of household and individual-level outcomes such as education, health, income, expenditure, and time use
represented by a vector (H) of a household i living in a village j using (X) amount of goods and services,
conditioned upon the use of lighting services (L) and a set of exogenous village characteristics (V):
hij
hj
hijij
hijijij VLXH εηµδγβ +++++= (1)

18
where β , γ , and δ are parameters to be estimated, ijµ are unobserved household-level characteristics,
jη unobserved village-level characteristics, and ijε independent error terms uncorrelated with any of the
regressors. However, unlike X determined only by market-controlled prices, L is determined by the same
factors that condition the household production of welfare goods (H) using the technology used to produce
light that is combined with X to produce welfare goods (H) in the following manner,
lij
lj
lijij
lijij VXL εηµδα ++++= (2)
Introducing modern technology (S) such as SHS to produce electricity to generate better and cleaner lighting
for household production and consumption means a shift in the production technology of lighting. This
means rewriting equation (2) as follows:
lij
lj
lijijkkij
lijij SVXL εηµπδα +++++= (3)
);(0 τπππ jk H+= (4)
Equation (4) suggests that the price of an SHS unit is not given but depends on a number of factors,
including an aggregate measure of community welfare ( ijj HH Σ= ) and the rate of subsidy (τ ) provided by
IDCOL to POs to entice household demand for SHS. If there are no factors that differentiate equation (3)
from (2) and hence, (1), there is no way to estimate the separate effect of SHS adoption on the level of
household welfare. For example, as equation (4) suggests, if the SHS price and its adoption depend only on
aggregate community welfare (aggregate over household welfare), then equations (1)-(3) are indistinguishable
and there is no way one can measure the effect of SHS on household welfare.4
The objective of the impact evaluation is to assess how adoption of the SHS affects household
welfare. However, in the case of use of SHS, a possible simultaneity arises as causation may run in the reverse
4 Similarly, if the basic price of SHS irrespective of subsidy is non-zero )0( ≠π it can also be a determinant of the independent effect of SHS on the welfare. However, the price of SHS unit is not truly exogenous as IDCOL through POs influences the price of SHS.

19
direction: from household outcome such as income to SHS connection. The household’s decision to adopt
the SHS may depend on income and a vector of additional determinants. Another problem occurs if some of
the determinant variables are unobservable. Consider the households that are more motivated or risk-takers.
They might be more inclined to purchase an SHS. At the same time, these generally unobservable
characteristics may affect the outcome variable. Hence, differences in outcome would be assigned to the SHS
adoption, even though they are in fact due to unobservable differences in characteristics. This is commonly
referred to as omitted variables or selection bias in the econometrics literature.
Since no baseline data are available on the adoption of the SHS in Bangladesh, the difference-in-
difference technique, a common method for impact evaluation, cannot be applied. There are three
contending non-experimental methods available for ex-post impact evaluation in such a situation, namely
regression discontinuity design (RDD), instrumental variables (IV) and propensity score matching (PSM)
methods (for details, see Khandker, Koolwal and Samad, 2010). It may be noted that program placement, i.e.
the choice of villages, is endogenous in that the treated villages must be off the grid in order for the POs to
sell a particular system and receive refinancing and subsidy through the IDCOL. However, once a PO is
established in a particular village, all of the households are eligible to purchase an SHS if they so wish.
Unlike interventions such as microcredit programs where targeting is based on land ownership or
the gender of the household head, there is no definitive criterion for targeting households for the purpose of
SHS adoption. This rules out the use of the RDD method which is applicable in case of explicitly specified
exogenous rules such as the one used for microcredit targeting in the country.
The IV method involves finding creditable instruments that are highly correlated with program
placement or SHS adoption but not with unobserved characteristics affecting outcomes. However, finding
suitable instruments for SHS adoption is a formidable task.
Due to lack of credible instruments, we propose an alternative method known as the propensity
score matching (PSM) method in the literature. The idea is to match program participants with non-
participants using typical individual and community observable characteristics, despite the shortcoming of

20
unobservable variable bias. In this case, each SHS participant is paired with a small group of non-participants
in the comparison group that are most similar in the sense of probability of participation in the program.
This probability (called propensity score) is estimated as a function of individual characteristics typically
using a logit or probit model. The mean outcomes of these groups of matched non-participants form the
constructed counterfactual outcome. The mean program impact is estimated by the difference between the
observed mean outcome of the project participants and the mean outcome of the constructed
counterfactual. Alternatively, we construct a p-score based on the probability function of SHS adoption, and
use the p-score weighted regression to estimate the effect of SHS adoption.5 The p-score weighted
technique is better than the propensity matching method (PSM) as it does not involve sample attrition
because of satisfying the balancing property (Hirano, Imbens, and Ridder 2003).
5. Determinants of SHS Adoption: Price Elasticity of SHS
Who purchases solar home systems to generate electricity for lighting and other needs? Given that the SHS
price per unit has declined, we need to estimate the price elasticity of SHS panels. Very few studies have
examined the determinants of SHS adoption. Wealthier households in a community are more likely to adopt
SHS than their poorer counterparts when solar units are made available. Moreover, in some countries,
households that are already on the electric grid are sometimes found to adopt solar home systems as well,
suggesting that solar home systems are seen as a source of backup power for people who are willing to pay
for electricity. Household adoption of SHS is also influenced by the education levels of household head or
other members. However, it is not known how the price of SHS or prices of alternative fuels affect the
adoption rate of SHS in areas where there is no grid electricity.
5 In p-score weighted regression, the weight variable used in the regression is equal to 1/p for the SHS users and 1/(1-p) for the non-users, where p (propensity score) is the probability of adoption of SHS.

21
Assume that for a given amount of lighting or electricity services )(L∧
demanded by each household,
equation (3) is expressed as follows where Sij is a function of all exogenous factors including the given
demand for lighting services of households:
ijjijijijij VXLS εηµτρπρρρρ +++++++∧
= 403210 (5)
where, ),,,( 0 τπijij VXLL =∧
is also determined by the same exogenous factors that affect the living
conditions including demand for lighting services. In other word, as equation (5) states, whether a household
adopts/purchases an SHS unit would depend on household- and individual-level exogenous factors such as
age and education of household head, land and non-land assets and village-level exogenous factors such as
village access to roads and electricity plus a set of exogenous prices of alternative fuels including prices of
SHS panels and subsidy rates for marketing the panels.
Table 6 presents comparative statistics of explanatory variables for the SHS adoption model of
equation (5). The descriptive statistics are shown by SHS adopters, non-SHS adopters and all types of
households to differentiate if the SHS adopters are different from their counterpart non-adopters in terms of
major characteristics. We find that SHS adopters are headed more often by females, are more educated, and
are much wealthier (in terms of both land and non-land assets) than non-adopters. The SHS adopters are
also more likely to live in villages characterized by char land and subject to river erosion.6 Adopters also tend
to live in villages with higher incidence of primary and secondary schools, and higher presence of NGOs. On
the other hand, SHS adopters live in villages that have lower presence of Grameen Bank and less connection
to a paved road. This means villages that have paved roads and Grameen Bank are more likely to use
alternative sources of electricity.7
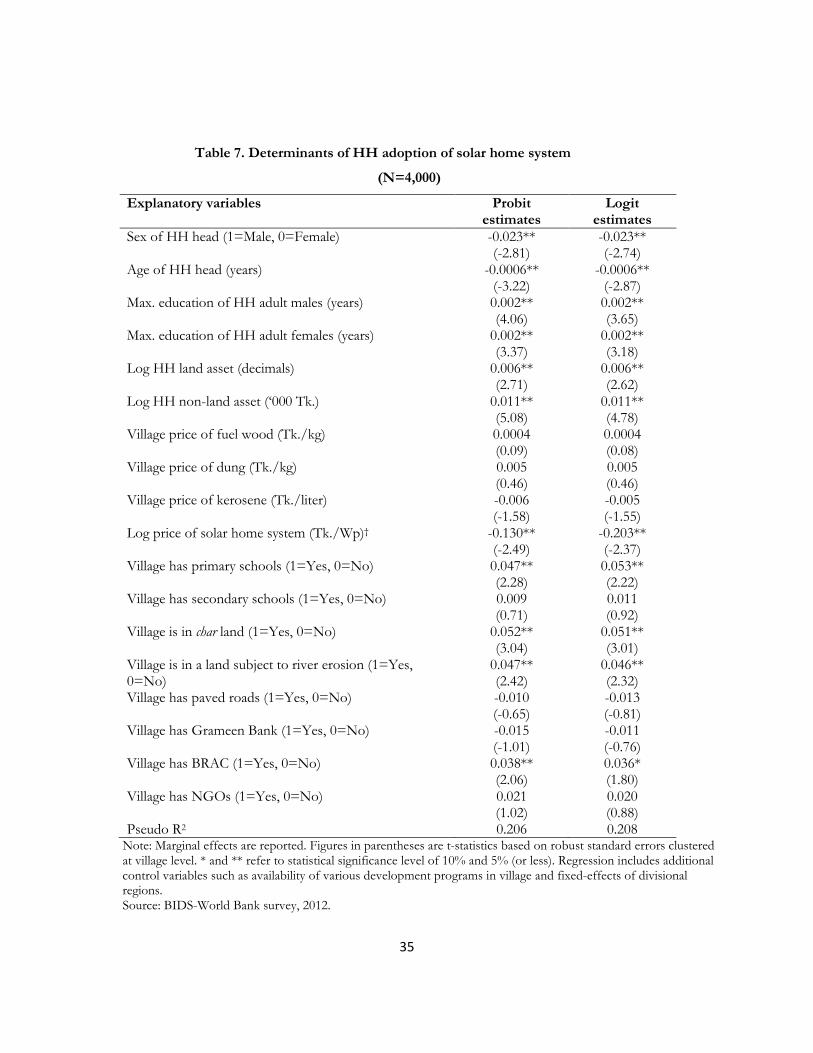
As the adoption is a binary variable (1 if adopted, and 0 otherwise) we estimate equation (5) using a
probit technique, assuming the error term follows a normal distribution. However, the literature on 6 A char is a riverine island that forms as a result of river erosion and accretion. While char lands are highly vulnerable to flooding and erosion, millions of poor people in Bangladesh live there. 7 Note that no village in our sample has grid electricity.

22
technology adoption suggests a logistic distribution (an S-shaped adoption curve implying very few adopt a
new technology initially, but after a while when the technology is known, its demand increases exponentially).
An alternative model is thus followed using a logit regression method. The results of both regression
methods are presented in Table 7. But as we have seen earlier, SHS units are not homogeneous, as adopters
can choose various levels of capacity. To see what variables determine the choice of various categories of
SHS capacity units, we estimate a multinomial logit model for household adoption of different capacities of
SHS and present the results in Table 8.
As Tables 7 and 8 suggest, female-headed households are more likely to adopt SHS panels than male-
headed households and also to adopt SHS units with higher capacity. Younger heads of households are more
likely to adopt an SHS panel with lower capacity. Higher education of either adult males or females means
both a higher probability of adoption and the adoption of a larger-capacity SHS. Similarly, land and non-land
assets increase the SHS adoption of higher capacity and the probability of adoption of low-capacity units is
high for small landholding groups. This suggests smaller-capacity units are favored more by small-size farm
households.
The price of alternative fuels such as kerosene, fuel wood and dung seems to affect the adoption of
SHS when it comes to size of the unit, but not the adoption of the system in general (as shown in Table 7). In
particular, the price of kerosene, which could be a substitute for SHS for the purpose of lighting, has a
negative effect on the adoption of a low-capacity system. This implies that households decide to adopt higher
capacity units if the price of the substitute fuel goes up. That is not surprising as higher capacity units are
cheaper based on price per Wp and provide a better value. Of course, some fuels are better substitutes than
others. The own price effect of SHS units is negative, meaning the lower the price of a solar panel, the higher
the demand for a unit and hence a higher adoption rate of solar panels. The coefficients of own price are less
than one, implying that the demand for SHS is price-inelastic. Thus, a 10 percent decline in SHS price
increases the overall demand for a solar panel by 2 percent (as per the logit model).
The socioeconomic and agroclimate endowments of villages play also an important role in SHS
adoption. The demand for SHS is higher in villages with higher incidence of primary schools, char land, and

23
river erosion. These factors matter more for higher-capacity units than lower-capacity units of SHS. The
presence of a BRAC program increases the adoption rate and for higher-size units. This is however not the
case with Grameen Bank and other NGOs.
In short, both household and community characteristics influence the adoption rates of SHS. The
prices of SHS units as well as other fuels are also found to matter. Income or wealth matters very much.
Wealthier households demand higher-capacity units of SHS; the converse is true for poor households.
Interestingly, the demand for SHS units is price-inelastic, implying that the price reduction through price
support policies such as grants may not be the only option to spur growth in SHS adoption.
6. Welfare Effects of SHS: An Application of the Propensity Score Method (PSM)
As indicated earlier, we propose one variant of the propensity score method (PSM) to estimate the welfare
effects of SHS adoption. As suggested by Hirano, Imbens and Ridder (2003), we first obtain the propensity
score by estimating the adoption equation (logit or probit regression) and then calculate the weight variable.
The weight variable gets a value 1 for the participants and p/(1-p) for the non-participants, where p is the
propensity score (probability of SHS adoption). In the next step, we estimate a weighted outcome equation
using the weight variable.
The welfare effects of SHS units may also vary not only by whether the households adopt but also
how long they use solar panels and how much electricity they consume (in essence this means what capacity
of solar units adopted). Therefore, two more models besides the adoption model are utilized to estimate the
effects of solar power. The results are presented in Table 10.
There are a variety of outcomes considered in the paper. Table 9 presents the descriptive statistics of
several outcomes. The outcomes are consumption of kerosene, hours spent on fuel collection, hours spent
for study in the evening, incidence of morbidity among household members, women’s decision-making
power, and household per capita expenditure. The descriptive statistics are given by SHS adopters, non-
adopters, and for all types of households. We find that there are statistical differences in several outcomes
between adopters and non-adopters of SHS. Thus, solar power owners have higher food, non-food, and

24
total expenditure than non-adopters. Kerosene consumption is significantly much lower (by more than 2
liters per month) than it is among non-adopters of SHS. Both boys and girls spend significantly more time
for study during evenings in SHS-owned households than in non-adopter households. Although there are no
statistical differences in the incidence of disease of various types, women’s fuel collection time is much lower
for SHS adopters than non-adopters. Also, women’s decision-making ability in household affairs is higher for
SHS adopters than non-adopters.
The key research question is, whether SHS adopters are better off (in terms of higher expenditure,
for example) than non-adopters as a result of solar power or they were better off to begin with, as wealth
(land and non-land assets) is a major factor influencing the decision to adopt a solar panel. It is also possible
that when solar panels are available, more able households tend to adopt SHS so that the effect of SHS on
behavioral outcomes such as study hours and per capita consumption are not so much due to SHS adoption
itself but the unobserved ability effect of households.
The challenge is to determine whether SHS adoption has actually impacted household behavioral
responses. As discussed in the methodological section, we would like to address this fundamental challenge
by using the PSM technique. Let us consider the estimates of p-score weighed regressions for various
outcomes of particular interest in Table 10.
As we know, the immediate effect of solar power is to replace kerosene. As Table 10 shows,
kerosene consumption is reduced by as much as 68 percent because of SHS adoption. Our results also show
that the adoption for an additional year reduces kerosene consumption by 33 percent. Consumption of solar
power by 1 kWh per month reduces consumption of kerosene by 69 percent. These are substantial gains of
SHS adoption. Households in rural areas also use fuel wood for lighting or cooking. Hence, one immediate
effect is expected on the time use of women or children for fuel collection. We find in Table 10 that SHS
adoption reduces women’s hours of fuel collection by 9 percent. In contrast, one additional year of solar
power exposure reduces women’s time use by 4 percent. However, consumption of solar energy does not
seem to affect women’s pattern of time use.

25
The immediate outcomes of solar power are study hours of children as well as the morbidity of
household members and changes in the decision-making power of women induced by TV use facilitated by
solar electricity. We find that evening study hours of both boys and girls have increased as a result of SHS
expansion. For example, boys study 8 additional minutes and girls study 7 additional minutes during evening
when the household is connected to a solar panel. Solar power is found to reduce the morbidity of
household members, especially female members. For example, SHS adoption reduces respiratory disease of
women by aged 16 and above by 1.2 percent. This is perhaps possible if solar power is used for cooking that
not only reduced the use of fuel wood for cooking, which may lead to decreased incidence of respiratory
illness due to less air pollution. Women are also found to exercise some decision-making power, but that is
only when a certain amount of solar power is consumed that facilitates running a TV. No wonder it is the
consumption of electricity but not simple SHS adoption that matters more to this decision-making power.
The ultimate effect of electricity provided by SHS is on household consumption and income. There
are a number of ways electricity through SHS adoption can facilitate growth in income and consumption.
First, replacement of kerosene saves money that can be used for consumption of food and non-food items.
Second, changes in time use and decision-making power induced by SHS adoption can help reallocate
household resources for consumption and production, which increases both income and consumption.
Third, solar power might help promote home-based income earning activities that have a direct effect on
income, and hence, an indirect effect on consumption. Our results presented in Table 10 suggest that solar
power increases per capita food expenditure by 9.3 percent, per capita nonfood expenditure by 4.7 percent
and total per capita expenditure by 5.1 percent, either simply because of adoption of the SHS unit, or through
longer exposure to solar power or higher amount of electricity consumption from solar units.
How do the welfare effects of SHS adoption compare to similar benefits due to grid electrification?
A study using household survey data of 2005 from rural Bangladesh shows that grid connectivity improves
household per capita expenditure by 11.3 percent (Khandker, Barnes, and Samad 2012). The same study also
finds that the evening study time of boys and girls goes up respectively by about 22 minutes and 13 minutes.
That is, the impacts of SHS adoption are similar in nature while being smaller in magnitude. Because of the

26
limited utility and services possible by SHS, its benefits will never match those due to grid connectivity.
However, such a comparison at least shows that the benefits achieved are in the right direction.
7. Cost Effectiveness of SHS
How much do the consumers of SHS pay against the lighting and other services provided by an SHS unit?
How much do they benefit from an SHS system? Can accrued benefits by households outweigh the cost of
the system charged to the households? There are various ways we can calculate the cost-effectiveness of SHS
for households who adopted such a technology for generating electricity for a variety of uses.
First, let us quantify the extent of benefits generated from a solar system for an average household.
Consider the case of expenditure savings because of reduction of kerosene consumption as a result of solar
power generation. If an average household saves 2 liters of kerosene per month by adopting SHS, it means a
savings of Tk. 160 per month (given that kerosene price is Tk. 80 per liter). This is the benefit (in terms of
cost savings for lighting) of SHS. Next, consider the income/expenditure gains induced by SHS adoption.
Estimates in Table 10 show that households accrue a 5 percent increase of total expenditure per month due
to SHS adoption. This is equivalent to over Tk. 700 gains per month from solar power. This expenditure
gain takes into account the savings in switching from kerosene to SHS.8
Now, let us consider the cost of SHS adoption. As per our data, the average unit price of SHS is Tk.
26,920 including the subsidy (2012 figures). If we spread this cost of the unit over its lifetime of 10 years, we
get a monthly cost of a SHS unit of Tk. 224. When we divide the benefits (in terms of expenditure gain) by
the cost of SHS adoption, we get a benefit-cost ratio as 3.1. That is, accrued benefits of a solar unit exceed its
cost by 210 percent.
8. Conclusions
8 This gain should not be interpreted as the increase in expenditure following the SHS adoption due to loan payments. It reflects, instead, a betterment of the quality of life accumulated through years of use of SHS. SHS had already been in rural Bangladesh for 10 years by the time our data were collected, with an average duration of 2.5 years for the sample. As such, such an accumulation of benefits is not surprising reflected through enhanced productivity, income and expenditure (a measure of welfare). .
27
Electricity is considered a powerful instrument for raising productivity and improving living conditions.
However, universal electrification has not been attained. More than 1.2 billion people do not have access to
electricity, many of whom live in South Asia and Sub-Saharan Africa. In Bangladesh, for example, less than
45 percent of rural households have access to electricity and the overall country-level access rate is not more
than 56 percent. The barriers toward universal electrification are not only lack of income, but also the
country’s ability to generate and distribute grid electricity enough to meet demand. In this context, solar
power using photovoltaic technology appears a promising instrument for promoting electrification in remote
rural areas that would not be connected to the grid in the foreseeable future or for possible use as a feed-in to
the grid in the future. Apart from the technological challenges of marketing solar home systems in remote
areas, financing a solar power program is challenging for a number of reasons. Given the cost of the unit and
its distribution problems, many poor households would find it difficult to purchase a solar unit out of their
own pockets.
Because of lack of income and access to a financing facility to help purchase a solar panel on loans,
the government of Bangladesh, with help from the World Bank and other donors, has aided a local company
called IDCOL and its partner organizations (POs) to devise a financing scheme for marketing SHS. The
objective is to make solar units available at a low price with easy access to a financing system under
reasonable interest rates and acceptable loan duration. Apart from a financing scheme, the donors also
provided a grant (although on a declining basis over time) in support of marketing solar units to POs of
IDCOL. As the system of marketing SHS is subsidized, it is important to estimate the cost-effectiveness of
acquiring a solar unit to generate electricity for millions who would likely never otherwise have access to
electric power.
Our analysis shows that the subsidy was about 25 percent of the average price of SHS in 2004, but
declined to 10 percent of the price in 2012. Analysis also shows that the demand for SHS is price-inelastic.
This means POs can charge a higher price for a system at its cost (i.e., without any subsidy) perhaps without
substantial reduction of market demand for SHS. However, given that the client base among the poor and
the prices of SHS are proportional to capacities, it is understandable that wealth plays a critical role in

28
promoting SHS adoption. That means the poor households who may prefer lower-capacity solar panel units
(less than 40 Wp) may not even be able to pay the market price (without subsidy) of such a unit. That is,
even if the subsidy is less than 10 percent of the current price, it seems IDCOL’s subsidized operation of
marketing SHS may not be discontinued for some time.
Thus, for adopters in rural areas, it is important to find out the socioeconomic benefits of SHS. The
objective is to estimate benefits to compare and contrast with the costs of acquiring a solar unit. Using a
large household survey data from Bangladesh, this paper estimates the effects of SHS on a variety of
household and intra-household behavioral outcomes. We find that SHS adoption increases evening study
hours of both boys and girls; reduces fuel collection time of women; helps adopt b/w TVs which in turn
helps promote women’s decision-making power and information sharing; and also reduces women’s and
children’s morbidity from respiratory diseases by reducing kerosene consumption. SHS adoption also
promotes household welfare by increasing per capita expenditure. Given the high cost of acquiring a unit
plus the grant subsidy attached to each unit, we find nonetheless that the benefits accrued to households
outweigh the cost of buying a solar unit. This means SHS is cost-effective for a rural household. Whether
the social benefits generated through higher access to electricity via solar power also exceed the social cost (in
terms of providing grant and subsidy support) of marketing such units is something worth exploring. Indeed,
this issue is addressed in another paper that shows that the social benefits exceed social cost (Haque et al.,
2013).

29
References
Bandiera, Oriana, and Imran Rasul. 2006. “Social Networks and Technology Adoption in Northern
Mozambique.” Economic Journal 116 (514): 869–902.
Barnes, Douglas F., ed. 2007. The Challenge of Rural Electrification: Strategies for Developing Countries.
Washington DC: RFF Press.
Brass, Jennifer N., Sanya Carley, Lauren M. MacLean, , and Elizabeth Baldwin. 2012. “Power for
Development: A Review of Distributed Generation Projects in the Developing World.” Annual
Review of Environment and Resources 37: 107–136.
Cabraal, R. Anil, Douglas F. Barnes, and Sachin G. Agarwal. 2005. “Productive Uses of Energy
for Rural Development.” Annual Review of Environment and Resources 30: 117–144.
Dinkelman, Taryn. 2011. “The Effects of Rural Electrification on Employment: New Evidence
from South Africa.” American Economic Review 101 (7): 3078–3108.
Friebe, Christian A., Paschen von Flotow, and Florian A. Täube. 2013. “Exploring the Link
between Products and Services in Low-Income Markets: Evidence from Solar Home Systems.”
Energy Policy 52: 760–769.
Haque, Enamul, Shahidur Khandker, Hussain Samad, and Zubair Sadeque. 2013. “Subsidy to Promote Solar
Home Systems: Evidence from Rural Bangladesh,” (mimeo).
Hirano, Keisuke, Guido Imbens, and Geert Ridder. 2003. “Efficient Estimation of Average Treatment
Effects Using the Estimated Propensity Score.” Econometrica, Econometric Society, vol. 71 (4): 1161–
1189.
Jacobson, Arne. 2007. “Connective Power: Solar Electrification and Social Change in Kenya.”
World Development 35 (1): 144–162.
Khandker, Shahidur R,, Douglas F. Barnes, and Hussain A Samad. 2012. “The Welfare Impacts of Rural
Electrification in Bangladesh.” Energy Journal, vol. 33 (1): 187–206.
Khandker, Shahidur R,, Gayatri B, Koolwal, and Hussain A Samad. 2010. Handbook on Impact Evaluation:
Quantitative Methods and Practice, World Bank Press.

30
Ki-Moon, Ban. 2011. “Sustainable Energy for All: A Vision Statement by Ban Ki-Moon, Secretary-
General of the United Nations.” November 2011.
Komatsu, Satoru, Shinji Kaneko, Ram M. Shrestha, and Partha Pratim Ghosh. 2011. “Nonincome
Factors behind the Purchase Decisions of Solar Home Systems in Rural Bangladesh.” Energy for
Sustainable Development 15 (3): 284–292.
Lay, Jann, Janosch Ondraczek, and Jana Stoever. 2012. “Renewables in the Energy Transition:
Evidence on Solar Home Systems and Lighting-Fuel Choice in Kenya.” German Institute of
Global and Area Studies, Working Paper 198.
Nieuwenhout, F.D.J., A. van Dijk, P.E. Lasschuit, G. van Roekel, V.A.P. van Dijk, D. Hirsch, H.
Arriaza, M. Hankins, B.D. Sharma, and H. Wade. 2001. “Experience with Solar Home Systems in Developing Countries: A Review.” Progress in Photovoltaics: Research and Applications 9 (6): 455–474.
Rebane, Kaja L., and Bradford L. Barham. 2011. “Knowledge and Adoption of Solar Home
Systems in Rural Nicaragua.” Energy Policy 39 (6): 3064–3075.
Wamukonya, Njeri. 2007. “Solar Home System Electrification as a Viable Technology Option for
Africa’s Development.” Energy Policy 35 (1): 6–14.
World Bank, 2013. Global Tracking Framework for Sustainable Energy for All, Washington, D.C.
Zerriffi, Hisham. 2011. Rural Electrification: Strategies for Distributed Generation. New York:
Springer.

31
Tables
Table 1: Sample distribution of the data
Sampling units Numbers
Division 7
Districts 16
Upazilas
Treatment 16
Control 16
Total 32
Villages
Treatment 64
Control 64
Total 128
Households
Treatment HHs 1,600
Control HHs in treatment villages 400
Control HHs in control villages 2,000
Total 4,000
Individuals
From treatment HHs 9,555
From control HHs in treatment villages 2,243
From control HHs in control villages 10,869
Total 39,684
Source: BIDS-World Bank survey, 2012

32
Table 2. Extent of Solar Home System (SHS) adoption in rural Bangladesh (%)
Divisional Region In villages with SHS In all villages
Dhaka
20.5 4.1
Chittagong
24.8 5.2
Khulna
20.5 4.1
Rajshahi
11.3 2.1
Rangpur
13.3 2.5
Barisal
48.2
13.4
Sylhet 34.4 8.0
All regions 22.5 4.6
N 2,000 2,000
Note: Figures in this table and subsequent tables are weighted by actual distribution of SHS households at the region level, and so are nationally representative for rural Bangladesh. Source: BIDS-World Bank survey, 2012.
Table 3. HH access to various energy sources by SHS use (%)
Energy
source
SHS HHs
(N=1,600)
Non-SHS HHs
From SHS
villages
(N=400)
From non-SHS
villages
(N=2,000)
From all
villages
(N=2,400)
Fuel wood 86.5 82.2 79.8 80.2
Non-fuel wood
biomass†
78.1 80.0 84.4 83.7
Kerosene 61.6 97.0 99.1 98.7
SHS 100.0 0 0 0
Other sources‡ 52.5 65.0 63. 8 64.0
†Non-fuel wood biomass sources are dung, tree leaves, crop residue, coal, jute stick, and briquette. ‡Other sources include LPG, candle, dry cell batteries, storage batteries, generators. Although a good share of households uses these sources, energy consumption from these sources are very low as we will see in the next table. Source: BIDS-World Bank survey, 2012.

33
Table 4. Energy consumption from various sources by rural households (kgOE/month)
Energy source
SHS HHs (N=1,600)
Non-SHS HHs t-statistics of the difference between SHS
users and nonusers
HHs from SHS villages (N=400)
HHs from non-SHS villages (N=2,000)
All non-SHS HHs
(N=2,400) Fuel wood 63.57 55.68 49.61 50.64 4.48** Non-fuel wood biomass†
61.87 61.20 65.48 64.80 -1.27
Kerosene 0.76 (0.92)
2.39 (2.91)
2.33 (2.82)
2.34 (2.84)
-23.62**
SHS 0.30 (3.56)
0 0 0
Other sources‡ 0.29 0.02 0.02 0.02 5.36** All sources 104.32 97.05 97.21 97.18 1.30 †Non-fuel wood biomass sources are dung, tree leaves, crop residue, coal, jute stick, and briquette. ‡Other sources include LPG, candle, dry cell batteries, storage batteries, generators. Although a good share of households uses these sources, energy consumption from these sources is very low. **Figures are statistically significant at a level of 5% or less. Note: Figures are average values for households that actually use particular energy sources, that is, households with zero consumption are excluded from the calculation. The figure in parentheses is energy consumption in kWh/month for SHS and liter/month for kerosene. Source: World Bank-BIDS survey, 2012.
Table 5. Appliance use pattern by SHS HHs by selected SHS capacities (%)
(N=1,505)
SHS capacity (Wp) Share among SHS users (%)
Tube/CFL lights (number)
Charger lights/lantern
TV
20 to <40 (mostly 20) 17.3 1.0 9.0 5.8 40 to <50 (mostly 40) 23.9 2.4 8.7 33.2 50 to <65 (mostly 50) 36.1 3.3 13.2 46.1 65 to <75 (mostly 65) 12.9 3.8 23.4 50.7 75 to 90 (mostly 75 and 85) 9.8 4.7 18.6 49.6 All capacities 100.0 2.9 13.3 37.0
Source: BIDS-World Bank survey, 2012

34
Table 6. Descriptive statistics of key explanatory variables (N=4,000)
Explanatory variables SHS households
Non-SHS households
All households
Sex of HH head (1=Male, 0=Female) 0.910 (0.286)
0.945 (0.229)
0.943 (0.232)
Age of HH head (years) 45.6 (13.2)
45.2 (12.9)
46.1 (12.9)
Max. education of HH adult males (years) 6.5 (4.7)
4.5 (4.4)
4.6 (4.4)
Max. education of HH adult females (years) 5.7 (4.0)
4.1 (3.8)
4.1 (3.8)
HH land asset (decimals) 242.6 (524.4)
114.3 (187.9)
120.2 (217.0)
HH non-land asset (‘000 Tk.) 4,515.1 (15,295.8)
1,700.9 (5,935.8)
1,830.6 (6,887.8)
Village price of fuel wood (Tk./kg) 4.39 (1.68)
4.20 (1.39)
4.21 (1.41)
Village price of dung (Tk./kg) 3.04 (0.62)
2.94 (0.67)
2.95 (0.66)
Village price of kerosene (Tk./liter) 64.59 (1.39)
64.92 (1.83)
64.91 (1.81)
Price of solar home system (Tk./Wp)† 318.12 (40.53)
316.92 (13.05)
316.97 (15.44)
Village has primary schools (1=Yes, 0=No) 0.918 (0.274)
0.677 (0.468)
0.689 (0.463)
Village has secondary schools (1=Yes, 0=No) 0.411 (0.492)
0.248 (0.432)
0.255 (0.436)
Village is in char area (1=Yes, 0=No) 0.297 (0.457)
0.250 (0.433)
0.793 (0.405)
Village is in a land subject to river erosion (1=Yes, 0=No)
0.248 (0.432)
0.180 (0.384)
0.814 (0.389)
Village has paved roads (1=Yes, 0=No) 0.475 (0.499)
0.550 (0.498)
0.546 (0.498)
Village has Grameen Bank (1=Yes, 0=No) 0.544 (0.498)
0.710 (0.454)
0.702 (0.457)
Village has BRAC (1=Yes, 0=No) 0.892 (0.310)
0.782 (0.413)
0.787 (0.410)
Village has other NGOs (1=Yes, 0=No) 0.766 (0.423)
247.1 (55.5)
247.5 (55.5)
†Price of solar home system is calculated by dividing the price of the unit by the capacity of the unit. This price is the price of net of subsidy, if any. Note: Figures in parentheses are standard deviations. Source: BIDS-World Bank survey, 2012.
35
Table 7. Determinants of HH adoption of solar home system
(N=4,000)
Explanatory variables Probit estimates
Logit estimates
Sex of HH head (1=Male, 0=Female) -0.023** (-2.81)
-0.023** (-2.74)
Age of HH head (years) -0.0006** (-3.22)
-0.0006** (-2.87)
Max. education of HH adult males (years) 0.002** (4.06)
0.002** (3.65)
Max. education of HH adult females (years) 0.002** (3.37)
0.002** (3.18)
Log HH land asset (decimals) 0.006** (2.71)
0.006** (2.62)
Log HH non-land asset (‘000 Tk.) 0.011** (5.08)
0.011** (4.78)
Village price of fuel wood (Tk./kg) 0.0004 (0.09)
0.0004 (0.08)
Village price of dung (Tk./kg) 0.005 (0.46)
0.005 (0.46)
Village price of kerosene (Tk./liter) -0.006 (-1.58)
-0.005 (-1.55)
Log price of solar home system (Tk./Wp)† -0.130** (-2.49)
-0.203** (-2.37)
Village has primary schools (1=Yes, 0=No) 0.047** (2.28)
0.053** (2.22)
Village has secondary schools (1=Yes, 0=No) 0.009 (0.71)
0.011 (0.92)
Village is in char land (1=Yes, 0=No) 0.052** (3.04)
0.051** (3.01)
Village is in a land subject to river erosion (1=Yes, 0=No)
0.047** (2.42)
0.046** (2.32)
Village has paved roads (1=Yes, 0=No) -0.010 (-0.65)
-0.013 (-0.81)
Village has Grameen Bank (1=Yes, 0=No) -0.015 (-1.01)
-0.011 (-0.76)
Village has BRAC (1=Yes, 0=No) 0.038** (2.06)
0.036* (1.80)
Village has NGOs (1=Yes, 0=No) 0.021 (1.02)
0.020 (0.88)
Pseudo R2 0.206 0.208 Note: Marginal effects are reported. Figures in parentheses are t-statistics based on robust standard errors clustered at village level. * and ** refer to statistical significance level of 10% and 5% (or less). Regression includes additional control variables such as availability of various development programs in village and fixed-effects of divisional regions. Source: BIDS-World Bank survey, 2012.

36
Table 8. Determinants of HH adoption of SHS by capacity (multinomial logit estimates) (N=4,000)
Explanatory variables SHS capacity 20 to <40 40 to <50 50 to <65 65 to <75 75 to 90
Sex of HH head (1=Male, 0=Female) 0.00005 (0.02)
-0.005* (-1.75)
-0.008** (-2.08)
-0.005** (-2.48)
-0.005** (-3.45)
Age of HH head (years) -0.0002** (-3.39)
-0.0001** (-2.18)
-0.0002** (-2.07)
-0.00003 (-0.52)
-0.00003 (-0.66)
Max. education of HH adult males (years) 0.0001 (0.83)
0.0002 (1.19)
0.001** (4.10)
0.0004** (2.54)
0.00009 (0.75)
Max. education of HH adult females (years) 0.0002 (1.19)
0.0005** (2.33)
0.0002 (0.90)
0.0003** (2.06)
0.0003** (2.36)
Log HH land asset (decimals) -0.001** (-2.12)
0.0001 (0.15)
0.004** (3.73)
0.003** (3.00)
0.002** (2.68)
Log HH non-land asset (‘000 Tk.) 0.001** (2.04)
0.002** (3.31)
0.004** (3.37)
0.002** (3.65)
0.001** (4.24)
Village price of fuel wood (Tk./kg) 0.001 (1.23)
-0.0004 (-0.29)
0.001 (0.46)
-0.001 (-0.78)
-0.001* (-1.65)
Village price of dung (Tk./kg) -0.005** (-2.51)
0.006 (1.61)
0.002 (0.37)
0.002 (0.93)
0.001 (0.50)
Village price of kerosene (Tk./liter) -0.001* (-1.77)
-0.001 (-0.74)
-0.002 (-1.38)
-0.001 (-1.14)
-0.0008 (-1.57)
Log price of solar home system (Tk./Wp)† -0.166** (-5.04)
-0.081** (-1.98)
0.027** (0.80)
0.023* (1.70)
-0.031* (-1.93)
Village has primary schools (1=Yes, 0=No) 0.006 (1.41)
0.010 (1.44)
0.022** (2.14)
0.006 (1.46)
0.006** (2.07)
Village has secondary schools (1=Yes, 0=No)
0.003 (1.20)
0.007* (1.89)
-0.002 (-0.32)
-0.001 (-0.32)
0.003 (1.40)
Village is in char land (1=Yes, 0=No) 0.003 (1.25)
0.014** (2.87)
0.018** (2.71)
0.009** (2.73)
0.004 (1.33)
Village is in a land subject to river erosion (1=Yes, 0=No)
0.002 (0.52)
0.011** (2.10)
0.012* (1.67)
0.009** (2.54)
0.008** (2.59)
Village has paved roads (1=Yes, 0=No) -0.003 (-1.14)
-0.001 (-0.35)
-0.005 (-0.72)
-0.002 (-0.50)
-0.001 (-0.44)
Village has Grameen Bank (1=Yes, 0=No) -0.002 (-0.64)
-0.002 (-0.45)
-0.006 (-0.95)
-0.0003 (-0.09)
-0.002 (-0.77)
Village has BRAC (1=Yes, 0=No) 0.001 (0.30)
0.016** (2.38)
0.011 (1.46)
0.003 (0.74)
0.005* (1.67)
Village has NGOs (1=Yes, 0=No) 0.003 (0.65)
0.005 (1.07)
0.004 (0.37)
0.002 (0.37)
0.002 (0.76)
Pseudo R2 0.202 Note: Marginal effects are reported. Figures in parentheses are t-statistics based on robust standard errors clustered at village level. * and ** refer to statistical significance level of 10% and 5% (or less). Regression includes additional control variables such as availability of various development programs in village and fixed-effects of divisional regions. Source: BIDS-World Bank survey, 2012.

37
Table 9: Descriptive statistics of outcome variables of interest
(N=4,000)
Outcome variables SHS HHs Non-SHS HHs t-statistics of the difference
Per capita food expenditure (Tk./month) 1,622.9 (796.0)
1,343.7 (566.7)
6.39
Per capita non-food expenditure (Tk./month)
1,220.4 (2.318.9)
796.4 (1,088.9)
4.79
Per capita total expenditure (Tk./month) 2,843.3 (480.3)
2,140.2 (1,357.0)
6.43
HH kerosene consumption (liter/month) 0.57 (0.89)
2.8 (1.3)
-23.62
Evening study time of boys (5-18) (minutes/day)
131.3 (53.3)
120.0 (49.5)
2.68
Evening study time of girls (5-18) (minutes/day)
127.3 (51.8)
115.0 (48.7)
-2.99
Incidence of gastro-intestinal diseases among boys in last year (5-15) (%)
7.8 (26.8)
6.6 (24.8)
0.56
Incidence of gastro-intestinal diseases among girls in last year (5-15) (%)
8.7 (28.1)
8.1 (27.3)
0.25
Incidence of gastro-intestinal diseases among males in last year (>15) (%)
8.7 (28.2)
9.5 (29.4)
-0.55
Incidence of gastro-intestinal diseases among females in last year (>15) (%)
9.2 (28.8)
9.0 (28.6)
0.13
Incidence of respiratory diseases among boys in last year (5-15) (%)
10.4 (30.5)
12.3 (32.8)
-0.68
Incidence of respiratory diseases among girls in last year (5-15) (%)
10.3 (30.4)
11.7 (32.2)
-0.52
Incidence of respiratory diseases among males in last year (>15) (%)
11.2 (31.5)
10.5 (30.7)
0.39
Incidence of respiratory diseases among females in last year (>15) (%)
8.6 (28.0)
9.4 (29.2)
-0.54
Women’s fuel collection time (hours/day) 0.259 (0.555)
0.386 (0.661)
-2.89
Women’s decision-making ability in household affairs (%)
5.1 (21.9)
3.0 (17.1)
1.94
Women’s freedom in purchasing own goods (%)
17.4 (37.9)
17.6 (38.1)
-0.10
Note: Figures in parentheses are standard deviations. Source: BIDS-World Bank survey, 2012.

38
Table 10. Impacts of SHS adoption by the households (p-score weighted regression)
(N=4,000)
Explanatory variables Adoption of SHS
Duration of SHS use
(years)
Log consumption of electricity from
SHS (kWh/month)
Log HH per capita food expenditure (Tk./month) 0.093* (1.90)
0.034* (1.93)
0.091** (2.64)
Log HH per capita non-food expenditure (Tk./month) 0.047** (2.09)
0.020** (2.41)
0.062** (3.98)
Log HH per capita total expenditure (Tk./month) 0.051* (1.84)
0.021** (2.06)
0.063** (3.10)
Log HH kerosene consumption (liter/month) -0.683** (-30.95)
-0.327* (-19.71)
-0.688** (-19.67)
Evening study time of boys (5-18) (minutes/day) 7.0** (2.39)
2.0* (1.88)
7.9** (3.56)
Evening study time of boys (5-18) (minutes/day) 8.2** (2.71)
2.7** (2.65)
8.4** (3.29)
Incidence of gastro-intestine diseases among boys (5-15) -0.006 (-0.61)
-0.002 (-0.56)
-0.005 (-0.53)
Incidence of gastro-intestine diseases among girls (5-15) -0.012 (-1.28)
-0.005 (-1.47)
-0.015* (-1.72)
Incidence of gastro-intestine diseases among men (16 or older)
-0.013 (-1.42)
-0.002 (-0.69)
-0.007 (-1.02)
Incidence of gastro-intestine diseases among women (16 or older)
-0.015* (-1.66)
-0.005* (-1.66)
-0.013* (-1.81)
Incidence of respiratory diseases among boys (5-15) -0.001 (-0.08)
0.0004 (0.08)
0.005 (0.55)
Incidence of respiratory diseases among girls (5-15)† 0.001 (0.09)
-0.0005 (-0.11)
0.008 (0.83)
Incidence of respiratory diseases among men (16 or older)
0.003 (0.33)
0.003 (0.77)
0.006 (0.85)
Incidence of respiratory diseases among women (16 or older)
-0.012* (-1.64)
-0.002 (-0.77)
-0.001 (-0.21)
Women’s fuel collection time (hours/day) -0.090** (-2.11)
0.041** (-2.98)
-0.027 (-0.84)
Women’s decision-making ability in household affairs 0.008 (0.91)
0.001 (0.27)
0.013* (1.77)
Women’s freedom in purchasing own goods 0.003 (0.26)
0.001 (0.31)
0.020** (2.22)
Sample mean and standard deviations of intervention variables
0.046† (0.210)
0.116 (0.660)
0.164‡ (0.881)
†Mean duration for SHS adopters is 2.5 years

39
‡Figure is sample mean of household consumption, not of log consumption. Mean electricity consumption for SHS
adopters is 3.6 kWh/month.
Note: Figures in parentheses are t-statistics based on robust standard errors clustered at village level. * and ** refer
to statistical significance level of 10% and 5% (or less). Regression includes explanatory variables as listed in Table 4.
Source: BIDS-World Bank survey, 2012.