the big picture of quality mri quality assurance and acr ...mri/ce/slides/mrqa and acr...
TRANSCRIPT

4/14/2009
1
MRI Quality Assurance and ACR MRI Accreditation Program
Chen Lin, PhD
Indiana University School of Medicine & Clarian Health Partners
The Big Picture of Quality
• Diagnosis accuracy
– Image quality
– Knowledge and expertise of radiologists
– Effective communication
• Workflow and efficiency
• Safety
• Satisfaction of patients and referring physicians
• …
Basic Elements for Image Quality
Signal, Spatial Resolution, Contrast
Other Contributions to Image Quality
1. Signal
2. Spatial Resolution
3. Contrast
4. Artifacts
5. Noise
6. Temporal resolution
7. Scan time
8. Temporal Stability or Reproducibility
9. MRS line-width and baseline
2D SE 60 2D T1 FLAIR 2D FLASH 3D FLASH 3D MPRAGE
IQ=4 IQ=6 IQ=4 IQ=5 IQ=5
Common MRI Artifacts
Magnetic field (B0)1. Main field inhomogeneity2. Susceptibility artifacts
RF Field (B1)1. Cross-talk (Imperfect slice
profile)2. Zipper (RF leak)3. RF feed through4. RF noise/interference5. Inhomogeneity (intensity
and suppression)
Gradients (G)1. Ghosting2. Distortion or Non-linearity
Data Acquisition and Image Reconstruction
1. Aliasing2. Truncation (Gibbs Ringing)3. Blurring4. Chemical shift5. Partial volume
Physiology / Patient1. Bulk Motion 2. Flow
Noise in MRI
• Originated from the patient / object.
• Also introduced by the hardware components in the receiving chain/path.
• Thermal/random noise has the same characteristic over a wide frequency range, i.e. “White noise”
• Noise measurement: Standard deviation of pixel intensity in noise region.
Signal Intensity
Noise Level
frequency
rBW

4/14/2009
2
Signal to Noise Ratio (SNR)
• Signal: Average pixel intensity for a specific region/tissue
• SNR = Signal / NoiseSNR = f(Seq) B0 PD x y z ( NPE NEX / RBW )1/2
SNR32 = 0.5 SNR8 SNR128 = 0.25 SNR8SNR8
Use consistent imaging parameters for SNR measurement and comparison.
Contrast to Noise Ratio (CNR)
• Contrast:
– |SignalTissue1 – SignalTissue2|
– CNR = Contrast/Noise
– Better measure of conspicuity
• Artifact to Noise Ratio
– Artifact: Average of pixel intensity in an artifact region
Major Influences to Image Quality1. Scanner performance, imaging technique & protocol
2. Patient management
3. Exam planning (Slice position, orientation and coverage; Acquisition timing)
4. Image presentation (Film and Display Quality)
MRCP w. 3D SPACE & Var FA MRCP w. 3D SPACE & Const FA
Image Quality Assurance
• Scanner Performance Monitoring– Acceptance Testing after Installation, Upgrade and Service
– Scheduled Daily/Weekly QA
– Scheduled Quarterly/Annually QA• Test all coils, RF room integrity, PMU, Display, Injector, etc.
– Preventive Maintenance
– Testing for Advanced Applications
• Protocol Optimization and Standardization
• Tech Education & Training
• Image Quality/Artifacts Reporting and Trouble-shooting (Continuous Improvement Process)
2/3/2006
ACR QA Program
• Personnel Qualification
• Preventive Maintenance and Safety
• Weekly QA by MR Technologists:
– Phantom scans, visual checks, film test
• Acceptance and Annual Testing by Physicist
• Re-accreditation Every Three Years:
– Attestation of weekly and annual QA
– Submit expanded phantom scans
– Submit clinical cases
ACR Weekly QA Tests
• Visual Checks
– Patient table
– RF shield
– Patient monitoring
– Safety Equipment
• Film QA
– Base + Fog
– Speed
– Contrast

4/14/2009
3
Features in ACR Phantom
• Appropriate size, shape, loading and relaxation time.
• Stable for over time
• An uniform region
• Grid for geometric accuracy
• Wedges for slice position measurement
• Ramps for slice thickness measurement
• Shallow holes for low contrast detectability measurement
• Small holes for spatial resolution measurement
ACR PhantomAppropriate for most head coils
Phantom Setup and slice positioning
• Straight and in the center of the coil.
• Use a customized holder or the same support.
• Line up slice #1 and #11 to the cross of wedges
ACR Weekly QA Protocol
• CSE sequence, TR/TE = 500ms/20ms
• Acq. matrix = 256x256 and FOV = 250mm
• 11 slice of 5mm w. 100% gap
• What about other imaging options?
None, except image intensity correction if phase array coil is used. (for accreditation)
Normalize or Pre-scan Norm (Siemens)SCIC or PURE (GE)
1. Central Frequency (CF)
• Typically set to the resonance frequency of water protons.
• Proportional to the field strength (B0).
• Search for the largest water signal using spectroscopy sequence with 10Hz increment.
• Affects the quality of fat saturation, the severity of off-resonance artifacts, etc.
Finding Center Frequency
• Display as one of the calibration / pre-scan parameters. Can also be found in DICOM header: DICOM TAG (0018, 0084) Imaging Frequency
• ACR recommended criteria: < +/-1.5ppm different between weekly tests
• Possible cause of failure:
– Phantom not at iso-center
– Magnet drift
– RF (synthesizer) instability
2. Transmitter Gain/Voltage
• Reflects RF power required to achieve certain flip angle
• Depends on RF coil (the coupling), phantom (coil load), RF pulse type, etc.
• Should remain constant over time if nothing in the pulse sequence or hardware has changed.
4/14/2009
4
Finding Transmitter Gain/Voltage
• GE: displayed on screen (dB)
• Siemens: “options” >> “adjustments”
– Transmitter amplitude (temp) (V)
• Philips: under system performance parameters
– rf_act_drivescale
• Toshiba: “acquisition window”
– Center frequency (MHz)
– RF level
Criteria and Causes of Failure
• Recommended criteria: 10% increase from baseline.
• Possible cause of failure:
– Incorrect positioning of phantom.
– Defect in RF transmitting coil (such as improper quadrature phase shift).
– RF (amplifier) instability.
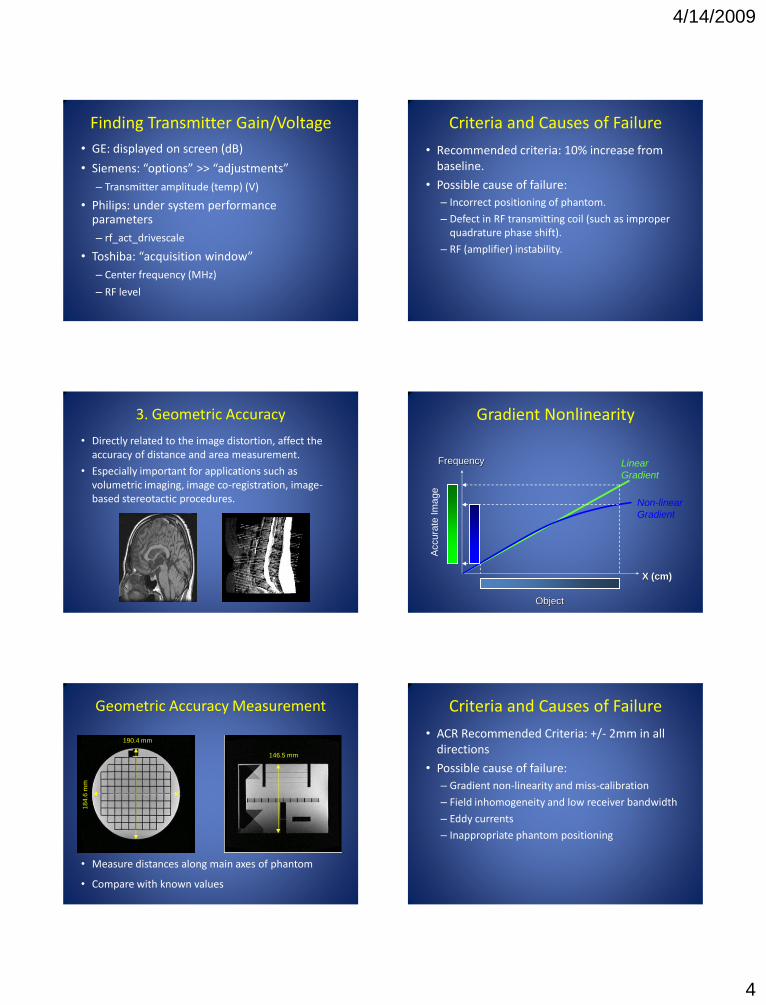
3. Geometric Accuracy
• Directly related to the image distortion, affect the accuracy of distance and area measurement.
• Especially important for applications such as volumetric imaging, image co-registration, image-based stereotactic procedures.
Frequency
X (cm)
Accura
te Im
age
Object
Gradient Nonlinearity
Linear
Gradient
Non-linear
Gradient
Geometric Accuracy Measurement
• Measure distances along main axes of phantom
• Compare with known values
190.4 mm
18
4.6
mm
146.5 mm
Criteria and Causes of Failure
• ACR Recommended Criteria: +/- 2mm in all directions
• Possible cause of failure:
– Gradient non-linearity and miss-calibration
– Field inhomogeneity and low receiver bandwidth
– Eddy currents
– Inappropriate phantom positioning

4/14/2009
5
4. Spatial Resolution Measurement
• Ability to detect small structures.
• Depends on FOV and acquisition matrix size
• But also depends on:
– pulse sequence type
– relaxation times
– k-space sampling
– filter settings
– etc.
Spatial Resolution MeasurementResolution Grid Method
• Evaluate the separation of holes arranged in two square arrays.
• The resolution is the smallest size of holes can be separated.
UL
LR
Image
Matrix
Resolution
Holes
Prevent Partial Volume Error Criteria and Causes of Failure
• ACR Recommended Criteria: <= 1.0 mm
• Possible cause of failure:– Blurred by image filter.
– Interference from artifacts
– Poor SNR
– Increased eddy currents
– Poor gradient calibration
– Poor B0 uniformity
– Reduced stability of system
5. Low Contrast Detectability (LCD)
• The ability to distinguish objects with subtle difference in signal intensity.
• CNR = |S1 – S2 |/(St. Dev. of Noise)
• LCD: A visual test. Related to SNR, but more subjective.
LCD Measurement
Holes of different size
Imaging Slice
Plastic Sheet of different thickness

4/14/2009
6
The Relationship between SNR and LCD
To
tal N
um
be
r o
f S
po
ke
s
Signal-to-Noise Ratio
0 50 100 150 200 250 300 350
40
35
30
25
20
15
10
5
0
Criteria and Cause of Failure
• ACR Recommend Criteria:
– More than 9 for 1.5T or lower
– More than 37 for 3.0T
– Reduction of 4 spokes from the baseline
• Possible Cause of Failure:
– Inaccurate slice position
– Poor SNR
– Artifacts
1. ACR Sag Loc
2. ACR Ax T1
3. ACR Ax PD/T2
4. Site Brain Ax T1
5. Site Brain Ax T2
• Complete the Phantom Site Scanning Data Form (Large Phantom) online.
Expanded Phantom Scans
Weekly Phantom Scans
11 slices of 5 skip 5
Additional Phantom Tests
• Image Uniformity
– Use imaging intensity correction option with a phased array coil.
• Slice thickness and slice offset
– Be careful with your phantom position
• Ghosting artifact
– Checked in a recent PM or annual testing
Ask your physicist to check the phantom images before ACR submission.
ACR MRI Clinical Modules
• Choice of Basic and Specialty exams
• Each scanner must apply for all modules routinely performed
Head Spine MSK
Body MRA Cardiac
ACR MRI Evaluation Categories
• Pulse Sequences and Image Contrast
• Spatial and Temporal Resolution
• Exam Identification: Missing Information
• Anatomic Coverage and Imaging Planes
• Artifacts
• Filming Technique (for hard copy film submissions only)
Need good planning and team work.
4/14/2009
7
ACR Accreditation Preparation
• Refill ACR phantom
• Perform PM and annual tests.
• Review your clinical protocols and make sure they meet ACR requirements (i.e. the resolution and scan time.)
• Register online and choose the type clinical cases carefully according to your patient population.
ACR Online Submission
Timeline for Clinical cases and phantom scans
Clinical cases (45 days)
ApplicationDue (60 days)
MaterialDue (45 days)
Notified by ACR
Extension I (30 days)
Phantom Scans 2
Phantom Scans 1
Extension II (30 days)
Tips and Suggestions
• Discuss with ACR if you are not clear about what they ask for.
– Acquisition matrix: frequency encoding and phase encoding used
– Reconstruction matrix: number of pixels in each dimension of the image
– Display matrix: number of pixels in each dimension of the post-processed image
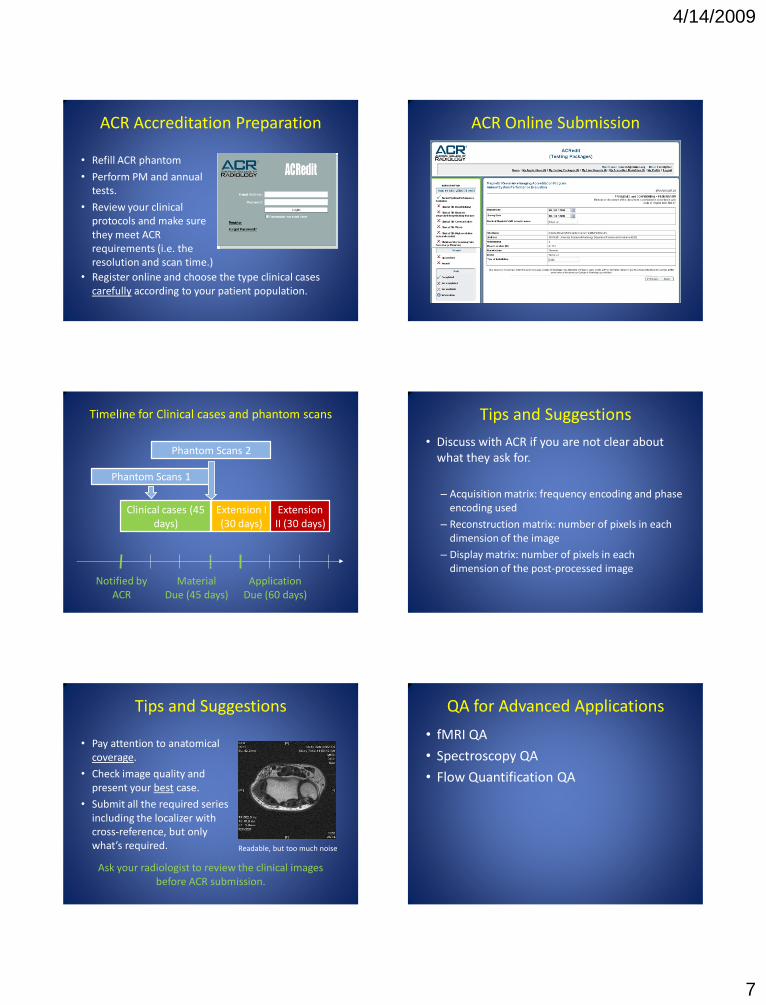
Tips and Suggestions
• Pay attention to anatomical coverage.
• Check image quality and present your best case.
• Submit all the required series including the localizer with cross-reference, but only what’s required.
Ask your radiologist to review the clinical images before ACR submission.
Readable, but too much noise
QA for Advanced Applications
• fMRI QA
• Spectroscopy QA
• Flow Quantification QA

4/14/2009
8
Challenges of fMRI• Based on signal difference between rest and active states.
• Such difference (i.e. BOLD effect) is only a few %.
• While problems such as baseline drift can be corrected in post-processing, it should still be kept to minimum.
430
435
440
445
450
455
460
465
470
475
480
0 20 40 60 80 100
Time
AU
fMRI QA Measurements
Run extended fMRIprotocol with low and high excitation flip angles.Measure : SNR (RF check) SGR (Signal to Ghost
Ratio) (Gradient & eddy current check)
Signal intensity drifts and fluctuations. (System stability check)
* A. S
imm
on
s, e
t al, M
RM
41
:12
74–
12
78
(19
99
)
fMRI QA Example fMRI QA Results of Two GE 3T Scanner
Variation
(%)
Ghosting
(%)Noise SNR
SB w. PA < 1 2.7 0.40 885
SB w. PA
& IFIS< 1 2.5 0.30 716
SB w.
BC< 1 2.7 0.23 638
LB w.
PA< 1 2.1 0.25 735
LB w.
BC< 1 1.5 0.23 550
SB=Short Bore; LB=Long Bore; PA=Phased Array; BC=Bird Cage
Possible Cause of Failure
• Instability of RF amplifier and receiver
• Changes of eddy currents due to temperature change
Summary
• Contributing factors in MR image quality.
• Principles behind the ACR weekly tests.
• ACR accreditation process.
• fMRI QA

4/14/2009
9
Thank You !
www.indiana.edu/~mri