the big picture: who comes, why and what might change in the future?
TRANSCRIPT

The 'Big Picture': who comes, why and what might change in the future?
The UK and internationalstudents: strengths, challenges and opportunities
UKCISA Regional Conference, Manchester
Professor Nigel HealeyPro-Vice-Chancellor (International)
Nottingham Trent University6 February 2015

2
Overview
• Who comes? The national picture - international enrolments in English HEIs
• Who comes? The big picture – global trends in international students?
• Why do they come?
• What might change in the future?
3
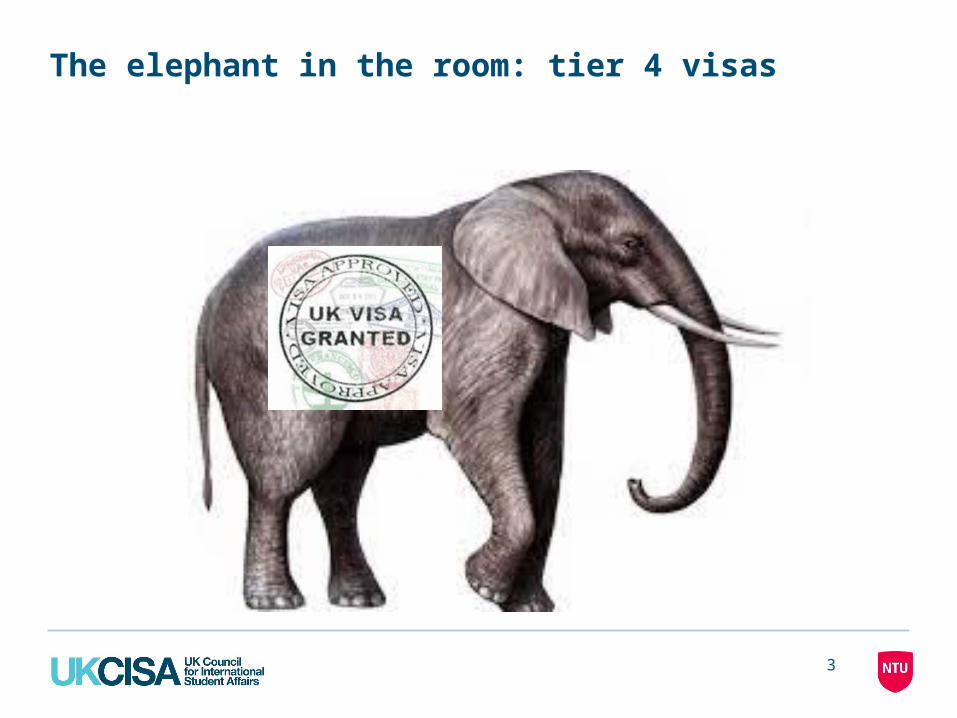
The elephant in the room: tier 4 visas
4
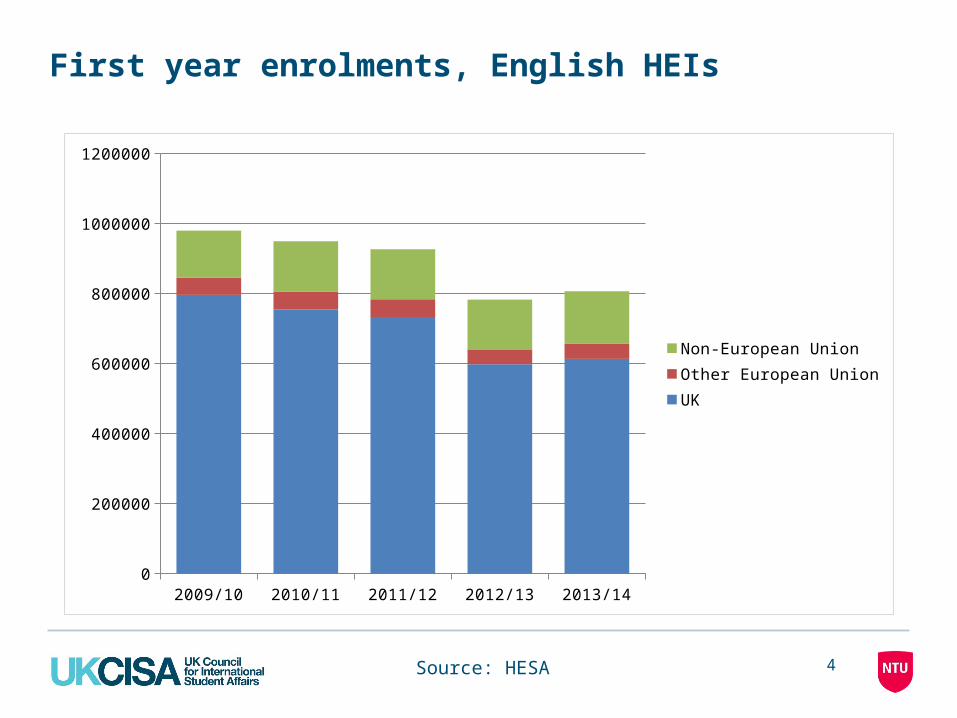
First year enrolments, English HEIs
2009/10 2010/11 2011/12 2012/13 2013/140
200000
400000
600000
800000
1000000
1200000
Non-European UnionOther European UnionUK
Source: HESA

5
Total enrolments, English HEIs
2009/10 2010/11 2011/12 2012/13 2013/140
500000
1000000
1500000
2000000
2500000
Non-European UnionOther European UnionUK
Source: HESA

6
First year international enrolments, English HEIs
Source: HESA
2009/10 2010/11 2011/12 2012/13 2013/140
20000
40000
60000
80000
100000
120000
140000
160000
Other European UnionNon-European Union
First year enrolments fell 470 in 2011/12 and another 860 in
2012/13

7
Total international enrolments, English HEIs
2009/10 2010/11 2011/12 2012/13 2013/140
50000
100000
150000
200000
250000
300000
Other European UnionNon-European Union
Source: HESA
First recorded all-years decline since 1981, down from
251,980 in 2011/12 to 249,630

8
Total international undergraduate enrolments, English HEIs
2009/10 2010/11 2011/12 2012/13 2013/140
20000
40000
60000
80000
100000
120000
140000
Other European UnionNon-European Union
Source: HESA

9
Total international postgraduate enrolments, English HEIs
Source: HESA
2009/10 2010/11 2011/12 2012/13 2013/140
20000
40000
60000
80000
100000
120000
140000
160000
Other European UnionNon-European Union
Postgraduates peak at 134,270 in
2010/11

10
Who comes? Top 10 non-EU enrolments, English HEIs
Source: HESA
2009/10 2010/11 2011/12 2012/13 2013/14
% change 2009/10 -
2013/14China 48625 56990 66050 69970 74020 52%
India 31195 30890 24030 18525 16480 -47%
Nigeria 13525 14165 14415 14305 14850 10%
Malaysia 12095 11950 12440 12615 14005 16%
Hong Kong (SAR) 9105 9510 10275 11850 13415 47%
United States 11100 11510 12120 11865 11985 8%
Saudi Arabia 6975 8765 8400 7930 7485 7%
Singapore 3435 4030 4750 5370 6075 77%
Thailand 4955 5335 5555 5475 5555 12%
Pakistan 8155 8120 6880 5695 5230 -36%
All other 87735 87190 87060 86035 89330 2%
Total 236900 248455 251980 249630 258430 9%

11
Who comes? Top 10 other-EU enrolments, English HEIs
Source: HESA
2009/10 2010/11 2011/12 2012/13 2013/14
% change 2009/10 -
2013/14Germany 6615 6960 6585 5420 5175 -22%
France 6410 6390 5935 5070 4850 -24%
Italy 2950 3200 3500 3535 4145 41%
Greece 4935 5050 5065 4210 4080 -17%
Cyprus (EU) 4765 4790 4860 3725 3610 -24%
Ireland 4310 4465 3730 2745 2730 -37%
Spain 2375 2555 2470 2365 2720 15%
Romania 1555 2155 2490 2145 2040 31%
Bulgaria 1565 1765 2000 1635 1715 10%
Poland 2370 2035 1825 1420 1615 -32%
All other 11170 12135 12360 10350 11100 -1%
Total 49020 51495 50815 42620 43795 -11%

12
Students enrolled outside their country of citizenship (m)
1975 1980 1985 1990 1995 2000 2005 2010 2011 20120
0.5
1
1.5
2
2.5
3
3.5
4
4.5
5
Source: OECD Education at a Glance 2014

13
Growth of global enrolments versus international mobility
1980 1985 1990 1995 2000 2005 2010
Global tertiary enrolments (m)
51.2 60.3 68.7 81.7 99.9 139.0 178.0
Internationally-mobile (m)
1.1 1.1 1.3 1.7 2.1 3.0 4.1
Internationally mobile as % total
2.1% 1.8% 1.9% 2.1% 2.1% 2.2% 2.3%
Source: UNESCO Institute for Statistics

14
Percentage of foreign students enrolled by country of destination
United States 16%
United Kingdom 13%
Germany 6%
France 6%Australia 6%
Canada 5%
Russian Federa-tion 4%
Japan 3%
Spain 2%
China 2%
Italy 2%
Austria 2%
New Zealand 2%
South Africa 2%Switzerland 1%Netherlands 1%
Korea 1%
Belgium 1%
Other OECD countries 8%
Other non-OECD countries 17%
Source: OECD Education at a Glance 2014

15
International tertiary students as % of total enrolments
Source: OECD Education at a Glance 2014
Luxe
mbourg
Australi
a
United Kingd
om
Switz
erlan
d
New Ze
aland
Austria
Belgium
Canad
a
Denmark
Netherl
ands
0.00
5.00
10.00
15.00
20.00
25.00
30.00
35.00
40.00
45.00
OECD mean = 8.38%
16
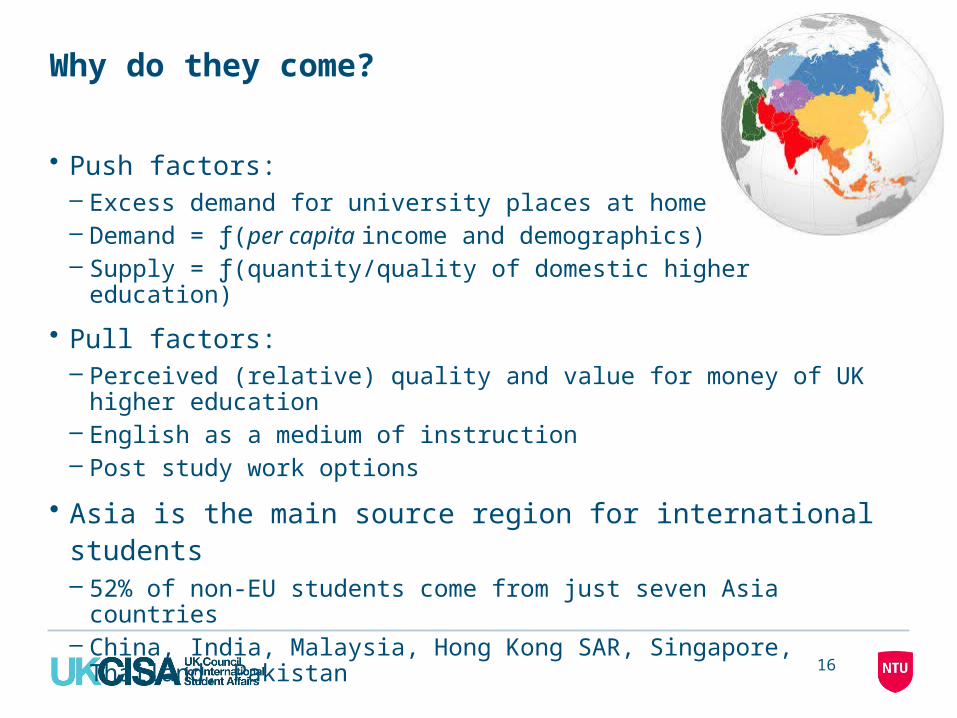
Why do they come?
• Push factors:– Excess demand for university places at home– Demand = ƒ(per capita income and demographics)– Supply = ƒ(quantity/quality of domestic higher education)
• Pull factors:– Perceived (relative) quality and value for money of UK higher
education– English as a medium of instruction– Post study work options
• Asia is the main source region for international students– 52% of non-EU students come from just seven Asia countries– China, India, Malaysia, Hong Kong SAR, Singapore, Thailand,
Pakistan

17
What might change: projected per capita GDP (US$’000 PPP at constant prices)
Source: PWC, The world in 2050 - Beyond the BRICs: a broader look at emerging market growth prospects
18
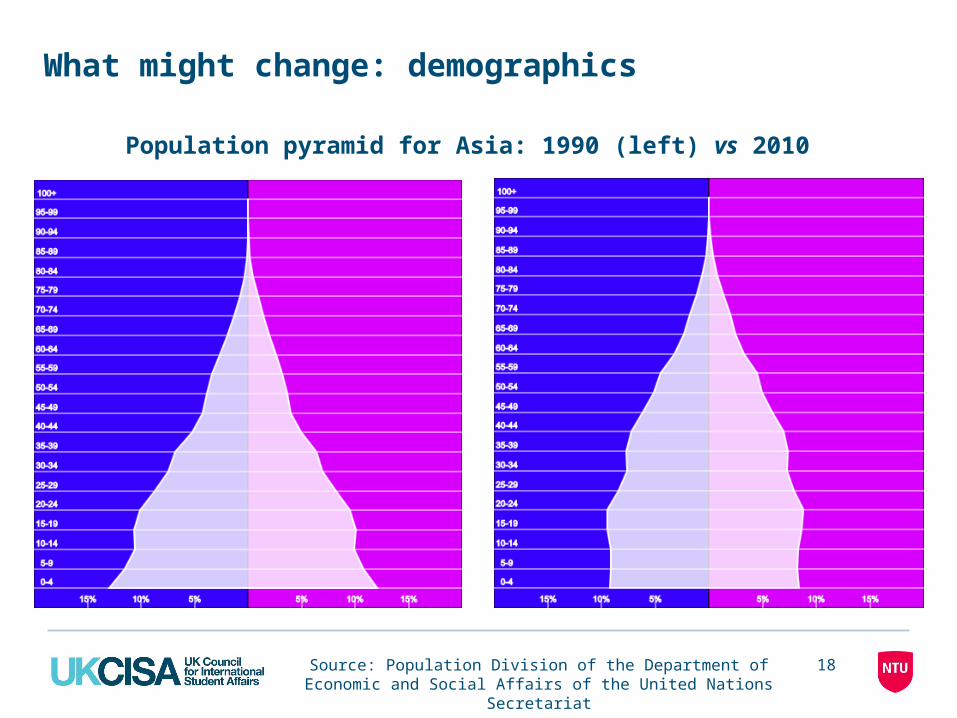
What might change: demographics
Source: Population Division of the Department of Economic and Social Affairs of the United Nations Secretariat
Population pyramid for Asia: 1990 (left) vs 2010

19
Breaking news from the UN Population Division, May 2011
The World has reached Peak Number of Children!
World population continues to grow, but the number of children
in the world has now reached its peak.
In 1960 there were 1 billion children below 15 years of age and
they were 35% of the world population.
Now there are 1.9bn children in the world, but they are 27% of
world population.
In 2050 there will still be an estimated 1.9bn kids, but they will
be only 20% of world population.
Source: http://www.gapminder.org/

20
What might change: demographics
Source: Population Division of the Department of Economic and Social Affairs of the United Nations Secretariat
Chinese population 20-24 year old (medium forecast)

21
What might change: domestic higher education capacity
Gross tertiary enrolment rate in China
Source: World Bank
22
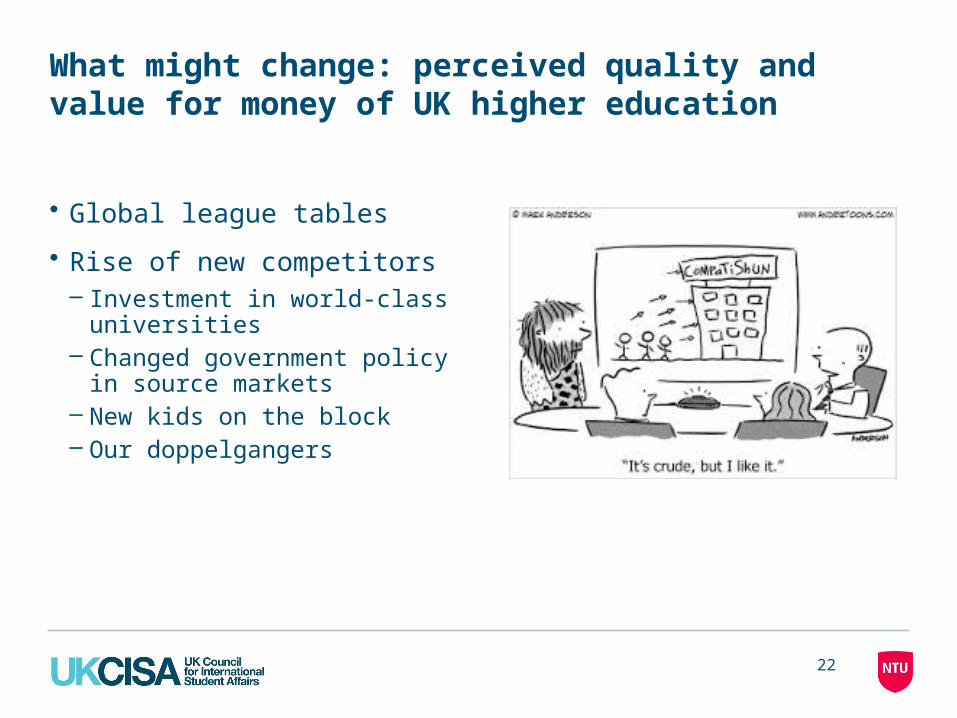
What might change: perceived quality and value for money of UK higher education
• Global league tables
• Rise of new competitors– Investment in world-class
universities– Changed government policy in
source markets– New kids on the block– Our doppelgangers

23
The rise of international league tables
24
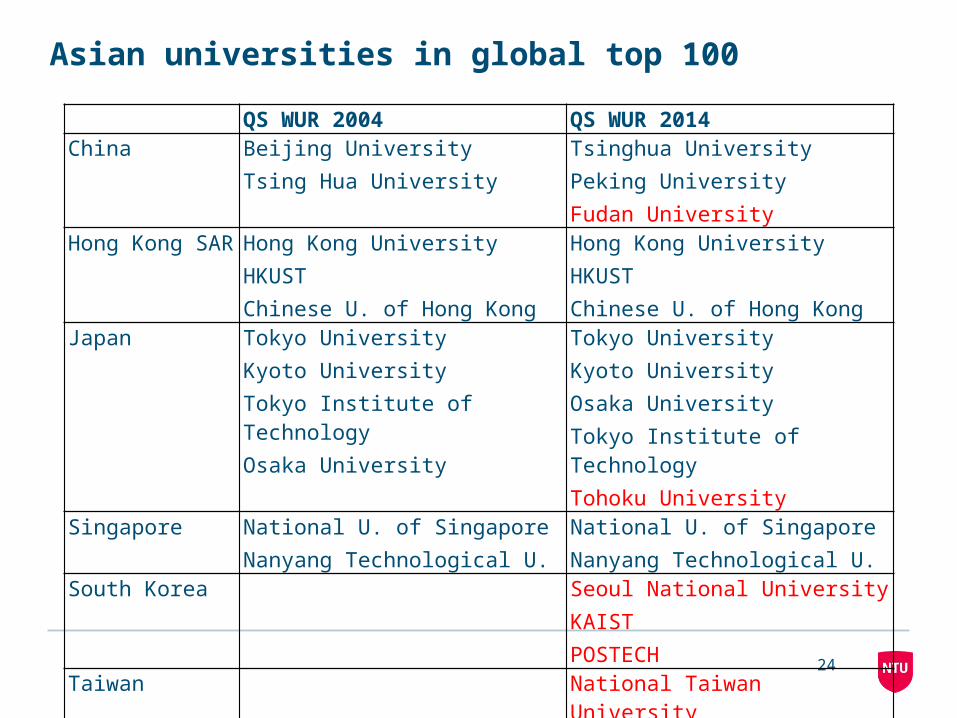
Asian universities in global top 100
QS WUR 2004 QS WUR 2014China Beijing University
Tsing Hua UniversityTsinghua UniversityPeking UniversityFudan University
Hong Kong SAR Hong Kong UniversityHKUSTChinese U. of Hong Kong
Hong Kong UniversityHKUSTChinese U. of Hong Kong
Japan Tokyo UniversityKyoto UniversityTokyo Institute of TechnologyOsaka University
Tokyo UniversityKyoto UniversityOsaka UniversityTokyo Institute of TechnologyTohoku University
Singapore National U. of SingaporeNanyang Technological U.
National U. of SingaporeNanyang Technological U.
South Korea Seoul National UniversityKAISTPOSTECH
Taiwan National Taiwan University

25
Focusing resources to build world-class universities (1)
• China– Project 211 (113 universities, 80% PhDs, 96% of research labs)– Project 985 (39 universities, goals to make Peking and Tsinghua
'top university', others 'world-class')
• Korea– KoreaBrain21 to create 10 world class, research-oriented
universities
• Thailand– Second 15-Year Long Range Plan on Higher Education, focus
resources on 9 national research universities
• Japan– Global COE Programme: targeted support to the creation of world-
standard research and education bases (centres of excellence)

26
Focusing resources to build world-class universities (2)
• Malaysia– National Higher Education Strategic Plan 2011-15 (6 Research
Universities, 20 world class Centres of Excellence (CoE)
• Singapore– Has bilateral system of polytechnics/institutes of technical
education vs four public universities– Research funding concentrates on NUS and NTU
• Taiwan– Development Plan for World-Class Universities and Research
Centers of Excellence

27
What might change: government policy in source markets (1)
• Motives for internationalisation:– Development aid (Colombo Plan)– Project language and culture (soft diplomacy)– Export education (commercial)– Attract skilled immigrants– Strengthen teaching and research on campus through the
presence of foreign scholars
• Every major Asian country has ambitious government plans for internationalisation
28
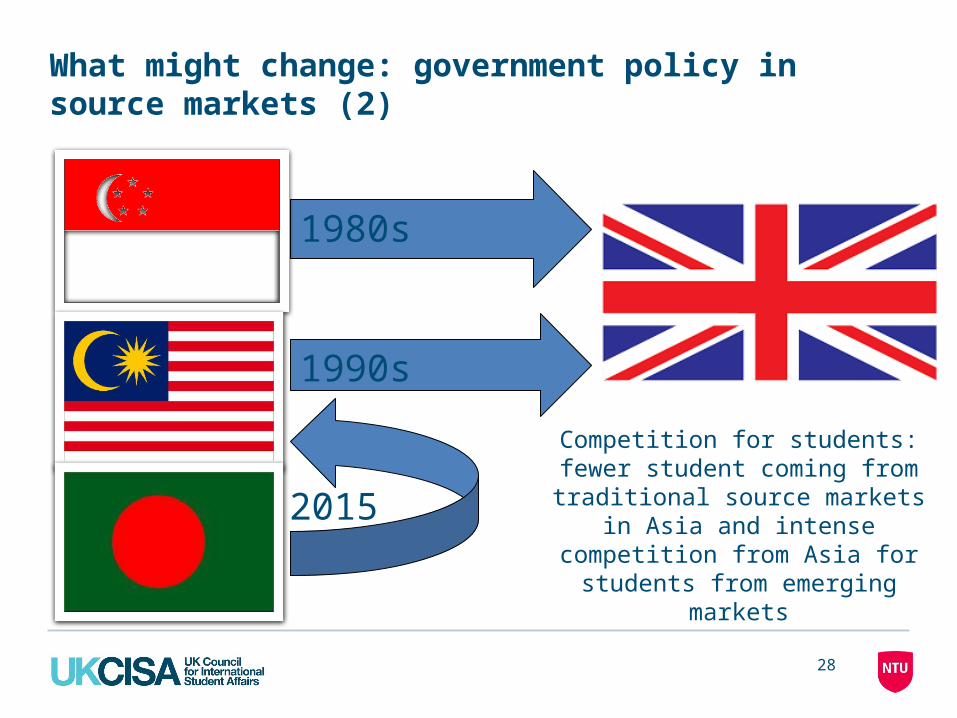
What might change: government policy in source markets (2)
1980s
1990s
Competition for students: fewer student coming from traditional
source markets in Asia and intense competition from Asia
for students from emerging markets
2015

29
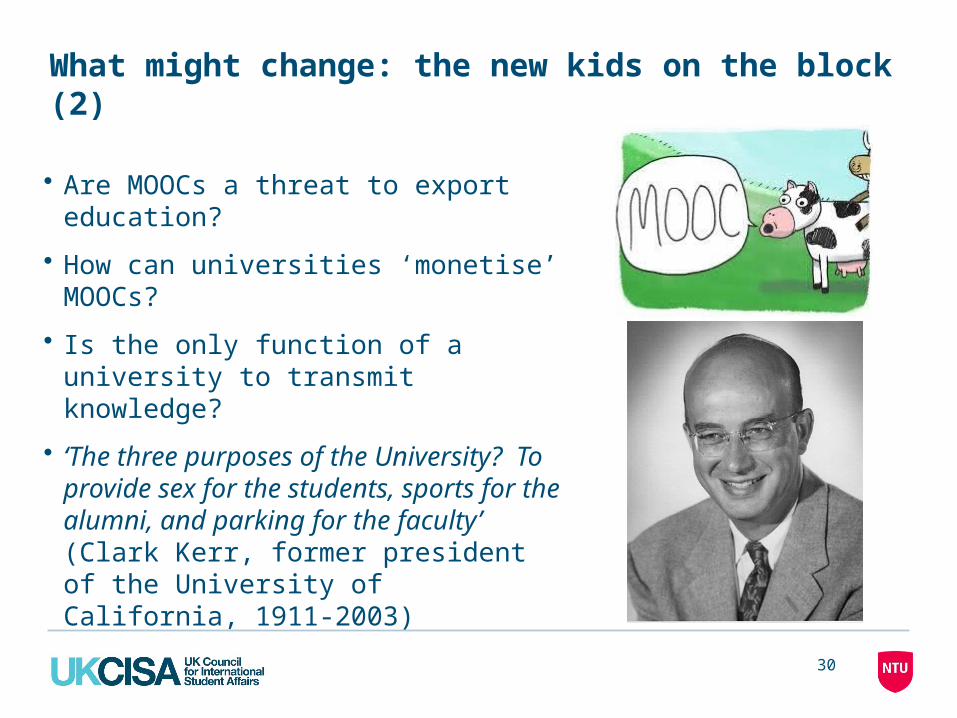
What might change: the new kids on the block (1)
Laureate International Universities
30
What might change: the new kids on the block (2)
• Are MOOCs a threat to export education?
• How can universities ‘monetise’ MOOCs?
• Is the only function of a university to transmit knowledge?
• ‘The three purposes of the University? To provide sex for the students, sports for the alumni, and parking for the faculty’ (Clark Kerr, former president of the University of California, 1911-2003)

31
What might change: our doppelgangers
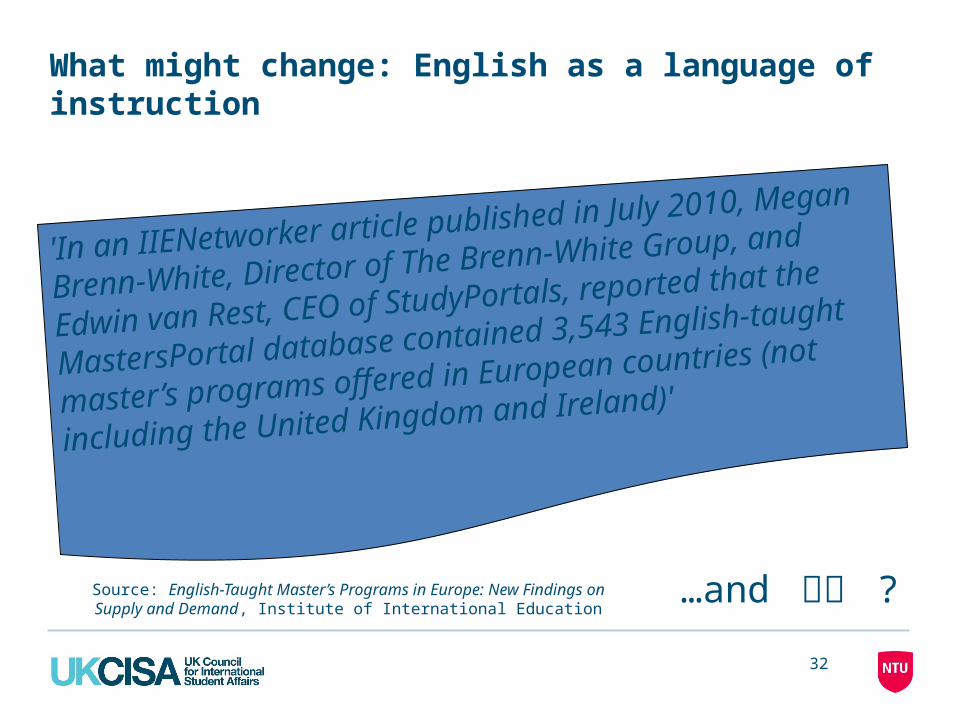
What might change: English as a language of instruction
32
'In an IIENetworker article published in July 2010,
Megan Brenn-White, Director of The Brenn-White
Group, and Edwin van Rest, CEO of StudyPortals,
reported that the MastersPortal database contained
3,543 English-taught master’s programs offered in
European countries (not including the United
Kingdom and Ireland)'
…and 官話 ?Source: English-Taught Master’s Programs in Europe: New Findings on Supply and Demand, Institute of International Education

33
What might change: post-study work rights…

34
…but our competitors are keen to attract and retain foreign students as skilled immigrants
Land mass km2
Population 2013
Pop./km2
2013
Australia 7,692,024 23,731,044 3.1
Canada 9,984,670 35,853,719 3.6
New Zealand 270,467 4,558,981 16.8
United Kingdom 242,910 64,105,700 262.0
United States 9,826,675 320,313,888 32.6
Source: United Nations

35
Conclusions
• In terms of international student recruitment and support, today’s focus is on student visas and the immigration debate
• UK continues to compete strongly for international students, although tier 4 visas have impacted the type of students recruited
• Taking a longer term view, there are much greater challenges on the horizon from demographics, changes in the geopolitical landscape and new sources of competition
'There are three kinds of companies: those who make
things happen, those who watch things happen and those
who wonder what’s happened'

36
For more information:
• E-mail: [email protected]
• Website: http://nottinghamtrent.academia.edu/NigelHealey
• Website includes conferences presentations, papers and resources on TNE developed for the Higher Education Academy