the biochemical impact of biochar in soil … s.m... · the biochemical impact of biochar in soil...
TRANSCRIPT

The Biochemical Impact of Biochar in Soil Environments
A thesis submitted to Newcastle University in partial fulfilment of the requirement for
the degree of Doctor of Philosophy (Integrated) in the Faculty of Science, Agriculture
and Engineering
Sani Mu’azu Makarfi
School of Civil Engineering and Geosciences
Newcastle University, UK
July, 2014

i
Declaration
Except where acknowledged, the content of this thesis is the work of the author. No
part of the material presented has been submitted previously for a degree or other
qualifications in this, or any other University anywhere.
Sani Mu’azu Makarfi
(July, 2014)

ii
Acknowledgement
All praise is due to Allah the designer of the universe and all that lies within and
beyond it. I must thank my supervisors for their valuable contributions towards the
success of my PhD research. Dr Neil Gray and Professor David Manning answered all
my questions regardless of how trivial they might have sounded. I must also thank my
third supervisor, Professor Mark Thomas for facilitating the provision of my first
biochar samples and also for his other important suggestions.
I also express my appreciation for the assistance received from Mr Bernie Bowler, Mr
Phil Green, Mr Stuart Patterson and Mrs Yvonne Hall. Mr Clive Barr of Moorbank
gardens also deserves my appreciation for his assistance. I must also acknowledge the
assistance and cooperation received from Miss Obioma Mejeha, Miss Emma Bell, Dr
Clare McCann and indeed all the members of Professor Ian Head’s group. They
succeeded in making microbiology appear a bit more comprehensible to me.
I thank the authorities of Kaduna State University, Nigeria for sponsoring my studies
through the Education Trust Fund (ETF). I must specifically express my appreciation for
the contributions of the former vice chancellor of Kaduna state university, Professor
Ezzeldine Abdurrahman, the late registrar, Dr S. Goje and Alhaji Rilwanu Abdussalam,
the former deputy librarian and ETF desk officer for their sincere support towards my
doctoral training.
I say thank you to the many wonderful Nigerians and other nationals I have interacted
with both in Newcastle and the rest of the UK. I also thank Noor, Kauthar, Nappaporn
(Gig) and Chris with whom I shared office in the university for their good company.
Finally, I must register my sincere gratitude to my trusted friend Umar Ishaq who
willingly ran all errands on my behalf back in Nigeria while I studied, my cousin Garba
Bala for his generous financial support, my loving wife Maryam (abar kaunata) for all
her support and prayers to me and also for managing the home front while I worked,
and to my mother Hajiya Hauwa’u for the care and special lifelong support she has
given me as dan auta (last born) and for her constant prayers for my success. May
Allah the most high reward them abundantly.
iii
Glossary ANOVA Analysis of variance
APS Ammonium per sulphate
ATR Attenuated total reflectance
BD Bulk density
BR Basal respiration
CEC Cation exchange capacity
DEA Denitrification enzyme activity
DGGE Denaturing gradient gel electrophoresis
DNA Deoxyribonucleic acid
DSC Differential scanning calorimetry
EDTA Ethylene diammine tetra-acetic acid
ess Edinburgh biochar produced from ≤10mm Sitka spruce wood chips
ess400 Edinburgh biochar produced at 400oC
ess600 Edinburgh biochar produced at 600oC
ess800 Edinburgh biochar produced at 800oC
FAO Food and agriculture organisation
FC Fixed carbon
FTIR Fourier-transform infrared
GC-MS Gas chromatography mass spectrometry
GHG Greenhouse gas
HTT Highest temperature of treatment
ibc Interreg biochar
IPCC Intergovernmental panel on climate change
Kbc800 Previous project biochar produced at 800oC
NH4-OAc Ammonium acetate
OM Organic matter
PAH Polycyclic aromatic hydrocarbons

iv
PCR Polymerase chain reaction
QMS Quadrupole mass spectrometry
qPCR Quantitative polymerase chain reaction
RNA Ribonucleic acid
rRNA Ribosomal RNA
SA Surface acidity
SB Surface basicity
SEM Scanning electron microscopy
SE Standard error
ss Lancashire biochar produced from ≤2mm saw dust of Sitka spruce wood
ss400 Lancashire biochar produced at 400oC
ss600 Lancashire biochar produced at 600oC
ss800 Lancashire biochar produced at 800oC
TAE Tris-acetate EDTA
TC Total carbon
TCE Trichloroethylene
TEMED N, N, N’, N’- tetramethylenediamine
TG Thermogravimetry
TG-DSC Thermogravimetry differential scanning calorimetry
TG-DSC-QMS Thermogravimetry differential scanning calorimetry and quadrupole mass
spectrometry
TGGE Temperature gradient gel electrophoresis
Tmax Maximum decomposition temperature in the course of pyrolysis
TOC Total organic carbon
UK United Kingdom
US United States
UV Ultraviolet
VM Volatile matter
WHC Water holding capacity

v
Abstract
Biochar, a product of thermochemical conversion of biomass, is a way to sequester
carbon and mitigate climate change, improve soil agronomic properties and enhance
crop production. However, such uses can only be valuable if the biochar does not
negatively impact on normal soil microbially mediated processes that are important to
soil health. The physical and biochemical characterization of biochar products is
therefore important. One of the two central factors that affect the physicochemical
properties of biochar is the production temperature (or highest temperature of
treatment, HTT); the other being nature of the feedstock.
A study of existing literature on biochar research reveals a lack of a systematic and
rigorous approach focused on individual feedstock or HTT. It is to fill this gap that this
study aimed to rigorously examine: the characteristics of biochar in a systematic way
that focusses on a single feedstock source while varying the HTT from two different
treatment facilities. It also aimed to assess the impact these biochars had on soil
properties to which they (biochars) were added. The specific objectives were:
to synthesize from the same feedstock six biochars, three from each of two different
production processes (Batch and Continuous) over a range of pyrolysis temperatures
and then subject the biochars to rigorous characterization;
to investigate the influence of the synthesized biochars on a range of soil processes,
and microbial diversities;
to assess how the addition of the synthesized biochars to two soil types affects the
physicochemical properties of the amended soil and influences plant growth.
Sitka Spruce (Picea sitchensis) wood was pyrolysed at 400, 600 and 800oC.
Experimental methods used included; titrimetric analyses, combined
thermogravimetry – differential scanning calorimetry – quadrupole mass spectrometry,
Fourier transform infrared spectroscopy and gas chromatography – mass spectrometry.
In order to assess the impact of the biochars on the soil environments, a fully
replicated and systematic plant growth trial was done. The post-harvest amended soils
were then used to measure soil processes and also determine microbial community
diversity against chosen controls.
vi
Results obtained from this study showed altered physicochemical properties of the
biochars (increases in pH and total organic carbon; decreases in cation exchange
capacity and water holding capacity), confirming the first hypothesis that biochemical
and physical properties of the biochar are systematically altered with increasing HTT.
However, there was very little difference between the properties of the biochars from
the different production processes indicating that uniformity can likely be predicted
based on HTT.
Biochar addition to soil enhanced its basal respiration rate in the low pH soil but
suppressed it in the near neutral soil, suppressed denitrification enzyme activity in the
near neutral soil and these effects were to some extent affected by HTT. Biochar
addition raised the total organic carbon content and lowered bulk density in both the
acid and near- neutral soils and also increased the pH in the acid soil but not in the
near neutral soil. The significant alteration of these soil properties was also influenced
by changing the HTT. Biochar addition also influenced leek growth compared to the
controls only in the acid soil. However, altering the biochar HTT had no significant
effect on leek growth in both soils.

i
Table of contents
Declaration ...................................................................................................................................... i
Acknowledgement ......................................................................................................................... ii
Glossary ......................................................................................................................................... iii
Abstract .......................................................................................................................................... v
List of Figures ................................................................................................................................ iv
List of Tables ................................................................................................................................... i
Chapter 1 Introduction .............................................................................................................. 1
1.1 Background ................................................................................................................... 1
1.1.1 Interest in biochar ................................................................................................. 2
1.1.2 Biochar and climate change .................................................................................. 3
1.1.3 Biochar and food security ..................................................................................... 5
1.2 Research gap and justification ...................................................................................... 5
1.3 Aims............................................................................................................................... 6
1.4 Objectives...................................................................................................................... 6
1.5 Thesis structure ............................................................................................................. 7
Chapter 2 Literature review ....................................................................................................... 9
2.1 Introduction .................................................................................................................. 9
Solid waste management ........................................................................................... 13 2.1.1
Fuels/Energy .............................................................................................................. 13 2.1.2
Sorption applications ................................................................................................. 15 2.1.3
Carbon sequestration/Greenhouse gas emissions .................................................... 16 2.1.4
Soil improvement/Plant growth ................................................................................ 17 2.1.5
Biochar and soil microbial systems ............................................................................ 19 2.1.6
Physico-chemical characterization of biochar ........................................................... 21 2.1.7
2.2 The research gap and justification .............................................................................. 22
Chapter 3 Materials and methods ........................................................................................... 24
Introduction ...................................................................................................................... 24 3.1
Biochar preparation and pre-treatment ........................................................................... 25 3.2
3.2.1 The feedstock ............................................................................................................. 25
Biochar production ........................................................................................................... 25 3.3
3.3.1 Biochar pre-treatment for use in soil amendment and other investigations ............ 26
Biochar recovery post-plant trial experiments ................................................................. 26 3.4
Physico-chemical characterization of the freshly produced biochar. ............................... 26 3.5
3.5.1 Proximate analysis on the biochar samples ............................................................... 26

ii
3.5.2 Thermal analysis of the raw wood, freshly produced biochar and soil samples. ...... 27
3.5.3 Biochar and soil pH determination ............................................................................ 28
3.5.4 Water holding capacity (WHC) for biochar and soil samples. ................................... 28
3.5.5 Fourier-transform infrared analysis of the biochar samples. .................................... 30
3.5.6 Surface acidity/basicity of the biochar. ..................................................................... 30
3.5.7 Elemental analysis of the CHN contents of the biochars. .......................................... 31
3.5.8 Analysis for total organic carbon (TOC) contents of the biochars and soils. ............. 31
3.5.9 Cation exchange capacity (CEC) for soil and biochar ................................................. 32
3.5.10 Scanning electron microscopy (SEM) ....................................................................... 32
Leek growth pot trials in soils amended with biochars .................................................... 33 3.6
3.6.1 Introduction ............................................................................................................... 33
3.6.2 Seeding leek to obtain seedlings for the pot experiment .......................................... 35
Soil process assays and molecular biological analysis ...................................................... 36 3.7
3.7.1 Basal respiration (BR) ................................................................................................. 36
3.7.2 Denitrification enzyme activity (DEA) ........................................................................ 38
3.7.3 Microbial community structure analysis using PCR-DGGE ........................................ 39
Statistical analyses ............................................................................................................ 41 3.8
Chapter 4 Characterization of the freshly synthesized biochars from the batch and
continuous processes .................................................................................................................. 43
Introduction ................................................................................................................ 43 4.1
Results ......................................................................................................................... 45 4.2
Proximate analysis of biochars from the two production processes .................. 45 4.2.1
Thermal analysis of biochars from the two production processes ..................... 47 4.2.2
Elemental and other chemical analyses .............................................................. 49 4.2.3
Fourier-transform infra-red (FT-IR) analysis ....................................................... 52 4.2.4
Discussion .................................................................................................................... 53 4.3
Proximate analysis .............................................................................................. 53 4.3.1
Thermal analysis.................................................................................................. 53 4.3.2
Elemental and other chemical analyses .............................................................. 56 4.3.3
FT-IR .................................................................................................................... 59 4.3.4
Conclusion ................................................................................................................... 61 4.4
Chapter 5 The impact of biochar amendments on plant growth and the physico-chemical
properties of amended soils. ...................................................................................................... 62
Introduction ...................................................................................................................... 62 5.1
Results ............................................................................................................................... 64 5.2
5.1.1 Impact on soil properties .................................................................................... 65
iii
5.2.2 Impact on leek growth ........................................................................................ 73
Discussion .......................................................................................................................... 78 5.3
5.3.1 Soil properties ..................................................................................................... 78
5.3.2 Leek growth................................................................................................................ 83
Conclusion ......................................................................................................................... 85 5.4
Chapter 6 Soil processes and soil microbial community structure as a function of biochar
amendment ……………………………………………………………………………………………………………………………86
: Introduction .................................................................................................................... 86 6.1
Results ............................................................................................................................... 88 6.2
6.2.1 Basal respiration (BR) .......................................................................................... 88
6.2.2 Denitrification enzyme activity (DEA) ................................................................. 93
6.2.3 Microbial community structure .......................................................................... 95
Discussion .......................................................................................................................... 97 6.3
6.3.1 Basal respiration ................................................................................................. 97
6.3.2 Denitrification enzyme activity ......................................................................... 101
6.3.3 Microbial community structure ........................................................................ 104
Conclusion ....................................................................................................................... 104 6.4
Chapter 7 General discussion ................................................................................................ 106
7.1 Introduction .............................................................................................................. 106
7.2 Trends in biochar properties with highest temperature of treatment ..................... 106
7.2.1 Proximate analysis ............................................................................................ 106
7.2.2 Physicochemical properties .............................................................................. 107
7.3 Pyrolysis temperature and the effect of biochar amendment on soil properties .... 111
7.4 The influence of pyrolysis temperature on how biochar amendment impacts on soil
processes and leek growth. .................................................................................................. 113
7.5 Influence of production process ............................................................................... 115
Chapter 8 General conclusions and recommended further work ......................................... 117
8.1 Conclusions ............................................................................................................... 117
8.2 Recommended further work .................................................................................... 120
References ................................................................................................................................ 121
iv
List of Figures
Figure 1.1 (a) Sitka spruce wood chips (right) and its biochar (left), (b) biochar products from
various feedstock sources such as rice husk, corn cobs, wheat straw, saw dust and chicken
manure. ......................................................................................................................................... 1
Figure 1.2 Google TrendsTM result of “biochar”, “Terra Preta” and “black earth” search for a 5-
year period. Adapted from Verheijen et al., (2009) ..................................................................... 3
Figure 1.3: Sectoral contributions to carbon dioxide emissions in the US (left) and the UK (right)
...................................................................................................................................................... 4
Figure 2.1: The various forms of pyrogenic carbon in the black carbon combustion continuum.
Adapted from Schimmelpfennig and Glaser (2012). .................................................................... 9
Figure 2.2: Manual oven (A) and Industrial pyrolysis unit (B) for Biochar production ............... 10
Figure 2.3 The chemical structure of wood-derived lignin. Adapted from Shen et al. (2010). .. 11
Figure 2.4 Lignin monomers: H-type, V-type, S-type and C-type phenols (Thevenot et al., 2010)
.................................................................................................................................................... 11
Figure 2.5: Scanning electron microscopy image of the fresh Sitka spruce biochar produced at
400oC (a) and structures in a Sitka spruce wood (b) taken from Moore (2011). ...................... 12
Figure 2.6: Relative output proportions from fast and slow pyrolysis processes. ..................... 14
Figure 2.7 Schematic diagrams of slow (A) and fast (B) Pyrolysers; Source: (Laird, 2009) ......... 14
Figure 2.8 Relationships between soil biota (inner circle), soil properties biochar may influence
(middle circle) and the properties of biochar (outer circle). Arrows show influence between
properties. Adapted from Lehmann et al (2011) ........................................................................ 20
Figure 3.1: Sitka spruce wood chips and saw dust processed to produce the biochars studied.25
Figure 3.2: Temperature programme and mass loss profiles for the proximate analysis of the
biochar samples. .................................................................................................................... 27
Figure 3.3: Coupled thermogravimetric, differential scanning calorimetric and quadrupole mass
spectrometry System .................................................................................................................. 27
Figure 3.4: Thermo Scientific NICOLET 6700 Fourier-transform infrared spectrometer ............ 30
Figure 3.5: Carlo Erba 1108 elemental analyser ......................................................................... 31
Figure 3.6: Leco CS244 Carbon/Sulphur analyser ....................................................................... 31
Figure 3.7: Environmental scanning electron microscope .......................................................... 32
Figure 3.8 Leek seedlings in a growth chamber .......................................................................... 35
Figure 3.9 Potted Leeks in the near-neutral soil. ........................................................................ 35
Figure 3.10: Fisons Gas chromatograph-mass spectrometer ..................................................... 37
Figure 3.11: Polymerase chain reaction thermal cycler ............................................................. 39
Figure 3.12: INGENY denaturing gradient gel electrophoresis tank ........................................... 40
Figure 4.1: Biochar samples from continuous process (ess) and their temperature of production
.................................................................................................................................................... 45
Figure 4.2: Correlation between fixed carbon (filled triangle), volatile matter (empty triangle)
and pyrolysis temperature for the ess biochar. .......................................................................... 46
Figure 4.3: Correlation between fixed carbon and volatile matter contents of the fresh biochar
samples. ...................................................................................................................................... 47
Figure 4.4: Stacked thermal gravimetry plot for Lancashire (a) biochar with raw wood and
Edinburgh (b) biochar ................................................................................................................. 48
Figure 4.5: Stacked differential scanning calorimetry plot for Lancashire (a) biochar with raw
wood and Edinburgh (b) biochar ................................................................................................ 49

v
Figure 4.6: Correlation between highest temperature of treatment and maximum temperature
of decomposition. ....................................................................................................................... 49
Figure 4.7: Correlation between total carbon and total organic carbon for the biochar ........... 51
Figure 4.8: Fourier-transform infrared spectral traces for the ss (similar to that for ess) biochar.
.................................................................................................................................................... 52
Figure 4.9: Correlation between aromatic character and highest temperature of decomposition
(Tmax) for the fresh biochars...................................................................................................... 55
Figure 4.10: Correlations between aromatic character, highest temperature of decomposition
(Tmax) and highest temperature of treatment (HTT) for the biochars. ...................................... 55
Figure 4.11: Correlations between highest temperature of treatment versus hydrogen; and
cation exchange capacity for the biochars under investigation. ................................................ 57
Figure 5.1: Potted leek plants in the greenhouse ....................................................................... 63
Figure 5.2: Impact of ibc and kbc800 biochars on the pH of the acid soil used in the pilot
experiment. The initial numbers in the sample codes represent weight percent of added
biochar. Error bars represent ±SE of the means. ........................................................................ 66
Figure 5.3: Impact of different levels of amendments using biochar at the different highest
temperature of treatments on soil pH for (a) low pH and (b) near-neutral soils. Error bars
represent ±SE of the means. ....................................................................................................... 66
Figure 5.4: Impact of ibc and kbc800 biochars on the total organic carbon contents of the acid
soil used in the pilot experiment. The initial numbers in the sample codes represent weight
percent of added biochar. Error bars represent ±SE of the means. ........................................... 69
Figure 5.5: Impact of the different biochars used at different amendment levels on the total
organic carbon contents of (a) the low pH soil and (b) the near-neutral soil. Error bars
represent ±SE of the means. ....................................................................................................... 69
Figure 5.6: Impact of the different biochars at 5% amendment rate on the bulk density of (a)
the low pH soil and (b) the near- neutral soil. Error bars represent ±SE. ............................. 70
Figure 5.7: Percentage increase in cation exchange capacity for the ss amended low pH soils
over the control. Error bars represent ±SE of the mean. ........................................................... 71
Figure 5.8: Impact of the different levels of biochar amendments on the water holding capacity
of the low pH soils from the pilot experiment. Error bars represent ±SE of the mean and those
not visible have too small values. ............................................................................................... 72
Figure 5.9: Impact of the different levels of biochar amendments on the water holding
capacity of the (a) low pH and (b) near-neutral soils. ................................................................ 72
Figure 5.10: Leek growth rates in the pilot experiment. The acid soil was amended with the
interreg (ibc) and previous project (kbc800) biochars. Error bars represent ±SE of the means. 73
Figure 5.11 Leek growth rates in (a) the acid soil amended with Sitka spruce (ss) biochar and (b)
the near-neutral soil amended with Edinburgh Sitka spruce (ess) biochar. ............................... 74
Figure 5.12 Leek growth rates at 5% ss amendment in the two soils ........................................ 75
Figure 5.13: Leek growth rates at 5% ss and ess amendments in the near neutral soil ............. 76
Figure 5.14: Relationship between total organic carbon (TOC) and water holding capacity (WHC)
for the amended acid soil from the pilot experiment. ............................................................... 82
Figure 5.15: Relationship between total organic carbon (TOC) and water holding capacity (WHC)
for the ss biochar used to amend the acid soil in both the pilot and first experiments. ........... 82
Figure 6.1: Rates of carbon dioxide production in the pilot experiment. Rates determined after
subtracting carbon dioxide emissions due to biochar. Control was the unamended soil. Error
bars (±SE) too small to be seen on plots. .................................................................................... 90

vi
Figure 6.2: Rates of carbon dioxide evolved from ss biochar amended low pH soil. Data points
represent means ± standard error (n=3). Unseen error bars due to small values of the standard
errors. Rates were calculated as explained in chapter 3, section 3.7.1. Control is the
unamended soil........................................................................................................................... 92
Figure 6.3: Rates of carbon dioxide evolved from ess biochar amended near-neutral soil. Data
points represent mean ±standard error (n=3). Unseen error bars due to small values of the
standard errors. 1ess400 means soil amended with 1% ess400 biochar. Control is the
unamended soil........................................................................................................................... 93
Figure 6.4: Rates of headspace nitrous oxide production in microcosms of ibc and kbc800
amended acid soils from the pilot experiment. There were no detectable nitrous oxide
emissions from both the biochar and unamended controls. Error bars (±SE) too small to be
seen on plots. .............................................................................................................................. 94
Figure 6.5: Rates of headspace nitrous oxide evolved from microcosms of ess biochar amended
near-neutral soil. Error bars representing standard error of the mean (n=3) are not visible on
the bars due to small values of the standard errors (order of 10-5). .......................................... 94
Figure 6.6: Denaturing gradient gel electrophoresis profile for the ss biochar amended soil
samples and controls. The banding patterns 1 and 2 represent unamended controls at time
zero for the ss400 and ss600 amended soils respectively while ss4, ss6 and ss8 represent the
ss400, ss600 and ss800 amended soil samples after 12 weeks of running the plant trials
respectively. The symbol ‘M’ represents the marker. ................................................................ 96
Figure 6.7: Denaturing gradient gel electrophoresis profile for the ess biochar amended soil
samples and controls. The banding patterns C0 and C12 represent unamended controls at the
beginning and after 12 weeks while es4, es6 and es8 represent the ess400, ess600 and ess800
amended soil samples after 12 weeks of running the plant trials respectively. The symbol ‘M’
represents the marker. ............................................................................................................... 96
Figure 6.8: Scanning electron microscope image (x2500) showing putatively microbial cells
within Sitka spruce biochar prepared at 400oC recovered from pot soil. .................................. 97
Figure 6.9: Correlation plots of carbon dioxide rate of production in µg CO2/g soil/hour with (a)
pH and (b) total organic carbon in the amended acid soils of the pilot experiment .................. 99
Figure 6.10: Correlation plots of carbon dioxide rate of production with (a) pH and (b) total
organic carbon in the amended near neutral soils of the second experiment. ....................... 100
Figure 6.11: Correlation plots of nitrous oxide rate of production in µg N2O/g soil/hour with (a)
pH and (b) total organic carbon in the amended acid soils of the pilot experiment. ............... 101
Figure 6.12: Correlation plots of nitrous oxide rate of production in µg N2O/g soil/hour with (a)
pH and (b) total organic carbon in the amended near neutral soils of the second experiment.
.................................................................................................................................................. 102
Figure 7.1: Trends of changes in proximate analysis results for the fresh biochar with highest
temperature of treatment. ....................................................................................................... 107
Figure 7.2: Trends of changes in the physicochemical properties of the fresh biochars with
highest temperature of treatment. .......................................................................................... 108
Figure 7.3: Trends of changes in the physicochemical properties of the fresh biochars with
pyrolysis temperature. .............................................................................................................. 110
Figure 7.4: Influence of biochar pyrolysis temperature on the trends of properties change in
the amended soils. Symbols represent soils amended at 5% level with the indicated
biochar (ss or ess) produced at indicated temperature (400, 600 or 800oC). The ss biochar was

vii
used to amend the low pH sandy soil while the ess biochar was used to amend the near
neutral loamy/clayey soil. Error bars are ±SE. ....................................................................... 112
Figure 7.5: Influence of changes in highest temperature of treatment on the impact of biochar
amendment on the rate of soil carbon dioxide emissions. Error bars (±SE) are not discernible
due to the small values of the standard error. ......................................................................... 113
Figure 7.6: Influence of changes in highest temperature of treatment on the impact of biochar
amendment on the rate of soil nitrous oxide emissions. Error bars (±SE) are not discernible due
to the small values of the standard error. ................................................................................ 114
Figure 7.7: Influence of changes in highest temperature of treatment on the impact of biochar
amendment on the rate of leek growth. Error bars represent ±SE. ......................................... 114
i
List of Tables
Table 2.1 Crop yield responses from biochar applications (Source: Chan and Xu, 2009) .......... 19
Table 3.1: Sources, types and other details of biochars and soils analysed and used for
experiments ................................................................................................................................ 24
Table 3.2 Details on the pilot and the two main pot experiments established in a greenhouse
within the indicated periods of time. ......................................................................................... 34
Table 3.3: Biochar sample codes and their meanings ................................................................ 34
Table 4.1: Proximate analysis results for the fresh biochar samples .......................................... 46
Table 4.2: Thermal gravimetry parameters and estimated proportions (%) of thermally
unstable components of the biochars at pyrolysis temperature intervals ................................. 48
Table 4.3: Differential scanning calorimetry parameters and temperature range of peaks and
their maximum temperatures (Tmax) ........................................................................................... 48
Table 4.4: Elemental composition and chemical characteristics for the fresh biochars ............ 51
Table 4.5: Main functional groups assignment for the recorded Fourier-transform infrared
spectral bands of the biochars (Chen and Chen, 2009; Cheng et al., 2006; Shen et al., 2010;
Yang et al., 2007; Zhao et al., 2013). ........................................................................................... 52
Table 5.1: Summary of the investigated agronomic properties of the amended soils. The sandy
acid soil was amended with ss biochar and the loamy/clayey was amended with ess biochar. 65
Table 5.2: Analysis of variance results comparing p values between controls and factors
(amendment level and highest temperature of treatment) for the amended soil properties
investigated. ................................................................................................................................ 67
Table 5.3: Analysis of variance results comparing p values within factors (Amendment levels
and highest temperature of treatment) for the amended soil properties investigated. ........... 68
Table 6.1: Analysis of variance results comparing unamended controls with factors
(amendment level and highest temperature of treatment) for rates of carbon dioxide and
nitrous oxide production from biochar amended soil microcosms. ........................................... 91
Table 6.2: Analysis of variance results comparing factors (amendment level and highest
temperature of treatment) for their influence on rates of carbon dioxide and nitrous oxide
production from biochar amended soil microcosms. ................................................................. 91
Table 6.3: Mean rates of carbon dioxide production from the biochar amended soils and
unamended controls. Low pH sandy soil was used in the pilot and first experiments, while near
neutral loamy/clayey soil was used in the second experiment. ................................................. 98
Table 7.1 Biochar Production Process Conditions .................................................................... 115

1
Chapter 1 Introduction
1.1 Background
The term ‘Biochar’ is applied to the solid product of the thermal decomposition of
biomass in oxygen-limited environment (Mašek et al., 2013; Wang et al., 2013b) and is
classed under the wider term ‘black carbon’ which simply refers to the product of
burnt biomass (Ascough et al., 2011). These materials actually represent a continuum
embracing the carbon-rich products of incomplete biomass combustion with no agreed
clear-cut boundaries between products (Bird et al., 2008). The products of burning
range from slightly charred biomass produced at low combustion temperatures
through to char, charcoal, soot and graphitised black carbon which are formed at
progressively higher temperatures (Masiello, 2004).
Figure 1.1 (a) Sitka spruce wood chips (right) and its biochar (left), (b) biochar products from various feedstock sources such as rice husk, corn cobs, wheat straw, saw dust and chicken manure.
Source for (b): carbon-negative US
a
b

2
Biochar has variously been referred to as ‘charcoal’ (Glaser et al., 2002; Bell and
Worrall, 2011), ‘char’ (Chun et al., 2004), ‘agrichar’ (Lehmann and Joseph, 2009a),
‘carbonized biomass’ (Ogawa et al., 2006) or even ‘carbonaceous material’ (Gartler et
al., 2013). These names and their variety depend on the context under which they are
defined. However, a general definition that seems to be gaining acceptance is one that
defines biochar as the carbon-rich product of biomass decomposition during pyrolysis,
that is produced and applied to soil with the intention of improving fertility (Lehmann
and Joseph, 2009b; Verheijen et al., 2009; Enders et al., 2012). Technically, the
definition mentions the ‘limited’ or ‘no-oxygen’ conditions under which biochar is
produced (Lehmann and Joseph, 2009a; Wang et al., 2013b) at temperatures below
700oC (Lehmann and Joseph, 2009a; Taghizadeh-Toosi et al., 2011). Though, other
authors differ on this temperature ceiling (Wang et al., 2013b) and go on to suggest a
maximum pyrolysis temperature of 700oC to optimise some properties of crop straw
biochar.
1.1.1 Interest in biochar
There has been a surging interest in biochar research in the last decade primarily due
to reports of its potential uses in agriculture (based on the known property of the
Amazonian terra preta soils on which crops grow better compared to surrounding
soils), climate change mitigation, other environmental applications such as polluted
land remediation and as a tool for organic solid waste management/disposal. The ‘bio’
in ‘biochar’ differentiates it from charred materials from non-biological sources such as
plastics (Lehmann and Joseph, 2009a). Verheijen et al. (2009), provided an illustration
of the growing interest in ‘biochar’ compared to the terms ‘terra preta’ and ‘black
earth’ using a Google trends search result for a 5-year period (figure 1.2)

3
Figure 1.2 Google TrendsTM
result of “biochar”, “Terra Preta” and “black earth” search for a 5-year period. Adapted from Verheijen et al., (2009)
1.1.2 Biochar and climate change
For the average temperature of the Earth to remain stable over long periods of time,
incoming energy in form of solar radiation from space have to be equal to outgoing
energy radiated from the Earth’s surface as thermal infrared back to space
(http://earthobservatory.nasa.gov/Features/EnergyBalance/page6.php, accessed on
31/07/14) . The Earth is kept warm because greenhouse gases (GHG), mainly water
vapour and carbon dioxide (CO2), trap the outgoing heat energy. This is the so called
natural greenhouse effect. Other major GHG are methane (CH4) and nitrous oxide (N2O)
(Solomon et al., 2007). Referring to a report by the Intergovernmental Panel on
Climate Change (IPCC), Steinbeiss et al. (2009) mentioned increases in atmospheric
CO2 at a yearly rate equivalent to 4.1 x 10⁹ t of C. The concentration of CO2 which is the
primary greenhouse gas in the atmosphere is increased by human activities in the form
of fossil fuel combustion and deforestation. For example in 2011 CO2 amounted
to of all GHG emission in the S, with electricity generation and transportation
as the biggest contributors; similarly in the UK, 2012 estimates show CO2 amounting to
about 82% of all GHG emissions again with energy supply and transport contributing
the most (Figure 1.3).

4
Figure 1.3: Sectoral contributions to carbon dioxide emissions in the US (left) and the UK (right)
Sources: http://www.epa.gov/climatechange/ghgemissions/gases/co2.html, accessed on 31/12/2013 and https://www.gov.uk/government/publications/final-uk-emissions-estimates, accessed on 25/03/2014.
This increase in amounts of CO2 in the atmosphere raises the average global
temperature unleashing a chain of events (Climate Change): melting snow and ice
cover; raising water levels in oceans; flooding coastal areas; exposed darker areas
under snow and ice absorbing more solar radiation further heating the Earth; and
extreme weather scenarios (heavy rains and droughts). Hence, mitigating climate
change primarily should involve the removal of the excess CO2 out of the atmosphere
into a more stable sink or reservoir.
This is where biochar comes in as a channel through which the C in CO2 can be
‘captured’ in biochar and ‘sequestered’ or stored in soil (Bell and Worrall, 2011).
Ogawa et al. (2006), reported a 35-year project on Eucalyptus plantation management
that could sequester CO2 equivalent to over 1 million t , about 5 of which will be in
the form of biochar produced from the wood residues. ther authors reported the
possibility of adding large amounts of biochar 0 t/ha to soil without detrimental
effects to crop yield (Vaccari et al., 2011). Carbon sequestration using biochar has
potential with multiple advantages of long term C storage (biochar is recalcitrant) and,
soil quality improvement (agronomic value), and provides a good way to manage plant
and animal waste. Otherwise, such waste is left to decompose in the natural way
releasing in the process more green-houses gases to the atmosphere (CO2 in aerobic

5
decomposition and CH4 in anaerobic decomposition). Biochar-amended soils have also
been reported as showing suppressed GHG emissions (Spokas et al., 2009; Yaghoubi
and Reddy, 2011; Yoo and Kang, 2012; Harter et al., 2013). This adds to the climate
change mitigating credentials of biochar.
1.1.3 Biochar and food security
A publication of the Food and Agriculture Organisation (FAO) of the United Nations
counsels on the need to increase agricultural production by as much as 60% in the next
four decades in order to cope with a 39% rise in world population (FAO, 2012). With
such projected growth in world population coupled with dwindling arable land
resources, restoring fertility to degraded soils is vital to enhanced global food security
(Spokas et al., 2012). Biochar has the potential to contribute in achieving this goal
through improved soil physico-chemical properties that result in enhanced fertility.
Though biochar has only limited direct nutrient value (Asai et al., 2009; Chan and Xu,
2009; Sukartono et al., 2011), it indirectly increases fertility through improved
fertiliser-use efficiency (Chan and Xu, 2009; Hossain et al., 2010; Sohi et al., 2010). It
does this by enhancing properties like cation exchange capacities (CEC) of amended
soils which help in retaining nutrients and making them available to plants (Sanchez et
al., 2009). Other properties that improve productivity include increased organic carbon
contents of soils (Sukartono et al., 2011; Gartler et al., 2013), lower bulk density
(Vaccari et al., 2011), ameliorating soil acidity (Masahide et al., 2006; Hossain et al.,
2010), and plant water availability (Masahide et al., 2006; Van Zwieten et al., 2010).
1.2 Research gap and justification
The literature survey done and reported in the next chapter revealed many studies and
reports on biochar lacking in rigor and systematic approach. This gap is evident in the
way biochars from so many feedstock sources produced at many different pyrolysis
temperature values are studied together, using various types of procedures and
reporting in different units. Hence, repeating procedures, comparing results and most
importantly identifying individual biochar suitability for specific applications (such as
its impact on soil environments) based on its properties become difficult. It also
reflects a general lack of a standard for biochar characterization and documentation
(Spokas et al., 2012).

6
The research work undertaken and reported in this thesis was therefore intended to
contribute in filling this gap. To achieve that, a multidisciplinary approach was adopted
with the objectives of assessing the biochemical and agronomic impact of the
synthesized biochars on soil environment and plant growth. The approach fixes one of
the most important factors affecting biochar properties (feedstock) and varying
another (the pyrolysis temperature). The multidisciplinary approach involves a detailed
physico-chemical characterization of the biochars, using them in a fully replicated
experimental plant growth trials for agronomic impact assessment followed by
biochemical study of soil processes and molecular biological determination of
microbial diversity. An extended presentation of this section is at the end of Chapter 2.
1.3 Aims
To produce and characterize different biochars from a single feedstock based
on different production processes.
To measure their impact on the biochemical and agronomic properties of the
soil environments.
1.4 Objectives
The objectives this research project set out to achieve and test the accompanying
hypotheses were:
Objective 1: Biochar synthesis and characterization
Synthesize from the same feedstock a set of six biochars, three from each of two
different production processes (Batch and Continuous) over a range of pyrolysis
temperatures (400, 600 and 800oC) and then rigorously subject the biochars to a range
of biochemical and physical characterization.
Hypothesis 1: Biological, chemical and physical properties of the biochar such
as fixed carbon, pH, functional group chemistry, water holding and cation
exchange capacities, are altered with increasing pyrolysis temperature.
Hypothesis 2: The biological and physico-chemical properties of biochars are
altered differently based on the production process used.

7
Objective 2: Biochemical impact of biochar in the soil environment
Investigate and compare the influence of biochars synthesized at different
temperatures from different production processes on a range of soil processes, and
microbial diversities relative to chosen controls.
Hypothesis 3: Increasing pyrolysis temperature progressively alters biochar’s
ability to influence the selection of resultant microbial communities and
microbial mediated processes e.g. respiration, and nitrogen cycling in soil
environments.
Objective 3: Impact of biochar amendment on the agronomic properties of
the soil environment
Assess how the addition of biochar produced at different pyrolysis temperature from
different production processes to two soil types (low and near-neutral pH) affects the
physicochemical properties of the amended soil and influence plant growth in both
soils compared to unamended control. To achieve this objective, controlled fully
replicated pot experiments were conducted in a greenhouse using Leek (Allium porrum)
as test plant. The biochar was applied to the test soils at three amendment rates; 1, 5
and 10% w/w equivalent to 10, 50 and 100 t/ha.
Hypothesis 4: Different biochar pyrolysis temperatures and their application
rates will significantly alter the pH, total organic carbon (TOC) contents, bulk
density (BD) water holding (WHC), and cation exchange capacities (CEC) of
soils to which the biochar was added.
Hypothesis 5: Different biochar pyrolysis temperatures and their application
rates influence biochar’s ability to impact on the growth rate of leek plant in
amended soils compared to control soils.
1.5 Thesis structure
Eight chapters are presented in this thesis. Introductory notes, aims, objectives and
research hypotheses are given in Chapter 1. Chapter 2 presents a review of the
literature on research work around biochar; its production, properties, applications
and impacts in areas such as agriculture and climate change mitigation. A fuller and

8
clearer research gap and thus justification for this research work emerge at the end of
Chapter 2.
The methodologies adopted and equipment used in measuring the biochemical and
agronomic parameters studied are presented in Chapter 3. This chapter also gives
details of sample sourcing, the pre-pyrolysis handling of the Sitka spruce wood chips,
and the pot experiment design that includes growing the leek seedlings and then
establishing them in the amended soils in the pots. Results for the fresh biochar
characterization are presented and discussed in Chapter 4; a similar format is followed
for the agronomic properties of the amended soil and its impact on leek growth in
Chapter 5. The results for microbial studies consisting of microbial mediated soil
processes and microbial community diversity are presented and discussed in Chapter 6.
Each of the three Chapters (4, 5 & 6) is ended with a conclusion.
Chapter 7 gives an overall discussion centered on the trend of changes in the various
measured parameters with the main variable in this study, the pyrolysis temperature
and also with the biochar amendment rates. Chapter 8 is the final chapter of this thesis
and hence contains the overall conclusions with some recommendations on future
work that could be done to further enhance documented scientific information on the
samples studied in this research project.

9
Chapter 2 Literature review
2.1 Introduction
The definition of biochar is somewhat fluid depending on the intent for its production.
The names char and activated carbon are preferred in fuel/energy and sorption
applications, while the broader term of black carbon is used in soil science/carbon
sequestration discussions. Figure 2.1 adapted from Schimmelpfennig and Glaser (2012)
depicts the various forms of pyrogenic carbon within the black carbon continuum.
Figure 2.1: The various forms of pyrogenic carbon in the black carbon combustion continuum. Adapted from Schimmelpfennig and Glaser (2012).
It could therefore be inferred that while all biochar is black carbon, not all black carbon
is biochar (Spokas et al., 2012). Based on intended use, a recent publication defines
‘biochar’ as charred organic matter that is deliberately produced and applied to soil
with the aim of improving soil properties (Lehmann and Joseph, 2009a). What relates
all these terms is the fact that all are used to refer to the solid residue of partial
10
A B
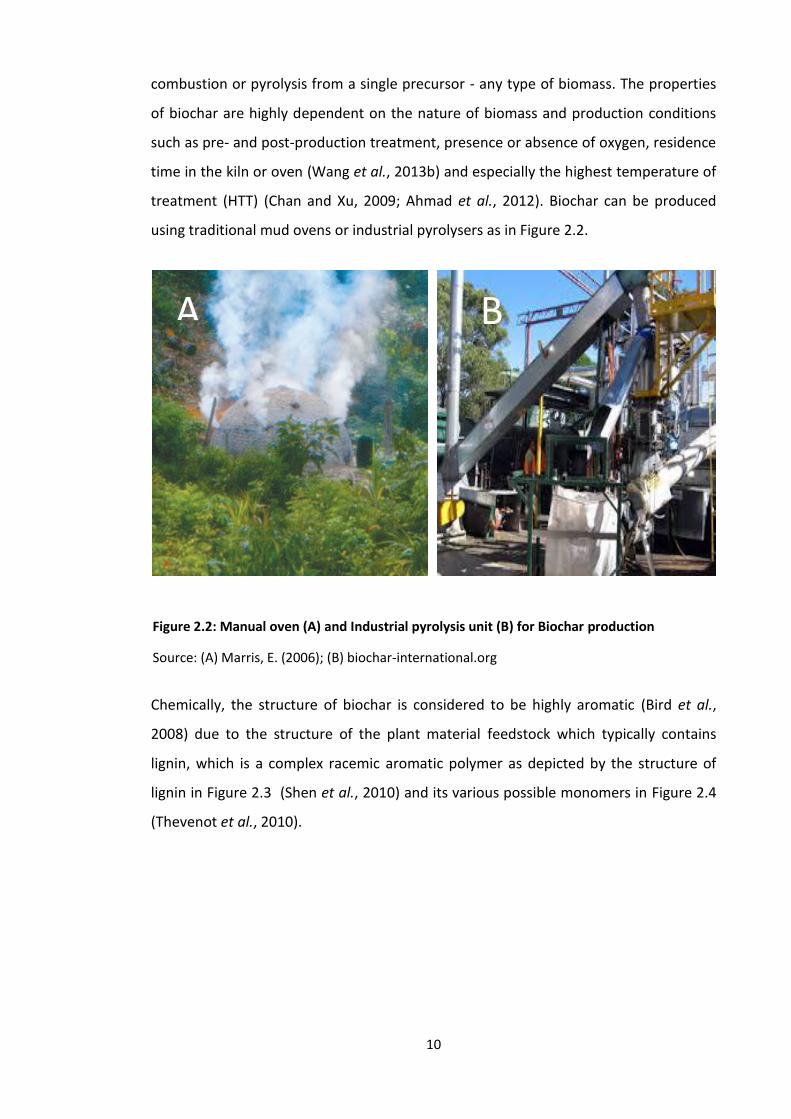
combustion or pyrolysis from a single precursor - any type of biomass. The properties
of biochar are highly dependent on the nature of biomass and production conditions
such as pre- and post-production treatment, presence or absence of oxygen, residence
time in the kiln or oven (Wang et al., 2013b) and especially the highest temperature of
treatment (HTT) (Chan and Xu, 2009; Ahmad et al., 2012). Biochar can be produced
using traditional mud ovens or industrial pyrolysers as in Figure 2.2.
Chemically, the structure of biochar is considered to be highly aromatic (Bird et al.,
2008) due to the structure of the plant material feedstock which typically contains
lignin, which is a complex racemic aromatic polymer as depicted by the structure of
lignin in Figure 2.3 (Shen et al., 2010) and its various possible monomers in Figure 2.4
(Thevenot et al., 2010).
Figure 2.2: Manual oven (A) and Industrial pyrolysis unit (B) for Biochar production
Source: (A) Marris, E. (2006); (B) biochar-international.org

11
Figure 2.3 The chemical structure of wood-derived lignin. Adapted from Shen et al. (2010).
Figure 2.4 Lignin monomers: H-type, V-type, S-type and C-type phenols (Thevenot et al., 2010)

12
Figure 2.5: Scanning electron microscopy image of the fresh Sitka spruce biochar produced at 400oC (a)
and structures in a Sitka spruce wood (b) taken from Moore (2011).
At low pyrolysis temperatures (400oC) the biochar in this study (Figure 2.5a) retained
some of the annual ring structures of a Sitka spruce wood as recorded in Figure 2.5b
(Moore, 2011). These porous structures could be conduits for the flow of nutrient-
containing soil solutions and could also serve as havens for soil microbes (Bird et al.,
2008).
Research work around biochar is said to be motivated by four themes: soil
improvement, climate change mitigation, energy production and waste (solid)
management (Lehmann and Joseph, 2009a). These topics have recently received the
attention of researchers but to varying extents. However, it should be noted that the
motivations for production and usages of biochar are sometimes mutually exclusive
(such as when biochar simply results as an insignificant end product in the production
of bio-oil) while some are mutually inclusive (such as when biochar is produced to
serve as a soil improver as well as a way to sequester carbon). This literature review
will discuss these different research themes under the following headings that also
include physico-chemical characterization since all potential applications to which
biochar could be deployed will depend on its physico-chemical properties:
1. Solid waste management.
2. Fuels/Energy.
3. Sorption applications.
4. Carbon sequestration/Greenhouse gas emissions.
a b

13
5. Agronomic impact (Soil improvement/Plant growth).
6. Biochar and soil microbial systems.
7. Physico-chemical Characterization.
Solid waste management 2.1.1
Biochar production and deployment to soil (see 2.1.5) is seen as a very positive way of
managing both animal, crop and other agricultural wastes that would otherwise be
dumped in open-air sites or landfills and constitute sources of both surface and
groundwater pollution (Lehmann and Joseph, 2009a). This understanding has led to
lots of efforts towards producing biochar from coconut shells (Amuda et al., 2007), saw
dust (Sun and Zhou, 2008), rice and wheat straw (Qiu et al., 2009), orange peels (Chen
and Chen, 2009), bagasse (Inyang et al., 2010), poultry litter (Uchimiya et al., 2010),
waste water sludge (Hossain et al., 2011), rice husk (Enders et al., 2012), and various
types of wood (Titiladunayo et al., 2012; Liu and Balasubramanian, 2013; Mukherjee
and Zimmerman, 2013).
Fuels/Energy 2.1.2
The production of bio-fuels involves pyrolyzing biomass at high temperature to obtain
liquid fuel, gaseous fuel in the form of syngas (a mixture of CO, H2 and some CO2) and a
solid carbon-rich residue (biochar). Most studies on energy from biomass (Ozcimen
and Karaosmanoglu, 2004; Ozcimen and Ersoy-Mericboyu, 2008; Grierson et al., 2009;
Sanchez et al., 2009; Agblevor et al., 2010), focus heavily on maximizing bio-oil and
syngas production. Hence, pyrolysis design has been geared towards minimal
production of char as it is considered a low value waste product (Sohi et al., 2010;
Montanarella and Lugato, 2013) and consequently the little biochar produced is
sometimes gasified (Melchior et al., 2009), or assessed based on its heating value
(Agblevor et al., 2010) rather than any agronomic value. An important finding from
these energy studies that relate to biochar production is that slow pyrolysis (low
temperature and low heating rate) is noted to maximize biochar yield (Demirbas, 2004)
while fast pyrolysis maximizes bio-oil/syngas output as Figure 2.6 illustrates. Figure 2.7
shows the schematic outlines of the two processes.

14
Figure 2.6: Relative output proportions from fast and slow pyrolysis processes.
Regardless of the yield of biofuel obtained from pyrolysis of biomass, biochar itself has
been identified as a combustible fuel (Laird et al., 2009), albeit a solid one with a heat
energy content of about 20 MJ/Kg. However, other workers have reported higher
calorific values for biochar; 25.3 MJ/Kg for biochar from rapeseed cake (Ozcimen and
Karaosmanoglu, 2004), 25.96 MJ/Kg and 32.62 MJ/Kg for biochar from coconut fibre
A B
Figure 2.7 Schematic diagrams of slow (A) and fast (B) Pyrolysers; Source: (Laird, 2009)

15
and pine wood respectively (Liu and Balasubramanian, 2013). Such high calorific values
(>20MJ/Kg) satisfy the generally held opinion for a solid fuel to ensure auto-thermal
combustion (Liu et al., 2012), and this calorific yield is consistent with low moisture
and fixed-carbon content (Ozcimen and Ersoy-Mericboyu, 2008), low ash and oxygen
content (Sanchez et al., 2009). Titiladunayo et al. (2012), concluded that the negligible
sulfur content of some hard wood biochar is a characteristic that makes this biochar
environmentally friendly in terms of SOx emissions.
Sorption applications 2.1.3
Activated carbon, made from carbon-rich biomass (Kalderis et al., 2008) is used
industrially as an adsorbent or filter for various volatile organic compounds (Fletcher et
al., 2007) and heavy metals (Amuda et al., 2007). This is due to its very large surface
area coupled with proper micro-porous structure, two properties that are also found
in biochar (Qiu et al., 2009). Thus, there is a growing interest in deploying biochar as a
cost-effective adsorbent in place of activated carbon for organic compounds like dyes
(Qiu et al., 2009), polycyclic aromatic hydrocarbons (Chen and Chen, 2009; Beesley et
al., 2010), pesticides (Spokas et al., 2009; Yu et al., 2009) and heavy metals like arsenic
(Hartley et al., 2009), chromium (Wang et al.), copper (Uchimiya et al., 2011) and lead
(Liu and Zhang, 2009; Namgay et al., 2010). Qiu et al. (2008), found Pb(II) adsorption to
be higher in rice straw- and wheat straw-derived biochar than in commercial activated
carbon. Biochar may also remove odorants from air (Laird et al., 2009) and, toxins
from water, food and drugs (Peterson et al., 2013), and is effective in retaining
nutrients and making them available to plants (Sanchez et al., 2009) while reducing the
bioavailability of both inorganic and organic contaminants to plants (Beesley et al.,
2010). The sorptive potentials of biochar may probably be due to electrostatic
attractions between positive metal ions and negative surface functional groups on the
biochar (Qiu et al., 2008) which could be carboxylic in nature (Uchimiya et al., 2012).
Inyang et al. (2012), reported effective removal of heavy metals from aqueous
solutions by biochar sourced from anaerobically digested diary waste and sugar beet,
further suggesting the use of anaerobic digestion to biologically ‘activate’ biochar as a
means of improving its sorptive properties.

16
Carbon sequestration/Greenhouse gas emissions 2.1.4
Biochar as a product of pyrolysis contains a high percentage of carbon which has been
found to be stable, and ‘inert’ or ‘recalcitrant’ in the environment (Spokas et al., 2009).
This property makes biochar when added to soil a potential tool for carbon capture
and storage (Montanarella and Lugato, 2013) in climate change mitigation.
Additionally, biochar reduces the emission of greenhouse gases from amended soils.
The recalcitrance of biochar is ascribed to its resistance to both chemical and microbial
degradation (Lehmann and Joseph, 2009a) and an index to estimate this property (see
section 4.3.2 of this thesis) has recently been suggested (Harvey et al., 2012). Biochar
is estimated to have a mean residence time of 2000 years in temperate soils (Kuzyakov
et al., 2009), and some researchers suggest biochar may have a half-life in the order of
thousands of years (Forbes et al., 2006). However, its rate of degradation in soil
remains controversial (Bird et al., 2008). Nevertheless, biochar appears to provide a
channel for the removal of carbon from the short-term bio-atmospheric carbon cycle
and sequestering it into the long-term geological carbon cycle (Bird et al., 1999; Forbes
et al., 2006; Yoo and Kang, 2012). Vaccari et al. (2011), reported the possibility of high
rates (60t/ha; 5% w/w) of application of biochar to soil as a way to sequester carbon
without detrimental effect on crop yield.
In addition to sequestering carbon, biochar application to soil is reported to suppress
greenhouse gas (GHG) emissions in the form of N2O and CO2 (Zhang et al., 2012)
further enhancing its climate change mitigation potential. Others found that laboratory
incubation of a farmland top soil with biochar over a period of 100 days reduced the
soil CO2 production for all amendment levels corresponding to field application rates of
24 – 720 t/ha (Spokas et al., 2009). They also found biochar additions >20% w/w
significantly suppressed N2O production just as it reduced ambient CH4 oxidation at all
levels compared to unamended soil. Anthropogenic sources are said to contribute
about 6.75 million metric tonnes of N2O emissions with 1.5 million tonnes from grazing
animal excreta (Taghizadeh-Toosi et al., 2011). Yaghoubi and Reddy (2011) reported
over 40% improvement in CH4 adsorption for a landfill cover soil amended with 5%
biochar (w/w), while others reported an N2O emission reduction potential of 47% for
biochar at 2% application rate (Harter et al., 2013). The impact of biochar on
greenhouse gas emissions from soil environments are said to depend on soil and
biochar types (Spokas and Reicosky, 2009; Harter et al., 2013), biochar aging and

17
water-filled pore size (Singh et al., 2010). More discussion on proposed mechanisms of
GHG suppression is provided in section 6.3.2 (Chapter 6) of this thesis.
Soil improvement/Plant growth 2.1.5
A considerable amount of published work exists which describes the impact of biochar
in improving soil quality in terms of enhanced retention and/or availability of nutrients
(Glaser et al., 2002; DeLuca et al., 2009; Agblevor et al., 2010), water retention and
cation exchange capacities (Masahide et al., 2006; Asai et al., 2009; Van Zwieten et al.,
2010), reduced plant uptake of pesticides (Yu et al., 2009), heavy metals (Hartley et al.,
2009) and increased microbial abundance (Masahide et al., 2006; Steinbeiss et al.,
2009; Thies and Rillig, 2009). Application of biochar from the bark of Acacia mangium
(brown Salwood) improved the availability of nutrients like Ca which increased from
0.79 to 5.86 cmolc/Kg, Mg from 0.27 to 0.55 cmolc/Kg, K from 0.07 to 0.21 cmolc/Kg,
and total N from 1.3g/Kg to 2.1g/Kg (Masahide et al., 2006). These increases were
attributed to the biochar’s contents of the relevant nutrients and exchangeable cations.
Glaser et al. (2002), reported higher levels of available nutrients in a pooled data table
that showed a Ca increase from 1.00 cmolc/Kg in unamended soil to 13.46 cmolc/Kg in
soil amended with 300g/Kg of hardwood charcoal. For the same treatment, K
increased from 0.03 to 0.46 cmolc/Kg, Mg from 0.17 to 0.41 cmolc/Kg and, total N from
0.7 to 2.4g/Kg. Similarly, P increased from 7.0 to 37.4mg/Kg. Biochar-amended soils
have lower bulk densities which reduce the tensile strength of the soils and hence give
lower tillage costs (Vaccari et al., 2011), just as it provides a liming effect to acidic soils
(Van Zwieten et al., 2010). However, biochar’s impact on soil fertility varies with soil,
crop type and over time (Mukherjee and Zimmerman, 2013) in addition to the intrinsic
characteristics of the biochar itself.
There are reports of biochar’s positive impact on plant growth and crop yields
(Masahide et al., 2006; Asai et al., 2009; Yu et al., 2009). Asai et al. (2009), investigated
the impact of biochar application on the physical properties of soil and rice (Oryza
sativa L.) yield. Their results show saturated hydraulic conductivity of the soil increased
by 79% at 16 t/ha biochar application rate. This, they explain, suggests not only
improved soil water permeability but also soil water holding capacity which translates
into improved water availability to plant. Masahide et al. (2006), studied the effect of
biochar on the chemical properties of soil and the yields of maize (Zea mays L.), cow

18
pea (Vigna unguiculata L.) and pea nut (Arachis hypogaea L.). From their results,
biochar application was associated with increases in the pH value of the soil from 4.5
to 5.4; total N from 1.3 to 2.1g/Kg and cation exchange capacity from 8.85 to 12.38
cmolc/Kg. A 15.8% increase in maize yield at 20 t/ha biochar amendment has been
reported (Zhang et al., 2012), while a waste water sludge biochar at half this
amendment rate is said to have increased cherry tomato yield by over 60% (Hossain et
al., 2010). Vaccari et al. (2011) reported a 30% increase in biomass and durum wheat
yield using a wood based biochar, while Major et al. (2010) have shown biochar
amendment to have increased maize yield by 28, 30 and 140% over three consecutive
years. This shows the potential of biochar for sustained positive impact on crop yield at
least in the short term. Some other authors, however, reported no effect on plant
growth (Hartley et al., 2009), while yet others report depressed crop response (Chan
and Xu, 2009; Gartler et al., 2013). But some of the data on crop response to biochar
addition collected in a review paper (Glaser et al., 2002) seem to suggest that low
amounts of applied biochar perform better compared to high amounts that have
negative impact on plant growth. For instance, they report a 63% increase in biomass
production at 5.0 t ha-1 charcoal amendment, while only 29% was obtained at 15.0 t
ha-1 charcoal amendment for the same soybean plant. These authors reported
improved soil fertility and high biomass yield at reduced tillage cost which could lower
the energy cost of production for biofuel crops, making them better climate mitigation
tools. Table 2.1 provides more information on crop responses to different biochar
types (Chan and Xu, 2009).

19
Table 2.1 Crop yield responses from biochar applications (Source: Chan and Xu, 2009)
Feedstock for biochar and rate of application
Crops/plants Responses Reasons for responses Given by authors
References
Unknown wood (0.5 t ha-1)
Soybean Biomass increased by 51%
Water-holding capacity and black colour on temperature
Iswaran et al (1980)
Unknown wood (5t ha-1 and 15t ha-1)
Soybean Yield reduced by 37 and 71%
pH-induced micro-nutrient deficiency
Kishimoto and Sugiura (1985)
Wood for charcoal Production, unknown rates
Vegetation in charcoal hearth and non-hearth areas compared after 110 years
Tree density and basal area were reduced by 40%
Negative responses due to changes in soil properties
Mikan and Abrams (1995)
Wood for charcoal production, (2t ha-1)
Trees (Betula pendula and Pinus Sylvestris)
Affected only B. pendula and only in substrates high in phenolics
Increased N uptake by countering the effect of phenolics
Wardle et al (1998)
Bamboo, unknown rate Tea tree Height and volume increased by 20 and 40%
Retained fertilizer and maintained pH
Hoshi (2001)
Secondary forest wood (68t C ha-1 – 135t C ha-1)
Rice, cowpea and Oats Biomass of rice increased by 17%, cowpea by 43%
Improved P, K and possibly Cu nutrition
Lehmann et al (2003b), Glaser et al (2002)
Bark of Acacia mangium (37t ha-1)
Maize, cowpea and peanut at two sites
Response only at one site (less fertile) with 200% increase (fertilized)
Increase in P and N availability and reduction of exchangeable Al3+; arbuscular mycorrhizal (AM)
Yamato et al (2006)
Secondary forest wood (11t ha-1)
Rice and sorghum Little response with biochar alone, but with a combination of biochar and fertilizer yielded as much as 880% more than plots with fertilizer alone
Fungal colonization Not stated
Steiner et al (2007)
Rice husk (10t ha-1) Maize, soybean 10-40% yield increases
Not clearly understood, dependent upon soil, crop and other nutrients
FFTC (2007)
Green waste (0-100t ha-1)
No positive effect with biochar up to 100t ha-1, but with added N fertilizer, 226% increase in dry matter
Indirect effect of improving physical properties of hard-setting soil
Chan et al (2007c)
Paper mill sludge (10t ha-1)
Wheat Increase in wheat height by 30-40% in acid soil but not in alkaline soil
Mainly liming value Van Zwieten et al (2007)
Biochar and soil microbial systems 2.1.6
Soil is a highly complex system that embodies a variety of microhabitats with different
physico-chemical properties and environmental conditions that serve as havens for soil
microorganisms (Insam, 2001; Torsvik and Øvreås, 2002). These microorganisms are of
central importance in sustaining soil health due to the vital role they play in the
release and cycling of nutrients and decomposition of organic matter which has a net
effect on primary productivity (Rutigliano et al., 2004). Figure 2.8 below depicts the
connection between biochar properties, soil processes and soil biota (Lehmann et al.,
2011).

20
Figure 2.8 Relationships between soil biota (inner circle), soil properties biochar may influence (middle circle) and the properties of biochar (outer circle). Arrows show influence between properties. Adapted from Lehmann et al (2011)
Human activities in the form of soil amendment techniques impact on the structure,
diversity and activity of microbial populations (Sheppard et al., 2005). Published works
report the impact of addition of sewage sludge and/or lime on ammonia oxidizing
bacterial communities (Gray et al., 2003), the impact of N fertilizer treatments on the
diversity of ammonia-oxidizing bacteria populations (Webster et al., 2002), and the
impact of repeated long-term addition of anoxically digested sewage sludge on the
diversity of methanogens (Sheppard et al., 2005). However, the impact of biochar
amendment on soil biota has been much less studied (Lehmann et al., 2011) compared
to its impact on the physico-chemical properties of soil.
In the case of biochar amendments, the impact can be studied in two ways, namely,
the effect of biochar on the soil microbial community and how the microbes influence
the biochar itself. On the one hand, addition of biochar to soil has been shown to
provide pore spaces for colonization by microbes (Bird et al., 2008). Biochar also
possibly provides the micro-organisms access to nutrients (Brodowski et al., 2005) held
by the biochar within its pores. Steinbeiss et al. (2009), identified biochar type as the
driving parameter for any effects on the microbial community. Comparing total
amount of phospholipid fatty acids in soils before and after incubation as an estimate

21
of microbial biomass they found that while addition of glucose-derived biochar led to a
significant reduction in microbial biomass, the addition of yeast-derived biochar did
not have any effect. On the other hand, microbes are reported to influence the
oxidation or mineralization of biochar in soil with only one study reporting no
degradation as detailed in the reviews of Schmidt and Noack (2000) and Glaser et al.
(2002). Kuzyakov et al. (2009), found that only between 1.5 and 2.6% of biochar C was
incorporated into microbial biomass after incubation for over 89 weeks. However, all
seem to agree that microbial degradation of biochar is very slow.
Physico-chemical characterization of biochar 2.1.7
All the applications to which biochar is deployed (carbon sequestration, soil
improvement, sorptive potential, energy purposes) ultimately depend on biochars
physical and chemical nature which in turn depend mainly on the nature of feedstock
and highest temperature of treatment (HTT). Expectedly, there is a growing interest in
the physico-chemical characterization of biochar especially in the last decade
(Fernandes et al., 2003; Ozcimen and Karaosmanoglu, 2004; Zhu et al., 2005; Brown et
al., 2006; Bourke et al., 2007; Qiu et al., 2008; Chen and Chen, 2009; Song and Peng,
2010; Ascough et al., 2011; Enders and Lehmann, 2012; Zhao et al., 2013) . The
sorptive properties of biochar for example are shown to be due to chemisorbed O2 on
the carbon surface (Boehm, 2002), while Ahmad et al. (2012) attributed the adsorption
of trichloroethylene (TCE) by crop residue biochars to the high aromatic and low
polarity nature of their surfaces. Additionally, surface area itself influenced by HTT;
(Wang et al., 2013b) may explain the sorption of nonpolar pollutants, as Kloss et al.
(2012) concluded after finding higher concentration of naphthalene in woody biochars
with increasing HTT (which also increased the surface area of the biochars). Straw-
based biochar has also been suggested as better than wood based biochar in
agriculture (Wang et al., 2013b), probably due to their higher contents of soluble
major and trace elements, boron apart (Kloss et al., 2012). What has not received
deserved attention is a systematic study focused on the main variables affecting
biochar’s properties (Feedstock and HTT). This is vital to weaning biochar from being
considered a waste product (Sohi et al., 2010; Montanarella and Lugato, 2013) to
having a set of standards (Cheng and Lehmann, 2009) and properties for identifying
biochar (Schimmelpfennig and Glaser, 2012) aimed at particular applications (Zhao et
al., 2013) especially in soil environments which require meeting regulatory constraints

22
(Keiluweit et al., 2012) that set maximum allowable limits for certain pollutant
contents in materials added to agricultural soils.
2.2 The research gap and justification
The study of existing literature on biochar research reveals a lack of a systematic and
rigorous approach focused on individual feedstock and/or the highest temperature of
treatment and consequent effects on the properties of biochar. It is these properties
upon which biochar’s potential benefits for use in climate change mitigation, pollution
control and agricultural soil improvement are based. This gap is evident in the way
biochar from so many feedstock sources produced at many different pyrolysis
temperature values are studied together, using various types of procedures and
reporting in different units. This reflects a general lack of a standard for biochar
characterization and documentation (Spokas et al., 2012) which makes it difficult to
compare results, repeat procedures and most importantly identify individual biochars
by their properties suitable for specific applications, a need that has recently been
echoed by various researchers (Kloss et al., 2012; Schimmelpfennig and Glaser, 2012).
Titiladunayo et al. (2012), for example studied biochars from three different named
hard woods at five different HTT’s mainly for their fuel potentials, while others
analyzed biochar from two different feedstock sources at seven different HTT’s for PAH
content (Keiluweit et al., 2012). Enders et al. (2012) evaluated 94 different biochars at
7 different HTT’s for their recalcitrant and agronomic values, while others quantified
PAH's in over 50 biochars from 22 different feedstock sources using various pyrolysis
methods at numerous HTT’s between 250-900oC (Hale et al., 2012). Another study
(Beesley et al., 2010) did not give any information on the identity of the hardwood
used, or the HTT chosen for producing their biochar or its properties; they simply
mentioned source company, a situation very similar to that of Major et al. (2010).
Taghizadeh-Toosi et al. (2011), gave no information on the HTT used to produce the
biochar they used to study impact on N2O emissions. A more puzzling case is when no
information is given concerning the feedstock (type or name), HTT or source of the
biochar in addition to lack of any procedure used in determining the physico-chemical
characteristics of the biochar used (Saxena et al., 2013). Sometimes as when
traditional production methods are used, only a range of HTT is mentioned (Schulz et
al., 2013) which obviously makes repeatability difficult.

23
It is to fill this gap that we aimed to rigorously study and document the characteristics
of biochar in a systematic way that focusses on a single feedstock source (Sitka spruce
wood) while varying the highest temperature of treatment (HTT) from two different
treatment facilities. HTT is one of the two most important factors that influence
biochar properties. Additionally, we aimed to assess the impact of the synthesized
biochars on the soil environments using a unique multidisciplinary approach that
involved applying the biochars in a fully replicated and systematic plant growth trials in
multiple soils. The post-harvest soils were then used to measure impacts on soil
processes (respiration and denitrification) and also employ molecular biology tools to
determine microbial community diversity on the amended soils against chosen
controls.

24
Chapter 3 Materials and methods
Introduction 3.1
This chapter presents the materials used and their sources, and the various
experimental procedures and pieces of analytical equipment used to generate the
results discussed in this thesis. Materials include the feedstock, biochars and soils,
while analyses conducted include thermal, proximate, elemental, Fourier Transform
Infra-red (FTIR), pH, soil respiration and Denaturing Gradient Gel Electrophoresis
(DGGE). Table 3.1 gives details of the materials, their types and sources and production
process in the case of biochars. Results of the pilot plant growth trials are also
reported though they were used to understand how best to conduct the pot
experiments using our synthesized biochars.
Table 3.1: Sources, types and other details of biochars and soils analysed and used for experiments
Material Source Type Production
process
Feedstock Taylormade Timber Products Ltd Sherburn
Hill, County Durham DH6 1PS in North East
England
Sitka spruce (chips and
saw dust)
Not
applicable
Biochar Interreg project (German) – (labelled ibc)
Unknown Unknown
Biochar Previous PhD project – (labelled kbc800) Unknown feedstock but
produced at 800oC
Unknown
Biochar Jacobi Carbons Ltd, Moss Estate, Leigh,
Lancashire, WN7 3PT, UK (labelled ss)
Produced from Sitka
spruce at 400, 600 and
800oC
Batch
Biochar UK Biochar Research Centre, University of
Edinburgh, EH9 3JN, UK (labelled ess)
Produced from Sitka
spruce at 400, 600 and
800oC
Continuous
Soil Fenton Centre, Northumberland, UK
(Ordnance Survey National Grid Reference NT
966 334
Sandy (pH = 4.38) Not
applicable
Soil Nafferton farm cottage, Stocksfield,
Northumberland, UK (Ordnance Survey
National Grid Reference NZ 066 657
Loamy/Clayey (pH = 6.67) Not
applicable

25
Biochar preparation and pre-treatment 3.2
The feedstock was sourced as detailed in Table 3.1, air dried as in section 3.2.1 and
processed to produce biochar at the three chosen pyrolysis temperatures; 400, 600
and 800oC using two different production processes as detailed in section 3.3 below.
3.2.1 The feedstock
Sitka Spruce (Picea sitchensis) saw dust and wood chips of mixed sizes were sourced
from Taylormade Timber Products Ltd, (Sherburn Hill, County Durham, DH6 1PS) in
North East England. These were air dried to about 10% moisture content then sieved
to obtain a ≤2mm size from the saw dust and ≤10mm sized sample from the mixed
wood chips.
Biochar production 3.3
The ≤2mm wood chips were pyrolysed at Jacobi Carbons Ltd, (Moss Estate, Leigh,
Lancashire, WN7 3PT, UK) in a batch system using a 10 litre horizontal electrical
furnace; a residence time at maximum temperature of 30 minutes and a heating rate
10oC/min, while the 10mm chips were pyrolysed at the UK Biochar Research Centre,
(University of Edinburgh, EH9 3JN, UK) in a continuous flow system using a stage II
continuous pyrolyser, with a residence time at maximum temperature of 30 minutes
and feed rate of 0.5Kg/h. Heat up to furnace set-point took typically 50 min which
gives a heating rate of between 8-16oC/min for the three temperature values. Both
production processes were carried out under nitrogen gas atmosphere. The biochars
were henceforth labelled as ss400, ss600, ss800, ess400; ess600 and ess800 where the
letters ss stand for biochar produced from Lancashire (Lancashire biochar) and ess
stand for biochar produced from Edinburgh (Edinburgh biochar), while the numerical
numbers stand for pyrolysis temperatures at which the biochar was produced.
Figure 3.1: Sitka spruce wood chips and saw dust processed to produce the biochars studied.

26
3.3.1 Biochar pre-treatment for use in soil amendment and other investigations
The fresh biochar samples were gently crushed by hand to pass through a 2mm sieve
and stored in sealed polythene sample bags at ambient temperature in the laboratory
for use in the various analytical tests and experimental treatments.
Biochar recovery post-plant trial experiments 3.4
At the end of soil pot experiments (see section 3.6 of this chapter) sub-samples of the
soil-biochar mixtures were taken for biochar recovery. One of the methods used for
the recovery was a flotation method in which about a litre of distilled water was added
to about 150g of soil-biochar mixture, stirred and allowed to settle after which the
floating biochar particles were filtered off through a #1 Whatman filter paper. The use
of tweezers (Nguyen and Lehmann, 2009) under a magnifying glass was also employed
to manually pick out the biochar particles from the soil.
The recovered biochar was investigated using Scanning Electron Microscopy for
evidence of possible microbial colonisation of the biochar pores (see Figure 2.9 in
Chapter 2 of this thesis) similar to what other researchers have reported (Brodowski et
al., 2005).
Physico-chemical characterization of the freshly produced biochar. 3.5
3.5.1 Proximate analysis on the biochar samples
Proximate analysis is aimed at determining the major constituents of the biomass as a
percentage of its total weight and is mostly undertaken in the energy industry to give
an insight into the energy potentials of the biomass. The measured constituents are,
fixed carbon (FC), volatile matter (VM), moisture content and ash content. Ultimate
analysis quantifies the elemental constituents of the material which are mainly C, H, O,
S and N. Other elements of interest may be determined as part of the ultimate analysis.
A Netzsch Jupiter STA449C TG-DSC (thermogravimetry-differential scanning
calorimetry) system was used for the proximate analysis. About 19mg of sample was
accurately weighed into an alumina crucible and heated first in helium atmosphere,
then in air and then back in the inert atmosphere at a flow rate of 30ml/min. A heating
rate of 20K/min was used. The equipment monitored the percentage mass loss with
temperature at various stages representing moisture contents, volatile matter, fixed
carbon and ash as represented in Figure 3.2.

27
Helium
400
298K 298K
1600K
Air Helium
Moisture content
Volatile matter
Fixed carbon
Ash
Time/min
Sam
ple
mas
s (W
t%)
3.5.2 Thermal analysis of the raw wood, freshly produced biochar and soil samples.
Thermal analysis is defined as “a group of
techniques in which a physical property
of a substance and/or its reaction
products is measured as a function of
temperature whilst the substance is
subjected to a controlled temperature
programme” Anandhan; Mackenzie,
1979). The samples in this study were
analysed using thermogravimetry (TG), a
thermal analysis technique that
monitors the change in mass of a substance as a function of temperature or time in the
course of heating the sample specimen through a controlled temperature programme
Figure 3.3: Coupled thermogravimetric, differential scanning calorimetric and quadrupole mass spectrometry System
Figure 3.2: Temperature programme and mass loss profiles for the proximate analysis of the biochar samples.

28
(30-900oC in this study) in a controlled atmosphere (mostly inert)
(http://www.perkinelmer.com/CMSResources/Images/44-
74556GDE_TGABeginnersGuide.pdf), running concurrently with differential scanning
calorimetry (DSC), that measures the difference in heat flow rate (mW = mJ/sec) between a
sample and inert reference as a function of time and temperature
(http://www4.ncsu.edu/~lalucia/courses/WPS-595B-BIOMATERIALS-CHARACTERIZATION/DSC.pdf).
Samples were analysed as a fine powder, crushed using an agate pestle and mortar.
A subsample of between 17-18mg was accurately weighed into an alumina crucible
and analysed using a Netzsch Jupiter STA449C TG-DSC (thermogravimetry-differential
scanning calorimetry) system connected to a Netzsch Aeolos 403C quadrupole mass
spectrometer (QMS) for the mass spectrometric analysis of the evolved gas. Samples
were heated from 30°C to 900°C at a rate of 10°C min-1 in an atmosphere of 80% He +
20% O2 (purge gas, flow rate 30 ml min-1). The protective gas was helium (flow rate 30
ml min-1). Adapter heads and transfer lines were heated at 150°C and 300°C,
respectively. TG and DSC data were acquired and processed using Netzsch TA4 Proteus
Analysis software.
3.5.3 Biochar and soil pH determination
The pH for both biochar and soil samples was measured using the British Standard
method (BS7755 Section 3.2), which involves scooping out and suspending 5ml of
sample in 25ml of deionised water in a 60ml plastic bottle. The bottle was mounted
onto a shaker for 15minutes after which the bottles were removed and the
suspensions left to stand overnight. The pH was then measured using a JENWAY 3020
pH meter.
3.5.4 Water holding capacity (WHC) for biochar and soil samples.
The water holding capacity for soil samples was determined using a slightly modified
version of the British Standard method BS 7755-4.4.3:1997. The perforated base of a
plastic cylinder (50mm length, 60mm diameter) was covered with a filter paper and
weighed. The cylinder was then partially filled with the soil sample and introduced into
a water bath at room temperature allowing water to seep through the perforated base
until it submerged the soil in the cylinder. The sample was then left to soak for 3 hours
at room temperature, removed from the water and then placed on a draining tray
containing wet, fine quartz sand to a depth of about 20mm. The soil was left overnight

29
to drain after which the cylinder containing the drained wet soil was weighed. The soil
was removed and dried to constant mass in an oven at 105 oC and weighed.
Water holding capacity was then calculated as a percentage using the equation;
Where
ms is mass of water-saturated soil + cylinder + filter paper in grams;
mt is mass of empty cylinder + filter paper in grams;
md is the mass of dried soil in grams.
Water holding capacity for the biochar samples was measured after the method of
Nguyen and Lehmann (2009) which involved mixing 19 g of pure white sand (Sigma
Aldrich no. 274739, -50 +70 mesh; ignited at 500 oC for 24 h) and 1 g biochar material.
The two were mixed well and placed onto a previously weighed Whatman no. 1 filter
paper in a funnel. The biochar–sand mixture was then saturated with deionised water.
After thorough free draining, the saturated biochar-sand mixture was weighed, dried
at 105 oC for 24 h, cooled in a desiccator and then weighed again. A control
biochar/sand free filter paper with funnel was used to determine the mass of water
held by the filter paper which was then subtracted from the water held by the biochar-
sand mixture. Water holding capacity was then calculated as a percentage using the
relationship;
Where
ms is mass of water saturated biochar-sand mixture in grams;
md is mass of dried biochar-sand mixture in grams;
mw is mass of water held by filter paper in grams.

30
3.5.5 Fourier-transform infrared analysis of the biochar samples.
Fourier transform infra-
red (FTIR) spectroscopic
measurements were done
on powdered samples
using a single reflectance
attenuated total
reflectance (ATR) method
(Seredych et al., 2008;
Uchimiya et al., 2010). A
Thermo Scientific
NICOLET 6700 spectrometer (Thermo Nicolet Corporation, Madison WI 53711) (Figure
3.4) fitted with a universal diamond ATR platform was used for measurements. Thirty
two scans were collected for each sample spanning 550–4000 cm-1 at a 4cm-1
resolution. Spectra were automatically corrected for background collected with a
sample free ATR crystal. Data collected were processed and analysed using OMNIC
software package Version 6.1a (1992) from Thermo Nicolet Corporation. Spectral
interpretation and functional group assignment were achieved through the relevant
published articles as detailed in Chapter 4 (section 4.3.4) of this thesis.
3.5.6 Surface acidity/basicity of the biochar.
Boehm neutralization titrations were employed to measure the two surface
amphoteric properties (acidity and basicity) of the biochar samples (Boehm, 2002;
Cheng et al., 2006; Fletcher et al., 2006; Cheng and Lehmann, 2009). For surface acidity,
about 0.15 g of biochar was added to 15 mL of 0.1 M NaOH solution and shaken with
an end-over-end shaker for 30 h. The resulting biochar slurry was then filtered using a
Whatman No. 42 filter paper. An aliquot (5 mL) of the NaOH filtrate was transferred to
a 10-mL 0.1 M HCl solution that neutralized the unreacted base. The solution was then
back-titrated with 0.1 M NaOH to an endpoint determined by phenolphthalein
indicator. The adsorbed base was then converted to surface acidity content (mmol/g)
of biochar. Surface basicity was measured in a similar manner to surface acidity, but in
this case an aliquot (5 mL) of the HCl filtrate was directly titrated with 0.1 M NaOH.
The adsorbed acid was converted to surface basicity content in (mmol/g) of biochar.
Figure 3.4: Thermo Scientific NICOLET 6700 Fourier-transform infrared spectrometer

31
3.5.7 Elemental analysis of the CHN contents of the biochars.
Powdered samples were analysed for
Carbon, Hydrogen and Nitrogen
contents using a Carlo Erba 1108
Elemental Analyser (Figure 3.5)
controlled with CE eager200 software,
run in accordance with manufacturer’s
guidelines and weighed using a certified
Mettler MX5 micro balance. The
equipment was calibrated with
acetanilide Organic Analytical Standard (batch No. 151853). Oxygen was determined
by a difference calculation. Samples were also analysed for carbon, nitrogen and
sulphur using VarioMAX V7.0.5 16.Nov. 05, CNS elemental analyser with Sulfadiazine
used as the calibration standard.
3.5.8 Analysis for total organic carbon (TOC) contents of the biochars and soils.
The total organic carbon for both
biochar and soil samples was
determined using the British Standard
method (BS7755 section 3.8, 1995).
Approximately 0.1 g of each sample
was accurately weighed into a porous
crucible on a tray with numbered
positions, 1 mL of 4 M hydrochloric
acid was then added drop wise to remove inorganic carbon contents (i.e. carbonates).
The crucibles were removed from the tray and placed in a fume cupboard on a
drainage platform to let the acid drain away for about 4 hours. The crucibles and
contents were then dried overnight in an oven at 65C. The tray was then removed
from the oven, covered with aluminium foil to protect against possible contamination
or loss of sample, allowed to cool and organic carbon content was then determined on
a Leco CS244 Carbon/Sulphur Analyser (Figure 3.6). An empty crucible was also
prepared and processed as a procedural blank.
Figure 3.5: Carlo Erba 1108 elemental analyser
Figure 3.6: Leco CS244 Carbon/Sulphur analyser

32
3.5.9 Cation exchange capacity (CEC) for soil and biochar
Cation Exchange Capacity for the samples was determined according to the method of
Enders et al. (2012) with some modifications. The modifications include using manual
in place of mechanical vacuum extractor and Millipore filter paper (Type GV 0.22
microns) in place of filter pulp. Briefly, 1.00 +/- 0.05 g of biochar was added to 40 mL of
pH 7.0 buffered ammonium acetate solution (NH4-OAc) and shaken overnight in 60 mL
glass vials. Contents were transferred using an additional 10 mL NH4-OAc into extractor
syringes prepared with Millipore filter paper (Type GV 0.22 microns) supporting a bud
of glass wool. Syringes were mounted in clamps and used to manually extract a total of
50 mL NH4-OAc solution over approximately 2 h. CEC was determined by adding 60 mL
of 95% EtOH to the sample syringes to remove NH4-OAc not adsorbed to exchange
sites. Following this, 50.0 mL of 2 M KCl was added and left overnight to displace NH4+.
Samples were then extracted over 2 h and an additional 40 mL of 2 M KCl was added
to the sample syringes and extracted a second time. The two extractions were pooled
and brought to 100 mL volume with 2 M KCl. Ammonium was quantified in the extracts
on Spectroquant Pharo 00 spectrophotometer using MER K’s ammonium test kit
(Merck KGaA, 64271 Damstadt, Germany). CEC was calculated according to the
following relationship:
( ⁄ ) ( )
( ) ( ⁄ )
3.5.10 Scanning electron microscopy (SEM)
Fresh biochar crushed to pass
through a 2mm sieve was used
for SEM measurements. Small
amounts of the samples were
mounted on aluminium stubs
using carbon double sided
adhesive tabs. Images were
recorded using an
Environmental Scanning
Electron Microscope-Field Emission Gun (FEI XL30 ESEM-FEG) with a back scattered
Figure 3.7: Environmental scanning electron microscope

33
electron detector at 20KeV. Biochar samples recovered from pot soils were prepared
for images that could possibly reveal micro-organisms on the surface or inner cavities
of the biochar crystals. Sample preparation involved fixing the specimens overnight in
a solution of 2% gluteraldehyde (CH2(CH2CHO)2) in Sorensons phosphate buffer (a
mixture of mono and disodium hydrogen phosphates made to pH 7.4), followed by
two rinses for 15 minutes each with fresh volumes of the same buffer. The samples
were then dehydrated by soaking for 30minutes each in 25%, 50%, and 75% ethanol,
followed by soaking in 100% ethanol twice for 60 minutes each. Final dehydration was
achieved using carbon dioxide in a Baltec Critical Point Dryer. The samples were then
mounted on aluminium stubs with Acheson Silver Dag, dried overnight and then
coated with a standard 15nm gold layer using a Polaron SEM Coating Unit. The
specimens were finally examined using a Stereoscan 240 Scanning Electron Microscope
(housed within the Electron Microscopy Research Services, Newcastle University) and
the digital images were collected with Orion6.60.6 software.
Leek growth pot trials in soils amended with biochars 3.6
3.6.1 Introduction
The improvement of agricultural soils by addition of biochars has been reported by
various researchers. It appears that biochars improve crop yields (Masahide et al.,
2006; Sukartono et al., 2011) by improving soil fertility status through enhanced water
availability to plants, soil organic carbon contents and reduced leaching of applied N
fertilizers (Berglund et al., 2004; Spokas et al., 2009; Taghizadeh-Toosi et al., 2011) and
changing physical properties (Asai et al., 2009). In this study pot based growth trials
were aimed at assessing the impact of different biochar amendments on the growth
characteristics or yield of leek (Allium porrum); as well as on soil properties such as pH,
water holding capacity, CEC, basal respiration and nitrogen dynamics. Microbial
community composition of the amended soil from the pots has also been investigated.
Biomass yield was monitored by measuring the above ground stem diameter and the
leek plant owing to its morphology provided a good model for that purpose.
The pot experiments consisted of a series of three different trials to investigate the
growth of a test plant (leek) in two different soils amended at different rates with four
different biochars as detailed in Table 3.2. The pilot experiment using two types of
biochars (see Tables 3.1 & 3.2) was designed to develop the right approach taken in
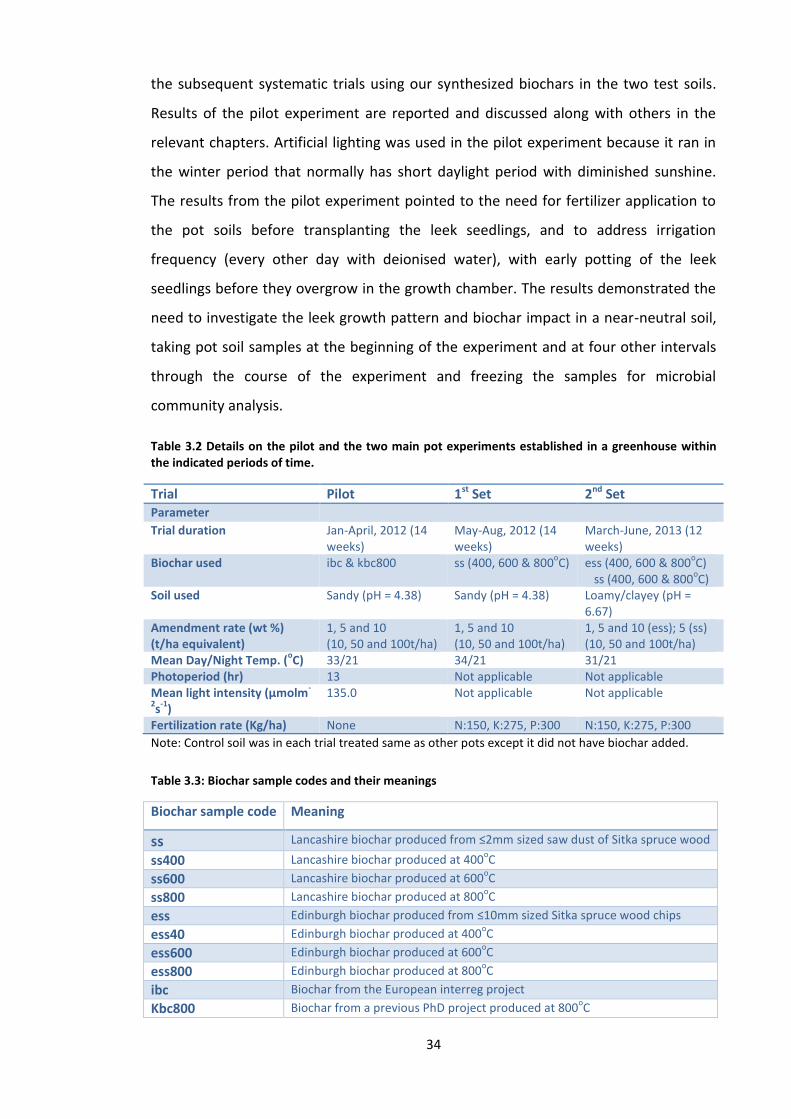
34
the subsequent systematic trials using our synthesized biochars in the two test soils.
Results of the pilot experiment are reported and discussed along with others in the
relevant chapters. Artificial lighting was used in the pilot experiment because it ran in
the winter period that normally has short daylight period with diminished sunshine.
The results from the pilot experiment pointed to the need for fertilizer application to
the pot soils before transplanting the leek seedlings, and to address irrigation
frequency (every other day with deionised water), with early potting of the leek
seedlings before they overgrow in the growth chamber. The results demonstrated the
need to investigate the leek growth pattern and biochar impact in a near-neutral soil,
taking pot soil samples at the beginning of the experiment and at four other intervals
through the course of the experiment and freezing the samples for microbial
community analysis.
Table 3.2 Details on the pilot and the two main pot experiments established in a greenhouse within the indicated periods of time.
Trial Pilot 1st Set 2nd Set Parameter Trial duration Jan-April, 2012 (14
weeks) May-Aug, 2012 (14 weeks)
March-June, 2013 (12 weeks)
Biochar used ibc & kbc800 ss (400, 600 & 800oC) ess (400, 600 & 800
oC)
ss (400, 600 & 800oC)
Soil used Sandy (pH = 4.38) Sandy (pH = 4.38) Loamy/clayey (pH = 6.67)
Amendment rate (wt %) (t/ha equivalent)
1, 5 and 10 (10, 50 and 100t/ha)
1, 5 and 10 (10, 50 and 100t/ha)
1, 5 and 10 (ess); 5 (ss) (10, 50 and 100t/ha)
Mean Day/Night Temp. (oC) 33/21 34/21 31/21
Photoperiod (hr) 13 Not applicable Not applicable Mean light intensity (µmolm
-
2s
-1)
135.0 Not applicable Not applicable
Fertilization rate (Kg/ha) None N:150, K:275, P:300 N:150, K:275, P:300
Note: Control soil was in each trial treated same as other pots except it did not have biochar added.
Table 3.3: Biochar sample codes and their meanings
Biochar sample code Meaning
ss Lancashire biochar produced from ≤2mm sized saw dust of Sitka spruce wood
ss400 Lancashire biochar produced at 400oC
ss600 Lancashire biochar produced at 600oC
ss800 Lancashire biochar produced at 800oC
ess Edinburgh biochar produced from ≤10mm sized Sitka spruce wood chips
ess40 Edinburgh biochar produced at 400oC
ess600 Edinburgh biochar produced at 600oC
ess800 Edinburgh biochar produced at 800oC
ibc Biochar from the European interreg project
Kbc800 Biochar from a previous PhD project produced at 800oC

35
3.6.2 Seeding leek to obtain seedlings for the pot experiment
All pot trial experiments were set up
with transplanted seedlings. To prepare
the seedlings, leek seeds ‘VEG0 9
M SSELB RGH’ purchased from
http://www.nickys-nursery.co.uk) were
sown in compost within perforated-base
plastic trays contained in an outer plastic
trough used to irrigate the seedlings
from beneath and placed into a growth
chamber (Figure 3.8) at 21oC ±1 with 11 hour artificial lighting (7am – 6pm). Initially
a pilot pot experiment using the sandy low pH soil was set up in which the leek
seedlings at about 15cm in height were transplanted into 250grams of soil in ” 10cm
plastic pots (one plant per pot) in a greenhouse at the Moorbank Botanic Garden
under artificial lighting. At the time of this study, Moorbank Botanic Garden
(Claremont Road, Newcastle NE2 4NL) was a teaching and research facility under the
School of Biology, Newcastle University which maintained living collections of plants.
The experimental design contained
replicated (x3) treatments of 1%, 5% and
10% by weight biochar/soil mixtures
using two biochar types: ibc and kbc800.
A triplicate control containing
unamended soil only was also included. In
the pilot experiment, no fertilizer was
added before or in the course of the
experiment and potable water was used
to automatically irrigate the plants daily. The pots were appropriately labelled,
randomly arranged on a garden table and the experiment lasted for 15 weeks (see
Table 3.2). Plant growth was monitored on weekly basis by measuring the diameter of
the plant at its base just above the soil. A digital calliper (Fisher Scientific, 0 – 150mm,
accurate to within 0.01mm) was used for the diameter measurement. At the end of
Figure 3.9 Potted Leeks in the near-neutral soil.
Figure 3.8 Leek seedlings in a growth chamber

36
the experiment, the plants (including all large bits of roots) were carefully removed
from the pots and the soil, and discarded. The soil was transferred to the laboratory,
air dried and stored in polythene sample bags for further analysis.
A second set of pot experiments was subsequently started with the same replicated
experimental design as the pilot. However, in this case biochar treatments included
the use of Sitka spruce biochars obtained from Jacobi Carbons (Lancashire biochar) and
deionised water for irrigation (every other day). No artificial lighting was used as these
experiments were conducted during the summer, and fertilizer was added to the same
type of soil (sandy, low pH) as in the pilot experiment at the rate of 275 Kg/ha (0.1375
g/Kg soil) for potassium; 300 Kg/ha (0.15 g/Kg soil) for phosphorous and 150 Kg/ha
(0.075 g/Kg soil) for nitrogen (Defra, 2010). The experiment lasted for 15 weeks with
an average day/night greenhouse temperature of 34/21oC.
A third set of pot experiments with a similar experimental design as those conducted
previously was again started. However, in this case in addition to using mainly Sitka
spruce biochar from Edinburgh (ess) at the three amendment rates as the pilot, a
parallel set of pots was introduced in which the Lancashire biochar (ss) was used but
only at the 5% amendment rate. Moreover, on the basis of results from our pilot
experiment, a near-neutral soil (see Table 3.2) was used in this set of experiment
which lasted for 13 weeks with an average day/night greenhouse temperature of
31/21oC.
Pot soil samples were randomly taken at the beginning and (from the same pots) at
four other intervals during the course of the second and third set of experiments and
frozen for microbial community analysis. At the end of the experiments the leek plant
was harvested and pot soil recovered as for the pilot experiment.
Soil process assays and molecular biological analysis 3.7
3.7.1 Basal respiration (BR)
Basal respiration of soils was determined according to ISO 16072 (2002). Triplicate
samples of 10 g air dried soil were adjusted to 60 % water holding capacity in 100 ml
glass serum bottles (Wheaton science products, USA). Bottles were then sealed with
butyl rubber septa and crimp closed (Sigma-Aldrich, UK). Gas samples were taken at 0,
20 and 24 hours using a 100 µl gas-tight syringe (Hamilton, Switzerland) with CO2

37
production measured by GC-MS. Analysis
of headspace CO2 by GC-MS was
conducted on a Fisons 8060 GC (Figure
3.10) using split injection (150°C) linked
to a Fisons MD800 MS operated at
electron voltage 70eV, emission current
150µA, source current 600µA, source
temperature 200°C, multiplier voltage
500V, and interface temperature of
150°C. The acquisition was controlled
using Xcalibur software in full scan mode (1.0-151.0 amu/sec). An equal volume of
100µl headspace sample gas from each serum bottle was injected in split mode
through the column and the GC programme and MS data acquisition commenced.
Separation was performed on a HP-PLOT-Q capillary column (30m x 0.32mm i.d)
packed with 20um Q phase. The GC was held isothermally at 35°C with Helium as the
carrier gas with a flow rate of 1ml/min, pressure of 65kPa, and open split at 100ml/min.
Chromatogram peaks of m/z 44 corresponding to CO2 gas were integrated and
quantified in Xcalibur and saved as Excel files for further processing. Calibrations were
carried out by injecting 100, 0, 0, 0, and 20 μL of a 1 CO2 standard gas (Scientific
& Technical Gases Ltd, UK), based on which %CO2 in the head space of sample bottles
was determined.
CO2 values (% in headspace) were converted to mgCO2/g dry soil, using the ideal gas
equation PV = nRT rearranged to determine n, the number of moles of CO2 produced.
The product of the number of moles and molar mass of the gas gives its mass in grams.
In the ideal gas equation:
P = pressure of the gas standards (1 atm)
R = universal gas constant, 82.05746 atm*ml*(mol*K)-1
T = absolute temperature, in this case 298K
V = volume of the gas in head space in ml, calculated as (%CO2 read off the calibration
curve * head space volume in ml)*(100)-1
BR rates expressed in mg CO2*g-1*h-1 dry soil were then determined from the slopes of
the linear regression of plots of CO2 production against sampling times.
Figure 3.10: Fisons Gas chromatograph-mass spectrometer

38
3.7.2 Denitrification enzyme activity (DEA)
Denitrification enzyme activity was determined via a miniaturised acetylene block
method as described by Patra et al. (2006) and Wertz et al. (2006) with a few minor
modifications (McCann, 2013).
Field moist soil equivalent to 2 g of oven dried soil was placed in 10 ml serum bottles
(Wheaton, Sigma-Aldrich, UK) and amended with 2 ml of distilled water containing
potassium nitrate, KNO3 200 μg N -3– N g−1 dry soil), glucose (0.5 mg C g−1 dry soil)
and glutamic acid (0.5 mg C g−1 dry soil). The original experiment was carried out in 150
ml plasma flasks (Wertz et al., 2006), however, with a reduction in soil mass it was
decided to reduce vessel volume to 10 ml in order to further miniaturise the
experiment. Supplementary water was added when necessary to achieve 100 % WHC
in all soils. Bottles were sealed with butyl rubber stoppers and then the headspaces of
bottles were flushed with oxygen free nitrogen (N2) gas (BOC Gases, UK) followed by 1 %
acetylene (C2H2) in N2 (CK Gas Products Ltd, UK) and crimp closed (Sigma-Aldrich, UK).
This provided inhibition of N2O-reductase activity and ensured anaerobic conditions. In
the original method of Wertz and colleagues, a 90:10 He–C2H2 mixture was used to
flush headspace. However, this was unfeasible to employ due to safety reasons related
to the stability of acetylene in such a gas mixture. Instead a stable and safe mixture of
1 % acetylene C2H2 in N2 was used in all assays within this study.
Experimental controls were carried out in triplicate, using the same weight of soil, but
only flushed with N2 to determine natural levels of N2O emissions. Bottles were
incubated at room temperature and headspace gas samples were measured after 4
and 6 hours to determine N2O production by GC-MS.
As for the assessment of BR (section 3.7.1), 100 µl of headspace gas was extracted with
a gas-tight syringe (Hamilton, Switzerland), flushed with N2. Concentrations of N2O
were determined using the major ion fragment of NO+ at a mass to charge ratio (m/z)
of 30. The parent ion of N2O (m/z 44) was not used due to interference with any
discharged CO2 which also has the same mass to charge ratio of 44. Calibration and
linear response was checked using a gas standard of 0.988% N2O in N2 (Scientific &
Technical Gases Ltd, K injected with volumes of 100, 0, 0, 0, 20 and 10 μL. G -MS
equipment and operational parameters were as for BR measurements and the mass of
N2O produced was calculated as for CO2. Similarly, DEA rates were determined from
the slopes of the linear regression of plots of N2O production against sampling times

39
and expressed as μg N2O*g-1*h-1 dry soil following calculating rates based on N2O
accumulation over time.
3.7.3 Microbial community structure analysis using PCR-DGGE
Introduction
Pot soil samples taken in the course of plant growth trials (see section 3.6.2) were used
to assess changes in the bacterial community composition over time resulting from
biochar addition. This preliminary assessment involved comparing the DGGE profiles of
PCR-amplified Bacterial 16S rRNA gene fragments from DNA extracts of amended and
control soils as detailed in the sections below.
Soil DNA extraction
Soil DNA was extracted in replicates (x3) from 0.25 grams each of individual biochar-
amended pot soil samples and control using the ‘Experienced ser Protocol’ provided
with PowerSoil DNA Isolation Kit (MO BIO Laboratories, Inc., 2746 Loker Ave West,
Carlsbad, CA 92010).
PCR-amplification of bacterial 16S rRNA genes
Polymerase Chain Reaction (Torsvik
and Øvreås, 2002) or Polymer Chain
Reaction (Liu et al., 2006) is a culture-
independent technique that facilitates
the investigation of the almost 99% of
microorganisms that could not be
routinely cultured in the laboratory
(Torsvik and Øvreås, 2002; Ghazanfar
et al., 2010; Hirsch et al., 2010). The
16S rRNA gene fragments from the DNA extracts were amplified after which the PCR
products were separated using the Denaturing Gradient Gel Electrophoresis (DGGE).
DNA extracts were PCR amplified using a TECHNE TC-512 thermal cycler (TECHNE Inc.
Burlington NJ, USA). Reaction mixtures contained 0.5 µL of template DNA, 23.5 µL of
MegaMix-Blue (Microzone, Haywards Heath, West Sussex, UK) containing Taq
polymerase (recombinant) in 1.1 PCR reaction buffer (2.75 mM MgCl2) with 220 µM of
deoxynucleoside triphosphates, blue agarose loading dye with stabilizer and 0.5 µL
Figure 3.11: Polymerase chain reaction thermal cycler

40
each of primers 2 (5'-ATTACCGCGGCTGCTGG-3') and 3. Primer 3 contained a GC clamp
(a 40-nucleotide G rich sequence attached to the 5’ end of the following sequence
5'-CCTACGGGAGGCAGCAG-3' (Muyzer et al., 1993). The PCR thermal profile went
through 24 cycles of an initial denaturation at 95oC for 10minutes followed by 65oC for
30s, 54oC for 30s and 72oC for 30s. PCR products were identified in aliquots (7µL) by gel
electrophoresis using an ethidium bromide stained, 1% (w/v) agarose gel. 3µL of hyper
ladder marker was added into each of the two gel lanes that border the sample lanes.
The resolved PCR products were visualized under UV light in a UVP iBox In vivo imaging
system.
Denaturing gradient gel electrophoresis
Denaturing Gradient Gel
Electrophoresis as a method for
investigating microbial diversity uses
different strengths of chemical
denaturants as a gradient to separated
DNA (Liu et al., 2006). The principle is
similar to that of Temperature
Gradient Gel Electrophoresis (TGGE),
but in TGGE the gradient is
temperature in place of chemical denaturants (Gray et al., 2003; Liu et al., 2006). The
DGGE is considered reliable in its ability to follow changes in microbial populations and
it allows for gel analysis of multiple samples in a single run (Muyzer, 1999) using
markers that can be compared across gels.
DGGE was conducted using a 0.75mm thick 10% polyacrylamide denaturing gel. The
denaturant gradient ranged from 30% (L) to 70% denaturant (H) (100% denaturant is 7
mol L-1 urea plus 40% (v/v) deionised formamide in 1 TAE (Tris-acetate EDTA)). To cast
the denaturing gel, a vertical clamp cassette (Ingeny International BV) was assembled
holding two thin-walled glass plates between which a 32 teeth plastic comb was
inserted to form wells at the top of the gel. Twenty four millilitres each of the L and H
denaturing solutions per gel was then mixed with 50µL of 20% aqueous solution of
ammonium per sulphate APS and 10µL of N,N,N’,N’-tetramethylenediammine
(TEMED). The low and high solutions were mixed in a BIO RAD gradient former (model
Figure 3.12: INGENY denaturing gradient gel electrophoresis tank
41
485) and poured between the glass plates in the cassette up to a level just below the
comb teeth using a peristaltic pump. The polymerised gel was left to set for 2 hours. A
stacking gel was prepared by adding 60µL APS and 6µL TEMED to 6mL of 0% aqueous
solution of buffer and 40% Bis/Acrylamide per gel. This was introduced through a
syringe on top of the polymerised gel to generate the wells needed.
After an hour, the comb was gently removed from the set stacking gel and the cassette
holding the gel was immersed in a 1 x TAE buffer (1 x TAE is 40 mM Tris-acetate plus 1
mM EDTA (pH 8.3)) in a 10L electrophoresis tank (Figure 3.12) at 60oC and the
electrical terminals connected. The flow tube was also connected to the top of the
cassette to allow for TAE flow round the gel. Into fresh PCR tubes, 15µL each of the
sample PCR products and loading dye were mixed and added into the wells with the
tank at low voltage (LV) and the TAE flow halted. Sample lanes were regularly
interspersed with gel lanes to which a marker PCR product was added. A BIO RAD 3000
PowerPac was then set at 100V, the DGGE tank at high voltage (HV) and started for
about 5 minutes after which the TAE flow through the cassette was restarted. The
electrophoresis was operated for 16 hours, after which the gel was carefully removed
from between the glass plates and stained in a solution of 20µL SYBR green in 200mL
of 1 x TAE for 1 hour and then visualized under UV light in a UVP iBox In vivo imaging
system.
Statistical analyses 3.8
All replicate data sets were statistically analysed on untransformed data by ANOVA
using IBM SPSS statistical software (IBM SPSS statistics version 21, 1989-2012, New
York, NY 10022, US). For the soil microbial function trials the effects of biochar
treatment and biochar pyrolysis temperature were tested through a two-way ANOVA.
The tests were done using the general linear model Univariate (LSD, post hoc) analysis
with the relevant microbial function indicator (rates of CO2 production for basal
respiration or rates of N2O production for denitrification enzyme activity) as
dependent variable, while amount of biochar added to the soil and pyrolysis
temperature of the biochar were the fixed factors. For the plant growth trials in both
the low pH and near neutral soils, the rate of leek growth was the dependent variable
while amounts of biochar added to the soils and biochar pyrolysis temperature were
the fixed factors. However, in the case of the pilot experiments (in the low pH soil) only
the amount of biochar added was the fixed factor due to lack of information on

42
pyrolysis temperature for the ibc biochar. Fisher’s least significant difference post hoc
test was used to compare means and unless otherwise stated, mean differences were
significant at the 0.05 level.

43
Chapter 4 Characterization of the freshly synthesized biochars from
the batch and continuous processes
Introduction 4.1
Critical to all the possible functions of biochar (see Chapters 1 and 2) are the physico-
chemical characteristics of individual biochars. For instance, pre- and post-pyrolysis
composition determine elemental composition and what surface functional groups
exist, which in turn determine to a large extent pH, and cation exchange capacity (Guo
and Rockstraw, 2007). Surface area and pore size of the biochar determine its water
holding capacity (which improves the plant available water holding capacity of the
biochar amended soils) and also sorption abilities (Amuda et al., 2007; Karhu et al.,
2011).
Most biochar characteristics ultimately depend on two key factors: the temperature at
which the biochar is produced, so called highest temperature of treatment (HTT) and
the nature of feedstock (Enders et al., 2012; Kloss et al., 2012; Zhao et al., 2013). A
third factor that is sometimes considered is production processes (Schimmelpfennig
and Glaser, 2012).
The bulk of research work on biochar appears to be too broad with biochars from
multiple feedstock sources considered together but confoundingly and
unsystematically produced at variable production temperatures. In addition these
biochars may only have been studied with respect to a few physical and chemical
parameters. Calvelo Pereira et al. (2011), for example studied biochar from three
different feedstock at two different pyrolysis temperatures to measure properties like
pH, thermal gravimetry, volatiles and elemental contents. In another study, close to
twenty different feedstock sources were used in a similar fashion to produce 94
biochars with four different HTT’s to determine pH, elemental and proximate analysis
(Enders et al., 2012). The authors aimed at investigating stability properties and
agronomic values of this large number of biochars in addition to examining the effect
of feedstock source and HTT on biochar composition. These many factors and variables
make such a study unsystematic and difficult to easily distinguish the effect of HTT
from feedstock source. In a similar fashion a total of 66 biochars from 16 different
feedstock sources produced at 7 different HTT’s using 5 different production processes

44
that include ‘others’ i.e. unspecified were analysed (Schimmelpfennig and Glaser,
2012) with the stated aims of investigating material properties and setting analytical
properties for biochar identification. The authors found it necessary to state in their
conclusion the need for further research to better separate biochar characteristics due
to feedstock and production processes. Hence, to efficiently separate the two principal
effects on biochar quality there is a great need for rigorous characterization studies
focussed either on biochars from single feedstock source and the effect of varying
pyrolysis temperature or production process, or on biochars produced from multiple
feedstock sources but rigorously produced at the same HTT and using the same
production process. The gap that this research project seeks to fill is the former: the
need for rigorous characterization focussed on biochars from a single feedstock source
while varying the highest temperature of treatment from two different production
processes.
It is beyond the scope of this study to investigate the effects of varying both pyrolysis
temperature (HTT) and feedstock sources simultaneously as this is likely to be
cumbersome and thus becloud the individual effects of one from the other. This
approach is necessary if an advocated characterization data library (Enders et al., 2012)
and/or analytical guideline values (Schimmelpfennig and Glaser, 2012) for biochar are
to be realised.

45
Results 4.2
Results on the characterization of freshly synthesized biochar from the same feedstock
(Sitka spruce) using the batch and continuous production processes are presented and
discussed. Each of the two production techniques were used to produce a set of three
biochars at three different pyrolysis temperatures of 400, 600 and 800oC from the
same feedstock (see Chapter 3, section 3.3 and Table 3.1). Figure 4.1 shows biochar
samples produced using the continuous process.
Proximate analysis of biochars from the two production processes 4.2.1
The proximate analysis results in Table 4.1 show moisture content fluctuated from a
large decrease between 400oC to 600oC and a smaller increase between 600oC to
800oC biochar in both the batch and continuous products (such duplication indicates
the slight rise at higher temperature is reproducible). Volatile matter (VM; - material
lost at high temperature in the absence of air) shows a consistent decrease with rise in
pyrolysis temperature (R2 = 0.91, Figure 4.2 and Table 4.1) for both biochars (values for
ess used in plotting Figure 4.2), with consistent values for the same temperature of
production for the two biochar production processes especially between ss/ess600;
and ss/ess800 (Table 4.1). Fixed carbon (FC) showed a linear increase with rise in HTT
(R2 = 0.93, Figure 4.2 and Table 4.1). Thus, FC and VM show an inverse relationship as
shown in Figure 4.3. The trend in the ash content differs between the two biochars; a
drop and rise for the ss (Lancashire) biochar and a rise and drop for the ess (Edinburgh)
biochar.
400oC 600oC 800oC
Figure 4.1: Biochar samples from continuous process (ess) and their temperature of production

46
Table 4.1: Proximate analysis results for the fresh biochar samples
Biochar
Parameters
Moisture content (%) Volatile matter (%) Fixed carbon (%) Ash content (%) ibc 1.09 14.67 67.70 16.54
Kbc800 1.72 18.31 35.33 44.63
ss400 1.29 28.91 64.38 5.43
ss600 0.19 8.83 88.82 2.16
ss800 0.29 3.82 92.89 3.00
ess400 0.98 25.93 69.87 3.22
ess600 0.19 8.87 86.31 4.64
ess800 0.35 3.66 92.02 3.97
R2=0.93
R2=0.91
Pyrolysis temperature (oC)
300 400 500 600 700 800 900
Per
cent
(%)
0
20
40
60
80
100
R2=0.93
R2=0.91
Figure 4.2: Correlation between fixed carbon (filled triangle), volatile matter (empty triangle) and pyrolysis temperature for the ess biochar.
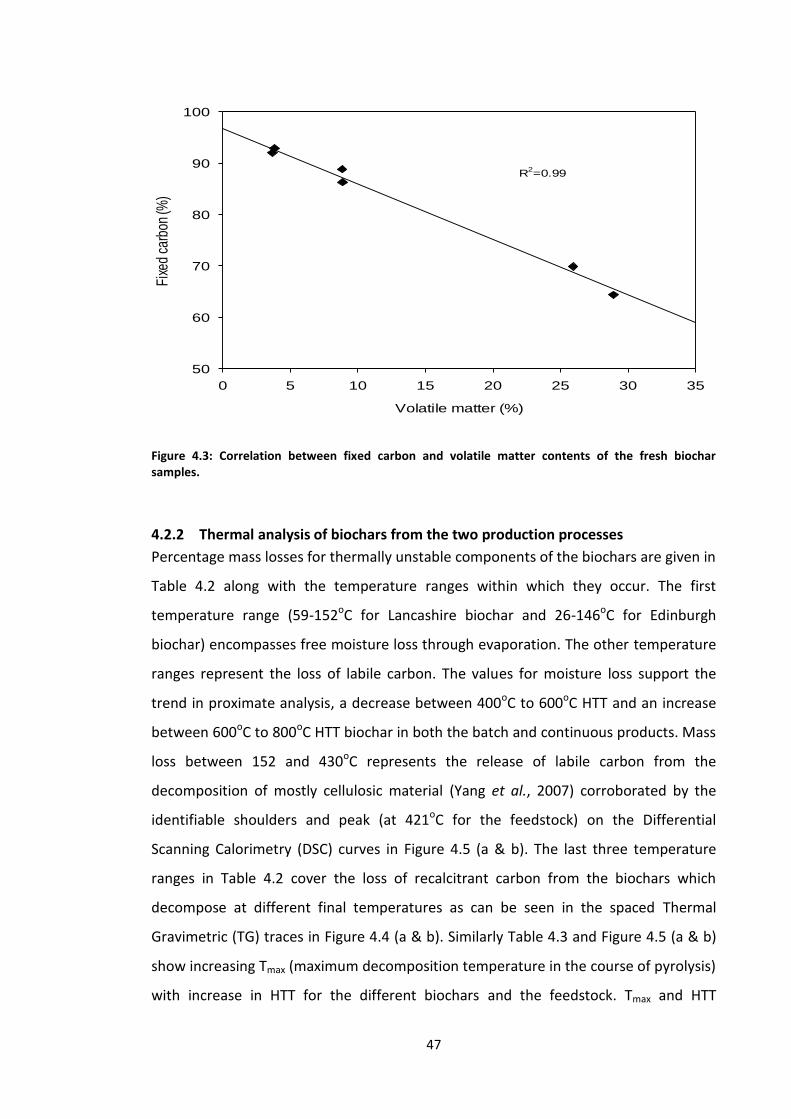
47
R2=0.99
Volatile matter (%)
0 5 10 15 20 25 30 35
Fixe
d ca
rbon
(%)
50
60
70
80
90
100
R2=0.99
Figure 4.3: Correlation between fixed carbon and volatile matter contents of the fresh biochar samples.
Thermal analysis of biochars from the two production processes 4.2.2
Percentage mass losses for thermally unstable components of the biochars are given in
Table 4.2 along with the temperature ranges within which they occur. The first
temperature range (59-152oC for Lancashire biochar and 26-146oC for Edinburgh
biochar) encompasses free moisture loss through evaporation. The other temperature
ranges represent the loss of labile carbon. The values for moisture loss support the
trend in proximate analysis, a decrease between 400oC to 600oC HTT and an increase
between 600oC to 800oC HTT biochar in both the batch and continuous products. Mass
loss between 152 and 430oC represents the release of labile carbon from the
decomposition of mostly cellulosic material (Yang et al., 2007) corroborated by the
identifiable shoulders and peak (at 421oC for the feedstock) on the Differential
Scanning Calorimetry (DSC) curves in Figure 4.5 (a & b). The last three temperature
ranges in Table 4.2 cover the loss of recalcitrant carbon from the biochars which
decompose at different final temperatures as can be seen in the spaced Thermal
Gravimetric (TG) traces in Figure 4.4 (a & b). Similarly Table 4.3 and Figure 4.5 (a & b)
show increasing Tmax (maximum decomposition temperature in the course of pyrolysis)
with increase in HTT for the different biochars and the feedstock. Tmax and HTT

48
correlate well with R2 = 0.86 as shown in Figure 4.6. Fuller explanations will be given
under the discussion section of this thesis.
Table 4.2: Thermal gravimetry parameters and estimated proportions (%) of thermally unstable
components of the biochars at pyrolysis temperature intervals
59-152oC 152-430
oC 430-543
oC 430-580
oC 430-625
oC
ss400 2.50 22.73 70.65 ss600 0.39 3.47 92.77 ss800 0.47 1.35 94.46 26-146
oC 146-400
oC 400-552
oC 400-592
oC 400-640
oC
ess400 1.30 14.26 82.07 ess600 0.37 1.78 91.86 ess800 0.58 0.74 94.61 52-114
oC 114-480
oC 480-583
oC
Feedstock 4.79 66.43 23.48
Table 4.3: Differential scanning calorimetry parameters and temperature range of peaks and their
maximum temperatures (Tmax)
1st exotherm (oC) Tmax (oC) 2nd exotherm
(oC) Tmax (
oC)
ss400 150-430 (s) 348 430-540 (b) 508 ss600 n.d. n.d. 430-580 (b) 538 ss800 n.d. n.d. 430-620 (b) 581 ess400 150-430 (s) 351 430-550 (b) 511 ess600 n.d. n.d. 430-590 (b) 559 ess800 n.d. n.d. 430-640 (b) 581 & 613 Feedstock 150-480 (b) 421 480-582 (b) 569
S: shoulder; b: broad; n.d.: not detected
Figure 4.4: Stacked thermal gravimetry plot for Lancashire (a) biochar with raw wood and Edinburgh (b) biochar
Pyrolysis temperature (oC)
100 200 300 400 500 600 700
Sa
mp
le w
eig
ht
(%)
0
20
40
60
80
100
ss400
ss600
ss800
Raw feedstocka
Pyrolysis temperature (oC)
100 200 300 400 500 600 700
Sa
mp
le w
eig
ht
(%)
0
20
40
60
80
100
ess400
ess600
ess800
b

49
R2=0.86
Pyrolysis temperature (oC)
0 200 400 600 800 1000
T max
for e
xoth
erm
(o C)
440
480
520
560
600
640
R2=0.86
Figure 4.6: Correlation between highest temperature of treatment and maximum temperature of decomposition.
Elemental and other chemical analyses 4.2.3
The results for elemental analysis, pH and other chemical characteristics are recorded
in Table 4.4 below. The pH increases with increase in pyrolysis temperature of the
biochars (R2 = 0.90) from acidic in the 400oC through near neutral in the 600oC to a
basic character in the 800oC for both streams of biochar. Total carbon (TC) also
Figure 4.5: Stacked differential scanning calorimetry plot for Lancashire (a) biochar with raw wood and Edinburgh (b) biochar
Pyrolysis temperature (oC)
100 200 300 400 500 600 700
DS
C (
mW
/mg)
0
5
10
15
20
25
30
35
ss400
ss600
ss800
Raw feedstock
a
581oC
538oC
508oC
569oC
421oC350
oC
Temperature (oC)
100 200 300 400 500 600 700
DS
C (
mW
/mg)
0
10
20
30
ess400
ess600
ess800
b
613oC
581
oC
559oC
511oC
351oC

50
increases with rise in pyrolysis temperature and quite similar values for both biochars.
The proportion of hydrogen in the biochars drops with rise in HTT, while that of
nitrogen increases though with small margins. Oxygen determined by difference
(Calvelo Pereira et al., 2011; Enders et al., 2012), also drops with rise in production
temperature for the biochars. With higher proportions for total carbon and low
proportions for both of hydrogen and oxygen with rise in HTT, the elemental ratios
(O:C, H:C and (O+N):C) decreased from the 400oC to the 800oC HTT biochars for both
production streams. The significance of these changing ratios and their relationship to
pyrolysis temperature will be elaborated in the discussion section. Total organic
carbon (TOC) increases with rise in pyrolysis temperature (R2 = 0.74) and is essentially
the same as the total carbon (TC) due to the absence of inorganic carbon (see Figure
4.7 and section 4.3.3), while both cation exchange capacity (CEC) and water holding
capacity (WHC) decrease with rise in production temperature. In line with the trend in
H content, the surface acidity (SA) of the biochars measured in mmol/g drops with rise
in HTT; while surface basicity (SB) increases except for the ss600 biochar which shows
a negative value for SA and a fairly big spike for SB compared to the ess600.
An important point to note is that regardless of differences in production processes
(Batch for Lancashire biochar and Continuous for Edinburgh biochar), Table 4.4 shows
the 400oC biochars to stand well apart from their higher temperature counterparts in
many properties such as TC/TOC, WHC, Oxygen, elemental ratios and to some extent
even CEC. A similar pattern is observed with fixed carbon (see Table 4.1).

51
Table 4.4: Elemental composition and chemical characteristics for the fresh biochars
ibc Kbc800 ss400 ss600 ss800 ess400 ess600 ess800
pH 8.94 7.85 5.53 6.44 8.13 5.03 6.48 9.37
C (%) 71.89 45.65 75.30 94.08 95.26 83.00 94.18 95.68
H (%) 1.45 1.13 3.08 2.21 0.74 3.62 2.23 0.61
N (%) 0.26 0.65 0.05 0.06 0.07 0.09 0.13 0.17
S (%) n.d. 0.15 n.d. n.d. n.d. n.d. n.d. n.d.
Ash (%) 14.49 42.35 3.84 3.13 3.61 2.86 2.48 3.01
O (%) 11.91 10.07 17.73 0.52 0.32 10.43 0.98 0.53
O:C 0.17 0.22 0.24 0.01 0.01 0.13 0.01 0.01
H:C 0.02 0.02 0.04 0.02 0.01 0.04 0.02 0.01
N:C 0.00 0.01 0.00 0.00 0.00 0.00 0.00 0.00
(O+N):C 0.17 0.23 0.24 0.01 0.00 0.13 0.01 0.01
TOC (%) 66.29 40.96 74.73 89.51 92.41 82.53 93.63 95.35
CEC (mmolcKg-1
) n.d. n.d. 7.25 4.63 3.11 10.34 5.66 2.43
BD (gcm-3
) 0.32 0.28 0.12 0.12 0.14 0.14 0.14 0.13
WHC (%) 41.50 41.00 45.79 35.95 36.09 56.94 44.03 47.63
SA (mmolg-1
) 0.2 0.4 0.47 -0.20 0.00 0.07 0.00 0.00
SB (mmolg-1
) 0.33 0.87 0.00 0.13 0.07 0.07 0.07 0.20
Note: TOC: total organic carbon; CEC: cation exchange capacity; BD: bulk density; WHC: water holding capacity; SA: surface acidity; SB: surface basicity; n.d.: not detected.
R2=0.96
Slope=1.06
Total organic carbon (%)
70 75 80 85 90 95 100
To
tal c
arb
on (
%)
70
75
80
85
90
95
100
R2=0.96
Slope=1.06
Figure 4.7: Correlation between total carbon and total organic carbon for the biochar

52
Fourier-transform infra-red (FT-IR) analysis 4.2.4
The wavenumbers of prominent spectral absorbance bands identified from the results
of FTIR measurements on the biochars under investigation are marked in Figure 4.8
and recorded along with assigned functional groups in Table 4.5. Possible functional
groups assigned based on the absorbance wavenumbers include hydroxyls of water
and alcohols, carbonyls of carboxylic acid and ketones, and aliphatic and aromatic
ethers.
Table 4.5: Main functional groups assignment for the recorded Fourier-transform infrared spectral bands of the biochars (Chen and Chen, 2009; Cheng et al., 2006; Shen et al., 2010; Yang et al., 2007; Zhao et al., 2013).
Wavenumber (cm-1
) Types of bonds, vibrations and compounds
700-900 C-C stretching; Aromatic C-H
1024 Aliphatic C-O stretching of R-OH in an alcohol
1035 C-O stretching in polysaccharides
1200 Aliphatic C-O-C stretching as in Pyranose ring
1232 C-O-C stretching in Aryl-alkyl ether linkage
1370 CH2, alkyl C-CH3 bending
1430 O-H bending of an acid; CH2 and CH3 bending
1600 -COO anti-symmetric stretching of amino acids;
C=O stretching of ketone and carbonyl
1690 O-H bending in H2O
Wavenumber (cm-1
)
600800100012001400160018002000
Abs
orba
nce
0.1
0.2
0.3
0.4
0.5
0.6
0.7
700-9001024
1200
1232
1370
1430
1600
1690
ss400
ss600
ss800
Figure 4.8: Fourier-transform infrared spectral traces for the ss (similar to that for ess) biochar.

53
Discussion 4.3
Proximate analysis 4.3.1
The moisture content is largely contributed by the loss of free water by evaporation at
low temperatures (Chen and Chen, 2009) which may explain the drop with rise in
pyrolysis temperature. The rise in moisture content from 600oC to 800oC is confirmed
by the values for moisture content from the thermogravimetry plots (see Table 4.2).
The volatile matter (VM) contents decrease with rise in pyrolysis temperature, while
fixed carbon content increases with pyrolysis temperature. A similar trend has been
reported by Titiladunayo et al. (2012) who studied woody biochars produced at
temperatures that included 400, 600 and 800oC. The two parameters of FC and VM
have been used by Liu and Balasubramanian (2013) to calculate the fuel ratio (FR)
which is defined as the ratio between fixed carbon and volatiles (FC:VM); a
characteristic value for solid fuels. The higher the fuel ratio the better the fuel quality
for the solid fuel in addition to an indication of lower volatiles, hence reduced emission
of air pollutants (Liu and Balasubramanian, 2013). These authors determined a fuel
ratio of 1.85 for pine wood biochar produced at 350oC. Comparing the biochar samples
in this study with one of the biochars studied by Titiladunayo et al. (2012) the
calculated fuel ratio (FC:VM) increased from 2.23 (for ss400) to 10.06 (for ss600) by
over 350% while the Iroko biochar they used increased by just about 100% from 3.65
(for the 400oC biochar) to 7.41 (for the 600oC biochar). These results may indicate
better fuel quality for the biochar derived from Sitka spruce. Volatile matter has also
been suggested in addition to other parameters as a measure of carbon sequestration
potential; a volatile matter content exceeding 80% shows such biochar has no C
sequestration value (Enders et al., 2012). All the biochars investigated in this study
have less than 30% volatile matter contents (see Table 4.1).
Thermal analysis 4.3.2
The total weight loss during the thermogravimetric analysis reflects loss of water, CO2
and other volatile products of heating the sample. The weight loss (TG) curves in
Figure 4.4 show all the biochar samples losing weight within a minimum of three
temperature intervals as recorded in Table 4.2. The mass loss in the first interval (59-
152oC) is attributed to free water (Chen and Chen, 2009); while the second interval
(152-430oC) could be due the thermal decomposition of the solid residues resulting

54
from the pyrolysis of hemicellulose and cellulose in the original plant material (Yang et
al., 2007) which is Sitka spruce wood in this project. It is worth noting here that
temperature intervals for mass loss in TG curves overlap as is obvious from the
literature. For example, hemicellulose and cellulose or other labile carbon contents are
said to be lost within 200-350oC (Lopez-Capel et al., 2005), 300-350oC (Lopez-Capel et
al., 2006) and 220-400oC (Yang et al., 2007). Table 4.2 further shows the labile carbon
content of the chars decreases with rise in pyrolysis temperature and this is confirmed
by the fact that while in Figure 4.5, a & b (DSC curves) a clear first exotherm (shoulder)
is seen for the 400oC biochars, none is discernible for the higher temperature samples
and this is held as a characteristic of highly condensed black carbon materials (Harvey
et al., 2012). The largest mass loss is recorded from temperatures >403oC which is
attributed to the decomposition of mainly aromatic recalcitrant carbon (Lopez-Capel et
al., 2006).
Figure 4.4 and Table 4.2 show different upper limits for the third mass loss interval,
getting higher with rise in HTT for the biochar samples which likely point to the
breakdown of strong aromatic C=C bonds. Table 4.2 also shows the proportion of
recalcitrant C contents which are mainly aromatic (Lopez-Capel et al., 2006) increasing
with rise in HTT as is also supported by the DSC curves in Figure 4.5 which show
increasing Tmax (maximum decomposition temperature) values with rise in pyrolysis
temperature. This observation is in line with the report of Enders et al. (2012). The Tmax
values in Figure 4.5 and also in Table 4.3 indicate increased thermal stability of the
recalcitrant carbon fractions in the biochar samples with rise in HTT; the higher the
Tmax the more the thermal stability of the fraction. Hence, recalcitrance of the biochars
as indicated by Tmax is directly related to aromatic character of the biochar as shown in
Figure 4.9 (R2 = 0.92). For a single feedstock as the one under investigation therefore,
the sole influence on the recalcitrance character of the biochars may be the HTT since
both aromatic character and Tmax increase with increasing HTT as is clear from the R2
values in Figure 4.10.

55
R2=0.92
Aromatic character (C:H)
20 40 60 80 100 120
Tm
ax (
oC
)
500
520
540
560
580
600
620
R2=0.92
Figure 4.9: Correlation between aromatic character and highest temperature of decomposition (Tmax) for the fresh biochars
The Tmax values for all samples show those for Edinburgh biochar to be higher than the
corresponding samples from Lancashire which probably is a factor of difference in
production process; continuous for Edinburgh and batch for Lancashire. The higher of
Tmax (oC)
500 520 540 560 580 600
R2=0.9895
Aromatic character
20 40 60 80 100 120
HT
T (
oC
)
300
400
500
600
700
800
900
R2=0.96
Figure 4.10: Correlations between aromatic character, highest temperature of decomposition (Tmax) and highest temperature of treatment (HTT) for the biochars.
56
the two Tmax values for both ss800 and ess800 in the DSC plots (Figure 4.5) may likely
be due to the decomposition of some of the ligneous content since it decomposes over
a wide range of temperature (Lopez-Capel et al., 2006; Yang et al., 2007; Shen et al.,
2010). Such decomposition may then probably explain the increase in moisture
content in the 800oC biochars above that for the 600oC biochars as recorded in both
Tables 4.1 and 4.2. The increased recalcitrance of the biochars assumed from their
enhanced thermal stability can be further evaluated by applying the recently
developed (Harvey et al., 2012) method of calculating the recalcitrance index (R50). The
recalcitrance index is calculated using the equation:
Where T50, x and T50, graphite are the temperature values at which half of the weight of
the carbon material and graphite are respectively lost through oxidation/volatilisation.
The two parameters are directly obtained from the TG thermograms of x (the
individual biochar samples in this project) and graphite that have been corrected for
moisture and ash. Using the T50 values from our corrected TG curves and the T50 value
of 886oC for graphite as determined by Harvey et al. (2012) the calculated R50 values
for our biochar samples are: ss400 (0.54); ss600 (0.59); ss800 (0.62); ess400 (0.52);
ess600 (0.59); and ess800 (0.64). These values place all the biochars into class B 0.50 ≤
R50 < 0.7) on the sequestration potential scale which is an intermediate level above
that of the uncharred biomass, R50 < 0.5 and below that comparable to graphite, R50 ≥
0.7 (Harvey et al., 2012). Examples of other reported (Harvey et al., 2012) class B
biochars produced at 650oC under nitrogen atmosphere include those from loblolly
pine (R50 = 0.58), eastern red cedar (R50 = 0.56) and swamp oak (R50 = 0.52). These
examples show the biochar under investigation as more recalcitrant (see section 4.1)
and hence having better potential as a tool for carbon sequestration since its R50
values even at 600oC are higher than those for the compared wood biochars prepared
at 650oC (a higher HTT). The recalcitrance index values also add to the conclusion
based on their characteristics that the 400oC biochars stand apart from the higher
temperature ones as observed earlier.
Elemental and other chemical analyses 4.3.3
Table 4.4 shows pH values increasing with rise in pyrolysis temperature and this agrees
with other reports (Pereira et al., 2003; Enders et al., 2012). Increased basic character

57
(decreased H content) with rise in HTT is likely due to depleted concentration of mainly
carboxylic acid functional groups (Pereira et al., 2003), a reason that is also associated
with decrease in cation exchange capacity (Enders et al., 2012; Kloss et al., 2012) as
the correlation plot in Figure 4.11 shows. Hence, a direct relationship between CEC
and H contents exists in the biochars under investigation (Figure 4.12, R2=0.91).
CEC (mmolc/Kg)
2 4 6 8 10 12
H (
%)
0
1
2
3
4
5
R2=0.91
Figure 4.12: Correlation between cation exchange capacity and hydrogen contents of the biochars
Pyrolysis temperature (oC)
300 400 500 600 700 800 900
H (
%)
0.5
1.0
1.5
2.0
2.5
3.0
3.5
R2=0.98
Pyrolysis temperature (oC)
300 400 500 600 700 800 900
CE
C (
mm
olc
/Kg
)
2
3
4
5
6
7
8
R2=0.98
Figure 4.11: Correlations between highest temperature of treatment versus hydrogen; and cation exchange capacity for the biochars under investigation.

58
Decrease in concentration of carboxyl groups with rise in HTT is supported in our
biochars by the disappearance of FTIR absorption bands associated with these groups
in the traces for the higher temperature biochars (see Figure 4.8 and Table 4.5). The
ultimate analysis (elemental composition) results in Table 4.4 show the C content
increasing with temperature, a trend that agrees with other reports (Chen and Chen,
2009; Enders et al., 2012; Kloss et al., 2012). The C content values for the 600 and
800oC biochars almost attain absolute values (100%) and compares well with biochars
at these temperatures produced from Apa and Iroko woods (Titiladunayo et al., 2012).
Nitrogen also shows some enrichment with rise in pyrolysis temperature and this
trend is supported by other reports (Calvelo Pereira et al., 2011; Enders et al., 2012;
Kloss et al., 2012; Titiladunayo et al., 2012). The proportions of both H and O decrease
with rise in pyrolysis temperature as shown in Table 4.4 which is in line with the
observations of many authors (Chen and Chen, 2009; Enders et al., 2012; Titiladunayo
et al., 2012). The loss of these two elements with rise in HTT may point to the loss of
functional groups as indicated by the flat line FTIR trace for the 800oC biochars (see
Figure 4.8).
Increased C content coupled with decrease in both H and O contents of the biochars
with rise in temperature means elemental ratios H:C, O:C and (O+N):C decrease with
rise in temperature. These decreased values point to increased aromaticity with rise in
temperature (Lopez-Capel et al., 2006; Kloss et al., 2012) as can be exemplified with
the H contents of cyclohexane (an alicyclic compound with 6 C atoms and 12 H atoms)
and benzene (an aromatic compound with 6 C atoms but only 6 H atoms). These
elemental ratios have variously been applied in assessing the potential of biochars as a
tool for C sequestration, soil amendment and sorption applications. Enders et al. (2012)
propose that a biochar with volatile matter content < 80%, and O:Corg < 0.2 or H: Corg <
0.2 may indicate high sequestration value. The values in Table 4.4 therefore show a
pattern of increasing sequestration potential with increasing pyrolysis temperature for
the biochars in this study especially since the total carbon essentially equals the total
organic carbon (see Figure 4.7 with a slope of 1.0645), a fact supported by the absence
of any endotherm (carbonate decomposition) beyond 600oC in the DSC thermogram
(Figure 4.5) for the biochars which would have indicated the presence of inorganic
carbon. Decreased O:C and H:C may also indicate fewer surface functional groups

59
(Schimmelpfennig and Glaser, 2012) which will hence point to increased aromatic
character. Disappearance of surface functional groups with rise in HTT is evident in our
samples from the FTIR traces of the higher temperature biochars especially at 800oC
where no absorption bands are discernible. The recorded (see Table 4.4) decrease in
Cation Exchange Capacity (CEC) for the investigated biochars with rise in pyrolysis
temperature (see Figure 4.11a) may also be due to the diminished amount of
functional groups (Kloss et al., 2012). The (O+N):C is a measure of polarity of the
surface groups (Chen and Chen, 2009) which decreases with rise in temperature for
the biochar samples in this study. Decreased polarity coupled with significant surface
area (not measured in this project) in high temperature biochars may enhance
retention of non-polar pollutants (Kloss et al., 2012). The elemental analysis reported
zero readings for S (not tabulated) which may indicate its absence in our samples and
this probably makes these biochars environmentally friendly in terms of SOx emissions.
Titiladunayo et al. (2012), claimed such environmental friendliness for the biochars
they investigated for industrial applications even though they contain S concentrations
of up to 0.30%. The water holding capacity for the biochar samples under investigation
as recorded in Table 4.4 compares with the value of 34% reported for oak wood
biochar at 600oC (Nguyen and Lehmann, 2009).
There seems to be no clear trend in the values for surface amphoteric properties
especially for the Lancashire biochar as shown in Table 4.4. Edinburgh biochar though
shows a decrease in surface acidity and increase in surface basicity with rise in HTT.
This is in line with our pH and FTIR results and agrees with the reports of (Chun et al.,
2004). Negative results for an amphoteric surface property has been reported (Pereira
et al., 2003) and may indicate high values for the opposing property since surface
acidic and basic sites co-exist and seem to be inversely related (Boehm, 2002).
FT-IR 4.3.4
The bands between 700-900cm-1 (see Figure 4.8) are assigned to aromatic structures
that include C-H bonds (Yang et al., 2007; Kloss et al., 2012) and their broadening in
ss600 indicates a shift to more condensed carbon and an increase in aromatic nature
with rise in HTT which agrees with the findings of a number of authors (Chen and Chen,
2009; Kloss et al., 2012). This helps to confirm the observed decrease in the
concentrations of H with rise in pyrolysis temperature (see Figure 4.11a). Kloss et al.

60
(2012) observed that a band at 875cm-1 may also indicate vibrations due to carbonates,
but this is discounted for the samples here since no endotherm exists on the DSC
curves in Figure 4.5. The band in the region 1024-1035cm-1 is assigned to aliphatic C-O
stretching of alcohols (Shen et al., 2010) and polysaccharides (Cheng et al., 2006)
which are cellulosic materials. The loss of these bands in the higher temperature
biochars (600 and 800oC) again indicates shift to more recalcitrant carbon as soft
carbon fractions are eliminated (Chen and Chen, 2009). The band around 1200cm-1 in
the 400oC biochars is assigned to aliphatic ethers while the one at 1232cm-1 in the
600oC biochars represents an aryl-alkyl C-O-C linkage (Yang et al., 2007). This
transformation may also be another indication of developing aromatic character with
rise in HTT. The band in the region 1310-1370cm-1 is assigned to a methylene group
(Chen and Chen, 2009) and aliphatic C-CH3 bending vibration (Shen et al., 2010) and
that band is greatly diminished in the 600oC biochars; and it along with all other
aliphatic absorption bands completely disappears in the 800oC biochars, again
indicating gradual dehydrogenation leading to formation of aromatics at higher
temperatures. This conforms with the observation of Zhao et al. (2013) who explained
such disappearance of aliphatic groups results from the dehydration of cellulosic and
ligneous components. The absorption band at 1430cm-1 is assigned to O-H bending
vibration of an acid (Yang et al., 2007) and this group appears removed in the trace for
the 600oC biochars. This goes to support the observed increase in pH with rise in
pyrolysis temperature and is in line with the observations of Chun et al. (2004), that
rise in temperature reduces surface acidity. Pereira et al. (2003) also reported
temperature programmed desorption (TPD) results that showed the removal of acidic
oxygen groups at 700oC. The strong absorption band at about 1510-1600cm-1 is
assumed to be due to anti-symmetric stretching vibration of amino acids (Zhao et al.,
2013) and C=O stretching of ketones and carbonyls (Yang et al., 2007). This band
appears diminished in the 600oC biochars to about a third of its size in the 400oC
biochars which may indicate decarboxylation of acidic groups that could further
support increase in basic character with rise in HTT. The final spectral band for our
samples is around 1690cm-1 and is assigned to O-H bending vibration in water
molecules (Shen et al., 2010). The band clearly disappears in the 600oC biochars which
supports measured decreased moisture content and also increased basicity with rise in
pyrolysis temperature.

61
Conclusion 4.4
The totality of the results considered goes a long way in addressing the first objective
and hypothesis put forward in this study; that physico-chemical properties of biochar
are progressively altered with increasing pyrolysis temperature. The progressive
changes in properties recorded in this Chapter may provide a framework of
understanding the trend of biochar amendment impact on plant growth and soil
processes. With the feedstock source fixed in this study, the results clearly show that
temperature of production is an important factor that alters both physical and
chemical properties of biochars (Wang et al., 2013a), a position supported in the case
of C content by the report of Enders et al. (2012).
It could also be concluded that as noted in this thesis the 400oC biochar stands well
apart from the higher temperature biochars which show only minor differences
between themselves in properties like all proximate analysis (except ash content), pH,
TC, TOC, thermal behaviour, elemental ratios and CEC. These minor differences in
many properties between the two higher temperature biochars mean depending on
the desired property it could be cheaper to produce and use the 600oC biochar rather
than the 800oC. Production process may also influence some biochar properties as
shown by identifiable differences, even though small, between the Lancashire and
Edinburgh biochars produced from the same feedstock and at the same temperatures.
The Sitka Spruce biochar may have both high fuel quality and C sequestration potential
as evidenced by its satisfactory fuel ratio and recalcitrant index values.

62
Chapter 5 The impact of biochar amendments on plant growth and the
physico-chemical properties of amended soils.
Introduction 5.1
Considerable research effort (see Chapters 1 and 2) has gone into determining the
potential of biochar as a vehicle to sequester atmospheric CO2 and hence fight climate
change. To properly establish the importance of biochar as a soil additive for this
purpose it must not negatively affect the bio-physicochemical properties of the soil
which are critical in maintaining soil health. A healthy soil is one that possesses
qualities which make it fit to provide many important ecosystem goods and services
(Haygarth and Ritz, 2009) that include supporting the growth of food crops, livestock
and space for building and recreation (Kennedy and Smith, 1995). The potential impact
of biochar on the agronomic properties of a given soil could be assessed by
determining how biochar application impacts on the growth and yield of plant material
in the amended soil, which will be a reflection of improvements in the bio-physico-
chemical properties of the soil. These properties and how biochar application to soil
affects them are crucial in determining the health status of the amended soil.
Masahide et al. (2006) for example reported on the impact of biochar amendments on
the chemical properties of an acid soil and yield of maize, cowpea and peanut crops in
a field experiment, but they used a biochar with no definite pyrolysis temperature
(260-360 oC) and an application rate of 10 Lm-2 both of which create difficulty in results
comparison. Asai et al. (2009) monitored soil physical properties and grain (rice) yield
on various soils with pH range of 5.2-8.3 amended with biochar (at 4, 8 and 16t/ha)
from wood wastes in a field experiment. The authors however, used a commercial
biochar with no information on its highest temperature of treatment (HTT) which
makes the investigation unsystematic and results difficult for comparison. Biochar
from waste water sludge (HTT, 550oC) was used in a greenhouse experiment to study
the bioavailability of metals and the yield of cherry tomatoes in an acid soil (Hossain et
al., 2010). The authors monitored plant height as an indicator of plant growth.
Sukartono et al. (2011), reported on the effect of biochar amendment (in a field
experiment) on soil fertility and maize yield in a sandy loam soil, though they used
three non-wood feedstock sources and a biochar production method that only gave a

63
range for HTT (200-300oC) again making it unsystematic and raising difficulties in
comparing results. Other researchers worked on the possible effect of biochar addition
to bio-fortify some crops with zinc metal (Gartler et al., 2013) using a large number of
crops (11) ranging from above ground shrubs such as lettuce to underground tubers
like carrot. The authors used weight of dry biomass as a measure of amendment
impact on plant growth. However, making a definite statement on the impact of
biochar on the agronomic properties of an amended soil is not easy as it depends on
the nature of the soil-crop-climate trio (Enders et al., 2012). Hence in this study, in
addition to using a single feedstock source to produce the test biochar, a single plant
(leek) had been used within a uniform climatic condition in form of the greenhouse, all
in an effort to make the result of impact clearer. Plant growth in this investigation was
monitored by measuring the ground level
diameter of the leek plant which grows
upwards as a single unbranched shoot (Hay
and Kemp, 1992) making diameter
measurement easy. The diameter
measurement gives a more dependable
linear dataset compared to monitoring
biomass weight, which is prone to errors
resulting from handling during harvest. Diameter measurement also allows continuous
monitoring of plant growth dynamics and the impact of biochar throughout the
experimental period while biomass estimation happens only at the end of the
experiment.
The influence of biochar on soil fertility and plant growth/yield have been assessed
using both pot experiments (Hartley et al., 2009; Graber et al., 2010; Hossain et al.,
2010; Gartler et al., 2013) and field studies (Masahide et al., 2006; Asai et al., 2009;
Sukartono et al., 2011). Parameters measured to monitor plant growth or crop yield
range from fresh biomass weight (Masahide et al., 2006; Gartler et al., 2013), dry
biomass weight (Hossain et al., 2010), weight of harvested crop (Asai et al., 2009;
Sukartono et al., 2011), and weight/height of shoot (Khan et al., 2013; Schulz et al.,
2013). Similarly, various types of crops have been used by researchers as test plants
and these in most cases include maize (Masahide et al., 2006; Major et al., 2010;
Figure 5.1: Potted leek plants in the greenhouse
64
Sukartono et al., 2011; Zhang et al., 2012; Gartler et al., 2013), rice (Asai et al., 2009;
Khan et al., 2013), wheat (Van Zwieten et al., 2010; Vaccari et al., 2011) and tomatoes
(Graber et al., 2010; Hossain et al., 2010), with a few reporting the use of beans (Van
Zwieten et al., 2010) and leek (Gartler et al., 2013) amongst others. For the purpose of
this work, pot experiments were employed using leek (Allium porrum) as the test plant
in two different soils; sandy of low pH and loamy/clayey of near-neutral pH. Leek
growth was monitored by measuring the diameter of the above ground part of the
stem. A preliminary (pilot) pot experiment was conducted as part of method
development (see Chapter 3, section 3.6 and Table 3.2) for the two subsequent
experiments. Available data from the pilot experiment are also given here for
comparison to those from the main experiments.
The specific objective this chapter sought to achieve was to assess how the addition of
biochar produced at different pyrolysis temperatures using different production
processes to two soil types (low and near-neutral pH) affects the physicochemical
properties of the amended soil and influences plant growth in both soils compared to
unamended controls. These biochars have already been shown to possess
systematically variable properties (see Chapter 4) many of which are likely to affect the
properties of soils to which they could be added. It was hypothesized (see hypotheses
4 and 5 in Chapter 1 section 1.4) that:
Different biochar pyrolysis temperatures and their application rates will
significantly alter the pH, total organic carbon (TOC) contents, bulk density
(BD) water holding (WHC), and cation exchange capacities (CEC) of soils to
which the biochar was added.
Different biochar pyrolysis temperatures and their application rates influence
biochar’s ability to impact on the growth rate of Leek plant in amended soils
compared to control soils.
Results 5.2
The results concerning the impact of biochar addition on the agronomic properties of
the two types of amended soils (low pH and near-neutral) are graphically presented
under section 5.2.1 and in Table 5.1. The first section is on the biochars’ impact on the
physico-chemical properties of the amended soils (pH, TOC, BD, WHC and CEC) while a
second section (5.2.2) is on the impact of biochar on leek growth (presented as rates)

65
in the two soils against relevant controls. Under both sections, relevant ANOVA
statistical tables are provided.
Table 5.1: Summary of the investigated agronomic properties of the amended soils. The sandy acid
soil was amended with ss biochar and the loamy/clayey was amended with ess biochar.
Biochar HTT (oC) 400 600 800
Amendments (%) Amendments (%) Amendments (%) Parameter Soil Type Control 1 5 10 1 5 10 1 5 10 pH sandy 4.30 4.45 4.46 4.44 4.34 4.42 4.60 4.45 4.76 4.77
loamy/clayey 6.54 6.46 6.28 6.41 6.50 6.50 6.52 6.53 6.55 6.99 sandy (pilot) 5.20 5.42 5.53 6.25 5.50 6.34 6.65 TOC (%) sandy 2.31 2.81 4.13 6.50 2.94 6.22 7.83 2.99 5.45 7.95
loamy/clayey 2.19 2.75 5.41 9.02 3.09 6.74 6.01 3.53 6.23 10.84 sandy (pilot) 2.69 2.69 4.58 7.23 2.69 4.02 6.54 BD (g cm
-3)
sandy 1.15 0.90 0.87 0.90 loamy/clayey 1.16 0.78 0.94 0.92
%CEC incr sandy 21.52 35.18 47.70 21.14 30.25 25.58 18.67 21.75 26.86
WHC (%) sandy 53.53 52.89 73.89 105.36 60.42 75.68 90.07 32.03 79.70 146.77 loamy/clayey 52.55 54.19 62.48 75.40 54.34 59.64 71.55 56.05 60.02 72.51
sandy (pilot) 54.54 60.45 64.64 70.34 56.78 62.71 66.74
TOC: total organic carbon; BD: bulk density; CEC: cation exchange capacity;
WHC: water holding capacity (replicated measurements taken only in the acid soil of the pilot
experiment.
Note: HTT 400 does not apply to values for the pilot experiment since no HTT is available for the ibc
biochar.
5.1.1 Impact on soil properties
Figures 5.2, 5.3a and 5.3b show the impact of the various levels of biochar
amendments (1, 5 and 10% ; 10, 50 and 100t/ha) on the pH of amended soils. Figure
5.2 is for the acid soil amended with ibc and kbc800 biochars used in the pilot
experiment while Figures 5.3a and b are for acid soil amended with ss biochar in the
first experiment and near neutral soil amended with ess biochar in the second
experiment respectively. Comparing the controls (unamended soils) with the amended
soils, statistical treatment of the data (Table 5.2) shows the 5 and 10% amended soils
in the pilot and first experiments differ significantly from their respective controls
(Univariate ANOVA, Post Hoc Tests, p = 0.000), while the 1% amendment in both cases
is not significantly different from the controls.

66
1ibc5ibc
10ibc
1kbc800
5kbc800
10kbc800
Control
pH
4.0
4.5
5.0
5.5
6.0
6.5
7.0
Figure 5.2: Impact of ibc and kbc800 biochars on the pH of the acid soil used in the pilot experiment. The initial numbers in the sample codes represent weight percent of added biochar. Error bars represent ±SE of the means.
ibc: an interreg biochar; kbc: biochar from a previous research project (see Chapter 3 Table 3.3).
1ss400, 1ess400: 1% amendment with 400oC Lancashire and Edinburgh biochar respectively.
For the near neutral soil (Figure 5.3b) none of the pH values of the amended soils
significantly differed from the control; p values are 0.521 for the 1%, and 0.138 for
each of the 5% and 10% amendment levels (Table 5.2).
Figure 5.3: Impact of different levels of amendments using biochar at the different highest
temperature of treatments on soil pH for (a) low pH and (b) near-neutral soils. Error bars represent ±SE of the means.
1ss400
5ss400
10ss400
1ss600
5ss600
10ss600
1ss800
5ss800
10ss800
Control
pH
4.0
4.5
5.0
5.5
6.0
6.5
7.0
a
1ess400
5ess400
10ess400
1ess600
5ess600
10ess600
1ess800
5ess800
10ess800
Control
b

67
Table 5.2: Analysis of variance results comparing p values between controls and factors (amendment level and highest temperature of treatment) for the amended soil properties investigated. This goes to test the fourth hypothesis of this study.
Experiment Pilot 1st 2nd
Soil type acid Near neutral Variable Amendment
level (%) 1 5 10 1 5 10 1 5 10
pH Control x 0.124 0.000* 0.000* 0.059 0.000* 0.000* 0.521 0.138 0.138 BD n.d. n.d. n.d. n.d. n.d. n.d. n.d. n.d. n.d. CEC n.d. n.d. n.d. 0.000* 0.000* 0.000* n.d. TOC 0.991 0.011* 0.000* 0.501 0.007* 0.000* 0.346 0.001* 0.000* WHC 0.009* 0.000* 0.000* n.d. n.d. n.d. n.d. n.d. n.d. HTT (
oC) 400 600 800 400 600 800 400 600 800
pH Control x n.d. n.d. 0.000* 0.014* 0.012* 0.000* 0.025* 0.612 0.033* BD n.d. n.d. n.d. 0.000* 0.000* 0.000* 0.000* 0.000* 0.000* CEC n.d. n.d. 0.000* 0.000* 0.000* n.d. TOC n.d. 0.006* 0.031* 0.003* 0.004* 0.003* 0.003* 0.000* WHC n.d. 0.000* n.d. n.d. n.d. n.d. n.d. n.d.
*mean difference significant at the 0.05 level
n.d.: not determined; for the pilot experiment due to lack of information on the HTT for one of the biochars (ibc).
BD: bulk density (measured only for 5% amended soils in both test soils).
CEC: cation exchange capacity (measured only in the first experiment); TOC: total organic carbon.
WHC: water holding capacity (replicated measurements taken only in the pilot experiment).
1st
experiment is the first set of experiments after the pilot where ss biochar was used to amend the acid soil (see Chapter 3 section 3.6 Table 3.2)
2nd
experiment is the second set of experiments where ess biochar (at all amendment levels) and ss biochar (only at 5% amendment level) were used to amend the near neutral soil (see Chapter 3 section 3.6 Table 3.2).
Two factor ANOVA was done on all the soil properties data (Table 5.3) to determine
differences between the amendment levels and the biochars’ highest temperature of
treatment (HTT). For the pH, the three amendment levels significantly differ from each
other in the pilot experiment (Univariate ANOVA, Post Hoc Tests, p = 0.002 (1x5); p =
0.000 (1x10) and p = 0.004 (5x10)), while in the first experiment there is no significant
difference between the 5 and 10% amendment levels (Univariate ANOVA, Post Hoc
Tests, p = 0.153) and no significant difference between the 1 and 5% amendment
levels for the pH in the near neutral ess amended soil (Univariate ANOVA, Post Hoc
Tests, p = 0.221). The pH in both the acid and near neutral soils shows significant
differences between the three HTT’s except for the insignificant difference between
the 400 and 600oC biochars in the acid soil (Table 5.3; Univariate ANOVA, Post Hoc
Tests, p = 0.933). This reflects the major trend of increased pH values for the biochars
with rise in HTT (see Chapter 4, section 4.2.3 and Table 4.4).
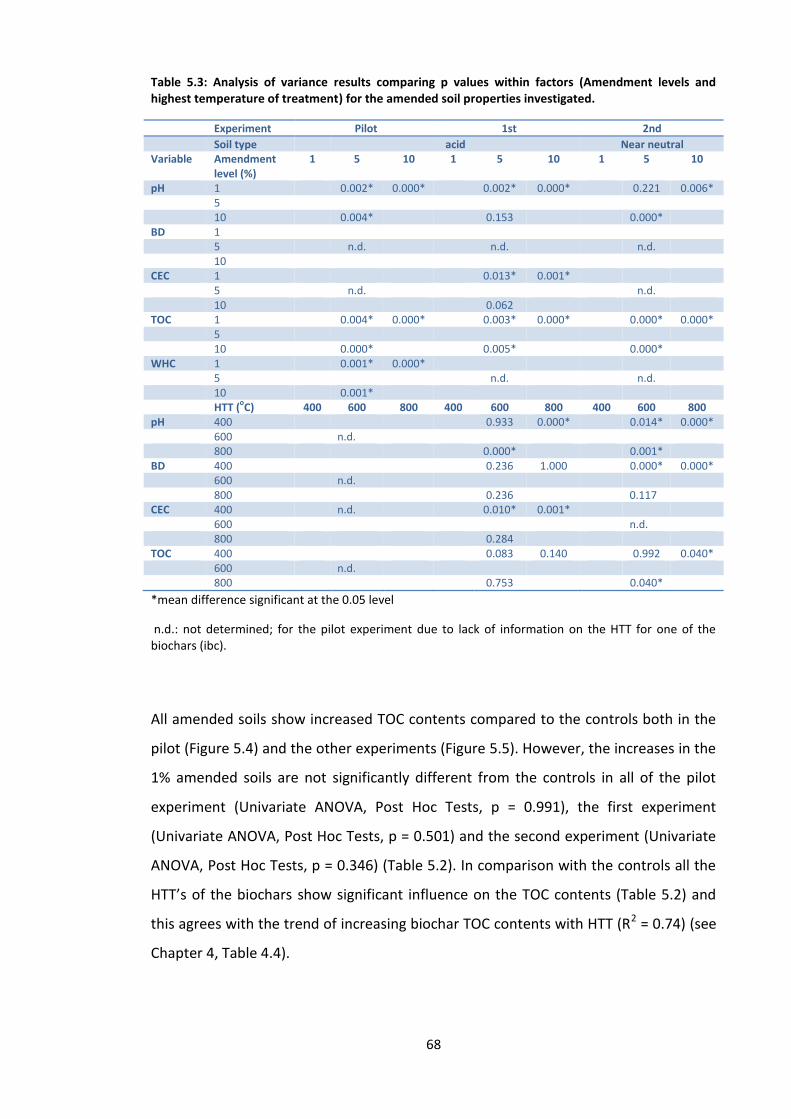
68
Table 5.3: Analysis of variance results comparing p values within factors (Amendment levels and highest temperature of treatment) for the amended soil properties investigated.
Experiment Pilot 1st 2nd
Soil type acid Near neutral Variable Amendment
level (%) 1 5 10 1 5 10 1 5 10
pH 1 0.002* 0.000* 0.002* 0.000* 0.221 0.006* 5 10 0.004* 0.153 0.000* BD 1 5 n.d. n.d. n.d. 10 CEC 1 0.013* 0.001* 5 n.d. n.d. 10 0.062 TOC 1 0.004* 0.000* 0.003* 0.000* 0.000* 0.000* 5 10 0.000* 0.005* 0.000* WHC 1 0.001* 0.000* 5 n.d. n.d. 10 0.001* HTT (
oC) 400 600 800 400 600 800 400 600 800
pH 400 0.933 0.000* 0.014* 0.000* 600 n.d. 800 0.000* 0.001* BD 400 0.236 1.000 0.000* 0.000* 600 n.d. 800 0.236 0.117 CEC 400 n.d. 0.010* 0.001* 600 n.d. 800 0.284 TOC 400 0.083 0.140 0.992 0.040* 600 n.d. 800 0.753 0.040*
*mean difference significant at the 0.05 level
n.d.: not determined; for the pilot experiment due to lack of information on the HTT for one of the biochars (ibc).
All amended soils show increased TOC contents compared to the controls both in the
pilot (Figure 5.4) and the other experiments (Figure 5.5). However, the increases in the
1% amended soils are not significantly different from the controls in all of the pilot
experiment (Univariate ANOVA, Post Hoc Tests, p = 0.991), the first experiment
(Univariate ANOVA, Post Hoc Tests, p = 0.501) and the second experiment (Univariate
ANOVA, Post Hoc Tests, p = 0.346) (Table 5.2). In comparison with the controls all the
HTT’s of the biochars show significant influence on the TOC contents (Table 5.2) and
this agrees with the trend of increasing biochar TOC contents with HTT (R2 = 0.74) (see
Chapter 4, Table 4.4).

69
1ss400
5ss400
10ss400
1ss600
5ss600
10ss600
1ss800
5ss800
10ss800
Control
Tota
l O
rganic
Carb
on (
%)
0
2
4
6
8
10
12
14
a
1ess400
5ess400
10ess400
1ess600
5ess600
10ess600
1ess800
5ess800
10ess800
5ss400
5ss600
5ss800
Control
b
1ibc5ibc
10ibc
1kbc800
5kbc800
10kbc800
Control
TO
C (
%)
0
2
4
6
8
10
12
14
Figure 5.4: Impact of ibc and kbc800 biochars on the total organic carbon contents of the acid soil used in the pilot experiment. The initial numbers in the sample codes represent weight percent of added biochar. Error bars represent ±SE of the means.
Comparison between the amendment levels shows they have significantly different
impacts on the TOC contents of the amended soils (Table 5.3). But a similar
comparison between the HTT’s shows significantly different influences on TOC
contents only between the 400/800 (Univariate ANOVA, Post Hoc Tests, p = 0.040) and
600/800oC (Univariate ANOVA, Post Hoc Tests, p = 0.040) biochars in the near neutral
Figure 5.5: Impact of the different biochars used at different amendment levels on the total organic carbon contents of (a) the low pH soil and (b) the near-neutral soil. Error bars represent ±SE of the means.

70
soil (Table 5.3). The increases in the TOC contents of the amended soils with both
amendment levels and HTT’s of the biochars is a reflection of the trend in T
contents of the biochars (Chapter 4, section 4.2.3, Table 4.4).
Figure 5.6 shows all bulk densities of the 5% amended soils are lower than the
respective unamended controls. There were no post hoc tests for amendments on bulk
density data (Tables 5.2 and 5.3) because the property was determined on the same
amendment level (5%) in both soil types. But compared to the control, the different
biochar HTT’s show a significant lowering effect on the bulk density (Univariate ANOVA,
Post Hoc Tests, p = 0.000 Table 5.2 in both soil types. However, between the HTT’s
significantly different influence on the BD exist only between 400/600 and 400/800oC
biochar pairs in near neutral soil.
Cation exchange capacity (CEC) was determined only for the ss amended acid soils and
is presented as percentage increase in CEC over the control unamended soil (Figure
5.7). All the amended soils have significantly different CEC from the control at all three
amendment levels and for all biochar HTT’s (Univariate ANOVA, Post Hoc Tests, p =
0.000) (Table 5.2). However, comparing p values within the factors (amendment level
and biochar HTT’s shows no significant E difference between the 5 and 10
amended soils (Univariate ANOVA, Post Hoc Tests, p = 0.062) (Table 5.3) just as there is
no significant difference influencing the CEC between the 600 and 800oC biochars
(Univariate ANOVA, Post Hoc Tests, p = 0.284) (Table 5.3).
Figure 5.6: Impact of the different biochars at 5% amendment rate on the bulk density of (a) the low
pH soil and (b) the near- neutral soil. Error bars represent ±SE.
5ss400 5ss600 5ss800 Control
0.0
0.2
0.4
0.6
0.8
1.0
1.2
1.4
Bulk
density (
gcm
-3)
a
5ess400
5ess600
5ess800
5ss400
5ss600
5ss800
Control
b

71
1ss400
5ss400
10ss400
1ss600
5ss600
10ss600
1ss800
5ss800
10ss800
CEC
incr
ease
(%)
0
10
20
30
40
50
60
Figure 5.7: Percentage increase in cation exchange capacity for the ss amended low pH soils over the
control. Error bars represent ±SE of the mean.
Figure 5.8 shows changes in water holding capacity (WHC) of the amended acid soil
from the pilot experiment while Figure 5.9 shows the impact of amendment on the
acid and near neutral soils. Replicate measurements were only taken on the pilot
amended soils hence the only ones for which statistical treatment of data are available
(Tables 5.2 and 5.3). Compared with the control, all the amended soils have
significantly different WHC values (Table 5.2). The amendment levels also have
significantly different influences between them on the WHC of the amended soils
(Table 5.3; p values, 0.000 and 0.001). These ANOVA results could be assumed to be
true at least for the amended soils of the first experiment (Figure 5.9a) where the
same soil as the pilot was used.

72
1ibc5ibc
10ibc
1kbc800
5kbc800
10kbc800
Control
Wat
er h
oldi
ng c
apac
ity (%
)
0
20
40
60
80
100
120
140
160
Figure 5.8: Impact of the different levels of biochar amendments on the water holding capacity of the low pH soils from the pilot experiment. Error bars represent ±SE of the mean and those not visible have too small values.
1ss
400
5ss
400
10ss
400
1ss
600
5ss
600
10ss
600
1ss
800
5ss
800
10ss
800
Control
Wate
r hold
ing c
apacity (
%)
0
20
40
60
80
100
120
140
160
a
1ess400
5ess400
10ess400
1ess600
5ess600
10ess600
1ess800
5ess800
10ess800
Control
b
Figure 5.9: Impact of the different levels of biochar amendments on the water holding capacity of the (a) low pH and (b) near-neutral soils.

73
5.2.2 Impact on leek growth
The rates of Leek growth in mm/week in the pilot experiment are shown in Figure 5.10
while Figure 5.11 shows the leek growth rates in the two other plant trial experiments.
Compared to the controls, only 1% (10t/ha) amended acid soil shows significantly
different (Univariate ANOVA, Post Hoc Tests, p = 0.018) leek growth rate in the pilot
experiment which from Figure 5.10 is obviously due to the wilted growth of the leeks
in the 1% amended soil. The reason for this is not clear since if it were toxicity due to
amendment there should have been a greater effect in the higher amendments. Only
the 5% amendment in the first experiment (Univariate ANOVA, Post Hoc Tests, p =
0.015) is significantly different from the control but none of the amendment levels in
the near neutral soil of the second experiment showed any significant difference
compared to the control (Univariate ANOVA, Post Hoc Tests, p > 0.05) (Table 5.4).
Influence of biochar HTT on the growth rate is only significant for the 600oC biochar in
the acid soil of the first experiment (Table 5.4, Univariate ANOVA, Post Hoc Tests, p =
0.041). Two factor ANOVA shows no significant difference (p > 0.05) in impact on leek
growth rate between any pair of amendment levels or biochar HTT’s in both the first
and second experiments (Table 5.5).
ibc kbc800 Control
Rate
(m
m/w
eek)
-0.2
0.0
0.2
0.4
0.6
1%
5%
10%
Control
Figure 5.10: Leek growth rates in the pilot experiment. The acid soil was amended with the interreg (ibc) and previous project (kbc800) biochars. Error bars represent ±SE of the means.
Rates were calculated as slopes of linear regression lines from plots of leek diameter against sampling
times for each treatment in the replicated experiments. Percentages are amendment rates and the
control contained the unamended soil. Negative rate represents wilted growth.

74
Figure 5.11 Leek growth rates in (a) the acid soil amended with Sitka spruce (ss) biochar and (b) the near-neutral soil amended with Edinburgh Sitka spruce (ess) biochar.
Rates were calculated as slopes of linear regression lines from plots of leek diameter against sampling
times for each treatment in the replicated experiments. The biochars on the x-axis represent biochars
used for amendment in each case while percentages are amendment rates and the control contained
the relevant unamended soil in each case. Error bars represent ±SE.
Table 5.4: Analysis of variance results comparing controls with factors (amendment levels and highest temperature of treatment) for leek growth rates in the amended soils.
Experiment Pilot 1st 2nd
Soil type used acid Near neutral Amendment level (%)
1 5 10 1 5 10 1 5 10
Control x 0.018* 0.886 0.360 0.059 0.015* 0.205 0.361 0.370 0.436 HTT (oC) 400 600 800 400 600 800 400 600 800 Control x n.d. 0.450 0.057 0.041* 0.094 0.156 0.875 0.324 *mean difference significant at the 0.05 level
n.d.: not determined; for the pilot experiment due to lack of information on the HTT for one of the biochars (ibc).
Table 5.5: Analysis of variance results comparing p values within factors (amendment level and highest temperature of treatment) for leek growth rates in the amended soils.
Experiment Pilot 1st 2nd
Soil type used acid Near neutral Amendment level (%) 1 5 10 1 5 10 1 5 10 1 0.008* 0.001* 0.365 0.342 0.981 0.845 5 10 0.202 0.072 0.864 HTT (oC) 400 600 800 400 600 800 400 600 800 400 0.824 0.710 0.078 0.520 600 n.d. 800 0.553 0.243 *mean difference significant at the 0.05 level
ss400 ss600 ss800 Control
Rate
(m
m/w
eek)
0.0
0.1
0.2
0.3
0.4
0.5
0.6
1%
5%
10%
Control
a
ess400 ess600 ess800 Control
b

75
n.d.: not determined; for the pilot experiment due to lack of information on the HTT for one of the biochars (ibc).
Figure 5.12 shows leek growth rates in the two soils with their respective controls at 5%
amendment using the ss biochar. Fixing the biochar type (ss) and amendment rate (5%)
allows for a direct comparison of the influence of biochar HTT’s and soil type on leek
growth rates in the two different soils. Compared to their respective controls, biochar
pyrolysis temperature has significant impact on leek growth rates in the acid soil (p <
0.05) but not in the near neutral soil (p > 0.05) (Table 5.6). Table 5.7 shows significant
difference in leek growth rate between the two different soil types (p < 0.05) but not
between pairs of biochar types (p > 0.05).
ss400 ss600 ss800 Control
Ra
te (
mm
/we
ek)
0.0
0.1
0.2
0.3
0.4
0.5
0.6
Low pH
Near-neutral pH
Control low pH
Control Near-neutral pH
Figure 5.12 Leek growth rates at 5% ss amendment in the two soils
Table 5.6: Analysis of variance results comparing controls with factors for leek growth rates at 5% amendment in the acid and near neutral soils
HTT (oC) 400 600 800 Acid control
Acid control x 0.002* 0.001* 0.008* Near neutral control x 0.206 0.329 0.061 0.000* Soil type Near neutral Acid Acid control Acid control x 0.000* 0.055 Near neutral control x 0.823 0.005* 0.000* *mean difference significant at the 0.05 level

76
Table 5.7: Analysis of variance results for within factors comparison for leek growth rates at 5% amendment in the acid and near neutral soils
HTT (%) 400 600 800
400 0.707 0.404 600 800 0.233 Soil type Acid Near neutral Acid 0.000* Near neutral 0.000* *mean difference significant at the 0.05 level
Figure 5.13 compares leek growth rates in 5% ss and ess amended near neutral soil
which fixes amendment level and soil type and hence allows for assessing the impact
of the two biochars from the two different production streams on leek growth rates
and also the influence of HTT on leek growth. Compared to the control, none of
biochar type and HTT has significant influence on leek growth (p > 0.05) (Table 5.8).
Similarly there is insignificant difference (p > 0.05) in impact between the factors
(biochar type and HTT) (Table 5.9)
5% in near neutral soil
ss400
ess400ss600
ess600ss800
ess800
Control
Rate
(m
m/w
eek)
0.0
0.1
0.2
0.3
0.4
0.5
0.6
Figure 5.13: Leek growth rates at 5% ss and ess amendments in the near neutral soil

77
Table 5.8: Analysis of variance results comparing controls with factors for leek growth rates at 5% ss and ess amendment in the near neutral soil
HTT (oC) 400 600 800
Control x 0.236 0.468 0.791 Biochar type ss ess Control x 0.830 0.191
Table 5.9: Analysis of variance results for within factors comparison for leek growth rates at 5% ss and ess amendment in the near neutral soil
HTT (%) 400 600 800
400 0.556 0.255 600 800 0.569 Biochar type ss ess ss 0.124 ess 0.124
Combined ANOVA was done on all leek growth data across the two soils comparing
unamended controls with amendment levels of the amended soil, biochar HTT’s and
soil types (Table 5.10); comparison within the factors (Table 5.11) and interactions
between the factors (Table 5.12). Significant leek growth increases relative to the
control resulted from the 5% and 10% amendment levels (Table 5.10, p < 0.05) only in
the acid soil but there is no significant difference between the two amendment levels
(Table 5.11, p = 0.583) on influencing leek growth. The 400 and 600oC biochars have
significantly different influence (p < 0.05) on leek growth compared to the control but
compared between the HTT pairs there is no significant difference (Table 5.11, p >
0.05). All these confirm the results of the separate ANOVA treatments (Tables 5.4 –
5.7).
Table 5.10: Combined Analysis of variance across experiments and soil types comparing controls with factors for leek growth rates
Amendment level (%) 1 5 10
Acid control x 0.364 0.007* 0.020* Near neutral control x 0.060 0.557 0.414 HTT (oC) 400 600 800 Acid control x 0.007* 0.040* 0.064 Near neutral control x 0.635 0.318 0.222 Soil type Acid Near neutral Acid control x 0.944 0.000* Near neutral control x 0.011* 0.404 *mean difference significant at the 0.05 level
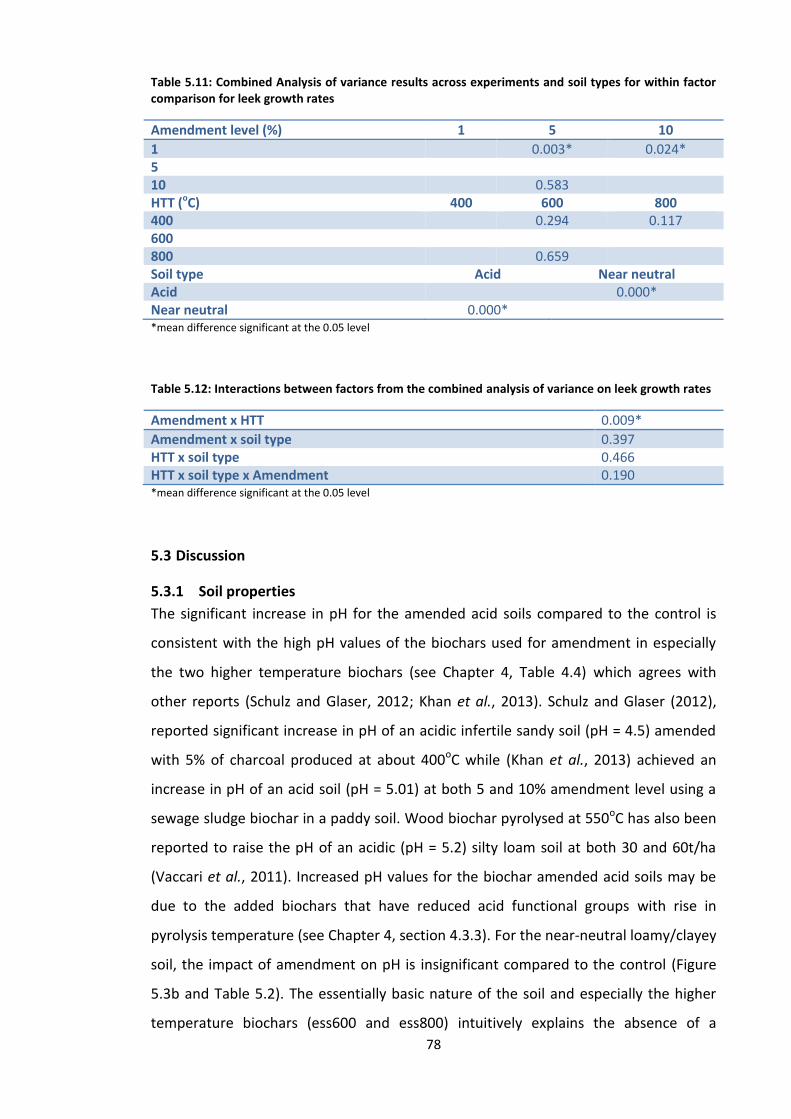
78
Table 5.11: Combined Analysis of variance results across experiments and soil types for within factor comparison for leek growth rates
Amendment level (%) 1 5 10
1 0.003* 0.024* 5 10 0.583 HTT (oC) 400 600 800 400 0.294 0.117 600 800 0.659 Soil type Acid Near neutral Acid 0.000* Near neutral 0.000* *mean difference significant at the 0.05 level
Table 5.12: Interactions between factors from the combined analysis of variance on leek growth rates
Amendment x HTT 0.009*
Amendment x soil type 0.397 HTT x soil type 0.466 HTT x soil type x Amendment 0.190 *mean difference significant at the 0.05 level
Discussion 5.3
5.3.1 Soil properties
The significant increase in pH for the amended acid soils compared to the control is
consistent with the high pH values of the biochars used for amendment in especially
the two higher temperature biochars (see Chapter 4, Table 4.4) which agrees with
other reports (Schulz and Glaser, 2012; Khan et al., 2013). Schulz and Glaser (2012),
reported significant increase in pH of an acidic infertile sandy soil (pH = 4.5) amended
with 5% of charcoal produced at about 400oC while (Khan et al., 2013) achieved an
increase in pH of an acid soil (pH = 5.01) at both 5 and 10% amendment level using a
sewage sludge biochar in a paddy soil. Wood biochar pyrolysed at 550oC has also been
reported to raise the pH of an acidic (pH = 5.2) silty loam soil at both 30 and 60t/ha
(Vaccari et al., 2011). Increased pH values for the biochar amended acid soils may be
due to the added biochars that have reduced acid functional groups with rise in
pyrolysis temperature (see Chapter 4, section 4.3.3). For the near-neutral loamy/clayey
soil, the impact of amendment on pH is insignificant compared to the control (Figure
5.3b and Table 5.2). The essentially basic nature of the soil and especially the higher
temperature biochars (ess600 and ess800) intuitively explains the absence of a

79
significant impact on the pH of the amended soil. Similar insignificant biochar
amendment effect on the pH of a non-acidic soil has been reported by Zhang et al.
(2012) who amended a high pH (8.38) calcareous loamy soil with a wheat straw
biochar (pH = 10.4) at 20 and 40 t/ha (about 2 and 4%) amendment levels. Haefele et al.
(2011) also reported no significant effect on the pH of an anthraquic Gleysol near
neutral soil (pH = 6.5) amended with 16 t/ha rice husk biochar (pH = 8.6).
The recorded two factors ANOVA on the pH data (Table 5.3) shows significant
difference between pH at the three amendment levels in the pilot soils; no significant
difference between 5 and 10% in the first experiment and no significant difference
between 1 and 5% in the near neutral soil. Hence, 5% amendment level could then be
the amendment level of choice across the two soil types dependent on the priorities of
achieving change in soil properties, maximizing agronomic effects and sequestering
carbon.
The significant increases in total organic carbon (TOC) contents in the low pH soil range
from 79% in 5ss400 to 244% in 10ss800 and from 147% in 5ess400 to 394% in
10ess800 in the near-neutral amended soil. These compare well with the report of
Zhang et al. (2012) who recorded 44% increase in soil organic carbon at 20t ha-1 (about
2%) application rate with a wheat straw biochar; other authors reported a 66.5%
increase in organic carbon contents at 41.3 t ha-1 (about 4%) using rice husk biochar in
a near neutral soil (Haefele et al., 2011). Another report (Khan et al., 2013) achieved a
550% increase in total carbon contents in a 5% amendment using sewage sludge
biochar in an acidic paddy soil. Organic matter (OM) is comprised mainly of organic
carbon, and in soils a lot of benefits are derived from OM; it serves as nutrient
reservoir and source of fertility, acts as a buffer against rapid changes in pH (soil
reaction), an energy source for soil microorganisms and contributes to soil aeration
that is important in reducing soil compaction and increasing infiltration rate and water
storage capacity (Jones et al., 2005). Zhang et al. (2012) compared crop (maize) N
usage in a fertilized unamended control and wheat straw biochar amended fertilized
calcareous soil of low organic carbon contents and reported significant increase in N
use efficiency (and increased crop yield) with increase in soil organic carbon due to
biochar addition. Biochar addition could also give a positive priming effect on soil
organic matter decomposition (Vaccari et al., 2011). Hence, the Sitka spruce biochar

80
can potentially boost the organic carbon contents of soils leading to a more stable soil
organic matter essential to enhanced nutrient availability, reduced bulk density,
increased aeration and water storage which are all important for boosting crop
production while simultaneously helping to sequester carbon in the soil environment
and even mitigate flood risks.
Biochar amendments have been reported to decrease the bulk density (BD) of soils.
Haefele et al. (2011), reported a 3% reduction in bulk density over the control at about
4% amendment with rice husk biochar, while others reported a 4.5% decrease in BD at
5% amendment rate using sewage sludge biochar produced at 550oC in an acid paddy
soil (Khan et al., 2013). Results in this study (Figure 5.6 and Table 5.1) show bulk
density reductions of between 22 – 24% in the acid soil and 19 – 32% in the near-
neutral soil at 5% biochar amendments. The bulk density values show little difference
between the amended soils as would be expected for same level of treatment and are
also in line with the almost equal bulk density values of the different biochars added to
the soils (see Table 4.4 in Chapter 4). But the bulk density is significantly lower than the
controls in both soils for all biochar HTT’s Table 5.2 . These reductions are much
higher than the reported 4.5% using sewage sludge biochar (HTT, 550oC) at 5%
amendment (Khan et al., 2013); 4% using woody biochar (HTT, 500oC) at 30 t/ha
amendment (Vaccari et al., 2011); and 19% using wheat straw biochar (HTT, 350-55oC)
at 40 t/ha (about 4%) (Zhang et al., 2012). The agronomic benefit of lowered bulk
density in amended soils could be in the form of reduced tensile strength that offers
cheaper tillage cost (Vaccari et al., 2011) and potential higher yield especially for root
crops like carrots and beetroot (Gartler et al., 2013). Hence, the biochar under study
here has the potential of enhancing the physical structure of amended soils making
them amenable to the growth of tubers and easy flow of water through the system.
The Cation Exchange Capacity (CEC) of the amended sandy soils was significantly
increased relative to the control (Table 5.2) across all amendments with percentages
ranging from 18.67 – 47.70% (Table 5.1). The difference in influence on CEC between 5%
and 10% amendment levels and between 600 and 800oC biochars is insignificant (Table
5.3) which makes 5% amendment with 400oC biochar a good choice for raising CEC in
amended soils. A more significant impact on CEC from 400oC biochar reflects the
measured CEC levels for the biochars which was highest for the lowest temperature
81
biochar (see Chapter 4, Table 4.4 and section 4.3.3). Increased soil CEC with biochar
amendment agrees with the observations of DeLuca et al. (2009) and Atkinson et al.
(2010) on the impact of biochar addition to soils. Enhanced Cation Exchange Capacity
helps in retention of nutrients (such as K and NH4+) and cycling within amended soils.
Though, while some reported CEC increase of about 13% (Sukartono et al., 2011) to as
high as 40% (Masahide et al., 2006), others reported a decrease of about the same
margin (Haefele et al., 2011) or no effect (Schulz and Glaser, 2012). This could be due
to differences in feedstock source, HTT, application rates and/or soil nature.
The significant increase in water holding capacity (WHC) for the amended soils relative
to the control in the pilot experiment (Figure 5.8 and Table 5.2) correlates well with
the TOC contents of the soils (Figure 5.14). Similar correlation plots show good linear
relationships for the ss amended soil (R2 = 0.72) and ess amended soil (R2 = 0.73).
However, for the biochars the two measured properties (TOC and WHC) show a linear
relationship but with a negative slope (Figure 5.15) for both ss and ess biochars (see
hapter , Table . . A similar plot for ess biochar gave a Pearson’s coefficient of R2 =
0.85.
Increased water holding capacity for an amended soil is a positive agronomic impact
since enhanced WHC translates into more water availability to plants (Asai et al., 2009)
and is also a possible remedy in free draining soils (Atkinson et al., 2010) that are
susceptible to causing the flooding of surrounding infrastructures during storm events.
Recent changes in the rainfall pattern in the UK that has led to frequent flooding
events point to the great importance of enhancing the soil’s ability to retain more
water.

82
TOC (%)
2 3 4 5 6 7 8
WH
C (
%)
56
58
60
62
64
66
68
70
72
R2 = 0.90
Figure 5.14: Relationship between total organic carbon (TOC) and water holding capacity (WHC) for the amended acid soil from the pilot experiment.
TOC (%)
72 74 76 78 80 82 84 86 88 90 92 94
WH
C (
%)
34
36
38
40
42
44
46
48
R2 = 0.97
Figure 5.15: Relationship between total organic carbon (TOC) and water holding capacity (WHC) for the ss biochar used to amend the acid soil in both the pilot and first experiments.

83
Compared to the controls, our results show WHC increases by between 13 – 174% in
the sandy soil and 3 – 44% in the near-neutral soil across the amendment rates. Higher
increase margins in the amended sandy soils compared to the loamy/clayey soils
confirms a possibility suggested by Atkinson et al. (2010) who reviewed potential
mechanisms for achieving agricultural benefits through the addition of biochar to
temperate soils. The authors reported works that showed sandy soils having higher
water holding capacity on treatment with biochar compared to similarly amended
clayey or loamy soils.
5.3.2 Leek growth
The provision of food crops is one of the most important functions of the soil (Kennedy
and Smith, 1995), consequently plant growth depends on soil properties such as
nutrient availability, pH, plant available water, and a functional microbial community
that plays important role in soil organic matter decomposition. Deficiency and/or
extremes in any of these variables could limit plant growth (Mingorance et al., 2014).
The impact of biochar amendment on leek growth is therefore discussed in relation to
the impact of amendment on the soil properties treated in the previous section. The
stated objective in this Chapter was to assess how biochar produced at different
pyrolysis temperatures alters the agronomic properties of soil to which it was added
and what impact that had on plant growth. To facilitate a systematic investigation,
biochars used were from same feedstock; same test plant with same level of
fertilization and water regimen used; and same biochar addition rates. Statistical
treatment of the overall data was also used to assess interactions between the trio of
soil type, biochar HTT and amendment rates across the two soil types in addition to
separate treatment of leek growth data in the two soil types (acidic sandy and near
neutral loamy/clayey) and three experiments (the pilot, first and second) (see Chapter
3, Table 3.2).
Significant leek growth relative to the control in the acid soil resulted only from 5%
amendment (Univariate ANOVA, Post Hoc Tests, p = 0.015) with ss600 biochar
(Univariate ANOVA, Post Hoc Tests, p = 0.041) (Tables 5.4 and 5.5). The growth could
be due to increased TOC, WHC and decreased BD over the control (Table 5.1). TOC
correlates well with WHC in the acid soil (Table 5.1 and Figure 5.14). Increased biomass
growth due to biochar addition could result from positive priming on soil organic

84
matter decomposition leading to faster mineralisation and improved nutrient
availability (Vaccari et al., 2011). These authors used wheat as a test plant and applied
a wood biochar (HTT, 500oC) into a silty loam soil of pH 5.2. Schulz and Glaser (2012)
applied barbecue charcoal (HTT, 400oC) along with charcoal + compost and charcoal +
mineral fertilizer at 5% amendment into a modelled infertile sandy soil planted with
oat (Avena sativa L.) to test impact on soil fertility and plant growth and concluded
that biochar addition raised soil organic matter, soil fertility and increased plant
growth. However, in the near neutral soil biochar addition has no significant impact
compared to the control p > 0.05 at all amendment levels for all biochar HTT’s Table
5.4) even though from Table 5.1 the amended soils have increased TOC, WHC and
decreased BD compared to the control. The reason could be due to the soil pH which
was not greatly affected being already high which itself also may explain the better
overall leek growth in the near neutral soil (Figure 5.11).
Both soil types received the same level of mineral fertilization (see Chapter 3, Table 3.2)
in addition to having similar levels of TOC, WHC and BD (Table 5.1) and therefore none
of these parameters could be the reason for the limited leek growth in the acid soil
compared to the near neutral. The pH levels of the amended acid soils (4.42-4.77) and
the near neutral soils (6.28-6.99) could explain the leek growth differences in the two
soils (Figure 5.12 and Table 5.6) as the optimum pH for leek growth is estimated to be
6.0-6.8.
(http://www.extension.umn.edu/garden/yard-garden/vegetables/leeks/doc/M1230.pdf
Accessed on 19/05/2014)
Soil pH could limit plant growth in a number of ways that centre on availability or lack
of it of nutrients both macro (N, P, K, Ca and Mg) and micro (Fe, Mn and Zn) and also
the presence and uptake by plants of Al3+ that is phytotoxic in its various forms. Low
soil pH solubilise Al3+ species in soil which go on to displace macro nutrients from the
soil and cation exchange sites (Cristancho et al., 2014) thus starving the plant of
nutrients needed for growth. Masahide et al. (2006) partly ascribed low productivity of
maize, cowpea and peanut in their control soils to low pH (4.1), low nutrients and high
Al3+ (2.61 molc/Kg). Other authors also observed that close to neutral pH favours
nutrient availability and increased crop yield (Vaccari et al., 2011). Schulz and Glaser
(2012), also reported significant increase in available K with increased soil pH.

85
Conclusion 5.4
The combined results in this Chapter and statistical treatment of the data positively
show that addition of Sitka spruce biochar to the test soils did impact to a certain
extent the growth of leek by altering some of the physico-chemical properties of the
soil environment in which the plant was grown. Significant soil property changes
compared to unamended controls include raising the TOC and lowering BD in both the
acid and near neutral soils (p < 0.05); the pH in the acid soil (p < 0.05) but not in the
near neutral soil (p > 0.05); and increasing the CEC and WHC (p < 0.05) although
replicated measurements on these last two properties were only determined in the
acid soil. The alteration of these soil properties due to biochar addition was also
significantly influenced by changing the pyrolysis temperatures of the biochars (HTT)
used for amendment which makes the fourth hypothesis put forward in this study
acceptable.
Sitka spruce biochar addition to the test soils significantly influenced leek growth
compared to the controls only in the acid soil and not in the near neutral soil (Table
5.10). More directly related to the fifth hypothesis in this investigation, altering the
biochar HTT had no significant effect on leek growth in both soils (Table 5.11) and
hence the fifth hypothesis is rejected.
Another conclusion that could be drawn from this study is that production process did
not significantly influence the impact of these biochars on leek growth (Figure 5.13 and
Tables 5.8 & 5.9).
From the ANOVA results in Tables 5.2 and 5.3, a suggested suitable dosage of Sitka
spruce biochar could be 5% (50 t/ha) of 600oC biochars for enhanced pH in sandy acid
soil; 1% (10 t/ha) of 400oC biochars for enhanced TOC in both acidic sandy soil and
near neutral loamy clayey soil; 5% of 600oC biochars for enhanced CEC in acid soil; and
1% amendment level for enhanced WHC in acid soil (no ANOVA result for near neutral
soil and no HTT chosen due to lack of full information on it since replicate
measurement for WHC was only determined in the acid soil of the pilot experiment).
Similarly from the ANOVA results in Tables 5.10 and 5.11, a dose of 5% 400oC biochars
could be suggested for enhanced leek growth in the acid soil only.
86
Chapter 6 Soil processes and soil microbial community structure as a
function of biochar amendment
: Introduction 6.1
Biochar is receiving increasing attention from researchers due to its use as a soil
fertility enhancer (Zimmerman et al., 2011; Dempster et al., 2012; Yoo and Kang, 2012)
and its effect in abating climate change through its potential for both reducing
greenhouse gas (GHG) emissions (Spokas et al., 2010; Yoo and Kang, 2012; Harter et al.,
2013) and sequestering atmospheric carbon dioxide in soils. This is due to its relative
inertness and resistance to microbial degradation (Spokas et al., 2009). Carbon dioxide
(CO2) is the primary greenhouse gas and anthropogenic activities in the form of fossil
fuel combustion and deforestation are blamed for increases in its atmospheric
concentrations. Biochar as a product which has a high concentration of carbon
contributes greatly when used as a soil improver in withdrawing CO2 from the
atmosphere, in addition to its suppression of basal respiration (CO2 emissions) from
soil environments (Calvelo Pereira et al., 2011).
A productive or fertile soil that is essential to sustainable agriculture invariably
depends on the maintenance of healthy, diverse and functional microbial populations
(Kennedy and Smith, 1995; Lehmann et al., 2011) due to the pivotal role they play in
organic matter decomposition, nutrient cycling and many other ecosystem services
provided by the soil (Liu et al., 2006; Ritz et al., 2009). In an effort to cater for the
growing world population, human activity has placed many ecosystems under pressure
from unsustainable use of land resources through deforestation and intensive
mechanised agricultural production (Kennedy and Smith, 1995). Microbial populations
are quite intimate in their contact and interaction with the soil environment and are
therefore very sensitive and respond to such environmental stresses (Kennedy and
Smith, 1995; Bloem and Breure, 2003; Sheppard et al., 2005) in terms of their structure,
diversity and functions (Webster et al., 2002; Gray et al., 2003; Harter et al., 2013).
Thus, the role of biochar as a climate change mitigation tool can only be valuable if the
biochar does not negatively impact on normal soil microbial mediated processes that
are central to the maintenance of soil health.
The term ‘soil health’ is in some ways synonymous to ‘soil quality’ and a healthy soil
should be fit for contemporary purposes that include the provision of a whole
87
spectrum of ecosystem goods and services (Haygarth and Ritz, 2009), such as food
crops and livestock and the provision of space for buildings and recreation (Kennedy
and Smith, 1995). Soils are extremely complex, heterogeneous (Haygarth and Ritz,
2009) and heavily populated by microorganisms; a gram of soil could be home to close
to 10 billion microbes with a diversity running into thousands of different species
(Torsvik and Øvreås, 2002).
The scope of this Chapter is limited to investigating the impact of biochar amendments
in a low pH (pH = 4.38) and a near-neutral (pH = 6.67) soils, on:
Basal Respiration (BR) measured as evolved carbon dioxide, which doubles as
an estimate of microbial activity (Winding et al., 2005) and as an intrinsic
indicator of C cycling which is fundamental to soil function (Ritz et al., 2009).
Denitrification Enzyme Activity (DEA) measured as released nitrous oxide
(N2O), which indicates on soil function in nutrient (N) cycling (Liu et al., 2006),
and
Microbial diversity that is one of the three microbiological parameters (amount
of biomass, the activity and the diversity of the microbial community) that
could be measured to monitor environmental stress resulting from
anthropological soil management practices (Bloem and Breure, 2003).
The choice of these properties for investigation in this study is based on the very
sensitive response of microorganisms to environmental stress, which makes biological
parameters effective candidates as indicators for environmental monitoring and
ecological risk assessment (Kennedy and Smith, 1995; Bloem and Breure, 2003). The
hypothesis (see Chapter 1 section 1.4) to be tested here was,
Increasing pyrolysis temperature progressively alters biochar’s ability to
influence the selection of resultant microbial communities and microbial
mediated processes e.g. respiration, and nitrogen cycling in soil environments.
Laboratory-based microcosms were used to incubate biochar-amended soils recovered
from 12-14 week pot experiments (see Chapter 3 for details on method) and the flux of
CO2 and N2O in the headspace (as indicators of soil microbial activity), were measured
for the biochar treated soils and controls (unamended soil and fresh biochar).

88
Although it is said to be recalcitrant (Forbes et al., 2006; Kuzyakov et al., 2009; Harvey
et al., 2012) and largely unavailable to soil microorganisms (Anderson et al., 2011),
biochar controls were considered because, it cannot be immune to degradation at
some rate (Zimmerman, 2010). This degradation is reported to possibly be both abiotic
(Cheng et al., 2006) and biotic (Zimmerman, 2010).
To qualitatively assess biochar’s impact on the indigenous microbial population,
microbial diversity patterns in the amended soils were assessed. To this end,
Polymerase Chain Reaction (PCR) products of bacterial 16S rRNA genes amplified from
DNA extracts of the amended soils and controls were separated using Denaturing
Gradient Gel Electrophoresis (DGGE). DGGE is a culture-independent molecular
technique (see Chapter 3 for method), where gene fragment separation is achieved
based on differences in the electrophoretic mobility of denatured (partially melted)
DNA fragments through a polyacrylamide gel; sequence variants (representing
individual bacterial species) melt at different temperatures and stop migrating through
the gel when they melt, hence the separation to produce a barcode pattern
representing the diversity of the system (Muyzer et al., 1993). Critically DGGE
represents a rapid if crude diversity fingerprinting method that allows a comparison of
diversity patterns across the replicated experimental treatments in this study.
Results 6.2
6.2.1 Basal respiration (BR)
The results for basal respiration (as rates in µg CO2/g soil/hour) measured 13 weeks
after biochar amendment from the plant trial pot soils are presented in Figures 6.1, 6.2
and 6.3. For the pilot experiment, Figure 6.1 represents rates of CO2 production in the
microcosms containing the low pH sandy soil amended with ibc and kbc800 biochars
at the three levels of treatment (1, 5, and 10% equivalent to 10, 50 and 100 t/ha) along
with a control soil that contained no biochar. Figure 6.2 shows a similar arrangement
for first experiment in which same type of soil as in the pilot was amended with ss
biochar while Figure 6.3 shows rates of CO2 production in the microcosms for the ess
biochar amended near neutral soils and unamended control. In all cases, the observed
data have been corrected by subtracting gas emissions from the biochar control before
producing the charts (Spokas et al., 2009). Additionally, all data were adjusted for
actual mass of soil in microcosms to remove the effect of dilution resulting from
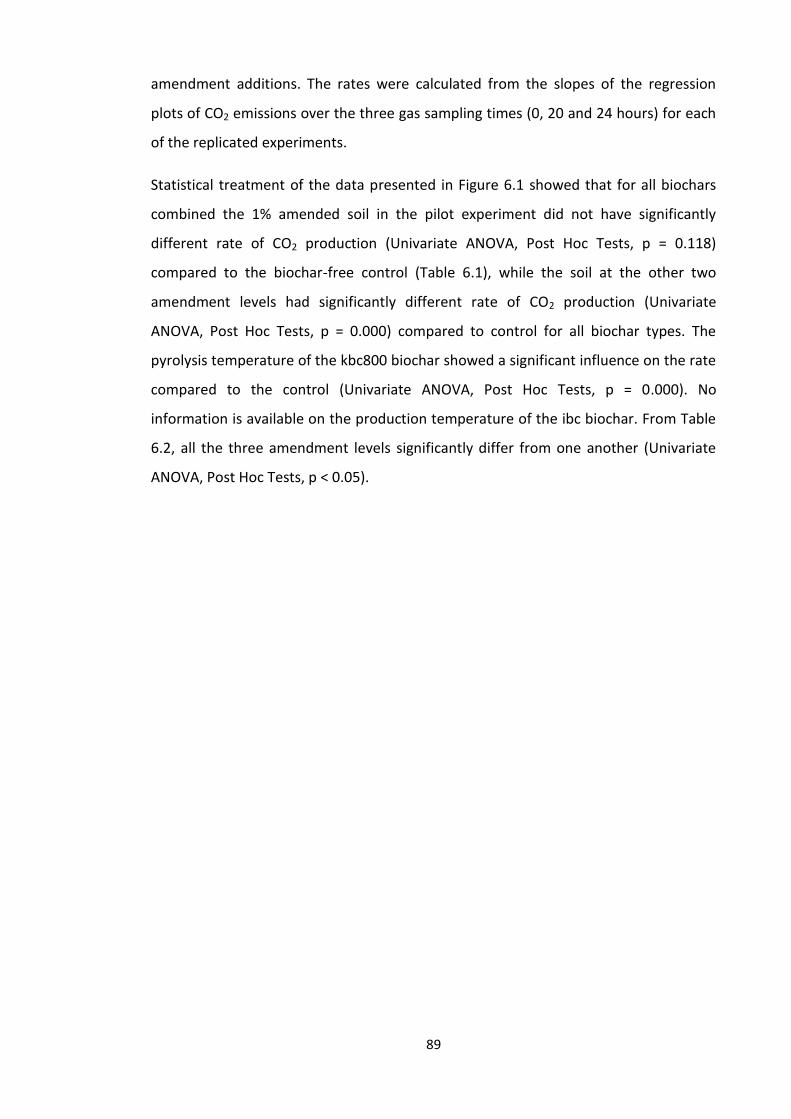
89
amendment additions. The rates were calculated from the slopes of the regression
plots of CO2 emissions over the three gas sampling times (0, 20 and 24 hours) for each
of the replicated experiments.
Statistical treatment of the data presented in Figure 6.1 showed that for all biochars
combined the 1% amended soil in the pilot experiment did not have significantly
different rate of CO2 production (Univariate ANOVA, Post Hoc Tests, p = 0.118)
compared to the biochar-free control (Table 6.1), while the soil at the other two
amendment levels had significantly different rate of CO2 production (Univariate
ANOVA, Post Hoc Tests, p = 0.000) compared to control for all biochar types. The
pyrolysis temperature of the kbc800 biochar showed a significant influence on the rate
compared to the control (Univariate ANOVA, Post Hoc Tests, p = 0.000). No
information is available on the production temperature of the ibc biochar. From Table
6.2, all the three amendment levels significantly differ from one another (Univariate
ANOVA, Post Hoc Tests, p < 0.05).

90
1ibc5ibc
10ibc
1kbc800
5kbc800
10kbc800
Control
Ra
tes (
ug C
O2/g
so
il/h
ou
r)
0
2
4
6
8
Figure 6.1: Rates of carbon dioxide production in the pilot experiment. Rates determined after subtracting carbon dioxide emissions due to biochar. Control was the unamended soil. Error bars (±SE) too small to be seen on plots.
In the main experiment (Figure 6.2), the rate of CO2 production significantly differed
from the control soil at all the amendment levels (Univariate ANOVA, Post Hoc Tests, p
= 0.000) and the amendment levels had significantly different influences on the rate of
CO2 emissions between them (Univariate ANOVA, Post Hoc Tests, p < 0.05) (Table 6.2).
However, while all the biochar HTT’s had a significantly different influence on 2
emissions compared to the control (Table 6.1), the influence of ss800 is not
significantly different (Univariate ANOVA, Post Hoc Tests, p = 0.149) from that of ss400
(Table 6.2).

91
Table 6.1: Analysis of variance results comparing unamended controls with factors (amendment level and highest temperature of treatment) for rates of carbon dioxide and nitrous oxide production from biochar amended soil microcosms.
Experiment
Pilot 1st 2nd
Soil type used
acid Near neutral
Variable
Amendment level (%)
1 5 10 1 5 10 1 5 10
CO2 Control x 0.118 0.000* 0.000*
0.000*
0.002*
0.000*
0.681 0.000*
0.000*
N2O 0.081 0.032* 0.002*
n.d. 0.000*
0.000*
0.000*
HTT (oC) 400 600 800 400 600 800 400 600 800
CO2 Control x n.d. 0.000*
0.000*
0.000*
0.002*
0.001*
0.000*
0.000*
N2O n.d. 0.028*
n.d. 0.000*
0.000*
0.000*
*mean difference significant at the 0.05 level; n.d.: not determined
1st
and 2nd
experiments are the first and second sets of experiments after the pilot where ss and ess biochars were used to amend the acid and near neutral soils respectively (see chapter 3 section 3.6 Table 3.2).
Table 6.2: Analysis of variance results comparing factors (amendment level and highest temperature of treatment) for their influence on rates of carbon dioxide and nitrous oxide production from biochar amended soil microcosms.
Experiment
Pilot 1st 2nd
Soil type acid Near neutral Variable
Amendment level (%)
1 5 10 1 5 10 1 5 10
CO2 1 0.001* 0.000* 0.000* 0.000*
0.000* 0.000*
5 10 0.000* 0.036* 0.000* N2O 1 0.552 0.045* 0.000* 0.000* 5 n.d. 10 0.134 0.000* HTT (oC) 400 600 800 400 600 800 4
00
600 800
CO2 400 0.000*
0.149 0.000* 0.000*
600 n.d. 800 0.000
* 0.076
N2O 400 0.000* 0.000* 600 n.d. n.d. 800 0.027* *mean difference significant at the 0.05 level; n.d.: not determined
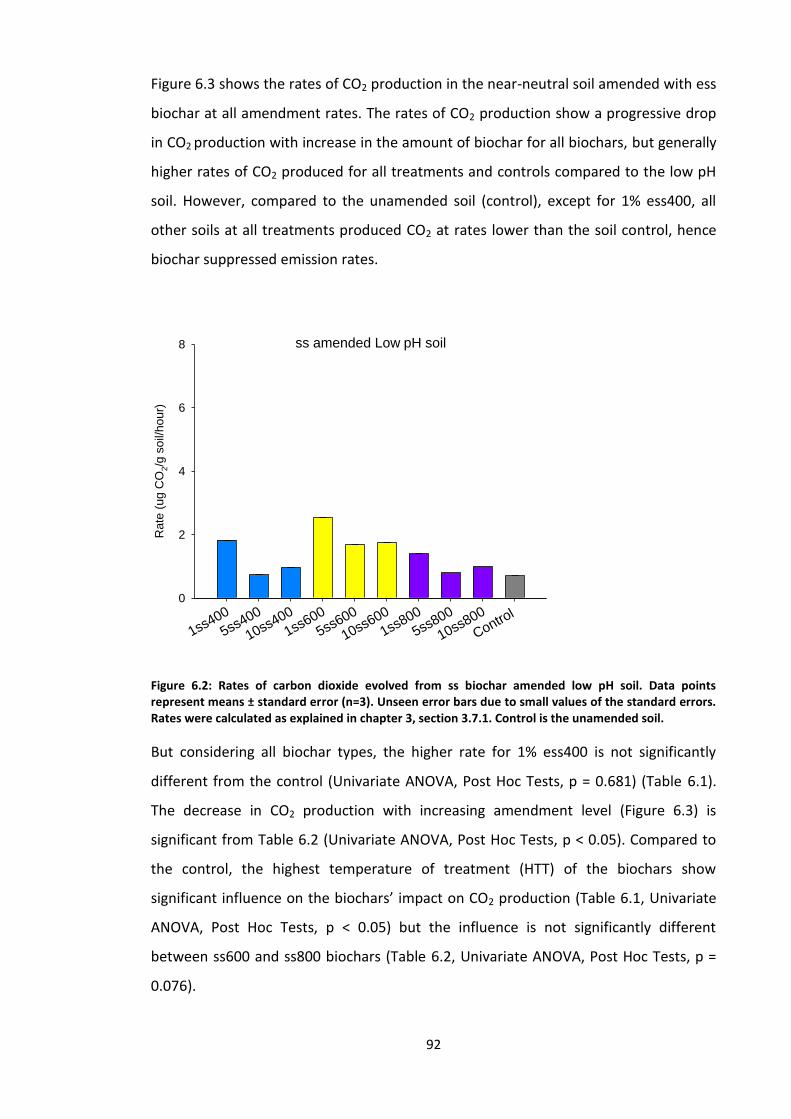
92
Figure 6.3 shows the rates of CO2 production in the near-neutral soil amended with ess
biochar at all amendment rates. The rates of CO2 production show a progressive drop
in CO2 production with increase in the amount of biochar for all biochars, but generally
higher rates of CO2 produced for all treatments and controls compared to the low pH
soil. However, compared to the unamended soil (control), except for 1% ess400, all
other soils at all treatments produced CO2 at rates lower than the soil control, hence
biochar suppressed emission rates.
ss amended Low pH soil
1ss400
5ss400
10ss400
1ss600
5ss600
10ss600
1ss800
5ss800
10ss800
Control
Ra
te (
ug C
O2/g
so
il/h
our)
0
2
4
6
8
Figure 6.2: Rates of carbon dioxide evolved from ss biochar amended low pH soil. Data points represent means ± standard error (n=3). Unseen error bars due to small values of the standard errors. Rates were calculated as explained in chapter 3, section 3.7.1. Control is the unamended soil.
But considering all biochar types, the higher rate for 1% ess400 is not significantly
different from the control (Univariate ANOVA, Post Hoc Tests, p = 0.681) (Table 6.1).
The decrease in CO2 production with increasing amendment level (Figure 6.3) is
significant from Table 6.2 (Univariate ANOVA, Post Hoc Tests, p < 0.05). Compared to
the control, the highest temperature of treatment (HTT) of the biochars show
significant influence on the biochars’ impact on 2 production (Table 6.1, Univariate
ANOVA, Post Hoc Tests, p < 0.05) but the influence is not significantly different
between ss600 and ss800 biochars (Table 6.2, Univariate ANOVA, Post Hoc Tests, p =
0.076).

93
ess amended near-neutral soil
1ess400
5ess400
10ess400
1ess600
5ess600
10ess600
1ess800
5ess800
10ess800
Control
Ra
te (
ug C
O2/g
so
il/ho
ur)
0
2
4
6
8
Figure 6.3: Rates of carbon dioxide evolved from ess biochar amended near-neutral soil. Data points represent mean ±standard error (n=3). Unseen error bars due to small values of the standard errors. 1ess400 means soil amended with 1% ess400 biochar. Control is the unamended soil.
6.2.2 Denitrification enzyme activity (DEA)
Results for the DEA are presented in Figures 6.4 and 6.5 as rates of N2O production in
(µg N2O/g soil/hour). There were no detectable N2O emissions from ss amended low
pH soil regardless of biochar type or amendment rate while the pilot experiment pot
amended soils showed some detectable nitrous oxide emissions (Figure 6.4) in a few
samples but none from the unamended control soil. Moreover, a statistical treatment
of the combined data for the two biochars showed only one of the biochar treatments
(10% or 100t/ha) had a rate of N2O production that significantly (Univariate ANOVA,
Post Hoc Tests, p = 0.045) differed from zero, the rate for the unamended control
(Tables 6.1 and 6.2). Nitrogen based gas emissions (N2O, NO and N2) are lower in acid
soils compared to soils with higher pH values (ŠImek and ooper, 2002). Khan et al.
(2013), measured some N2O emissions from an acidic soil (pH = 4.02), but they
sampled from flux chambers enclosing pots of growing plants while the microcosms
used in this study used a re-wetted field moist soil transferred from pot experiments.
Additionally the soil used in this study is more acidic at pH = 4.38 because they
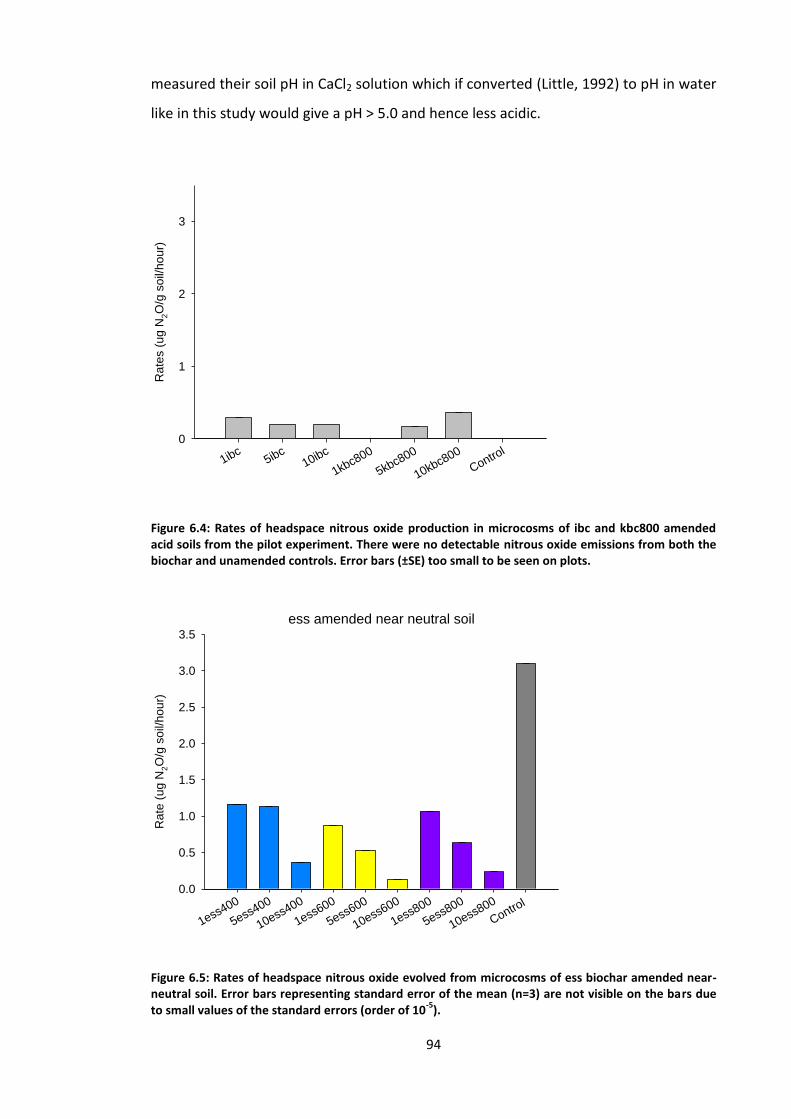
94
measured their soil pH in CaCl2 solution which if converted (Little, 1992) to pH in water
like in this study would give a pH > 5.0 and hence less acidic.
1ibc5ibc
10ibc
1kbc800
5kbc800
10kbc800
Control
Rate
s (
ug N
2O
/g s
oil/
hour)
0
1
2
3
Figure 6.4: Rates of headspace nitrous oxide production in microcosms of ibc and kbc800 amended acid soils from the pilot experiment. There were no detectable nitrous oxide emissions from both the biochar and unamended controls. Error bars (±SE) too small to be seen on plots.
ess amended near neutral soil
1ess400
5ess400
10ess400
1ess600
5ess600
10ess600
1ess800
5ess800
10ess800
Control
Ra
te (
ug N
2O
/g s
oil/
ho
ur)
0.0
0.5
1.0
1.5
2.0
2.5
3.0
3.5
Figure 6.5: Rates of headspace nitrous oxide evolved from microcosms of ess biochar amended near-neutral soil. Error bars representing standard error of the mean (n=3) are not visible on the bars due to small values of the standard errors (order of 10
-5).

95
Figure 6.5 shows the Nitrous oxide production rates for the ess biochar-amended near-
neutral soils. All the rates fall below that of the unamended control soil which shows
suppressed rates of N2O production. Compared to the unamended control, the
changes in N2O production due to amendments with biochars at the different
amendment levels are significant (Table 6.1, Univariate ANOVA, Post Hoc Tests, p =
0.000). Similarly, the different biochar HTT’s show significantly different influence
Table .2, nivariate AN VA, Post Hoc Tests, p < 0.05 on the biochars’ ability to
impact on the denitrification process responsible for the N2O emissions in this study.
These reduced production rates with increasing biochar amendment level and the
different influence from the various biochar pyrolysis temperatures could be directly
from the changes in the denitrifying microbial community and/or other
physicochemical factors as presented in the discussion section of this Chapter.
6.2.3 Microbial community structure
Microbial community analysis of the post-plant trials pot soils was carried out by
comparing DGGE profiles for the ss and ess biochar amended soils (both low pH and
near neutral) and the unamended control soil. PCR was done in triplicate on each of
soil DNA extract and the PCR products were analysed by DGGE. All the soil samples
used for the microbial community analysis were amended with 5% of the biochars
except the controls that did not contain any biochar. The DGGE profile in Figure 6.6
reflects ss400, ss600; ss800 biochar amended low pH sandy soils at the end of the pot
experiment (12 weeks) and related unamended control soils at the start of the pot
experiments (banding patterns 1 and 2). In this preliminary analysis there is no
apparent loss of bands in the banding patterns in Figure 6.6 compared to the controls
which may mean biochar amendment did not adversely affect the microbial diversity
of the amended soils. Figure 6.7 shows the DGGE profile for the ess biochar amended
near neutral loamy/clayey soils (es4, es6 and es8) at the end of the plant trial
experiment with the unamended control soils at the beginning (C0) and at the end
(C12) of the experiment. The banding patterns also show no discernible shift in the
diversity of the microbial community in all the amended soils for all the biochar types
compared to the control soil.

96
Figure 6.6: Denaturing gradient gel electrophoresis profile for the ss biochar amended soil samples and controls. The banding patterns 1 and 2 represent unamended controls at time zero for the ss400 and ss600 amended soils respectively while ss4, ss6 and ss8 represent the ss400, ss600 and ss800 amended soil samples after 12 weeks of running the plant trials respectively. The symbol ‘M’ represents the marker.
Figure 6.7: Denaturing gradient gel electrophoresis profile for the ess biochar amended soil samples and controls. The banding patterns C0 and C12 represent unamended controls at the beginning and after 12 weeks while es4, es6 and es8 represent the ess400, ess600 and ess800 amended soil samples after 12 weeks of running the plant trials respectively. The symbol ‘M’ represents the marker.
The addition of biochar to soil could also provide pore spaces for possible colonization
by microbes as shown in the scanning electron microscope image of the ss400oC
biochar recovered from the pot experiment of this study (Figure 6.8).
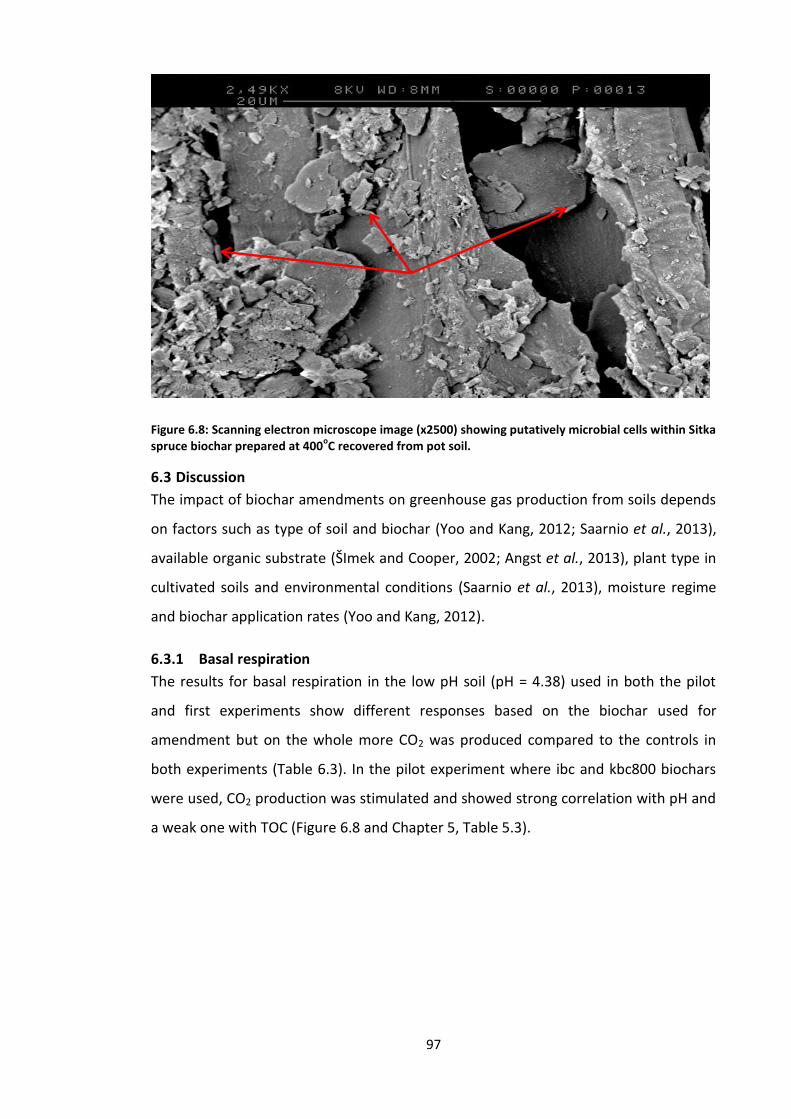
97
Figure 6.8: Scanning electron microscope image (x2500) showing putatively microbial cells within Sitka spruce biochar prepared at 400
oC recovered from pot soil.
Discussion 6.3
The impact of biochar amendments on greenhouse gas production from soils depends
on factors such as type of soil and biochar (Yoo and Kang, 2012; Saarnio et al., 2013),
available organic substrate (ŠImek and Cooper, 2002; Angst et al., 2013), plant type in
cultivated soils and environmental conditions (Saarnio et al., 2013), moisture regime
and biochar application rates (Yoo and Kang, 2012).
6.3.1 Basal respiration
The results for basal respiration in the low pH soil (pH = 4.38) used in both the pilot
and first experiments show different responses based on the biochar used for
amendment but on the whole more CO2 was produced compared to the controls in
both experiments (Table 6.3). In the pilot experiment where ibc and kbc800 biochars
were used, CO2 production was stimulated and showed strong correlation with pH and
a weak one with TOC (Figure 6.8 and Chapter 5, Table 5.3).

98
Table 6.3: Mean rates of carbon dioxide production from the biochar amended soils and unamended controls. Low pH sandy soil was used in the pilot and first experiments, while near neutral loamy/clayey soil was used in the second experiment.
Sample ID Experiment Mean Rates (µg CO2/g soil/hour)
±SE
1ibc Pilot 4.1 0.0001453
5ibc 2.9 0.00100167
10ibc 9.4 0.00034641
1kbc800 4.8 6.6667E-05
5kbc800 10.3 0.00073106
10kbc800 10.3 0.0001453
control 3.4 0.00017638
1ss400 First 1.8 0.00013333
5ss400 0.7 3.3333E-05
10ss400 1.0 3.3333E-05
1ss600 2.5 8.8192E-05
5ss600 1.7 5.7735E-05
10ss600 1.8 0.00017638
1ss800 1.4 0.0001
5ss800 0.8 0
10ss800 1.0 0
Control 0.7 0.0001
1ess400 Second 5.4 0.00029627
5ess400 4.3 8.8192E-05
10ess400 3.7 5.7735E-05
1ess600 4.6 0.00012019
5ess600 3.5 0.0001
10ess600 3.2 3.3333E-05
1ess800 4.9 0.00013333
5ess800 4.2 0.0002
10ess800 1.5 8.8192E-05
Control 5.1 3.3333E-05
1, 5 and 10 in the amended soil sample ID’s define amendment levels in percentage with the
accompanying biochar ID’s.

99
Figure 6.9: Correlation plots of carbon dioxide rate of production in µg CO2/g soil/hour with (a) pH and (b) total organic carbon in the amended acid soils of the pilot experiment
The enhanced CO2 production could therefore be explained more by the increased soil
pH as a result of amendment than due to positive priming from increased TOC
contents. The lower enhancement of CO2 production in the ss amended soils (Table 6.3)
could also be due to the marginal pH increases in the amended soils (Chapter 5, Table
5.3), though no correlation existed between CO2 production and pH (R2 = 0.23), TOC
(R2 = 0.12) and WHC (R2 = 0.17). In the ess amended near neutral soil, CO2 production
showed no correlation with pH but inversely correlated with TOC (Figure 6.9) and WHC
(R2 = 0.59). The reduced CO2 production compared to control especially with increasing
amendment level (higher TOC contents) in the near neutral soil could be due to
negative priming (reduced organic carbon decomposition or substrate exhaustion) as
the report of Dempster et al. (2012) indicated. These authors noted a decrease in CO2
evolution at 5 t ha-1 Eucalyptus biochar application rate but no effect at five times that
amount attributing the decrease in CO2 evolution to negative priming effect from the
carbonate contents of the added biochar. Yoo and Kang (2012), proposed that
negative correlation may suggest adsorption of evolved CO2 by the biochar but
expressed the need for further sorption studies to determine the underlying
mechanism. Similar suppressed CO2 production with biochar amendment (and
unknown cause) has been reported by Spokas et al. (2010). It is however worth noting
that across the two soil types (Figures 6.1-6.3) microbial carbon based respiration may
not have been negatively affected as a result of biochar additions because even though
CO2 gas production is suppressed with amendment in the ess amended near neutral
pH
5.0 5.5 6.0 6.5 7.0
Ra
te (
ug
CO
2/g
so
il/h
our)
2
4
6
8
10
12
R2=0.92
a
TOC (%)
2 4 6 8 10 12
Ra
te (
ug
CO
2/g
so
il/h
our)
2
4
6
8
10
12
b
R2=0.40
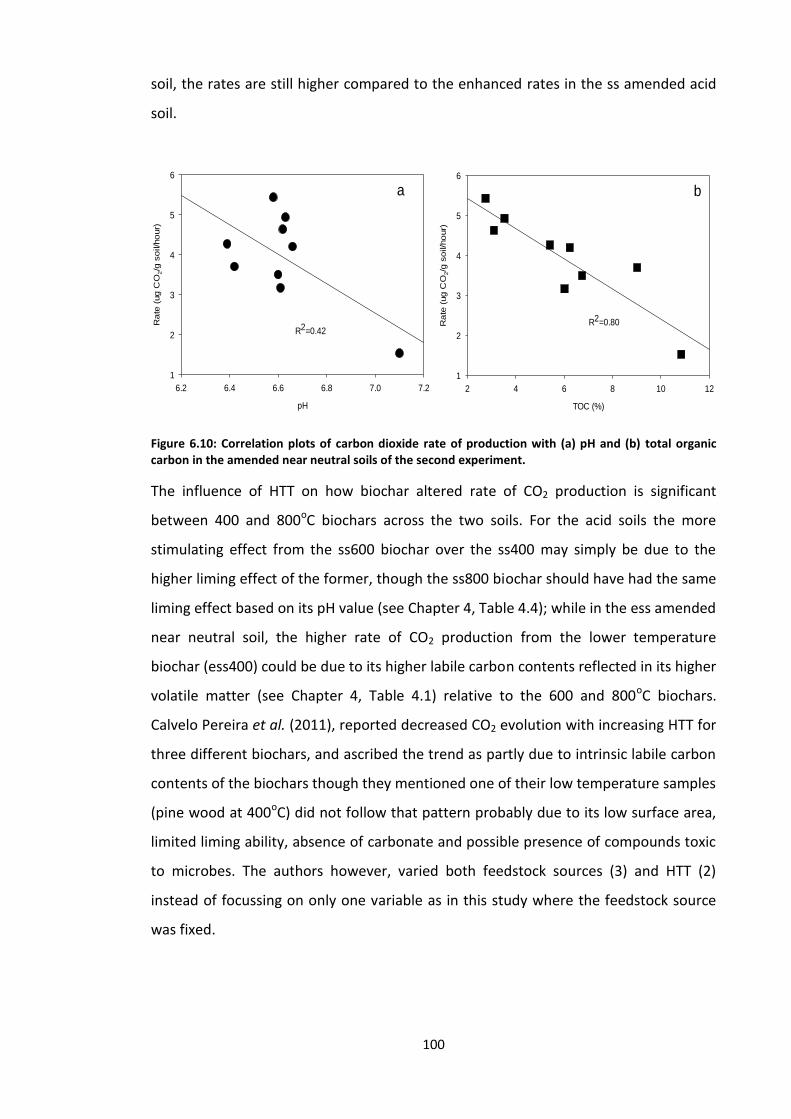
100
soil, the rates are still higher compared to the enhanced rates in the ss amended acid
soil.
Figure 6.10: Correlation plots of carbon dioxide rate of production with (a) pH and (b) total organic carbon in the amended near neutral soils of the second experiment.
The influence of HTT on how biochar altered rate of CO2 production is significant
between 400 and 800oC biochars across the two soils. For the acid soils the more
stimulating effect from the ss600 biochar over the ss400 may simply be due to the
higher liming effect of the former, though the ss800 biochar should have had the same
liming effect based on its pH value (see Chapter 4, Table 4.4); while in the ess amended
near neutral soil, the higher rate of CO2 production from the lower temperature
biochar (ess400) could be due to its higher labile carbon contents reflected in its higher
volatile matter (see Chapter 4, Table 4.1) relative to the 600 and 800oC biochars.
Calvelo Pereira et al. (2011), reported decreased CO2 evolution with increasing HTT for
three different biochars, and ascribed the trend as partly due to intrinsic labile carbon
contents of the biochars though they mentioned one of their low temperature samples
(pine wood at 400oC) did not follow that pattern probably due to its low surface area,
limited liming ability, absence of carbonate and possible presence of compounds toxic
to microbes. The authors however, varied both feedstock sources (3) and HTT (2)
instead of focussing on only one variable as in this study where the feedstock source
was fixed.
pH
6.2 6.4 6.6 6.8 7.0 7.2
Ra
te (
ug
CO
2/g
so
il/h
our)
1
2
3
4
5
6
a
R2=0.42
TOC (%)
2 4 6 8 10 12
Ra
te (
ug
CO
2/g
so
il/h
our)
1
2
3
4
5
6
b
R2=0.80

101
6.3.2 Denitrification enzyme activity
The trace N2O emissions from the acid soil in the pilot experiment showed no
correlation with any of pH, TOC (Figure 6.10) and WHC (R2 = 0.31), while the
suppressed rates of N2O production with increasing biochar amendment in the near
neutral soil showed no correlation with pH but had an inverse correlation with TOC
(Figure 6.11) and WHC (R2 = 0.66). The trace emission in the acid soil may perhaps be
due to the intrinsically low carbon to NO3- ratio in these soils in addition to the low pH
of the soil which are two of the three primary regulators to the synthesis and activity
of the enzymes (nitrate reductase, Nar; nitrite reductase, Nir; nitric oxide reductase,
Nor; and nitrous oxide reductase, Nos) responsible for the denitrification process
(Cavigelli and Robertson, 2001). Having the only significant N2O emission in the 10%
amended soil could support this since the carbon to NO3- ratio is highest at that
amendment level.
Figure 6.11: Correlation plots of nitrous oxide rate of production in µg N2O/g soil/hour with (a) pH and (b) total organic carbon in the amended acid soils of the pilot experiment.
Reduced or suppressed N2O production in the near neutral soil with increasing biochar
additions agrees with many other reports (Spokas et al., 2009; Spokas et al., 2010;
Taghizadeh-Toosi et al., 2011; Case et al., 2012; Yoo and Kang, 2012; Ameloot et al.,
2013; Harter et al., 2013; Khan et al., 2013; Saarnio et al., 2013).
pH
5.2 5.4 5.6 5.8 6.0 6.2 6.4 6.6 6.8
Ra
te (
ug
N2O
/g s
oil/h
our)
0.0
0.1
0.2
0.3
0.4
R2=0.20
a
TOC (%)
2 3 4 5 6 7 8
Ra
te (
ug
N2O
/g s
oil/h
our)
0.0
0.1
0.2
0.3
0.4
b
R2=0.22

102
Figure 6.12: Correlation plots of nitrous oxide rate of production in µg N2O/g soil/hour with (a) pH and (b) total organic carbon in the amended near neutral soils of the second experiment.
Some of these reports (Case et al., 2012; Khan et al., 2013) show results that do not
support an earlier report suggesting only biochar amendment rates >20% w/w
suppress nitrous oxide emissions (Spokas et al., 2010). These authors and others
proposed various reasons for the sort of decreased N2O emissions with biochar
amendment observed in this study and most of them suggested reduced availability of
N to denitrifying microbes. In this study, N2O was measured to assess DEA as a
microbiological indicator on soil health (section 6.1) hence a suppression of N2O may
point to decreased activity. However, reasons other than reduced microbial activity
have been proposed for the decrease in N2O emissions from biochar amended low
and/or high pH soils as explained in the next paragraph.
One of the earlier suggestions ascribed reduced nitrous oxide emission to either faster
rate of N2O reduction to molecular nitrogen or a low rate of its production resulting
from biochar addition to soil (Spokas et al., 2009). Faster rate of N2O reduction as an
explanation is not considered in this study because such reduction is blocked by the
addition of acetylene which was meant to inhibit the activity of N2O-reductase (see
Chapter 3 section 3.7.2). Angst et al. (2013), believe biochar adsorbs NH4+ thereby
retarding the production of NO3- needed by denitrifiers for N2O production. This view
is shared by Taghizadeh-Toosi et al. (2011) who added that another possible
explanation may be the presence of microbial inhibiting chemical compounds on
biochar surface. The hypotheses of Angst et al. (2013) may not apply in this
investigation because NO3- was added to the microcosms in the DEA assay. Others
pH
6.2 6.4 6.6 6.8 7.0 7.2
Ra
te (
ug
N2O
/g s
oil/h
our)
0.0
0.2
0.4
0.6
0.8
1.0
1.2
1.4
R2=0.17
a
TOC (%)
2 4 6 8 10 12
Ra
te (
ug
N2O
/g s
oil/h
our)
0.0
0.2
0.4
0.6
0.8
1.0
1.2
1.4
R2 = 0.59
b

103
however, explain the negative correlation between N2O production and increased
biochar amendment rates they obtained as due to GHG absorption by biochar (Yoo
and Kang, 2012). Case et al. (2012), while doubting the effect of soil pH on suppressed
N2O emission, hypothesized a mechanism involving physical or biological
immobilization of NO3- needed for denitrification to give N2O. The authors did not
discuss the mechanism for such immobilization. ŠImek and ooper 2002 , reviewed 50
years of published research work on the influence of pH on denitrification noting that
overall denitrification process is affected by soil pH; the process is less in acid soil
compared to neutral or slightly alkaline soils. But the authors concluded that the
influence of pH on the denitrification process is likely indirect in the form of lower
availability of organic carbon and mineralised N (NH4+ or NO3
-) to the denitrifying
bacteria and not direct effect of pH on the denitrifying enzymes. It has been
hypothesized that nitrate (an anion) immobilization could be in solution within biochar
pores (Prendergast-Miller et al., 2011), as it cannot be due to improved Cation
Exchange Capacity (CEC) as suggested by other authors (Van Zwieten et al., 2010) who
associated greater nutrient retention to higher CEC. Ameloot et al. (2013), further
added the possible role of increased soil aeration to NO3- retention by biochar; though
the reference they cited for the claim of nitrate retention (Cheng et al., 2008) does not
contain such information. It rather contains reference to the report of Lehmann et al.
(2003) which showed decreased leaching of applied ammonium in biochar-containing
soils. Improved plant N uptake in cultivated soils which makes the element less
available to denitrifiers has also been given as a reason for decreased N2O emissions
from biochar amended soils (Saarnio et al., 2013). But this does not explain reduced
emissions with increased biochar addition since in this study a single test plant was
planted per pot at all amendment levels and more importantly N source was supplied
in the microcosms. Thus a more plausible explanation for the observed reduction of
N2O emissions in this study is adsorption and/or immobilization of NO3- by the added
biochar which will increase with increase in added biochar leading to decreased NO3-
availability and lower N2O emissions hence the inverse correlation between TOC and
N2O emissions. Moreover such a mechanism does not alter the soil microbial
community which the DGGE profiles in Figures 6.6 and 6.7 seem to support.

104
6.3.3 Microbial community structure
Soil microorganisms play a central role in organic matter decomposition and nutrient
cycling (Liu et al., 2006). The DGGE method is a powerful culture-independent
analytical tool capable of identifying community constituents representing as low as 1%
of total microbial populations (Muyzer et al., 1993). Each DGGE band represents many
copies of a single amplicon (Hirsch et al., 2010), hence the greater the number of
bands in a DGGE profile the greater the microbial diversity and the higher the intensity
of a band the higher the microbial abundance or population (Torsvik and Øvreås, 2002;
Bloem and Breure, 2003). However, Nakatsu (2007) cautions that number of bands
only represent dominant species and not necessarily overall diversity and band
intensities point to relative densities of PCR products and should not be taken as
equivalent to numerical microbial abundance in the original soil community. The
author further stated that the disappearance of a band may not mean complete
removal of specie from the community but rather may represent a change to reduced
presence (to a level below detection limit) relative to other populations within the
community.
Results in this study indicate similar community diversity in both the biochar amended
and unamended control soils across the soil types especially after 12 weeks except for
the lower intensity bands in the low pH soils. Hence biochar addition did not alter the
microbial community structure in the test soils. However, it needs to be pointed out
that these microbial studies are preliminary and a lot more could be done using
techniques such as quantitative PCR (qPCR) to investigate physical increase or
decrease of the soil bacterial community populations as a result of biochar addition.
Conclusion 6.4
In conclusion, the results under this Chapter indicated that addition of Sitka spruce
biochar to the two test soils did influence the two microbial mediated soil processes
measured (BR and DEA) in different ways, enhancing basal respiration in the low pH
sandy soil and suppressing it in a systematic pattern based on HTT induced biochar
properties in the near neutral soil. The amendment suppressed DEA in terms of
reduced N2O production potential in the near neutral soil but had no measurable
effect in the acid soil. However, the reduced N2O production potential may not be due
to directly inhibited enzyme activity as other physicochemical reasons such as nutrient

105
immobilisation may explain the reductions. Moreover, there seems to be no change in
the microbial community structure in the test soils as a result of biochar addition.
Increasing the pyrolysis temperature of the biochars used in this study did change how
the biochar influenced the processes measured but not in a progressive way. Taken
together therefore the hypothesis put forward in this Chapter is partly accepted (HTT
alters biochars influence on BR and DEA) and partly rejected (HTT alters biochars
influence on microbial community selection).
From the perspective of biochar’s other applications in agriculture and the
environment, the suppression of N2O emission at higher biochar application rate may
offer double advantages in using biochar as a climate change mitigation tool; solid
carbon sequestration and reduction in atmospheric N2O concentrations. Additionally,
the hypothesized mechanism for reduced N2O emission (sorption and immobilisation
of NH4+ and NO3
-) could be advantageous in nutrient availability and hence improved
soil fertility in biochar amended soils.

106
Chapter 7 General discussion
7.1 Introduction
This Chapter includes a general discussion in the light of all results as discussed in the
various chapters of this thesis. Discussions are centred on how biochar properties and
the impact of biochar addition on soil properties change with changes in our main
variable, the Highest Temperature of Treatment (HTT), and finally compare the
properties of the biochar products from the two different production streams; batch
process from Lancashire and continuous process from Edinburgh.
7.2 Trends in biochar properties with highest temperature of treatment
7.2.1 Proximate analysis
The parameters determined under proximate analysis of the biochar included moisture
content, volatile matter, fixed carbon and ash content. The trends of changes in these
properties with pyrolysis temperature are presented in Figure 7.1 (a, b, c & d).
Moisture content (Figure 7.1a) in both biochars (ss & ess) decreases with increase in
highest temperature of treatment which agrees with other reports (Titiladunayo et al.,
2012). The little increase in moisture content with the 800oC biochar means the
influence of HTT on moisture contents of the biochar is not progressive since the
decrease with rise in HTT is not linear.
Figure 7.1b shows a linear drop of volatile matter contents with rise in pyrolysis
temperature for both biochars, while Figure 7.2c shows increasing fixed carbon
content for the biochar with increase in HTT. The decrease in volatile matter and
increase in fixed carbon with increasing pyrolysis temperature have both been
reported by other researchers (Kloss et al., 2012; Crombie et al., 2013; Ronsse et al.,
2013).
The ash contents of our biochars show no defined pattern (Figure 7.1d) with change in
pyrolysis temperature. These contrasts with other reports (Titiladunayo et al., 2012;
Crombie et al., 2013) that indicate increase in ash contents with rise in HTT. However,
reports exist (Keiluweit et al., 2010; Ronsse et al., 2013) that show a rise and fall in ash
content with rise in pyrolysis temperature for wood biochars especially at HTT > 700oC
and residence time above 10 minutes.

107
7.2.2 Physicochemical properties
Figure 7.2 shows the trends in physico-chemical properties of the biochars under
investigation with pyrolysis temperature. Figure 7.2a shows a trend of increasing basic
character for the biochars with increasing pyrolysis temperature. This conforms to
several other reports (Pereira et al., 2003; Enders et al., 2012; Ronsse et al., 2013;
Wang et al., 2013b). Increase in pH with HTT is associated with the loss of carboxylic
acid functional groups from the biochar surfaces (Pereira et al., 2003), an observation
that is supported in this study by the FTIR results for the biochars (see Chapter 4,
Table 4.5 and Figure 4.8).
Pyrolysis temperature (oC)
300 400 500 600 700 800 900
Mo
istu
re c
on
ten
t (%
)
0.0
0.2
0.4
0.6
0.8
1.0
1.2
1.4
ss
ess
a
Pyrolysis temperature (oC)
300 400 500 600 700 800 900
Vola
tile
matt
er
(%)
0
5
10
15
20
25
30
35
ss
ess
b
Pyrolysis temperature (oC)
300 400 500 600 700 800 900
Fix
ed c
arb
on (
%)
60
65
70
75
80
85
90
95
ss
ess
c
Pyrolysis temperature (oC)
300 400 500 600 700 800 900
Ash c
onte
nt
(%)
1
2
3
4
5
6
ss
ess
d
Figure 7.1: Trends of changes in proximate analysis results for the fresh biochar with highest temperature of treatment.

108
An inverse relationship is reported between H/C ratio (a measure of aromatic
character) and pyrolysis temperature (Kloss et al., 2012). Hence, a plot of the
reciprocal of this ratio (Figure 7.2b) shows a linear increase in aromatic character with
Pyrolysis temperature (oC)
300 400 500 600 700 800 900
pH
4
5
6
7
8
9
10
ss
ess
a
Pyrolysis temperature (oC)
300 400 500 600 700 800 900
Tota
l carb
on (
%)
70
75
80
85
90
95
100
ss
ess
d
Pyrolysis temperature (oC)
300 400 500 600 700 800 900
Aro
matic c
hara
cte
r (C
/H)
0
20
40
60
80
100
120
140
160
180
ss
ess
b
Pyrolysis temperature (oC)
300 400 500 600 700 800 900
Tota
l org
anic
carb
on (
%)
70
75
80
85
90
95
100
ss
ess
e
Pyrolysis temperature (oC)
300 400 500 600 700 800 900
Ca
tio
n e
xch
an
ge
ca
pa
city (
mm
olc
/Kg)
2
4
6
8
10
12
ss
ess
c
Pyrolysis temperature (oC)
300 400 500 600 700 800 900
Wa
ter
ho
ldin
g c
ap
acity (
%)
30
35
40
45
50
55
60
ss
ess
f
Figure 7.2: Trends of changes in the physicochemical properties of the fresh biochars with highest
temperature of treatment.

109
rise in HTT for the biochars produced in this study. The results agree with other reports
(Kim et al., 2012; Kloss et al., 2012; Wang et al., 2013b) and are supported by the
decreased H contents of the biochars with increase in HTT (see Chapter 4, Table 4.4).
Moreover, both aromatic character and pH are thought to be more influenced by
pyrolysis temperature than by nature of feedstock (Zhao et al., 2013).
The Cation Exchange Capacity (CEC) for our biochars shows a linear decrease with
pyrolysis temperature (Figure 7.2c) which agrees with other findings (Kloss et al., 2012;
Wang et al., 2013b). Kloss et al. (2012), ascribe the decrease in CEC to the removal of
oxygen-containing functional groups on the biochar with rise in HTT, an observation
that the FTIR results in this study also confirm (see Chapter 4, Table 4.5 and Figure 4.8).
The total carbon (Figure 7.2d) and total organic carbon (Figure 7.2e) contents of the
biochars increase with increasing pyrolysis temperature in agreement with other
reports (Kim et al., 2012; Kloss et al., 2012; Mašek et al., 2013) and also supported by
similar trends in fixed carbon contents of the biochars (see Chapter 4, Table 4.1).
Water holding capacity (WHC) decreases with increase in highest temperature of
treatment (Figure 7.2f). All the three properties in Figures 7.2 d, e & f show a much
larger change (increase or decrease) between the 400oC and 600oC biochars compared
to the change between the 600oC and 800oC biochars. The same observation is true
with all proximate analysis results except ash contents (Figure 7.1 and Chapter 4, Table
4.1); elemental ratios (Figures 7.3 d, e & f, and Chapter 4, Table 4.4) and thermal
properties (see Chapter 4, Table 4.2).
The percentage amounts of the elements H and O decrease with increase in pyrolysis
temperature while N content was enhanced (Figure 7.3 a, b & c) in line with other
reports (Chen and Chen, 2009; Kim et al., 2012; Kloss et al., 2012; Ronsse et al., 2013)
and supported by the evidence of gradual loss of functional groups on the biochar
surfaces (see Chapter 4, Table 4.5 and Figure 4.8). However, Wang et al. (2013b)
reported reduced N content with increasing HTT for bamboo wood which likely reflects
similar observations made on the fluctuations of N and other mineral elements
depending on feedstock source (Enders et al., 2012; Zhao et al., 2013).

110
Figure 7.3: Trends of changes in the physicochemical properties of the fresh biochars with pyrolysis temperature.
Pyrolysis temperature (oC)
300 400 500 600 700 800 900
Hydro
gen c
onte
nts
(%
)
0.0
0.5
1.0
1.5
2.0
2.5
3.0
3.5
4.0
ss
ess
a
Pyrolysis temperature (oC)
300 400 500 600 700 800 900
H:C
ratio
0.005
0.010
0.015
0.020
0.025
0.030
0.035
0.040
0.045
ss
ess
d
Pyrolysis temperature (oC)
300 400 500 600 700 800 900
Oxygen
con
ten
ts (
%)
0
2
4
6
8
10
12
14
16
18
ss
ess
b
Pyrolysis temperature (oC)
300 400 500 600 700 800 900
O:C
ratio
0.00
0.05
0.10
0.15
0.20
0.25
0.30
ss
ess
e
Pyrolysis temperature (oC)
300 400 500 600 700 800 900
Nitro
gen c
onte
nts
(%
)
0.04
0.06
0.08
0.10
0.12
0.14
0.16
0.18
ss
ess
c
Pyrolysis temperature (oC)
300 400 500 600 700 800 900
(O+
N):
C r
atio
0.00
0.05
0.10
0.15
0.20
0.25
0.30
ss
ess
f

111
The loss of H from aliphatic chains leads to increased aromatic character while its loss
from protonated carbonyl groups explains the increased basic character of the
biochars with rise in pyrolysis temperature. The decrease in O contents helps explain
decrease in CEC with increase in HTT (Kloss et al., 2012).
All elemental ratios for the biochars decrease with increasing pyrolysis temperature
(Figure 7.3 d, e & f). This trend with HTT results from the increase in total C with HTT
(Figure 7.2d) coupled with decreasing amounts of H and O with increasing pyrolysis
temperature (Figure 7.3 a & b). Many other reports (Keiluweit et al., 2010; Kloss et al.,
2012; Schimmelpfennig and Glaser, 2012) indicate this trend in elemental ratios for
biochars.
7.3 Pyrolysis temperature and the effect of biochar amendment on soil properties
To assess how the main variable in this research project influenced the impact of the
test biochars on the properties of the test soils, samples treated at 5% amendment
rate were chosen for discussion because a larger number of properties were
determined at this level of amendment. The plots in Figure 7.4 are used for discussion
along with reference to Tables 5.2 and 5.3 from Chapter 5.
Figure 7.4a shows some influence of pyrolysis temperature of the biochars on pH of
the amended soils. In the acid soil, increasing the HTT from 600 to 800oC or 400 to
800oC influenced a significant (Univariate ANOVA, Post Hoc Tests, p = 0.000) increase
in pH of the biochar amended soil although there was no significant influence between
the 400 and 600oC biochars (Univariate ANOVA, Post Hoc Tests, p = 0.933). Changing
the pyrolysis temperature of the biochars significantly (Univariate ANOVA, Post Hoc
Tests, p < 0.05) influenced the biochars ability to progressively raise the pH of the
amended near neutral soil.
The total organic carbon contents (Figure 7.4b) of the low pH amended soils were not
significantly altered by increasing the pyrolysis temperature of the ss biochar
(Univariate ANOVA, Post Hoc Tests, p > 0.05). However, the impact of ess biochar on
the TOC contents of the near neutral soil was significant with increasing HTT from 400
to 800oC (Univariate ANOVA, Post Hoc Tests, p < 0.05). But TOC contents for all
amended soils had significant increases at all biochar amendment rates compared to
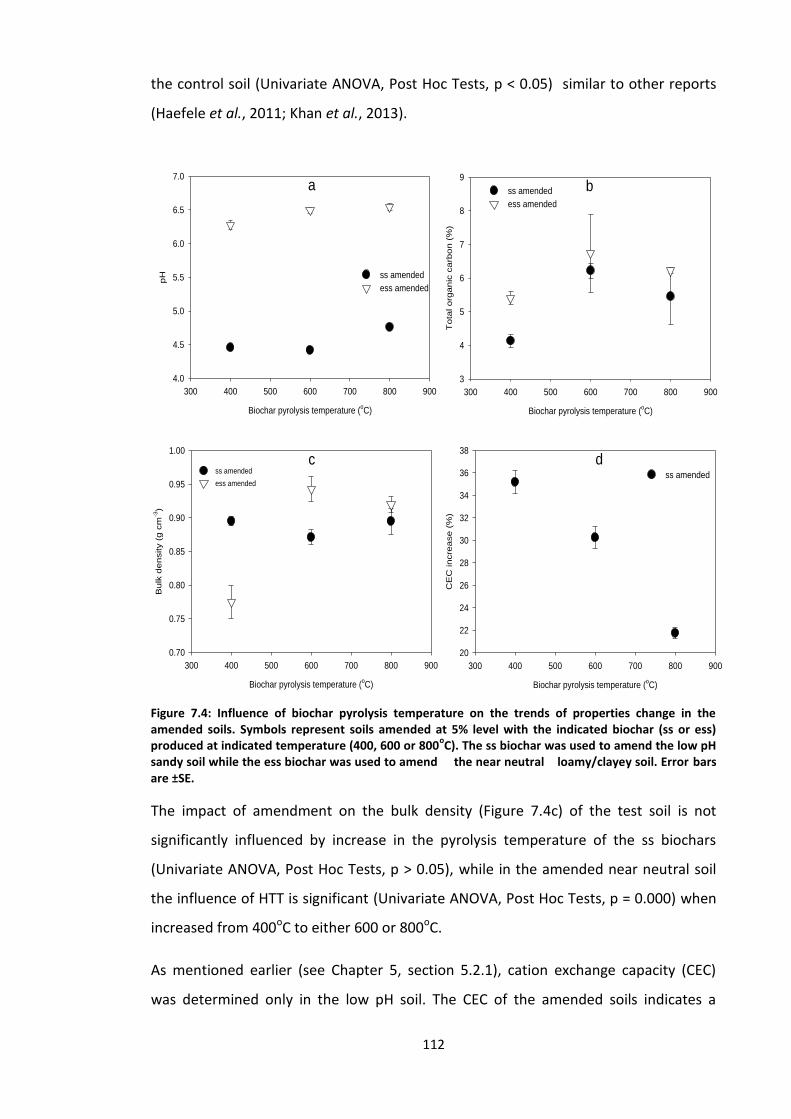
112
the control soil (Univariate ANOVA, Post Hoc Tests, p < 0.05) similar to other reports
(Haefele et al., 2011; Khan et al., 2013).
The impact of amendment on the bulk density (Figure 7.4c) of the test soil is not
significantly influenced by increase in the pyrolysis temperature of the ss biochars
(Univariate ANOVA, Post Hoc Tests, p > 0.05), while in the amended near neutral soil
the influence of HTT is significant (Univariate ANOVA, Post Hoc Tests, p = 0.000) when
increased from 400oC to either 600 or 800oC.
As mentioned earlier (see Chapter 5, section 5.2.1), cation exchange capacity (CEC)
was determined only in the low pH soil. The CEC of the amended soils indicates a
Biochar pyrolysis temperature (oC)
300 400 500 600 700 800 900
pH
4.0
4.5
5.0
5.5
6.0
6.5
7.0
ss amended
ess amended
a
Biochar pyrolysis temperature (oC)
300 400 500 600 700 800 900
Tota
l org
an
ic c
arb
on (
%)
3
4
5
6
7
8
9
ss amended
ess amended
b
Biochar pyrolysis temperature (oC)
300 400 500 600 700 800 900
Bulk
density (
g c
m-3
)
0.70
0.75
0.80
0.85
0.90
0.95
1.00
ss amended
ess amended
c
Biochar pyrolysis temperature (oC)
300 400 500 600 700 800 900
CE
C in
cre
ase (
%)
20
22
24
26
28
30
32
34
36
38
ss amended
d
Figure 7.4: Influence of biochar pyrolysis temperature on the trends of properties change in the amended soils. Symbols represent soils amended at 5% level with the indicated biochar (ss or ess) produced at indicated temperature (400, 600 or 800
oC). The ss biochar was used to amend the low pH
sandy soil while the ess biochar was used to amend the near neutral loamy/clayey soil. Error bars are ±SE.

113
dependence on the HTT’s of the biochars used Figure 7.4d). Increasing the pyrolysis
temperature of the biochar from 400oC to either 600 or 800oC had significant influence
(Univariate ANOVA, Post Hoc Tests, p < 0.05) on the impact of the added biochar on
the CEC of the amended soil.
7.4 The influence of pyrolysis temperature on how biochar amendment impacts on
soil processes and leek growth.
The impact of biochar amendment on soil respiration (Figure 7.5) is significantly
altered with increase in HTT’s of the biochars in both soils (Univariate ANOVA, Post
Hoc Tests, p = 0.000), though the influence in both soils was for increase from 400 to
600oC since in the acid soil there was no significant difference between 400 and 800oC
biochars (Univariate ANOVA, Post Hoc Tests, p = 0.149) and none between 600 and
800oC biochars in the near neutral soil (Univariate ANOVA, Post Hoc Tests, p = 0.076).
There is a significant influence of increasing HTT (Univariate ANOVA, Post Hoc Tests, p
< 0.000) on the impact of ess biochar on denitrification enzyme activity measured as
rate of N2O (Figure 7.6), though the suppression of N2O emissions from the amended
soil compared to the control was not ascribed to reduced microbial activity but rather
due to other physicochemical reasons (see Chapter 6, section 6.3.2).
5ss400 5ss600 5ss800
Ra
te (
ug
CO
2/g
so
il/h
ou
r)
0.0
0.4
0.8
1.2
1.6
2.0
a
5ess400 5ess600 5ess800
Ra
te (
ug C
O2/g
so
il/h
our)
0
1
2
3
4
5
b
Figure 7.5: Influence of changes in highest temperature of treatment on the impact of biochar amendment on the rate of soil carbon dioxide emissions. Error bars (±SE) are not discernible due to the small values of the standard error.
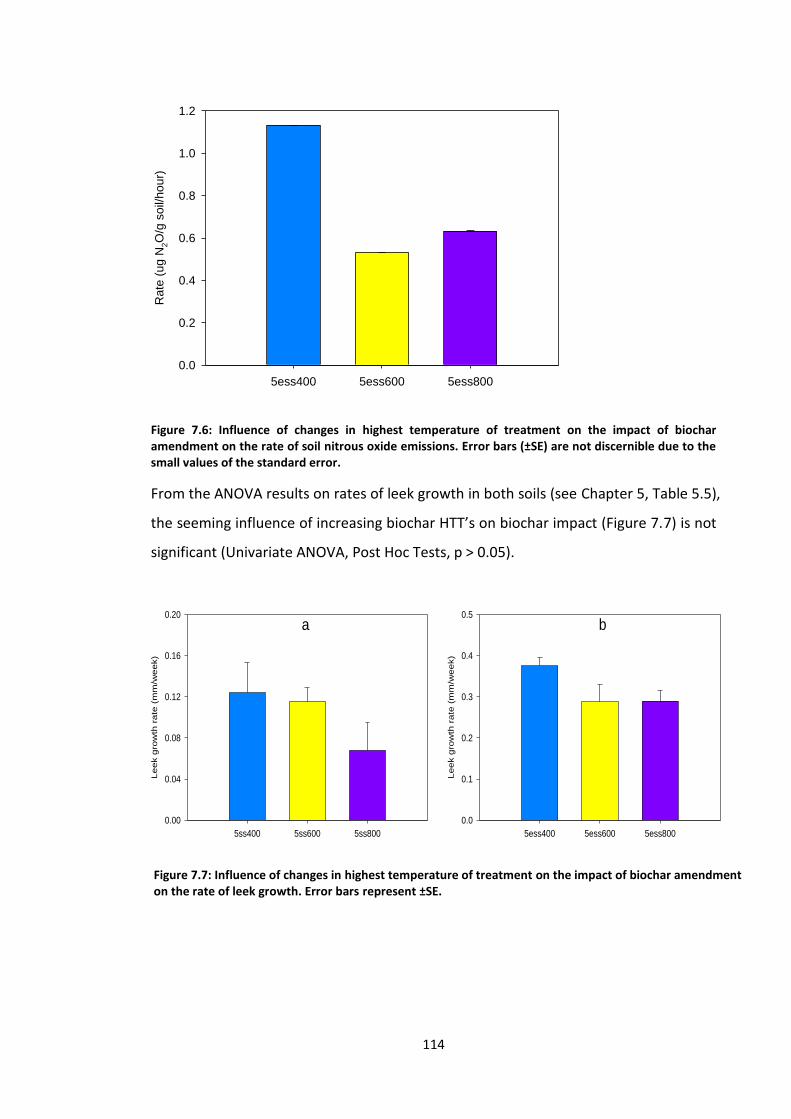
114
5ess400 5ess600 5ess800
Ra
te (
ug
N2O
/g s
oil/
ho
ur)
0.0
0.2
0.4
0.6
0.8
1.0
1.2
Figure 7.6: Influence of changes in highest temperature of treatment on the impact of biochar amendment on the rate of soil nitrous oxide emissions. Error bars (±SE) are not discernible due to the small values of the standard error.
From the ANOVA results on rates of leek growth in both soils (see Chapter 5, Table 5.5),
the seeming influence of increasing biochar HTT’s on biochar impact Figure 7.7) is not
significant (Univariate ANOVA, Post Hoc Tests, p > 0.05).
Figure 7.7: Influence of changes in highest temperature of treatment on the impact of biochar amendment on the rate of leek growth. Error bars represent ±SE.
5ss400 5ss600 5ss800
Le
ek g
row
th r
ate
(m
m/w
ee
k)
0.00
0.04
0.08
0.12
0.16
0.20
a
5ess400 5ess600 5ess800
Le
ek g
row
th r
ate
(m
m/w
ee
k)
0.0
0.1
0.2
0.3
0.4
0.5
b

115
7.5 Influence of production process
Biomass pyrolysis process parameters that could influence the properties of biochar
include nature of feedstock, highest temperature of treatment (HTT), particle size of
feedstock, residence time at HTT, heating rate, oven/kiln/furnace atmosphere and
flow rate of purge gas, the first two being most important (Demirbas, 2004;
Schimmelpfennig and Glaser, 2012; Crombie et al., 2013; Mašek et al., 2013; Ronsse et
al., 2013; Wang et al., 2013b). For the biochar samples investigated in this study,
feedstock type, HTT, residence time at HTT and furnace atmosphere were all the same
in both the batch and continuous processes (Table 7.1). The heating rate is essentially
the same, hence the only different parameters between the two production processes
are particle size of the feedstock and possibly flow rate of purge gas since no
information on it is available for the batch process (Table 7.1).
Table 7.1 Biochar production process conditions
Parameter Production process
Batch Continuous
Feedstock Sitka spruce Sitka spruce
HTT (oC) 400, 600, 800 400, 600, 800
Particle size of Feedstock (mm) 2 10
Residence time at HTT (minutes) 30 30
Heating rate (oC/min) 10 8, 12, 16
Kiln/Oven atmosphere (Purge gas) Nitrogen Nitrogen
Flow rate of purge gas (L/min) No information 0.9
The mostly similar production parameters between the two processes may likely
explain the many similarities in properties of the biochars from the two production
streams. In terms of trends of properties with pyrolysis temperature, the biochars do
not appear different from one another as is evident from Figures 7.1 and 7.2. Even
when actual values are considered, differences exist only between the 400oC biochars
for only two parameters: oxygen content (Figure 7.3b) and O:C ratio (Figure 7.3e). The
difference in O:C ratio is directly related to oxygen contents of the biochar which may
be the result of differences in post-pyrolysis handling of the product. Information
supplied from the producers of Edinburgh biochar show that in addition to purging the

116
kiln with nitrogen gas throughout the process, at the end, the warm biochar fresh from
the pyrolysis unit was purged with nitrogen and sealed to avoid oxidation. This may
explain the lower oxygen content and subsequent O:C ratio for the ess400 biochar
which possibly was not the case for the batch process.

117
Chapter 8 General conclusions and recommended further work
8.1 Conclusions
The results considered in Chapter 4 go a long way in addressing our first hypothesis:
Biological, chemical and physical properties of the biochar such as fixed carbon,
pH, functional group chemistry, water holding and cation exchange capacities,
are altered with increasing pyrolysis temperature.
With the feedstock source fixed, the results of this experimental study clearly show
that temperature of production is the most important factor that alters both physical
and chemical properties of biochars (Wang et al., 2013b), a position supported in the
case of C content by the report of Enders et al. (2012). The 400oC biochars from both
production streams stand well apart from the higher temperature (600 and 800oC)
biochars which on their part show only minor differences between themselves in
properties such as all proximate analysis except ash content, pH, TC, TOC, thermal
behaviour, elemental ratios and CEC. Thus, producing and using the 600oC biochar in
place of the 800oC biochar could be more cost effective in terms of energy input. The
Sitka Spruce biochar possesses high fuel quality potentials as evidenced by its
satisfactory fuel ratio.
Measurement of microbial mediated soil processes and microbial community diversity
in the amended soils addressed the third hypothesis of this study:
Increasing pyrolysis temperature progressively alters biochar’s ability to
influence the selection of resultant microbial communities and microbial
mediated processes e.g. respiration, and nitrogen cycling in soil environments.
The addition of Sitka spruce biochar to the two test soils did influence the two
microbial mediated soil processes measured (BR and DEA), enhancing basal respiration
in the low pH sandy soil and suppressing it in the near neutral soil. The amendment
suppressed DEA in terms of reduced N2O emissions in the near neutral soil and no
measurable effect in the acid soil. However, the reduced N2O emissions may not be
due to decreased enzyme activity as other physicochemical reasons such as nutrient
immobilisation may explain the reductions. Moreover, there seems to be no change in

118
the microbial community structure in the test soils as a result of biochar addition. But
increasing the pyrolysis temperature of the biochars used in this study did change how
the biochar influenced the processes measured but not in a progressive way. Taken
together therefore the third hypothesis put forward is partly accepted (HTT alters
biochars influence on BR and DEA) and partly rejected (HTT alters biochars influence
on microbial community selection).
Soil amendment using Sitka spruce biochar brought about significant soil property
changes compared to unamended controls which included raising the TOC and
lowering BD in both the acid and near- neutral soils (p < 0.05); increasing the pH in the
acid soil (p < 0.05) but not in the near neutral soil (p > 0.05); and increasing the CEC
and WHC (p < 0.05) although these last two properties were only determined in the
acid soil. The significant alteration of these soil properties due to biochar addition was
also significantly influenced by changing the pyrolysis temperatures of the biochars
(HTT) used for amendment which makes the fourth hypothesis put forward in this
study acceptable. The fourth hypothesis was:
Different biochar pyrolysis temperatures and their application rates will
significantly alter the pH, total organic carbon (TOC) contents, bulk density (BD)
water holding (WHC), and cation exchange capacities (CEC) of soils to which the
biochar was added.
From the ANOVA results in Tables 5.1 and 5.2, a suggested suitable dosage of Sitka
spruce biochar could be 5% of 600oC biochars for enhanced pH in sandy acid soil; 1% of
400oC biochars for enhanced TOC in both acidic sandy soil and near neutral loamy
clayey soil; 5% of 600oC biochars for enhanced CEC in acid soil; and 1% amendment
level for enhanced WHC in the acid soil. Similarly from the ANOVA results in Tables
5.10 and 5.11, a dose of 5% 400oC biochars could be suggested for enhanced leek
growth in the acid soil only.
In answer to our fifth hypothesis:
Different biochar pyrolysis temperatures and their application rates influence
biochar’s ability to impact on the growth rate of leek plant in amended soils
compared to control soils.

119
The results in Chapter 5 and statistical treatment of the data considered showed that
addition of Sitka spruce biochar to the test soils significantly influenced leek growth
compared to the controls only in the acid soil (at 5 and 10% amendment rates) and not
in the near neutral soil (Table 5.10). Impact of biochar addition on the growth of leek
was achieved by altering some of the physico-chemical properties of the soil
environment in which the plant was grown. However, altering the biochar HTT had no
significant effect on leek growth in both soils (Table 5.11) and hence the fifth
hypothesis is partly accepted (different biochar application rates influence biochar’s
ability to impact on the growth rate of leek plant in amended soils compared to
control soils) and partly rejected (different biochar pyrolysis temperatures influence
biochar’s ability to impact on the growth rate of leek plant in amended soils compared
to control soils).
The totality of our results (see Chapters 4, 5 & 6) and the discussion in section 7.5 of
Chapter 7, go to answer the second hypothesis put forward:
The biological and physico-chemical properties of biochars are altered
differently based on the production process used.
There seems to be very little differences between the properties (see Chapter 4, Table
4.4) of the biochars from the batch and continuous production processes. In a similar
way production process did not for example significantly influence the impact of these
biochars on leek growth (see Chapter 5, Figure 5.13 and Tables 5.8 & 5.9). Hence, our
second hypothesis is rejected.
On the whole and from the perspective of biochar’s applications in agriculture and the
environment, the result in this experimental study showed Sitka spruce biochar as
possessing high percentage of recalcitrant (satisfactory recalcitrant index) organic
carbon and hence, has strong potential worth pursuing as a tool for carbon
sequestration. The suppression of N2O emission from amended soil at higher biochar
application rate (50-100 t/ha) may offer double advantages in using the Sitka spruce
biochar as a climate change mitigation tool, namely; long term solid carbon
sequestration and reduction in atmospheric N2O concentrations especially as there is
some evidence of unaltered microbial community structure in the soils. Additionally,
the hypothesized mechanism for the observed reduction in N2O emission (sorption

120
and immobilisation of NH4+ and NO3
-) could be advantageous in nutrient availability
and hence improved soil fertility in biochar amended soils.
8.2 Recommended further work
Consequent upon the strong need for a library or database of properties for individual
biochars (Enders et al., 2012; Kloss et al., 2012; Schimmelpfennig and Glaser, 2012)
resulting from systematic studies, a further analysis on the Sitka spruce biochars
investigated in this study for areas that could not be covered in this thesis is desirable.
These include a fuller proximate and ultimate analysis of the feedstock, PAH contents
of the biochars, in addition to nutrient sorption, retention and leaching. Molecular
analysis could be carried further to the point of identifying the identities of
microorganisms introduced and/or removed by the biochar amendment.
The preliminary molecular study done can be improved further by for example, looking
at other functional genes such as nitrate reductase and ammonia mono-oxygenase and
how their functions are affected by biochar addition. Next generation DNA sequencing
technologies could also be used to sequence the soil DNA extracts from the different
experiments which will provide thousands of sequences for comparison.

121
References
Agblevor, F.A., Beis, S., Kim, S.S., Tarrant, R. and Mante, N.O. (2010) 'Biocrude oils from
the fast pyrolysis of poultry litter and hardwood', Waste Management, 30(2),
pp. 298-307.
Ahmad, M., Lee, S.S., Dou, X., Mohan, D., Sung, J.-K., Yang, J.E. and Ok, Y.S. (2012)
'Effects of pyrolysis temperature on soybean stover- and peanut shell-derived
biochar properties and TCE adsorption in water', Bioresource Technology,
118(0), pp. 536-544.
Ameloot, N., De Neve, S., Jegajeevagan, K., Yildiz, G., Buchan, D., Funkuin, Y.N., Prins,
W., Bouckaert, L. and Sleutel, S. (2013) 'Short-term CO2 and N2O emissions and
microbial properties of biochar amended sandy loam soils', Soil Biology and
Biochemistry, 57(0), pp. 401-410.
Amuda, O.S., Giwa, A.A. and Bello, I.A. (2007) 'Removal of heavy metal from industrial
wastewater using modified activated coconut shell carbon', Biochemical
Engineering Journal, 36(2), pp. 174-181.
Anderson, C.R., Condron, L.M., Clough, T.J., Fiers, M., Stewart, A., Hill, R.A. and
Sherlock, R.R. (2011) 'Biochar induced soil microbial community change:
Implications for biogeochemical cycling of carbon, nitrogen and phosphorus',
Pedobiologia, 54(5–6), pp. 309-320.
Angst, T.E., Patterson, C.J., Reay, D.S., Anderson, P., Peshkur, T.A. and Sohi, S.P. (2013)
'Biochar Diminishes Nitrous Oxide and Nitrate Leaching from Diverse Nutrient
Sources', J. Environ. Qual., 42(3), pp. 672-682.
Asai, H., Samson, B.K., Stephan, H.M., Songyikhangsuthor, K., Homma, K., Kiyono, Y.,
Inoue, Y., Shiraiwa, T. and Horie, T. (2009) 'Biochar amendment techniques for
upland rice production in Northern Laos 1. Soil physical properties, leaf SPAD
and grain yield', Field Crops Research, 111(1-2), pp. 81-84.
Ascough, P.L., Bird, M.I., Francis, S.M., Thornton, B., Midwood, A.J., Scott, A.C. and
Apperley, D. (2011) 'Variability in oxidative degradation of charcoal: Influence
of production conditions and environmental exposure', Geochimica et
Cosmochimica Acta, 75(9), pp. 2361-2378.

122
Atkinson, C., Fitzgerald, J. and Hipps, N. (2010) 'Potential mechanisms for achieving
agricultural benefits from biochar application to temperate soils: a review',
Plant and Soil, 337(1-2), pp. 1-18.
Beesley, L., Moreno-Jiménez, E. and Gomez-Eyles, J.L. (2010) 'Effects of biochar and
greenwaste compost amendments on mobility, bioavailability and toxicity of
inorganic and organic contaminants in a multi-element polluted soil',
Environmental Pollution, 158(6), pp. 2282-2287.
Bell, M.J. and Worrall, F. (2011) 'Charcoal addition to soils in NE England: A carbon sink
with environmental co-benefits?', Science of The Total Environment, 409(9), pp.
1704-1714.
Berglund, L.M., DeLuca, T.H. and Zackrisson, O. (2004) 'Activated carbon amendments
to soil alters nitrification rates in Scots pine forests', Soil Biology and
Biochemistry, 36(12), pp. 2067-2073.
Bird, M.I., Ascough, P.L., Young, I.M., Wood, C.V. and Scott, A.C. (2008) 'X-ray
microtomographic imaging of charcoal', Journal of Archaeological Science,
35(10), pp. 2698-2706.
Bird, M.I., Moyo, C., Veenendaal, E.M., Lloyd, J. and Frost, P. (1999) 'Stability of
elemental carbon in a savanna soil', Global Biogeochem. Cycles, 13(4), pp. 923-
932.
Bloem, J. and Breure, A.M. (2003) 'Microbial indicators', in Markert, B.A., Breure, A.M.
and Zechmeister, H.G. (eds.) Bioindicators and biomonitors. Elsevier Science Ltd,
pp. 259-282.
Boehm, H.P. (2002) 'Surface oxides on carbon and their analysis: a critical assessment',
Carbon, 40(2), pp. 145-149.
Bourke, J., Manley-Harris, M., Fushimi, C., Dowaki, K., Nunoura, T. and Antal, M.J., Jr.
(2007) 'Do All Carbonized Charcoals Have the Same Chemical Structure? A
Model of the Chemical Structure of Carbonized Charcoal, Industrial and
Engineering Chemistry Research, 46(18).
Brodowski, S., Amelung, W., Haumaier, L., Abetz, C. and Zech, W. (2005)
'Morphological and chemical properties of black carbon in physical soil
fractions as revealed by scanning electron microscopy and energy-dispersive X-
ray spectroscopy', Geoderma, 128(1-2), pp. 116-129.

123
Brown, R.A., Kercher, A.K., Nguyen, T.H., Nagle, D.C. and Ball, W.P. (2006) 'Production
and characterization of synthetic wood chars for use as surrogates for natural
sorbents', Organic Geochemistry, 37(3), pp. 321-333.
Calvelo Pereira, R., Kaal, J., Camps Arbestain, M., Pardo Lorenzo, R., Aitkenhead, W.,
Hedley, M., Macías, F., Hindmarsh, J. and Maciá-Agulló, J.A. (2011)
'Contribution to characterisation of biochar to estimate the labile fraction of
carbon', Organic Geochemistry, 42(11), pp. 1331-1342.
Case, S.D.C., McNamara, N.P., Reay, D.S. and Whitaker, J. (2012) 'The effect of biochar
addition on N2O and CO2 emissions from a sandy loam soil – The role of soil
aeration', Soil Biology and Biochemistry, 51(0), pp. 125-134.
Cavigelli, M.A. and Robertson, G.P. (2001) 'Role of denitrifier diversity in rates of
nitrous oxide consumption in a terrestrial ecosystem', Soil Biology and
Biochemistry, 33(3), pp. 297-310.
Chan, K.Y. and Xu, Z. (2009) 'Biochar: Nutrient Properties and Their Enhancement', in
Lehmann, J. and Joseph, S. (eds.) Biochar for Environmental Management
Science and Technology. London, Sterling, VA: Earthscan, pp. 67-84.
Chen, B.L. and Chen, Z.M. (2009) 'Sorption of naphthalene and 1-naphthol by biochars
of orange peels with different pyrolytic temperatures', Chemosphere, 76(1), pp.
127-133.
Cheng, C.-H. and Lehmann, J. (2009) 'Ageing of black carbon along a temperature
gradient', Chemosphere, 75(8), pp. 1021-1027.
Cheng, C.-H., Lehmann, J. and Engelhard, M.H. (2008) 'Natural oxidation of black
carbon in soils: Changes in molecular form and surface charge along a
climosequence', Geochimica et Cosmochimica Acta, 72(6), pp. 1598-1610.
Cheng, C.-H., Lehmann, J., Thies, J.E., Burton, S.D. and Engelhard, M.H. (2006)
'Oxidation of black carbon by biotic and abiotic processes', Organic
Geochemistry, 37(11), pp. 1477-1488.
Chun, Y., Sheng, G., Chiou, C.T. and Xing, B. (2004) 'Compositions and Sorptive
Properties of Crop Residue-Derived Chars', Environmental Science & Technology,
38(17), pp. 4649-4655.

124
Cristancho, R.J.A., Hanafi, M.M., Syed Omar, S.R. and Rafii, M.Y. (2014) 'Aluminum
speciation of amended acid tropical soil and its effects on plant root growth',
Journal of Plant Nutrition, 37(6), pp. 811-827.
rombie, K., Mašek, ., Sohi, S.P., Brownsort, P. and ross, A. 201 'The effect of
pyrolysis conditions on biochar stability as determined by three methods', GCB
Bioenergy, 5(2), pp. 122-131.
Defra, U.K.S.O. (2010) Fertiliser Manual Rb209. 8th edn. Stationery Office.
DeLuca, T.H., MacKenzie, M.D. and Gundale, M.J. (2009) 'Biochar Effects on Soil
Nutrient Transformations', in Lehmann, J. and Joseph, S. (eds.) Biochar for
Environmental Management Science and Technology. London, Sterling, VA:
Earthscan, pp. 251-270.
Demirbas, A. (2004) 'Effects of temperature and particle size on bio-char yield from
pyrolysis of agricultural residues', Journal of Analytical and Applied Pyrolysis,
72(2), pp. 243-248.
Dempster, D., Gleeson, D., Solaiman, Z., Jones, D. and Murphy, D. (2012) 'Decreased
soil microbial biomass and nitrogen mineralisation with Eucalyptus biochar
addition to a coarse textured soil', Plant and Soil, 354(1-2), pp. 311-324.
Enders, A., Hanley, K., Whitman, T., Joseph, S. and Lehmann, J. (2012) 'Characterization
of biochars to evaluate recalcitrance and agronomic performance', Bioresource
Technology, 114(0), pp. 644-653.
Enders, A. and Lehmann, J. (2012) 'Comparison of Wet-Digestion and Dry-Ashing
Methods for Total Elemental Analysis of Biochar', Communications in Soil
Science and Plant Analysis, 43(7), pp. 1042-1052.
FAO (2012) FAO statistical yearbook, 2012 Africa food and agriculture.
Fernandes, M.B., Skjemstad, J.O., Johnson, B.B., Wells, J.D. and Brooks, P. (2003)
'Characterization of carbonaceous combustion residues. I. Morphological,
elemental and spectroscopic features', Chemosphere, 51(8), pp. 785-795.
Fletcher, A.J., Uygur, Y. and Thomas, K.M. (2007) 'Role of surface functional groups in
the adsorption kinetics of water vapor on microporous activated carbons',
Journal of Physical Chemistry C, 111(23), pp. 8349-8359.

125
Fletcher, A.J., Yüzak, Y. and Thomas, K.M. (2006) 'Adsorption and desorption kinetics
for hydrophilic and hydrophobic vapors on activated carbon', Carbon, 44(5), pp.
989-1004.
Forbes, M.S., Raison, R.J. and Skjemstad, J.O. (2006) 'Formation, transformation and
transport of black carbon (charcoal) in terrestrial and aquatic ecosystems',
Science of The Total Environment, 370(1), pp. 190-206.
Gartler, J., Robinson, B., Burton, K. and Clucas, L. (2013) 'Carbonaceous soil
amendments to biofortify crop plants with zinc', Science of The Total
Environment, 465(0), pp. 308-313.
Ghazanfar, S., Azim, A., Ghazanfar, M.A., Iqbal, M.A. and Begum, I. (2010)
'Metagenomics and its application in soil microbial community studies:
biotechnological prospects', Journal of Animal & Plant Sciences, 6(2), pp. 611-
622.
Glaser, B., Lehmann, J. and Zech, W. (2002) 'Ameliorating physical and chemical
properties of highly weathered soils in the tropics with charcoal - a review',
Biology and Fertility of Soils, 35(4), pp. 219-230.
Graber, E., Meller Harel, Y., Kolton, M., Cytryn, E., Silber, A., Rav David, D., Tsechansky,
L., Borenshtein, M. and Elad, Y. (2010) 'Biochar impact on development and
productivity of pepper and tomato grown in fertigated soilless media', Plant
and Soil, 337(1-2), pp. 481-496.
Gray, N.D., Hastings, R.C., Sheppard, S.K., Loughnane, P., Lloyd, D., McCarthy, A.J. and
Head, I.M. (2003) 'Effects of soil improvement treatments on bacterial
community structure and soil processes in an upland grassland soil', Fems
Microbiology Ecology, 46(1), pp. 11-22.
Grierson, S., Strezov, V., Ellem, G., McGregor, R. and Herbertson, J. (2009) 'Thermal
characterisation of microalgae under slow pyrolysis conditions', Journal of
Analytical and Applied Pyrolysis, 85(1-2), pp. 118-123.
Guo, Y. and Rockstraw, D.A. (2007) 'Activated carbons prepared from rice hull by one-
step phosphoric acid activation', Microporous and Mesoporous Materials,
100(1–3), pp. 12-19.

126
Haefele, S.M., Konboon, Y., Wongboon, W., Amarante, S., Maarifat, A.A., Pfeiffer, E.M.
and Knoblauch, C. (2011) 'Effects and fate of biochar from rice residues in rice-
based systems', Field Crops Research, 121(3), pp. 430-440.
Hale, S.E., Lehmann, J., Rutherford, D., Zimmerman, A.R., Bachmann, R.T.,
Shitumbanuma, V., ’Toole, A., Sundqvist, K.L., Arp, H.P.H. and ornelissen, G.
(2012) 'Quantifying the Total and Bioavailable Polycyclic Aromatic
Hydrocarbons and Dioxins in Biochars', Environmental Science & Technology,
46(5), pp. 2830-2838.
Harter, J., Krause, H.M., Schuettler, S., Ruser, R., Fromme, M., Scholten, T., Kappler, A.
and Behrens, S. (2013) 'Linking N2O emissions from biochar-amended soil to
the structure and function of the N-cycling microbial community', The ISME
journal.
Hartley, W., Dickinson, N.M., Riby, P. and Lepp, N.W. (2009) 'Arsenic mobility in
brownfield soils amended with green waste compost or biochar and planted
with Miscanthus', Environmental Pollution, 157(10), pp. 2654-2662.
Harvey, O.R., Kuo, L.-J., Zimmerman, A.R., Louchouarn, P., Amonette, J.E. and Herbert,
B.E. (2012) 'An Index-Based Approach to Assessing Recalcitrance and Soil
Carbon Sequestration Potential of Engineered Black Carbons (Biochars)',
Environmental Science & Technology, 46(3), pp. 1415-1421.
Hay, R.K.M. and Kemp, D.R. (1992) 'The prediction of leaf canopy expansion in the leek
from a simple model dependent on primordial development', Annals of Applied
Biology, 120, pp. 537-545.
Haygarth, P.M. and Ritz, K. (2009) 'The future of soils and land use in the UK: Soil
systems for the provision of land-based ecosystem services', Land Use Policy,
26S((Suppl. 1)), pp. S187-S197.
Hirsch, P.R., Mauchline, T.H. and Clark, I.M. (2010) 'Culture-independent molecular
techniques for soil microbial ecology', Soil Biology and Biochemistry, 42(6), pp.
878-887.
Hossain, M.K., Strezov, V., Chan, K.Y., Ziolkowski, A. and Nelson, P.F. (2011) 'Influence
of pyrolysis temperature on production and nutrient properties of wastewater
sludge biochar', Journal of Environmental Management, 92(1), pp. 223-228.

127
Hossain, M.K., Strezov, V., Yin Chan, K. and Nelson, P.F. (2010) 'Agronomic properties
of wastewater sludge biochar and bioavailability of metals in production of
cherry tomato (Lycopersicon esculentum)', Chemosphere, 78(9), pp. 1167-1171.
Insam, H. (2001) 'Developments in soil microbiology since the mid 1960s', Geoderma,
100(3-4), pp. 389-402.
Inyang, M., Gao, B., Pullammanappallil, P., Ding, W. and Zimmerman, A.R. (2010)
'Biochar from anaerobically digested sugarcane bagasse', Bioresource
Technology, 101(22), pp. 8868-8872.
Inyang, M., Gao, B., Yao, Y., Xue, Y., Zimmerman, A.R., Pullammanappallil, P. and Cao, X.
(2012) 'Removal of heavy metals from aqueous solution by biochars derived
from anaerobically digested biomass', Bioresource Technology, 110(0), pp. 50-
56.
Jones, R.J.A., Hiederer, R., Rusco, E. and Montanarella, L. (2005) 'Estimating organic
carbon in the soils of Europe for policy support', European Journal of Soil
Science, 56(5), pp. 655-671.
Kalderis, D., Koutoulakis, D., Paraskeva, P., Diamadopoulos, E., Otal, E., Valle, J.O.d. and
Fernández-Pereira, C. (2008) 'Adsorption of polluting substances on activated
carbons prepared from rice husk and sugarcane bagasse', Chemical Engineering
Journal, 144(1), pp. 42-50.
Karhu, K., Mattila, T., Bergström, I. and Regina, K. (2011) 'Biochar addition to
agricultural soil increased CH4 uptake and water holding capacity - Results from
a short-term pilot field study', Agriculture, Ecosystems & Environment, 140(1-2),
pp. 309-313.
Keiluweit, M., Kleber, M., Sparrow, M.A., Simoneit, B.R.T. and Prahl, F.G. (2012)
'Solvent-Extractable Polycyclic Aromatic Hydrocarbons in Biochar: Influence of
Pyrolysis Temperature and Feedstock', Environmental Science & Technology,
46(17), pp. 9333-9341.
Keiluweit, M., Nico, P.S., Johnson, M.G. and Kleber, M. (2010) 'Dynamic Molecular
Structure of Plant Biomass-Derived Black Carbon (Biochar)', Environmental
Science & Technology, 44(4), pp. 1247-1253.
Kennedy, A.C. and Smith, K.L. (1995) 'Soil microbial diversity and the sustainability of
agricultural soils', Plant and Soil, 170(1), pp. 75-86.

128
Khan, S., Chao, C., Waqas, M., Arp, H.P.H. and Zhu, Y.-G. (2013) 'Sewage Sludge Biochar
Influence upon Rice (Oryza sativa L) Yield, Metal Bioaccumulation and
Greenhouse Gas Emissions from Acidic Paddy Soil', Environmental science &
technology, 47(15), pp. 8624-32.
Kim, K.H., Kim, J.-Y., Cho, T.-S. and Choi, J.W. (2012) 'Influence of pyrolysis temperature
on physicochemical properties of biochar obtained from the fast pyrolysis of
pitch pine (Pinus rigida)', Bioresource Technology, 118(0), pp. 158-162.
Kloss, S., Zehetner, F., Dellantonio, A., Hamid, R., Ottner, F., Liedtke, V., Schwanninger,
M., Gerzabek, M.H. and Soja, G. (2012) 'Characterization of Slow Pyrolysis
Biochars: Effects of Feedstocks and Pyrolysis Temperature on Biochar
Properties', J. Environ. Qual., 41(4), pp. 990-1000.
Kuzyakov, Y., Subbotina, I., Chen, H.Q., Bogomolova, I. and Xu, X.L. (2009) 'Black carbon
decomposition and incorporation into soil microbial biomass estimated by C-14
labeling', Soil Biology & Biochemistry, 41(2), pp. 210-219.
Laird, D.A., Brown, R.C., Amonette, J.E. and Lehmann, J. (2009) 'Review of the pyrolysis
platform for coproducing bio-oil and biochar', Biofuels Bioproducts &
Biorefining-Biofpr, 3(5), pp. 547-562.
Lehmann, J. and Joseph, S. (2009a) 'Biochar for Environmental Management: An
Introduction', in Lehmann, J. and Joseph, S. (eds.) Biochar for Environmental
Management Science and Technology. London, Sterling, VA: Earthscan, pp. 1-
12.
Lehmann, J. and Joseph, S. (2009b) Biochar for Environmental Management: Science
and Technology. Earthscan LLC.
Lehmann, J., Pereira da Silva, J., Jr., Steiner, C., Nehls, T., Zech, W. and Glaser, B. (2003)
'Nutrient availability and leaching in an archaeological Anthrosol and a Ferralsol
of the Central Amazon basin: fertilizer, manure and charcoal amendments',
Plant and Soil, 249(2), pp. 343-357.
Lehmann, J., Rillig, M.C., Thies, J., Masiello, C.A., Hockaday, W.C. and Crowley, D. (2011)
'Biochar effects on soil biota – A review', Soil Biology and Biochemistry, 43(9),
pp. 1812-1836.
Little, I.P. (1992) 'The relationship between soil pH measurements in calcium chloride
and water suspensions', Soil Research, 30(5), pp. 587-592.

129
Liu, B.-R., Jia, G.-M., Chen, J. and Wang, G. (2006) 'A Review of Methods for Studying
Microbial Diversity in Soils', Pedosphere, 16(1), pp. 18-24.
Liu, Z. and Balasubramanian, R. (2013) 'A comparison of thermal behaviors of raw
biomass, pyrolytic biochar and their blends with lignite', Bioresource
Technology, 146(0), pp. 371-378.
Liu, Z., Quek, A., Kent Hoekman, S., Srinivasan, M.P. and Balasubramanian, R. (2012)
'Thermogravimetric investigation of hydrochar-lignite co-combustion',
Bioresource Technology, 123(0), pp. 646-652.
Liu, Z. and Zhang, F.-S. (2009) 'Removal of lead from water using biochars prepared
from hydrothermal liquefaction of biomass', Journal of Hazardous Materials,
167(1-3), pp. 933-939.
Lopez-Capel, E., Abbott, G.D., Thomas, K.M. and Manning, D.A.C. (2006) 'Coupling of
thermal analysis with quadrupole mass spectrometry and isotope ratio mass
spectrometry for simultaneous determination of evolved gases and their
carbon isotopic composition', Journal of Analytical and Applied Pyrolysis, 75(2),
pp. 82-89.
Lopez-Capel, E., Bol, R. and Manning, D.A.C. (2005) 'Application of simultaneous
thermal analysis mass spectrometry and stable carbon isotope analysis in a
carbon sequestration study', Rapid Communications in Mass Spectrometry,
19(22), pp. 3192-3198.
Major, J., Rondon, M., Molina, D., Riha, S. and Lehmann, J. (2010) 'Maize yield and
nutrition during 4 years after biochar application to a Colombian savanna
oxisol', Plant and Soil, 333(1-2), pp. 117-128.
Masahide, Y., Yasuyuki, O., Irhas Fredy, W., Saifuddin, A. and Makoto, O. (2006) 'Effects
of the application of charred bark of Acacia mangium on the yield of maize,
cowpea and peanut, and soil chemical properties in South Sumatra, Indonesia',
Soil Science and Plant Nutrition, 52(4), pp. 489-495.
Mašek, ., Brownsort, P., ross, A. and Sohi, S. 201 'Influence of production
conditions on the yield and environmental stability of biochar', Fuel, 103(0), pp.
151-155.
Masiello, C.A. (2004) 'New directions in black carbon organic geochemistry', Marine
Chemistry, 92(1-4), pp. 201-213.

130
McCann, C.M. (2013) The use of natural Mn-oxide containing wastes as a
contaminated land remediation strategy and their effects on soil microbial
functioning. Unpublished thesis. Newcastle University.
Melchior, T., Perkins, C., Lichty, P., Weimer, A.W. and Steinfeld, A. (2009) 'Solar-driven
biochar gasification in a particle-flow reactor', Chemical Engineering and
Processing, 48(8), pp. 1279-1287.
Mingorance, M.D., Oliva, S.R., Valdés, B., Gata, F.J.P., Leidi, E.O., Guzmán, I. and Peña,
A. (2014) 'Stabilized municipal sewage sludge addition to improve properties of
an acid mine soil for plant growth', J Soils Sediments, 14, pp. 703-712.
Montanarella, L. and Lugato, E. (2013) 'The Application of Biochar in the EU: Challenges
and Opportunities', Agronomy, 3(2), pp. 462-473.
Moore, J. (2011) Wood properties and uses of Sitka spruce in Britain. Edinburgh:
Forestry Commission Publications 231 Corstorphine Road Edinburgh Scotland,
EH12 7AT. [Online]. Available at:
http://www.forestry.gov.uk/pdf/FCRP015.pdf/$FILE/FCRP015.pdf.
Mukherjee, A. and Zimmerman, A.R. (2013) 'Organic carbon and nutrient release from
a range of laboratory-produced biochars and biochar-soil mixtures', Geoderma,
193, pp. 122-130.
Muyzer, G. (1999) 'DGGE/TGGE a method for identifying genes from natural
ecosystems', Current Opinion in Microbiology, 2(3), pp. 317-322.
Muyzer, G., de Waal, E.C. and Uitterlinden, A.G. (1993) 'Profiling of Complex Microbial
Populations by Denaturing Gradient Gel Electrophoresis Analysis of Polymerase
Chain Reaction-Amplified Genes Coding for 16S rRNA', Applied and
Environmental Microbiology, 59(3), pp. 695-700.
Nakatsu, C.H. (2007) 'Soil Microbial Community Analysis Using Denaturing Gradient Gel
Electrophoresis.', Soil Sci. Soc. Am. J., 71(2), pp. 562-571.
Namgay, T., Singh, B. and Singh, B.P. (2010) 'Influence of biochar application to soil on
the availability of As, Cd, Cu, Pb, and Zn to maize (Zea mays L.)', Soil Research,
48(7), pp. 638-647.
Nguyen, B.T. and Lehmann, J. (2009) 'Black carbon decomposition under varying water
regimes', Organic Geochemistry, 40(8), pp. 846-853.

131
Ogawa, M., Okimori, Y. and Takahashi, F. (2006) 'Carbon Sequestration by
Carbonization of Biomass and Forestation: Three Case Studies', Mitigation and
Adaptation Strategies for Global Change, 11(2), pp. 421-436.
Ozcimen, D. and Ersoy-Mericboyu, A. (2008) 'A study on the carbonization of
grapeseed and chestnut shell', Fuel Processing Technology, 89(11), pp. 1041-
1046.
Ozcimen, D. and Karaosmanoglu, F. (2004) 'Production and characterization of bio-oil
and biochar from rapeseed cake', Renewable Energy, 29(5), pp. 779-787.
Patra, A.K., Abbadie, L., Clays-Josserand, A., Degrange, V., Grayston, S.J., Guillaumaud,
N., Loiseau, P., Louault, F., Mahmood, S., Nazaret, S., Philippot, L., Poly, F.,
Prosser, J.I. and Roux, X.L. (2006) 'Effects of management regime and plant
species on the enzyme activity and genetic structure of N-fixing, denitrifying
and nitrifying bacterial communities in grassland soils', Environmental
Microbiology, 8(6), pp. 1005-1016.
Pereira, M.F.R., Soares, S.F., Órfão, J.J.M. and Figueiredo, J.L. (2003) 'Adsorption of
dyes on activated carbons: influence of surface chemical groups', Carbon, 41(4),
pp. 811-821.
Peterson, S.C., Appell, M., Jackson, M.A. and Boateng, A.A. (2013) 'Comparing Corn
Stover and Switchgrass Biochar: Characterization and Sorption Properties',
Journal of Agricultural Science, 5(1), pp. 1-8.
Prendergast-Miller, M.T., Duvall, M. and Sohi, S.P. (2011) 'Localisation of nitrate in the
rhizosphere of biochar-amended soils', Soil Biology and Biochemistry, 43(11),
pp. 2243-2246.
Qiu, Y., Cheng, H., Xu, C. and Sheng, G.D. (2008) 'Surface characteristics of crop-
residue-derived black carbon and lead(II) adsorption', Water Research, 42(3),
pp. 567-574.
Qiu, Y., Zheng, Z., Zhou, Z. and Sheng, G.D. (2009) 'Effectiveness and mechanisms of
dye adsorption on a straw-based biochar', Bioresource Technology, 100(21), pp.
5348-5351.
Ritz, K., Black, H.I.J., Campbell, C.D., Harris, J.A. and Wood, C. (2009) 'Selecting
biological indicators for monitoring soils: A framework for balancing scientific
132
and technical opinion to assist policy development', Ecological Indicators, 9(6),
pp. 1212-1221.
Ronsse, F., van Hecke, S., Dickinson, D. and Prins, W. (2013) 'Production and
characterization of slow pyrolysis biochar: influence of feedstock type and
pyrolysis conditions', GCB Bioenergy, 5(2), pp. 104-115.
Rutigliano, F.A., D'Ascoli, R. and Virzo De Santo, A. (2004) 'Soil microbial metabolism
and nutrient status in a Mediterranean area as affected by plant cover', Soil
Biology and Biochemistry, 36(11), pp. 1719-1729.
Saarnio, S., Heimonen, K. and Kettunen, R. (2013) 'Biochar addition indirectly affects
N2O emissions via soil moisture and plant N uptake', Soil Biology and
Biochemistry, 58(0), pp. 99-106.
Sanchez, M.E., Lindao, E., Margaleff, D., Martinez, O. and Moran, A. (2009) 'Pyrolysis of
agricultural residues from rape and sunflowers: Production and
characterization of bio-fuels and biochar soil management', Journal of
Analytical and Applied Pyrolysis, 85(1-2), pp. 142-144.
Saxena, J., Rana, G. and Pandey, M. (2013) 'Impact of addition of biochar along with
Bacillus sp. on growth and yield of French beans', Scientia Horticulturae, 162(0),
pp. 351-356.
Schimmelpfennig, S. and Glaser, B. (2012) 'One Step Forward toward Characterization:
Some Important Material Properties to Distinguish Biochars', Journal of
environmental Quality, 41(4), pp. 1001-1013.
Schmidt, M.W.I. and Noack, A.G. (2000) 'Black carbon in soils and sediments: Analysis,
distribution, implications, and current challenges', Global Biogeochemical
Cycles, 14(3), pp. 777-793.
Schulz, H., Dunst, G. and Glaser, B. (2013) 'Positive effects of composted biochar on
plant growth and soil fertility', Agronomy for Sustainable Development, 33(4),
pp. 817-827.
Schulz, H. and Glaser, B. (2012) 'Effects of biochar compared to organic and inorganic
fertilizers on soil quality and plant growth in a greenhouse experiment', Journal
of Plant Nutrition and Soil Science, 175(3), pp. 410-422.
Seredych, M., Hulicova-Jurcakova, D., Lu, G.Q. and Bandosz, T.J. (2008) 'Surface
functional groups of carbons and the effects of their chemical character,

133
density and accessibility to ions on electrochemical performance', Carbon,
46(11), pp. 1475-1488.
Shen, D.K., Gu, S., Luo, K.H., Wang, S.R. and Fang, M.X. (2010) 'The pyrolytic
degradation of wood-derived lignin from pulping process', Bioresource
Technology, 101(15), pp. 6136-6146.
Sheppard, S.K., McCarthy, A.J., Loughnane, J.P., Gray, N.D., Head, I.M. and Lloyd, D.
(2005) 'The impact of sludge amendment on methanogen community structure
in an upland soil', Applied Soil Ecology, 28(2), pp. 147-162.
ŠImek, M. and ooper, J.E. 2002 'The influence of soil pH on denitrification: progress
towards the understanding of this interaction over the last 50 years', European
Journal of Soil Science, 53(3), pp. 345-354.
Singh, B.P., Hatton, B.J., Singh, B., Cowie, A.L. and Kathuria, A. (2010) 'Influence of
Biochars on Nitrous Oxide Emission and Nitrogen Leaching from Two
Contrasting Soils', J. Environ. Qual., 39(4), pp. 1224-1235.
Sohi, S.P., Krull, E., Lopez-Capel, E. and Bol, R. (2010) 'A review of biochar and its use
and function in soil', in Sparks, D.L. (ed.) Advances in agronomy. Burlington:
Academic Press, pp. 47-82.
Solomon, S., Qin, D., Manning, M., Z., C., M., M., K.B., A., M., T. and (eds.), M.H.L. (2007)
IPCC, 2007: Climate Change 2007: The Physical Science Basis. Contribution of
Working Group I to the Fourth Assessment Report of the Intergovernmental
Panel on Climate Change. Cambridge, United Kingdom and New York, NY, USA:
Press, C.U.
Song, J. and Peng, P.a. (2010) 'Characterisation of black carbon materials by pyrolysis-
gas chromatography-mass spectrometry', Journal of Analytical and Applied
Pyrolysis, 87(1), pp. 129-137.
Spokas, K., Baker, J. and Reicosky, D. (2010) 'Ethylene: potential key for biochar
amendment impacts', Plant and Soil, 333(1-2), pp. 443-452.
Spokas, K.A., Cantrell, K.B., Novak, J.M., Archer, D.W., Ippolito, J.A., Collins, H.P.,
Boateng, A.A., Lima, I.M., Lamb, M.C., McAloon, A.J., Lentz, R.D. and Nichols,
K.A. (2012) 'Biochar: A Synthesis of Its Agronomic Impact beyond Carbon
Sequestration', J. Environ. Qual., 41(4), pp. 973-989.

134
Spokas, K.A., Koskinen, W.C., Baker, J.M. and Reicosky, D.C. (2009) 'Impacts of
woodchip biochar additions on greenhouse gas production and
sorption/degradation of two herbicides in a Minnesota soil', Chemosphere,
77(4), pp. 574-581.
Spokas, K.A. and Reicosky, D. (2009) 'Impacts of sixteen different biochars on soil
greenhouse gas production', Annals of Environmental Science, 3, pp. 179-193.
Steinbeiss, S., Gleixner, G. and Antonietti, M. (2009) 'Effect of biochar amendment on
soil carbon balance and soil microbial activity', Soil Biology & Biochemistry,
41(6), pp. 1301-1310.
Sukartono, Utomo, W.H., Kusuma, Z. and Nugroho, W.H. (2011) 'Soil fertility status,
nutrient uptake, and maize (Zea mays L.) yield following biochar and cattle
manure application on sandy soils of Lombok, Indonesia', Journal of Tropical
Agriculture, 49(1-2), pp. 47-52.
Taghizadeh-Toosi, A., Clough, T.J., Condron, L.M., Sherlock, R.R., Anderson, C.R. and
Craigie, R.A. (2011) 'Biochar Incorporation into Pasture Soil Suppresses in situ
Nitrous Oxide Emissions from Ruminant Urine Patches', Journal of
environmental Quality, 40, pp. 468-476.
Thevenot, M., Dignac, M.-F. and Rumpel, C. (2010) 'Fate of lignins in soils: A review',
Soil Biology and Biochemistry, 42(8), pp. 1200-1211.
Thies, J.E. and Rillig, M. (2009) 'Characteristics of Biochar: Biological Properties', in
Lehmann, J. and Joseph, S. (eds.) Biochar for Environmental Management
Science and Technology. London, Sterling, VA: Earthscan, pp. 85-106.
Titiladunayo, I., McDonald, A. and Fapetu, O. (2012) 'Effect of Temperature on Biochar
Product Yield from Selected Lignocellulosic Biomass in a Pyrolysis Process',
Waste and Biomass Valorization, 3, pp. 311-318.
Torsvik, V. and Øvreås, L. (2002) 'Microbial diversity and function in soil: from genes to
ecosystems', Current Opinion in Microbiology, 5(3), pp. 240-245.
Uchimiya, M., Bannon, D.I. and Wartelle, L.H. (2012) 'Retention of Heavy Metals by
Carboxyl Functional Groups of Biochars in Small Arms Range Soil', Journal of
Agricultural and Food Chemistry, 60(7), pp. 1798-1809.
Uchimiya, M., Lima, I.M., Thomas Klasson, K., Chang, S., Wartelle, L.H. and Rodgers, J.E.
(2010) 'Immobilization of Heavy Metal Ions (CuII, CdII, NiII, and PbII) by Broiler

135
Litter-Derived Biochars in Water and Soil', Journal of Agricultural and Food
Chemistry, 58(9), pp. 5538-5544.
Uchimiya, M., Wartelle, L.H., Klasson, K.T., Fortier, C.A. and Lima, I.M. (2011) 'Influence
of Pyrolysis Temperature on Biochar Property and Function as a Heavy Metal
Sorbent in Soil', Journal of Agricultural and Food Chemistry, 59, pp. 2501-2510.
Vaccari, F.P., Baronti, S., Lugato, E., Genesio, L., Castaldi, S., Fornasier, F. and Miglietta,
F. (2011) 'Biochar as a strategy to sequester carbon and increase yield in durum
wheat', European Journal of Agronomy, 34(4), pp. 231-238.
Van Zwieten, L., Kimber, S., Morris, S., Chan, K.Y., Downie, A., Rust, J., Joseph, S. and
Cowie, A. (2010) 'Effects of biochar from slow pyrolysis of papermill waste on
agronomic performance and soil fertility', Plant and Soil, 327(1-2), pp. 235-246.
Verheijen, F., Jeffery, S., Bastos, A.C., van der Velde, M. and Diafas, I. (2009) Biochar
applications to soils - A Critical Scientific Review of Effets on Soil Properties,
Processes and Functions. Luxembourg: Office for the Official Publications of the
European Communities.
Wang, T., Camps-Arbestain, M. and Hedley, M. (2013a) 'Predicting C aromaticity of
biochars based on their elemental composition', Organic Geochemistry, 62, pp.
1-6.
Wang, X.S., Chen, L.F., Li, F.Y., Chen, K.L., Wan, W.Y. and Tang, Y.J. (2010) 'Removal of
Cr (VI) with wheat-residue derived black carbon: Reaction mechanism and
adsorption performance', Journal of Hazardous Materials, 175(1-3), pp. 816-
822.
Wang, Y., Hu, Y., Zhao, X., Wang, S. and Xing, G. (2013b) 'Comparisons of Biochar
Properties from Wood Material and Crop Residues at Different Temperatures
and Residence Times', Energy & Fuels, 27(10), pp. 5890-5899.
Webster, G., Embley, T.M. and Prosser, J.I. (2002) 'Grassland Management Regimens
Reduce Small-Scale Heterogeneity and Species Diversity of {beta}-
Proteobacterial Ammonia Oxidizer Populations', Appl. Environ. Microbiol., 68(1),
pp. 20-30.
Wertz, S., Degrange, V., Prosser, J.I., Poly, F., Commeaux, C., Freitag, T., Guillaumaud, N.
and Roux, X.L. (2006) 'Maintenance of soil functioning following erosion of
microbial diversity', Environmental Microbiology, 8(12), pp. 2162-2169.
136
Winding, A., Hund-Rinke, K. and Rutgers, M. (2005) 'The use of microorganisms in
ecological soil classification and assessment concepts', Ecotoxicology and
Environmental Safety, 62(2), pp. 230-248.
Yaghoubi, P. and Reddy, K.R. (2011) 'Characteristcs of Biochar-amended Soil Cover for
Landfill Gas Mitigation', Pan-Am CGS Geotechnical Conference.
Yang, H., Yan, R., Chen, H., Lee, D.H. and Zheng, C. (2007) 'Characteristics of
hemicellulose, cellulose and lignin pyrolysis', Fuel, 86(12–13), pp. 1781-1788.
Yoo, G. and Kang, H. (2012) 'Effects of Biochar Addition on Greenhouse Gas Emissions
and Microbial Responses in a Short-Term Laboratory Experiment', J. Environ.
Qual., 41(4), pp. 1193-1202.
Yu, X.Y., Ying, G.G. and Kookana, R.S. (2009) 'Reduced plant uptake of pesticides with
biochar additions to soil', Chemosphere, 76(5), pp. 665-671.
Zhang, A., Liu, Y., Pan, G., Hussain, Q., Li, L., Zheng, J. and Zhang, X. (2012) 'Effect of
biochar amendment on maize yield and greenhouse gas emissions from a soil
organic carbon poor calcareous loamy soil from Central China Plain', Plant and
Soil, 351, pp. 263-275.
Zhao, L., Cao, X., Masek, O. and Zimmerman, A. (2013) 'Heterogeneity of biochar
properties as a function of feedstock sources and production temperatures',
Journal of Hazardous Materials, 256, pp. 1-9.
Zhu, D., Kwon, S. and Pignatello, J.J. (2005) 'Adsorption of Single-Ring Organic
Compounds to Wood Charcoals Prepared under Different Thermochemical
Conditions', Environmental Science & Technology, 39(11), pp. 3990-3998.
Zimmerman, A.R. (2010) 'Abiotic and Microbial Oxidation of Laboratory-Produced
Black Carbon (Biochar)', Environmental Science & Technology, 44(4), pp. 1295-
1301.
Zimmerman, A.R., Gao, B. and Ahn, M.-Y. (2011) 'Positive and negative carbon
mineralization priming effects among a variety of biochar-amended soils', Soil
Biology and Biochemistry, 43(6), pp. 1169-1179.