the biocultural origins of human capital formation · the biocultural origins of human capital...
TRANSCRIPT

The Biocultural Origins of Human Capital Formation
Oded Galor and Marc Klemp
July 4, 2015
Galor and Klemp Biocultural Origins of Human Capital July 4, 2015 1 / 72

Introduction Motivation
Research Questions
The evolutionary foundations of human capital formation
Have the forces of natural selection favored individuals with a largerpredisposition towards child quality?
Have the forces of natural selection contributed to:
Human capital formation?
The demographic transition?
The transition from stagnation to growth?
Galor and Klemp Biocultural Origins of Human Capital July 4, 2015 2 / 72

Introduction Motivation
Existing Theories
The Life-History Theory (Lack, 1954)
Reproductive strategies of any organisms have evolved to maximize theirlong-run reproductive success
Clutch size (e.g., number of eggs) maximizes long-run reproduction
Evolutionary Growth Theory (Galor-Moav, 2002)
Natural Selection is the origin of economic growth
Traits associated with pre-disposition towards child quality were selected,triggering the transition from stagnation to growth
Galor and Klemp Biocultural Origins of Human Capital July 4, 2015 3 / 72

Introduction Motivation
Fundamental Empirical Questions
Is there an intergenerational trade-off in reproductive success?
Is higher fecundity (e.g., higher sperm count) conducive for reproductivesuccess in the long run?
Does a larger number of children generate a larger number of offspringin the long run?
Have the forces of natural selection favored moderately fertile indivi-duals (i.e., the quality strategy) during the Malthusian epoch?
Galor and Klemp Biocultural Origins of Human Capital July 4, 2015 4 / 72

Introduction Motivation
Conditions for the Optimality of Moderate Fertility
Necessary Condition: Quantity-Quality Trade-off
Quantity of children come on the account of their quality (survival,education, marriageability)
Lower quality reduces the child’s earning capacity and therefore fertility
Sufficient Condition:
The product of the following elasticities is greater than 1:
The elasticity of child quality with respect to to quantity
The elasticity of grandchildren with respect to child quality
Galor and Klemp Biocultural Origins of Human Capital July 4, 2015 5 / 72

Introduction Motivation
Evidence for a Quantity-Quality Trade-off
Plants
Trade-off between the number and size of seeds
Animals
Trade-off between the number of offspring and their size
Humans
Trade-off between the number of children and their human capital
Galor and Klemp Biocultural Origins of Human Capital July 4, 2015 6 / 72

Introduction Motivation
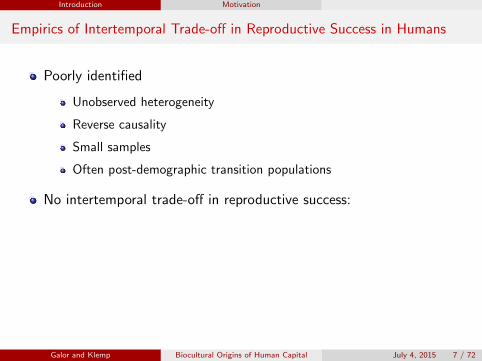
Empirics of Intertemporal Trade-off in Reproductive Success in Humans
Poorly identified
Unobserved heterogeneity
Reverse causality
Small samples
Often post-demographic transition populations
No intertemporal trade-off in reproductive success:
Kenyan Kipsigis (Borgerhoff-Mulder, 2000)
82 men and 64 women in 4 income groups
No trade-off for men and for 3 of the 4 income groups
New Mexican men (Kaplan et al., 1995)
Post-demographic transition
Galor and Klemp Biocultural Origins of Human Capital July 4, 2015 7 / 72
Introduction Motivation
Empirics of Intertemporal Trade-off in Reproductive Success in Humans
Poorly identified
Unobserved heterogeneity
Reverse causality
Small samples
Often post-demographic transition populations
No intertemporal trade-off in reproductive success:
Kenyan Kipsigis (Borgerhoff-Mulder, 2000)
82 men and 64 women in 4 income groups
No trade-off for men and for 3 of the 4 income groups
New Mexican men (Kaplan et al., 1995)
Post-demographic transition
Galor and Klemp Biocultural Origins of Human Capital July 4, 2015 7 / 72

Introduction Motivation
Historical Lab: Quebec During its Demographic Explosion
Galor and Klemp Biocultural Origins of Human Capital July 4, 2015 8 / 72

Introduction Motivation
Quebec During its Demographic Explosion
Quebec 1608–1800
Founder population order of magnitude smaller than carrying capacity
Reproductive histories of 3,798 lineages
Genealogy of nearly 500,000 individuals
Galor and Klemp Biocultural Origins of Human Capital July 4, 2015 9 / 72

Introduction Motivation
Findings
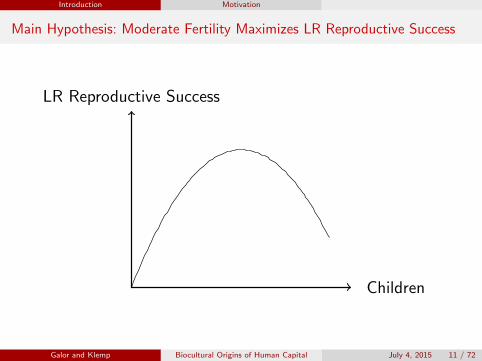
First comprehensive evidence for presence of an intertemporal trade-offin reproductive success (across any species)
An intermediate level of fecundity is associated with maximal long-runreproductive success.
Confirmation of selection of a quality strategy over the pre-industrial,pre-demographic transition era
The optimal level of fecundity is below the population mean
Galor and Klemp Biocultural Origins of Human Capital July 4, 2015 10 / 72

Introduction Motivation
Findings
First comprehensive evidence for presence of an intertemporal trade-offin reproductive success (across any species)
An intermediate level of fecundity is associated with maximal long-runreproductive success.
Confirmation of selection of a quality strategy over the pre-industrial,pre-demographic transition era
The optimal level of fecundity is below the population mean
Galor and Klemp Biocultural Origins of Human Capital July 4, 2015 10 / 72
Introduction Motivation
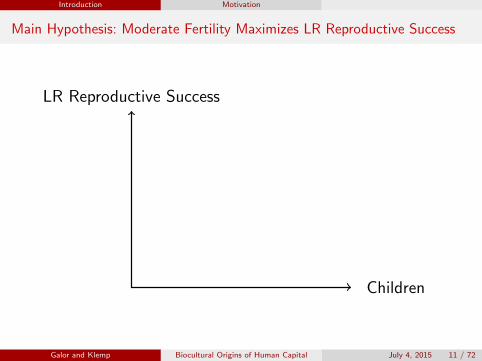
Main Hypothesis: Moderate Fertility Maximizes LR Reproductive Success
LR Reproductive Success
Children
Galor and Klemp Biocultural Origins of Human Capital July 4, 2015 11 / 72
Introduction Motivation
Main Hypothesis: Moderate Fertility Maximizes LR Reproductive Success
LR Reproductive Success
Children
Galor and Klemp Biocultural Origins of Human Capital July 4, 2015 11 / 72

Introduction Motivation
Empirical challenges: Unobserved Heterogeneity
Income and education
Transmitted intergenerationally
Positively affects fertility
Biases the results towards the absence of an intergenerational trade-off
Galor and Klemp Biocultural Origins of Human Capital July 4, 2015 12 / 72

Introduction Motivation
Empirical challenges: Unobserved Heterogeneity
Income and education
Transmitted intergenerationally
Positively affects fertility
Biases the results towards the absence of an intergenerational trade-off
Galor and Klemp Biocultural Origins of Human Capital July 4, 2015 12 / 72

Introduction Motivation
Empirical challenges: Unobserved Heterogeneity
Income and education
Transmitted intergenerationally
Positively affects fertility
Biases the results towards the absence of an intergenerational trade-off
Galor and Klemp Biocultural Origins of Human Capital July 4, 2015 12 / 72

Introduction Motivation
Empirical challenges: Unobserved Heterogeneity
Income and education
Transmitted intergenerationally
Positively affects fertility
Biases the results towards the absence of an intergenerational trade-off
Galor and Klemp Biocultural Origins of Human Capital July 4, 2015 12 / 72

Introduction Motivation
Challenge: Unobserved heterogeneity
Grandchildren
Children
Poor
Galor and Klemp Biocultural Origins of Human Capital July 4, 2015 13 / 72
Introduction Motivation
Challenge: Unobserved heterogeneity
Grandchildren
Children
Ordinary
Galor and Klemp Biocultural Origins of Human Capital July 4, 2015 13 / 72

Introduction Motivation
Challenge: Unobserved heterogeneity
Grandchildren
Children
Rich
Galor and Klemp Biocultural Origins of Human Capital July 4, 2015 13 / 72

Introduction Motivation
Challenge: Unobserved heterogeneity
Grandchildren
Children
Galor and Klemp Biocultural Origins of Human Capital July 4, 2015 13 / 72

Introduction Motivation
Empirical Challenge: Reverse causality
Effect of offspring quality on quantity
Lower quality of children that results in higher child mortality
Higher fertility via the replacement motive
Galor and Klemp Biocultural Origins of Human Capital July 4, 2015 14 / 72
Introduction Motivation
Empirical Challenge: Reverse causality
Effect of offspring quality on quantity
Lower quality of children that results in higher child mortality
Higher fertility via the replacement motive
Galor and Klemp Biocultural Origins of Human Capital July 4, 2015 14 / 72

Introduction Motivation
Empirical Challenge: Reverse causality
Effect of offspring quality on quantity
Lower quality of children that results in higher child mortality
Higher fertility via the replacement motive
Galor and Klemp Biocultural Origins of Human Capital July 4, 2015 14 / 72

Introduction Empirical strategy
Empirical strategy
Exploits random variation in fecundity (i.e., the physiological ability toreproduce) to establish the optimality of moderate fecundity for long-run reproductive success.
Employ the time interval between the date of marriage and the first birth(TFB) as a source of variation in fecundity, .
TFB is affected by:
Genetic predisposition
Socio-environmental conditions
Random elements that affect conception
Identification will be based on the random variation in TFB
Galor and Klemp Biocultural Origins of Human Capital July 4, 2015 15 / 72

Introduction Empirical strategy
The Distribution of Time to First Birth (TFB)
0
1
2
3
4
5
Per
cent
age
of o
bser
vatio
ns
0 38 142
Weeks from marriage to first birth
Galor and Klemp Biocultural Origins of Human Capital July 4, 2015 16 / 72

Introduction Empirical strategy
Time to First Birth (TFB) and the Number of Children
8.5
9
9.5
10
Num
ber o
f chi
ldre
n
40 60 80 100 120Weeks from marriage to first birth
Show unconditional relationship
Galor and Klemp Biocultural Origins of Human Capital July 4, 2015 17 / 72

Introduction Empirical strategy
Isolating the Random Variation in TFB
Control for socioeconomic factors
Literacy
Gender
Birth year, birth parish and death parish
Month of marriage and month of birth of firstborn
Marriage and stoppage age
Birth order
Lineage-specific fixed effects
Control for genetic predisposition
Lineage-specific fixed effects
Identification based on variation across siblings as opposed to thepopulation as a whole
Galor and Klemp Biocultural Origins of Human Capital July 4, 2015 18 / 72

Introduction Empirical strategy
Reproductive Success of Head of Dynasties
Focus on head of dynasties born prior to 1685 allows for:
Reproductive histories of 3,798 head of dynasties
Tracing reproductive histories over 4 generations
Account for lineage-specific fixed effects
Galor and Klemp Biocultural Origins of Human Capital July 4, 2015 19 / 72

Introduction Empirical strategy
Head of Dynasty
Galor and Klemp Biocultural Origins of Human Capital July 4, 2015 20 / 72

Introduction Empirical strategy
The Lineage of Head of Dynasties
Galor and Klemp Biocultural Origins of Human Capital July 4, 2015 21 / 72

Introduction Empirical strategy
The Lineage of Head of Dynasties
Galor and Klemp Biocultural Origins of Human Capital July 4, 2015 22 / 72

Introduction Empirical strategy
Lineages of Head of Dynasties
Galor and Klemp Biocultural Origins of Human Capital July 4, 2015 23 / 72

Introduction Empirical strategy
Lineages of Head of Dynasties
Galor and Klemp Biocultural Origins of Human Capital July 4, 2015 23 / 72

Number of Children
0
2
4
6
8
10
Perc
enta
ge o
f obs
erva
tions
1 5 10 15 20 25 30Number of children

Number of Grandchildren
0
1
2
3
4
5
Perc
enta
ge o
f obs
erva
tions
1 50 100 150 200Number of grandchildren

Data & Analysis Data
Summary Statistics
Mean Median S.D. Count(1) (2) (3) (4)
Children 9.70 10 3.99 3,798Surviving childrena 4.63 4 2.59 3,798Grandchildren 47.35 44 28.07 3,798Great-grandchildren 187.59 159 140.17 3,798Great-great-grandchildrenb 294.01 171 363.58 3,798Years from marriage to first birth (TFB) 1.20 1.02 0.47 3,798Literate 0.66 1 0.47 2,222Fraction of literate children 0.74 1 0.35 3,448Fraction of surviving childrena 0.49 0.50 0.21 3,798Fraction of surviving children with known literacya 0.76 0.67 0.56 3,727Age at first marriage 22.67 22.2 5.46 3,798Age at last delivery 41.95 42.1 8.61 3,798c Survival is recorded at age 40.b The moderate increase in the mean and median number of descendants from the third to the fourthgeneration (i.e. from great-grandchildren to great-great-grandchildren) reflects the fact that these cohortsare less fully observed. Furthermore, since men produce children at later ages than women, this effect ismore pronounced among men.
Galor and Klemp Biocultural Origins of Human Capital July 4, 2015 26 / 72

Children vs. TFB: restricted cubic splines
8.5
99.
510
10.5
Pre
dict
ed n
o. o
f chi
ldre
n
38 142
Weeks from marriage to first birth
A

Grandchildren vs. TFB: restricted cubic splines
4042
4446
4850
Pre
dict
ed n
o. o
f gra
ndch
ildre
n
38 142
Weeks from marriage to first birth
B
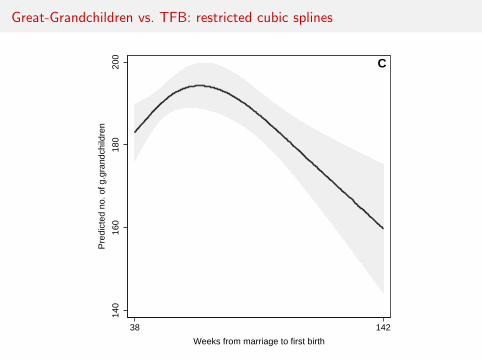
Great-Grandchildren vs. TFB: restricted cubic splines
140
160
180
200
Pre
dict
ed n
o. o
f g.g
rand
child
ren
38 142
Weeks from marriage to first birth
C

Great-Great-Grandchildren vs. TFB: restricted cubic splines
200
250
300
Pre
dict
ed n
o. o
f g.-
g.-g
rand
child
ren
38 142
Weeks from marriage to first birth
D

Econometric Specification
The effect of TFB on the number of children:
lnDi ,1 = β0,1 + β1,1TFBi + Ziβ2,1 + εi ,1,
The effect of TFB on the number of offspring in generation t = 2, 3, 4:
lnDi ,t = β0,t + β1,tTFBi + β2,tTFB2i + Ziβ3,t + εi ,t ,

Econometric Specification
The effect of TFB on the number of children:
lnDi ,1 = β0,1 + β1,1TFBi + Ziβ2,1 + εi ,1,
The effect of TFB on the number of offspring in generation t = 2, 3, 4:
lnDi ,t = β0,t + β1,tTFBi + β2,tTFB2i + Ziβ3,t + εi ,t ,

TFB and Number of Descendants for Head of Lineages Born before 1685(Accounting for Maternal Founder FE)
Log number of descendants in:Gen. 1 Gen. 2 Gen. 3 Gen. 4 Gen. 1 Gen. 2 Gen. 3 Gen. 4 Gen. 1 Gen. 4
(1) (2) (3) (4) (5) (6) (7) (8) (9) (10)
TFB -.052** .167 .505** .783*** -.062*** .140 .463** .773*** -.077*** .810***(.024) (.163) (.205) (.264) (.024) (.162) (.204) (.264) (.011) (.258)
TFB2 -.068 -.193*** -.310*** -.063 -.183*** -.309*** -.325***(.053) (.067) (.087) (.053) (.067) (.087) (.084)
Literate -.006 .063 .148*** .138** -.027* .109*(.030) (.040) (.051) (.066) (.014) (.066)
Male .220*** .254*** .299*** .131** -.028* .036(.031) (.039) (.047) (.060) (.015) (.063)
Stoppage age fixed effects No No No No No No No No Yes Yes
Number of observations 3,798 3,798 3,798 3,798 3,798 3,798 3,798 3,798 3,798 3,798Adjusted R2 .015 .016 .038 .306 .032 .029 .052 .307 .799 .355Joint sign.-level of TFB & TFB2 .031 .196 .002 .000 .010 .130 .002 .000 .000 .000Maximizing TFB 1.224 1.307 1.261 1.113 1.263 1.249 1.247Lower limit of 90% CI - .961 .999 - .827 .976 1.002Upper limit of 90% CI - 1.467 1.398 - 1.435 1.389 1.376This table presents the results of a series of fixed-effects regressions of the number of descendants in generation t on time to first birth measured in years, i.e. TFBand TFB2. All regressions account for Maternal Founder fixed effects. Birth year and marriage age dummies are included as controls. Furthermore, stoppage agedummies are included in columns 9–10. A dummy indicating unknown literacy is included in the regressions underlying column 5–10. Standard errors clustered atthe level of the firstborn are reported in parentheses. * p <0.10, ** p <0.05, *** p <0.01.

TFB and Number of Descendants for Head of Lineages Born 16851660–1685 (accounting for Maternal Founder FE)
Log number of descendants in:Gen. 1 Gen. 2 Gen. 3 Gen. 4 Gen. 1 Gen. 2 Gen. 3 Gen. 4 Gen. 1 Gen. 4
(1) (2) (3) (4) (5) (6) (7) (8) (9) (10)
TFB -.065** .237 .544** .830*** -.075*** .193 .487** .802*** -.079*** .773***(.025) (.175) (.216) (.280) (.025) (.174) (.216) (.282) (.012) (.277)
TFB2 -.096* -.214*** -.337*** -.086 -.199*** -.330*** -.323***(.057) (.071) (.092) (.057) (.071) (.093) (.091)
Literate -.031 .023 .120** .116* -.035** .087(.033) (.042) (.054) (.070) (.015) (.070)
Male .219*** .279*** .315*** .177*** -.035** .115*(.032) (.040) (.049) (.063) (.015) (.066)
Stoppage age fixed effects No No No No No No No No Yes Yes
Number of observations 3,376 3,376 3,376 3,376 3,376 3,376 3,376 3,376 3,376 3,376Adjusted R2 .019 .020 .042 .335 .036 .036 .058 .337 .804 .379Joint sign.-level of TFB & TFB2 .010 .066 .001 .000 .003 .042 .000 .000 .000 .000Maximizing TFB 1.230 1.270 1.232 1.124 1.219 1.214 1.196Lower limit of 90% CI -11.448 .923 .961 - .761 .919 .886Upper limit of 90% CI 1.505 1.427 1.37 - 1.392 1.357 1.343This table presents the results of a series of fixed-effects OLS regressions of the number of descendants in generation t on time to first birth measured in years, i.e.TFB and TFB2 for heads of lineages born in the period 1660–1685. All regressions account for Maternal Founder fixed effects. Birth year and marriage age dummiesare included as controls. Furthermore, stoppage age dummies are included in columns 9–10. A dummy indicating unknown literacy is included in the regressionsunderlying column 5–10. Standard errors clustered at the level of the firstborn are reported in parentheses. * p <0.10, ** p <0.05, *** p <0.01.

Robustness to Alternative Cohorts: No Restrictions on Cohorts (Accountingfor Maternal Founder FE)
Log number of descendants in:Gen. 1 Gen. 2 Gen. 3 Gen. 4 Gen. 1 Gen. 2 Gen. 3 Gen. 4 Gen. 1 Gen. 4
(1) (2) (3) (4) (5) (6) (7) (8) (9) (10)
TFB -.064*** .055 .319** .409** -.071*** .031 .293** .393** -.090*** .459**(.017) (.120) (.141) (.199) (.017) (.119) (.140) (.199) (.008) (.198)
TFB2 -.039 -.133*** -.192*** -.033 -.126*** -.187*** -.212***(.040) (.046) (.065) (.039) (.046) (.065) (.065)
Literate .007 .078*** .133*** .134*** -.014 .121**(.023) (.030) (.037) (.049) (.011) (.048)
Male .222*** .220*** .191*** .088** -.013 .019(.018) (.023) (.027) (.036) (.009) (.038)
Stoppage age fixed effects No No No No No No No No Yes Yes
Number of observations 7,664 7,664 7,664 7,664 7,664 7,664 7,664 7,664 7,664 7,664Adjusted R2 .026 .022 .067 .413 .049 .036 .077 .414 .789 .431Joint sign.-level of TFB & TFB2 .000 .015 .000 .000 .000 .008 .000 .000 .000 .000Maximizing TFB .694 1.200 1.065 .457 1.166 1.049 1.079Lower limit of 90% CI - .741 .466 - .604 .396 .610Upper limit of 90% CI - 1.376 1.269 - 1.355 1.261 1.264This table presents the results of a series of fixed-effects OLS regressions of the number of descendants in generation t on time to first birth measured in years,i.e. TFB and TFB2 for heads of lineages born in the entire sample period. All regressions account for Maternal Founder fixed effects. Birth year and marriageage dummies are included as controls. Furthermore, stoppage age dummies are included in columns 9–10. A dummy indicating unknown literacy is included in theregressions underlying column 5–10. Standard errors clustered at the level of the firstborn are reported in parentheses. * p <0.10, ** p <0.05, *** p <0.01.

Data & Analysis Parametric analysis
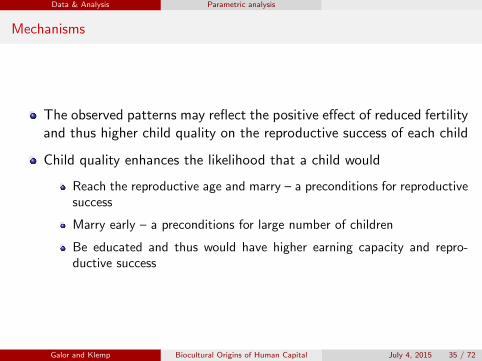
Mechanisms
The observed patterns may reflect the positive effect of reduced fertilityand thus higher child quality on the reproductive success of each child
Child quality enhances the likelihood that a child would
Reach the reproductive age and marry – a preconditions for reproductivesuccess
Marry early – a preconditions for large number of children
Be educated and thus would have higher earning capacity and repro-ductive success
Galor and Klemp Biocultural Origins of Human Capital July 4, 2015 35 / 72
Data & Analysis Parametric analysis
Mechanisms
The observed patterns may reflect the positive effect of reduced fertilityand thus higher child quality on the reproductive success of each child
Child quality enhances the likelihood that a child would
Reach the reproductive age and marry – a preconditions for reproductivesuccess
Marry early – a preconditions for large number of children
Be educated and thus would have higher earning capacity and repro-ductive success
Galor and Klemp Biocultural Origins of Human Capital July 4, 2015 35 / 72
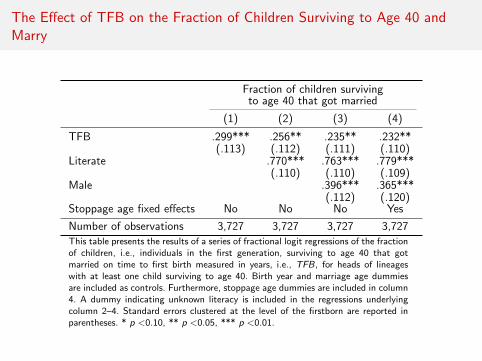
The Effect of TFB on the Fraction of Children Surviving to Age 40 andMarry
Fraction of children survivingto age 40 that got married
(1) (2) (3) (4)
TFB .299*** .256** .235** .232**(.113) (.112) (.111) (.110)
Literate .770*** .763*** .779***(.110) (.110) (.109)
Male .396*** .365***(.112) (.120)
Stoppage age fixed effects No No No Yes
Number of observations 3,727 3,727 3,727 3,727This table presents the results of a series of fractional logit regressions of the fractionof children, i.e., individuals in the first generation, surviving to age 40 that gotmarried on time to first birth measured in years, i.e., TFB, for heads of lineageswith at least one child surviving to age 40. Birth year and marriage age dummiesare included as controls. Furthermore, stoppage age dummies are included in column4. A dummy indicating unknown literacy is included in the regressions underlyingcolumn 2–4. Standard errors clustered at the level of the firstborn are reported inparentheses. * p <0.10, ** p <0.05, *** p <0.01.

The Effect of TFB on the on the Average Marriage Age
Average marriage age of children
(1) (2) (3) (4)
TFB -.430*** -.400*** -.376** -.339**(.005) (.008) (.013) (.023)
Literate -.629*** -.621*** -.705***(.001) (.001) (.000)
Male -.406*** -.720***(.009) (.000)
Stoppage age fixed effects No No No Yes
Number of observations 3,796 3,796 3,796 3,796Adjusted R2 .006 .010 .011 .036This table presents the results of a series of OLS regressions of the average marriageage of childre,, i.e., individuals in the first generation, on time to first birth measuredin years, i.e., TFB. Birth year and marriage age dummies are included as controls.Furthermore, stoppage age dummies are included in column 4. A dummy indicatingunknown literacy is included in the regressions underlying column 2–4. Standard errorsclustered at the level of the firstborn are reported in parentheses. * p <0.10, ** p <0.05,*** p <0.01.

The Effect of TFB on the on Share of Literate Offspring
Fraction of literate children
(1) (2) (3) (4)
TFB .401*** .351*** .322*** .337***(.090) (.090) (.091) (.091)
Literate 1.308*** 1.307*** 1.305***(.094) (.094) (.095)
Male .563*** .407***(.090) (.098)
Stoppage age fixed effects No No No Yes
Number of observations 3,448 3,448 3,448 3,448This table presents the results of a series of fractional logit regressions of the shareof children, i.e., individuals in the first generation, obtaining literacy on time to firstbirth measured in years, i.e., TFB, for heads of lineages with at least one survivingchild with observed literacy status. Birth year and marriage age dummies are includedas controls. Furthermore, stoppage age dummies are included in column 4. A dummyindicating unknown literacy is included in the regressions underlying column 2–4. Standarderrors clustered at the level of the firstborn are reported in parentheses. * p <0.10, **p <0.05, *** p <0.01.

Data & Analysis Parametric analysis
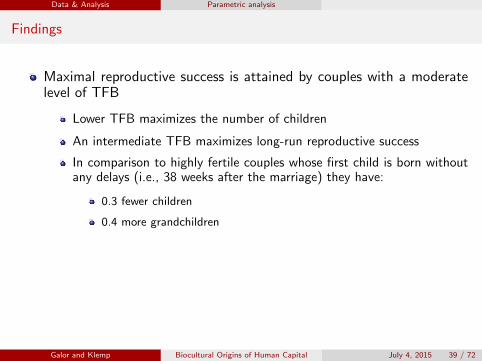
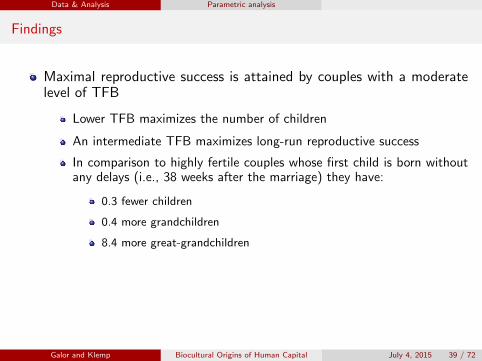
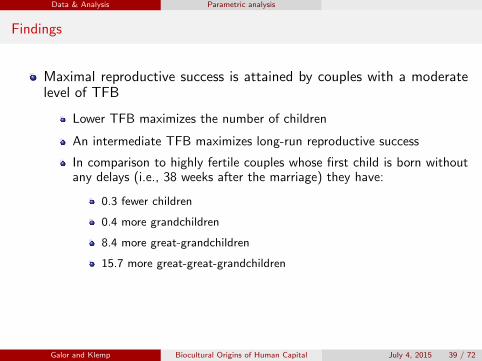
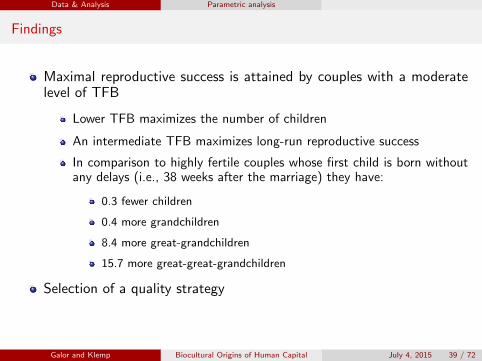
Findings
Maximal reproductive success is attained by couples with a moderatelevel of TFB
Lower TFB maximizes the number of children
An intermediate TFB maximizes long-run reproductive success
In comparison to highly fertile couples whose first child is born withoutany delays (i.e., 38 weeks after the marriage) they have:
0.3 fewer children
0.4 more grandchildren
8.4 more great-grandchildren
15.7 more great-great-grandchildren
Selection of a quality strategy
The optimal level of TFB and fertility is below the population median
Galor and Klemp Biocultural Origins of Human Capital July 4, 2015 39 / 72

Data & Analysis Parametric analysis
Findings
Maximal reproductive success is attained by couples with a moderatelevel of TFB
Lower TFB maximizes the number of children
An intermediate TFB maximizes long-run reproductive success
In comparison to highly fertile couples whose first child is born withoutany delays (i.e., 38 weeks after the marriage) they have:
0.3 fewer children
0.4 more grandchildren
8.4 more great-grandchildren
15.7 more great-great-grandchildren
Selection of a quality strategy
The optimal level of TFB and fertility is below the population median
Galor and Klemp Biocultural Origins of Human Capital July 4, 2015 39 / 72


TFB and number of descendants for head of lineages born –1685(accounting for Maternal Founder FE)
Log number of descendants in:Gen. 1 Gen. 2 Gen. 3 Gen. 4 Gen. 1 Gen. 2 Gen. 3 Gen. 4 Gen. 1 Gen. 2 Gen. 3 Gen. 4 Gen. 1 Gen. 2 Gen. 3 Gen. 4
(1) (2) (3) (4) (5) (6) (7) (8) (9) (10) (11) (12) (13) (14) (15) (16)
TFB -.052** .167 .505** .783*** -.053** .170 .499** .788*** -.062*** .140 .463** .773*** -.077*** .208 .535*** .810***(.024) (.163) (.205) (.264) (.024) (.163) (.205) (.264) (.024) (.162) (.204) (.264) (.011) (.130) (.181) (.258)
TFB2 -.068 -.193*** -.310*** -.070 -.191*** -.313*** -.063 -.183*** -.309*** -.089** -.210*** -.325***(.053) (.067) (.087) (.053) (.067) (.087) (.053) (.067) (.087) (.042) (.059) (.084)
Literate -.008 .060 .145*** .136** -.006 .063 .148*** .138** -.027* .044 .125*** .109*(.031) (.040) (.051) (.066) (.030) (.040) (.051) (.066) (.014) (.032) (.046) (.066)
Male .220*** .254*** .299*** .131** -.028* .025 .085* .036(.031) (.039) (.047) (.060) (.015) (.031) (.043) (.063)
Stoppage age fixed effects No No No No No No No No No No No No Yes Yes Yes Yes
Number of observations 3,798 3,798 3,798 3,798 3,798 3,798 3,798 3,798 3,798 3,798 3,798 3,798 3,798 3,798 3,798 3,798Adjusted R2 .015 .016 .038 .306 .017 .016 .041 .307 .032 .029 .052 .307 .799 .442 .296 .355Joint sign.-level of TFB & TFB2 .031 .196 .002 .000 .026 .184 .003 .000 .010 .130 .002 .000 .000 .002 .000 .000Maximizing TFB 1.224 1.307 1.261 1.223 1.304 1.260 1.113 1.263 1.249 1.163 1.272 1.247Lower limit of 90% CI - .961 .999 - .948 1.000 - .827 .976 -.141 1.012 1.002Upper limit of 90% CI - 1.467 1.398 - 1.466 1.397 - 1.435 1.389 1.393 1.403 1.376
This table presents the results of a series of fixed-effects regressions of the number of descendants in generation t on time to first birth measured in years, i.e. TFB and TFB2. All regressions account for Maternal Founder fixed effects. Birth year and marriageage dummies are included as controls. Furthermore, stoppage age dummies are included in columns 13–16. A dummy indicating unknown literacy is included in the regressions underlying column 5–16. Standard errors clustered at the level of the firstborn arereported in parentheses. * p <0.10, ** p <0.05, *** p <0.01.

TFB and number of descendants for head of lineages born 1660–1685(accounting for Maternal Founder FE)
Log number of descendants in:Gen. 1 Gen. 2 Gen. 3 Gen. 4 Gen. 1 Gen. 2 Gen. 3 Gen. 4 Gen. 1 Gen. 2 Gen. 3 Gen. 4 Gen. 1 Gen. 2 Gen. 3 Gen. 4
(1) (2) (3) (4) (5) (6) (7) (8) (9) (10) (11) (12) (13) (14) (15) (16)
TFB -.065** .237 .544** .830*** -.066*** .238 .537** .830*** -.075*** .193 .487** .802*** -.079*** .201 .498*** .773***(.025) (.175) (.216) (.280) (.025) (.175) (.217) (.282) (.025) (.174) (.216) (.282) (.012) (.139) (.191) (.277)
TFB2 -.096* -.214*** -.337*** -.097* -.212*** -.337*** -.086 -.199*** -.330*** -.088* -.203*** -.323***(.057) (.071) (.092) (.057) (.071) (.093) (.057) (.071) (.093) (.046) (.063) (.091)
Literate -.028 .027 .124** .118* -.031 .023 .120** .116* -.035** .016 .110** .087(.033) (.043) (.055) (.070) (.033) (.042) (.054) (.070) (.015) (.035) (.049) (.070)
Male .219*** .279*** .315*** .177*** -.035** .056* .116*** .115*(.032) (.040) (.049) (.063) (.015) (.032) (.044) (.066)
Stoppage age fixed effects No No No No No No No No No No No No Yes Yes Yes Yes
Number of observations 3,376 3,376 3,376 3,376 3,376 3,376 3,376 3,376 3,376 3,376 3,376 3,376 3,376 3,376 3,376 3,376Adjusted R2 .019 .020 .042 .335 .020 .020 .045 .335 .036 .036 .058 .337 .804 .451 .306 .379Joint sign.-level of TFB & TFB2 .010 .066 .001 .000 .009 .066 .001 .000 .003 .042 .000 .000 .000 .005 .000 .000Maximizing TFB 1.230 1.270 1.232 1.230 1.268 1.231 1.124 1.219 1.214 1.137 1.224 1.196Lower limit of 90% CI -11.448 .923 .961 -11.038 .910 .959 - .761 .919 -1.02 .883 .886Upper limit of 90% CI 1.505 1.427 1.37 1.504 1.427 1.369 - 1.392 1.357 1.387 1.375 1.343
This table presents the results of a series of fixed-effects OLS regressions of the number of descendants in generation t on time to first birth measured in years, i.e. TFB and TFB2 for heads of lineages born in the period 1660–1685. All regressions account forMaternal Founder fixed effects. Birth year and marriage age dummies are included as controls. Furthermore, stoppage age dummies are included in columns 13–16. A dummy indicating unknown literacy is included in the regressions underlying column 5–16.Standard errors clustered at the level of the firstborn are reported in parentheses. * p <0.10, ** p <0.05, *** p <0.01.
Robustness to alternative cohorts: no restrictions on cohorts (accounting forMaternal Founder FE)
Log number of descendants in:Gen. 1 Gen. 2 Gen. 3 Gen. 4 Gen. 1 Gen. 2 Gen. 3 Gen. 4 Gen. 1 Gen. 2 Gen. 3 Gen. 4 Gen. 1 Gen. 2 Gen. 3 Gen. 4
(1) (2) (3) (4) (5) (6) (7) (8) (9) (10) (11) (12) (13) (14) (15) (16)
TFB -.064*** .055 .319** .409** -.064*** .050 .310** .400** -.071*** .031 .293** .393** -.090*** .096 .378*** .459**(.017) (.120) (.141) (.199) (.017) (.120) (.141) (.199) (.017) (.119) (.140) (.199) (.008) (.094) (.125) (.198)
TFB2 -.039 -.133*** -.192*** -.038 -.129*** -.189*** -.033 -.126*** -.187*** -.060* -.158*** -.212***(.040) (.046) (.065) (.040) (.046) (.065) (.039) (.046) (.065) (.031) (.041) (.065)
Literate .007 .078** .133*** .133*** .007 .078*** .133*** .134*** -.014 .057** .110*** .121**(.023) (.030) (.037) (.049) (.023) (.030) (.037) (.049) (.011) (.024) (.033) (.048)
Male .222*** .220*** .191*** .088** -.013 .005 .019 .019(.018) (.023) (.027) (.036) (.009) (.019) (.025) (.038)
Stoppage age fixed effects No No No No No No No No No No No No Yes Yes Yes Yes
Number of observations 7,664 7,664 7,664 7,664 7,664 7,664 7,664 7,664 7,664 7,664 7,664 7,664 7,664 7,664 7,664 7,664Adjusted R2 .026 .022 .067 .413 .026 .023 .070 .414 .049 .036 .077 .414 .789 .420 .282 .431Joint sign.-level of TFB & TFB2 .000 .015 .000 .000 .000 .018 .000 .000 .000 .008 .000 .000 .000 .000 .000 .000Maximizing TFB .694 1.200 1.065 .663 1.198 1.060 .457 1.166 1.049 .798 1.196 1.079Lower limit of 90% CI - .741 .466 - .708 .434 - .604 .396 -3.176 .924 .610Upper limit of 90% CI - 1.376 1.269 - 1.378 1.268 - 1.355 1.261 1.167 1.333 1.264
This table presents the results of a series of fixed-effects OLS regressions of the number of descendants in generation t on time to first birth measured in years, i.e. TFB and TFB2 for heads of lineages born in the entire sample period. All regressions accountfor Maternal Founder fixed effects. Birth year and marriage age dummies are included as controls. Furthermore, stoppage age dummies are included in columns 13–16. A dummy indicating unknown literacy is included in the regressions underlying column5–16. Standard errors clustered at the level of the firstborn are reported in parentheses. * p <0.10, ** p <0.05, *** p <0.01.

Summary statistics for females
(1) (2) (3) (4)Mean Median S.D. Count
Children 9.42 10 3.66 2,058Grandchildren 45.99 43 27.40 2,058Great-grandchildren 187.65 159 142.74 2,058Great-great-grandchildren 341.04 206.5 408.07 2,058Years from marriage to first birth (TFB) 1.23 1.04 0.49 2,058Literate 0.68 1 0.47 1,192Fraction of literate children 0.72 1 0.36 1,872Fraction of surviving childrenb 0.59 0.60 0.20 2,058Fraction of surviving children with known literacyb 0.62 0.60 0.40 2,044Age at first marriage 19.34 18.7 3.79 2,058Age at last delivery 38.27 40.3 6.46 2,058a The moderate increase in the mean and median number of descendants from the third to the fourthgeneration (i.e. from great-grandchildren to great-great-grandchildren) reflects the fact that these cohortsare less fully observed. Furthermore, since men produce children at lager ages than women, this effect ismore pronounced among men.b Survival is recorded at the average marriage age, i.e. 23 years.
Galor and Klemp Biocultural Origins of Human Capital July 4, 2015 44 / 72

Summary statistics for males
(1) (2) (3) (4)Mean Median S.D. Count
Children 10.03 10 4.32 1,740Grandchildren 48.94 45 28.77 1,740Great-grandchildren 187.53 159 137.10 1,740Great-great-grandchildren 238.38 136.5 293.17 1,740Years from marriage to first birth (TFB) 1.16 0.99 0.44 1,740Literate 0.64 1 0.48 1,030Fraction of literate children 0.76 1 0.34 1,576Fraction of surviving childrenb 0.60 0.60 0.20 1,740Fraction of surviving children with known literacyb 0.57 0.50 0.39 1,728Age at first marriage 26.62 25.9 4.41 1,740Age at last delivery 46.31 46.9 8.81 1,740a The moderate increase in the mean and median number of descendants from the third to the fourthgeneration (i.e. from great-grandchildren to great-great-grandchildren) reflects the fact that these cohortsare less fully observed. Furthermore, since men produce children at lager ages than women, this effect ismore pronounced among men.b Survival is recorded at the average marriage age, i.e. 23 years.
Galor and Klemp Biocultural Origins of Human Capital July 4, 2015 45 / 72

TFB and number of descendants for head of lineages born –1685 (usingGLM w/ neg. binom.)
Number of descendants in:Gen. 1 Gen. 2 Gen. 3 Gen. 4 Gen. 1 Gen. 2 Gen. 3 Gen. 4 Gen. 1 Gen. 2 Gen. 3 Gen. 4 Gen. 1 Gen. 2 Gen. 3 Gen. 4
(1) (2) (3) (4) (5) (6) (7) (8) (9) (10) (11) (12) (13) (14) (15) (16)
TFB -.063*** .120 .371** .616*** -.063*** .090 .324* .573** -.081*** .028 .260 .525** -.090*** .049 .346** .573**(.018) (.148) (.185) (.230) (.018) (.148) (.186) (.231) (.017) (.145) (.184) (.231) (.010) (.121) (.167) (.227)
TFB2 -.047 -.133** -.232*** -.039 -.119* -.219*** -.026 -.106* -.209*** -.035 -.137** -.224***(.048) (.060) (.074) (.049) (.061) (.074) (.048) (.060) (.074) (.039) (.054) (.073)
Literate -.002 .143*** .222*** .227*** -.009 .138*** .219*** .225*** -.056*** .098*** .180*** .195***(.020) (.030) (.038) (.046) (.019) (.030) (.038) (.046) (.011) (.025) (.035) (.047)
Male .295*** .379*** .402*** .306*** -.004 .094*** .150*** .194***(.019) (.027) (.035) (.041) (.011) (.023) (.032) (.042)
Stoppage age fixed effects No No No No No No No No No No No No Yes Yes Yes Yes
Number of observations 3,798 3,798 3,798 3,798 3,798 3,798 3,798 3,798 3,798 3,798 3,798 3,798 3,798 3,798 3,798 3,798Joint sign.-level of TFB & TFB2 .000 .446 .059 .000 .000 .445 .086 .001 .000 .139 .041 .000 .000 .016 .001 .000Maximizing TFB 1.273 1.399 1.328 1.159 1.363 1.306 .546 1.229 1.255 .702 1.262 1.277
This table presents the results of a series of GLM regressions, with a negative binomial distribution and a logarithmic link function, of the number of descendants in generation t on time to first birth measured in years, i.e. TFB and TFB2. Birth year andmarriage age dummies are included as controls. Furthermore, stoppage age dummies are included in columns 13–16. A dummy indicating unknown literacy is included in the regressions underlying column 5–16. Standard errors clustered at the level of thefirstborn are reported in parentheses. * p <0.10, ** p <0.05, *** p <0.01.

TFB and number of descendants for head of lineages born –1685 (usingGLM w/ neg. binom. – accounting for Maternal Founder FE)
Number of descendants in:Gen. 1 Gen. 2 Gen. 3 Gen. 4 Gen. 1 Gen. 2 Gen. 3 Gen. 4 Gen. 1 Gen. 2 Gen. 3 Gen. 4 Gen. 1 Gen. 2 Gen. 3 Gen. 4
(1) (2) (3) (4) (5) (6) (7) (8) (9) (10) (11) (12) (13) (14) (15) (16)
TFB -.041** .126 .412** .547** -.042** .131 .414** .557*** -.052*** .101 .387** .547** -.073*** .195* .468*** .595***(.020) (.146) (.179) (.215) (.020) (.146) (.178) (.215) (.020) (.145) (.177) (.215) (.010) (.118) (.160) (.216)
TFB2 -.054 -.162*** -.234*** -.056 -.163*** -.238*** -.050 -.158*** -.236*** -.087** -.191*** -.256***(.047) (.058) (.068) (.047) (.058) (.069) (.047) (.058) (.068) (.038) (.052) (.069)
Literate -.006 .059* .121*** .119** -.006 .061* .124*** .121** -.020 .055* .118*** .104*(.026) (.036) (.045) (.056) (.025) (.036) (.045) (.056) (.013) (.029) (.040) (.055)
Male .248*** .280*** .282*** .127** -.015 .044 .083** .072(.027) (.036) (.044) (.054) (.014) (.029) (.040) (.055)
Stoppage age fixed effects No No No No No No No No No No No No Yes Yes Yes Yes
Number of observations 3,798 3,798 3,798 3,798 3,798 3,798 3,798 3,798 3,798 3,798 3,798 3,798 3,798 3,798 3,798 3,798Joint sign.-level of TFB & TFB2 .045 .207 .001 .000 .037 .189 .001 .000 .009 .097 .000 .000 .000 .000 .000 .000Maximizing TFB 1.172 1.271 1.169 1.174 1.27 1.169 1.01 1.226 1.155 1.116 1.225 1.159
This table presents the results of a series of GLM regressions, with a negative binomial distribution and a logarithmic link function, of the number of descendants in generation t on time to first birth measured in years, i.e. TFB and TFB2. All regressionsinclude dummies for Maternal Founder fixed effects (the results without the Maternal Founder Fixed Effects is presented in Table A.7). Birth year and marriage age dummies are included as controls. Furthermore, stoppage age dummies are included incolumns 13–16. A dummy indicating unknown literacy is included in the regressions underlying column 5–16. Standard errors clustered at the level of the firstborn are reported in parentheses. * p <0.10, ** p <0.05, *** p <0.01.

Robustness to including extinct lineages – accounting for Maternal Founderfixed effects
Log number of descendants in: Log 1+number of descendants in:
Gen. 1 Gen. 2 Gen. 3 Gen. 4 Gen. 1 Gen. 2 Gen. 3 Gen. 4
(1) (2) (3) (4) (5) (6) (7) (8)
TFB -.046* .151 .462** .773*** -.041* .414* .822*** 1.169***(.026) (.172) (.208) (.264) (.021) (.215) (.294) (.336)
TFB2 -.071 -.180*** -.309*** -.149** -.293*** -.427***(.057) (.068) (.087) (.068) (.093) (.108)
Literate -.022 .060 .153*** .138** -.014 .058 .144* .180**(.033) (.042) (.053) (.066) (.027) (.056) (.076) (.087)
Male .321*** .321*** .349*** .131** .276*** .456*** .597*** .478***(.033) (.040) (.050) (.060) (.027) (.051) (.069) (.076)
Number of observations 4,240 4,002 3,933 3,798 4,240 4,240 4,240 4,240Adjusted R2 .052 .044 .068 .307 .054 .065 .084 .241Joint sign.-level of TFB & TFB2 .073 .083 .003 .000 .053 .046 .002 .000Maximizing TFB 1.067 1.283 1.249 1.387 1.403 1.368This table presents the results of a series of fixed-effects regressions of the number of descendants in generation t on time to first birth measured inyears, i.e. TFB and TFB2. All regressions account for Maternal Founder fixed effects. Birth year and marriage age dummies are included as controls. Adummy indicating unknown literacy is also included in the regressions. In columns 1–4, the restriction of at least one observed great-great-grandchildis relaxed and extinct lineages drop out of the sample in the relevant generations. In columns 5–8, the same extended sample is used, but the outcomeis ln(1 + Di,t), where the added number 1 ensures that the logarithmic transformation is defined and all lineages remains included. Standard errorsclustered at the level of the firstborn are reported in parentheses. * p <0.10, ** p <0.05, *** p <0.01.

Robustness to additional sample restrictions: more than one child andmarriage occurring after turning 15 years – accounting for MaternalFounder fixed effects
Log number of descendants in:Gen. 1 Gen. 2 Gen. 3 Gen. 4 Gen. 1 Gen. 2 Gen. 3 Gen. 4
(1) (2) (3) (4) (5) (6) (7) (8)
TFB -.053** .204 .560*** .891*** -.052** .129 .461** .779***(.021) (.157) (.201) (.263) (.025) (.175) (.218) (.279)
TFB2 -.082 -.211*** -.344*** -.057 -.180** -.310***(.051) (.066) (.086) (.058) (.073) (.093)
Literate .025 .090** .175*** .162** -.016 .052 .139*** .123*(.027) (.038) (.050) (.065) (.031) (.041) (.052) (.068)
Male .251*** .272*** .314*** .135** .225*** .269*** .318*** .153**(.029) (.038) (.047) (.061) (.031) (.039) (.048) (.061)
Number of observations 3,738 3,738 3,738 3,738 3,604 3,604 3,604 3,604Adjusted R2 .044 .037 .060 .318 .035 .031 .055 .314Joint sign.-level of TFB & TFB2 .011 .104 .001 .000 .038 .294 .009 .000Maximizing TFB 1.248 1.323 1.296 1.140 1.282 1.256Lower limit of 90% CI - 1.059 1.095 - .798 .973Upper limit of 90% CI - 1.464 1.417 - 1.458 1.396This table presents the results of a series of fixed-effects regressions of the number of descendants in generation t on time to first birth measured inyears, i.e. TFB and TFB2. All regressions account for Maternal Founder fixed effects. Birth year and marriage age dummies are included as controls.A dummy indicating unknown literacy is also included in the regressions. In columns 1–4, the sample is restricted to heads of lineages who produced atleast two children. In columns 5–8, the sample is restricted to heads of lineages who were married after their 15th birthday. Standard errors clusteredat the level of the firstborn are reported in parentheses. * p <0.10, ** p <0.05, *** p <0.01.
Robustness to additional control variables: number of marriages and spousalmigration (accounting for Maternal Founder FE)
Log number of descendants in:Gen. 1 Gen. 2 Gen. 3 Gen. 4 Gen. 1 Gen. 2 Gen. 3 Gen. 4
(1) (2) (3) (4) (5) (6) (7) (8)
TFB -.059*** .282* .590*** .828*** -.059** .117 .423** .720***(.022) (.157) (.200) (.263) (.024) (.161) (.204) (.264)
TFB2 -.109** -.225*** -.328*** -.054 -.168** -.289***(.051) (.066) (.087) (.052) (.067) (.087)
Literate -.013 .059 .143*** .135** -.007 .067* .148*** .140**(.028) (.039) (.050) (.066) (.030) (.040) (.051) (.066)
Male .168*** .204*** .255*** .116* .198*** .206*** .232*** .037(.028) (.037) (.046) (.060) (.032) (.039) (.047) (.061)
Total number of marriages fixed effects Yes Yes Yes Yes No No No NoTotal number of marriages of spouse fixed effects Yes Yes Yes Yes No No No NoImmigration status of spouse fixed effects No No No No Yes Yes Yes YesEmigration status of spouse fixed effects No No No No Yes Yes Yes Yes
Number of observations 3,798 3,798 3,798 3,798 3,798 3,798 3,798 3,798Adjusted R2 .188 .116 .097 .312 .035 .035 .062 .315Joint sign.-level of TFB & TFB2 .009 .027 .000 .000 .013 .169 .005 .000Maximizing TFB 1.289 1.311 1.263 1.073 1.260 1.244Lower limit of 90% CI .420 1.063 1.024 - .716 .935Upper limit of 90% CI 1.509 1.446 1.393 - 1.445 1.392This table presents the results of a series of fixed-effects regressions of the number of descendants in generation t on time to first birth measured in years, i.e. TFB andTFB2. All regressions account for Maternal Founder fixed effects. Birth year and marriage age dummies are included as controls. A dummy indicating unknown literacy isalso included in the regressions. In columns 1–4, dummies for the total number of marriages experienced during the lifetime of the heads of lineages, as well as dummies forthe total number of marriages experienced by the first spouses of the heads of lineages, are included. In columns 5–8, dummies indicating the immigration and emigrationstatuses of the head of the first spouses of the heads of lineages are included. Standard errors clustered at the level of the firstborn are reported in parentheses. * p <0.10,** p <0.05, *** p <0.01.
Robustness to gender distinction – sample restricted to females (accountingfor Maternal Founder FE)
Log number of descendants in:Gen. 1 Gen. 2 Gen. 3 Gen. 4 Gen. 1 Gen. 2 Gen. 3 Gen. 4
(1) (2) (3) (4) (5) (6) (7) (8)
TFB -.079*** .374* .985*** 1.568*** -.080*** .380* .993*** 1.581***(.030) (.214) (.278) (.349) (.030) (.215) (.278) (.349)
TFB2 -.140** -.347*** -.560*** -.142** -.349*** -.564***(.069) (.088) (.109) (.069) (.088) (.110)
Literate -.040 .072 .120 .145(.043) (.067) (.084) (.107)
Number of observations 2,058 2,058 2,058 2,058 2,058 2,058 2,058 2,058Adjusted R2 .089 .064 .091 .267 .089 .064 .092 .267Joint sign.-level of TFB & TFB2 .008 .057 .000 .000 .007 .056 .000 .000Maximizing TFB 1.334 1.418 1.401 1.339 1.422 1.402Lower limit of 90% CI .366 1.24 1.263 .428 1.247 1.267Upper limit of 90% CI 1.58 1.538 1.500 1.583 1.542 1.501This table presents the results of a series of fixed-effects regressions of the number of descendants in generation t on time to first birth measuredin years, i.e. TFB and TFB2 for female heads of lineages. All regressions account for Maternal Founder fixed effects. Birth year and marriage agedummies are included as controls. A dummy indicating unknown literacy is also included in the regressions. Standard errors clustered at the level ofthe firstborn are reported in parentheses. * p <0.10, ** p <0.05, *** p <0.01.
Robustness to additional control variables: location of birth and death –accounting for Maternal Founder fixed effects
Log number of descendants in:Gen. 1 Gen. 2 Gen. 3 Gen. 4 Gen. 1 Gen. 2 Gen. 3 Gen. 4
(1) (2) (3) (4) (5) (6) (7) (8)
TFB -0.062∗∗∗ 0.106 0.416∗∗ 0.695∗∗∗ -0.062∗∗∗ 0.032 0.391∗ 0.653∗∗
(0.024) (0.163) (0.205) (0.267) (0.023) (0.161) (0.202) (0.255)TFB2 -0.052 -0.168∗∗ -0.284∗∗∗ -0.023 -0.154∗∗ -0.262∗∗∗
(0.053) (0.067) (0.088) (0.053) (0.066) (0.084)Literate -0.008 0.062 0.149∗∗∗ 0.144∗∗ -0.015 0.037 0.097∗ 0.074
(0.031) (0.040) (0.051) (0.066) (0.031) (0.040) (0.052) (0.067)Male 0.214∗∗∗ 0.253∗∗∗ 0.298∗∗∗ 0.134∗∗ 0.203∗∗∗ 0.208∗∗∗ 0.226∗∗∗ 0.033
(0.031) (0.039) (0.048) (0.061) (0.031) (0.038) (0.046) (0.059)Constant 3.861∗∗∗ 5.949∗∗∗ 6.288∗∗∗ 6.228∗∗∗ 2.256∗∗∗ 4.130∗∗∗ 5.229∗∗∗ 4.676∗∗∗
(0.366) (0.649) (0.667) (0.935) (0.428) (0.681) (0.703) (0.921)Birth parish fixed effects Yes Yes Yes Yes No No No NoDeath parish fixed effects No No No No Yes Yes Yes Yes
Number of observations 3,798 3,798 3,798 3,798 3,798 3,798 3,798 3,798Adjusted R2 0.034 0.030 0.050 0.308 0.066 0.098 0.130 0.370Joint sign.-level of TFB & TFB2 .009 .155 .002 .000 .009 .425 .011 .000Maximizing TFB 1.024 1.234 1.223 .700 1.264 1.243Lower limit of 90% CI - .646 .875 - .607 .892Upper limit of 90% CI - 1.424 1.379 - 1.461 1.402This table presents the results of a series of fixed-effects regressions of the number of descendants in generation t on time to first birth measured inyears, i.e. TFB and TFB2. All regressions account for Maternal Founder fixed effects. Birth year and marriage age dummies are included as controls. Adummy indicating unknown literacy is also included in the regressions. In columns 1–4, dummies indicating the birth (or baptism) parish of the headsof lineages are included. In columns 5–8 dummies indicating the death (or burial) parish of the heads of lineages are included. Standard errors clusteredat the level of the firstborn are reported in parentheses. * p <0.10, ** p <0.05, *** p <0.01.

Robustness to additional control variables: month of marriage and first birth– accounting for Maternal Founder fixed effects
Log number of descendants in:Gen. 1 Gen. 2 Gen. 3 Gen. 4 Gen. 1 Gen. 2 Gen. 3 Gen. 4
(1) (2) (3) (4) (5) (6) (7) (8)
TFB -0.061∗∗ 0.151 0.482∗∗ 0.798∗∗∗ -0.050∗∗ 0.181 0.500∗∗ 0.787∗∗∗
(0.024) (0.163) (0.205) (0.265) (0.024) (0.166) (0.208) (0.274)TFB2 -0.067 -0.190∗∗∗ -0.318∗∗∗ -0.073 -0.194∗∗∗ -0.314∗∗∗
(0.053) (0.067) (0.087) (0.054) (0.068) (0.089)Literate -0.008 0.062 0.146∗∗∗ 0.137∗∗ -0.004 0.065 0.153∗∗∗ 0.140∗∗
(0.030) (0.040) (0.051) (0.067) (0.030) (0.040) (0.051) (0.067)Male 0.224∗∗∗ 0.255∗∗∗ 0.296∗∗∗ 0.123∗∗ 0.220∗∗∗ 0.257∗∗∗ 0.298∗∗∗ 0.129∗∗
(0.031) (0.039) (0.048) (0.060) (0.031) (0.039) (0.047) (0.060)Month of marriage fixed effects Yes Yes Yes Yes No No No NoMonth of birth of firstborn fixed effects No No No No Yes Yes Yes Yes
Number of observations 3,798 3,798 3,798 3,798 3,798 3,798 3,798 3,798Adjusted R2 0.032 0.028 0.051 0.307 0.032 0.032 0.056 0.308Joint sign.-level of TFB & TFB2 .010 .109 .001 .000 .037 .169 .001 .000Maximizing TFB 1.126 1.267 1.253 1.242 1.286 1.254Lower limit of 90% CI - .865 .994 - .904 .968Upper limit of 90% CI - 1.433 1.389 - 1.452 1.398This table presents the results of a series of fixed-effects regressions of the number of descendants in generation t on time to first birth measured in years, i.e.TFB and TFB2. All regressions account for Maternal Founder fixed effects. Birth year and marriage age dummies are included as controls. A dummy indicatingunknown literacy is also included in the regressions. In columns 1–4, dummies indicating the months of marriage of the heads of lineages are included. Incolumns 5–8, dummies indicating the month of birth of the the firstborn of the heads of lineages are included. Standard errors clustered at the level of thefirstborn are reported in parentheses. * p <0.10, ** p <0.05, *** p <0.01.

Robustness to additional control variable: birth order (accounting forMaternal Founder FE)
Log number of descendants in:Gen. 1 Gen. 2 Gen. 3 Gen. 4 Gen. 1 Gen. 2 Gen. 3 Gen. 4
(1) (2) (3) (4) (5) (6) (7) (8)
TFB -.062*** .139 .462** .773*** -.062*** .144 .456** .752***(.024) (.162) (.204) (.264) (.024) (.162) (.204) (.265)
TFB2 -.062 -.183*** -.309*** -.063 -.181*** -.303***(.053) (.067) (.087) (.053) (.067) (.087)
Literate -.006 .064 .149*** .137** -.008 .064 .149*** .141**(.030) (.040) (.051) (.066) (.030) (.040) (.051) (.067)
Male .219*** .250*** .296*** .132** .220*** .248*** .293*** .131**(.031) (.039) (.047) (.060) (.031) (.039) (.047) (.061)
Firstborn .016 .064** .042 -.019(.023) (.031) (.038) (.047)
Birth order fixed effects No No No No Yes Yes Yes Yes
Number of observations 3,798 3,798 3,798 3,798 3,798 3,798 3,798 3,798Adjusted R2 .032 .030 .052 .307 .031 .030 .052 .308Joint sign.-level of TFB & TFB2 .010 .135 .002 .000 .009 .139 .002 .000Maximizing TFB 1.117 1.264 1.249 1.133 1.261 1.240Lower limit of 90% CI - .828 .976 - .807 .949Upper limit of 90% CI - 1.436 1.388 - 1.434 1.384This table presents the results of a series of fixed-effects regressions of the number of descendants in generation t on time to first birth measured inyears, i.e. TFB and TFB2. All regressions account for Maternal Founder fixed effects. Birth year and marriage age dummies are included as controls.A dummy indicating unknown literacy is also included in the regressions. In columns 1–4, a dummy for the firstborn status of the heads of lineagesis included. In columns 5–8, dummies the birth order of the heads of lineages are included. Standard errors clustered at the level of the firstborn arereported in parentheses. * p <0.10, ** p <0.05, *** p <0.01.

Effect of number of children on long-run reproductive success – accountingfor Maternal Founder fixed effects
Log number of descendants in:Gen. 2 Gen. 3 Gen. 4 Gen. 2 Gen. 3 Gen. 4 Gen. 2 Gen. 3 Gen. 4
(1) (2) (3) (4) (5) (6) (7) (8) (9)
Log Number of Children 2.334*** 3.446*** 4.491*** 2.339*** 3.459*** 4.545*** 2.384*** 3.515*** 4.619***(.524) (.842) (1.078) (.525) (.851) (1.091) (.520) (.837) (1.075)
(Log Number of Children)2 -.371 -.728** -1.280*** -.376 -.738** -1.306*** -.388* -.749** -1.324***(.229) (.367) (.474) (.230) (.373) (.481) (.228) (.366) (.474)
Literate .068 .151** .171* .067 .150** .170*(.047) (.070) (.092) (.047) (.070) (.092)
Male .129*** .266*** .307***(.046) (.071) (.092)
Number of observations 4,240 4,240 4,240 4,240 4,240 4,240 4,240 4,240 4,240First stage F (Kleibergen-Paap) 30.701 30.701 30.701 33.094 33.094 33.094 31.891 31.891 31.891Joint sign. of linear and squared terms .000 .000 .000 .000 .000 .000 .000 .000 .000Maximizing number of log(1+D) 3.142 2.367 1.754 3.113 2.343 1.74 3.069 2.345 1.744Exp(Maximizing log(1+D)) 22.15 9.665 4.777 21.488 9.412 4.697 20.52 9.433 4.72Lower limit of 90% CI 1.618 1.770 1.473 1.473 1.756 1.465 2.081 1.767 1.472Upper limit of 90% CI 6.012 8.556 2.805 2.805 8.445 2.757 57.776 7.475 2.702This table presents the results of a series of fixed-effects 2SLS regressions of the log number of descendants in generation t, i.e. ln(1 +Di,t), where Di,t is the number of descendantsthat the head of household i has in generations t, t = 2, 3, 4, on the number of children and the number of children squared, i.e., ln(1 + Di,1) and (ln(1 + Di,1))2, instrumented byvariation in TFB. The added number 1 ensures that the logarithmic transformation is defined for extinct lineages and all that lineages remain in the sample. All regressions accountfor Maternal Founder fixed effects. Birth year, marriage age, and stoppage age dummies are included as controls. Since the second stage of these 2SLS regressions is quadratic in theendogenous regressor, it is necessary to instrument for both the linear and the squared terms in order to identify the parameters. Thus, following Wooldridge (2010), pp. 267–268, azeroth stage is introduced to the analysis, where Di,1 is first regressed on TFB and all the second-stage controls to obtain predicted values of the number of children. The predictednumber of children from the zeroth stage, D̂1,i is transformed by ln(1 + D̂1,i ) as well as (ln(1 + D̂1,i ))2, and these transformed terms are then used as excluded instruments in thesecond stage. A dummy indicating unknown literacy is included in the regressions underlying columns 4–9. Standard errors clustered at the level of the firstborn are reported inparentheses. * p <0.10, ** p <0.05, *** p <0.01.

0
5
10
15P
erce
ntag
e of
obs
erva
tions
0 41 60
Age
Galor and Klemp Biocultural Origins of Human Capital July 4, 2015 56 / 72

2.2
2.25
2.3
2.35
2.4
Pre
dict
ed ln
(1+
child
ren)
38 142
Weeks from marriage to first birth
A
3.6
3.65
3.7
3.75
3.8
Pre
dict
ed ln
(1+
gran
dchi
ldre
n)
38 142
Weeks from marriage to first birth
B
4.7
4.8
4.9
5
5.1
Pre
dict
ed ln
(1+
g.gr
andc
hild
ren)
38 142
Weeks from marriage to first birth
C
4.6
4.8
5
5.2
5.4
Pre
dict
ed ln
(1+
g.g.
gran
dchi
ldre
n)
38 142
Weeks from marriage to first birth
D

0
2
4
6
8
10Pe
rcen
tage
of o
bser
vatio
ns
1 5 10 15 20Number of children

0
2
4
6
8
10Pe
rcen
tage
of o
bser
vatio
ns
1 5 10 15 20 25 30Number of children

0
1
2
3
4
5Pe
rcen
tage
of o
bser
vatio
ns
1 50 100 150 200Number of grandchildren

0
1
2
3
4
5Pe
rcen
tage
of o
bser
vatio
ns
1 50 100 150 200Number of grandchildren

0
10
20
30
40
Perc
enta
ge o
f obs
erva
tions
1 200 400 600 800 1000Number of great-grandchildren
A
0
10
20
30
40
Perc
enta
ge o
f obs
erva
tions
1 200 400 600 800 1000Number of great-grandchildren
B
0
10
20
30
40
Perc
enta
ge o
f obs
erva
tions
1 200 400 600 800 1000Number of great-grandchildren
C
0
20
40
60
Perc
enta
ge o
f obs
erva
tions
1 1000 2000 3000 4000Number of great-great-grandchildren
D
0
20
40
60Pe
rcen
tage
of o
bser
vatio
ns
1 1000 2000 3000 4000Number of great-great-grandchildren
E
0
20
40
60
Perc
enta
ge o
f obs
erva
tions
1 1000 2000 3000 4000Number of great-great-grandchildren
F
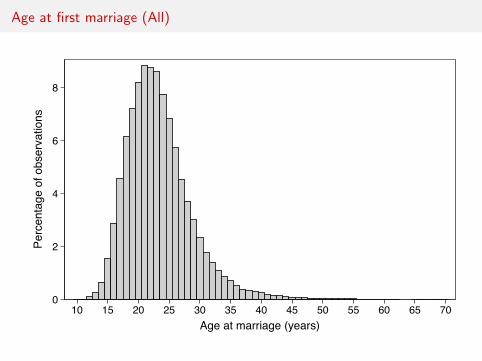
Age at first marriage (All)
0
2
4
6
8
Perc
enta
ge o
f obs
erva
tions
10 15 20 25 30 35 40 45 50 55 60 65 70Age at marriage (years)
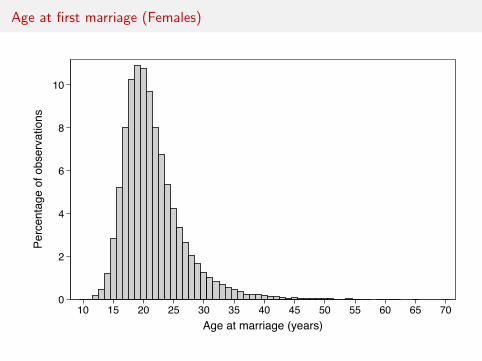
Age at first marriage (Females)
0
2
4
6
8
10
Perc
enta
ge o
f obs
erva
tions
10 15 20 25 30 35 40 45 50 55 60 65 70Age at marriage (years)

Age at first marriage (Males)
0
2
4
6
8
10
Perc
enta
ge o
f obs
erva
tions
10 15 20 25 30 35 40 45 50 55 60 65 70Age at marriage (years)

0
5
10
15P
erce
ntag
e of
obs
erva
tions
0 41 60
Age

8.5
9
9.5
10N
umbe
r of c
hild
ren
40 60 80 100 120Weeks from marriage to first birth
Return to presentation
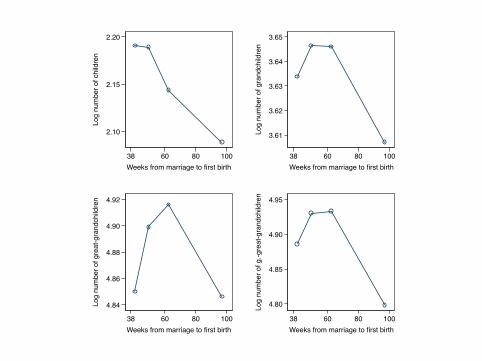
2.10
2.15
2.20
Log
num
ber o
f chi
ldre
n
38 60 80 100Weeks from marriage to first birth
3.61
3.62
3.63
3.64
3.65
Log
num
ber o
f gra
ndch
ildre
n
38 60 80 100Weeks from marriage to first birth
4.84
4.86
4.88
4.90
4.92
Log
num
ber o
f gre
at-g
rand
child
ren
38 60 80 100Weeks from marriage to first birth
4.80
4.85
4.90
4.95
Log
num
ber o
f g.-g
reat
-gra
ndch
ildre
n
38 60 80 100Weeks from marriage to first birth
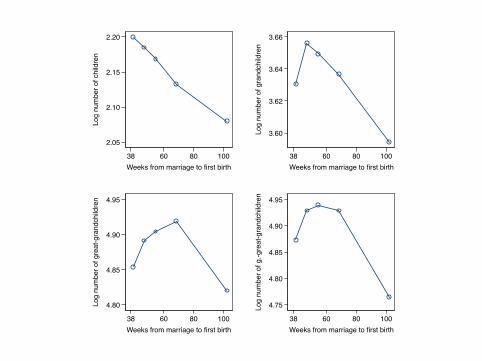
2.05
2.10
2.15
2.20
Log
num
ber o
f chi
ldre
n
38 60 80 100Weeks from marriage to first birth
3.60
3.62
3.64
3.66
Log
num
ber o
f gra
ndch
ildre
n
38 60 80 100Weeks from marriage to first birth
4.80
4.85
4.90
4.95
Log
num
ber o
f gre
at-g
rand
child
ren
38 60 80 100Weeks from marriage to first birth
4.75
4.80
4.85
4.90
4.95
Log
num
ber o
f g.-g
reat
-gra
ndch
ildre
n
38 60 80 100Weeks from marriage to first birth

2.00
2.20
Log
num
ber o
f chi
ldre
n
38 60 80 100 120Weeks from marriage to first birth
3.55
3.60
3.65
3.70
Log
num
ber o
f gra
ndch
ildre
n
38 60 80 100 120Weeks from marriage to first birth
4.70
4.80
4.90
5.00
Log
num
ber o
f gre
at-g
rand
child
ren
38 60 80 100 120Weeks from marriage to first birth
4.60
4.70
4.80
4.90
5.00
Log
num
ber o
f g.-g
reat
-gra
ndch
ildre
n
38 60 80 100 120Weeks from marriage to first birth

2.00
2.10
2.20
2.30
Log
num
ber o
f chi
ldre
n
38 60 80 100 120Weeks from marriage to first birth
3.55
3.60
3.65
3.70
Log
num
ber o
f gra
ndch
ildre
n
38 60 80 100 120Weeks from marriage to first birth
4.70
4.80
4.90
5.00
Log
num
ber o
f gre
at-g
rand
child
ren
38 60 80 100 120Weeks from marriage to first birth
4.60
4.80
5.00
5.20
Log
num
ber o
f g.-g
reat
-gra
ndch
ildre
n
38 60 80 100 120Weeks from marriage to first birth

0
.1
.2
.3Pr
opor
tion
mot
hers
dea
d w
ithin
42
days
of l
ast b
irth
1 2 3 4 5 6 7 8 9 10 11 12 13 14 15 16 17 18 19 20 21 22 23Number of children