the biodiversity of short rotation willow coppice in the ... · the biodiversity of . short...
TRANSCRIPT

The biodiversity of short rotation willow coppice in the Welsh landscape
Danielle Fry and Fred Slater Cardiff University
Llysdinam Field Centre
A report to the Institute of Biological,
Environmental and Rural Sciences,
Aberystwyth University for EU
Project “Willows for Wales.”

Contents THE BIODIVERSITY OF SHORT ROTATION WILLOW COPPICE IN THE WELSH LANDSCAPE
CONTENTS ii LIST OF FIGURES v LIST OF TABLES viii SECTION 1 GENERAL INTRODUCTION: 1 THE BIODIVERSITY OF SHORT ROTATION WILLOW COPPICE IN THE
WELSH LANDSCAPE
1 1.1 ENERGY CROPS IN THE UK 1 1.2 WILLOW FOR WALES 3 1.3 WILLOW FOR WALES: THE SITES 4 1.3.1 Bodorgan Estate, Anglesey 5 1.3.2 Glynllifon College, Caernarvon 6 1.3.3 Cernyfed Farm, Denbighshire 7 1.3.4 Cilgoed, Dendighshire 8 1.3.5 Hayscastle Farm, Pembrokeshire 9 1.3.6 Oakwood, New House Farm, Pembrokeshire 10 1.3.7 Brigam Farm, Rhondda Cynon Taff 11 1.4 GROWING SRC 12 1.4.1 Land preparation 12 1.4.2 Planting 12 1.4.3 Cut back and harvest 13 1.4.4 General management 13 1.5 BIODIVERSITY 14 1.6 BIRDS AS BIODIVERSITY INDICATORS 14 1.7 SRC AND BIODIVERSITY 15 1.8 SRC AND BIRDS 17 SECTION 2 THE EFFECTS ON PLANT COMMUNITY COMPOSITION OF
PLANTING SRC IN WALES 19
2.0 SUMMARY 19 2.1 INTRODUCTION 20 2.2 METHODS 22 2.2.1 Data collection 22 2.2.2 Data analysis 22 2.3 RESULTS 24 2.3.1 Diversity measures 24 2.3.2 Weeds in relation to other taxa 24 2.4 DISCUSSION 29 SECTION 3 SEEDS PRODUCED IN SRC FIELDS IN WALES AND THEIR USE BY
GRANIVOROUS BIRDS 32
3.0 SUMMARY 32 3.1 INTRODUCTION 33 3.2 METHODS 35 3.2.1 Seed production 35 3.2.2 Bird counts 35 3.2.3 Exclusion nets 36 3.2.4 Bird condition 37 3.3 RESULTS 37 3.3.1 Seed production 37 3.3.2 Bird and seed abundance 38
ii

3.4.3 Exclusion nets 40 3.4.4 Seed abundance and bird condition 42 3.5 DISCUSSION 43 SECTION 4 BIRD DIVERSITY AND ABUNDANCE IN SRC IN WALES 45 4.0 SUMMARY 44 4.1 INTRODUCTION 46 4.2 METHODS 49 4.2.1 Birds of young SRC 49 4.2.2 Breeding birds 49 4.2.3 Birds of mature SRC 49 4.3 RESULTS 50 4.3.3 Birds of mature SRC 52 4.4 DISCUSSION AND CONCLUSIONS 55 SECTION 5 BIRD COMMUNITIES IN SRC AND UPLAND FFRIJDD HABITAT WITH
PARTICULAR REFERENCE TO WILLOW WARBLERS (PHYLLOSCOPUS TROCHILUS)
57
5.0 SUMMARY 57 5.1 INTRODUCTION 58 5.2 STUDY SITES 60 5.3 METHODS 62 5.3.1 Data collection 62 5.3.1.1 Capture and handling 62 5.3.1.2 Radio-tracking 63 5.3.2 Data analysis 66 5.3.2.1 Home range size 66 5.3.2.2 Habitat utilisation 66 5.4 RESULTS 68 5.4.1 Species communities at the sites 68 5.4.2 Comparing Willow warblers at the sites 72 5.5 DISCUSSION 82 5.5.1 Species communities at the sites 82 5.5.2 Willow warblers at the site 82 SECTION 6 MAMMALS IN SRC IN WALES 85 6.0 SUMMARY 85 6.1 INTRODUCTION 86 6.2 METHODS 86 6.2.1 Data collection 86 6.3 RESULTS 87 6.4 DISCUSSION AND CONCLUSIONS 89 SECTION 7 INVERTEBRATE FAUNA OF SHORT ROTATION WILLOW COPPICE 91 7.1 THE AIM OF THIS PART OF THE STUDY WAS TO … 91 7.2 MATERIALS AND METHODS 91 7.3 RESULTS 93 7.4 DISCUSSION 95
iii

SECTION 8 FINAL DISCUSSION AND CONCLUSIONS THE BIODIVERSITY OF SHORT ROTATION WILLOW COPPICE IN WALES WITH PARTICULAR
REFERENCE TO BIRDS 98
8.1 MAIN FINDINGS 98 8.2 CONCLUSIONS 100 REFERENCES 101 APPENDIX I
COMPLETE LIST OF PLANT SPECIES RECORDED WITHIN THE SRC AND THE CONTROL SITES THROUGHOUT THE 3 YEAR STUDY.
126
APPENDIX II
COMPLETE LIST OF BIRD SPECIES RECORDED WITHIN THE YOUNG SRC (<2 YEARS OLD) BY THE WINTER BIRD SURVEYS (WBS).
129
APPENDIX III
COMPLETE LIST OF BIRD SPECIES RECORDED WITHIN THE YOUNG (<2 YEARS OLD) AND ESTABLISHED AND MATURE SRC BY THE BREEDING BIRD SURVEYS (BBS).
130
APPENDIX IV INVERTEBRATES TAKEN USING WINDOW TRAPS 132 APPENDIX V A LIST OF PLANTS, BIRDS AND MAMMALS OCCURRING AT EACH STUDY SITE. 133
iv

List of Figures FIGURE 1.1 THE PERENNIAL GRASS MISCANTHUS (TOP) AND SHORT ROTATION WILLOW COPPICE (BOTTOM)
1
FIGURE 1.2 AREA (HA) OF NEWLY PLANTED SHORT ROTATION COPPICE (WILLOW) AND MISCANTHUS UNDER THE ENERGY CROP SCHEME (AVAILABLE IN ENGLAND ONLY)
2
FIGURE 1.3 SITE LOCATIONS 4 FIGURE 1.4 BODORGAN ESTATE SITE DESCRIPTION AND SURROUNDING LANDSCAPE 5 FIGURE 1.5 GLYNLLIFON COLLEGE SITE DESCRIPTION AND SURROUNDING LANDSCAPE 6 FIGURE 1.6 CERNYFED FARM SITE DESCRIPTION AND SURROUNDING LANDSCAPE 7 FIGURE 1.7 CILGOED SITE DESCRIPTION AND SURROUNDING LANDSCAPE. 8 FIGURE 1.8 HAYSCASTLE FARM SITE DESCRIPTION AND SURROUNDING LANDSCAPE 9 FIGURE 1.9 OAKWOOD SITE DESCRIPTION AND SURROUNDING LANDSCAPE 10 FIGURE 1.10 BRIGAM FARM SITE DESCRIPTION AND SURROUNDING LANDSCAPE 11 FIGURE 1.11 PLANTING WILLOW RODS AT OAKWOOD, NEW HOUSE FARM, PEMBROKESHIRE 12 FIGURE 1.12 CUTBACK AT OAKWOOD, NEW HOUSE FARM, PEMBROKESHIRE 13 FIGURE 1.13 NEW SHOOTS DEVELOPING FROM CUTBACK STOOL 13 FIGURE 1.14 HARE AT CERYFED FARM, DENBIGHSHIRE 13 FIGURE 1.15 PERCENTAGE LAND USE ON AGRICULTURAL HOLDINGS, JUNE 2001 (DEFRA. 2008 18 FIGURE 2.1 ARABLE WEEDS IN YOUNG COPPICE AT CILGOED, DENBIGHSHIRE 2005 20 FIGURE 2.2 ARABLE WEEDS IN YOUNG COPPICE ON THE BODORGAN ESTATE, ANGLESEY 2005 21 FIGURE 2.3 THE TREND IN DIVERSITY SCORES. THE GROUND FLORAL DIVERSITY INCREASES WHEN SRC IS PLANTED (-1 = THE CONTROL GROUP; 0 = YEAR OF PLANTING; 1 = SECOND YEAR SRC AND 2 = THIRD YEAR SRC) 24 FIGURE 2.4 RANK ABUNDANCE DISTRIBUTIONS OF WEED COMMUNITIES IN CONVENTIONAL WELSH FARMLAND AND IN SHORT ROTATION WILLOW COPPICE (AGE CODES AS IN FIGURE 2.3) 25 FIGURE 2.5 PROPORTION OF ANNUAL, SHORT-LIVED AND LONG-LIVED PERENNIAL SPECIES WITHIN THE CONTROLS, AND SRC OF DIFFERENT AGES (AGE CODES AS IN FIGURE 2.3) 26 FIGURE 2.6 DCA ORDINATION SHOWING THE INCREASING SIMILARITY BETWEEN THE SITES (AGE CODES AS IN FIGURE 2.3) 27 FIGURE 2.7 SCATTERPLOT WITH TRENDLINES SHOWING THE INCREASING SIMILARITY BETWEEN THE 3 SITES FOR WHICH 4 YEARS DATA HAD BEEN COLLECTED (SITES 1, 5 AND 6) AND THE AVERAGE SIMILARITY INDEX FOR ALL THE SITES (AVE). THE INDEX USED WAS THE BRAY-CURTIS INDEX OF SIMILARITY 27 FIGURE 2.8 TRENDS IN THE ABUNDANCE OF WEED GENERA IMPORTANT TO BIRDS (TOP) AND SPECIES IMPORTANT FOR PHYTOPHAGOUS INSECTS (BOTTOM) IN THE GRASSLAND CONTROLS (N=7) AND THE SRC OF DIFFERENT AGES, YEAR 0 (N=7) YEAR 1 (N=6) AND YEAR 2 (N=3) 28
v

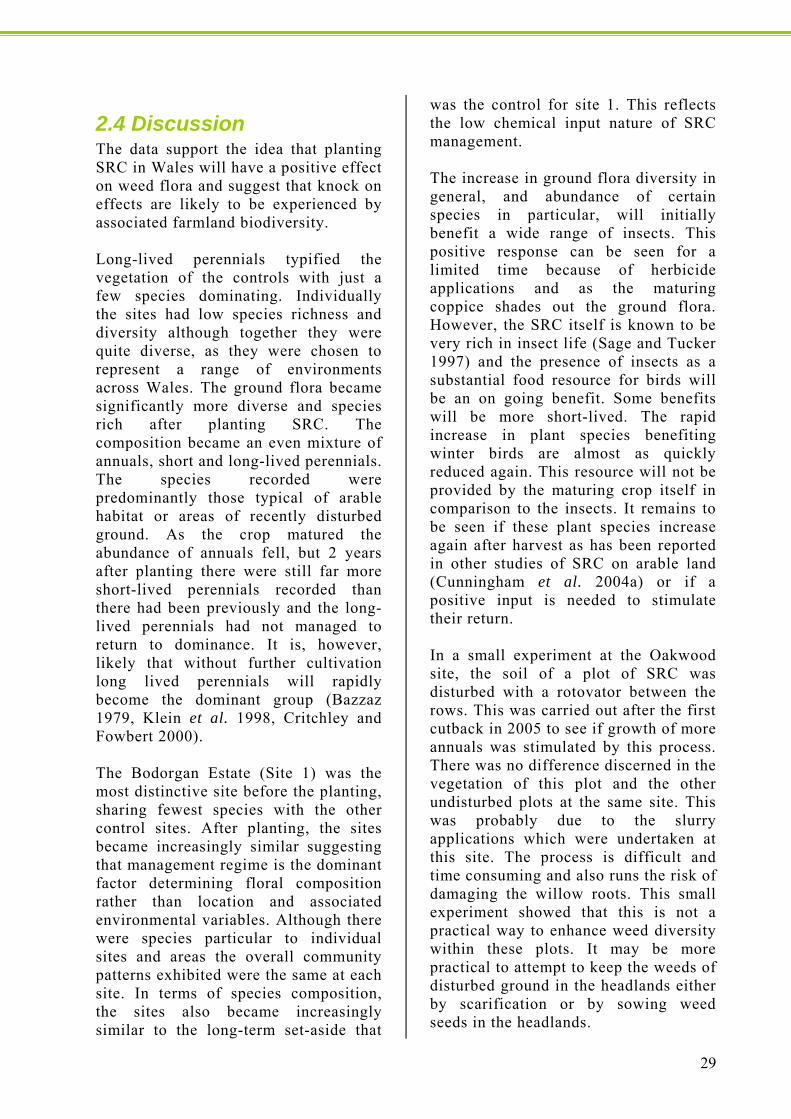
FIGURE 3.1 REDPOLL (CARDUELIS FLAMMEA) CAUGHT AT GLYNLLFON COLLEGE 34 FIGURE 3.2 SEEDS COLLECTED FROM YOUNG SRC PLOTS 35 FIGURE 3.3 EXCLUSION NETS AT GLYNLLIFON COLLEGE (TOP), HAYSCASTLE FARM (MIDDLE) AND OAKWOOD (BOTTOM) 36 FIGURE 3.4 COMPARING PEAK SEED ABUNDANCE (KG/M2) WITH THE BIRD ABUNDANCE (MEAN NO PER VISIT) AT 4 OF THE SITES. NOTE DIFFERENT SCALES ON THE Y-AXIS AND THAT VEGETATION SAMPLE DATA ARE NOT AVAILABLE FOR CILGOED 38 FIGURE 3.5 AVERAGE WEIGHTS (G/M2) FOR VORTIS, VEGETATION AND SOIL SAMPLES (WITH 95% CONFIDENCE INTERVALS) 40 FIGURE 3.6 TRENDS IN THE SEED ABUNDANCE (KG/M2) AND THE CONDITION SCORES (TPS = TRACHEAL PIT SCORE AND PMS = PECTORAL MUSCLE SCORE) OF BIRDS CAUGHT AT HAYSCASTLE 42 FIGURE 4.1 SAWFLY (CLIMBEX SP) CATERPILLARS FEEDING ON SRC 46 FIGURE 4.2 PHESANT (PHASIANUS COLCHICUS) FOOT PRINTS IN SAND TRAPS IN THE SRC AT BODORGAN ESTATE 47 FIGURE 4.3 THE PERCENTAGE OF PUBLISHED PAPERS REFERRING TO THE UK AND CONSTITUENT COUNTRIES (IRELAND AND NORTHERN IRELAND ARE COMBINED) WITHIN EUROPEAN AGRICULTURAL RESEARCH (DEFINED AS ANY PAPER CONTAINING THE WORD ‘EUROPE’ AND ‘FARMLAND’ OR ‘AGRICULTURE’ AND RELATED SYNONYMS IN THE TITLE, KEYWORDS OR ABSTRACT) LISTED BY THE ISI DATABASE, 1997-2006 48 FIGURE 4.4 SHEEP GRAZING - THE DOMINANT LAND USE IN WALES 48 FIGURE 4.5 MIST NET AT HUNDRED HOUSE 49 FIGURE 4.6 COMPARISON OF WINTER BIRD SURVEY (WBS) AND BREEDING BIRD SURVEYS (BBS). COMPARISONS ARE MADE IN THE BIRD GROUPS FOR A) SPECIES DIVERSITY AND B) ABUNDANCE (MEAN INDIVIDUALS/VISIT) 51 FIGURE 4.7 MEAN BIRD ABUNDANCE RECORDED IN THE MATURE SRC AT HUNDRED HOUSE (MARCH 2005 TO APRIL 2006) 52 FIGURE 4.8 ABUNDANCE OF BIRD GROUPS CAUGHT IN THE MATURE SRC AT HUNDRED HOUSE 53 FIGURE 4.9 MEAN ABUNDANCE EACH MONTH OF SPECIES CAUGHT IN THE MATURE SRC AT HUNDRED HOUSE IN THE BIRD GROUPS; WARBLERS, TITS, THRUSHES, FINCHES AND OTHER 54 FIGURE 5.1 SMOOTHED POPULATION TRENDS FOR THE WILLOW WARBLER (TAKEN BAILLIE ET AL. (2007) 59 FIGURE 5.2 PRODUCTIVITY DECLINES IN THE WILLOW WARBLER (BAILLIE ET AL. (2007) 59 FIGURE 5.3 SITE LOCATION AND SURROUNDING LANDUSE 61 FIGURE 5.4 RADIO-TRACKING AT TERRIBLE HOLLOW (TOP) FOR WILLOW WARBLERS (BOTTOM) 64 FIGURE 5.5 ATTACHING THE RADIO TRANSMITTERS 65 FIGURE 5.6 EXAMPLES OF HOW LOCATIONS WERE ESTIMATED USING TRIANGULATION METHODS AT A) HH AND B) TH 66
vi

FIGURE 5.7 ABUNDANCE OF BIRD SPECIES CAUGHT AT THE SITES TERRIBLE HOLLOW AND HUNDRED HOUSE IN A) 2006 AND B) 2007 70 FIGURE 5.8 AVERAGE CONDITION SCORES FOR A) TRACHEAL PIT B) PECTORAL MUSCLE AND C) BODY MASS (+ 1 SE) AT THE SITES TH AND HH. 71 FIGURE 5.9 AVERAGE CONDITION SCORES FOR A) TRACHEAL PIT AND PECTORAL MUSCLE AND B) BODY MASS (+ 1 SE) OF WILLOW WARBLERS CAUGHT AT TH AND HH IN 2006 AND 2007 72 FIGURE 5.10 MINIMAUM CONVEX POLYGONS (MPC’S) AROUND THE OUTER MOST LOCATIONS OF WILLOW WARBLERS CAUGHT AT TH (RED) AND HH (BLACK) IN A) 2006 AND B) 2007 73 FIGURE 5.11 BOX PLOTS ILLUSTRATING THE A) BETWEEN SITE AND B) BETWEEN YEAR VARIATION IN TERRITORY SIZES 74 FIGURE 5.12 CORE AREAS WITHIN THE MAPPED TERRITORIES IN A) 2006 AND B) 2007 75 FIGURE 5.13 THE BREEDING TERRITORIES OF THE 4 INDIVIDUALS TRACKED AT TH IN 2006 76 FIGURE 5.14 THE BREEDING TERRITORIES OF THE 7 INDIVIDUALS TRACKED AT HH IN 2006 77 FIGURE 5.15 THE BREEDING TERRITORIES OF INDIVIDUALS CAUGHT AT TH (4) AND HH (3) IN 2007 78 FIGURE 5.16 REGRESSION LINES SHOWING SCRUB AND SRC RELATED TO HOME RANGE SIZE 79 FIGURE 5.17 OBSERVED HABITAT USE COMPARED WITH EXPECTED USE BASED ON THE PROPORTIONS OF AVAILABLE HABITAT FOR THE WILLOW WARBERS CAUGHT AT A) HH AND B) TH 81 FIGURE 6.1 SUMMARY MAPS OF RESULTS OF BADGER SURVEYS AT FOUR SITES SURVEYED 87 FIGURE 6.2 ABUNDANCE OF SMALL MAMMALS AT BRIGHAM AND BLUESTONE SITES 88 FIGURE 6.3 ABUNDANCE OF SMALL MAMMALS WITH INCREASING DISTANCE INTO SRC AND ADJACENT IMPROVED PASTURE. 89 FIGURE 7.1 A WINDOW TRAP 92 FIGURE 7.2 CHANGES OF NUMBERS OF INVERTEBRATES OVER THE SAMPLING SESSIONS 93 FIGURE 7.3 NUMBER OF PHORIDAE FLIES OVER THE SAMPLING SESSIONS 93 FIGURE 7.4 ORDER DIVERSITY AT OAKWOOD AND HAYSCASTLE SITES IN MAY 94 FIGURE 7.5 ORDER DIVERSITY AT OAKWOOD AND HAYSCASTLE SITES IN JUNE 94 FIGURE 7.6 ORDER DIVERSITY AT OAKWOOD AND HAYSCASTLE SITES IN AUGUST 94
vii

viii
List of Tables TABLE 2.1 FOR IMPORTANCE TO FARMLAND BIRDS, WEED GENERA ARE CATEGORISED BY PRESENCE IN THE DIET IN TERMS OF SEED. FOR PHYTOPHAGOUS INSECTS, THE GROUPS ARE BASED ON THE NUMBER OF ASSOCIATED INSECTS WITH A PARTICULAR WEED SPECIES (60+ SPECIES = GROUP 1, 40-59 = GROUP 2, 20-39 = GROUP 3, 0-19 SPECIES = GROUP 4) (ADAPTED FROM MARSHALL ET AL. 2003) 23 TABLE 2.2 DIFFERENCES IN DIVERSITY MEASURES AND FLORA CLASSES BETWEEN THE CONTROL GROUP (-1) AND THE SRC AT DIFFERENT AGES (0, 1 AND 2). 24 TABLE 3.1 CALORIFIC VALUES OF SEEDS COLLECTED FROM FOUR SRC FIELDS ACROSS WALES. 37 TABLE 3.2 LIST OF WINTER BIRD SPECIES RECORDED AT THE SIX SITES. 39 TABLE 3.3 RESULTS FROM 2-SAMPLE T-TESTS COMPARING INSIDE AND OUTSIDE THE EXCLUSION NETS. 41 TABLE 3.4 RESULTS OF MULTIPLE LINEAR REGRESSION ANALYSIS FOR 5 BIRD SPECIES SURVEYED ON SIX SRC SITES OVER 2 WINTERS IN WALES WHERE WEED SPECIES WERE ALSO INVESTIGATED. 41 TABLE 4.1 BIRD SPECIES CAUGHT OR RECORDED IN THE SURVEYS DURING THE BREEDING SEASON (APRIL-SEPT), WINTER (OCT-MARCH) AND BOTH PERIODS. 50 TABLE 5.1 THE FREQUENCY OF SAMPLING AND CAPTURE EVENTS OF WILLOW WARBLERS AT THE STUDY SITES HUNDRED HOUSE (HH) AND TERRIBLE HOLLOW (TH), SPRING 2006 AND 2007. 62 TABLE 5.2 HABITAT TYPES COLLATED INTO GROUPS FOR ANALYSIS. 67 TABLE 5.3 LISTS OF SPECIES, WHERE THEY WERE CAUGHT AND WHEN. 68 TABLE 5.4 PREFERENCE AND AVOIDANCE STATEMENTS FOR EACH HABITAT TYPE FOR EACH INDIVIDUAL BIRD. 80 TABLE 6.1 COMBINED SMALL MAMMAL TOTALS FOR ALL SITES 88 TABLE 7.1 A LIST OF THE DIFFERENT TREATMENTS FOR THE WILLOW PLOTS 91 TABLE 7.2 SITE DIFFERENCES IN FAMILY DIVERSITY 94 TABLE 7.3 FAMILY DIVERSITY FOR THE SMALL AND LARGE OAKWOOD SITES 95 TABLE 7.4 FAMILY DIVERSITY FOR ALL WILLOW COPPICE SITES AND GRAZED LAND IN JUNE 95

Section 1: General Introduction: The biodiversity of short rotation willow coppice in the Welsh landscape
1.1 Energy crops in the UK Biomass currently accounts for just 0.43% of the UK's energy (Supergen 2007). Both the Biomass Task Force (MacLeod et al. 2005) and the subsequent UK Biomass Strategy (Defra 2007a) concluded that biomass is a highly under-utilised resource. Increasing biomass production is one of the ways the UK government hopes to reach it’s targets to reduce carbon dioxide emissions by 20% below 1990 levels by 2010 and by 60% by 2050 (Defra 2007a). Correctly managed, biomass crops provide a sustainable fuel that offers a significant reduction in net carbon emissions compared with fossil fuels. As well as helping to reduce carbon emissions there are other ancillary benefits to growing biomass crops. Other atmospheric pollutants such as sulphur are also reduced and there are opportunities for their use in phytoremediation and improving water quality (Thornton et al. 1997, Mirck et al. 2005). They are, in contrast to fossil fuels such as coal, oil and natural gas (currently our main sources of energy), a secure supply, being grown and sourced locally on an indefinite basis. Growing biomass crops can minimize financial and environmental costs of transport because local networks of production and usage are established. The development of biomass crops offer new local business opportunities and support to the rural economy (Perttu 1998). Despite the obvious benefits, the biomass industry has been slow to develop, with fossil fuels continuing to dominate energy production.
To increase the amount of energy crops grown in England, the Energy Crop Scheme was introduced in 2001. The scheme offers a one off payment to help farmers with the establishment costs of growing two types of energy crops; the perennial grass Miscanthus (typically Miscanthus x gigantus) and short rotation willow (typically Salix viminalis hybrids) coppice (SRC) (Figure 1.1).
Figure 1.1 The perennial grass Miscanthus (top) and short rotation willow coppice (bottom).
1

The scheme ran until 2006 under the England Rural Development Programme and a new but similar Energy Crops Scheme opened to new applications from 1st October 2007 under the Rural Development Programme for England. The uptake of these schemes has been good and has increased steadily since its introduction. The majority of farmers entering the scheme have been investing in Miscanthus rather than SRC (Figure 1.2). The scheme has only been available to land owners in England. The Energy Aid Payment Scheme, coordinated by the Rural Payments Agency (RPA), introduced in 2004 is available across the UK. Farmers qualify for aid if they have a contract with the processing industry for their crops. This is the basic feature of the scheme which guarantees the crops grown will be processed into energy. The RPA have contracts in Scotland and Wales as well as England, evidence that the demand for energy crops does not occur in England only. Establishment grants made available to the rest of the UK would encourage the growth of this industry and help the government to reach its own targets.
Defra has produced regional yield maps across England for Miscanthus and SRC (Defra 2007b). The aim of these maps is to model potential yields of these crops and identify where they would be most productive. Local environmental conditions dictate which crop is better suited to a given area and therefore will produce greater yields. Although a greater amount of Miscanthus has been established under the grant schemes there are areas where SRC would be a more profitable crop. Although a similar map has not been published for Wales, previous research suggests that SRC would be better suited to the Welsh environment (Hodson 1995, Heaton 2000, Lowthe-Thomas 2003). Miscanthus is a genus of about 15 species of perennial grasses native to subtropical and tropical regions of Africa and southern Asia, with one species (M. sinensis) extending north into temperate eastern Asia (El Bassam 1998). Willow in contrast has a global range (Newsholme 1992), is native to the UK and is consequently better adapted to the generally harsher conditions experienced in areas of Wales.
0
500
1000
1500
2000
2500
3000
2001 2002 2003 2004 2005 2006 2007
Year
Area
(ha)
Short Rotation CoppiceMiscanthus
Figure 1.2 Area (ha) of newly planted short rotation coppice (willow) and Miscanthus under the Energy Crop Scheme (available in England only).
2

1.2 Willow for Wales The project, ‘the development of sustainable heat and power fuelled by biomass from short rotation coppice in Wales’ (Helyg i Gymru – Willow for Wales) began in 2004 and ran until December 2008. The main objective of the project was to evaluate and demonstrate the potential of short rotation willow coppice as a biomass crop in Wales. An important aspect of the project is that it engaged farmers as partners in establishing crop test sites and as potential commercial producers. One important impetus for the creation of the project was the fact that the biomass industry in Wales does not have a fully developed supply chain. The Welsh landscape and environment presents particular challenges to this burgeoning industry that have not been encountered elsewhere in Europe, even in neighbouring England. It is perceived that the Willow for Wales project will assist in the development of supply chains feeding into a range of markets.
The Willow for Wales project is funded by the European Regional Development Fund (ERDF) Objective 1 priority/measure 2.5 through the Welsh European Funding Office on behalf of the Welsh Assembly Government, by the Welsh Development Agency and by Industry. It is co-ordinated by the Institute of Grassland and Environmental Research (IGER) and not only involves Cardiff University, but also Forest Research, EGNI, Mid-Wales Energy Agency, RWE npower, Renewable Fuels Ltd, SW Seed Ltd and Agrobransle, ADAS and the West Wales Machinery Ring. In the words of the Project Co-ordinator Dr. John Valentine: “Helyg i Gymru – Willow for Wales is taking a stepwise approach to the development of heat and power from short rotation coppice in Wales. It will help bring about change through education and by allowing farmers to ‘see with their own eyes.’”
3
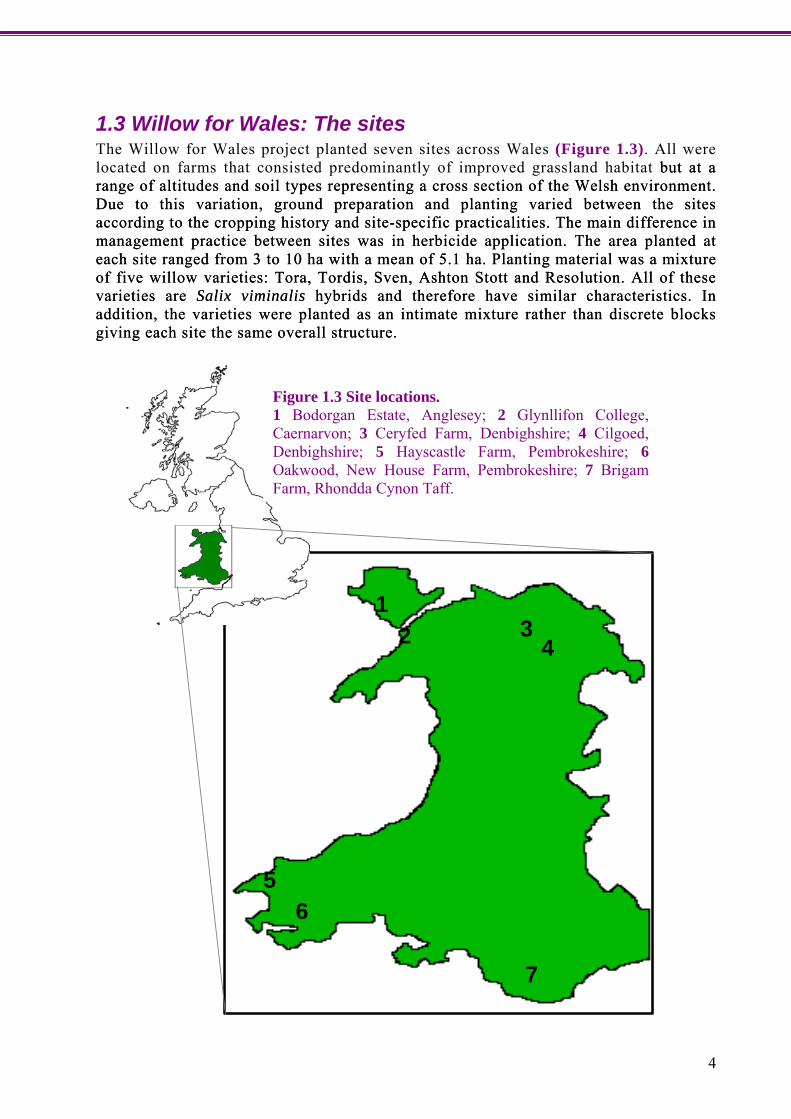
1.3 Willow for Wales: The sites The Willow for Wales project planted seven sites across Wales (Figure 1.3). All were located on farms that consisted predominantly of improved grassland habitat but at a range of altitudes and soil types representing a cross section of the Welsh environment. Due to this variation, ground preparation and planting varied between the sites according to the cropping history and site-specific practicalities. The main difference in management practice between sites was in herbicide application. The area planted at each site ranged from 3 to 10 ha with a mean of 5.1 ha. Planting material was a mixture of five willow varieties: Tora, Tordis, Sven, Ashton Stott and Resolution. All of these varieties are Salix viminalis hybrids and therefore have similar characteristics. In addition, the varieties were planted as an intimate mixture rather than discrete blocks giving each site the same overall structure.
but at a range of altitudes and soil types representing a cross section of the Welsh environment. Due to this variation, ground preparation and planting varied between the sites according to the cropping history and site-specific practicalities. The main difference in management practice between sites was in herbicide application. The area planted at each site ranged from 3 to 10 ha with a mean of 5.1 ha. Planting material was a mixture of five willow varieties: Tora, Tordis, Sven, Ashton Stott and Resolution. All of these varieties are Salix viminalis hybrids and therefore have similar characteristics. In addition, the varieties were planted as an intimate mixture rather than discrete blocks giving each site the same overall structure.
12 3
56
7
4
Figure 1.3 Site locations. 1 Bodorgan Estate, Anglesey; 2 Glynllifon College, Caernarvon; 3 Ceryfed Farm, Denbighshire; 4 Cilgoed, Denbighshire; 5 Hayscastle Farm, Pembrokeshire; 6 Oakwood, New House Farm, Pembrokeshire; 7 Brigam Farm, Rhondda Cynon Taff.
4
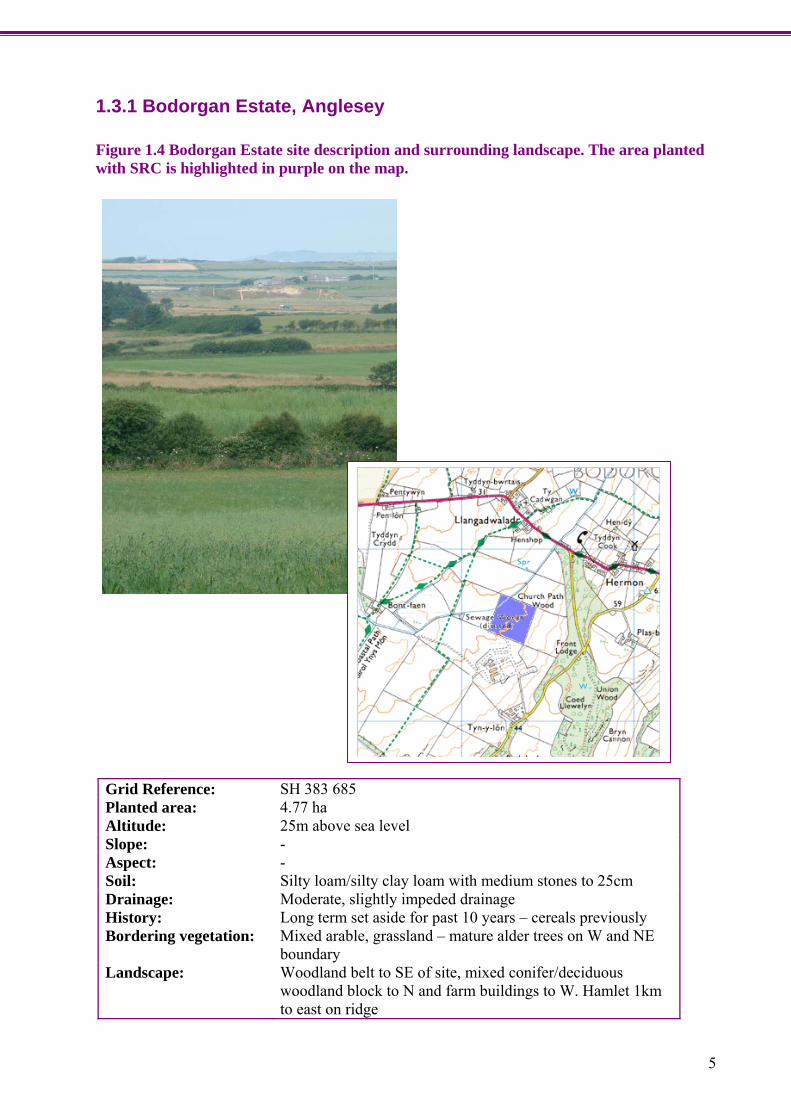
1.3.1 Bodorgan Estate, Anglesey Figure 1.4 Bodorgan Estate site description and surrounding landscape. The area planted with SRC is highlighted in purple on the map.
Grid Reference: SH 383 685 Planted area: 4.77 ha Altitude: 25m above sea level Slope: - Aspect: - Soil: Silty loam/silty clay loam with medium stones to 25cm Drainage: Moderate, slightly impeded drainage History: Long term set aside for past 10 years – cereals previously Bordering vegetation: Mixed arable, grassland – mature alder trees on W and NE
boundary Landscape: Woodland belt to SE of site, mixed conifer/deciduous
woodland block to N and farm buildings to W. Hamlet 1km to east on ridge
5

1.3.2 Glynllifon College, Caernarfon Figure 1.5 Glynllifon College site description and surrounding landscape. The area planted with SRC is highlighted in purple on the map.
Grid Reference: SH 464 557 Planted area: 4.36 ha (from 4.76) Altitude: 50m above sea level Slope: - Aspect: - Soil: Silty clay loam Drainage: Free draining History: Maize in recent years Bordering vegetation: Permanent pasture and mature woodland Landscape: No dwellings overlooking site
6

1.3.3 Cernyfed Farm, Denbighshire Figure 1.6 Cernyfed Farm site description and surrounding landscape. The area planted with SRC is highlighted in purple on the map.
Grid Reference: SJ 033 579 Planted area: 3 ha Altitude: 350m above sea level Slope: Up to 12% Aspect: SE Soil: Brown earth – Denbigh series – over laying shale Drainage: Free draining soils History: Long term permanent pasture – sheep grazing Bordering vegetation: Cleared forestry on southern boundary (scrub) perm
pasture elsewhere. Split by old field boundary (hawthorn and blackthorn)
Landscape: Concerns over proximity of small holiday cottage compromised the planting area slightly
7

1.3.4 Cilgoed, Denbighshire Figure 1.7 Cilgoed site description and surrounding landscape. The area planted with SRC is highlighted in purple on the map.
Grid Reference: SJ 061 510 Planted area: 4.2 ha (from 4.6) Altitude: 270m above sea level Slope: 3% Aspect: NNW Soil: Silty clay loam – stony below 15cm Drainage: Steam bed bisecting fields – under drained. Some wetter areas History: Grassland – ploughed and reseeded in 2001 Bordering vegetation: Mixed species hedge to S and E, streamside corridor on
northern edge (willow, hazel, and ash). Adjoining fields are perm pasture – area of wet grassland habitat on NW boundary
Landscape: No dwellings overlooking site
8
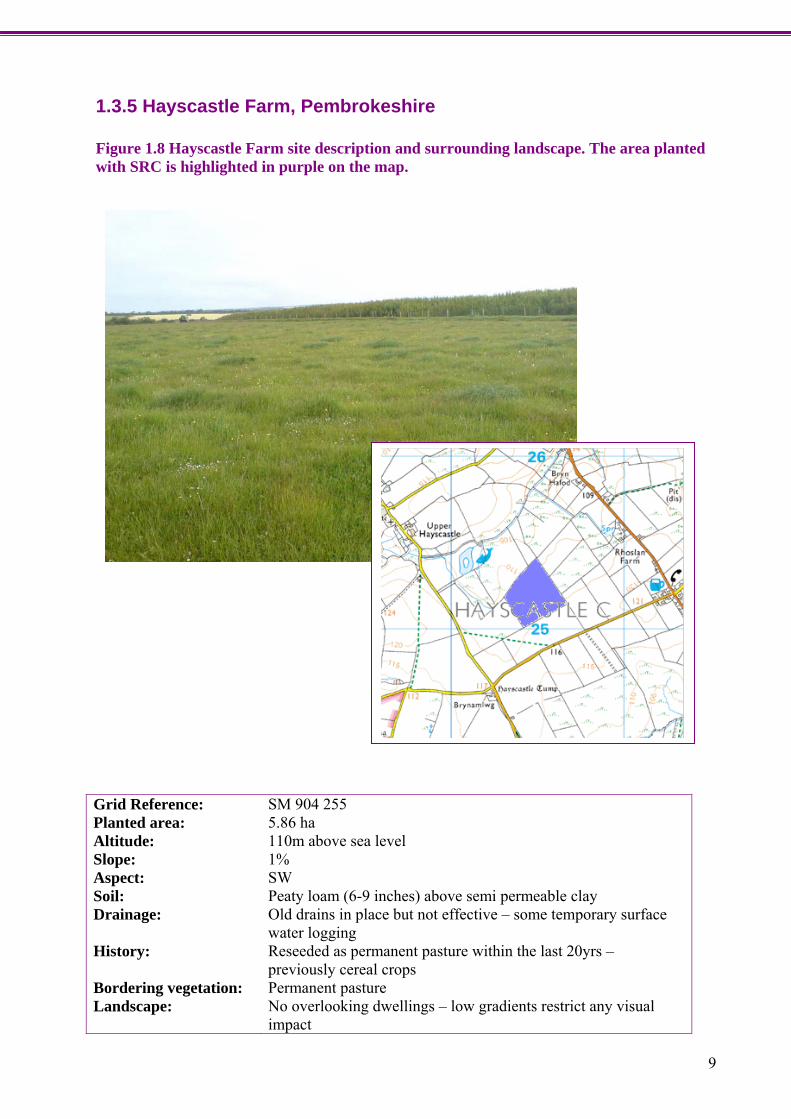
1.3.5 Hayscastle Farm, Pembrokeshire Figure 1.8 Hayscastle Farm site description and surrounding landscape. The area planted with SRC is highlighted in purple on the map.
Grid Reference: SM 904 255 Planted area: 5.86 ha Altitude: 110m above sea level Slope: 1% Aspect: SW Soil: Peaty loam (6-9 inches) above semi permeable clay Drainage: Old drains in place but not effective – some temporary surface
water logging History: Reseeded as permanent pasture within the last 20yrs –
previously cereal crops Bordering vegetation: Permanent pasture Landscape: No overlooking dwellings – low gradients restrict any visual
impact
9

1.3.6 Oakwood, New House Farm, Pembrokeshire Figure 1.9 Oakwood site description and surrounding landscape. The area planted with SRC is highlighted in purple on the map.
Grid Reference: SN 072 126 Planted area: 10 ha Altitude: 100m above sea level Slope: - Aspect: - Soil: Silty clay loam Drainage: Well drained – 2 fields with ditch to north History: Permanent pasture – reseeded within last 15 years Bordering vegetation: Fields bordered by mixed species hedges including some mature
oak, ash and willow. Adjoining fields of permanent pasture. Leisure park on SW side
Landscape: Minimal impact – low gradients – no dwellings
10
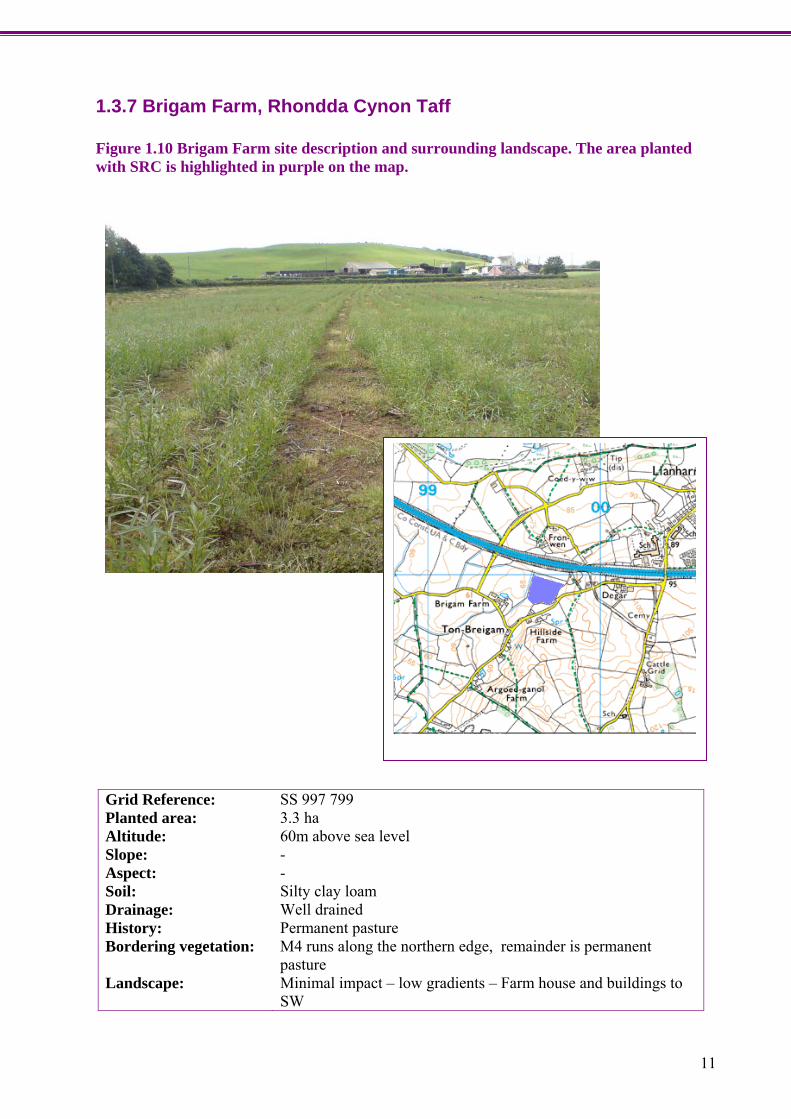
1.3.7 Brigam Farm, Rhondda Cynon Taff Figure 1.10 Brigam Farm site description and surrounding landscape. The area planted with SRC is highlighted in purple on the map.
11
Grid Reference: SS 997 799 Planted area: 3.3 ha Altitude: 60m above sea level Slope: - Aspect: - Soil: Silty clay loam Drainage: Well drained History: Permanent pasture Bordering vegetation: M4 runs along the northern edge, remainder is permanent
pasture Landscape: Minimal impact – low gradients – Farm house and buildings to
SW

1.4 Growing SRC Here the main features of planting procedures are summarised, for full best practice guidelines for growing short rotation willow coppice see Defra (2004).
1.4.1 Land preparation Uncontrolled weed growth can impede the initial growth of SRC (Parfitt et al. 1992, Clay and Parfitt 1994, Sage 1999) and weed control is therefore considered essential when planting SRC (Clay and Dixon 1997, Britt 2000, Defra 2004). As SRC is a long-term, perennial crop (a plantation could be viable for up to 30 years before re-planting becomes necessary), ensuring ideal conditions at establishment will reap benefits for first and subsequent harvests (Defra 2004). One or two applications of a glyphosate-based herbicide should be carried out in the summer/autumn prior to spring planting. An additional application just before planting may be necessary on some sites. When planting a site previously classed as improved grassland, compaction is likely so the site should be sub-soiled to a depth of 40cm to remove this. It should then be ploughed to a depth of at least 25cm and left over winter. Power harrowing should be carried out immediately before planting. Organic manure with low nitrogen content can be incorporated into the soils prior to planting but this is unlikely to be necessary on areas of high nitrogen content such as previously improved sites.
1.4.2 Planting Ideally, a mix of willow varieties will be planted to prevent or impede the spread of diseases such as rust and pests such as willow beetles (Chrysomelidae) through the crop later (Christian et al. 1994, Sage and Tucker 1998a, Perttu 1999, McCracken and Dawson 2003). The Game Conservancy Trust has produced a booklet describing integrated pest management techniques for SRC (Tucker and Sage 1999). Planting should take place after the last frosts but as early as February if soil conditions allow as the longer the first growing season the better. Willows rods should be planted in twin rows 0.75 metres apart and with 1.5 metres between rows (Figure 1.11). This spacing allows standard agricultural machinery to work across the crop. A spacing of 0.59 metres along the rows will give a planting density of 15,000/ha, the commercial standard. The site should be rolled immediately after planting and pre-emergence residual herbicide should be applied within 3-5 days of planting.
Figure 1.11 Planting willow
rods at Oakwood, New House Farm, Pembrokeshire
12

1.4.3 Cutback and harvesting During the winter following planting the willow is cut back to almost ground level (Figure 1.12) to encourage the development of multi-stemmed coppice. This should be carried out as late as possible in the winter but before bud-break, generally late February. 5-20 shoots will emerge from each cutback stool (Figure 1.13) depending on the variety. Within 3 months of cutback, canopy closure will have occurred providing natural weed control and making further herbicide applications unnecessary (Sage 1998, Britt 2000, Defra 2004). Harvesting is then generally carried out on a three-year cycle. The harvests are carried out during the winter, after leaf fall and before bud-break, usually mid-October to early March.
1.4.4 General management Browsing animals such as rabbits, hares (Figure 1.14) and deer can cause damage to SRC but mainly during establishment and must be kept out of the site during this time. Headlands and rides need to be quite large (at least 8 metres in width) to allow for vehicle turning. These areas can be cut for silage but management is minimal. No fertiliser should be applied during the establishment year to allow the herbicide applications to be effective and because nitrate leaching has been recorded at this time (Defra 2004). Due to the structure of SRC, fertiliser application can be difficult in year 2 of the harvest cycle and impossible in year 3. Opportunities to work over the crop have to be taken during cutback and harvest making SRC an extensively managed crop.
Figure 1.14 Hare at Ceryfed Farm, Denbighshire
Figure 1.12 Cutback at Oakwood, New House Farm, Pembrokeshire
Figure 1.13 New shoots developing from 13 cutback stool

1.5 Biodiversity Biodiversity, which 20 years ago was barely considered by most ecosystem ecologists, has now been shown to impact significantly upon many aspects of ecosystem functioning. Greater diversity leads to greater productivity in plant communities, greater nutrient retention in ecosystems and greater ecosystem stability (Tilman 2000). Some of the major functions ecosystems perform are; recycling waste, creating pure drinking water, driving global biogeochemical cycles that created and maintain an aerobic atmosphere, regulating global climate change through effects on greenhouse gasses and local climate through effects on evapotranspiration, generating soil fertility, and providing other ecosystem goods and services (Daily 1997). The myriad of organisms on earth are the catalysts that capture and transform energy and materials, producing, among other things, food, fuel, fibre and medicine. By eliminating species and destroying diversity, humans are harming the very ecosystems that ultimately are our life support systems. Today, agriculture dominates around half of the earth’s exploitable surface (Clay 2004). In Europe, the proportion is often even higher, with many countries having around two-thirds of their total surface in agricultural utilization, e.g. Denmark (64%), Ireland (63%) and the UK (70%) (Schafer 2007). Farmland consequently supports a substantial fraction of British biodiversity. During the second half of the 20th century, UK agricultural management underwent an unprecedented revolution, which has resulted in rapid agricultural intensification over the last few decades (for a full review of changes see Shrub 2000). Accounting for such a large proportion of land coverage, farming is by far the single biggest influence on
the British countryside, any changes within this industry affects the biodiversity that it supports. The changes in agricultural management have caused massive declines across many taxa associated with the farmed landscape including many of conservation value (Krebs et al. 1999, Chamberlain et al. 2000, Robinson and Sutherland 2002). Twenty eight percent of native plant species have decreased in Britain over the past 40 years (Thomas et al. 2004) with particularly massive diversity declines amongst arable flora species being documented (Sutcliffe and Kay 2000, Wilson 1992, Rich and Woodruff 1996). The extinction rates of UK invertebrates have matched, and probably exceeded, those of vascular plants in the present century (Thomas et al. 1994). For common British macro-moths, 21% of the species studied, declined by more than 30%, a decline at least as great as those recently reported for British butterflies (Thomas et al. 2004) and exceeding those of British vascular plants (Conrad et al. 2006). There have also been declines reported in essential pollinator species such as bees (Biesmeijer et al. 2006).
1.6 Birds as biodiversity indicators Population declines of farmland birds have been particularly rapid, massive and widespread, with some species in the UK experiencing more than 80% reductions in numbers and range in less than 20 years (Tucker and Heath 1994, Fuller et al. 1995). There is compelling and extensive evidence that the declines among farmland birds have been driven by agricultural intensification (Tucker and Heath 1994, Krebs et al. 1999, Aebischer et al. 2000, Chamberlain et al. 2000, Donald et al. 2001, Benton et al. 2002). By the turn of the
14

millennium, the need to conserve farmland birds had become one of Britain’s most pressing environmental issues and had emerged as a key driver of rural land management policies (Ormerod and Watkinson 2000, Grice et al. 2004). Birds are major indicators of the changes occurring within the landscape and underlying biodiversity. Their patterns of behavior, distribution and demography track closely the spatial and temporal scales of agricultural change (Ormerod and Watkinson 2000). Their declines are indicative, or even the direct result of, severe declines in the other components of farmland biodiversity, including insects and wild plants (Wilson 1992, Rich and Woodruff 1996, Donald 1998, Sotherton and Self 2000, Preston et al. 2002, Gregory et al. 2003). Foraging, nest-site selection and or breeding performance reflect features within the mosaic of agricultural habitat (Bradbury et al. 2000, Brickle et al. 2000). Birds have widespread popular appeal and – by virtue of their conspicuous nature – are easily monitored. They therefore make excellent flagship species for mobilising volunteer-based monitoring networks and in Britain we have geographically and temporally extensive datasets available for analysis. Birds are also the best-known and documented major taxonomic group, especially in terms of the sizes and trends of populations and distributions, and the number of species is manageable, thereby permitting comprehensive and rigorous analyses (Birdlife International 2007). For these reasons, it has become common practice to use birds as indicators of the general state of nature. Wild bird populations are one of the UK government’s sustainability indicators. These Quality of Life indicators are used
to measure the UK’s progress towards sustainable development and whether people are experiencing a better quality of life (DETR 1999). There are 68 national indicators supporting the strategy including measures of everyday concern such as health, housing, jobs, crime, education and environment (Defra 2008). The bird indicator or Wild Bird Index was developed to give a broad summary of the general health of wildlife in the British countryside and was first published in the government’s consultation on the Headline indicators in 1998 (DETR. 1998). The bird indicator originally focused on groups of birds from two main habitats, farmland and woodland but seabirds have been added subsequently. Having become established, the indicator could then be used to set targets and to monitor progress. The former Ministry of Agriculture, Fisheries and Food (now Department for Environment, Food and Rural Affairs – Defra) and the forestry Commission developed key targets to reverse the long-term decline in farmland and woodland birds by 2020. Specifically, Defra adopted a Public Service Agreement (PSA) to ‘Care for our living heritage and preserve natural diversity by reversing the long-term decline in the number of farmland birds by 2020, as measured annually against underlying trends’. Reversing the decline in farmland birds is viewed by government as a measurable surrogate for the success of its policies which seek to conserve biodiversity in general.
1.7 SRC and biodiversity SRC, by virtue of its nature and structure, requires far fewer herbicide, pesticide and fertiliser applications than other current farming practices, both arable and pastoral (Ranney and Mann 1994, Ledin 1998, Perttu 1998). Non-cropped areas are larger and less
15

intensively managed, soil compaction should be reduced and overall, completely different farming practices are introduced, all of which will impact on biodiversity. It is well documented that tillage is detrimental to soil quality and decreases soil organic matter (Reicosky et al. 1995, Kladivko 2001). SRC production only disturbs the soil during the planting process and has been reported to be of benefit to soil properties, both physical condition and biological activity (Makeschin 1994, Paine et al. 1995, Perttu 1995, Thornton 1997, Abrahamson et al. 1998, Ledin 1998, Perttu 1998, Perttu 1999, Borjesson 1999, Kahle et al. 2007, Rowe et al. 2007). SRC consistently contains high richness and abundance of plant species (Sage et al. 1994, Coates and Say 1999, Cunningham et al. 2004a, Cunningham et al. 2006), although the plant composition in SRC is highly variable and depends largely on previous land use and management practices (Sage et al. 1994, Sage 1995, 1998, Ledin 1998). Sage (1995) suggested that SRC established on westerly sites, typically on former grassland sites and contained a more diverse ground flora with a higher proportion of long-lived perennials than on sites in the eastern part of the country that were frequently established on former arable land. A general pattern of succession has been identified (Gustafasson 1986, Coates and Say 1999, Cunningham et al. 2004a, Cunningham et al. 2006), annuals germinating from the seed bank just after planting initially dominate, but then significant decrease as the SRC becomes established and higher proportions of both invasive and long-lived perennials take over. Work on ground invertebrates in SRC indicated a predatory invertebrate community that changes from species characteristic of ruderal habitats to
species of undisturbed habitats (Coates and Say 1999, Lowthe-Thomas 2003) reflecting the ground flora compositions within the crop. Native willows in Britain are known to be particularly rich in insect fauna. Kennedy and Southward (1984) found 450 insect (or mites) on five willow species (Salix spp) in Britain, more than any other tree or genus. In surveys of SRC plantations in England, insect species from over 50 groups were found to be occupying the canopy alone (Sage and Tucker 1997). In addition to foliar insects, the catkins produced in SRC may constitute an important resource for flower visiting insects particularly bee populations (Reddersen 2001) which are currently in decline (Williams 1995, Roubik 2001, Biesmeijer 2006). In traditional coppiced woodland, small mammal populations respond quickly to changing habitats (Gurnell et al. 1992). Although some species disappear after initial felling, populations quickly recover so that at 3 years they reach peak numbers (Gurnell et al. 1992). Similar abundances of small mammals have been recorded for SRC (poplar) and row crops in the U.S.A. (Christian et al. 1994, Tolbert and Wright 1998). In these studies, ground cover was determined to be the single most important factor in small mammal populations using plantations compared with hay/pasture and grain crops (Christian et al. 1994, Tolbert and Wright 1998). Both rabbits and deer have been recorded to browse on new willow shoots (Kopp et al. 1996, Bergstrom and Guillet 2002, Guillet and Bergstrom 2006). Detrimental affects of herbivore browsing can me minimised by altering planting density and harvest cycles (Kopp et al. 1996). SRC has the potential to be an excellent habitat for declining British hare populations (Vaughan 1993, Smith et al. 2004).
16

1.8 SRC and birds High bird diversity and density have been recorded in SRC in Sweden (Goransson 1990, 1994, Berg 2002), the USA (Christian et al. 1994, Dhont et al. 2004) and the UK (Kavanagh 1990, Sage and Robertson 1996, Sage and Tucker 1998a, Coates and Say 1999). Several studies (Kavanagh 1990, Goransson 1994, Sage and Robertson 1996, Sage and Tucker 1998a, Coates and Say 1999) have recorded densities comparable to traditional British coppice habitat between 3 and 10 years old (Fuller and Henderson 1992). Consistently greater bird diversity has been recorded in SRC compared to existing farmland habitat (Goransson 1990, 1994, Berg 2002, Sage et al. 2006). In sites managed commercially, more individuals and species were recorded in and around SRC than equivalent arable or grassland both in summer and winter (Sage et al. 2006). Goransson (1990) and Berg (2002) both concluded that Salix plantations increased bird diversity generally and were particularly positive for warblers and pheasants. Berg (2002) also concluded that SRC might even be the preferred habitat for some rare or threatened species. In the spring, birds are thought to be predominantly attracted to SRC by the substantial insect abundance (Sage and Tucker 1997). Because biomass crops in the UK are thought to lack nesting opportunities (Sage et al. 2006), boundary habitats are particularly important to the bird populations (Londo 2005, Sage et al. 2006). Indeed the interior of large SRC plots contained fewer birds than the edge zone (<50m) (Sage et al. 2006). In Sweden, Whitethroat and Chaffinch were found to avoid the interior of willow coppice (Berg 2002) and larger bird densities have been recorded in pre-commercial sites which were essentially all edge zone (Sage et al. 2006). Dhont et al.
(2004), in the USA also found that a high proportion of the birds recorded regularly using SRC were actually breeding within the plots (at least 21 of 39). Again, the plots in this study were quite small and the effects of edge were thought to have been negligible. Age classes and growth stages of SRC affect which birds are recorded (Goransson 1994, Sage and Robinson 1996, Sage et al. 2006, Dhont et al. 2007). In Sweden, Whitethroats and Whinchat preferred the sprouts of the recently harvested areas while Willow warbler and Garden warbler preferred the fully grown bushes preceding the harvest (Goransson 1994). Berg (2002) found that taller plantations were preferred by most species but it is not clear if crop height was linked to crop age i.e. if the older crops are the tallest. The clones used for SRC can vary quite markedly in terms of structure. Dhont et al. (2004), in the USA, found that birds constructed nests non-randomly in respect to willow clone. Clones vary in terms of growth structure and this may have been what drove the preferences. SRC has been found to provide excellent winter cover for game birds (Baxter et al. 1996, Sage and Robertson 1994). Particularly Pheasant, Partridge (Goransson 1990, Sage and Robinson 1994, Baxter et al. 1996, Berg 2002) and Snipe (Sage et al. 2006). Sage et al. (2006) concluded that autoecological bird studies in energy crops need to be implemented. This would help establish what characteristics of the SRC are important for those species. This could be particularly useful for game birds or species of conservation concern. In addition, although large numbers of song birds have also been recorded using SRC during the winter (Sage et al. 2006) there has been little work done to establish what resources are attracting them at this time.
17

The benefits of SRC are strongly influenced by the landscape into which it is introduced and the land use it replaces (Christian et al. 1994, Perttu 1995, Tolbert and Wright 1998, Coates and Say 1999, Starback and Becht 2005, Anderson and Fergusson 2006, Rowe et al. 2007). For highly mobile animals, particularly birds, landscape composition plays a central role in determining occupancy of plantations (Christian et al. 1998) and adjacent habitats have a strong influence on the bird community composition in the SRC (Berg 2002).
studies are conducted on SRC replacing peat land, 8 do not use other habitat controls or say what land use the plots have replaced and the remainder (32%) are review/discussion style papers. In the Cunningham et al. (2006) study, although the SRC was replacing grassland fields, not all were in areas predominated by grassland. Grasslands sites were less commonly used to plant SRC on in the area (the ones used in the study were the only available) and it was difficult to find control sites (one was over 1km from its paired SRC plot (Sage 2006). This study was undertaken in England which has a very different agricultural landscape to the rest of the UK (Figure 1.15). Consequently, relatively little is known of the likely effect of SRC on diversity in the grassland-dominated landscape that is currently found in other areas of the UK.
Of the 41 papers on SRC referenced in the last 2 sections of this review (1.7 SRC and biodiversity and 1.8 SRC and birds), 17 (41%) of the studies took place on sites replacing arable production or compare SRC directly to arable habitats, while only 1 (Cunningham et al. 2006) is based on SRC sites previously grassland. Two
18
0102030405060708090
UK England Scotland NorthernIreland
Wales
Perc
enta
ge la
nd u
se
Arable*Grass**Set-aside
Figure 1.15 Percentage land use on agricultural holdings, June 2001 (Defra. 2008). * crops, bare fallow and all grass under five years old. ** five years old and over (including sole right rough grazing).

Section 2: The effects on plant community composition of planting SRC in Wales
Summary Increasing demand for biomass crops in Wales could lead to a substantial increase in the land area devoted to short-rotation willow coppice (SRC) but little is known of the effect on biodiversity of planting SRC in a grassland-dominated landscape. This study used seven SRC fields, distributed throughout north and west Wales, on farms consisting predominantly of improved grassland. Plant abundance data collected over 3 years for grassland controls and 0-2 year old SRC were used to calculate species richness (number of species), diversity (Simpson’s 1/D), evenness (rank-abundance plots) and in multivariate analysis (detrended correspondence analysis) of plant communities. Proportions of annuals, short and long-lived perennials and weed species thought to be of particular
importance for phytophagous insects or in terms of seed for farmland birds were also investigated. Diversity was significantly greater in the SRC in the year it was planted (p=0.027) and the following year (p=0.017) than in the controls. Species richness followed the same pattern (39 species were recorded in the control plots and 87 in the SRC). Evenness was also greatest in the young SRC. These data support the idea that planting SRC in Wales will have a positive effect on the floral diversity, which may have knock-on effects for associated farmland biodiversity. There is now a need to understand the full impact of the replacement of grassland with SRC on other aspects of biodiversity, winter birds in particular. Future research is needed to develop management guidelines for SRC in grassland landscapes that can be incorporated into agri-environment schemes.
19
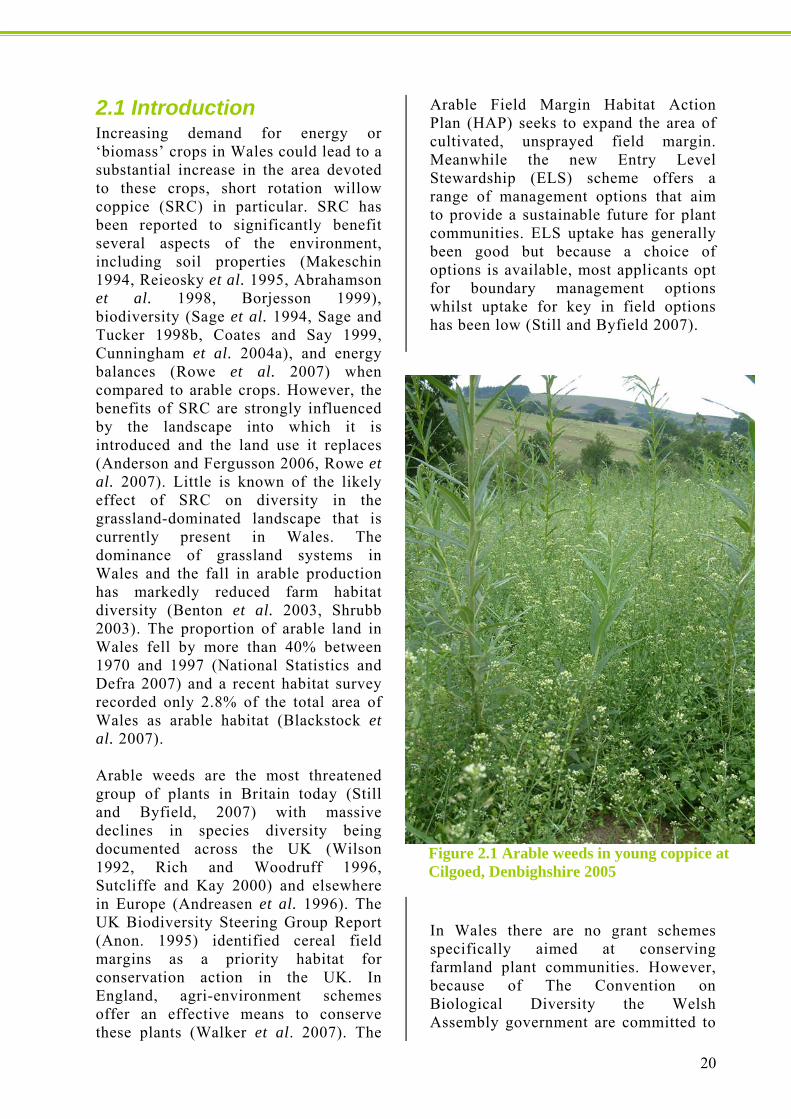
2.1 Introduction Increasing demand for energy or ‘biomass’ crops in Wales could lead to a substantial increase in the area devoted to these crops, short rotation willow coppice (SRC) in particular. SRC has been reported to significantly benefit several aspects of the environment, including soil properties (Makeschin 1994, Reieosky et al. 1995, Abrahamson et al. 1998, Borjesson 1999), biodiversity (Sage et al. 1994, Sage and Tucker 1998b, Coates and Say 1999, Cunningham et al. 2004a), and energy balances (Rowe et al. 2007) when compared to arable crops. However, the benefits of SRC are strongly influenced by the landscape into which it is introduced and the land use it replaces (Anderson and Fergusson 2006, Rowe et al. 2007). Little is known of the likely effect of SRC on diversity in the grassland-dominated landscape that is currently present in Wales. The dominance of grassland systems in Wales and the fall in arable production has markedly reduced farm habitat diversity (Benton et al. 2003, Shrubb 2003). The proportion of arable land in Wales fell by more than 40% between 1970 and 1997 (National Statistics and Defra 2007) and a recent habitat survey recorded only 2.8% of the total area of Wales as arable habitat (Blackstock et al. 2007). Arable weeds are the most threatened group of plants in Britain today (Still and Byfield, 2007) with massive declines in species diversity being documented across the UK (Wilson 1992, Rich and Woodruff 1996, Sutcliffe and Kay 2000) and elsewhere in Europe (Andreasen et al. 1996). The UK Biodiversity Steering Group Report (Anon. 1995) identified cereal field margins as a priority habitat for conservation action in the UK. In England, agri-environment schemes offer an effective means to conserve these plants (Walker et al. 2007). The
Arable Field Margin Habitat Action Plan (HAP) seeks to expand the area of cultivated, unsprayed field margin. Meanwhile the new Entry Level Stewardship (ELS) scheme offers a range of management options that aim to provide a sustainable future for plant communities. ELS uptake has generally been good but because a choice of options is available, most applicants opt for boundary management options whilst uptake for key in field options has been low (Still and Byfield 2007). In Wales there are no grant schemes specifically aimed at conserving farmland plant communities. However, because of The Convention on Biological Diversity the Welsh Assembly government are committed to
Figure 2.1 Arable weeds in young coppice at Cilgoed, Denbighshire 2005
20

halting the loss of biodiversity and for recovery to be underway by 2026. In the Environment Strategy for Wales (WAG 2006) the Welsh Assembly Government recognises the need for the wider environment to be more supportive of biodiversity. Of the total land area of Wales 77% is in agricultural production (CEH 2000) and it must therefore be a priority to improve the biodiversity of this habitat. Farmland birds have been chosen by the UK government as a biodiversity indicator for the health of the farmland environment but the widespread and popular use of sown bird seed and pollen and nectar mixes often utilise non-native species. This has favoured bird populations without necessarily improving the native plant communities in the farmland landscape (Still and Byfield 2007). New developments within the agricultural industry should from the outset aim to incorporate maximisation of diversity into the management guidelines. In their position at the base of the food chain, plants must be a priority not only in their own right but because of the key role they play in maintaining the diversity and viability of all other taxa. Research in this area has focused on the link between plant and insect diversity (Seimann et al. 1998, Knops et al. 1999, Koricheva et al. 2000, Haddad et al. 2001, Asteraki et al. 2003, Gibson et al. 2006) and plants in terms of food for birds providing both seed and insect resources (Green 1990, Campbell et al. 1997, Donald 1998, Wilson et al. 1999, Vickery et al. 1999, Vickery et al. 2001, Robinson and Sutherland 2002, Marshal et al. 2003, Newton 2004, Storkey 2006). SRC has been reported to consistently contain a higher species richness and abundance of plant species in comparison to arable controls (Sage et al. 1994, Sage and Tucker 1998b,
Coates and Say 1999, Cunningham et al. 2004a). This is particularly true in the first year after planting and uncontrolled weed growth can impede the growth of the crop (Sage 1999). Weed control is therefore considered essential when planting SRC (Defra 2004). SRC growth has been shown to be unaffected by weeds in the second year, making weed control after establishment unnecessary and uneconomical (Sage 1999). A more stable ground flora with less competitive plants can colonise after just one year's growth (Rich et al. 2001) or it can take much longer to stabilize if the SRC is replacing highly dissimilar habitat such as peat bogs and fens (Gustafsson 1986). The plant composition in SRC is highly variable depending largely on previous land use and management practices (Sage et al. 1994, Sage 1995). The plant composition of SRC that has replaced grassland has received little attention despite grassland accounting for 60% of all agricultural land in the UK (National Statistics and Defra 2007). It is likely that introducing any form of cultivation to Welsh farmland will have a positive effect on floral diversity (Figure 2.1 and Figure 2.2,
Figure 2.2 Arable weeds in young coppice on the Bodorgan Estate, Anglesey 2005
21

Critchley et al. 2006, Pywell et al. 2007) and associated taxa. For birds, the addition of arable habitat in pastoral landscapes where it is particularly scarce might be of even greater importance than improving the quality of existing arable habitat (Henderson et al. 2004, Robinson et al. 2004). Recent studies suggest that in grassland dominated areas like Wales, if even a single field (typically 5-10 ha) on each farm was used for arable crops, farmland bird numbers could be increased (Robinson et al. 2001, Robinson et al. 2004, Siriwardena et al. 2006). The main objective of this chapter is to provide an insight into the likely impact of commercial cropping of SRC in Wales on ground flora. The associations of invertebrates and birds with the flora recorded are also examined.
2.2 Methods
2.2.1 Data collection Botanical data were collected from quadrats (each 0.5m x 0.5m) randomly positioned in the central areas of each plot (at least 3m away from plot edges) to avoid bias and edge effects. The percentage cover of each plant species rooted in the quadrat was visually estimated to the nearest 5%. According to Greig-Smith’s (1983) commonly used description the measure is ‘the proportion of ground occupied by a perpendicular projection onto it of the aerial parts of individual species.’ Because the vegetation may be layered the cover of all species often sums to more than 100%. For all 7 sites, 50 quadrats were recorded for the previous land use as a control (year -1). Where it was not possible to use the same field, i.e. it had already been ploughed up or planted with SRC, a similar adjacent one was used in its place. SRC was
planted at the sites in different years and it was not possible to collect botanical data for all growth years at all sites. In the year SRC was planted (year 0), 80 quadrats were recorded within the willow coppice at the larger site (site 6, Oakwood) and 50 in the remaining 6 sites. I was able to repeat the survey for sites 1-6 for the year after planting (year 1) and sites 1 (Bodorgan Estate), 5 (Hayscastle Farm) and 6 (Oakwood) in the following year (year 2). The surveys were conducted at the end of September in 2004, 2005 and 2006.
2.2.2 Data analysis The computer package Estimates 5.0.1 (Colwell 2000) was used to compute the reciprocal form of the Simpson’s index of diversity (Simpson’s 1/D). This diversity index is particularly sensitive to changes in the more abundant species of a community (Krebs 1989) and has minimal bias when sample sizes are small (Lande 1996). It was calculated for all sites for every available year. Differences in both Simpson’s 1/D and in species richness (the number of species recorded) between previous land use (-1) and the willow coppice in the year of planting (0), the following year (1) and the year after that (2) were tested by paired t-tests performed with MINITAB 14. Evenness can be a good index of community structure because is able to find patterns among communities that differ in species composition (Bulla 1994). The sites were combined into groups, the control, and the SRC at each age in order to explore the evenness patterns of the plant communities in each group. Rank abundance plots were constructed for each group and the Q-values for those plots calculated. Species composition of the sites was investigated. Plant species were divided into classes according to their
22

23
establishment strategy (after Grime et al. 1988). The three categories were 1) annual species or those able to propagate from buried fragments 2) short-lived perennials (invasive perennials characteristic of disturbed habitat) and 3) long-lived perennial species characteristic of stable habitats. The proportion of total species belonging to each category was calculated and the difference between the controls and SRC of different ages explored. Ordination of the weed communities was conducted using detrended correspondence analysis (DCA) performed with CANACO 4.5. The Bray-Curtis index (Bray and Curtis 1957), sometimes called the Sorensen index, is a quantitative similarity index widely used and recommended (Clarke and Warwick 2001, Magurran 2004). The Bray-Curtis coefficient was calculated with Estimates 5.0.1 (Colwell 2000) and the biotic distinctness of the assemblages evaluated with the Mann Whitney U test performed with MINITAB 14. Sixteen weed species thought to be of particular importance for phytophagous insects were identified and put in one of 4 groups according to their importance, group 1 being most important and 4 being least important (Table 2.1). Importance was recognised according to the number of associated insects with that particular weed species (adapted from Marshal et al. 2003). The same was done for arable weed genera potentially important in terms of seed for farmland birds (Wilson et al. 1996a Buxton et al. 1999, Marshal 2003, Holland et al. 2006). Importance was determined by the presence of the genus in the diet. Twenty-four species from 17 genera were included on this list (Table 2.4). There were 13 species that occurred on both lists but only 5 had the same importance ranking so the lists
were quite different for each taxonomic group. Box plots were created to compare the changes in these species and genera at each site. Mann Whitney U was used to test for differences in the abundance of these plant groups between the control group and the SRC of different ages and was performed with MINITAB 14.
Table 2.1 For importance to farmland birds, weed genera are categorised by presence in the diet in terms of seed. For phytophagous insects, the groups are based on the number of associated insects with a particular weed species (60+ species = Group 1, 40-59 = Group 2, 20-39 = Group 3, 0-19 species = Group 4) (adapted from Marshall et al. 2003) Group Importance for
birds in terms of dietary seeds
Weed Genera
1 Very Chenopodium important Polygonum Stellaria
2 Important Cerastium Poa Rumex Senecio Sinapsis Viola
3 Present Capsella Cirsium Fumaria Sonchus
4 Nominally Galeopsis present Galium Geranium Matricaria
Group Number of associated insect
species
Weed species
1 61 Polygonum aviculare 79 Rumex obtusifolius 71 Stellaria media
2 53 Cirsium arvense 46 Poa annua 50 Senecio vulgaris
3 22 Cerastium fontanum 31 Chenopodium album 20 Persicaria maculosa 37 Sinapsis arvensis
4 3 Anagallis arvensis 13 Capsella bursa-pastoris 3 Fumaria officinaliis 13 Galeopsis tetrahit 7 Solanum nigrum 2 Viola arvensis

2.3 Results
2.3.1 Diversity measures A total of 93 species from 29 families were recorded (Appendix I). There were a total of 39 species recorded in the control plots and 87 in the SRC over the 3 years (58 in year 0, 70 in year 1 and 34 in year 2). There were 9 species which were recorded in the controls but were not recorded in the years after SRC was planted. However, there were 55 species which were recorded in the SRC plots which were not in the control plots. Overall diversity was significantly greater in the SRC in year 0 (p=0.027) and year 1 (p=0.017) than in the controls (Table 2.2, illustrated in Figure 2.3). Although the average diversity score in year 2 remained higher than in the controls the difference was not significant (p=0.129). Species richness followed the same pattern and the difference between the controls and year 0 was statistically even greater (p=0.006) (Table 2.2).
0
1
2
3
4
5
6
-1 0 1 2
Year relative to planting
Mea
n Si
mps
on d
iver
sity
val
ue
Figure 2.3 The trend in diversity scores. The ground floral diversity increases when SRC is planted (-1 = the control group; 0 = year of planting; 1 = second year SRC and 2 = third year SRC).
Table 2.2 Differences in diversity measures and flora classes between the control group (-1) and the SRC at different ages (0, 1 and 2).
-1 X 0 0 X 1 1 X 2 -1 X 1 -1 X 2 0 X 2 Diversity measures Species richness 0.006** 0.82 0.497 0.012* 0.383 0.398 Simpson's diversity index 0.027* 0.787 0.824 0.017* 0.129 0.822 Bray-Curtis similarity index 0.5294 0.7974 0.9528 0.6189 0.7934 0.8959 Class 1. Annuals 0.0010** 0.2581 0.0101* 0.0232* 0.6414 0.0005*** 2. Short-lived perennials 0.2452 0.1786 0.0096** 0.0056** 0.9854 0.2762 3. Long-lived perennials 0.8415 0.1234 0.2541 0.1108 0.8669 0.9354 P***<0.001, P**<0.01, P*<0.05
24

The overall pattern in the control groups was for a few species to have a very high abundance, while the majority were less abundant than in the SRC (Figure 2.4). Years 0 and 1 demonstrate a more even rank abundance distribution but year 2 returns to the pattern exhibited by the control groups. The Q-statistic for the rank abundance plots by year is 21, 32, 36 and 18, respectively; supporting the idea that year 0 and year 1 coppice supports a higher diversity.
0.001
0.01
0.1
1
10
100
1 4 7 10 13 16 19 22 25 28 31 34 37 40 43 46 49 52 55 58 61 64 67 70
Rank order of species abundances
Pro
port
iona
l abu
ndan
ce (l
og s
cale
)
-1012
Figure 2.4 Rank abundance distributions of weed communities in conventional welsh farmland and in short rotation willow coppice (age codes as in Figure 2.3).
25

The composition of the plant community within SRC plots was different from that of the controls. The controls were dominated by long-lived perennial species (90% of species recorded) but in year 0 when SRC was planted there was a more even proportion of each of the classes, annuals (34%), short-lived perennials (39%) and long-lived perennials (35%)(Figure 2.5). The proportion of annuals was significantly higher in the SRC in year 0 (p=0.001) and year 1 (p=0.0232) but by year 2 were back to the low levels found in the control plots (Table 2.1 and Figure 2.5). The short-lived perennials increased steadily from control proportions after SRC was planted until year 2 when levels remained the same as year 1.
0102030405060708090
100
-1 0 1 2
Year relative to planting
Pro
port
ion
of a
nnua
ls
26
0102030405060708090
100
-1 0 1 2
Year relative to planting
Prop
ortio
n of
sho
rt-li
ved
pere
nnia
ls
0102030405060708090
100
-1 0 1 2
Year relative to planting
Prop
ortio
n of
long
-live
d pe
renn
ials
Figure 2.5 Proportion of annual, short-lived and long-lived perennial species within the controls, and SRC of different ages (age codes as in Figure 2.3).

Community ordination of the weed species abundance did not reveal any clear differentiation along the axes. It did suggest that the sites became much more similar in terms of species composition 2 years after SRC was planted (Figure 2.6). This was supported by the Bray-Curtis similarity values (Table 2.1 and Figure 2.7). The DCA also suggested that the sites which previously had been improved grassland were becoming increasingly similar to the set-aside site.
-1.0 5.0
-0.5
3.5
1 (-1)
5 (-1)
6 (-1)
3 (-1)
2 (-1) 4 (-1)
7 (-1)
1 (0)
5 (0)
6 (0)
3 (0)2 (0)
4 (0)
7 (0)
1 (1)
5 (1)
6 (1)
3 (1)2 (1)
4 (1)
1 (2)
5 (2)
6 (2)
SAMPLES
-1 0 1 2
Year relative to planting
0
0.2
0.4
0.6
0.8
1
-2 -1 0 1 2
Y l ti t l ti
Sim
ilarit
y in
dex
scor
e
Site 1 X Site 5 Site 1 X Site 6 Site 5 X Site 6 Average for all sites
Figure 2.6 DCA ordination showing the increasing similarity between the sites (age codes as in Figure 2.3)
Figure 2.7 Scatterplot with trendlines showing the increasing similarity between the 3 sites for which 4 years data had been collected (sites 1, 5 and 6) and the average similarity index for all the sites (AVE). The index used was the Bray-Curtis index of similarity.
27

Weeds in relation to other taxa Of the 16 species highlighted as important for insects 14 exhibited a positive response to the planting of SRC. Of the 17 genera highlighted as important for birds in terms of seed, 13 responded positively. The following year (1) saw a much more mixed response and by year 2 most had disappeared completely (10/16 for the insect species and 12/17 for the bird seed resource). These abundance changes are illustrated for each site in Figure 2.6. Whether in year 0 or 1, every site did experience a dramatic increase in abundance of these important weed species. For the majority the increase is in year 0 but for sites 1 (Bodorgan Estate), 4 (Cilgoed) and the insect weed species at site 2 (Glynllifon College), the increases occurred in year 1 instead.
28
0
3
6
912
15
18
21
Control SRC Year 0 SRC Year 1 SRC Year 2
Pla
nts
impo
rtant
for b
irds
(mea
n %
)
Group 1 Group 2 Group 3 Group 4
0
3
6
9
12
15
18
21
Control SRC Year 0 SRC Year 1 SRC Year 2
Pla
nts
impo
rtant
for i
nsec
ts(m
ean
%)
Figure 2.8 Trends in the abundance of weed genera important to birds (top) and species important for phytophagous insects (bottom) in the grassland controls (n=7) and the SRC of different ages, year 0 (n=7) year 1 (n=6) and year 2 (n=3). Plant groups 1-4 are distinguished by their relative importance 1 being most important and 4 being least important (for genera and species included in each group see Table 1). Standard errors are presented.
2.4 Discussion The data support the idea that planting SRC in Wales will have a positive effect on weed flora and suggest that knock on effects are likely to be experienced by associated farmland biodiversity. Long-lived perennials typified the vegetation of the controls with just a few species dominating. Individually the sites had low species richness and diversity although together they were quite diverse, as they were chosen to represent a range of environments across Wales. The ground flora became significantly more diverse and species rich after planting SRC. The composition became an even mixture of annuals, short and long-lived perennials. The species recorded were predominantly those typical of arable habitat or areas of recently disturbed ground. As the crop matured the abundance of annuals fell, but 2 years after planting there were still far more short-lived perennials recorded than there had been previously and the long-lived perennials had not managed to return to dominance. It is, however, likely that without further cultivation long lived perennials will rapidly become the dominant group (Bazzaz 1979, Klein et al. 1998, Critchley and Fowbert 2000). The Bodorgan Estate (Site 1) was the most distinctive site before the planting, sharing fewest species with the other control sites. After planting, the sites became increasingly similar suggesting that management regime is the dominant factor determining floral composition rather than location and associated environmental variables. Although there were species particular to individual sites and areas the overall community patterns exhibited were the same at each site. In terms of species composition, the sites also became increasingly similar to the long-term set-aside that
was the control for site 1. This reflects the low chemical input nature of SRC management. The increase in ground flora diversity in general, and abundance of certain species in particular, will initially benefit a wide range of insects. This positive response can be seen for a limited time because of herbicide applications and as the maturing coppice shades out the ground flora. However, the SRC itself is known to be very rich in insect life (Sage and Tucker 1997) and the presence of insects as a substantial food resource for birds will be an on going benefit. Some benefits will be more short-lived. The rapid increase in plant species benefiting winter birds are almost as quickly reduced again. This resource will not be provided by the maturing crop itself in comparison to the insects. It remains to be seen if these plant species increase again after harvest as has been reported in other studies of SRC on arable land (Cunningham et al. 2004a) or if a positive input is needed to stimulate their return. In a small experiment at the Oakwood site, the soil of a plot of SRC was disturbed with a rotovator between the rows. This was carried out after the first cutback in 2005 to see if growth of more annuals was stimulated by this process. There was no difference discerned in the vegetation of this plot and the other undisturbed plots at the same site. This was probably due to the slurry applications which were undertaken at this site. The process is difficult and time consuming and also runs the risk of damaging the willow roots. This small experiment showed that this is not a practical way to enhance weed diversity within these plots. It may be more practical to attempt to keep the weeds of disturbed ground in the headlands either by scarification or by sowing weed seeds in the headlands.
29
Floral species richness was lower than that recorded by Cunningham et al. (2004c) in a similar study of arable habitat. Improved grassland is widely acknowledged to be generally less diverse that arable habitat (Buckingham et al. 2004, Woodhouse et al. 2005, Pywell et al. 2007). The lower number of species recorded after SRC was introduced could represent the depleted soil seed bank experienced in grassland systems. However, it could simply be that the Cunningham study included a greater number of sites in a different area of Britain and continued for a year longer than this study. The arable controls (Cunningham et al. 2004c) showed almost the exact opposite to the grassland controls used in this study. The arable controls were dominated by annual plants and their abundance fell when SRC was planted while the perennials increased. Short-lived perennials were at around the same abundance levels in the controls of both studies, and recorded in increasingly greater abundance in the years following planting SRC. Critical assessment Five percent steps in the plant abundance classes are quite small but I feel confident that it was possible to distinguish between these classes. I was able to look down on the vegetation in almost all cases making visual estimates easier and the subjective nature of the estimates was minimal as the same observer always conducted the surveys. The surveys were conducted a little late in the season considering main weed competition within SRC in England has been found to occur between April and June (Sage 1999). The timing was constrained by planting and spraying dates which were relatively late and it was thought more important to be consistent across the years of the study.
Implications and areas for further study This study has shown the potential of SRC to provide a crop of enhanced biodiversity and so help the government reach targets agreed by The Convention on Biological Diversity. Incorporating SRC into the Welsh landscape would help the wider environment support an increased level of biodiversity, a main theme in the Environment Strategy for Wales (WAG 2006). Although the sites in this study were intended to be treated as a commercial crop the planters and growers had little or no previous experience of this crop. Even at sites where particularly aggressive chemical spaying occurred there was still an increase in weed abundance. In the future, weed control will probably be refined and become increasingly effective, rendering SRC less valuable for enhancing biodiversity unless contrary guidance is given. Including SRC in Welsh agri-environment schemes such as Tir Gofal could significantly increase the floral diversity of Welsh farmland and positively effect associated taxa. Making it beneficial for farmers to be less aggressive in their control of weeds within this crop would allow it to realize its biodiversity potential and help the government to reach its biodiversity targets. With the EU Agriculture Council’s decision to set a 0% rate of set-aside for 2008, farming will loose valuable areas of nil or low chemical input. SRC could be of particular importance, as it will inevitably reduce the chemical input into farming systems. Although the loss of set-aside will not be particularly felt in Wales any new farming system which reduces the level of intensity would be beneficial anywhere in the UK. The headlands associated with SRC might in themselves become a valuable biodiversity resource.
30

31
This study suggests that plant species introduced with SRC would benefit winter birds in terms of a winter seed resource. As a quality of life indicator birds are a particularly important group. The interaction between birds and changing food resources is an area that merits further investigation. The most obvious question raised is whether birds will utilize the resource available in SRC. Even if levels of weed seed resources rise significantly it does not necessarily follow that birds will utilize them. Birds select foraging sites based on a trade off between energy gain and predation risk (Lima and Dill, 1990). The change from grassland to SRC will alter the structure of the habitat, thus altering perceived predation risk (Bro et al. 2004, Atkinson et al. 2005a, Wilson et al. 2005). The resource must also be detectable and accessible (Whittingham and Markland 2002, McCracken and Tallowin 2004, Whittingham et al. 2006). Further research is necessary to establish whether this resource is accessible to winter bird populations.

Section 3: Seeds produced in SRC fields in Wales and their use by granivorous birds
3.0 Summary Passerines that eat seed in winter form an important guild of farmland birds and many are of conservation concern. The commercial cropping of SRC in Wales may provide a useful habitat for these declining granivorous species both in terms of winter food and by increasing the structural heterogeneity of the habitat. This study used six young (<2 year old) SRC fields distributed across Wales and through a variety of seed sampling methods and winter bird surveys set out to determine whether this crop is utilised by winter bird populations. Substantial amounts of seed were produced by the young SRC fields and all the seeds of the weed species tested had high calorific values. Young SRC sites in Wales can be expected to produce an average of 4.2 MJ of energy per m2 each winter in terms of seed production. Birds
rapidly deplete these weed seeds as they ripen on the plant and then fall to the ground. Twenty-one of the 35 bird species recorded were granivorous and ground surface sampling showed significantly more seed in areas where birds had been excluded (p=0.021). Cirsium species were associated with the presence of Chaffinches and Cerastium and Rumex species with Redpoll. In addition, the strong negative correlation between seed abundance and bird condition scores (r2=-0.900 p=0.037) suggests that the birds in this study were relying directly on the seed provided within the SRC. Planting SRC could significantly raise the amount of winter seed in the Welsh landscape. The resource would be utilised by a range of bird species, several of which are of conservation concern. Sympathetic management of SRC should aim to maximise the diversity of weed species to extend the period of seed shed.
32

3.1 Introduction Passerines that eat seed in winter form an important guild of farmland birds and many are of conservation concern (Gibbons et al. 2006). The decline of these birds has in part, been driven by changes in adult survival (Peach et al. 1999, Siriwardena et al. 1998, 2000, Newton 2004). As these species rely heavily on weed seeds for food, particularly outside the breeding season (Moorcroft et al. 2002, Robinson and Sutherland 2002), the estimated 2% per year decline in the arable seed bank since the 1940’s (Robinson and Sutherland 2002) has had a profound affect on them. Introducing SRC into the Welsh landscape will substantially increase weed abundance including many species that produce seed eaten by winter birds (Section 2). Although the SRC sites studied in Section 2 became increasingly similar in terms of weed composition over time, in the first few years they were highly varied. This diversity of weed species will affect the extent and quality of seed production. Seed production is also determined by growth and maturation, as affected by environmental conditions such as weather, soil fertility and time of year (Kendeigh and West 1965). In addition, weeds and seed production will be affected by management regime, each site in this study was managed slightly differently according to the individual farmers and site conditions. The timing of seed shed (when seeds ripen and drop from the vegetation to the ground) is another highly variable factor, being species, crop and climate specific as documented for a number of weed species (Rauber and Koch 1975, Leguizamon and Roberts 1982). It is usually at the time of seed shed that the seeds are most available to predators, although some seed predators will consume ripe unshed seeds direct from
the plant (Kjellsson 1985). Just prior to shedding, ripe seeds are abundant but not necessarily available to all of the birds, illustrating an important difference between abundance and availability (Hutto 1990). However, in many other agro ecosystems, weed seeds are readily available to a range of predators and high consumption rates of weed seeds have been recorded (Burst and House 1988, Smith and Watt 1993, Cardina et al. 1996, Anderson 1998, Tooley et al. 1999, Manalled et al. 2000, Povey et al. 2003, Westerman et al. 2003). Environmental and crop management factors that affect which weed species grow and how much seed they produce may also affect the nutritional or energy value of the seeds. Differing calorific value of food has direct effects on growth (O’Sullivan et al. 1991) and egg production (Pallister 2004) in birds. These effects have been studied primarily in poultry but are probably also true in wild birds. Maintenance of condition is crucial to survival, particularly in the winter when food is scarce, although seed chemistry is less important than the effects of seed size and structure (Diaz 1996). Birds choose seeds based on their size and structure, which relates to seed processing speed and energy demands. For example, sparrows consume seeds that are an order of magnitude smaller than the seeds consumed by finches of similar body mass (Benkman and Pulliam 1988). For some species such as Linnets and Reedbuntings, the density of seed is important in order for them to meet their energy demands (Moorcroft et al. 2002). Birds select foraging sites based on a trade off between this energy gain and predation risk (Dill 1987, Lima and Dill 1990). The degree of vegetation cover will alter an individual’s perceived predation risk and affects most bird
33
species (Bro et al. 2004, Atkinson et al. 2005b, Wilson et al. 2005, Whittingham et al. 2006). It has been shown that the selection of stubble fields by wintering granivorous birds reflects both food abundance and vegetation cover (Moorcroft et al. 2002). Studies in other habitats have also shown that bird populations are limited by interacting predation and food supply factors (Sih 1980, 1982, Lima 1985, 1986, Rogers and Smith 1993). The winter fat reserve in birds is a useful trait for investigating cost-benefit trade-offs and their implications for population regulation and limitation (Dill 1987). The hypothesis of optimal fattening predicts that a certain fat reserve maximises the probability of winter survivorship by representing the best possible trade-off between costs and benefits of winter fat (Lima 1986, Houston et al. 1988, Ekman and Hake 1990). Costs include costs of flight (Freed 1981), loss of agility at high fat levels (Blem 1975), and exposure to predators that increases with the high foraging rates associated with high fat reserves (Lima 1986). The major benefit of fat is that it insures against starvation and it has been demonstrated that fat
reserves increase with foraging uncertainty or as the predictability of food supplies decrease (Ekman and Hake 1990, Ekman and Lilliendahl 1995, Rogers and Smith 1993, Bednekoff et al. 1994, Witter and Swaddle 1995, Gosler 1996). The addition of weeds to pastoral landscapes where they are particularly scarce might be of even greater importance for birds than improving the quality of existing weedy habitat such as arable areas (Henderson et al. 2004, Robinson et al. 2004, Parish and Sotherton 2008). Recent studies suggest that in grassland dominated areas like Wales, if even a single field (typically 5-10 ha) on each farm was used for weedy crops, farmland bird numbers could be increased (Robinson et al. 2001, Robinson et al. 2004, Gillings et al. 2005, Siriwardena et al. 2006). These seeds must be both detectable and accessible, in order for birds to utilize them (Whittingham and Markland 2002, McCracken and Tallowin 2004, Whittingham et al. 2006). For example, some species require a certain amount of bare ground to enable efficient foraging (Whittingham et al. 2006). Agricultural intensification has encouraged uniform dense swards, thus reducing habitat diversity and any land use change that provides heterogeneous sward structure could facilitate bird conservation (Whittingham and Evans 2004, Whittingham et al. 2006).
Figure 3.1 Redpoll (Carduelis flammea) caught at Glynllfon College
The commercial cropping of SRC in Wales may provide a useful habitat for these declining granivorous species both in terms of winter food i.e. seed abundance, and by increasing the structural heterogeneity of the habitat. The objective of this study was to quantify the seed resource produced by young SRC fields in Wales and with a number of methods (Figure 3.1), determine whether it is utilised by bird populations.
34

3.2 Methods
3.2.1 Seed production The abundance of seed resources was quantified in two ways, at 4 of the SRC sites (Glynllifon College, Cilgoed, Hayscastle and Oakwood), every 2 weeks from late September 2005 to early January 2006. Firstly, seeds were collected using a ‘Vortis’ suction sampling system. The Vortis has an air throughput of 10.5m3/min and a collection area of 0.2m2. It was designed to sample insects but picks up all debris including seeds. This method collects seeds from the soil surface, most likely to be available to small passerines. Thirty samples were taken on each survey visit; each sample consisted of the debris collected at three random locations when the Vortis was placed flat to the ground and activated for 10 seconds. The seeds were subsequently separated from the other debris in the samples, air-dried and weighed (Figure 3.2). Secondly, all ripe seeds present on standing plants were collected within nine, 0.25m2 quadrats. These collections were made at the same time as the Vortis collections. These seeds were also air-dried and weighed although kept separate in order not to bias the measure of seed availability for those species unable to feed on the standing crop. This sampling regime represented a compromise between adequate sampling per field and logistical constraints of seed analysis while providing a standardised measure of seed abundance (Benoit, Kenkel and Cavers 1989). After weighing, 10x1g of seed from six of the most prolific species or groups of species were separated (Cirsium spp, Chenopodium album, Rumex spp, Alopecurus geniculatus, Persicaria
hydropiper and Persicaria maculosa). These samples were used to determine calorific content for each species or group. Analysis was carried out by bomb calorimetry at the Institute of Grassland and Environmental Research (IGER) laboratory at Aberystwyth, which specialises in this analytical technique.
3.2.2 Bird counts Bird counts were undertaken on the same occasions as seed collections were made. Transects were walked around the field’s perimeter and through the field in order to flush all birds within the crop (Wilson, Taylor and Muirhead 1996, Perkins et al. 2000, Whittingham et al. 2006). All birds flushed in this manner were recorded. Care was taken to avoid double counting through observation of movements of previously flushed individuals and groups. Census periods avoided wet and windy weather, which is known to affect bird activity. All counts began within 1 hour of dawn and typically took 1 hour. Bird counts were also conducted at all six sites in years 1 and 2 of planting SRC. At least two surveys were
Figure 3.2 Seeds collected from young SRC plots
35

conducted each year at each site and more at the sites where the seed sampling was occurring. Multiple linear regression analysis was used to test the relationship between abundance of bird species and weed species known to be of dietary importance to wintering birds described in Section 2. Weed species which occurred in <25% of sites and/or reached <15% cover were excluded. Some species were pooled to genus level in order to exceed these criteria, leaving nine groups for analysis: Cerastium spp, Chenopodium album, Cirsium spp, Fumaria officinalis, Poa annua, Polygonum spp, Rumex spp, Senecio spp and Stellaria media. Granivorous bird species were excluded if they occurred in <50% of the surveys or if <100 individuals were recorded during the study. Five species exceeded these criteria: Blackbird, Chaffinch, Greenfinch, Redpoll and Reedbunting.
3.2.3 Exclusion nets In August 2005, exclusion nets were put up at three sites Glynllifon, Cilgoed, and Hayscastle. The netting used was a strong nylon 1.5cm gap mesh designed specifically to keep birds off particular areas and is widely used in horticulture (Figure 3.3). Although the effects of other seed predators in the UK (e.g. insects and mammals) are negligible (Robinson 1997), this mesh allowed other seed predators access so that only birds were excluded. Three nets were constructed at each site and the protected area under each net measured 25x1.5m. At the end of January 2006, the areas beneath the exclusion nets were sampled. From under each net, three Vortex samples, 3x 0.25m2 quadrats of vegetation and 3x soil samples (the top 1cm of soil from an area 20cm2) were taken. The same samples were taken from a nearby strip within the coppice with a similar vegetation composition from which
birds had not been excluded. All seeds were separated from the samples, air-dried and weighed. Data were transformed where appropriate and comparisons made using t-tests.
Figure 3.3 Exclusion nets at Glynllifon College (top), Hayscastle Farm (middle) and Oakwood (bottom).
36

37
3.3 Results 3.2.4 Bird condition At the Hayscastle site, birds were caught by mist-net during the seed sampling period (early September until mid January). Three 18m 4 shelf mist nets were erected within the SRC. All birds caught were identified and marked with aluminium (BTO) rings. Each individual was given a tracheal pit score (TPS) and pectoral muscle score (PMS) recorded for consistency by a single recorder (D. Fry). These scores reflect levels of fat and muscle protein reserves. These have a bearing on a bird’s future survival prospects and can provide information about the health or ‘condition’ of a population. TPS is a measure of the amount of fat deposited in the tracheal pit. This reserve is directly proportional to the total body fat carried by the bird (Redfern and Clark 2001). Fat, as the primary energy reserve fluctuates and typically increases throughout the day in non-migrating diurnal birds and may determine the bird’s chances of survival. The scoring system was a modified version of the Biometrics Working Group of the BTO Ringing Committee (BWG) system (Redfern and Clark 2001). Pectoral muscle may also be used as a fuel under certain conditions and is therefore another valuable indicator of body condition. Score classes were those used in the BTO Ringer’s Manual (Redfern and Clark 2001).
3.3.1 Seed production From late September to early January, Hayscastle produced an average of 0.28kg of seed per m2. The standing seed, on vegetation, peaked in October while the ground seed (from the Vortis sampling) peaked in November (Figure 3.4). For the same period, Glynllifon produced 0.39kg/m2, the unshed seed peaking again in October while the ground seed peaked in November (Figure 3.4). Oakwood produced 0.02kg/m2. Both seed surveys at this site showed that peaks were occurring as sampling began in September or had already finished (Figure 34). Calorific values are given in Table 3.1. Based on these figures, in terms of seed, Glynllifon produced an average 7.15 MJ/m2 (min: 5.94, max: 8.12) of energy, Hayscastle 5.13 (min: 4.26, max: 5.82) and Oakwood 0.37 (min: 0.3, max: 0.39). Young SRC sites in Wales might therefore be expected to produce an average of 4.21 MJ of energy per m2 in terms of seed production.
Table 3.1 Calorific values of seeds collected from four SRC fields across Wales. Species Mean energy content
(MJ/kg) of seed Range of energy content (MJ/kg)
of seed Cirsium spp 19.82 19.73-20.79 Chenopodium album 18.85 18.33-19.31 Rumex spp 17.50 16.99-18.03 Alopecurus geniculatus 17.23 16.94-17.58 Persicaria hydropiper 16.72 15.01-18.06 Persicaria maculosa 16.60 15.21-17.56

3.3.2 Bird and seed abundance There is a big discrepancy in the total volume of seed collected by the two sample techniques (Figure 3.4), with collection from the plant revealing a greater quantity of seed. The Vortis sampling revealed a peak in seed abundance shortly after the peak shown by vegetation sampling. This reflects the time of seed shed when the majority become available to the birds. Bird abundance appeared to peak around this time. As the resource was depleted, the bird numbers declined at Glynllifon and Cilgoed (Figure 3.4). Twenty-one of the 35 bird species recorded were granivorous (60%) but at the majority of sites, it was a greater proportion than this (Table 3.2). The two lowland Pembrokeshire sites (Hayscastle and Oakwood) had the highest species counts (22 at each) while the upland site at the greatest elevation (Ceryfed) had the lowest (13).
Hayscastle Farm Glynllifon College
0102030405060708090
100
September October November December January
See
d ab
unda
nce
Vegetation Vortis
0123456789
September October November December January
Vegetation Vortis
See
d ab
unda
nce
0
10
20
30
40
50
60
70
September October November December January
Bir
d ab
unda
nce
All birds Granivorous birds
0
50
100
150
200
250
September October November December January
All birds Granivorous birds
ndan
ce a
buBi
rd
Oakwood Cilgoed
0
50
100
150
200
250
September October November December January
Bir
d ab
unda
nce
All birds Granivorous birds
00.5
11.5
22.5
33.5
44.5
5
September October November December January
Vegetation Vortis
See
d ab
unda
nce
0
10
20
30
40
50
60
70
80
September October November December January
Bir
d ab
undn
ace
All birds Granivorous birds
0
100
200
300
400
500
600
September October November December January
All birds Granivorous birds
Bir
d ab
unda
nce
38
Figure 3.4 Comparing peak seed abundance (kg/m2) with the bird abundance (mean no per visit) at 4 of the sites. Note different scales on the y-axis and that vegetation sample data are not available for Cilgoed.

Table 3.2 List of winter bird species recorded at the six sites. Bodorgan Hayscastle Oakwood Glynllifon Ceryfed Cilgoed Granivorous species Blackbird * * * * * * Blue tit * * * * * * Bullfinch * * * Chaffinch * * * * * * Coal tit * Dunnock * * * * * * Fieldfare * * * Goldfinch * * Great tit * * * * * Greenfinch * * * * * Linnet * * Pheasant * * * Redpoll * * * Redwing * * Reedbunting * * * * * Robin * * * * * * Song thrush * * * Starling * * * Willow tit * Woodpigeon * * * * * Yellowhammer * Other species Buzzard * * * Crow * * * Goldcrest * * * Great spotted woodpecker * Jay * * * Lesser spotted woodpecker * Long-tailed tit * * * Magpie * Rook * * Snipe * * Sparrowhawk * * * Stonechat * * Woodcock * Wren * * * * * * No of species 16 22 22 19 13 19 No of granivorous species 13 15 15 11 10 14 Percentage of granivorous species 81% 68% 68% 58% 77% 74%
39

3.3.3 Exclusion nets At all three sites where exclusion nets were used, less seed was found outside the nets than inside the nets (Figure 3.5). This was significant for the Vortis sampling and in the soil at Glynllifon (Table 3.3). There were no significant differences found at the other sites when tested individually, but when all sites were combined, the Vortis sampling showed significantly less seed outside the nets (p=0.021). The large confidence intervals (Figure 3.5) are due to the patchy nature of the seeds. For the Vortis sampling, the confidence limits were much smaller outside the net.
0
0.2
0.4
0.6
0.8
1
1.2
1.4
1.6
1.8
Glyllifon Oakwood Hayscastle
g/m
-2
Inside Outside
0
10
20
30
40
50
60
70
80
90
Glyllifon Oakwood Hayscastle
g/m
-2
0
10
20
30
40
50
60
Glyllifon Oakwood Hayscastle
g/m
-2
Figure 3.5 Average weights (g/m2) for Vortis, vegetation and soil samples (with 95% confidence intervals).
40

41
Table 3.3 Results from 2-sample t-tests comparing inside and outside the exclusion nets. Soil Vegetation Vortis Glynliffon 0.003** 0.319 0.012* Oakwood 0.762 0.456 0.617 Hayscastle
Abundance of Cirsium spp was positively correlated with Chaffinch abundance. Both Cerastium and Rumex spp were positively correlated with Redpoll abundance while Fumaria officinalis and Stellaria media were negatively correlated (Table 3.4).
0.866 0.068 0.329 * Significantly different ** Highly significantly different
Table 3.4 Results of multiple linear regression analysis for 5 bird species surveyed on six SRC sites over 2 winters in Wales where weed species were also investigated. Significant associations are shown in bold. Direction of association (+ or -) between the predictor variable occurrence (% cover) and bird abundance are given. Bird species
Weed species Blackbird Chaffinch Greenfinch Redpoll Reed bunting Cerastium spp 0.671 0.185 0.630 0.025 (+) 0.651 Chenopodium album 0.743 0.802 0.789 0.143 0.804 Cirsium spp 0.311 0.039 (+) 0.370 0.664 0.412 Fumaria officinalis 0.717 0.55 0.826 0.040 (-) 0.831 Poa annua 0.746 0.727 0.770 0.098 0.781 Polygonum spp 0.315 0.142 0.771 0.154 0.829 Rumex spp 0.773 0.627 0.849 0.038 (+) 0.858 Senecio spp 0.640 0.513 0.886 0.351 0.899 Stellaria media 0.918 0.627 0.843 0.046 (-) 0.856

3.3.4 Seed abundance and bird condition As pectoral muscle (PMS) was lost, the birds increased their fat reserves (TPS) (Figure 3.6). The fat reserves increased rapidly at the same time as the available seed peaks (as the vegetation sample drops and the Vortis sample increases (Figure 3.6). There is a strong negative correlation between the seed abundance (vegetation samples) and TPS (r2=-0.900 p=0.037).
0
1
2
3
4
5
6
7
8
9
September October November December January
See
d ab
unda
nce
Vegetation Vortis
0
0.5
1
1.5
2
2.5
3
3.5
September October November December January
Cond
ition
sco
re
TPS PMS
Figure 3.6 Trends in the seed abundance (kg/m2) and the condition scores (TPS = Tracheal Pit Score and PMS = Pectoral Muscle Score) of birds caught at Hayscastle.
42

43
3.4 Discussion This study shows that young SRC fields in Wales have the potential to produce substantial amounts of weed seeds that can be utilised by many bird species. The seeds are generally high in energy value, detectable and accessible to a range of species. The perceived predator risk is low enough to enable foraging and is likely to decline for many species as the weeds provide shelter (Whittington and Evans 2004) and the willow itself provides watch posts and additional shelter that is not generally available in managed grassland. Substantial amounts of seed were produced by the young SRC fields and all the seeds of the weed species tested had high calorific values. Winter seed is a resource that has been reduced across the UK during the last 3-4 decades, particularly in grassland-dominated areas like Wales (Vickery et al. 2001). Grazed grass fields are generally avoided by granivorous species (Wilson et al. 1996b because they no longer provide any seed resources for this guild (Vickery et al. 2001). The timing of peak seed production and the total seed production was highly variable between sites and this is consistent with other studies (Westerman et al. 2003). The lowland sites on the west coast (Glynllifon and Hayscastle, Figure 3.1) shed seed slightly earlier than the upland site (Cilgoed), although, the period of seed shed seemed to last slightly longer at the later site. The Oakwood site produced the smallest amounts of seed and the data show that the majority had been shed by October. This site received the most aggressive management regime towards weed species which may be the cause of this effect. There was a big discrepancy between the volume of seed collected by the two sample techniques suggesting a rapid
depletion of seeds as they ripen on the plant and then fall to the ground. In other agro ecosystems, high consumption rates by a variety of seed-eating animals over short periods have been recorded (Burst and House 1988, Povey et al. 1993, Cardina et al. 1996, Anderson 1998, Tooley et al. 1999, Manalled et al. 2000, Westerman et al. 2003,). This study showed that in this habitat, it is the birds that are the biggest seed predators. The majority of the birds recorded were granivorous and their numbers increased shortly after the time of seed shed at every site. In addition, at the end of the winter, there was significantly more seed remaining in areas from which birds were excluded i.e. under the nets. This pattern showed up particularly well at Glynllifon, which produced the greatest volume of seed. At this site, there was also significantly less seed in the soil where birds had been feeding so the birds had significantly reduced the seed being recruited back into the soil seed bank. It has been shown previously in non-agricultural ecosystems that seed predation is an important factor limiting the population expansion of plants (Reichman 1979, Marone et al. 1998, Alignier et al. 2008). The results of the exclusion net experiment had large confidence intervals and ideally, greater numbers of samples need to be taken to reduce these. Seed sampling is an intensive activity and this sampling regime provides a standardised measure of seed abundance (Benoit et al. 1989). The amount of seed collected was always much less variable outside the nets suggesting that the patchiness is reduced by feeding, lending further weight to the idea that birds act as a very efficient weed control in this crop. From the presence of some weed species, it was possible to predict bird species abundance. In this study,

Cirsium species were associated with the presence of Chaffinches and Cerastium and Rumex species with Redpoll. The small number of field sites limited the number of weed and bird species that could be analysed and the patterns that could be extracted. In the field, it was observed that goldfinches were particularly associated with standing Cirsium species, feeding on the seeds directly from the plant. Once the plants started to die back and collapse, ground foragers such as Blackbird, Redwing and other thrushes seemed to move in. These associations merit further investigation as there may be many such interactions between other species. At Hayscastle, the birds tracheal pit score (TPS or ‘fat score’) increased during the period of seed shed. This is when the greatest abundance of seed is available but as time goes on and seed abundance depletes, the predictability of that food supply decreases. The birds are adjusting their fat reserves in direct response to the changing food supply. There are no other sources of seed in the landscape around this site other than perhaps some garden feeders. This would suggest that the birds are relying directly on the seed provided within the SRC. If agricultural practices can advance weed morphology and cause early seed shed (Westerman et al. 2003) the opposite should also be true. Management that leads to later seed shed could extend the availability of seeds further into the winter and have a significant impact on granivorous bird populations. Because weed species vary so much in the times at which they set seed, a greater diversity of weed species may increase the longevity of this resource.
Implications and suggestions for further research This study has shown that young SRC sites can significantly increase the amount of winter seed in the Welsh landscape and provides compelling evidence that the resource is available to a range of bird species. This resource is non-renewable however, as most plants only set seed prior to the onset of winter (Grime et al. 1989). Sympathetic management should aim to maximise the diversity of weed species and extend the period of seed shed. Associations between specific bird species and the availability of seeds to them merits further investigation. This would allow targeted management to maximise the benefit to local bird populations and conserve those species most at risk. Section 2 showed the sites becoming increasingly similar over time in terms of weed composition and the annuals (the most important group for the granivorous guild of birds), becoming scarce. The benefits of these weed species to birds is therefore likely to be short-lived. The investigation in the following section explores if birds utilise SRC out of the winter season and older more weed free coppice.
44

Section 4: Bird diversity and abundance in SRC in Wales
Summary The use of agricultural chemicals has negatively affected bird populations indirectly by reducing insect availability and abundance. SRC, by virtue of its nature and structure, requires far fewer chemical applications than other current farming practices in Wales and enlarges non-cropped areas important for insect populations. This study set out to describe the bird populations of SRC in Wales during the winter but particularly the breeding season in a range of coppice ages. This was achieved by using eight SRC fields distributed across Wales and a mixture of breeding and winter bird surveys and mist netting studies. In the young plots, 35 species were recorded during the winter surveys and 46 during the breeding surveys. Young SRC in the winter was characterised by large flocks of mixed finches, but also including Reed buntings and thrushes such as Redwing and Song thrush. Finches were still a diverse group during the breeding season in young coppice but far less abundant. Other groups
characteristic of the SRC at this time were warblers, tits, thrushes and starlings, all of which were present in reasonable numbers. As the SRC matured breeding bird numbers increased particularly warbler species. Five species were confirmed to be nesting within the older SRC; Blackbird, Song thrush, Redpoll, Goldfinch and Willow warbler (only Skylark nested in the young crop). The increase in nesting birds was accompanied with an increase in corvid numbers. A total of fifty-one species were recorded overall from the SRC plots in both young and established SRC during the breeding bird surveys. Willow warblers were the most abundant species in mature SRC. Young SRC provides winter forage for large numbers of finches but also for Reedbuntings and thrushes. As it matures, SRC becomes valuable habitat for nesting, feeding and post breeding juvenile dispersal for warblers, finches and thrushes in particular. Maintaining a mix of coppice age will maximise the benefits to the widest range of bird species.
45

4.1 Introduction Many farmland birds in western Europe have suffered severe population declines since the 1970s (Tucker and Heath 1994, Fuller et al. 1995, Siriwardena et al. 1998, Donald et al. 2001), probably caused by agricultural intensification (Krebs et al. 1999, Aebischer et al. 2000, Chamberlain et al. 2000, Chamberlain and Fuller 2000, Benton et al. 2002, Donald et al. 2006). The use of agricultural chemicals affects bird populations both directly, causing bird mortality (Carson 1962, Mineau 2002) and indirectly, reducing bird food resources (both seed (Section 3) and insects Figure 4.1). Insect abundance is reduced by both herbicide (Freemark and Boutin 1995, Taylor et al. 2006) and pesticide (Pimentel et al. 1992, McLaughlin and Mineau 1995, Cambell et al. 1997, Wilson and Tisdell 2001, Boatman 2004) application and impacts on bird populations, many of which feed largely on insects during the breeding season. The cost of reduced insect abundance can be immediate (through chick starvation or smaller clutches) or delayed (slower growth, reduced over winter survival of both juveniles and adults, reduced fecundity the following year) (Homes 1995, Peach et al. 1999, Siriwardena et al. 2000). Reduced availability of invertebrate prey for chicks has been implicated in the declines of Grey partridge (Southwood and Cross 1969, Green 1984, Potts 1986), Skylark (Poulsen et al. 1998), Corn bunting (Brickle et al. 2000), a number of hirundines (Byrant 1973, 1975, Turner 1980, Johnston 1990) Lapwing (Johansson and Blomqvist 1996, Blomqvist and Johansson 1995), Linnet (Moorcroft et al. 2006) and Yellowhammer (Hinsley 2000, Morris et al. 2001, Hart et al. 2006). On a farm scale, comparison of organically (no chemical input) or extensively (reduced chemical input) managed farms and conventional farms
(high chemical input) often indicates an increased bird diversity or greater productivity in the organic and lower input systems (Wilson et al. 1997, Christensen et al. 1996, Freemark and Kirk 2001, Stoate et al. 2001, Beecher et al. 2002, Wolff et al. 2001, Barnett et al. 2004, Bradbury et al. 2008). SRC, by virtue of its nature and structure, requires far fewer chemical applications than other current farming practices, both arable and pastoral (Ledin 1998, Perttu 1998, Ranney and Mann 1994). In addition, non-cropped areas, known to be important for both insects (Meek et al. 2002) and birds (Fuller et al. 2004) are larger and less intensively managed than current farming practices. High bird diversity and density have been recorded in SRC in the UK (Kavanagh 1990, Sage and Robertson 1996, Sage and Tucker 1998a, Coates and Say 1999). Consistently greater bird diversity has been recorded in SRC compared to existing farmland habitat (Sage et al. 2006, Goransson 1990, 1994, Berg 2002) both in summer and winter (Sage, Cunningham and Boatman 2006). In the spring they are thought to be
Figure 4.1 Sawfly (Climbex sp) larvae feeding on SRC.
46

predominantly attracted by the substantial insect abundance (Sage and Tucker 1997). Biomass crops in the UK are thought to lack nesting opportunities for song birds (Sage et al. 2006). Large densities of nesting birds have been recorded in pre-commercial sites however (Sage et al. 2006). Dhont et al. (2004), in the US also found that a high proportion of the birds recorded regularly using SRC were actually breeding within the plots (at least 21 of 39). In larger, commercially managed plots the interior contained fewer birds than the edge zone (<50m) (Sage et al. 2006). Age classes and growth stages of SRC affect which nesting birds are recorded (Goransson 1994, Sage and Robinson 1996, Sage et al. 2006, Dhont et al. 2007). In Sweden, Whitethroats and Whinchat preferred the sprouts of the recently harvested areas while Willow warbler and Garden warblers preferred the fully grown bushes preceding the harvest (Goransson 1994). Dhont et al. (2004) found that birds constructed nests highly non-randomly in respect to willow clone. The clones used for SRC can vary quite markedly in terms of structure and this may have been what drove the preferences. SRC has been found to provide excellent winter cover for game birds (Baxter et al. 1996, Sage and Robertson 1994), particularly Pheasant (Figure 4.2), Partridge (Goransson 1990, Sage and Robinson 1994, Baxter et al. 1996, Berg 2002) and Snipe (Sage et al. 2006). Habitats managed for game birds have been shown to greatly benefit songbirds including several threatened species (Parish and Sotherton 2004). SRC could provide suitable cover for holding game birds during the winter shooting season and at the same time benefit threatened song bird populations.
The benefits of SRC are strongly influenced by the landscape into which it is introduced and the land use it replaces (Christian et al. 1994, Perttu 1995, Tolbert and Wright 1998, Coates and Say 1999, Starback and Becht 2005, Anderson and Fergusson 2006, Rowe et al. 2007). For highly mobile animals such as birds, landscape composition plays a central role in determining occupancy of plantations (Christian et al. 1998) and adjacent habitats have a strong influence on the bird community composition in SRC (Berg 2002). Most studies relating agricultural intensification with population declines of farmland birds are from the UK (Ormerod and Watkinson 2000) and many suggested strategies for the conservation of farmland biodiversity are based on the situation in the UK (Aebischer et al. 2000, Vickery et al. 2004. However, the agricultural landscape across the UK varies greatly. The late 1940s saw the agricultural landscape become increasingly polarized, and arable systems now predominate in the east of Britain and pasture-based farming in the west (Stoate 1995, Robinson and Sutherland 2002, Shrubb 2003 and see Section 1 Figure 1.3).
Figure 4.2 Pheasant (Phasianus colchicus) foot prints in sand traps in the SRC at Bodorgan Estate.
47

An overview of agricultural research papers published in the UK reveals a geographical bias. The majority of studies (70%) conducted within the UK are in England or the UK (Figure 4.3). Most studies conducted under the UK umbrella are predominantly conducted in England. The geographical bias of the UK literature reflects a bias in the agricultural habitat being studied. The majority of recent, relevant, research has focused on arable farming systems (Aebischer et al. 2000, Vickery et al. 2001) even though grassland accounts for almost 60% of agricultural land in Britain (National Statistics and Defra 2007, Figure 4.4). Increased research activity into SRC in grassland farming systems seems warranted.
This study first describes the bird populations using young SRC during the winter and breeding season, then secondly compares breeding bird communities of young and established SRC. A mist netting study of a mature SRC site over a full year is also described.
Papers published (n=417)
05
10152025303540
UK England Scotland Ireland Wales
Per
cent
age
of to
tal
Figure 4.3 The percentage of published papers referring to the UK and constituent countries (Ireland and Northern Ireland are combined) within European agricultural research (defined as any paper containing the word ‘Europe’ and ‘farmland’ or ‘agriculture’ and related synonyms in the title, keywords or abstract) listed by the ISI database, 1997-2006.
Figure 4.4 Sheep grazing - the dominant land use in Wales.
48

4.2 Methods
4.2.1 Birds of young SRC Breeding bird surveys (BBS) were conducted at seven sites (1-7) in year 1 and six sites (1-6) in year 2 of planting SRC. Each BBS consisted of two visits, one ‘early’ transect count (early April – mid May) and one ‘late’ transect count (mid May – late June). The visits were made at least 4 weeks apart. The first visit coincided with the main activity period of the resident breeding birds, while the second took place after the arrival of the latest migrant breeding birds. Winter bird surveys (WBS) were also conducted at the same sites in year 1 and 2 of planting. At least 2 visits were made between October and January. At each visit, transects were walked around the fields perimeter and through the field in order to flush all birds within the crop (Wilson, Taylor and Muirhead 1996, Perkins et al. 2000, Whittingham et al. 2006). All birds flushed in this manner were recorded. Care was taken to avoid double counting through observation of movements of previously flushed individuals. Census periods avoided wet and windy weather, which is known to affect bird activity. All counts began within 1 hour of dawn. These surveys were all conducted on sites less than 2 years old and are referred to as ‘young’ plots throughout this Chapter. The bird communities using the young plots in the winter and breeding season are compared.
4.2.2 Breeding birds The BBS were repeated at three of the sites, Bogorgan Estate, Hayscastle Farm and Oakwood (sites 1, 5 and 6), once they reached 3 years old. These plots are referred to as ‘established’ plots
throughout this Chapter. Breeding birds of young and established coppice are compared for these three sites.
4.2.3 Birds of mature SRC HH is a small area (1.1ha) of SRC planted in 1999. It is in its 2nd year of the second rotation (harvested once in 2003). It will be referred to as a ‘mature’ plot throughout this section. This site was operated as a constant effort mist netting site (CE site). Three 18m 4 shelf mist nets were erected within the SRC (Figure 4.5). They were opened for 2 hours, 1 hour within sun rise, once a week from March 2005 to April 2006. All caught birds were identified and marked with aluminium (BTO) rings. Additional small netting studies have been taking place in some of the sites over the years and the species caught in these were added to the overall species lists.
49
Figure 4.5 Mist net at Hundred House

4.3 Results A total of 61 species were recorded in the SRC plots all together (Table 4.1). In the young plots, 35 species were recorded during the winter surveys (Section 4, Appendix II). Three species were recorded in the SRC during the WBS only; Reed buntings, Starlings and Pheasants. The most diverse groups were the finches (6 species), thrushes (5 species) and tits (6 species) (Figure 4.6a). The most abundant group were the finches, which were present in large flocks (Figure 4.6b). Other groups more abundant during the WBS were accentors, birds of prey, pigeons and doves, thrushes, tits, waders and wrens (Figure 4.6b). The waders were
predominantly made up of Snipe but also included Woodcock. A total of 46 species were recorded in the young SRC during the breeding bird surveys. Six groups recorded in the SRC were only present in the BBS; these were the gulls, larks, pigeons and doves, sparrows, Swallows and Swifts and warblers (Figure 4.6). The most diverse groups were the finches (5 species), thrushes (5 species), tits (4 species) and warblers (5 species). These were also the most abundant groups along with Starlings (Figure 4.6b). The only species found to be nesting in the young coppice were skylarks.
Table 4.1 Bird species caught or recorded in the surveys during the breeding season (April-Sept), winter (Oct-March) and both periods. * Species confirmed to be nesting in the SRC. Breeding season only (20 species)
Winter season only (15 species)
Caught in both seasons (25 species)
Barn owl Fieldfare Blackbird* Blackcap Goldcrest Blue tit Chiffchaff Greenfinch Bullfinch Curlew Herring gull Buzzard Garden warbler Lesser spotted woodpecker Chaffinch Grasshopper warbler Linnet Coal tit House sparrow Meadow pipit Crow Jackdaw Redwing Dunnock Kestrel Reedbunting Goldfinch* Mistle thrush Siberian chiffchaff Great tit Pied wagtail Snipe Great spotted woodpecker Redstart Starling Jay Sedge warbler Stonechat Long-tailed tit Siskin Willow tit Magpie Skylark* Woodcock Marsh tit Swallow Nuthatch Swift Pheasant Treecreeper Redpoll* Tree pipit Robin Whitethroat Rook Willow warbler* Song thrush* Sparrowhawk Woodpigoen
50
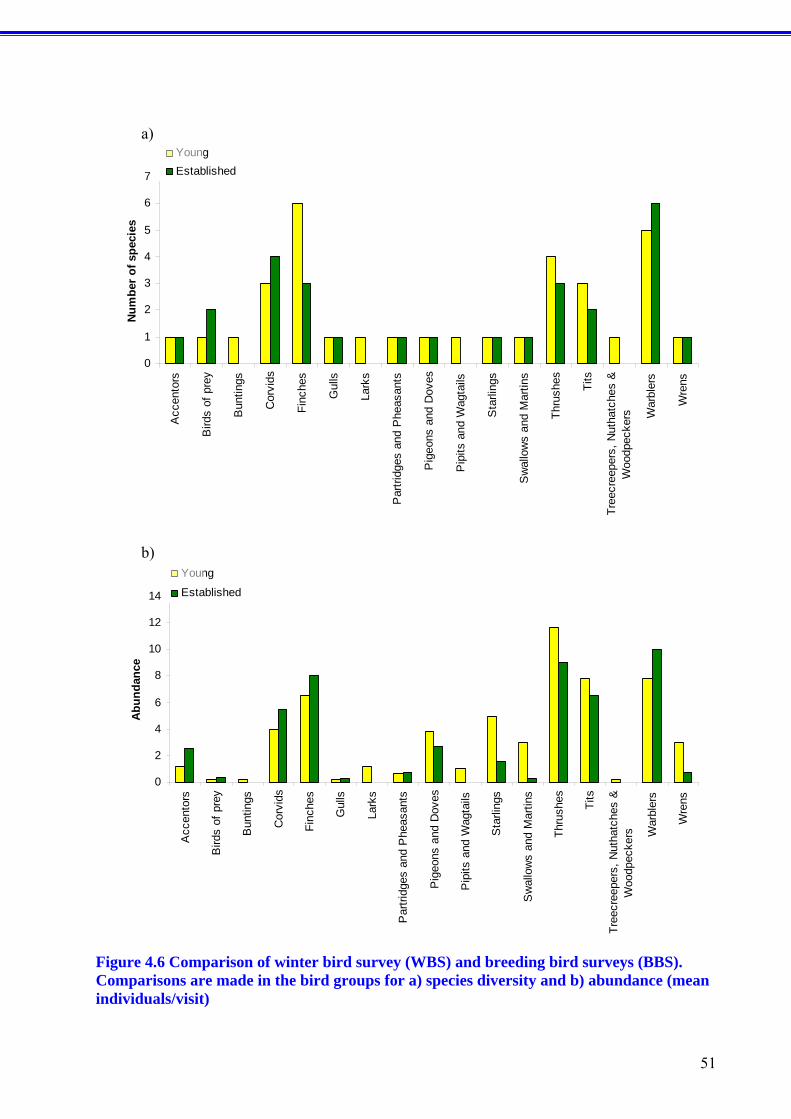
51
0
1
2
3
4
5
6
7A
ccen
tors
Bird
s of
pre
y
Bun
tings
Cor
vids
Finc
hes
Gul
ls
Lark
s
Par
tridg
es a
nd P
heas
ants
Pig
eons
and
Dov
es
Pip
its a
nd W
agta
ils
Sta
rling
s
Sw
allo
ws
and
Mar
tins
Thru
shes Tits
Tree
cree
pers
, Nut
hatc
hes
&W
oodp
ecke
rs War
bler
s
Wre
ns
Num
ber o
f spe
cies
YoungEstablished
0
2
4
6
8
10
12
14
Acc
ento
rs
Bird
s of
pre
y
Bun
tings
Cor
vids
Finc
hes
Gul
ls
Lark
s
Par
tridg
es a
nd P
heas
ants
Pig
eons
and
Dov
es
Pip
its a
nd W
agta
ils
Sta
rling
s
Sw
allo
ws
and
Mar
tins
Thru
shes Tits
Tree
cree
pers
, Nut
hatc
hes
&W
oodp
ecke
rs War
bler
s
Wre
ns
Abu
ndan
ce
Young
Established
a)
b)
Figure 4.6 Comparison of winter bird survey (WBS) and breeding bird surveys (BBS). Comparisons are made in the bird groups for a) species diversity and b) abundance (mean individuals/visit)

4.3.3 Birds of mature SRC There were 2 peaks in bird abundance within the mature crop at Hundred House (Figure 4.7). One peak occurred at the end of March into April and then dropped off again in August. The second peak occurred in winter, October to December. From Figure 4.7 it is apparent that very different groups of birds caused the peaks in abundance. The peak during the breeding season was caused predominantly by migrant Phylloscopus species but also by resident Parus species (Figure 4.8). The winter peak was caused by a further increase in Parus species but mainly the Aegithalos or Long-tailed tits. Willow warblers were the most commonly occurring species in the mature SRC. Of the warblers, Garden warbler numbers peaked just after the
Willow warblers (Figure 4.9a). Small numbers of Chiffchaffs were recorded as late as October and Goldcrests continued to be caught throughout the winter, usually with the Long-tailed tit flocks. The Long-tailed tits were the most abundant species in late winter when little else was being caught (Figure 4.9b). Blue tits were also common in the winter but more so in the early winter. Blue tits and Great tits were the most abundant Parus species throughout the breeding season. Finches were very sparse (Figure 4.9c) particularly in consideration of how numerous they were in both the young and established SRC (Figure 4.6). Thrushes were present in low numbers throughout the year (Figure 4.9d). Small numbers of Wrens were caught from June to January (Figure 4.9e).
0
1
2
3
4
5
6
Mar
ch
Apr
il
May
June
July
Aug
ust
Sep
tem
ber
Oct
ober
Nov
embe
r
Dec
embe
r
Janu
ary
Febr
uary
Mar
ch
Apr
il
Capt
ures
/hou
r
Figure 4.7 Mean bird abundance recorded in the mature SRC at Hundred House (March 2005 to April 2006)
52
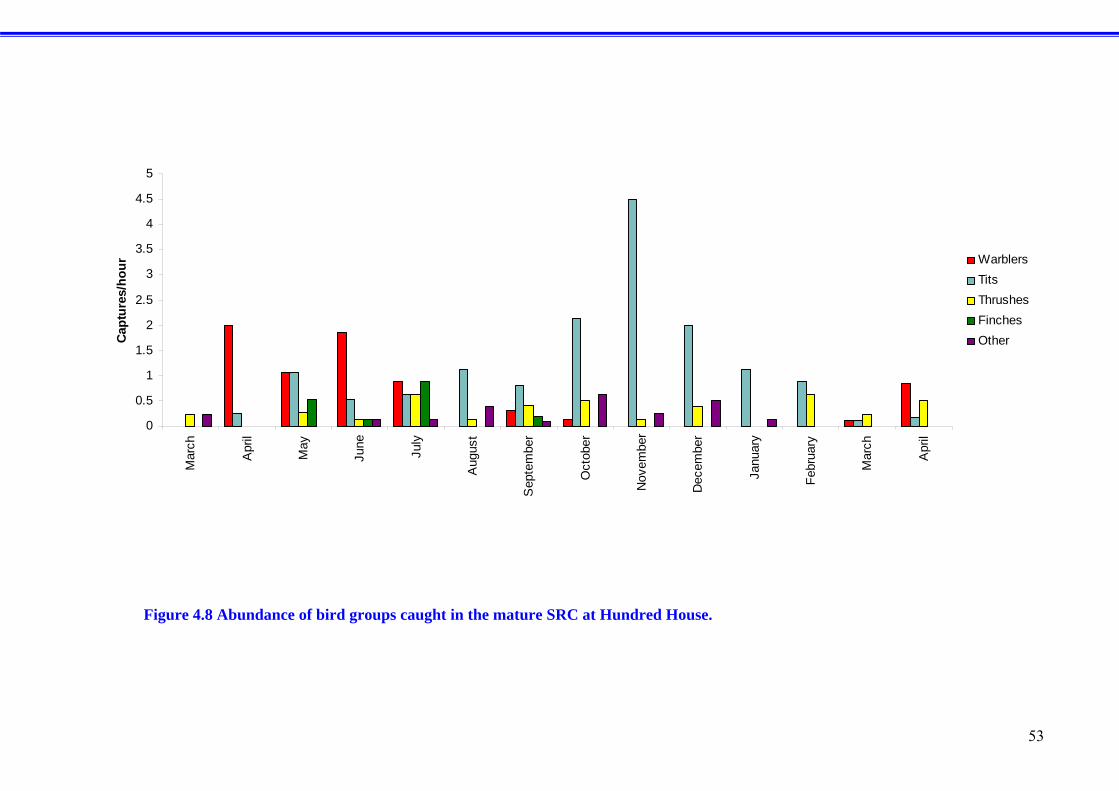
0
0.5
1
1.5
2
2.5
3
3.5
4
4.5
5M
arch
Apr
il
May
June
July
Aug
ust
Sep
tem
ber
Oct
ober
Nov
embe
r
Dec
embe
r
Janu
ary
Febr
uary
Mar
ch
Apr
il
Capt
ures
/hou
r WarblersTitsThrushesFinchesOther
Figure 4.8 Abundance of bird groups caught in the mature SRC at Hundred House.
53

Warblers
0
0.5
1
1.5
2
2.5
Mar
ch
Apr
il
May
June
July
Aug
ust
Sep
tem
ber
Oct
ober
Nov
embe
r
Dec
embe
r
Janu
ary
Febr
uary
Mar
ch
Apr
il
Capt
ures
/hou
r
BlackcapGarden warblerChiffchaffWillow warbler
a)
Tits
0
0.5
1
1.5
2
2.5
Mar
ch
Apr
il
May
June
July
Aug
ust
Sep
tem
ber
Oct
ober
Nov
embe
r
Dec
embe
r
Janu
ary
Febr
uary
Mar
ch
Apr
il
Capt
ures
/hou
r Blue titCoal titGreat titMarsh titLong-tailed tit
b)
Thrushes
0
0.5
1
1.5
2
2.5
Mar
ch
Apr
il
May
June
July
Aug
ust
Sep
tem
ber
Oct
ober
Nov
embe
r
Dec
embe
r
Janu
ary
Febr
uary
Mar
ch
Apr
il
Cap
ture
s/ho
ur BlackbirdRedstartRobinRedwingSong thrush
c)
Finches
0
0.5
1
1.5
2
2.5
Mar
ch
Apr
il
May
June
July
Aug
ust
Sep
tem
ber
Oct
ober
Nov
embe
r
Dec
embe
r
Janu
ary
Febr
uary
Mar
ch
Apr
il
Capt
ures
/hou
r
BullfinchChaffinchRedpoll
d)
Other
0
0.5
1
1.5
2
2.5
Mar
ch
Apr
il
May
June
July
Aug
ust
Sep
tem
ber
Oct
ober
Nov
embe
r
Dec
embe
r
Janu
ary
Febr
uary
Mar
ch
Apr
il
Capt
ures
/hou
r
GolcrestWrenDunnockTreecreeper
e)
Figure 4.9 Mean abundance each month of species caught in the mature SRC at Hundred House in the bird groups; warblers, tits, thrushes, finches and other.
54

4.4 Discussion This study showed that young SRC fields in Wales provide useful habitat for birds during the breeding season as well as the winter. As the crop matures the bird community changed but in particular, increasing numbers of warblers were recorded utilising the crop. These results are consistent with previous studies conducted on bird communities of SRC. Finches were by far the most abundant group in the young coppice during the winter but there were also other species of conservation concern recorded utilising the SRC at this time, such as Red listed Reed bunting and Song thrush. Snipe have previously been reported roosting in SRC (Sage and Tucker 1998b) and in this study large numbers of Snipe were recorded from one site in particular providing supporting evidence that SRC could be a useful game cover crop during the winter. These results again highlight the benefit of young weedy coppice to winter birds. Fifty one species were recorded during the breeding bird surveys in this study compared to 30 species recorded in a previous study conducted in England on SRC planted on ex-grassland (Cunningham et al. 2006). Sage et al. 2006 suggest there is a lack of nesting opportunity within SRC itself. During this study several species were found to be nesting within the older SRC, a mixture of canopy (Blackbird, Song thrush, Goldfinch and Redpoll) and ground nesters (Willow warbler). Previous studies have shown birds nesting within SRC show preference for the edge of the coppice and weedy plots (Sage et al. 2006). The mature site (Hundred House) is small and could be regarded as being all edge. However it is not very weedy within the SRC at this site, the old coppice having shaded out
much of the ground flora. There were undoubtedly more individuals nesting in surrounding habitats, hedgerows, gorse patches and old trees and then feeding within the SRC. But this plot showed great potential as a breeding habitat for a wide range of species. The increase in corvid abundance in established SRC is probably a direct response to the level of breeding birds. Corvids can be major predators of breeding passerine nests, particularly Magpies and Jays (Groom 1993, Roos 2002, Barkow 2005, Stevens et al. 2008), which were regularly recorded within the SRC. SRC may also be valuable as a post breeding dispersal habitat for juveniles. Many juveniles move into scrubby habitats after fledging as it offers, as well as abundant insects, structural heterogeneity and cover from potential predators (Gillings et al. 1998, Gillings and Fuller 1998). The mist netting studies only added a few extra species but it did add a British rarity to the list (Siberian Chiffchaff). We also caught several woodland bird species which were not expected to be present in SRC. Species such as Nuthatch and Treecreeper were caught on several occasions and Great and Lesser spotted Woodpecker were also recorded actually within the coppice. Bird surveys are perhaps not as good at picking these species up, particularly in the winter when they are not singing and not as obvious as the flocking species. In addition, these species are not generally expected to be in SRC (Berg 2002) and this could bias some observers. Fuller and Henderson (1992) suggested that a mix of woodland ages would benefit woodland birds and SRC provides a mix of young and old coppice which could compliment older woodlands. I tentatively suggest that SRC may be better for bird species associated with older woodland than previously thought.
55

56
Implications and suggestions for further research Many of the findings support those of previous studies. SRC provides a relatively semi-natural habitat that benefits many bird species. Maintaining a mix of coppice age will maximise the benefits to the widest range of bird species. Willow warblers were the most numerous species recorded during the breeding season (April-June 2005) in the mature SRC. Other studies have demonstrated a greater density of Willow warblers in SRC compared to both arable land (Cunningham et al. 2004b) and grassland (Cunningham et al. 2006). The commercial cropping of SRC in Wales may provide a useful habitat for this declining species. Further investigation is needed to establish exactly how this species utilises this crop compared to other alternatives in the landscape.
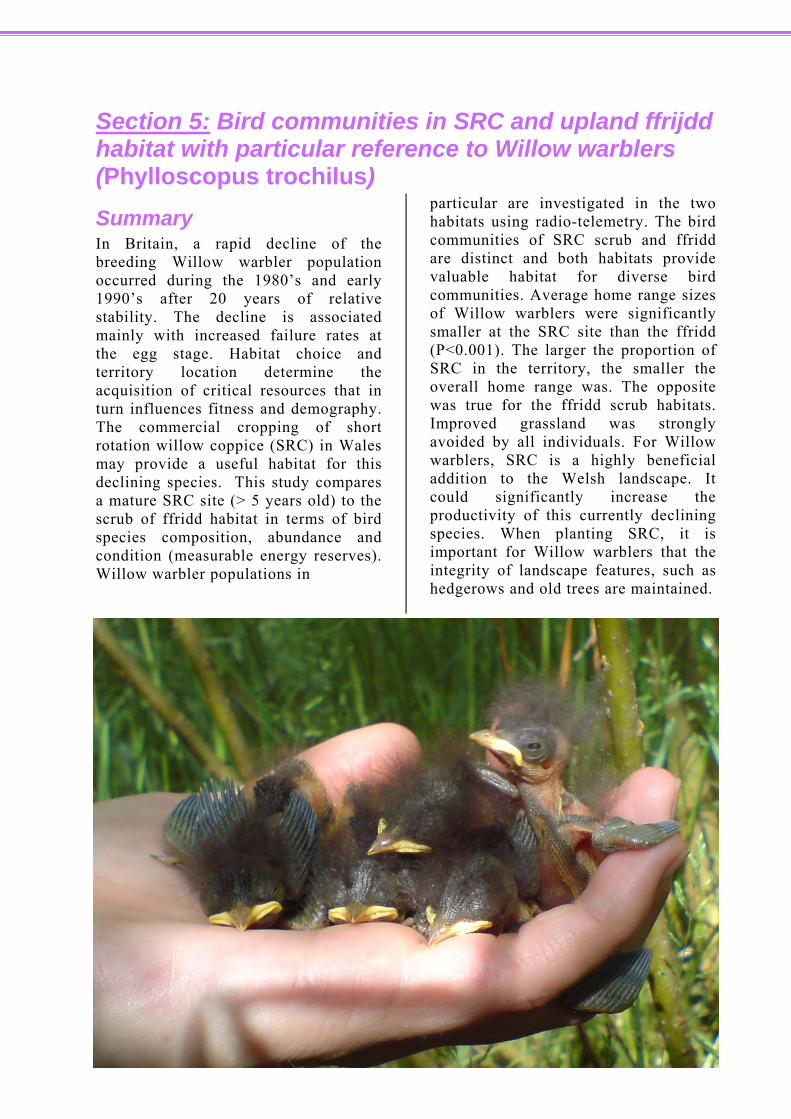
Section 5: Bird communities in SRC and upland ffrijdd habitat with particular reference to Willow warblers (Phylloscopus trochilus) Summary In Britain, a rapid decline of the breeding Willow warbler population occurred during the 1980’s and early 1990’s after 20 years of relative stability. The decline is associated mainly with increased failure rates at the egg stage. Habitat choice and territory location determine the acquisition of critical resources that in turn influences fitness and demography. The commercial cropping of short rotation willow coppice (SRC) in Wales may provide a useful habitat for this declining species. This study compares a mature SRC site (> 5 years old) to the scrub of ffridd habitat in terms of bird species composition, abundance and condition (measurable energy reserves). Willow warbler populations in
particular are investigated in the two habitats using radio-telemetry. The bird communities of SRC scrub and ffridd are distinct and both habitats provide valuable habitat for diverse bird communities. Average home range sizes of Willow warblers were significantly smaller at the SRC site than the ffridd (P<0.001). The larger the proportion of SRC in the territory, the smaller the overall home range was. The opposite was true for the ffridd scrub habitats. Improved grassland was strongly avoided by all individuals. For Willow warblers, SRC is a highly beneficial addition to the Welsh landscape. It could significantly increase the productivity of this currently declining species. When planting SRC, it is important for Willow warblers that the integrity of landscape features, such as hedgerows and old trees are maintained.
57

5.1 Introduction The Willow warbler is a small, insectivorous, migratory passerine that winters over a large area of western and southern Africa (Mead and Clark 1993) and breeds throughout much of northern Europe and Asia. In Britain, the Willow warbler is one of our commonest migratory bird species with an estimated 2,125,000 breeding pairs holding territories in 2000 (Bird Life International 2004). However, the population has suffered a 30% fall in numbers between 1982 and 2005 across Europe (EBCC 2007) and in Britain, a rapid decline occurred during the 1980’s and early 1990’s after 20 years of relative stability. This decline occurred mainly in the south of the UK and was accompanied by a fall in survival rates (Peach et al. 1995). The British Trust for Ornithology (BTO) Breeding Bird Survey (BBS) figures since 1994 indicate a stark contrast between a population increase in Scotland and Northern Ireland, and further severe decreases in England and in Wales (Figure 5.1). The recent population decline is associated with a moderate decline in productivity as measured by BTO Constant Effort Sites (CES) and a substantial increase in failure rates at the egg stage (Figure 5.2). Female Willow warblers choose males with a greater song rate and repertoire size (Arvidsson and Neergaard 1991, Gill and Slater 2000). Male song rate has been found to correlate positively with territory quality (e.g., food abundance) (Arvidsson and Neergaard 1991) and clutch size (Gill and Slater 2000). Increased repertoire can be beneficial in territorial disputes in some species (Krebs et al. 1978, Yasukawa 1981) and the highest song rate and repertoire occurs in older birds (Gill et al. 2001). In many migratory bird species, individuals of higher phenotypic quality are commonly
observed to arrive and mate first (Flood 1984, Francis and Crooke 1986, Hill 1988, Moller 1990, 1994, Enstom 1992, Lindberg and Alatalo 1992, Lozano, Perreault and Lemon 1996, Kokko 1999). In Willow warbler populations, older birds are first to arrive and establish territories (Jakobsson 1988, Pratt and Peach 1991) and are generally in better condition when they arrive than later arrivals (Ardsson and Neergaard 1991). Old males not only arrive earlier, but also pair earlier (Gill and Slater 2000) and the time between mating and egg laying is shorter (Arvidsson and Neergaard 1991). Evidence that earlier breeding birds achieve higher reproductive success is overwhelming (e.g. Daan, Dijkstra and Timbergen 1990, Verhulst and Tinbergen 1991, Wiggins, Part and Gustafsson 1994, Aebischer et al. 1996, Lozano et al. 1996, Hasselquist 1998, Verboven and Visser 1998). In addition, older males may exhibit better parenting skills through improved foraging or defence against predators (Alatalo et al. 1986, Marchetti and Price 1989) and they are more likely to maintain higher quality habitats from previous years (Jakobsson 1988). Habitat choice is critical for the acquisition of resources such as food (MacArthur et al. 1966, Cody 1974, Willson 1974, Rotenberry and Wiens 1998) and refugia from predators (Leber 1985, Martin 1988, Soderstrom 2001, Hithaus and Dill 2002, Eggers et al. 2005) which in turn influences fitness and demography (Misenhelter and Rotenberry 2000, Chalfoun and Martin 2007). Territory choice by males must be adaptive and some may change territory locations in response to reduced breeding success in the preceding year (Jakobsson 1988, Lawn 1994).
58

Figure 5.1 Smoothed population trends for the Willow warbler (taken Baillie et al. (2007). Annual estimates of the abundance of adults and young are separately assessed through application of log–linear Poisson regression models, from which fitted year-effects are taken as annual relative abundances, compared to an arbitrary value of 100 in a recent year in the sequence, the abundance index used here.
Figure 5.2 Productivity declines in the Willow warbler (Baillie et al. (2007). Annual indices of productivity (young per adult) are estimated from logistic regression models applied to the proportions of juvenile birds in the catch, the year-effects then being transformed to measures of productivity relative to an arbitrary value of 100 in a recent year.
59

Willow warblers are often referred to as a woodland species but are actually most closely associated with scrub (Gillings et al. 1998, Gillings and Fuller 1998). Coniferous and deciduous woodlands are the next habitat types where they are most commonly recorded (Robinson 2005). Scrub and woodland were once far more extensive in the British uplands; much of what is now sub-montane moorland would have been covered by trees (Rackham 2000). High grazing pressure from deer and sheep, coupled with burning, now widely inhibits tree regeneration (Fuller et al. 2005, Amar et al. 2006). Vegetation changes have also been evident in the marginal uplands of Wales (the ‘ffridd’) in recent decades, but here the trend has been towards intensified grazing by sheep (Fuller and Gough 1999). These areas, which occur on hillside slopes below the open moorland, are typically mixtures of bracken, grass, scrub and scattered trees and Willow warblers are a species typically found in them (Fuller et al. 2006). Scrub habitat is gaining recognition as an important and threatened habitat type and in 2007 upland willow scrub was added to the priority habitats in the UK Biodiversity Action Plan (Biodiversity Reporting and Information Group, 2007). In a mist netting study of a small field of short rotation willow coppice (SRC) in Powys, Willow warblers were the most numerous species recorded during April-June 2005 (Section 4). Other studies have demonstrated a greater density of Willow warblers in SRC compared to both arable land (Cunningham et al. 2004b) and grassland (Cunningham et al. 2006). Willow warblers have been found to prefer the fully grown bushes found in SRC than recently harvested areas (Goransson 1994) which is consistent with my findings in Section 4. The commercial cropping of SRC in Wales may provide a useful habitat for this
declining species. The objective of this study is to see how SRC compares to the scrub of ffridd habitat in terms of bird species composition, abundance and condition (measurable energy reserves). Willow warbler populations in particular were investigated in the two habitat types using radio-telemetry.
5.2 Study sites The study was carried out at two sites, Hundred House (HH) and Terrible Hollow (TH) in Powys Mid Wales (grid references SO 100 528 and SO 095 536, see Section 4 Figure 4.2). Figure 5.3 shows a map of the study sites and the surrounding area. HH is a small area (1.1ha) of mature SRC planted in 1999 and harvested once in 2003. TH is an area more than four times larger (4.8ha) of traditional marginal upland known as ffridd habitat in Wales. Ffridd habitat is quite variable but in this case consists of a mosaic of scrub with lots of bracken, non-coniferous and coniferous trees and some rough grassland. The sites are less than 1 km apart and therefore have similar surrounding land types, are subject to similar climatic factors and both have streams running through them. One of the main differences between the sites is the topography. TH has a marked gradient while HH is relatively flat with the surrounding hills sloping gently upwards. However, in a study of bird communities of ffridd habitat, Fuller et al. (2006) found that topographical and geographical variables were relatively unimportant in explaining variation in the bird communities of ffridd habitat. Skylark density was found to have a strong negative relationship with steep slopes in this habitat, but no topographical relationship was found for Willow warblers.
60

Figure 5.3 Site location and surrounding landuse
61

5.3 Methods
5.3.1 Data collection
5.3.1.1 Capture and handling This study was carried out over two spring seasons (2006 and 2007) at the two sites, Hundred House (HH) and Terrible Hollow (TH) described in Figure 5.2. Birds were caught by mist-net from the time of the Willow warblers arrival (29th March in 2006 and 4th April in 2007) until the transmitters were attached in late April (Table 5.1).
All birds caught were identified and marked with aluminium (BTO) rings. Age was determined using plumage wear or evidence of wing moult (Svensson 1984). Sex was determined using wing length (Norman 1983a) and when present cloacal proturbence and/or brood patch (Langslow 1971, Svensson 1984). For Willow warblers, sexual bimodality in wing lengths is apparent as early as fledging (Tiainen 1978, Norman 1983b) and can be used to sex 95% of adults.
Table 5.1 The frequency of sampling and capture events of Willow warblers at the study sites Hundred House (HH) and Terrible Hollow (TH), spring 2006 and 2007.
Site
HH TH Netting sampling period
29th March – 12th May 04th April-16th May 2006 12th April – 21st May 20th April– 29th April 2007
No of sampling events 2006 10 8 2007 9
5
No of sampling hours 2006 44 37 2007 36
33
Transmitter attachment 21st and 22nd April 21st and 22nd April 2006 20th – 23rd April 20th – 23rd April 2007
Tracking period 24th – 30th April 24th – 30th April 2006
25th April-1st May 25th April-1st May 2007 No of capture events
2006 28 24 2007 16
7
No of transmitters attached 2006 8 7 2007 6 6
62

63
The levels of reserves of fat and muscle protein have a bearing on a bird’s future survival prospects and can provide information about the health or ‘condition’ of a population (Dill 1987). The three measures of condition, recorded by a single recorder (D. Fry) for consistency, were: 1) Tracheal Pit Score (TPS) This is a measure of the amount of fat deposited in the tracheal pit. This reserve is directly proportional to the total body fat carried by the bird (Redfern and Clark 2001). Fat, as the primary energy reserve fluctuates and typically increases throughout the day in non-migrating diurnal birds. Fat reserves may determine the bird’s chances of survival. The scoring system was a modified version of the Biometrics Working Group of the BTO Ringing Committee (BWG) system (Redfern and Clark 2001). 2) Pectoral Muscle Score (PMS) Pectoral muscle may also be used as a fuel under certain conditions and is therefore another valuable indicator of body condition. Score classes were those used in the BTO Ringer’s Manual (Redfern and Clark 2001). 3) Body Mass Index (BMI). This was calculated by dividing weight by wing length to allow for comparison across species. Each individual was weighed, with an electronic balance with an accuracy of 0.1g, and tracheal pit scores (TPS) and pectoral muscle scores (PMS) given. In late April, adult male Willow warblers were fitted with Biotrak PIP transmitters (Biotrak Ltd, Wareham, UK), weighing approximately 0.5g. Transmitters were attached to the two central tail feathers (Figure 5.5). Each animal was also fitted with coloured rings with an individual colour
combination to facilitate direct identification by observation. One or 2 further netting sessions were conducted after the radio-tracking period in an attempt to recapture tagged individuals to check on the birds physical health (Godfrey and Bryant 2003) and to retrieve any transmitters that were still attached. Only males were used in this study for several reasons. Males tend to arrive before the females to establish territories (Lawn 1994a 1994b). They engage in activities of territory announcement and defence and lend themselves to easier tracking and territory mapping. The females spend more time lower to the ground constructing nests and sitting on eggs which could muffle the signal (Norman 1994). It has been suggested that females are more difficult to catch than males (Lawn 1982, Tiainan 1983) and previous studies had established that far more males than females tend to be caught at the HH site.
5.3.1.2 Radio-tracking Tagged individuals were tracked using hand-held collapsible three-element Yagi antennae and ‘Sika’ receivers (Figure 5.4 Biotrak Ltd, Wareham, UK). Five pairs of fixed locations were used at each site to search for signals and the locations of tagged birds were determined through triangulation (Figure 5.6). Bearings were recorded from a hand held compass directly onto a map. Searches were conducted during three sessions a day (06:00-10:00, 10:00-14:00 and 14:00-18:00) from each pair of fixed locations, at each site, for seven consecutive days. The first site to be visited (either TH or HH) was alternated each day. Data were collected from 24th to 30th April in 2006 and from 25th April to 1st May in 2007. Error in location estimates was quantified by taking repeated bearings (n=30) on 5 transmitters placed at

known locations within each study site. Mean errors associated with triangulation were: HH, 4.3m (range 10.2m): TH, 6.9m (range 16.1m). When fewer than 30 fixes were recorded for an individual they were excluded from the data analysis. These exclusions left available for analysis; 273 fix locations from 4 individuals at TH in 2006 (median 75.5 per bird, range 34-88), 542 locations from 7 individuals at HH in 2006 (median 77.43, range 37-92), 233 locations from 3 individuals at HH in 2007 (median 91, range 44-98) and locations from 4 individuals at TH in 2007 (median 69.25, range 47-84).
Figure 5.4 Radio-tracking at Terrible hollow (top) for Willow warblers (bottom).
64

igure 5.5 Attaching the radio transmitters. The transmitters are attached to the 2 central il feathers using elastic, waxed floss and fast drying glue.
Fta
65

a) b)
Figure 5.6 Examples of how locations were estimated using triangulation methods at a) HH and b) TH. Black dots represent the post locations from where the bearings were taken, lines are the directional bearings and the red dots the subsequent estimated bird location.
5.3.2 Data analysis Species communities were compared at the 2 sites by species caught, relative abundance (number of individuals caught/hour) and condition measures. Comparisons of condition measures were also conducted for the Willow warblers caught at both sites in both years.
Home range size
For each Willow warbler the 100% minimum convex polygon (MCP; Hawth’s Analysis tools version 3.27) was used to describe home range size (Beyer 2004). MCP’s are widely used and facilitate comparison across studies (Barg et al. 2005). These 100% MCP’s will be referred to as ‘home ranges’. Fixed kernel methods (Worton 1989, Millspaugh and Marzluff 2001, Barg et al. 2005) were employed to estimate the
location density distribution (ARCView Spatial Analyst in ESRI ArcGIS 9.2). The densest 20% are referred to as the ‘core area’ and 70% represents the ‘normal area’ utilised by the animal excluding the outliers (30% of the most separate locations) present in the MCP’s. Only total home range size was statistically compared between sites and years.
Habitat utilisation
The habitat types shown in Figure 5.3 were collated into categories (Table 5.2) and the number of locations within each habitat category for each individual counted. Locations which had linear features within their error distances were put into the linear feature category. This was decided on because observations from the field showed birds were far more likely to be there than in an open field. Habitat
66

types were collated to achieve large enough expected values to enable Chi-squared tests to be performed. Chi-squared tests were employed to analyse the differences between observed and expected numbers of locations in the different habitat types. Bonferroni confidence intervals were fitted to show whether use of each habitat by individuals was greater or less than the proportion of that habitat in the home range (Neu et al. 1974, Marcun and Loftsgaarden 1980, Byers et al. 1984, Alldredge and Ratti 1986, 1992). There are problems with this technique. The data are vulnerable to disproportionate effects of one individual if the data are
pooled. I first carried out the test for individuals to see how different individual’s habitat choices were before pooling the data. Another problem is that the procedure uses the locations not the animal as the sample unit for analysis and the same problem affects other more complex analyses (Heisey 1985, Kenwood 2001). However, the technique is easy to use and interpret and so was used, but, to provide further evidence of habitat importance, linear regression was also employed. This would find any significant correlations between habitat content and home range size indicating the importance of the habitat to the species (Kenwood 1982).
Table 5.2 Habitat types collated into groups for analysis. Total habitat types shown in Figure 6.3 Categories used in analysis Improved Grassland Improved Grassland Coniferous Trees Mainly Coniferous Trees Coniferous Trees, Nonconiferous Trees Tracks Linear Features Water features Field boundaries, Hedgerows Nonconiferous Trees Mainly Nonconiferous Trees Nonconiferous Trees (Scattered), Coniferous Trees Nonconiferous Trees (Scattered), Rough Grassland Nonconiferous Trees, Coniferous Trees Nonconiferous Trees, Rough Grassland Nonconiferous Trees, Rough Grassland, Scrub Nonconiferous Trees, Scrub Rough Grassland Mainly Rough Grassland Rough Grassland, Nonconiferous Trees, (Scattered) Rough Grassland, Scrub Rough Grassland, Nonconiferous Trees Rough Grassland, Nonconiferous Trees Scrub Mainly Scrub Scrub, Nonconiferous Trees Scrub, Rough Grassland Short Rotation Willow Coppice Short Rotation Willow Coppice
67

5.4 Results
5.4.1 Species communities at the sites A total of 28 bird species were caught. Nineteen species were recorded at HH and 18 at TH. The birds caught at TH tended to be species more closely associated with older woods and trees like Treecreeper, Pied flycatcher and Great spotted Woodpecker and/or the patches of coniferous trees found at TH e.g. Coal tit and Siskin. The
species caught at HH prefer younger trees and dense undergrowth such as Blackcap and Garden warbler. The species which were caught at both sites were more generalist species found in a wider range of habitats e.g. Blackbirds and Blue tits (Table 5.3). Twenty-seven species were recorded in 2006 and 15 in 2007. The species not caught in 2007 are all from the “more specialist” lists of species found at only one of the sites (Table 5.3).
In terms of abundance (capture events/hour) all recorded species fell in
Table 5.3 Lists of species, where they were caught and when.
Caught only at TH Caught only at HH Caught at both sites Caught in Coal tit Blackcap 2006 only Great spotted
Woodpecker Chiffchaff Jay Dunnock Long-tailed tit Garden warbler Meadow pipit Goldfinch Siskin Magpie Tree pipit Reedbunting Song thrush Willow tit Caught in 2007 only
Wren
Caught in Pied flycatcher Blackbird both Treecreeper Blue tit years Bullfinch
Chaffinch Great tit Redpoll Redstart Robin Willow warbler Blackbird
68

69
abundance at TH between years while the species at HH showed a mixed response (Figure 5.7). Some increased markedly (Chaffinch, Redpoll, Robin and Wren) and others only slightly (Blackbird, Blue tit, Reedbunting, Great tit and Goldfinch). The remaining species declined in abundance with the most striking being the Garden warbler, with 11 capture events (9 individual birds) in 2006 and 0 in 2007. Of the 12 species more abundant at TH than HH in 2006, 5 were not recorded in 2007 and 4 reversed the trend and were more abundant at HH that TH (Blue tit, Redpoll, Robin and Willow warbler). Willow warbler abundance for example was approximately equal at the 2 sites in 2006 (TH=0.649 and HH 0.636) but in 2007 the abundance at HH was double that of TH (TH=0.212 and HH=0.444).
Condition
Of the 9 species caught at both sites one species (Blackbird) was left out of this comparison due to lack of condition data. Numbers of birds caught at TH were too few to allow statistical analysis of the individual species or between years. TPS was generally higher at HH than TH except for Blue tits and Robins (Figure 5.8a). PMS was also generally higher at HH except for Blue tits and Great tits (Figure 5.7b). All species had slightly higher BMI at HH (Figure 5.8c). No significant differences were found when species were pooled between the sites for the condition indices PMS (t=-1.79, P=0.097) TPS (t=-1.54, P=0.149) or BMI (t=-1.31, P=0.231).

0
0.1
0.2
0.3
0.4
0.5
0.6
0.7
Bla
ckbi
rd
Bla
ckca
p
Blu
e tit
Bul
lfinc
h
Cha
ffinc
h
Chi
ffcha
ff
Coa
l tit
Dun
nock
Gar
den
war
bler
Gol
dfin
ch
Gre
at s
potte
d W
oodp
ecke
r
Gre
at ti
t
Jay
Long
-taile
d tit
Mag
pie
Mea
dow
pip
it
Pie
d fly
catc
her
Red
poll
Red
star
t
Ree
dbun
ting
Rob
in
Sis
kin
Son
g th
rush
Tree
pip
it
Tree
cree
per
Will
ow ti
t
Will
ow w
arbl
er
Wre
n
Bird
s/Hr
Terrible Hollow Hundred House
0
0.1
0.2
0.3
0.4
0.5
0.6
0.7
Bla
ckbi
rd
Bla
ckca
p
Blu
e tit
Bul
lfinc
h
Cha
ffinc
h
Chi
ffcha
ff
Coa
l tit
Dun
nock
Gar
den
war
bler
Gol
dfin
ch
Gre
at s
potte
d W
oodp
ecke
r
Gre
at ti
t
Jay
Long
-taile
d tit
Mag
pie
Mea
dow
pip
it
Pie
d fly
catc
her
Red
poll
Red
star
t
Ree
dbun
ting
Rob
in
Sis
kin
Son
g th
rush
Tree
pip
it
Tree
cree
per
Will
ow ti
t
Will
ow w
arbl
er
Wre
n
Bird
s/Hr
Figure 5.7 Abundance of bird species caught at the sites Terrible Hollow and Hundred House in a) 2006 and b) 2007. Abundance is adjusted for effort (number of birds caught /hour).
70

Figure 5.8 Average condition scores for a) tracheal pit b) pectoral muscle and c) body mass (+ 1 SE) at the sites TH and HH. Data is pooled for 2006 and 2007.
00.050.1
0.150.2
0.250.3
0.35
BLU
E T
IT
BU
LLFI
NC
H
CH
AFF
INC
H
GR
EA
T TI
T
RE
DP
OLL
RE
DS
TAR
T
RO
BIN
WIL
LOW
WA
RB
LER
Aver
age
Body
Mas
s In
dex
Scor
e
0
0.5
1
1.5
2
2.5
BLU
E T
IT
BU
LLFI
NC
H
CH
AFF
INC
H
GR
EA
T TI
T
RE
DP
OLL
RE
DS
TAR
T
RO
BIN
WIL
LOW
WA
RB
LER
Aver
age
Pec
tora
l Mus
cle
Scor
e
00.5
11.5
22.5
3
BLU
E T
IT
BU
LLFI
NC
H
CH
AFF
INC
H
GR
EA
T TI
T
RE
DP
OLL
RE
DS
TAR
T
RO
BIN
WIL
LOW
WA
RB
LER
Aver
age
Trac
heal
Pit
Scor
esTH HH
a)
b)
c)
71

72
5.4.2 Comparing Willow warblers at the sites For Willow warblers, TPS was significantly greater at HH in 2007 than HH in 2006 (P=<0.001) and TH in both 2006 (P=0.033) and 2007 (P=0.012) (Figure5.9). Overall, TPS was not significantly different between years (P=0.089) or sites (P=0.377). PMS was significantly higher in 2007 than 2006 (P= <0.001) but there was no difference between sites (P=0.216). No significant differences were found for the BMI (Figure 5.9).
a)
0
0.5
1
1.5
2
2.5
HH 06 HH 07 TH 06 TH 07
Sco
re
3
3.5 PMS
TPS
0.112
0.116
0.120
0.124
0.128
0.132
0.136
HH 06 HH 07 TH 06 TH 07
Bod
y M
ass
Inde
x Sc
ore
b)
0.140
0.144
Figure 5.9 Average condition scores for a) tracheal pit and pectoral muscle and b) body mass (+ 1 SE) of Willow warblers caught at TH and HH in 2006 and 2007.

Average territory sizes (measured by MCP’s, Figure 5.10) varied significantly among sites (t=-4.55, DF=12, P<0.001) but not between years (t=-0.95, DF=14, P=0.358) (Figure 5.11). The territories displayed large overlaps, even in the core areas (Figure 5.12), in 2006 but in 2007 they were much more dispersed (Figures 5.13, 5.14 and 5.15). The occurrence of multiple core areas was also more prevalent in 2006. Three individuals appeared to have more than one completely separate core area within their territory in 2006 (1 at HH and 2 at TH) (Figure 5.13 and 5.14).
a)
b)
Figure 5.10 Minimaum convex polygons (MPC’s) around the outer most locations of Willow warblers caught at TH (red) and HH (black) in a) 2006 and b) 2007.
73
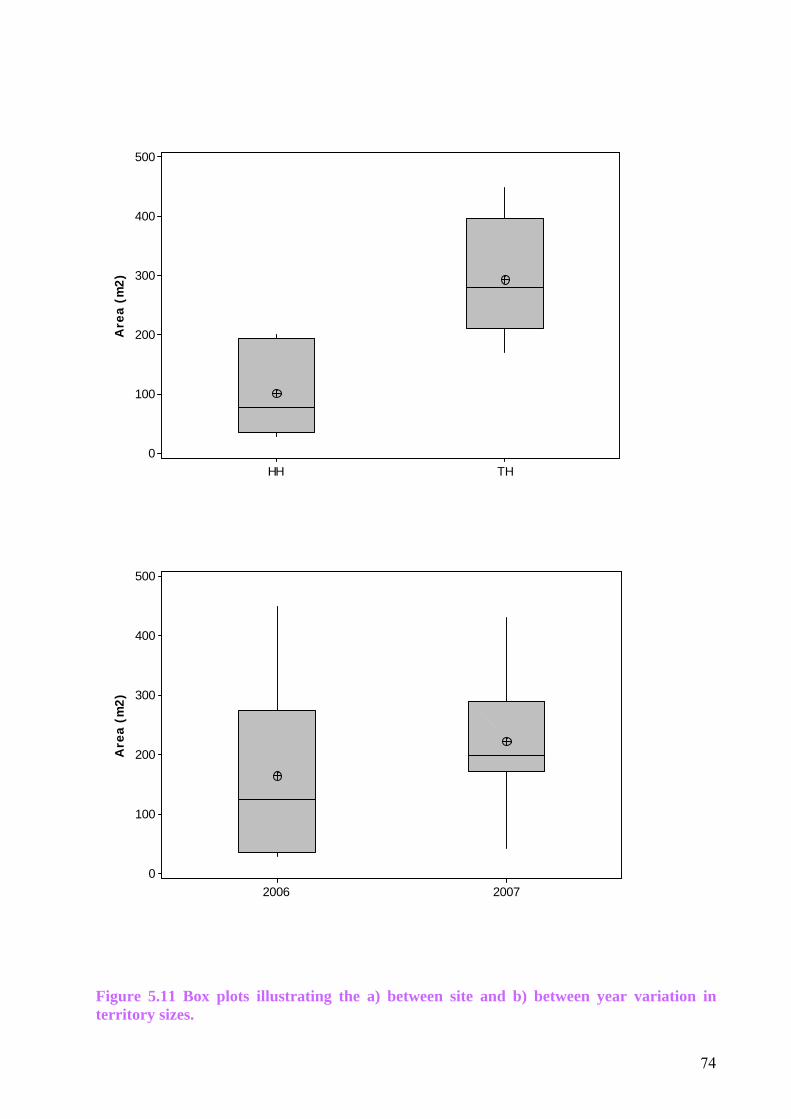
THHH
500
400
300
200
100
0
Are
a (m
2)
20072006
500
400
300
200
100
0
Are
a (m
2)
Figure 5.11 Box plots illustrating the a) between site and b) between year variation in territory sizes.
74

a) b) Figure 5.12 Core areas within the mapped territories in a) 2006 and b) 2007. The different colours each contain 5% of the location density distribution with red containing the densest 5%, orange the next 5% and so on.
75
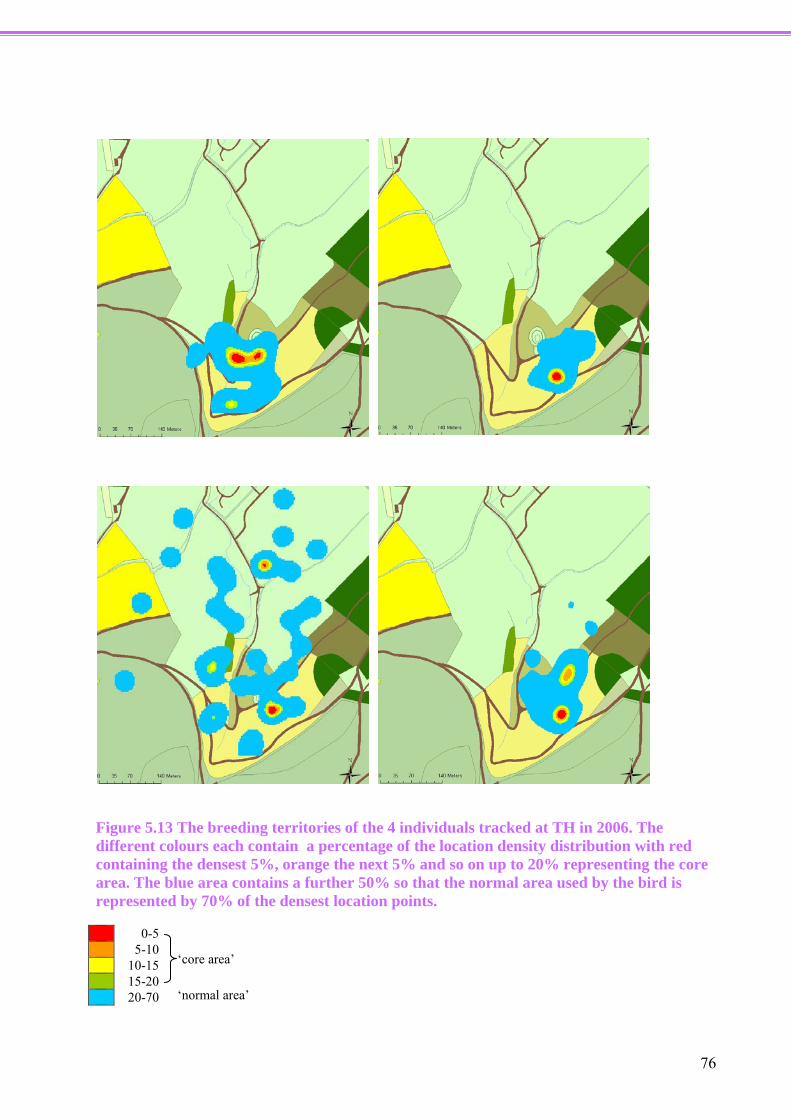
Figure 5.13 The breeding territories of the 4 individuals tracked at TH in 2006. The different colours each contain a percentage of the location density distribution with red containing the densest 5%, orange the next 5% and so on up to 20% representing the core area. The blue area contains a further 50% so that the normal area used by the bird is represented by 70% of the densest location points. 0-5 5-10 10-15 15-20 20-70
‘core area’
‘normal area’
76

2 individuals 1 individual with multiple core areas Figure 5.14 The breeding territories of the 7 individuals tracked at HH in 2006. Colour contours are the same as Figure 5.12.
77

78
Figure 5.15 The breeding territories of individuals caught at TH (4) and HH (3) in 2007. Colour contours are the same as Figure 5.12 except for one individual with a high degree of spread with its normal area coloured lilac to show areas associated with that particular individual. Some territories are faded to show the degree of overlap.

A significant correlation was found between home range size and two habitat types, scrub (2006 only) and SRC for 2006 and the overall trend for SRC was still significant despite variation because of year (Figure 5.16). The relationships suggest that the larger the proportion of SRC in the territory, the smaller the overall home range is. The opposite is true for the ffridd scrub habitats. Improved grassland was strongly avoided by all individuals and most showed preference for the linear features i.e. the hedgerows and tree lines (Table 5.4). The birds at HH tended to prefer SRC to other available habitats (6 out of 10 birds) while the ones at TH preferred scrub (7 out of 8). Habitat selection differed for the populations at the two sites. As expected from looking at the individual preferences, the birds at HH spent more time in the SRC than statistically expected while the TH population spent more time in the scrub habitats (Figure 5.17). The population at HH had a stronger association with linear features than those at TH.
20151050
500000
400000
300000
200000
100000
0
Scrub cover (%)
Terr
ioto
ry s
ize
(m2)
20062007
403020100
500000
400000
300000
200000
100000
0
SRC cover (%)
Terr
itor
y si
ze (
m2)
Figure 5.16 Regression lines showing scrub and SRC related to home range size. Scrub was significantly related to home range size in 2006 (F=6.53, P=0.031) and in SRC also 2006 (F=5.59, P=0.042). For SRC the trend was still significant despite variation because of year (F=7.48, P=0.015). No other habitat categories were significantly related.
79
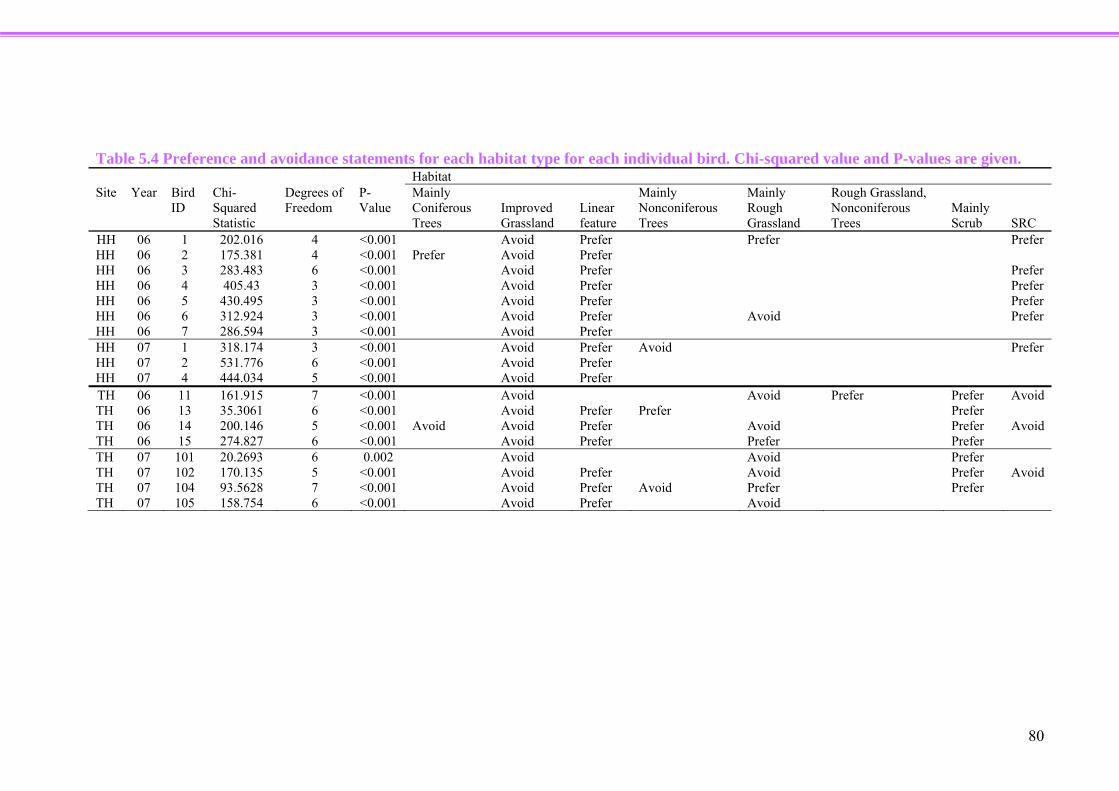
Table 5.4 Preference and avoidance statements for each habitat type for each individual bird. Chi-squared value and P-values are given. Habitat Site Year Bird
ID Chi-Squared Statistic
Degrees of Freedom
P-Value
Mainly Coniferous Trees
Improved Grassland
Linear feature
Mainly Nonconiferous Trees
Mainly Rough Grassland
Rough Grassland, Nonconiferous Trees
Mainly Scrub SRC
HH 06 1 202.016 4 <0.001 Avoid Prefer Prefer Prefer HH 06 2 175.381 4 <0.001 Prefer Avoid Prefer HH 06 3 283.483 6 <0.001 Avoid Prefer Prefer HH 06 4 405.43 3 <0.001 Avoid Prefer Prefer HH 06 5 430.495 3 <0.001 Avoid Prefer Prefer HH 06 6 312.924 3 <0.001 Avoid Prefer Avoid Prefer HH 06 7 286.594 3 <0.001 Avoid Prefer HH 07 1 318.174 3 <0.001 Avoid Prefer Avoid Prefer HH 07 2 531.776 6 <0.001 Avoid Prefer HH 07 4 444.034 5 <0.001 Avoid Prefer TH 06 11 161.915 7 <0.001 Avoid Avoid Prefer Prefer Avoid TH 06 13 35.3061 6 <0.001 Avoid Prefer Prefer Prefer TH 06 14 200.146 5 <0.001 Avoid Avoid Prefer Avoid Prefer Avoid TH 06 15 274.827 6 <0.001 Avoid Prefer Prefer Prefer TH 07 101 20.2693 6 0.002 Avoid Avoid Prefer TH 07 102 170.135 5 <0.001 Avoid Prefer Avoid Prefer Avoid TH 07 104 93.5628 7 <0.001 Avoid Prefer Avoid Prefer Prefer TH 07 105 158.754 6 <0.001 Avoid Prefer Avoid
80

00.10.20.30.40.50.60.70.8
Impr
oved
Gra
ssla
nd
Line
ar fe
atur
e
Mai
nly
Con
ifero
usTr
ees
Mai
nly
Non
coni
fero
us
Mai
nly
Rou
ghG
rass
land
Mai
nly
Scr
ub
SR
C
Observed Expected
a) HH
00.10.20.30.40.50.60.70.8
Impr
oved
Gra
ssla
nd
Line
ar fe
atur
e
Mai
nly
Con
ifero
usTr
ees
Mai
nly
Non
coni
fero
us
Mai
nly
Rou
ghG
rass
land
Mai
nly
Scr
ub
SR
C
b) TH
Figure 5.17 Observed habitat use compared with expected use based on the proportions of available habitat for the Willow warblers caught at a) HH and b) TH.
81

5.5 Discussion The main findings were that bird communities of SRC scrub and the scrub of ffridd habitat are distinct and both provide valuable habitat for diverse bird communities. For Willow warblers SRC is a highly beneficial addition to the landscape. Increasing SRC production could significantly increase the productivity of this species. This study also shows the importance of maintaining the integrity of landscape features, such as hedgerows and old trees.
5.5.1 Species communities at the sites. The year 2007 was generally a poor one for breeding birds with many species experiencing the worst breeding season since the BTO’s Constant Effort Scheme (CES) began in 1983. May 2007 was the wettest since 1967 and the thundery weather continued through much of June leading to devastating flooding in many parts of the country. The adverse weather began in the study area during the study period in 2007. Nationally, early breeders such as Blackcap and Long-tailed tit missed the worst of the weather but slightly late species such as Garden warblers suffered. Ground nesters suffered particularly and the BTO’ Bird Track received reports of warblers dying in the nest. This may have lead to the reduction of caught species in this study in 2007. The drop in species caught between years may also partially reflect slightly reduced effort (number of visits) (Table 5.1), indeed some of the species are ones which were caught in very low numbers in 2006 and would be most effected by reduced effort. However, the species not caught in 2007 are all from the “more specialist” lists of species found at only one site (Table 5.2) and most likely reflects the ability of more generalist species and/or early breeding species to
cope better with the weather patterns. The bad weather explains the dramatic fall in Garden warbler numbers caught between years in this study. The bird numbers at TH were particularly affected by the wet weather and some species may have made greater use of the SRC at HH in this “bad” year. This seems particularly true for Willow warblers as their relative abundance at HH in 2007 was approximately double that of TH. There was no difference in the bird’s condition at the 2 sites but the relative abundance numbers suggest that the resources provided by the SRC can maintain more individual birds at that condition than the habitats at TH overall and particularly when conditions are adverse.
5.5.2 Willow warblers at the sites PMS were higher in 2007 at both sites suggesting that the Willow warblers arrived back in better condition than 2006 albeit at lower numbers at TH. Fat scores did differ reflecting more immediate conditions. The higher fat scores recorded at HH can be interpreted in several ways. It could mean that birds here were able to fatten up quicker. Because of the increased cover afforded by the SRC birds may feel less vulnerable to predation and able to carry more fat (Rogers 1987), although if this were the case the pattern would presumably have occurred in 2006 as well. It has been shown in birds with a dominance hierarchy that more dominant birds are more certain of feeding and can afford to carry less fat (Gosler 1996, Lima 1986). The resource at TH may have been more predictable in 2007 and the birds could carry less fat because they were more certain of being able to feed (Rogers and Reed 2003). As is often the case, adaptive fat regulation was difficult to interpret (Rogers and Heath-Coss, 2003) and it is unclear what the differences in fat scores reflect.
82

The only bird caught at both sites was an individual who was tracked in 2006 at TH and then was re-caught the following year at HH. He was re-caught in 2007 at HH on the 16th March and the 21st April suggesting that he had changed territory locations. Male Willow warblers may change to a higher quality habitat in response to reduced breeding success in the preceding year (Jakobsson 1988, Lawn 1994). This would suggest that having held a territory at TH one year the individual chose a better quality one the following year in the SRC. Home ranges were larger than has been previously reported but the core areas where more like those previously mapped or described (Enemar et al. 1979, Lawn 1982, Tiainen 1983). Home ranges were significantly smaller at HH and this did not alter between years despite the lower density of birds in 2007 as has been found to happen in Great tit populations (Both and Visser 2000). Habitat type was a greater influence on territory size than the population density. The more SRC was available to an individual the smaller his home range needed to be to provide him with all the resources he would need to attract a mate and successfully fledge young. Conversely, when scrub in the ffridd habitat was utilized a greater home range size was required to provide the same resources. This indicates the resources provided by SRC are more concentrated than in the ffridd habitat (Tremblay et al. 2005). Additional support for this idea comes from the fact that SRC can support a greater number of individuals by allowing considerable overlap of territories consequently increasing productivity. The long-term trend of a declining English and Welsh Willow warbler population appears to be due to failure at the egg stage (BTO Bird Trends
2008). In a single study in Norway 68% of nests failed due to predation (Bjoernstad and Lifjeld 1996). Holding a smaller territory and having to travel smaller distances to feed would mean more time spent nest guarding and presumably lead to a greater breeding success than those individuals forced to spend longer away from the nest (Kerbiriou et al. 2006). These results suggest that growing more SRC in Wales could significantly increase Willow warbler productivity. The occurrence of multiple core areas was more prevalent in 2006 with three individuals having multiple core areas within their home range in 2006. Previous studies have found Willow warblers to be highly polygynous with bigyny being the rule and some males even having three females (Neergaard and Arvidson 1995). This is more evidence that 2006 was a much better year for breeding birds than 2007 and enabled increased pairing and nesting attempts. Analysis of habitat utilization by the Willow warblers showed that SRC appeared to be used in complete substitution for the traditional ffridd habitat. Further evidence of the importance of this habitat was the significant correlation between SRC content and home range size. However, one thing the ffridd has but is lacking in the SRC is old trees. The population inhabiting the SRC made greater use of the trees present in the linear features i.e. in the hedgerows. Willow warblers are especially associated with trees at the site scale (Fuller et al. 2006) and this study confirms the importance of maintaining trees within the landscape for this species. Although most closely associated with scrub habitats the presence of old trees in the habitat mosaic is clearly important for Willow warblers. In this case, for males setting up territories, the trees are probably
83
84
playing an important role as song posts. They are the highest available perches from which the males can perform their song repertoires in order to attract a mate and signal to other males that a territory has been established. Bird density alone does not necessarily mean greater breeding success as some introduced non-native vegetation can become ‘ecological traps’ (Remes 2003). SRC provides good forage and apparently good nesting opportunities. Willow is not an exotic introduction and is probably returning to a more ‘natural’ or at least older habitat type. It is unlikely to act as an ecological trap in the UK (Dhont et al. 2007) and the assumption that SRC could increase Willow warbler productivity based on these results seem justified.
Implications and suggestions for further research Future studies need to address the lack of direct measures of productivity for birds in these habitats. It was originally envisaged that nests would be located and monitored as part of this study but this proved to be too labour intensive to do in addition to dealing with the radio tracking data. There is a need to understand and identify the preferred mosaics and structures of vegetation of other bird species and what role SRC can play in that mosaic. This will provide a better understanding of the implications of introducing SRC into the landscape and enable it to be managed with the surrounding area to the maximum benefit to birds and other wildlife. If SRC is to be managed to its full potential a more complete understanding of the habitat needs of birds and other wildlife is necessary.
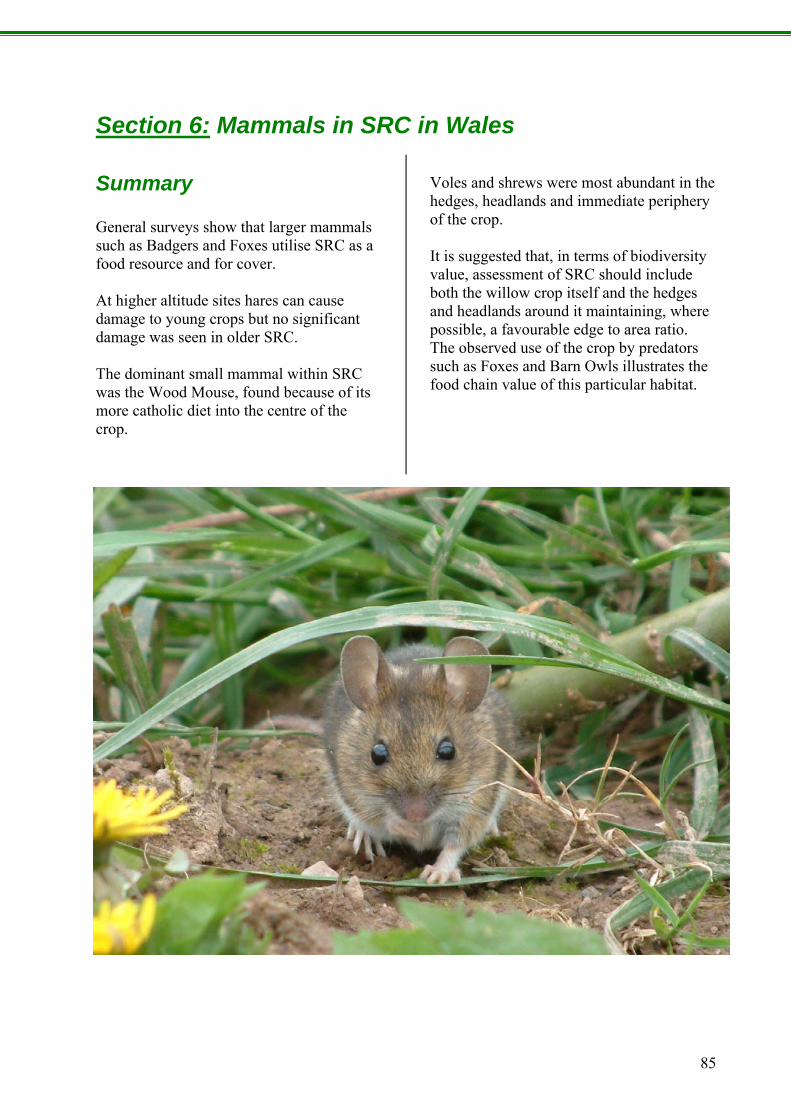
Section 6: Mammals in SRC in Wales
Summary General surveys show that larger mammals such as Badgers and Foxes utilise SRC as a food resource and for cover. At higher altitude sites hares can cause damage to young crops but no significant damage was seen in older SRC. The dominant small mammal within SRC was the Wood Mouse, found because of its more catholic diet into the centre of the crop.
Voles and shrews were most abundant in the hedges, headlands and immediate periphery of the crop. It is suggested that, in terms of biodiversity value, assessment of SRC should include both the willow crop itself and the hedges and headlands around it maintaining, where possible, a favourable edge to area ratio. The observed use of the crop by predators such as Foxes and Barn Owls illustrates the food chain value of this particular habitat.
85

6.1 Introduction In traditional coppiced woodland, small mammal populations respond quickly to changing habitats (Gurnell et al. 1992). Although some species disappear after initial felling, populations quickly recover so that at 3 years (the normal coppice cycle in the UK), they reach peak numbers (Gurnell et al. 1992). Similar abundances of small mammals have been recorded for SRC (poplar) and row crops in the U.S.A. (Christian et al. 1994, Tolbert and Wright 1998). In these studies, ground cover was determined to be the single most important factor in small mammal populations using plantations compared with hay/pasture and grain crops (Christian et al. 1994, Tolbert and Wright 1998). Both rabbits and deer have been recorded to browse on new willow shoots (Kopp et al. 1996, Bergstrom and Guillet 2002, Guillet and Bergstrom 2006). Detrimental affects of herbivore browsing can me minimised by altering planting density and harvest cycles (Kopp et al. 1996). SRC has the potential to be an excellent habitat for declining British hare populations (Vaughan 1993, Smith et al. 2004). An overview of badger useage was made at all sites and trapping for small mammals using Longworth live traps undertaken at all sites but number of sampling occasions varied depending on planting date, accessibility and complementarity with other surveys. Trapping occasions were Brigham (1), Cernyfed (3), Cilgoed (3), Bodorgan (4), Glynllifon (3), Hayscastle (6), Bluestone (6). 6.2 Methods
6.2.1 Data collection A preliminary survey was conducted in September 2005 of the only planted sites at that time (Oakwood, Hayscastle and Bodorgan). Sand traps 0.5m x 0.5m were set out in linear transects running from the rides into the crop. Both mammal and bird prints were recorded. This gave us an initial idea of what mammals were in the area and entering the crop. A survey was conducted in February 2005 of badger activity at four sites (Oakwood, Hayscastle, Glynllifon and Bodorgan). An area of 1km radius of the willow SRC plot was walked and active setts recorded. Obvious features such as dung pits, outlier setts as well as evidence of foraging and well-used pathways were also recorded. Any casual sightings of mammals during site visits have been recorded; this has mainly been hare and rabbit activity. Small mammals were surveyed using Longworth live traps at four sites (Oakwood, Hayscastle, Bodorgan and Hundred House). Traps used were set out using both trap lines to allow assessment of linear habitats such as hedgerows and rides and changing habitat type e.g. from willow SRC to rough grazing. Trapping sessions occurred in May, June and August. Timing and number of sessions per site varied for largely logistic reasons. Traps were put out for 3 or 4 nights using mixed seeds for bait and hay for bedding with fly pupae for trapped shrews. Traps were set 5m apart and checked at least once every 24 hours. Data are expressed as absolute values and as an Index of abundance = Number caught/traps in transect and trapping nights
86

6.3 Results 6.31 Large Mammals Figure 6.1 Summary maps of the results of the badger surveys are shown below to illustrate show the location and general orientation of the major badger tracks at the four sites surveyed.
Hares caused some damage to first year plants at the most upland site (350m) Cernyfed. The animals were seen on virtually every visit the most animals seen on one occasion being 6.
Bodorgan Glynllifon
6.32 Small Mammals All sites were trapped on a varying number of occasions (see 6.1) and because the overall pattern of capture at all sites was similar the combined totals are given in the Table below:
Oakwood
Hayscastle
Sett
87

Table 6.1 Combined small mammal totals for all sites (27 trapping occasions x 40 traps = 1080 trap-nights) x10 traps per location/occasion
Hedgerow Headland 5m into crop Crop Centre
Common Shrew 10 10 0 0 Pygmy Shrew 5 2 0 1 Bank Vole 19 2 3 0 Short-tailed/ Field Vole 21 24 4 4 Wood Mouse 16 90 162 178 Yellow-necked Mouse 3 3 0 2 Figure 6.2 Abundance of small mammals at Brigham and Bluestone sites.
When expressed as an index of abundance the results show that the Wood Mouse (Apodemus sylvaticus) is clearly the most abundant animal particularly within the crop. The related Yellow-necked mouse (Apodemus flavicollis) was caught only in the field margins (hedgerow and headlands) at Brigham and Bluestone with the exception of one in the field centre at the latter.
0
0.1
0.2
0.3
0.4
0.5
0.6
0.7
0.8
0.9
1
Commonshrew
Pygmyshrew
Bank vole Field vole Woodmouse
Yellow-neckedmouse
Inde
x of
Abu
ndan
ce
Hedgerow Headland 5m into crop Centre of crop
Shrews were also largely animals of the well vegetated field margins occurring only at about half of all the sites.
88

89
Figure 6.3 Abundance of small mammals with increasing distance into adjacent improved grazed pasture.
When trap lines were set from the centre of the SRC then out for 35m into adjacent improved grazed pasture at Hayscastle and Bodorgan and recorded for four successive days, the overall abundance pattern recorded was much as described above but on neither occasion were any small mammals caught in the Longworth traps within the improved pasture.(see Figure above) 6.4 Discussion The value of SRC to mammals should not be underestimated even though it is the crop periphery which carries the highest diversity of smaller species. To encourage and maintain such diversity it is clear that the crop benefits from a high edge to area ratio and that conventional wisdom advocating maintaining SRC crops within the existing landscape pattern rather than combining fields to larger units will be to the benefit of wildlife. Larger mammals do utilise SRC and in this study badger usage was mapped at four sites and at all of these badgers moved regularly through the crop with clear indication of feeding especially in high summer when
adjacent fields were dry but the ground was still moist below the SRC canopy making it better earthworm foraging area than the field. At all four sites latrine areas were located within the SRC but it was not ascertained if these had territorial significance. From the vicinity of active setts at Bluestone and Hayscastle, pathways frequently pass straight through the SRC as if it were being used as cover to move unseen to more distant feeding areas. As no deer were observed at any of the sites the only other larger mammal impacting on the willow was the hare which damaged a lot of trees at Cernyfed in the first year of planting. This was the highest site used in these trials at 350m and compares well with a site we have used outside these trials at 365m at Pwllpeiran in Ceredigion where similar damage occurred. This suggests that this could be a potential problem at high altitude sites, but as productivity at and often access to these sites if poor this may not prove to be a problem at most sites. Foxes were not seen but evidence of their presence detected (scent and scats) at all
0
0.1
0.2
0.3
0.4
0.5
0.6
0.7
0.8
35 30 25 20 15 10 5 0 5 10 15 20 25 30 35
Distance (m)
Abu
ndan
ce In
dex
Within SRC Adjacent improved grazed pasture
sites perhaps attracted by the cover or the presence of relatively high densities of prey. What is clear from the above results is that the conversion of improved pasture to SRC converts a wildlife desert into a highly diverse system for small mammals (and birds). As with other habitat types it is better to consider the entire habitat as a single entity e.g. river corridors as opposed to rivers and in this case the hedges and headlands along with the SRC crop. Within the crop, particularly after canopy closure, there is little ground flora and what there is, is often the aftermath of herbicide treatments and for this reason, wood mice
with their more catholic diets usually predominate. The peripheral hedges and headlands which are not usually chemically treated are valuable habitats with a coarse, species diverse flora favouring both the herbivores and insectivores (voles and shrews). The value of maintaining the small mammal interest in these areas is indisputable and requires further attention as it was not covered in this study. An additional value of coarse grass habitat to small mammals is suggested by the capture, in September 2008, at a Reed Canary Grass biomass site some 3 km from Oakwood, of several Harvest mice in Longworth traps.
90

Section 7: Invertebrate Fauna of Short Rotation Willow Coppice 7.1 The Aim of this part of the Study was to: Firstly, monitor the changes in invertebrate numbers over season in samples taken from the Oakwood and Hayscastle sites in May, June and August. Differences will be examined in invertebrate diversity as well as family diversity. The null hypothesis is that family diversity does not change over time or with season. Secondly, the size of willow coppice was investigated with comparisons drawn between the two plots at Oakwood, the small plot of two hectares and the large plot of six hectares. Thirdly, all samples from the willow taken in June are compared with the samples also
taken in June from adjacent rough but grazed pasture. As willow will be grown in place of sheep pasture, it is important to know diversity changes likely to occur as a result ofthe changes in land usage. For example, does the weed layer in the willow coppice offer greater floral diversity than grazed land and therefore does the willow offer greater heterogeneity? 7.2 Materials and Methods Invertebrate Sampling Two willow plots, one at Hayscastle of just under six hectares (grid reference SM904255) and the second at Oakwood (grid reference SN072126) were used. Both fields were planted with five varieties of willow Inger, Sven, Tordis, Tortilld and Tora. The two plots underwent separate treatments (see Table 1) and this may have some bearing on the invertebrate families found within the willow plantation.
Table 7.1 A list of the different treatments for the willow plots.
In both plots, vegetation surveys were carried out to standardise the sampling procedure.
Hayscastle site Oakwood site
Date Application Date Application 7th May
Sprayed with Round Up @5l/ha 7th May
Sprayed with touchdown @5l/ha
14th May
Dursban applied @1.25l/ha Sewage sludge applied Ploughed, Rolled and Secondary cultivation 16th May
Ploughed, Rolled and Power harrowed x2
16th May Planting 18th May Planting
20th May
Residual herbicides applied, Stomp @5l/ha and Flexidor @ 1l/ha 29th May
Residual herbicides applied, Stomp @5l/ha and Dursban @ 1.25l/ha
91

Figure 7.1. A window trap. Perspex 50 x 50cm, Tray 50 x 30cm. (Data from a second sheet and tray set at 2m are not presented).
Window traps as in Figure 1 were set in a 4 x 4 grid (five metres between rows and columns). A grid system was used as the plantations were different in shape and size and so the traps were set in the centre of the plot. This reduced the possibility that the invertebrates being caught came from the rides and surrounding fields allowing more reliable comparisons. When first set out, the ground was marked with the position of the traps so they could be placed in the same positions for every sampling period. Sixteen traps were laid out at each site. At the Hayscastle and the small Oakwood site traps were set out in May, June and August and these data were used for the evaluation of differences in populations of invertebrates over the seasons. In the large
Oakwood site and rough grazing field, the traps were only set up in June. In the trays of the traps, a mixture of water, alcohol and washing up liquid was placed. The washing up liquid broke the surface tension of the water ensuring that the invertebrates were killed and preserved by the alcohol. After four days, the invertebrates were collected using a pooter for smaller specimens and tweezers for the larger specimens. The specimens were then placed in clearly marked storage pots containing methanol. Identification to family level took place under an X30 microscope with the aid of various identification keys and textbooks.
92

7.3 Results Population Changes over the Season Figure 7.2 Changes of Numbers of Invertebrates over the Sampling Sessions
0
200
400
600
800
1000
1200
MAY JUNE AUGUST
Sampling Session
Num
ber
of In
verte
brat
es
OAKWOODHAYSCASTLE
In Graph 1 , it is clear that the population of invertebrates in the two plots behave very differently. The numbers of individual invertebrates from the Oakwood site decline to nearly half the number of invertebrates in
June. This decline continues into August, however, it is not as pronounced. At the Hayscastle site the number of invertebrates show a slight rise in June then by August they more than treble.
Figure 7.3 Number of Phoridae Flies over the Sampling Sessions
050
100150200
MAY JUNE AUGUST
Samplin
250300350400450500
g Session
Num
ber
of F
lies
Pho
r in th
e Fa
mily
of
idae OAKWOOD
HAYSCASTLE
Graph 2 shows that the patterns seen in Graph 1 are reflected for individual families.
93

Figure 7.4 Order Diversity at Oakwood and Hayscastle Sites in May.
The above pie charts show order diversity within the willow sites for the sampling session in May. The Diptera outweigh all others combined.
Figure 7.5 Order Diversity at Oakwood and Hayscastle Sites in June.
The pie charts above show the Order diversity for the small Oakwood and Hayscastle willow sites in June. When compared to the pie charts from May, they show that the proportion of Diptera has fallen. This reduction in Diptera is more pronounced at the Oakwood site, while the numbers of Araneae and Hemiptera have increased dramatically. At the Hayscastle site, however, all orders have increased equally.
Figure 7.6 Order Diversity at Oakwood and Hayscastle Sites in August.
The Diptera numbers in the pie chart for the Oakwood site in August have remained the same when compared with June’s pie chart. The Araneae numbers have dropped almost to what they were in May; Collembola numbers have also dropped. At the Hayscastle site however, Diptera numbers have returned to what they were in May and Hymenoptera numbers have risen while other orders numbers have dropped.
Order Diversity at the Oakwood Site in May
Acari
Araneae
Coleoptera
Collembola
Diptera
Hemiptera
Hymenoptera
Other
at the Hayscastle Site in May Order Diversity
Acari
Araneae
Coleoptera
Collembola
Diptera
Hemiptera
Hymenoptera
Other
Order Diversity at the Oakwood Site in June
Acari Araneae Coleoptera
Collembola
Diptera Hemiptera
Hymenoptera
Other
at the Hayscastle Site in June Order Diversity
Acari Araneae Coleoptera
Collem la bo
Diptera Hemiptera Hymenoptera Other
Order Diversity at the Oakwood Site in August Order Diversity at the Hayscastle Site in August
Acari Acari
Araneae Araneae
Coleoptera Coleoptera
Collem la Collembola bo
Diptera Diptera
Hemiptera Hemiptera
Hyme optera Hymenoptera n
Other Other
94

Table 7.2 Site differences in family diversity Site and Session Shannon’s Index Shannon’s Evenness Oakwood-May 2.41 0.50 Hayscastle-May 2.62 0.554 Oakwood-June 3.14 0.65 Hayscastle-June 3.19 0.66 Oakwood-August 3.06 0.63 Hayscastle-August 2.32 0.48 In May and June, the Hayscastle site has higher diversity and more evenness than the Oakwood site. In August however, this is reversed. The Oakwood site has higher diversity and evenness and the diversity is similar to the previous month. Out of the three sampling sessions June provided the highest diversity and most evenness. Table 7.3 Family Diversity for the Small and Large Oakwood Sites Sampled in June Willow Coppice Size Site Shannon’s Index Shannon’s Evenness Small Oakwood 3.14 0.65 Large Oakwood 2.64 0.55 The small Oakwood site has higher diversity and evenness than the large Oakwood site. Table 7.4. Family Diversity for all Willow Coppice Sites and Grazed Land in June Willow Compared with Grazed Land Site Shannon’s Index Shannon’s Evenness Oakwood Large 2.68 0.55 Oakwood Small 3.14 0.65 Hayscastle 3.19 0.66 Grazed Land 2.54 0.52 The Hayscastle site has the highest diversity and the highest evenness, closely followed by the small Oakwood site. The grazed land has the lowest diversity and evenness. 7.4 Discussion Environmental Impacts Concerns have been raised over the environmental impact of biomass crops. For example, the planting of a monoculture crop may reduce the biodiversity potential of a site and displace species that prefer open or grazed habitats. The application of herbicides and fertilisers may pollute watercourses and an established crop may have impacts of surrounding wetlands and
the hydrology of an area. There are also concerns that native and semi-native willows will cross breed with new varieties (The Wales Biomass Centre, 2004). Willow can be effectively managed as a low input system with few insecticide applications. Therefore, the introduction of short rotation coppice can lead to an increase in the diversity of plants and insects. Mature trees have a high tolerance for weeds and the closed canopy shades many out (Sage, 1998). Therefore, the application of herbicides is in general not required after the
95

establishment year. Synthetic fertilisers are not recommended for use on these crops and the use of organic materials is policed by the Environment Agency to prevent water pollution. Population Changes over the Season The null hypothesis of no difference between months is rejected; the diversity in June is higher than May and August for both sites. This justifies using June samples for the remaining comparisons. When looking at the changes over time within families the family Phoridae were used because they had the highest number of individuals caught in the samples. The confidence in their identification was also the highest. The changes that are seen in individual numbers over the season are mirrored in the family Phoridae. In Graph 1 it is clear that the number of species rises slowly between May and June then triples in August. The diversity and evenness also rises between May and June but then subsequently drops. The increase in number of individuals at Hayscastle can be attributed to six families, three of Diptera, Calliphoridae, Chironomidae and Phoridae, two Hymenoptera, Cynipidae and Trigonalyidae and the Phalangidae of the Araneae. Of these, the families Phoridae and Cynipidae show the biggest increases. The Cynipidae were absent in May and June then their total number rose to 110 in August. The Phoridae on the other hand were present in May and June, however, only in very small numbers (5 and 17 respectively) then they increased to 457. The increase in numbers of only a few families account for the decreased evenness that range between 0.48 and 0.66, showing no truly dominant species An H′ value of less than two shows low diversity. The Hayscastle site ranges between 2.32 to 3.19 showing good diversity. At the Oakwood site the number of individuals is high for May, then drops to nearly half, and drops again by only a few between June and August. Shannon’s H′ is
lowest in May showing the least diversity and the Shannon’s E is also at its lowest showing more dominance by only a few families. Over the sampling session Shannon’s H′ ranges from 2.41 to 3.14 showing a good level of diversity and E ranges between 0.50 and 0.65 indicating no true dominance of any particular family. Willow Coppice Size In an effort to increase agricultural productivity intensification of farmland management has occurred. The result of this has been the loss and degradation of non-cropped habitats including the removal of vegetation around crop edges because of ploughing, grazing up to the field edge and the drift from herbicide use (Perkins, 2002). Willow however, encourages the preservation of hedges and field margins as the machinery used for planting and harvesting requires large headlands for turning (The Welsh Biomass Centre, 2004). Many predatory invertebrates, for example, Carabid and Staphylinid beetles and spiders, overwinter outside the crop in field margins and hedgerows and are valuable as biological controls (Thomas et. al., 2002). Hedgerows provide over wintering refuges for invertebrates as they have taller vegetation that is more diverse (Pywell et. al., 2005). They also provide essential food sources and corridors for movement and aid the recovery of beneficial invertebrates after applications of pesticides. Farmland fragmentation and the loss of hedgerows are adversely influencing the diversity of invertebrates (Wratten et. al., 2003). The fragmentation of farmland is reduced when growing willow if fields are kept small. The economics of using biomass fuels dictate that they cannot be grown great distances from the end user meaning that plantation of these crops will not cause habitat fragmentation or completely cover the countryside (The Wales Biomass Centre, 2004). The benefit of having smaller willow plots is reinforced by small willow plots showing higher invertebrate diversity and evenness than the large plot. Again both
96

97
plots show a good level of diversity with H′ values being higher than two and the evenness values ranging between 0.5 and 0.65, showing no family having true dominance. Willow Compared with Grazed Land Habitat heterogeneity hypothesis predicts that the species number and abundance of arthropods will have an asymptotic relationship with increasing number of plant species and greater structural heterogeneity in the vegetation (Dennis et al. 1998). Most cropping practices severely limit plant diversity in favour of a single plant species and the diversity of a monoculture can be extremely low but because of crop rotation and intercropping, it may be higher at the landscape level and over time (Flint and Roberts, 1988). Both of these practices, however are impracticable for willow coppice. Sage (1999) on the other hand has shown that coppice growth in the second year was no different between weeded and unweeded plots and so no further use of herbicides is needed and a weed layer will naturally establish. This weed layer will increase vegetation heterogeneity and managing weed populations in this way within crops is one way to curb the recent decline in insect and bird populations in Britain (Marshall et al 2003). The results in Table 5 show the diversity levels for the four plots in June. It shows that the Hayscastle sites has the highest diversity at 3.19 and the highest evenness at 0.66 and Table 2 shows that the Hayscastle site also has more species of plants in the weed layer. The relatively simple structure of grasslands is exclusively situated at the interface of the soil and the atmosphere; therefore the intensively managed grasslands have a much reduced complexity. Grazing has three effects on the grassland: defoliating, manuring and treading which produces a characteristic short and evenly textured landscape (Morris, 2000) that according to
Dennis et. al. (1998) will produce lower invertebrate diversity. This too is reflected in Table 5, the grazed land has the lowest diversity and evenness of all plots tested. Experimental Limitations Table 1 shows the treatments applied to the willow plots, both plots used residual herbicides however, this should have the same effect on the weed layer in both plots. The use of sewage sludge would not only act as a fertiliser for the willow but for the weed layer too. The cultivation and harrowing of the land would redistribute the seeds in the soil and may have affected the composition of plants found in the weed layer. As seen in the vegetation surveys in both of the willow plots, four out of the five top species are the same and do not greatly influence the families of invertebrates. The sampling technique was designed to intercept only flying insects. However, from the family list (see Appendix ) many non-flying invertebrates were collected. This may have meant that these invertebrates were only a fraction of the numbers actually present in the plots and their abundance was much greater. If the sampling was to be repeated, other methods (i.e. pitfalls and/or soil coring) may be considered for use in conjunction with the window traps or only the flying insects be incorporated into the calculations for diversity. Most studies of diversity are relatively insensitive to the type of index applied or even if any at all are used in place of a simple count of species presence. This is because communities have characteristic patterns of relative abundances among their species. These patterns result in each diversity index bearing a consistent relationship to all other indices, as well as to the number of species in the community. All diversity indices are predictably related in some way to species richness, if normalised then species richness alone would be a good measure of comparison (Ricklefs and Schluter, 1993.

Section 8: Final Discussion and Conclusions
8.1 Main findings This report found that planting SRC in Wales could be of significant benefit to biodiversity. Weed floral diversity and abundance would be increased and this would have significant knock on benefits for a wide range of bird species including those contributing to the government’s Wild Bird Index. Specifically:
i) Weed floral diversity and species richness are significantly increased by planting SRC (Section 2)
ii) young SRC fields produce substantial amounts of weed seeds easily utilised
by many bird species during the winter (Section 3)
iii) SRC provides valuable habitat for diverse bird communities during the breeding season. As the crop matures the bird community changes but in particular, increasing numbers of migrant warblers are recorded utilising the crop (Section 4)
iv) SRC is a highly beneficial addition to the landscape for Willow warblers and
could significantly increase the productivity of this declining species (Section 5).
v) Large mammals such as badgers benefit from the cover and forage offered by
SRC although hares can damage young crops. Small mammals are often abundant especially in the peripheral hedgerows and headlands.
This report shows the potential of SRC to help the government reach targets agreed by The Convention on Biological Diversity. Incorporating SRC into the Welsh landscape would help the wider environment support an increased level of biodiversity, a main theme in the Environment Strategy for Wales (WAG 2006). Although the sites in this study were intended to be treated as a commercial crop the planters and growers had little or no previous experience of this crop. They may therefore have been weedier than future commercially managed plots. However, even at sites where particularly aggressive chemical spaying occurred there was a relative abundance of weed species. In the
future, weed control will probably be refined and become increasingly effective, rendering SRC less valuable for enhancing biodiversity unless discouraged by agri-environment schemes. In the UK, each devolved country has its own agri-environment scheme, and in Wales this is Tir Gofal. Tir Gofal operates competitively, such that farmers must apply and obtain a certain number of points if they wish to join the scheme. Points are awarded for a range of habitats, environmental features and farm characteristics. Once approved, each agreement is for a minimum of 5 years, and there are currently over 3000 farms in Wales in Tir Gofal covering over 300,000 hectares of land.
98

Including SRC in Welsh agri-environment schemes could significantly increase the floral diversity of Welsh farmland and positively effect associated taxa. Making it beneficial for farmers to be less aggressive in their control of weeds within this crop would allow it to realize its biodiversity potential and help the government to reach its biodiversity targets. With the EU Agriculture Council’s decision to set a 0% rate of set-aside for 2008, farming will loose valuable areas of nil or low chemical input. SRC could be of particular importance, as it will inevitably reduce the chemical input into farming systems. Although the loss of set-aside will not be particularly felt in Wales, any new farming system which reduces the level of intensity would be beneficial anywhere in the UK. The importance of maintaining the integrity of landscape features, such as hedgerows and old trees has been highlighted (Chapter 4 and 5, Sage et al. 2006). If biomass crops become more widely grown it is likely that larger blocks will be planted. If biodiversity is to be encouraged measures must be implemented to preserve the integrity of landscape features. Smaller plantings could be encouraged or larger plots broken up with rides or hedges. Maintaining a mix of coppice age is also important to maximise the benefits to the widest range of bird species (Chapter 4). Despite the benefits to birds, it is unlikely that SRC planted on unimproved farmland would lead to a conservation gain (Sage et al. 2006). However, Wales is currently dominated by improved grazing habitat which is become increasingly impoverished in terms of biodiversity (Vickery et al. 2002, Fuller and Gough 1999, Fuller et
al. 2006). In this context, the addition of SRC into the landscape would lead to massive benefits to all aspects of biodiversity. The landscape into which SRC is introduced will effect the species recorded with in it (Christian et al. 1994, Perttu 1995, Tolbert and Wright 1998, Coates and Say 1999, Starback and Becht 2005, Anderson and Fergusson 2006, Rowe et al. 2007). For highly mobile animals in particular such as birds, landscape composition plays a central role in determining occupancy of plantations (Christian et al. 1998) and adjacent habitats have a strong influence on the bird community composition in the SRCs (Berg 2002). This study was based on plots generally no more than 5ha set in conventional Welsh farmland. As demand for biomass grows and more of the Welsh landscape is planted with these crops this will inevitably have an effect on biodiversity and this should be taken into account when considering these results.
99

100
8.2 Conclusions This report demonstrates that SRC could significantly contribute to enhancing biodiversity and meeting government targets. It highlights the importance of adapting agri-environment schemes to new agricultural developments. Future studies need to address the lack of direct measures of productivity for birds in SRC. Studies which address breeding productivity issues such as nest survival, hatching and fledging rates from nests at SRC sites with other land uses need to be implemented. It is unclear whether other biomass crops such as energy grasses will also provide habitat for birds. Work has been undertaken on a small number of sometimes weedy fields (Semere and Slater 2005). It has been suggested that they might provide good summer and winter foraging if they contain weeds and insects similar to SRC. However, willow is a native tree known to be high in insect abundance (Kennedy and Southward 1984) in contrast to energy grasses which are foreign introductions and have been shown to provide less insect food than winter crop plants (Bellamy et al. 2008). Further investigation is warranted.
• SRC has higher plant diversity than adjacent improved grazed pasture.
• SRC has higher small mammal diversity than improved pasture
• Early rotation SRC is rich in arable weeds – a food resource for birds.
• SRC has greater diversity of invertebrate life than adjacent land.
• SRC can form corridor stepping stones for wildlife movement.
• SRC is richer in migrant passerine birds than comparable scrub.
• Hedges and headlands should be considered as part of the overall biodiversity value of SRC.
• SRC is likely to be a crop of increasing economic value and because of i ts biological value should be included in Agri-Stewardship schemes.

References Abrahamson, L.P., Robison, D.J., Volk, T.A., White, E.F., Neuhauser, E.F., Benjamin, W.H. and Peterson, J.M. (1998) Sustainability and environmental issues associated with willow bioenergy development in New York (U.S.A.). Biomass and Bioenergy, 15: 17-22. Aebischer, N.J., Green, R.E. and Evans, A.D. (2000) From science to recovery: four case studies of how research has been translated into action in the UK. Pages 43-54 in: Aebischer, A.D., Evans, A.D., Grice, P. and Vickery, J. eds. Ecology and Conservation of Lowland Farmland Birds. British Ornithologists Union, Tring, UK. Aebischer, A., Perrin, N., Krieg, M., Studer, J. and Meyer, D.R. (1996) The role of territory choice, mate choice and arrival date on breeding success in the Savi's warbler Locustella luscinioides. Journal of Avian Biology, 27: 143-152. Alignier, A., Meiss, H., Petit, S. and Reboud, X. (2008) Variation of post-dispersal weed seed predation according to weed species, space and time. Journal of Plant Diseases and Protection, 21: 221-226. Alatalo, R.V., Lundberg, A. and Glynn, C. (1986) Female pied flycatchers choose territory quality and not male characteristics. Nature, 323: 152-153. Alldredge, J.R. and Ratti, J.T. (1986) Comparisons of some statistical techniques for analysis of resource selection. Journal of Wildlife Management, 50: 157-165. Alldredge, J.R., and Ratti, J.T. (1992) Further comparisons of some statistical techniques for analysis of resource selection. Journal of Wildlife Management, 56: 1-9. Amar, A., Hewson, C.M., Thewlis, R.M., Smith, K.W., Fuller, R.J., Lindsell, J.A., Conway, G., Butler, S. and MacDonald, M.A. (2006) What’s happening to our woodland birds? Long-term changes in the populations of woodland birds. BTO Research Report 169 & RSPB Research Report 19. Thetford: BTO and Sandy: RSPB. Anderson, L. (1998) Post-dispersal seed removal in some agricultural weeds. Aspects of Applied Biology, 51: 159-164. Anderson, G.Q.A. and Fergusson, M.L. (2006) Energy from biomass in the UK: sources, processes and biodiversity implications. Ibis, 148: 180-183. Andreasen, C., Strythn H. and Streibig J. C. (1996) Decline of the flora in Danish arable fields. Journal of Applied Ecology, 33: 619-626. Anon. (1995) Biodiversity. The Steering Group Report, vol 2 Action Plans. HMSO, London.
101

Arvidsson, B.L. and Neergaard, R. (1991) Mate choice in the willow warbler – a field experiment. Behavioural Ecology and Sociobiology, 29: 225-229. Atkinson, P.W., Fuller, R.J., Vickery, J.A., Conway, G.J., Tallowin, J.R.B., Smith, R.E.N., Haysom, K.A., Ings, T.C., Asteraki, E.J. and Brown, V.K. (2005a) Influence of agricultural management, sward structure and food resources on grassland field use by birds in lowland England. Journal of Applied Ecology, 42: 932-942. Atkinson, P.W., Fuller, R.A., Gillings, S., and Vickery., J.A. (2005b) Counting birds on farmland habitats in winter. Bird Study, 53: 303-309. Baillie, S.R., Marchant, J.H., Crick, H.Q.P., Noble, D.G., Balmer, D.E., Barimore, C., Coombes, R.H., Downie, I.S., Freeman, S.N., Joys, A.C., Leech, D.I., Raven, M.J., Robinson, R.A. & Thewlis, R.M. (2007) Breeding Birds in the Wider Countryside: their conservation status 2007. [online]. BTO Research Report No. 487. BTO, Thetford. Available at: http://www.bto.org/birdtrends [Accessed: 09-09-2008]. Barg, J.J., Jones, J. and Robertson, R.J. (2005) Describing territories of migratory passerines: suggestions for sampling, choice of estimator, and delineation of core areas. Journal of Animal Ecology, 74: 139-149. Barkow, A. (2005) Predation on passerine nests in hedges: the impact of nest placement, hedge structure, season and predators. Vogelwelt, 126: 346-352. Barnett, P.R., Whittingham, M.J., Bradbury, R.B. and Wilson, J.D. (2004) Use of unimproved and improved lowland grassland by wintering birds in the UK. Agriculture, Ecosystems and Environment, 102: 49-60. Baxter, D.A., Sage, R.B. and Hall, D.O. (1996) A method for assessing gamebird use of short rotation coppice. Biomass and Bioenergy, 10: 301-366. Bazzaz, F.A. (1979) The physiological ecology of plant succession. Annual Review of Ecology and Systematics, 10: 351-371. Bednekoff, P.A., Biebach, H., and Krebs, J.R. (1994) Great tit fat reserves under unpredictable temperatures. Journal of Avian Biology, 25: 156-160. Beecher, N.A., Johnson, R.J. Brandle, J.R., Case, R.M. and Young, L.J. (2002) Agroecology of birds in organic and nonorganic farmland. Conservation Biology, 16: 1620-1632. Bellamy, P.E., Croxton, P.J., Heard, M.S., Hinsley, S.A., Hulmes, L., Hulmes, S. and Nuttall, P. (2008) The impact of growing miscanthus for biomass on farmland bird populations. Biomass and Bioenergy, doi:10.1016/j.biombioe.2008.07.001. Benkman, C.W., and Pulliam, H.R. (1988) The comparative feeding rates of North American sparrows and finches. Ecology, 69: 1195-1199. Benoit, D.L., Kenkel, N.C. and Cavers, P.B. (1989) Factors influencing the precision of soil seed bank estimates. Canadian Journal of Botany, 67: 2833-2840.
102

Benton, T.G., Vickery, J.A. and Wilson, J.D. (2003) Farmland biodiversity: is habitat heterogeneity the key? Trends in Ecology and Evolution, 18: 182-188. Benton, T.G., Bryant, D.M., Cole, L. and Crick, H.Q.P. (2002) Linking agricultural practice to insect and bird populations: a historical study over three decades. Journal of Applied Ecology, 39: 673-687. Berg, A. (2002) Breeding birds in short-rotation coppices on farmland in central Sweden-the importance of Salix height and adjacent habitats. Agriculture, Ecosystems and Environment, 90: 265-276. Bergstrom, R. and Guillet, C. (2002) Summer browsing by large herbivores in short-rotation willow plantations. Biomass and Bioenergy, 23: 27-32. Beyer, H.L. (2004) Hawth's Analysis Tools for ArcGIS. [online]. Available at: http://www.spatialecology.com/htools [Accessed: 31-03-2008]. Biesmeijer J.C., Roberts M.S.P., Reemer M., Ohlemüller R., Edwards M., Peeters T., Schaffers A.P., Potts S.G., Kleukers R., Thomas C.D., Settele J. and Kunin W.E. (2006) Parallel Declines in Pollinators and Insect-Pollinated Plants in Britain and the Netherlands. Science, 313: 351-354. BirdLife International (2004) Birds in Europe: population estimates, trends and conservation status. BirdLife Conservation Series No. 12. BirdLife International, Cambridge. (BiE04) Birdlife International. (2007) Are bird’s good indicators? [online]. Birdlife International. Available at: http://www.birdlife.org/action/science/indicators/birds_as_indicators.html [Accessed: 11-08-2008]. Biodiversity Reporting and Information Group (2007) Report on the Species and Habitat Review. [online]. Report to the UK Biodiversity Partnership. Available at: http://www.ukbap.org.uk/bapgrouppage.aspx?id=112 [Accessed: 31-03-2008]. Bjoernstad, G. and Lifjeld, J.T. (1996) Male parental care promotes early fledging in an open-nester, the willow warbler Phylloscopus trochilus. Ibis, 138: 229-235. Blackstock, T.H., Burrows, C.R., Howe, E.A., Stevens, D.P. and Stevens, J.P. (2007) Habitat inventory at a regional scale: a comparison of estimates of terrestrial broad habitat cover from stratified sample field survey and full census field survey for Wales, UK. Journal of Environmental Management, 85: 224-231. Blem, C.R. (1975) Geographic variation in wing-loading of the house sparrow. Wilson Bulletin, 87: 543-549. Blendinger, P.G. and Ojeda, R.A. (2001) Seed supply as a limiting factor for granivorous bird assemblages in the Monte Desert, Argentina. Austral Ecology, 26: 413-422.
103
Blomqvist, D. and Johansson, O.C. (1995) Trade-offs in nest site selection in coastal populations of lapwings Vanellus vanellus. Ibis, 137: 550-558. Boatman,N.D., Brickle, N.W., Hart, J.D., Milson, T.P., Morris, A.J., Murray, A.W.A., Murray, K.A. and Robertson, P.A. (2004) Evidence for the indirect effects of pesticides on farmland birds. Ibis, 146: 131-143. Borjesson, P. (1999) Environmental effects of energy crop cultivation in Sweden - I: Identification and quantification. Biomass & Bioenergy, 16: 137-154. Both, C. and Visser, M.E. (2000) Breeding territory size affects fitness: an experimental study on competition at the individual level. Journal of Animal Ecology, 69: 1021-1030. Bradbury, R.B., Kyrkos, A., Morris, A.J., Clark, S.C., Perkins, A.J. and Wilson, J.D. (2000) Habitat associations and breeding success of yellowhammers on lowland farmland. Journal of Applied Ecology, 37: 789-805. Bradbury, R.B., Bailey, C.M., Wright, D. and Evans, A.D. (2008) Wintering Cirl Buntings Emberiza cirlus in southwest England select cereal stubbles that follow a low-input herbicide regime. Bird Study, 55: 23-31. Bray, J.R., and Curtis, C.T. (1957) An ordination of the upland forest communities of southern Wisconsin. Ecological Monographs, 27: 325-349. Brickle, N.W., Harper, D.G.C., Aebischer, N.J. and Cockayne, S.H. (2000) Effects of agricultural intensification on the breeding success of Corn Buntings Miliaria calandra. Journal of Applied Ecology, 37: 742-755. Britt, C. (2000) Weed control in short rotation coppice crops. A review of recently published literature and current guidance for farmers. Report ETSU B/W2/00579/REP/3. A report for the Department of Trade and Industry by ADAS Consulting Ltd. Bro, E., Mayot, P., Corda, E. and Reitz, F. (2004) Impact of habitat management on Grey partridge populations: assessing wildlife cover using a multi-site BACI experiment. Journal of Applied Ecology. 41: 846-857. Buckingham, D.L., Atkinson, P.W. and Rook, A.J. (2004) Testing solutions in grass-dominated landscapes: a review of current research. Ibis, 146: 163-170. Bulla, L. (1994) An index of evenness and its associated diversity measure. Oikos, 70: 167-171. Burst, G.E. and House, G.J. (1988) Weed seed destruction by arthropods and rodents in low-input soybean agroecosystems. American Journal of Alternative Agriculture, 3: 19-25.
104

Buxton, J.M., Crocker, D.R. and Pascual, J.A. (1999) Birds and farming; Information for risk assessment. Commission PN0919. MAFF Pesticides Safety Directorate. Byers, C.R., Steinhorst, R.K. and Krasuman, P.R. (1984) Classification of a technique for analysis of utilisation-availability. Journal of Wildlife Management, 48: 1050-1053. Byrant, D.M. (1973) The factors influencing the selection of food by house martin (Delichon urbica L.). Journal of Animal Ecology, 42: 742-755. Byrant, D.M. (1975) Breeding biology of house martins Delichon urbica in relation to aerial insect abundance. Ibis, 117: 180-216. Campbell, L.H., Avery, M.I., Donald, P., Evans, A.D., Green, R.E. and Wilson, J.D. (1997) A review of the indirect effects of pesticides on birds. JNCC Report 227, Joint Nature Conservation Committee, Peterborough, UK. Cambell, L.H., Avery, M.I., Donald, P.F., Evans, A.D., Green, R.E. and Wilson, J.D. (1997) A review of the indirect effects of pesticides on birds. JNCC Report 227. Joint Nature Conservation Committee, Peterborough. Cardina, J., Norquay, H.M., Stinner, B.J. and McCartney, D.A. (1996) Post dispersal predation of velvetleaf (Abutilon theophrasti) seeds. Weed Science, 44: 534-539. Carson, R. (1962) Silent Spring. London: Hamilton. CEH. (2000) Landcover Map LC2000 [online] Centre for Ecology and Hydrology. Available at: http://www.ceh.ac.uk/sections/seo/sample_download.html [Accessed 07-08-2007]. Chalfoun, A.D. and Martin, T.E. (2007) Assessments of habitat preferences and quality depend on spatial scale and metrics of fitness. Journal of Applied Ecology, 44: 983-992. Chamberlain, D.E. and Fuller, R.J. (2000) Local extinctions and changes in species richness of lowland farmland birds in England and Wales in relation to recent changes in agricultural land-use. Agriculture, Ecosystems and Environment, 78: 1-17. Chamberlain, D.E., Fuller, R.J., Bunce, R.G.H., Duckworth, J.C. and Shrubb, M. (2000) Changes in the abundance of farmland birds in relation to the timing of agricultural intensification in England and Wales. Journal of Applied Ecology, 37: 771-788. Chinery, M. 1993. Field guide insects of Britain and Northern Europe. Third edition. Printing Express Limited, Hong Kong. Christensen, K.E. Jacobsen, E.M. and Nohr, H. (1996) A comparative study of bird faunas in conventionally and organically farmed areas. Dansk Orntlogissk Forenings Tidsskrift, 90: 21-28.
105

Christian, D.P., Niemi, G.J., Hanowski, J.M. and Collins P. (1994) Perspectives on biomass energy tree plantations and changes in habitat for biological organisms. Biomass and Bioenergy, 6: 31-39. Christian, D.P., Hoffman, W., Hanowski, J.M., Niemi, G.J. and Beyea, J. (1998) Bird and mammal diversity on woody biomass plantations in North America. Biomass and Bioenergy, 4: 395-402. Clarke, K.R. and Warwick, R.M. (2001) Change in marine communities; an approach to statistical analysis and interpretation, 2nd edn. Plymouth Marine Laboratory, UK: PRIMER-E Ltd. Clay, D.V. and Parfitt, R.I. (1994) Evaluation of residual and foliar-acting herbicides on poplar and willow cultivars. Report ETSU B/N2/00132/Rep. 24pp. A report for the Department of Trade and Industry by Avon Vegetation Research and Long Ashton Research Station. Clay, D.V. and Dixon, F.L. (1997) Effect of ground-cover vegetation on the growth of poplar and willow in short-rotation coppice. Aspects of Applied Biology, 49: 53-60. In: Biomass and Energy Crops. Clay, J. (2004) World Agriculture and the Environment: A Commodity-by-Commodity Guide to Impacts and practices. Island Press, Washington DC. Coates, A. and Say, A. (1999) Ecological assessment of short rotation coppice. Report ETSU B/W5/00216/00/REPORT/1-3. A report for the Department of Trade and Industry. Cody, M.L. (1974) Competition and the Structure of Bird Communities. Princeton University Press, Princeton, NJ. Colwell, R.K. (2000) EstimateS-statistical estimation of species richness and shared species from samples Version 6. User’s guide and application. [online]. Available at: http://viceroy.eeb.uconn.edu/EstimateS [Accessed: 09-09-2008]. Conrad, K.F., Warren, M.S., Fox, R, Parsons, M.S. and Woiwod, I.P. (2006) Rapid declines of common, widespread British moths provide evidence of an insect biodiversity crisis. Biological Conservation, 132: 279-291. Critchley, C.N.R. and Fowbert, J.A. (2000) Development of vegetation on set-aside land for up to nine years from a national perspective. Agriculture, Ecosystems and Environment, 79: 159-173. Critchley, C.N.R., Fowbert, J.A. and Sherwood, A.J. (2006) The effects of annual cultivation on plant community composition of uncropped arable field boundary strips. Agriculture, Ecosystems and Environment, 113: 196-205. Cunningham, M.D., Bishop, J.D., McKay, H.V. and Sage, R.B. (2004a) Vegetation within SRC and arable plots. Pages 45-84 in: ARBRE monitoring - ecology of short rotation coppice. Report B/U1/00627/REP. URN 04/961. A report for the Department
106

of Trade and Industry by The Game Conservancy Trust and The Central Science Laboratory. Cunningham M.D., Bishop, J.D., McKay, H.V. and Sage, R.B. (2004b) The ecology of short rotation coppice crops – ARBRE monitoring. B/U1/00727/00/REP. FES, Harwell, Oxford. Cunningham, M.D., Bishop, J.D., McKay, H.V. and Sage, R.B. (2004c) ARBRE monitoring - ecology of short rotation coppice. Report B/U1/00627/REP. DTI/PUB URN 04/961. A report for the Department of Trade and Industry by The Game Conservancy Trust and The Central Science Laboratory. Cunningham M.D., Bishop, J.D., Watola, G., McKay, H.V. and Sage, R.B. (2006) The effects on flora and fauna of converting grassland to short rotation coppice. Report B/W2/00738/00/00. URN: 06/1094. A report for the Department of Trade and Industry by The Game Conservancy Trust and The Central Science Laboratory. Daan, S., Dijkstra, C. and Timbergen, J.M. (1990) Family planning in the Kestrel (Falco tinnunculus): the ultimate control of covariation of laying date and clutch size. Behaviour, 114: 83-116. Daily, G.C. (1997) Nature’s services: Societal dependence on natural ecosystems. Island Press, Washington DC. Dennis, P., Young M. R. Gordon I. J. 1998. Distribution and abundance of small insects and arachnids in relation to structural heterogeneity of grazed, indigenous grasslands. Ecological Entomology 23 (3), 253-264 Defra. (2004) Best practice guidelines for applicants to Defra’s energy crop scheme: Growing short rotation coppice. [online]. Department for the Environment, Food and Rural Affairs and England Rural Development Programme. Available at: http://www.defra.gov.uk/erdp/pdfs/schemes/energy/short-rotation-coppice.pdf [Accessed: 11-08-2008]. Defra. (2007) UK biomass strategy. [online]. London: Department for the Environment, Food and Rural Affairs. Available at: www.defra.gov.uk/Environment/climatechange/uk/energy/renewablefuel/pdf/ukbiomassstrategy-0507.pdf [Accessed: 11-08-2008]. Defra. (2007b) Opportunities and optimum sitings for energy crops. [online]. London: Department for the Environment, Food and Rural Affairs. Available at: http://www.defra.gov.uk/farm/crops/industrial/energy/opportunities/index.htm [Accessed: 11-08-2008]. Defra. (2008) Sustainable development indicators in your pocket 2008. London: Department for Environment, Food and Rural Affairs. DETR. (1998) Sustainability counts: Consultation paper on a set of ‘Headline indicators of sustainable development. London: Department of the Environment, Transport and Regions.
107

DETR. (1999) A better quality of life-a strategy for sustainable development for the United Kingdom. London: Department of the Environment, Transport and Regions. Dhont, A.A., Werge, P.H., Sydenstricker, K.V. and Cerretani, J. (2004) Clone preference by nesting birds in short-rotation coppice plantations in central and western New York. Biomass and Bioenergy, 27: 429-435. Dhont, A.A., Wrege, P.H., Cerretani, J. and Sydensticker, K.V. (2007) Avian species richness and reproduction in short-rotation coppice habitats in central and western New York. Bird Study, 54: 12-22. Diaz, M. (1996) Food choice by seed-eating birds in relation to seed chemistry. Comparative Biochemical Physiology, 113A: 239-246. Dill, L.M. (1987) Animal decision making and its consequences: the future of aquatic ecology and behaviour. Canadian Journal of Zoology, 65: 803-811. Donald, P.F. (1998) Changes in abundance of invertebrates and plants in British farmland. British Wildlife, 9: 279-289. Donald, P.F., Green, R.E. and Heath, M.F. (2001) Agricultural intensification and the collapse of Europe’s farmland bird populations. Proceedings of the Royal Society London B, 286: 25-29. Donald, P.F., Sanderson, F.J., Burfield, I.J. and van Bommel, F.P.J. (2006). Further evidence of continent-wide impacts of agricultural intensification on European farmland birds, 1990-2000. Agriculture, Ecosystems and Environment, 116: 189-196. EBCC. (2007) The State of Europe's Common Birds, 2007. [online]. European Bird Census Council. Pan-European Common Bird Monitoring (PECBM) CSO/RSPB, Prague. Available at: http://www.ebcc.info/index.php?ID=342&basket=3fca20860f33f35ea241813d67e4e026 [Accessed: 31-03-2008]. Eggers, S., Griesser, M., Anderson, T. and Ekman, J. (2005) Nest predation and habitat change interact to influence Siberian jay numbers. Oikos, 111: 150-158. El Bassam, N. (1998). Energy plant species: their use and impact on environment and development. London: Earthscan. Ekman, J.B. and Hake, M.K. (1990) Monitoring starvation risk: adjustments of body reserves in greenfinches (Carduelis chloris L.) during periods of unpredictable foraging success. Behavioural Ecology, 1: 62-67. Ekman, J.B. and Lilliendahl, K. (1995) Using priority to food access: fattening strategies in dominance-structured willow tit (Parus montanus) flocks. Behavioural Ecology, 4: 232-238.
108

Enemar, A., Klaesson, P. and Sjostrand, B. (1979) Accuracy and efficiency of mapping territorial willow warblers Phylloscopus trochilus: a case study. Oikos, 33: 176-181. Enstom, D.A. (1992) Delayed plumage maturation in the orchard oriole (Icterus spurious): Tests of winter adaptation hypotheses. Behavioural Ecology and Sociobiology, 30: 262-279. Flint, M. L., Roberts, P. A. 1988. Using crop diversity to manage pest problems: some Californian examples. American Journal of Alternative Agriculture (3) 163-167. Flood, N.J. (1984) Adaptive significance of delayed plumage maturation in male northern orioles. Evolution, 38: 262-279. Francis, C.M. and Crooke, F. (1986) Differential timing of spring migration in wood warblers. Auk, 103: 548-556. Freed, L.A. (1981) Loss of mass in breeding wrens: stress or adaptation? Ecology, 1: 62-67. Freemark, K. and Boutin, C. (1995) Impacts of agricultural herbicide use on terrestrial wildlife in temperate landscapes: A review with special reference to North America. Agriculture, Ecosystems and Environment, 52: 67-91. Freemark, K.E. and Kirk, D.A. (2001) Birds on organic and conventional farms in Ontario: partitioning effects of habitat and practices on species composition and abundance. Biological Conservation, 101: 337-350. Fuller, R.J. and Henderson, A.C.B. (1992) Distribution of breeding songbirds in Bradfield Woods, in relation to vegetation and coppice management. Bird Study, 43: 28-37. Fuller, R.J., Gregory, R.D., Gibbons, D.W., Marchant, J.H., Wilson, J.D., Baillie, S.R. and Carter, N. (1995) Population declines and range contractions among lowland farmland birds in Britain. Conservation Biology, 9: 1425-1441. Fuller, R.J. and Gough, S.J. (1999) Changes in sheep numbers in Britain: Implications for bird populations. Biological Conservation, 103: 73-89. Fuller, R.J., Hinsley, S.A. and Swetnam, R.D. (2004) The relevance of non-farmland habitats, uncropped areas and habitat diversity to the conservation of farmland birds. Ibis, 146: 22-31. Fuller, R.J., Noble, D.W., Smith, K.W. and Vanhinsbergh, D. (2005) Recent declines in populations of woodland birds in Britain: a review of possible causes. British Birds, 98: 116-143. Fuller, R.J., Atkinson, P.W., Garnett, M.C., Conway, G.J., Bibby, C.J, and Johnstone, I.G. (2006) Breeding bird communities in the upland margins (ffridd) of Wales in the mid-1980s. Bird Study, 53: 177-186.
109

Gibbons, D.W., Bohan, D.A., Rotheray, P., Stuart, R.C., Haughton, A.J., Scott, R.J., Wilson, J.D., Perry, J.N., Clarke, S.J., Dawson, J.G. and Firbank, L.G. (2006) Weed seed resources for birds in fields with contrasting conventional and genetically modified herbicide-tolerant crops. Proceedings of the Royal Society, 273: 1921-1928. Gibson, R.H., Newton, I.L., Hopkins, G.W., Hamlett, B.J. and Memmot, J. (2006) Pollinator webs, plant communities and the conservation of rare plants: arable weeds as a case study. Journal of Applied Ecology, 43: 246-257. Gill, D. and Slater, P.J.B. (2000) Multiple song repertoire characteristics in the willow warbler (Phylloscopus trochilus): correlations with female choice and offspring viability. Behavioural Ecology and Sociobiology, 47: 319-326. Gil, D., Cobb, J.L.S. and Slater, P.J.B. (2001) Song characteristics are age dependant in the Willow warbler, Phylloscopus trochilus. Animal Behaviour, 62: 689-694. Gillings, S., Fuller, R.J. and Henderson, A.C.B. (1998) Avian community composition and patters of bird distribution within birch-heath mosaics in north-east Scotland. Ornis Fennica. 75: 27-37. Gillings, S. and Fuller, R.J. (1998) The breeding bird community of upland Juniper scrub in eastern Scotland. Scottish Birds, 19: 231-238. Gillings, S., Newson, S.E., Noble, D.G. and Vickery, J.A. (2005) Winter availability of cereal stubbles attracts declining farmland birds and positively influences breeding population trends. Proceedings of the Royal Society B, 272: 733-739. Godfrey, J.D. and Bryant, D.M. (2003) Effects of radio transmitters: Review of recent radio-tracking studies. Pp. 83-95 in: Williams, M, (Comp) 2003: Conservation applications of measuring energy expenditure of New Zealand birds: Assessing habitat quality and costs of carrying radio-transmitters. Science for Conservation 214.95 p. Goransson, G. (1990) Energy foresting in agricultural areas and changes in the avifauna. In: Hafton, S. (Ed.), Proceeding of the Sixth Nordic Congress of Ornithology, 1987. Norsk Ornitologist Forening, Trondeheim, pp. 17-20. Goransson, G. (1994) Bird fauna of cultivated energy shrub forests at different heights. Biomass and Bioenergy, 6: 49-52. Gosler, A.G. (1996) Environmental and social determinants of winter fat storage in the great tit Parus major. Journal of Animal Ecology, 65: 1-17. Green, R.E. (1984) The feeding ecology of and survival of partridge chicks (Alectoris rufa and Perdix perdix) on arable farmland in East Anglia. Journal of Applied Ecology, 21: 817-830.
110

Green, B.H. (1990) Agricultural intensification and the loss of habitat, species and amenity in British grasslands: a review of historical change and assessment of future prospects. Grass and Forage Science, 45: 365-372. Greig-Smith, P. (1983). Quantitative plant ecology. 3rd edition. Blackwell Scientific Publications, Oxford. Gregory, R.D., Noble, D.G., Field, R., Marchant, J.H., Raven, M. and Gibbons, D.W. (2003) Using birds as indicators of biodiversity. Ornis Hungarica, 12-13: 11-24. Grice, P., Evans, A., Osmond, J. and Brand-Hardy, R. (2004) Science into policy: the role of research in the development of a recovery plan for farmland birds in England. Ibis, 146: 239-249. Grime, J.P., Hodgeson, J.G. and Hunt, R. (1988) Comparative plant ecology. Unwin Hymen, London. Groom, D.W. (1993) Magpie Pica pica predation on blackbird Turdus merula nests in urban areas. Bird Study, 40: 55-62. Guillet, C. and Bergstrom, R. (2006) Comensatory growth of fast-growing willow (Salix) coppice in response to simulated large herbivore browsing. Oikos, 113: 33-42. Gurnell, J., Hicks, J. and Whitbread, S. (1992) The effects of coppice management on small mammal populations. Pp213-232. In: Buckley, G.P. Ecology and Management of coppice woodlands. Kluwer Academic Publisher,UK. Gustafsson, L. (1986) Vegetation and flora of short-rotation willow stands from a conservation viewpoint. Report 23, Swedish University of Agricultural Sciences. Haddad, N.M., Tilman, D. and Haarstad, J. (2001) Contrasting effects of plant richness and composition on insect communities: a field experiment. American Naturalist, 158: 17-35. Hart, J.D., Milsom, T.P., Fisher, G., Wilkins, V., Moreby, S.J., Murray, A.W.A. and Robertson, P.A. (2006). The relationship between yellowhammer breeding performance, arthropod abundance and insecticide applications on arable farmland. Journal of Applied Ecology, 43: 81-91. Hasselquist, D. (1998) Polygyny in great reed warblers: a long-term study of factors contributing to male fitness. Ecology, 79: 2376-2390. Heaton, R.J. (2000) The silviculture, nutrition and economica of short rotation willow coppice in the uplands of mid-Wales. PhD Thesis. University of Wales, Cardiff. Heisey, D.M. (1985) Analysing selection experiments with log-linear models. Ecology, 66: 1744-1748. Henderson, I.G., Vickery, J.A. and Carter, N. (2004) The use of winter bird crops by farmland birds in lowland England. Biological Conservation, 118: 21-32.
111

Hill, G.E. (1988) The function of delayed plumage maturation in male black-headed grosbeaks. Auk, 105: 1-10. Hinsley, S.A. (2000) The cost of multiple patch use by birds. Landscape Ecology, 15: 765-775. Hithaus, M.R. and Dill, L.M. (2002) Food availability and tiger shark predation risk influence bottlenose dolphin habitat use. Ecology, 83: 480-491. Hodson, R. (1995) The establishment of short rotation willow coppice in mid-Wales. PhD Thesis. University of Wales, Cardiff. Holland, J.M., Hutchinson, M.A.S., Smith, B. and Aebischer, N.J. (2006) A review of invertebrates and seed-bearing plants as food for farmland birds in Europe. Annals of Applied Biology, 148: 49-71. Homes, J.C. (1995) Population regulation: a dynamic complex of interactions. Wildlife Research, 22: 11-19. Houston, A.S., Clark, C., McNamara, J., and Mengel, M. (1988) Dynamic models in behavioural and evolutionary ecology. Nature, 332: 29-34. Hutto, R.L. (1990) Measuring the availability of food resources. Studies in Avian Biology, No 13. Avain Foraging: Theory, Methodology and Applications; International Symposium, California USA December 18-19, 1988 (Ed. Morrison, M. L.). Cooper Ornithological Society: Los Angeles, California, USA: 20-28. Jakobsson, S. (1988) Territorial fidelity of willow warbler (Phylloscopus trochilus) males and success in competition over territories. Behavioural Ecology and Sociobiology, 22: 79-84. Johansson, R.D. and Blomqvist, D. (1996) Habitat selection and diet of lapwing Vanellus vanellus chicks on coastal farmland in south-east Sweden. Journal of Applied Ecology, 33: 1030-1040. Johnston, R.D. (1990) Effects of nestling diet quality on the growth and adult size of passerine birds. PhD Thesis. University of Stirling, Stirling, UK. Kahle, P., Hildebrand, E., Baum, C. and Boelcke, B. (2007) Long-term effects of short rotation forestry with willows and poplar on soil properties. Archives of Agronomy and Soil Science, 53: 673-682. Kavanagh, B. (1990) Bird communities of two short rotation forestry plantations on cutover peat land. Irish Birds 4: 169–180. Kendeigh, C.S., and West, G.C. (1965) Calorific values of plant seeds eaten by birds. Ecology, 46: 553-555.
112

Kennedy, C.E.J. and Southward, T.R.E. (1984) The number of insects associated with British trees: a re-analysis. Journal of Animal Ecology, 53: 455-478. Kenwood, R.E. (1982) Goshawk hunting behaviour, and range size as a function of food and habitat availability. Journal of Animal Ecology, 51: 69-80. Kenwood, R.E. (2001) A manual for wildlife radio tagging. Academic Press. Kerbiriou, C., Gourmelon, F., Jiguet, F., Le Viol, I., Bioret, F., and Julliard, R. (2006) Linking territory quality and reproductive success in the Red-billed Chough Pyrrhocorax pyrrochorax: implications for conservation management of an endangered population. Ibis, 148: 352-364. Kjellsson, G. (1985) Seed fate in a population of Carex pilulifera L. II. Seed predation and its consequences for dispersal and seed bank. Oecologia, 67: 424-429. Kladivko, E. J. (2001) Tillage sytems and soil ecology. Soil and Tillage Research, 61: 61-76. Kleijn, D., Joenje, W., Le Coeur, Y. and Marshall, E.J.P. (1998) Similarities in vegetation development of newly established herbaceous strips along contrasting European field boundaries. Agriculture, Ecosystems and Environment, 68: 13-26. Knops, J.M.H., Tilman, D. and Haadad, N.M. (1999) Effects of plant species richness on invasion dynamics, disease outbreaks, insect abundance and diversity. Ecology Letters, 2: 286-293. Kokko, H. (1999) Competition for early arrival in migratory birds. Journal of Animal Ecology, 68: 940-950. Kopp, R.F., Abrahamson, L.P., White, E.H., Burns, K.F. and Nowak, C.A. (1996) Cutting cycle and spacing effects on biomass production by a willow clone in New York. Biomass and Bioenergy, 12: 313-319. Koricheva, J., Mulder, C.P.H. and Schmid, B. (2000) Numerical responses of different trophic groups of invertebrates to manipulations of plant diversity in grasslands. Oecologia, 125: 271-282. Krebs, J.R., Wilson, J.D., Bradbury, R.B. and Siriwardena, G.M. (1999) The second silent spring? Nature, 400: 611-612. Krebs, C.J. (1989) Ecological Methodology. New York: Harper Row. Krebs, J.R., Ashcroft, R. and Webster, M. (1978) Song repertoires and territory defence in the great tit. Nature, 271: 539-542. Lande, R. (1996) Statistics and partitioning of species diversity, and similarity among multiple communities. Oikos, 76: 5-13. Langslow, D. R. (1971) Wing-lengths and brood patches as a guide to sexing Willow Warblers and Chiffchaffs. Wicken Fen Group Report, 3: 30-32.
113

Lawn, M.R. (1994a) Site fidelity and annual survival of territorial male Willow Warblers Phlloscopus trochilus at four adjacent sites in Surrey. Ringing and Migration, 15: 1-7. Lawn, M.R. (1994b) Late territorial behaviour of Willow Warblers Phlloscopus trochilus. Journal of Avian Biology, 25: 303-307. Lawn, M.R. (1982) Pairing systems and site tenacity of the Willow warbler Phylloscopus trochilus in southern England. Ornis Scandinavica, 13: 193-199. Leber, K.M. (1985) The influence of predatory decapods, refuge, and microhabitat selection on sea grass communities. Ecology, 66: 1951-1964. Ledin, S. (1998) Environmental consequences when growing short rotation forests in Sweden. Biomass and Bioenergy, 15: 49-55. Leguizamon, E.S. and Roberts, H.A. (1982) Seed production by an arable weed community. Weed Research, 22: 35-39. Lima, S.L. (1985) Maximising feeding efficiency and minimising time spent exposed to predators: a trade off in the black-capped chickadee. Oecologia (Berlin), 66: 60-67. Lima, S.L. (1986) Predation risk and unpredictable feeding conditions: determinants of body mass in birds. Ecology, 67: 377-385. Lima, S.L. and Dill, L.M. (1990) Behavioural decisions made under the risk of predation: a review and prospectus. Canadian Journal of Zoology, 68: 619-640. Londo, M., Dekker, J. and Wim ter Keurs. (2005) Willow short-rotation coppice for energy and breeding birds: an exploration of potentials in relation to management. Biomass and Bioenergy, 28: 281-293. Lowthe-Thomas, S.C. (2003) Ground cover management for short rotation willow coppice in the uplands of mid-Wales. PhD Thesis. University of Wales, Cardiff. Lozano, G.A., Perreault, S. and Lemon, R.E. (1996) Age, arrival date and reproductive success of male American Redstarts Setophaga ruticilla. Journal of Avian Biology, 27: 164-170. Lundberg, A. and Alatalo, R. V. (1992) The Pied Flycatcher. Academic Press, San Diego. MacArthur, R.H., Recher, H. and Cody, M. (1966) On the relationship between habitat selection and species diversity. American Naturalist, 100: 319-332. Magurran, A.E. (2004) Measuring biological diversity. Blackwell. Makeschin, F. (1994) Effects of energy forestry on soils. Biomass and Bioenergy, 6: 63-79.
114

Manalled, F.D., Marino, P.C., Renner, K.A. and Landis, D.A. (2000) Post-dispersal weed seed predation in Michigan crop fields as a function of agricultural landscape structure. Agriculture, Ecosystems and Environment, 77: 193-202. Marchetti, K. and Price, T. (1989) Differences in the foraging of juvenile and adult birds: the importance of developmental constraints. Biological Reviews, 64: 51-70. Marcum, C.L. and Loftsgaarden, D.O. (1980) A non-mapping technique for studying habitat preferences. Journal of Wildlife Management, 44: 963-968. Marone, L., Rossi, B.E. and Lopez De Casenave, J. (1998) Granivore impact on soil-seed reserves in the central Monte desert, Argentina. Functional Ecology, 12: 640-645. Marshal, E.J.P., Brown, V.K., Boatman, N.D., Lutman, P.J.W., Squire, G.R. and Ward, L.K. (2003) The role of weeds in supporting biological diversity within crop fields. Weed Research, 43: 77-89. Martin, T.E. (1988) Are microhabitat preferences of coexisting species under selection and adaptive? Ecology, 79: 656-670. McCracken, A.R. and Dawson, W.M. (2003) Rust disease (Melampsora epitea) of willow (Salix) grown as short rotation coppice (SRC) in inter- and intra-species mixtures. Annals of Applied Biology, 143: 381-93. McCracken, D.I. and Tallowin, J.R. (2004) Swards and structure: the interactions between farming practices and bird food resources in lowland grasslands. Ibis, 146: 108-114. McLaughlin, A. and Mineau, P. (1995) The impact of agricultural practices on biodiversity. Agriculture, Ecosystems and Environment, 55: 201-212. Mead, C.J. and Clark, J.A. (1993) Report on bird ringing in Britain and Ireland for 1991. Ringing and Migration, 14: 1-72. Meek, B., Loxton, D., Sparks, T., Pywell, R., Pickett, H. and Nowakowski, M. (2002) The effect of arable field margin composition on invertebrate biodiversity. Biological Conservation, 106: 259-271. Millspaugh, J.J. & Marzluff, J.M. (2001) Radio Tracking and Animal Populations. Academic Press. Mineau, P. (2002) Estimating the probability of bird mortality from pesticide sprays on the basis of the field study record. Environmental Toxicology and Chemistry, 21: 1497-1506.
115

Mirck. J., Isebrands, J.G., Verwijst, t. and Ledin, S. (2005) Development of short-rotation willow coppice systems for environmental purposes in Sweden. Biomass and Bioenergy, 28: 219-228. Misenhelter, M.D and Rotenberry, J.T. (2000) Choices and consequences of habitat occupancy and nest site selection in Sage sparrows. Ecology, 81: 2892-2901. Moller, A.P. (1990) Male tail length and female mate choice in the monogamous swallow Hirundo rustica. Animal Behaviour, 39: 458-465. Moller, A.P. (1994) Phenotypic dependant arrival time and its consequences in a migratory bird. Behavioural Ecology and Sociobiology 35: 115-122. Moorcroft, D., Whittingham, M.J., Bradbury, R.B., and Wilson, J.D. (2002) The selection of stubble fields by wintering granivorous birds reflects vegetation cover and food abundance. Journal of Applied Ecology, 39: 535-547. Moorcroft, D., Wilson, J.D. and Bradbury, R.B. (2006) Diet of nestling Linnets Carduelis cannabina on lowland farmland before and after agricultural intensification. Bird Study, 53: 156-162. Morris, A.J., Whittingham, M.J., Bradbury, R.B., Wilson, J.D., Kyros, A., Buckingham, D.L. and Evans, A.D. (2001) Foraging habitat selection by yellowhammer (Emberiza citrinalla) nesting in agriculturally contrasting regions in lowland England. Biological Conservation, 101: 197-210. Morris, M. G. 2000. The effects of the structure and its dynamics on the ecology and conservation of arthropods in British grasslands. Biological Conservation 95 (2) 129-142 National Statistics and Defra. (2007) Sustainable development indicators in your pocket 2007: An update of the UK Government Strategy indicators. [online]. Department for the Environment, Food and Rural Affairs. Available at: http://www.defra.gov.uk/environment/statistics/eiyp/pdf/eiyp2007.pdf [Accessed: 21-07-2008]. Neergaard, R. and Arvidson, B.A. (1995) Polygyny in the Willow warbler Phylloscopus trochilus Swedish Lapland. Ibis, 131: 64-69. Neu, C.W., Byers, C.R. and Peek, J.M. (1974) A technique for analysis of utilisation-availability data. Journal of Wildlife Management, 38: 541-545. Newsholme, C. (1992) Willows the genus Salix. B.T. Batsford Ltd. London. Newton, I. (2004) The recent declines of farmland bird populations in Britain: an appraisal of causal factors and conservation actions. Ibis, 146: 579-600. Norman, S.C. (1983a) Variations in wing-lengths of Willow Warblers in relation to age, sex and season. Ringing and Migration. 4: 149-153.
116
Norman, S.C. (1983b) Growth of nestling Willow Warblers. Ringing and Migration, 4: 149-153. Norman, S.C. (1994) Dispersal and return rates of Willow Warblers Phylloscopus trochilus in relation to age, sex and season. Ringing and Migration, 15: 8-16. Ormerod, S.J. and Watkinson, A.R. (2000) Editors’ introduction: Birds and agriculture. Journal of Applied Ecology, 37: 699-705. O’Sullivan, N.P., Dunnington, E.A. and Siegal, P.B. (1991) Growth and carcass characteristics of early-feathered and late-feathering broilers reared under different feeding regimes. Poultry Science, 70: 1323-1332. Paine, L.K., Peterson, T.L., Undersander, D.J., Rineer, K.C., Bartlet, G.A., Temple, S.A., Sample, D.W. and Klemme, R.M. (1995) Some ecological and socio-economic considerations for biomass energy crop production. Biomass and Bioenergy, 10: 231-242. Pallister, S. (2004) A nutritionist's perspective. Poultry World, 158: Issue 3. Parfitt, R.I., Clay, D.V., Arnold, G.M. and Foulkes, A. (1992) Weed control in new plantations of short-rotation willow and poplar coppice. Aspects of Applied Biology, 29: 419-424. In: Vegetation management in forestry, amenity and conservation areas. Parish, D.M.B. and Sotherton, N.W. (2004) Game crops and threatened farmland songbirds in Scotland: a step towards halting population declines? Bird Study, 51: 107-112. Parish, D.M.B. and Sotherton, N.W. (2008) Landscape-dependent use of a seed rich habitat by farmland passerines: relative importance of game cover crops in a grassland versus an arable region of Scotland. Bird Study, 55: 118-123. Peach, W.J., Crick, H.Q.P. and Marchant, J.H. (1995) The demography of the decline in the British Willow Warbler population. Journal of Applied Statistics, 22: 905–922. Peach, W.J., Siriwardena, G.M. and Gregory, R.D. (1999) Long-term changes in over-winter survival rates explain the decline of reed buntings Emberiza schoeniclus in Britain. Journal of Applied Ecology, 36: 798-811 Perkins, A.J., Whittingham, M.J., Bradbury, R.B., Wilson, J.D., Morris, A.J. and Barnett, P.R. (2000) Habitat characteristics affecting use of lowland agricultural grassland by birds in winter. Biological Conservation, 95: 279-294. Perkins, A.J., Whittingham, M.J., Bradbury, R.B., Wilson, J.D., Morris, A.J. and Barnett, P.R. (2000) Habitat characteristics affecting use of lowland agricultural grassland by birds in winter. Biological Conservation, 95: 279-294. Perkins, A. J., Whittingham, M. J., Morris, A. J. and Bradbury, R. B. 2002. Use of field margins by foraging yellowhammers Emberiza citronella. Agriculture Ecosystems and Environment. 93 (1-3) 413-420
117

Perttu, K.L. (1995) Ecological, biological balances and conservation. Biomass and Bioenergy, 9: 107-116. Perttu, K.L. (1998) Environmental justification for short-rotation forestry in Sweden. Biomass and Bioenergy, 15: 1-6. Perttu, K.L. (1999) Environmental and hygienic aspects of willow coppice in Sweden. Biomass and Bioenergy, 16: 291-297. Pimentel, D. and Wilson, C. (1997) Economics and environmental benefits of biodiversity. BioScience, 47: 747–758. Preston, C.D., Pearmain, D.A. and Dines, T.D. (2002) New Atlas of the British and Irish Flora. Oxford, University Press. Potts, G.R. (1986) The Partridge. London, Collins. Poulsen, J.G., Sotherton, N.W. and Aebischer, N.J. (1998) Comparative nesting and feeding ecology of skylarks Alauda arvensis in southern England with special reference to set-aside. Journal of Applied Ecology, 35: 131-147. Povey, F.D., Smith, H. and Watt, T.A. (1993) Predation of annual grass weed seeds in arable field margins. Annals of Applied Biology, 122: 323-328 Pratt, A. and Peach, W. (1991) Site tenacity and annual survival of a Willow Warbler Phylloscopus trochilus population in Southern England. Ringing and Migration, 12: 128-134. Pywell, R. F., James, K. L., Herbert, I., Meek, W. R., Carvell, C., Bell, D. and Sparks, T. H. 2005. Determinants of over wintering habitat quality for beetles and spiders on arable farmland. Biological Conservation. 123 (1) 79-90. Pywell, R.F., Bullock, J.M., Tallowin, J.B., Walker, K.J., Warman, E.A. and Masters, G. (2007) Enhancing diversity of species-poor grasslands: an experimental assessment of multiple constraints. Journal of Applied Ecology, 44: 81-94. Rackham, O. (1986) The history of the countryside. Phoenix Press. Ranney, J.W. and Mann, L.K. (1994) Environmental considerations in energy crop production. Biomass and Bioenergy, 6: 211-228. Rauber, R. and Koch, W. (1975) Zur Populationdynamik des Flughafers (Avena fatua L.) unter dem Aspekt der langfristigen Bafallsprognose. Proceedings of the European Weed Research Society Symposium ‘Status, Biology and Control of Grass weeds in Europe’, 1: 113-123. Reddersen, J. (2001) SRC-willow (Salix viminalis) as a resource for flower-visiting insects. Biomass and Bioenergy 20: 171-179.
118

Redfern, C.P.F. and Clark, J.A. (2001) Ringers Manual 4th Edition. BTO, Thetford. Reicosky, D.C., Kemper, W.D., Langdale, G.W., Douglas, C.L. and Rasmussen, P.E. (1995) Soil organic matter changes resulting from tillage and biomass production. Journal of Soil and Water Conservation, 9: 253. Reichman, O.J. (1979) Desert granvivore foraging and its impact on seed densities and distributions. Ecology, 60, 1085-1092. Remes, V. (2003) Effects of exotic habitat on nesting success, territory density, and settlement patterns in the blackcap (Sylvia atricapilla), Conservation Biology, 17: 1127–1133. Rich, T.C.G. and Woodruff, E.R. (1996) Changes in the vascular plant floras of England and Scotland between 1930-1960 and 1987-1988: the BSBI monitoring scheme. Biological Conservation, 75: 217-229. Rich, T.J., Bellini, L. and Sage, R. (2001) In: Brighton crop protection conference – Weeds 2001. Brighton. Vols 1 and 2, pp. 739-744. Robinson, R.A. (1997) Ecology and conservation of seed-eating birds on farmland. PhD thesis, University of East Anglia, Norwich, UK. Robinson, R.A., Wilson, J.D, and Crick, H.Q.P. (2001) The importance of arable habitat for farmland birds in grassland landscapes. Journal of Applied Ecology, 38: 1059-1069. Robinson, R.A. and Sutherland, W.J. (2002) Post-war changes in arable farming and biodiversity in Great Britain. Journal of Applied Ecology, 39: 157-176. Robinson, R.A., Hart, J.D., Holland, J.M. and Parrott, D. (2004) Habitat use by seed-eating birds: a scale-dependent approach. Ibis, 146: 87-98. Robinson, R.A. (2005) BirdFacts: profiles of birds occurring in Britain & Ireland (v1.21, Jun 2008). [online]. BTO Research Report 407, BTO, Thetford Available at: http://www.bto.org/birdfacts [Accessed: 09-09-2008]. Rogers, C.M. (1987) Predation risk and fasting capacity: Do wintering birds maintain optimal body mass? Ecology, 68: 1051-1061. Rogers, C.M. and Smith, J.N.M. (1993) Life-history theory in the non-breeding period: trade-offs in avian fat reserves. Ecology, 74: 419-426. Rogers, C.M. and Heath-Coss, R. (2003) Effect of experimentally altered food abundance on fat reserves of wintering birds. Journal of Animal Ecology, 72: 822-830. Rogers, C.M. and Reed, A.K. (2003) Does avian winter fat storage integrate temperature and resource conditions? A long-term study. Journal of Avian Biology, 34: 112-118.
119

Roos, S. (2002) Functional response, seasonal decline and landscape differences in nest predation risk. Oecologia, 133: 608-615. Rotenberry, J.T. and Wiens, J.A. (1998) Reproductive biology of shrub steppe passerine birds: geographical and temporal variation in clutch size, brood size, and fledging success. Condor, 91: 1-14. Roubik, D.W. (2001) Ups and downs in pollinator populations: When is there a decline? Conservation Ecology, 5: 2. Rowe, R,L., Nathaniel, R.S. and Taylor, G. (2007) Identifying potential environmental impacts of large-scale deployment of dedicated bioenergy crops in the UK. Renewable and Sustainable Energy Reviews, doi:10.1016/j.rser.2007.07.008. Sage, R.B., and P.A. Robertson. (1994) Wildlife and Game Potential of Short-Rotation Coppice in the UK. Biomass & Bioenergy 6: 41-48. Sage, R.B., Robertson, P.A. and Poulson, J.G. (1994) Enhancing the conservation value of short rotation coppice – Phase 1, the identification of wildlife conservation potential. Report ETSUB/W5/00277/REP. Harwell Laboratories, Oxford. Sage, R.B. (1995) In: Brighton crop protection conference – Weeds 1995. Brighton Crop Protection Council. Brighton, pp 986-990. Sage, R.B. and Robinson, P.A. (1996) Factors affecting songbird communities using new short rotation coppice habitats in spring. Bird Study, 43: 201-213. Sage, R.B., and Tucker, K. (1997) Invertebrates in the canopy of willow and poplar short rotation coppices. Aspects of Applied Biology, 49: 105-111. Sage, R.B. (1998) Short rotation coppice for energy: towards ecological guidelines. Biomass and Bioenergy, 15: 39-47. Sage, R.B. and Tucker, K. (1998a) The distribution of Phratora vulgatissima (Coleoptera : Chrysomelidae) on cultivated willows in Britain and Ireland. European Journal of Forest Pathology, 28: 289-296. Sage, R.B. and Tucker, K. (1998b) Integrated crop management of SRC plantations to maximise crop value, wildlife benefits and other added value opportunities. Report B/W2/0040/00/REPORT Oxford: ETSU. Sage, R.B. (1999) Weed competition in willow coppice crops: the cause and extent of yield losses. Weed Research, 39: 399-411. Sage, R.B., Cunningham, M. and Boatman, N. (2006) Birds in willow short-rotation coppice compared to other arable crops in central England and a review of bird census data from energy crops in the UK. Ibis, 148: 184-197. Schluter, D. and Repasky, R. R. (1991) Worldwide limitation of finch densities by food and other factors. Ecology, 72: 1763-1774.
120

Schluter, D. (1982) Distribution of Galapagos ground finches along an altitudinal gradient: The importance of food supply. Ecology, 63: 1504-1517. Schafer, G., Feith, M., Fritz, M., Johansson Augier, A. and Wieland, U. eds. (2007) Europe in Figures - Eurostat yearbook 2006-07. Office for Official Publications of the European Communities, Luxembourg. Semere, T. and Slater, F. (2005) The effects of energy grass plantations on biodiversity. Annual report. DTI B/CR/00782/00/00. Shrubb, M. (2003) Birds Scythes and Combines. Cambridge University Press. Siemann, E., Tilman, D. and Haarstad, J. (1998) Experimental tests of the dependence of arthropod diversity on plant diversity. American Naturalist, 152: 38-750. Sih, A. (1982) Foraging strategies and the avoidance of predation by an aquatic insect Notonecta hoffmani. Ecology, 63: 786-796. Sih, A. (1980) Optimal behaviour: can foragers balance two conflicting demands? Science, 210: 1041-1043. Siriwardena, G.M., Baillie, S.R., Crick, H.Q.P., and Wilson, J.D. (1998) Trends in the abundance of farmland birds: a quantative comparison of smooth common bird census indices. Journal of Applied Ecology, 35: 24-43. Siriwardena, G.M., Baillie, S.R., Crick, H.Q.P., and Wilson, J.D. (2000) The importance of the variation in the breeding performance of seed-eating birds in determining their population trends on farmland. Journal of Applied Ecology, 37: 128-148. Siriwardena, G.M., Calbrade, N.A., Vickery, J.A., and Sutherland, W.J. (2006) The effect of the spatial distribution of winter seed food resources on their use by farmland birds. Journal of Applied Ecology, 43: 628-639. Smith, R.K., Jennings, N.V., Robinson, A. and Harris, S. (2004) Conservation of European hares Lepus europaeus in Britain: is increasing habitat heterogeneity in farmland the answer? Journal of Applied Ecology, 41: 1092-1102. Soderstrom, B. (2001) Seasonal changes in red-backed shrike Lanius collurio territory quality: the role of nest predation. Ibis, 143: 561-571. Sotherton, N.W. and Self, M.J. (2000) Changes in plant and arthropod diversity on lowland farmland: an overview. Pages 26-35 in: Aebischer, A.D., Evans, A.D., Grice, P. and Vickery, J. eds. Ecology and Conservation of Lowland Farmland Birds. British Ornithologists Union, Tring, UK. Southwood, T.R.E. and Cross, D.J. (1969) The ecology of the partridge. III. Breeding success and the abundance of insects in natural habitats. Journal of Animal Ecology, 38: 497-509.
121
Starback, E. and Becht, P. (2005) Landscape perspectives on energy forests. Biomass and Bioenergy, 28: 151-159.
Stevens, D.K., Anderson, G.Q.A., Grice, P.V., Norris, K. and Butcher N (2008) Predators of Spotted Flycatcher Muscicapa striata nests in southern England as determined by digital nest camera. Bird Study, 55: 179-187. Still, K. and Byfield, A. (2007) New priorities for arable plant conservation. [online]. Plantlife. Available at: http://www.plantlife.org.uk/uk/assets/saving-species/saving-species-publications/new%20priorities%20for%20arable%20plant%20conservation.pdf [Accessed: 10-09-2008]. Stoate, C., Boatman, N.D., Borralho, R.J. Rio Carvalho, C., de Snoo, G.R. and Eden, P. (2001) Ecological impacts of arable intensification in Europe. Journal of Environmental Management, 63: 337-365. Stoate, C. (1995) The changing face of lowland farming and wildlife I. 1845-1945. British Wildlife, 6: 341-350. Storkey, J. (2006) A functional group approach to the management of UK arable weeds to support biological diversity. Weed Research, 46: 513-522. Supergen. (2007) Advancing UK Bioenergy [online]. Supergen Bioenergy, Available from: http://www.supergen-bioenergy.net/ [Accessed: 09-09-2008]. Sutcliffe, O.L. and Kay, Q.O.N. (2000) Changes in the arable flora of central southern England since the 1960’s. Biological Conservation, 93: 1-8. Svensson, L. (1984) Identification guide to European passerines. 3rd edition. Stockholm. Taylor, R.L., Maxwell, B.D. and Boik, R.J. (2006) Indirect effects of herbicide on bird food resources and beneficial arthropods. Agriculture, Ecosystems and Environment, 116: 157-164. Thomas J.A., Morris M.G. and Hambler C. (1994) Patterns, mechanisms and rates of extinction among invertebrates in the United Kingdom (and discussion). Philosophical Transactions of the Royal Society B, 344: 47-54. Thomas, S. R., Noordhuis, R., Holland, J. M. and Goulson, D. 2002. Botanical diversity of beetle banks effects of age and comparison with conventional arable field margins in southern UK. Agriculture Ecosystems and Environment. 93 (1-3) 403-412 Thomas J.A., Telfer M.G., Roy D.B., Preston C.D., Greenwood J.J.D., Asher J., Fox R., Clarke R.T. and Lawton J.H. (2004) Comparative Losses of British Butterflies, Birds, and Plants and the Global Extinction Crisis. Science, 19: 1879-1881. Thornton, F.C., Joslin, J.D., Bock, B.R., Houston, A., Green, T.H., Schoenholtz, S., Pettry, D. and Tyler, D.D. (1997) Environmental effects of growing woody crops on
122
agricultural land: first year effects on erosion, and water quality. Biomass and Bioenergy, 15: 57-69. Tiainen, J. (1983) Dynamics of a local population of the Willow Warbler Phylloscopus trochilus in southern Finland. Ornis Scandinavica, 14: 1-15. Tilman, D. (2000) Causes, consequences and ethics of biodiversity. Nature, 405: 208-211 The Welsh Biomass Centre. 2004. Llysdinam Field Centre, Newbridge on Wye. Cardiff University. Tolbert, V.R. and Wright, L.L. (1998) Environmental enhancement of U.S. biomass crop technologies: research results to date. Biomass and Bioenergy, 15: 93-100. Tooley, J.A., Froud-Williams, R.J., Boatsman, N.D. and Holland, J.M. (1999) Weed seed predation in arable field margins by carabid beetles (Carabidae: Coleoptera). Aspects of Applied Biology, 54: 211-216. Tremblay, I., Thomas, D., Blondel, J., Perret. P. and Lambrechts, M.M. (2005) The effects of habitat quality on foraging patterns, provisioning rate and nestling growth in Corsican Blue Tits Parus caeruleus. Ibis, 147: 17-24. Tucker, G. and Heath, M. (1994) Birds in Europe: Their Conservation Status. Cambridge: Birdlife International. Tucker, K. and Sage, R.B. (1999) Integrated pest management in short rotation coppice – a growers guide. Game Conservancy Limited, Fordingbridge, Hampshire. Turner, A.K. (1980) The use of time and energy by aerial feeding birds. PhD Thesis. University of Stirling, Stirling, UK. Vaughan, N., Lucas, E.A., Harris, S. and White, P.C.L. (1993) Habitat associations of European hares Lepus europaeus in England and Wales: implications for farmland management. Journal of Applied Ecology, 40: 163-175. Verboven, N. and Visser, M.E. (1998) Seasonal variation in local recruitment of great tits: the importance of being early. Oikos, 81: 511-524. Verhulst, S. and Tinbergen, J.M. (1991) Experimental evidence for a causal relationship between timing and success of reproduction in the great tit Parus major. Journal of Animal Ecology, 60: 269-282. Vickery, J. A., Tallowin, J. R., Feber, R. E., Atkinson, P. W., Asteraki, E. J., Fuller, R. J. and Brown, V. K. (1999) Changes in lowland grassland management: implications for invertebrates and birds. BTO Research Report no. 222. British Trust for Ornithology, Thetford. Vickery, J.A., Tallowin, J.R., Feber, R.E., Asteraki, E.J., Atkinson, P.W., Fuller, R.J. and Brown, V.K. (2001) The management of lowland neutral grasslands in Britain:
123

effects of agricultural practices on birds and their food resources. Journal of Applied Ecology, 38: 647-664. Vickery, J.A., Bradbury, R.B., Henderson, I.G., Eaton, M.A. and Grice, P.V. (2004), The role of agri-environment schemes and farm management practices in reversing the decline of farmland birds in England, Biological Conservation, 119: 19–39. Vickery, J.A., Evans, A., Grice, P., Brand-Hardy, R. and Aebischer, N.A. (Eds) (2004) Ecology and conservation of lowland farmland birds. II. The road to recovery. Ibis, 146: (Supplement 2). WAG. (2006) The Environment Strategy for Wales [online]. Welsh Assembly Government. Available at: http://new.wales.gov.uk/topics/environmentcountryside/epq/Envstratforwales/About_the_strategy/?lang=en [Accessed: 07-08-2007]. Walker, K.J., Critchley, C.N.R., Sherwood, A.J., Large, R., Nuttall, P., Hulmes, S., Rose, R. and Mountford, J.O. (2007) The conservation of arable plants on cereal field margins: An assessment of new agri-environment scheme options in England, UK. Biological Conservation, 136: 260-270. Westerman, P.R., Wes, J.S., Kropff, M.J. and Van Der Werf, W. (2003) Annual losses of weed seeds due to predation in organic cereal fields. Journal of Applied Ecology, 40: 824-836. Whittingham, M.J. and Markland, H.M. (2002) The influence of substrate on the functional response of an avian granivore and its implications for farmland bird conservation Oecologia, 130: 637-644 Whittingham, M.J., and Evans, K.L. (2004) The effects of habitat structure on predation risk of birds in agricultural landscapes. Ibis, 146: 210-220. Whittingham, M.J., Devereux, C.L., Evans, A.D. and Bradbury, R.B. (2006) Altering perceived predation risk and food availability: management prescriptions to benefit farmland birds on stubble fields. Journal of Applied Ecology, 43: 640-650. Wiggins, D.A., Part, T. and Gustafsson, L. (1994) Seasonal decline in collared flycatcher Ficedula albicollis reproductive success: an experimental approach. Oikos, 31: 153-158. Wilson, M.F. (1974) Avian community organisation and habitat structure. Ecology, 55: 1017-1029. Wilson, P.J. (1992) Britain’s arable weeds. British Wildlife, 33: 149-161. Wilson, J.D., Arroyo, B.E. and Clarke, S.C. (1996a) The diet of bird species of lowland farmland; a literature review. BBSRC-NERC Ecology and Behaviour Group. University of Oxford, Oxford, UK.
124
Wilson, J.D., Taylor, R., and Muirhead, L.B. (1996b) Field use by farmland birds in winter: an analysis of field type preferences using resampling methods. Bird Study, 43: 320-332. Wilson, J.D., Evans, J., Browne, S.J. and King, J.R. (1997) Territory distribution and breeding success of skylarks Alauda arvensis on organic and intensive farmland in southern England. Journal of Applied Ecology, 34: 1462-1478. Wilson, J.D., Morris, A.J., Arroyo, B.E., Stephanie, C.C. and Bradbury, R.B. (1999) A review of the abundance and diversity of invertebrate and plant foods of granivorous birds in northern Europe in relation to agricultural change. Agriculture, Ecosystems and Environment, 75: 13-30. Wilson, C. and Tisdell, C. (2001) Why farmers continue to use pesticides despite environmental, health and sustainability costs. Ecological Economics, 39: 449-462. Wilson, J.D, Whittingham, M.J. and Bradbury, R.B. (2005) The management of crop structure: a general approach to reversing the impacts of agricultural intensification on birds? Ibis, 147: 453-463. Witter, M.S. and Swaddle, J.P. (1995) Dominance, competition, and energetic reserves in the European Starling, Sturnus vulgaris. Behavioural Ecology, 6: 343-348. Woodhouse, S.P., Good, J.E.G., Lovett, A.A., Fuller, R.J. and Dolman, P.M. (2005) Effects of land-use and agricultural management on birds of marginal farmland: a case study in the Llyn peninsula, Wales. Agriculture, Ecosystems and Environment, 107: 331-340. Wolff, A., Paul, J.P., Martin, J.L. and Bretagnolle, V. (2004) The benefits of extensive agriculture to birds: the case of the little bustard. Journal of Applied Ecology, 38: 963- 975. Worton, B.J. (1989) Kernel methods for estimating the utilization distribution in home-range studies. Ecology, 70: 164-168. Wratten, S. D., Bowie, M. H., Hickman, J. M., Evans, A. M., Sedcole, J. R. and Tylianakis, J. M. 2003. Field boundaries as barriers to movement of hover flies (Diptera: Syrphidae) in cultivated land. Oecologia 134 (4) 605-611. Yasukawa, K. (1981) Song repertoires in the red-winged blackbird (Agelaius phoeniceus): a test of the Beau Geste hypothesis. Behavioural Ecology and Sociobiology, 29: 114-125.
125

Appendix I Complete list of plant species recorded within the SRC and the control sites throughout the 3 year study. Shows the mean percentage of cover recorded for each species. Class 1 = Annual species Class 2 = Short-lived perennials Class 3 = Long-lived perennials (After Cunningham et al. 2004c)
Species Control
-1 Year
0 Year
1 Year
2 Class
Achillea millefolium Yarrow 0.006 0 0.237 0 3 Agrostis stolonifera Creeping Bent 19.520 1.686 22.738 8.675 3 Alopecurus geniculatus Marsh Foxtail 0 6.531 8.580 10.167 2 Anagallis arvensis Scarlet Pimpernel 0.036 0.017 0.002 0 1 Anthoxanthum odoratum Sweet Vernal-grass 0.006 0 0 0 3 Anthriscus sylvestris Cow Parsley 0 0.043 0 0 2 Aphanes arvensis Parsley-piert 0 0 0.423 0 1 Arctium lappa Greater Burdock 0 0 0.017 0.463 2 Atriplex patula Common Orache 0 1.134 0 0 1 Bellis perennis Daisy 0.737 0.020 0 0 3 Capsella bursa-pastoris Shepherd's-purse 0 2.329 0 0 1 Cardamine armara Large Bitter-cress 0 0.186 0.493 0 3 Cardamine hirsuta Hairy Bitter-cress 0.606 0 0 0 2 Carex diandra Lesser Tussock-sedge 0 0 0 0.6 3 Carex nigra Common Sedge 0.071 0.274 0.417 6.547 3 Carex ovalis Oval Sedge 0 0.014 0.647 0 3 Cerastium fontanum Common Mouse-ear 0.983 0.240 0.349 0.233 1 Cerastium glomeratum Sticky Mouse-ear 0.029 0 0.037 0 1 Chamerion angustifolium Rosebay Willowherb 0 0.012 1.285 0.292 2 Chenopodium album Fat-hen 0 1.961 0.050 0.563 1 Cirsium arvense Creeping Thistle 0.241 2.170 1.443 1.511 1 Cirsium palustre Marsh Thistle 0 0 0.007 0 2 Cirsium vulgare Spear Thistle 0.317 16.291 4.569 0.296 2 Dactylis glomerata Cock's-foot 1.786 0.029 0.052 0.550 3 Deschampsia cespitosa Tufted hair-grass 0 0.043 0.073 0 3 Elymus repens Common Couch 0 0.331 1.645 0.067 1
Epilobium montanum Broad-leaved Willowherb 0.056 0.523 1.333 2.429 2
Equisetum arvense Field Horsetail 0.114 0.157 0 1.633 2 Euphorbia peplus Petty Spurge 0 0.257 0.017 0 2 Fallopia convolvulus Black-bindweed 0 0.014 0 0 1 Festuca gigantea Giant Fescue 1.249 2.027 0 0 3 Festuca ovina Sheep's Fescue 0 0 0 0 3 Festuca rubra Red Fescue 0 0 0.223 0.125 3 Fumaria officinalis Common Fumitory 0 0.711 2.603 0 1 Galeopsis tetrahit Common Hemp-nettle 0 0.100 0 0 1
126

Galium palustre Common Marsh-bedstraw 0 0 1.200 0 2
Geranium molle Dove's-foot Crane's-bill 0.107 0 0.003 0 1 Glyceria fluitans Floating Sweet-grass 0 1.141 0.700 2.963 3 Hedera helix Common Ivy 0 0 0.002 0 3 Helictotrichon pubescens Hairy Oat 0.507 0.723 0.790 0 3 Heracleum sphondylium Hogweed 0.443 0 0.817 0 2 Holcus lanatus Yorkshire-fog 12.963 10.070 7.159 18.037 3 Hypericum humifusum Trailing St John's-wort 0 0 0.070 0 3 Juncus articulatus Jointed Rush 0 0 0.039 0.007 3 Juncus bufonius Toad Rush 0 0.055 0.103 0 1 Juncus conglomoratus Compact Rush 0 0 0.050 0.140 3 Juncus effusus Soft Rush 0.157 0 0 0.44 3 Kickxia elatine Sharp-leaved Fluellen 0 0.041 0.333 0 1 Kickxia spuria Round-leaved Fluellen 0 0 0.010 0 1 Lathyrus pratensis Yellow Vetchling 0 0 0 0.333 3 Lolium perenne Perennial Rye-grass 46.970 0.687 3.096 2.650 3
Lotus corniculatus Common Bird's-foot-trefoil 0 0 0.020 0 2
Lotus pedunculatus Greater Bird's-foot-trefoil 0.036 0.114 0.716 0 2
Luzula multiflora Heath Wood-rush 0.069 0 0 0 3 Matricaria discoidia Pineappleweed 0 1.780 0 0 1 Montia fontana Blinks 0.157 0.076 2.320 0 2 Persicaria hydropiper Water-pepper 3.157 2.189 0.847 0.132 1 Persicaria maculosa Redshank 0.006 3.554 5.573 0.438 1 Phleum pratense Timothy 0 0 0.037 0 3 Plantago lanceolata Ribwort Plantain 0 0.015 0 0 3 Plantago major Greater Plantain 0 0.186 0.004 0 2 Poa annua Annual Meadow-grass 1.889 10.659 4.405 0.607 1 Polygonum aviculare Knotgrass 0 0.071 1.110 0.438 1 Potentilla anserina Silverweed 0 0 0 2.353 3 Potentilla reptans Creeping Cinquefoil 0 12.932 0.897 0 2 Prunella vulgaris Selfheal 0.003 0 0 0 3 Ranunculus acris Meadow Buttercup 0.036 0 0.502 0.133 3 Ranunculus flammula Lesser Spearwort 0 0 0.056 0 3 Ranunculus repens Creeping Buttercup 7.009 0 35.573 46.167 2 Raphanus raphanistrum Wild Radish 0 0.249 0 0 1 Rubus fruticosus Bramble 0 0.027 0.066 0.292 3 Rumex acetosa Common Sorrel 0.781 0.163 1.440 0 3 Rumex acetosella Sheep's Sorrel 0 0 0.100 0 3 Rumex obtusifolius Broad-leaved Dock 0.229 1.792 0.173 0.063 2 Sagina procumbens Procumbent Pearlwort 0 0 0.023 0 2 Salix caprea Goat Willow 0 0.057 0.020 0 3 Salix cinerea Grey Willow 0 0 0.020 0 3 Senecio jacobaea Common Ragwort 0 0.174 0.002 0 2 Senecio vulgaris Groundsel 0 0.077 3.680 0 2 Silene dioica Red Campion 0 0.014 0.003 0 2 Sinapsis arvensis Charlock 0 0.057 0 0 1 Solanum nigrum Black Nightshade 0 1.669 0.033 0 1
127

128
Solanun dulcamara Bittersweet 0 0 0.065 0 2 Sonchus arvensis Perennial Sowthistle 0 0.220 0.430 0 1 Stellaria media Common Chickweed 0.171 3.787 1.280 0 1 Taraxacum (agg) Dandelions 0.586 0.995 0.131 0.246 1 Trifolium pratense Red Clover 0 0.134 0.002 0 3 Trifolium repens White Clover 5.570 17.983 1.905 1.150 3 Urtica dioica Common Nettle 0.286 0.149 0.996 0.546 2 Veronica agrestis Field Speedwell 0.040 0 0 0 2 Veronica officinalis Heath Speedwell 0.009 0 0 0 1 Vicia hirstua Hairy Tare 0.207 0 0 0 1 Viola arvensis Field Pansy 0 0.038 0.237 0 1
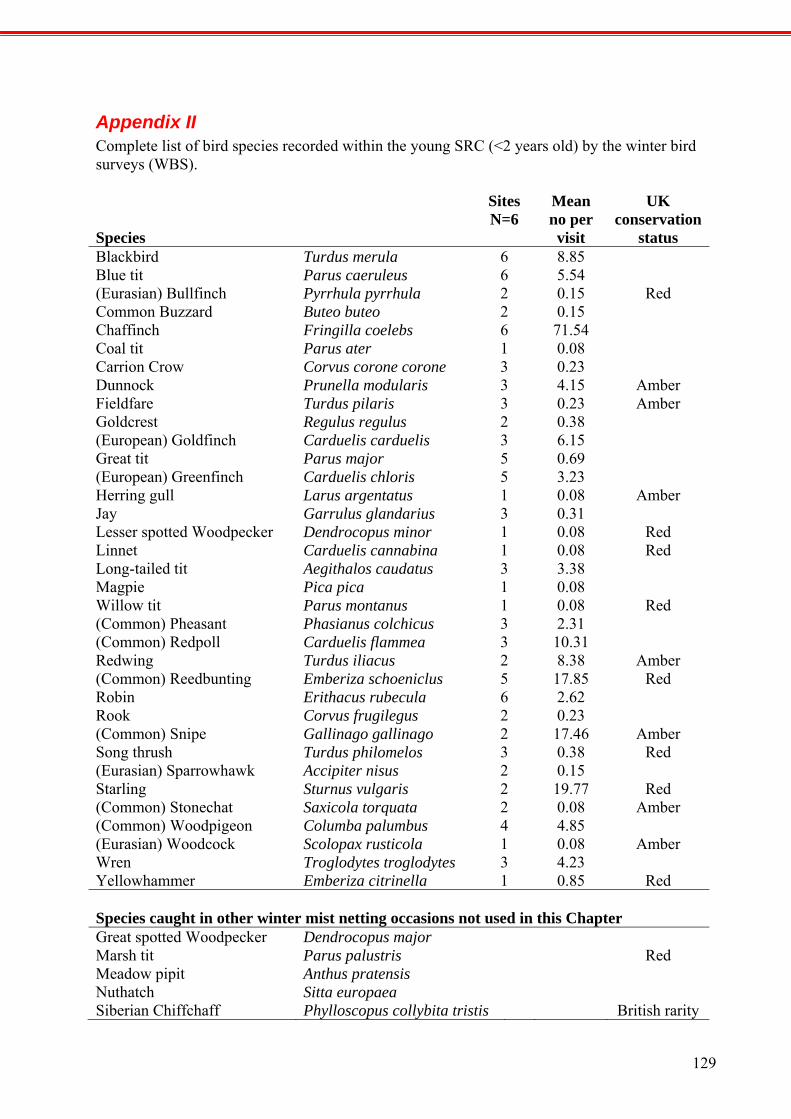
Appendix II Complete list of bird species recorded within the young SRC (<2 years old) by the winter bird surveys (WBS). Species
Sites N=6
Mean no per visit
UK conservation
status Blackbird Turdus merula 6 8.85 Blue tit Parus caeruleus 6 5.54 (Eurasian) Bullfinch Pyrrhula pyrrhula 2 0.15 Red Common Buzzard Buteo buteo 2 0.15 Chaffinch Fringilla coelebs 6 71.54 Coal tit Parus ater 1 0.08 Carrion Crow Corvus corone corone 3 0.23 Dunnock Prunella modularis 3 4.15 Amber Fieldfare Turdus pilaris 3 0.23 Amber Goldcrest Regulus regulus 2 0.38 (European) Goldfinch Carduelis carduelis 3 6.15 Great tit Parus major 5 0.69 (European) Greenfinch Carduelis chloris 5 3.23 Herring gull Larus argentatus 1 0.08 Amber Jay Garrulus glandarius 3 0.31 Lesser spotted Woodpecker Dendrocopus minor 1 0.08 Red Linnet Carduelis cannabina 1 0.08 Red Long-tailed tit Aegithalos caudatus 3 3.38 Magpie Pica pica 1 0.08 Willow tit Parus montanus 1 0.08 Red (Common) Pheasant Phasianus colchicus 3 2.31 (Common) Redpoll Carduelis flammea 3 10.31 Redwing Turdus iliacus 2 8.38 Amber (Common) Reedbunting Emberiza schoeniclus 5 17.85 Red Robin Erithacus rubecula 6 2.62 Rook Corvus frugilegus 2 0.23 (Common) Snipe Gallinago gallinago 2 17.46 Amber Song thrush Turdus philomelos 3 0.38 Red (Eurasian) Sparrowhawk Accipiter nisus 2 0.15 Starling Sturnus vulgaris 2 19.77 Red (Common) Stonechat Saxicola torquata 2 0.08 Amber (Common) Woodpigeon Columba palumbus 4 4.85 (Eurasian) Woodcock Scolopax rusticola 1 0.08 Amber Wren Troglodytes troglodytes 3 4.23 Yellowhammer Emberiza citrinella 1 0.85 Red Species caught in other winter mist netting occasions not used in this Chapter Great spotted Woodpecker Dendrocopus major Marsh tit Parus palustris Red Meadow pipit Anthus pratensis Nuthatch Sitta europaea Siberian Chiffchaff Phylloscopus collybita tristis British rarity
129
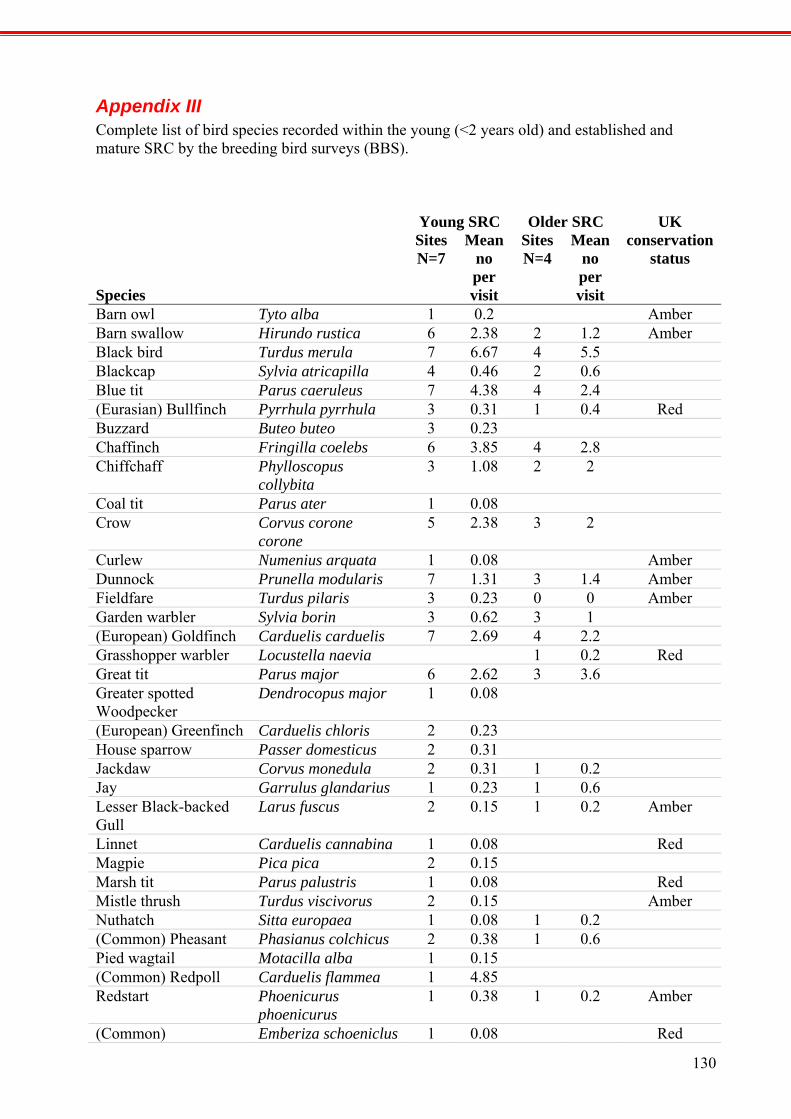
Appendix III Complete list of bird species recorded within the young (<2 years old) and established and mature SRC by the breeding bird surveys (BBS). Young SRC Older SRC UK
conservation status
Species
Sites N=7
Mean no per visit
Sites N=4
Mean no per visit
Barn owl Tyto alba 1 0.2 Amber Barn swallow Hirundo rustica 6 2.38 2 1.2 Amber Black bird Turdus merula 7 6.67 4 5.5 Blackcap Sylvia atricapilla 4 0.46 2 0.6 Blue tit Parus caeruleus 7 4.38 4 2.4 (Eurasian) Bullfinch Pyrrhula pyrrhula 3 0.31 1 0.4 Red Buzzard Buteo buteo 3 0.23 Chaffinch Fringilla coelebs 6 3.85 4 2.8 Chiffchaff Phylloscopus
collybita 3 1.08 2 2
Coal tit Parus ater 1 0.08 Crow Corvus corone
corone 5 2.38 3 2
Curlew Numenius arquata 1 0.08 Amber Dunnock Prunella modularis 7 1.31 3 1.4 Amber Fieldfare Turdus pilaris 3 0.23 0 0 Amber Garden warbler Sylvia borin 3 0.62 3 1 (European) Goldfinch Carduelis carduelis 7 2.69 4 2.2 Grasshopper warbler Locustella naevia 1 0.2 Red Great tit Parus major 6 2.62 3 3.6 Greater spotted Woodpecker
Dendrocopus major 1 0.08
(European) Greenfinch Carduelis chloris 2 0.23 House sparrow Passer domesticus 2 0.31 Jackdaw Corvus monedula 2 0.31 1 0.2 Jay Garrulus glandarius 1 0.23 1 0.6 Lesser Black-backed Gull
Larus fuscus 2 0.15 1 0.2 Amber
Linnet Carduelis cannabina 1 0.08 Red Magpie Pica pica 2 0.15 Marsh tit Parus palustris 1 0.08 Red Mistle thrush Turdus viscivorus 2 0.15 Amber Nuthatch Sitta europaea 1 0.08 1 0.2 (Common) Pheasant Phasianus colchicus 2 0.38 1 0.6 Pied wagtail Motacilla alba 1 0.15 (Common) Redpoll Carduelis flammea 1 4.85 Redstart Phoenicurus
phoenicurus 1 0.38 1 0.2 Amber
(Common) Emberiza schoeniclus 1 0.08 Red
130

Reedbunting Robin Erithacus rubecula 7 2.54 4 1.6 Rook Corvus frugilegus 1 1 Sedge warbler Acrocephalus
schoenobaenus 1 0.77
Siskin Carduelis spinus 1 0.08 Skylark Alauda arvensis 3 0.54 Red Song thrush Turdus philomelos 5 0.62 3 1 Red (Eurasian) Sparrowhawk
Accipter nisus 1 0.08
Starling Sturnus vulgaris 2 21.54 Red Swift Apus apus 1 0.46 Tree pipit Anthus trivialis 2 0.31 Amber Treecreeper Certhia familiaris 1 0.08 1 0.2 Whitethroat Sylvia communis 3 0.8 Willow tit Parus montanus 1 0.08 Red Willow warbler Phylloscopus
trochilus 6 3.69 4 3.4 Amber
(Common) Woodpigeon
Columba palumbus 6 2.54 3 2.4
Wren Troglodytes troglodytes
6 1.77 3 1
Yellowhammer Emberiza citrinella 1 0.15 Red
131

132
Appendix IV List of invertebrate taxa caught in window traps Section 7. Total Acari 119 Araneae Araneidae 1 Clubionidae 6 Linyphyiidae 283 Liocranidae 3 Lycosidae 104 Theridiosomatidae 1 Thomisidae 2 Coleoptera Aderidae 21 Attelabidae 1 Byrrhidae 2 Cantharidae 4 Carabidae 27 Cerambycidae 4 Chrysomelidae 9 Coccinellidae 6 Cryptophagidae 3 Curculionidae 4 Elateridae 104 Endomychidae 3 Hydraenidae 5 Hydrophilidae 315 Larvae 12 Lathridiidae 2 Leiodidae 1 Nitidulidae 1 Ptiliidae 18 Scaphidiidae 1 Scarabaeidea 26 Staphylinidae 140 Collembola Dicyrtomidae 1778 Entomobryoidea 690 Neelidae 1 Poduroidea 125 Sminthuridae 68 Diptera Asteiidae 2 Anisopodidae 10 Bibionidae 35 Calliphoridae 474 Camillidae 24 Carnidae 2
Cecidomyiidae 24Ceratopogonidea 213Chironomidae 1390Chromyiidae 2Coelopidae 20Culicidae 3Diastatidae 1Dolichopodidae 2619Drosophilidae 62Dryomyzidae 1Empididae 21Ephydridae 6Heleomyzidae 4Lauxaniidae 2Larvae 7Lonchopteridae 130Muscidae 22Mycetophilidae 62Opomyzidae 1Phoridae 2080Piophilidae 3Ptychopteridae 2Scathophagidae 4Scatopsidae 11Scenopinidae 1Sepsidae 21Simuliidae 13Sphaeroceridae 5Stratiomyidae 10Syrphidae 6Tabanidae 5Tipulidae 38Trichoceridae 1Xylomyiidae 1Hemiptera Aleyrodidae 2Anthocoridae 4Aphididae 155Aradidae 1Cicadellidae 67Cixiidae 1Coccoidea 3Delphacidae 47Larvae 3Miridae 54Nymph 68Reduviidae 5Rhopalidae 2Stenocephalidae 3Tingidae 11Hymenoptera
Apidae 30Chalcididae 22Cynipidae 273Formicidae 17Ichneumonidae 440Pamphiliidae 1Platygasteridae 159Sphecidae 1Symphyta Larvae 10Torymidae 71Trichogrammatidae 1Trigonalidae 64Vespidae 1Pulmonata 22Trichoptera Hydropsychidae 5Phryganeidae 1Lepidoptera Pyralidae 16Larvae 10Thysanoptera Thripidae 424Phlaeothripidae 20Opliones Phalangiidae 53Isopoda Porcellionidae 3Mecoptera Panorpidae 1Psocoptera Epipsocidae 12Lachesillidae 1Trogiidae 3Psocidae 1Orthoptera Acrididae 1Tetrigidae 1Annelida 3Anoplura 1Nematoda 1

Appendix V A list of plants, birds and mammals occurring at each study site.
Bodorgan Estate Summary No. of species Vascular plants 36 Bird Amber listed 9 Red listed 7 Total 36 Mammals 9
Species lists Vascular plant species recorded in the SRC
Common Name Scientific name 1 Creeping Bent Agrostis stolonifera 2 Marsh Foxtail Alopecurus geniculatus 3 Scarlet Pimpernel Anagallis arvensis 4 Lesser Tussock-edge Carex diandra 5 Common Sedge Carex nigra 6 Rosebay Willowherb Chamerion angustifolium 7 Creeping Thistle Cirsium arvense 8 Cock's-foot Dactylis glomerata 9 Tufted-hair Grass Deschampsia cespitosa 10 Common Couch Elymus repens 11 Field Horsetail Equisetum arvense 12 Common Fumitory Fumaria officinalis 13 Floating Sweet-grass Glyceria fluitans 14 Downy Oat-grass Helictotrichon pubescens 15 Hogweed Heracleum sphondylium 16 Yorkshire-fog Holcus lanatus
133

17 Jointed Rush Juncus articulatus 18 Toad Rush Juncus bufonius 19 Compact Rush Juncus conglomoratus 20 Soft Rush Juncus effuses 21 Yellow Vetchling Lathyrus aphaca 22 Greater Bird's-foot-trefoil Lotus pedunculatus 23 Redshank Persicaria maculosa 24 Annual Meadow-grass Poa annua 25 Knotgrass Polygonum aviculare 26 Silverweed Potentilla anserina 27 Creeping Cinquefoil Potentilla reptans 28 Meadow Buttercup Ranunculus acris 29 Creeping Buttercup Ranunculus repens 30 Common Sorrel Rumex acetosa 31 Broad-leaved Dock Rumex obtusifolius 32 Groundsel Senecio vulgaris 33 Red Campion Silene dioica 34 Common Chickweed Stellaria media 35 Dandelion Taraxacum (agg) 36 Field Pansy Viola arvensis Bird species recorded at this site
Common name Scientific name UK Conservation Status
1 Barn owl Tyto alba Amber
2 Barn swallow Hirundo rustica Amber
3 Blackbird Turdus merula
4 Blackcap Sylvia atricapilla
5 Blue tit Parus caeruleus
6 (Eurasian) Bullfinch Pyrrhula pyrrhula Red
7 Buzzard Buteo buteo
8 Carrion Crow Corvus corone corone
9 Chaffinch Fringilla coelebs
10 Chiffchaff Phylloscopus collybita
134

11 Dunnock Prunella modularis Amber
12 Goldcrest Regulus regulus Amber
13 (European) Goldfinch Carduelis carduelis
14 Grasshopper warbler Locustella naevia Red
15 Great Black-backed Gull Larus marinus Amber
16 Great tit Parus major
17 (European) Greenfinch Carduelis chloris
18 Herring gull Larus argentatus Amber
19 Jackdaw Corvus monedula
20 Kestrel Falco tinnunculus
21 Linnet Carduelis cannabina Red
22 Pheasant Phasianus colchius
23 (Common) Reedbunting Emberiza schoeniclus Red
24 Robin Erithacus rubecula
25 Rook Corvus frugilegus
26 Sedge warbler Acrocephalus schoenobaenus
27 Skylark Alauda arvensis Red
28 (Common) Snipe Gallinago gallinago Amber
29 Song thrush Turdus philomelos Amber
30 (Eurasian) Sparrowhawk Accipiter nisus
31 Starling Sturnus vulgaris Red
32 Tree pipit Anthus trivialis Amber
33 Whitethroat Sylvia communis
34 Willow warbler Phylloscopus trochilus Amber
35 Woodpigeon Columba palumbus
36 Wren Troglodytes troglodytes
Small mammal species recorded at this site
Common Name Scientific name
1 Bank vole Clethrionomys glareolus
2 Common Shrew Sorex araneus
3 Field vole Microtus agrestis
135

4 Wood mouse Apodemus sylvaticus Other mammals from casual sightings and sand traps
1 Badger Meles meles
2 Brown Hare Lepus europaeus
3 Fox Vulpes vulpes
4 Rat Rattus norvegicus
5 Weasel Mustela nivalis
136

Glynllifon College Summary No. of species Vegetation 32 Bird Amber listed 7 Red listed 4 Total 33 Mammals 4
Species lists Vascular plant species recorded in the SRC
Common Name Scientific name
1 Yarrow Achillea millefolium
2 Creeping Bent Agrostis stolonifera
3 Cow Parsley Anthriscus sylvestris
4 Parsley-piert Aphanes arvensis
5 Shepherd's-purse Capsella bursa-pastoris
6 Large Bitter-cress Cardamine armara
7 Hairy Bitter-cress Cardamine hirsuta
8 Common Mouse-ear Cerastium vulgatum
9 Rosebay Willowherb Chamerion angustifolium
10 Fat-hen Chenopodium album
11 Creeping Thistle Cirsium arvense
12 Spear Thistle Cirsium vulgare
13 Broad-leaved Willowherb Epilobium montanum
14 Petty Spurge Euphorbia peplus
15 Common Fumitory Fumaria officinalis
16 Trailing St John's-wort Hypericum humifusum
17 Perennial Rye-grass Lolium perenne
18 Common Bird's-foot-trefoil Lotus corniculatus
19 Greater Bird's-foot-trefoil Lotus pedunculatus
137
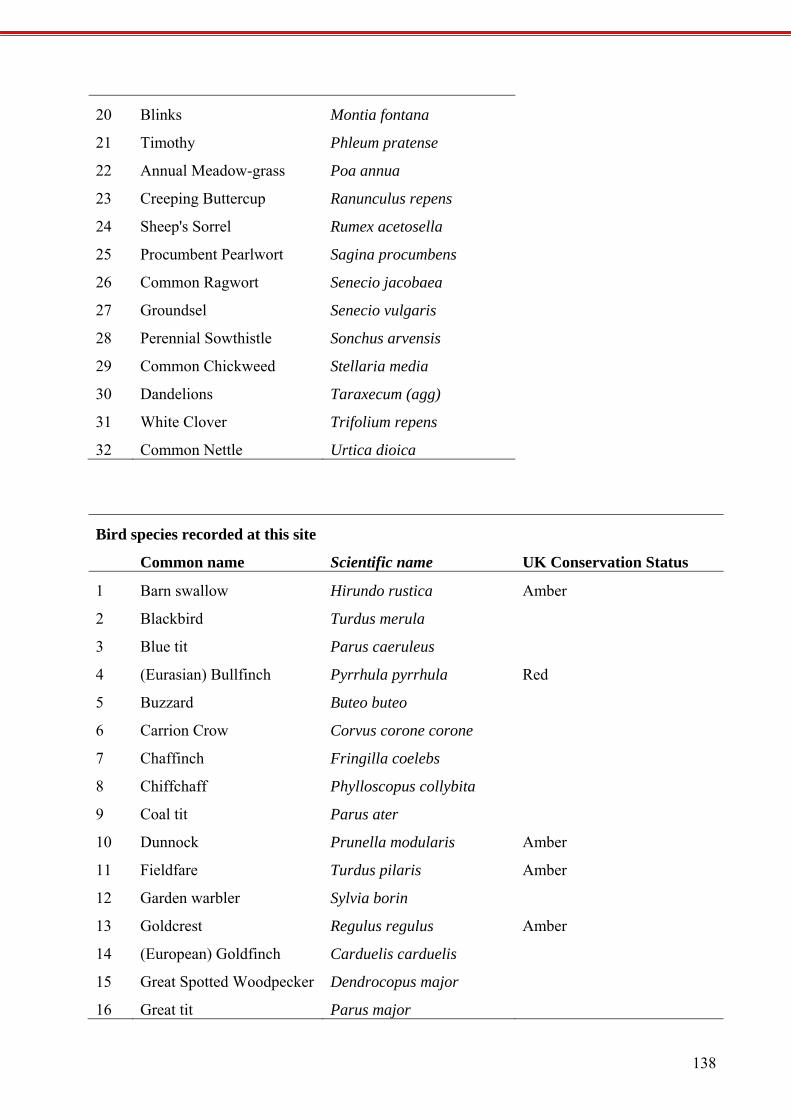
20 Blinks Montia fontana
21 Timothy Phleum pratense
22 Annual Meadow-grass Poa annua
23 Creeping Buttercup Ranunculus repens
24 Sheep's Sorrel Rumex acetosella
25 Procumbent Pearlwort Sagina procumbens
26 Common Ragwort Senecio jacobaea
27 Groundsel Senecio vulgaris
28 Perennial Sowthistle Sonchus arvensis
29 Common Chickweed Stellaria media
30 Dandelions Taraxecum (agg)
31 White Clover Trifolium repens
32 Common Nettle Urtica dioica
Bird species recorded at this site
Common name Scientific name UK Conservation Status
1 Barn swallow Hirundo rustica Amber
2 Blackbird Turdus merula
3 Blue tit Parus caeruleus
4 (Eurasian) Bullfinch Pyrrhula pyrrhula Red
5 Buzzard Buteo buteo
6 Carrion Crow Corvus corone corone
7 Chaffinch Fringilla coelebs
8 Chiffchaff Phylloscopus collybita
9 Coal tit Parus ater
10 Dunnock Prunella modularis Amber
11 Fieldfare Turdus pilaris Amber
12 Garden warbler Sylvia borin
13 Goldcrest Regulus regulus Amber
14 (European) Goldfinch Carduelis carduelis
15 Great Spotted Woodpecker Dendrocopus major
16 Great tit Parus major
138

17 Jackdaw Corvus monedula
18 Jay Garrulus glandarius
19 Lesser Black-backed Gull Larus fuscus Amber
20 Lesser Spotted Woodpecker Dendrocopus minor Red
21 Long-tailed tit Aegithalos caudatus
22 Nuthatch Sitta europaea
23 Pheasant Phasianus colchius
24 (Common) Redpoll Carduelis flammea Amber
25 (Common) Reedbunting Emberiza schoeniclus Red
26 Robin Erithacus rubecula
27 Rook Corvus frugilegus
28 Song thrush Turdus philomelos Red
29 (Eurasian) Sparrowhawk Accipiter nisus
30 Swift Apus apus
31 Willow warbler Phylloscopus trochilus Amber
32 (Common) Woodpigeon Columba palumbus
33 Wren Troglodytes troglodytes
Small mammal species recorded at this site
Common Name Scientific name
1 Field vole Microtus agrestis
2 Wood mouse Apodemus sylvaticus Other mammals from casual sightings and sand traps
1 Badger Meles meles
2 Fox Vulpes vulpes
139

Ceryfed Summary No. of species Vascular plants 29 Bird Amber listed 5 Red listed 3 Total 20 Mammals 1
Species lists Vascular plant species recorded in the SRC
Common Name Scientific name
1 Yarrow Achillea millefolium
2 Marsh Foxtail Alopecurus geniculatus
3 Common Orache Atriplex patula
4 Shepherd's-purse Capsella bursa-pastoris
5 Common Mouse-ear Cerastium vulgatum
6 Rosebay Willowherb Chamerion angustifolium
7 Fat-hen Chenopodium album
8 Creeping Thistle Cirsium arvense
9 Tufted hair-grass Deschampsia cespitosa
10 Common Couch Elymus repens
11 Red Fescue Festuca rubra
12 Floating Sweet-grass Glyceria fluitans
13 Compact Rush Juncus conglomoratus
14 Perennial Rye-grass Lolium perenne
15 Greater Bird's-foot-trefoil Lotus pedunculatus
16 Pineappleweed Matricaria discoidia
17 Water-pepper Persicaria hydropiper
18 Annual Meadow-grass Poa annua
19 Knotgrass Polygonum aviculare
140

20 Creeping Buttercup Ranunculus repens
21 Broad-leaved Dock Rumex obtusifolius
22 Goat Willow Salix caprea
23 Grey Willow Salix cinerea
24 Charlock Sinapsis arvensis
25 Black Nightshade Solanum nigrum
26 Common Chickweed Stellaria media
27 Dandelions Taraxacum (agg)
28 White Clover Trifolium repens
29 Common Nettle Urtica dioica
Bird species recorded at this site
Common name Scientific name UK Conservation Status
1 Barn swallow Hirundo rustica Amber
2 Blackbird Turdus merula
3 Blue tit Parus caeruleus
4 (Eurasian) Bullfinch Pyrrhula pyrrhula Red
5 Buzzard Buteo buteo
6 Carrion Crow Corvus corone corone
7 Chaffinch Fringilla coelebs
8 Curlew Numenius arquata Amber
9 Dunnock Prunella modularis Amber
10 (European) Goldfinch Carduelis carduelis
11 (European) Greenfinch Carduelis chloris
12 House sparrow Passer domesticus Red
13 (Common) Redpoll Carduelis flammea Amber
14 Robin Erithacus rubecula
15 Siskin Carduelis spinus
16 Song thrush Turdus philomelos Red
17 (Eurasian) Sparrowhawk Accipiter nisus
18 Willow warbler Phylloscopus trochilus Amber
19 (Common) Woodpigeon Columba palumbus
141

20 Wren Troglodytes troglodytes
Small mammal species recorded at this site
Common Name Scientific name
1 Wood mouse Apodemus sylvaticus
142

Cilgoed Summary No. of species Vascular plants 33 Bird Amber listed 6 Red listed 4 Total 31 Mammals 6
Species lists Vascular plant species recorded in the SRC
Common Name Scientific name
1 Yarrow Achillea millefolium
2 Marsh Foxtail Alopecurus geniculatus
3 Daisy Bellis perennis
4 Shepherd's-purse Capsella bursa-pastoris
5 Large Bitter-cress Cardamine armara
6 Hairy Bitter-cress Cardamine hirsuta
7 Sticky Mouse-ear Cerastium glomeratum
8 Rosebay Willowherb Chamerion angustifolium
9 Fat-hen Chenopodium album
10 Creeping Thistle Cirsium arvense
11 Spear Thistle Cirsium vulgare
12 Petty Spurge Euphorbia peplus
13 Black-bindweed Fallopia convolvulus
14 Common Fumitory Fumaria officinalis
15 Common Hemp-nettle Galeopsis tetrahit
16 Common Marsh-bedstraw Galium palustre
17 Floating Sweet-grass Glyceria fluitans
18 Yorkshire-fog Holcus lanatus
19 Perennial Rye-grass Lolium perenne
143
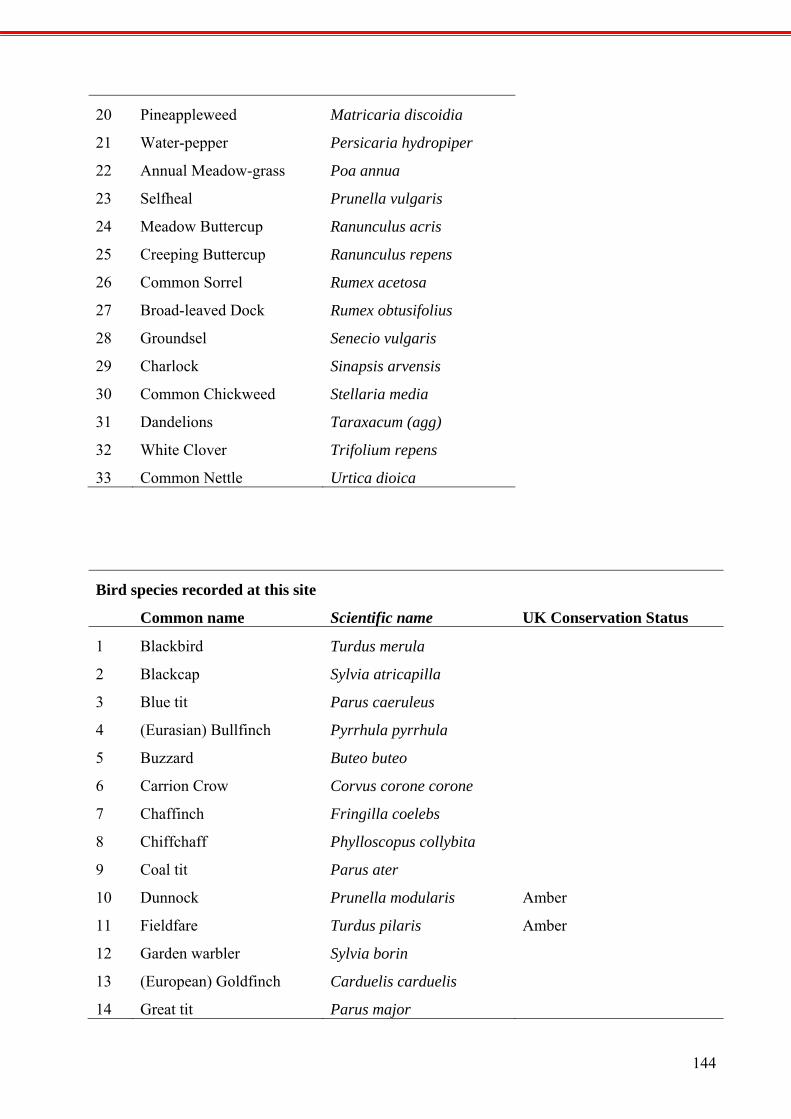
20 Pineappleweed Matricaria discoidia
21 Water-pepper Persicaria hydropiper
22 Annual Meadow-grass Poa annua
23 Selfheal Prunella vulgaris
24 Meadow Buttercup Ranunculus acris
25 Creeping Buttercup Ranunculus repens
26 Common Sorrel Rumex acetosa
27 Broad-leaved Dock Rumex obtusifolius
28 Groundsel Senecio vulgaris
29 Charlock Sinapsis arvensis
30 Common Chickweed Stellaria media
31 Dandelions Taraxacum (agg)
32 White Clover Trifolium repens
33 Common Nettle Urtica dioica
Bird species recorded at this site
Common name Scientific name UK Conservation Status
1 Blackbird Turdus merula
2 Blackcap Sylvia atricapilla
3 Blue tit Parus caeruleus
4 (Eurasian) Bullfinch Pyrrhula pyrrhula
5 Buzzard Buteo buteo
6 Carrion Crow Corvus corone corone
7 Chaffinch Fringilla coelebs
8 Chiffchaff Phylloscopus collybita
9 Coal tit Parus ater
10 Dunnock Prunella modularis Amber
11 Fieldfare Turdus pilaris Amber
12 Garden warbler Sylvia borin
13 (European) Goldfinch Carduelis carduelis
14 Great tit Parus major
144

15 Greater spotted Woodpecker Dendrocopus major
16 (European) Greenfinch Carduelis chloris
17 House sparrow Passer domesticus Red
18 Jay Garrulus glandarius
19 Lesser Black-backed Gull Larus fuscus Amber
20 Long-tailed tit Aegithalos caudatus
21 Magpie Pica pica
22 Pheasant Phasianus colchius
23 (Common) Redpoll Carduelis flammea Amber
24 Redstart Phoenicurus phoenicurus Amber
25 (Common) Reedbunting Emberiza schoeniclus Red
26 Robin Erithacus rubecula
27 Song thrush Turdus philomelos Red
28 Willow warbler Phylloscopus trochilus Amber
29 (Common) Woodpigeon Columba palumbus
30 Wren Troglodytes troglodytes
31 Yellowhammer Emberiza citrinella Red
Small mammal species recorded at this site
Common Name Scientific name
1 Bank vole Clethrionomys glareolus
2 Common Shrew Sorex araneus
3 Field vole Microtus agrestis
4 Wood mouse Apodemus sylvaticus
5 Yellow-necked mouse Apodemus flavicollis Other mammals from casual sightings and sand traps
1 Brown Hare Lepus europaeus
145

Hayscastle Farm Summary No. of species Vascular plants 27 Bird Amber listed 9 Red listed 14 Total 40 Mammals 7
Species lists Vascular plant species recorded in the SRC
Common Name Scientific name
1 Creeping Bent Agrostis stolonifera
2 Marsh Foxtail Alopecurus geniculatus
3 Oval Sedge Carex ovalis
4 Fat-hen Chenopodium album
5 Spear Thistle Cirsium vulgare
6 Tufted hair-grass Deschampsia cespitosa
7 Giant Fescue Festuca gigantea
8 Common Marsh-bedstraw Galium palustre
9 Floating Sweet-grass Glyceria fluitans
10 Yorkshire-fog Holcus lanatus
11 Jointed Rush Juncus articulatus
12 Greater Bird's-foot-trefoil Lotus pedunculatus
13 Blinks Montia fontana
14 Redshank Persicaria maculosa
15 Timothy Phleum pratense
16 Ribwort Plantain Plantago lanceolata
17 Annual Meadow-grass Poa annua
18 Meadow Buttercup Ranunculus acris
19 Lesser Spearwort Ranunculus flammula
146

20 Creeping Buttercup Ranunculus repens
21 Wild Radish Raphanus raphanistrum
22 Bramble Rubus fruticosus
23 Black Nightshade Solanum nigrum
24 Bittersweet Solanun dulcamara
25 Common Chickweed Stellaria media
26 Dandelions Taraxacum (agg)
27 Red Clover Trifolium pratense
Bird species recorded at this site
Common name Scientific name UK Conservation Status
1 Barn swallow Hirundo rustica Amber
2 Blackbird Turdus merula
3 Blackcap Sylvia atricapilla
4 Blue tit Parus caeruleus
5 Buzzard Buteo buteo
6 Carrion Crow Corvus corone corone
7 Chaffinch Fringilla coelebs
8 Dunnock Prunella modularis Amber
9 Fieldfare Turdus pilaris Amber
10 Garden warbler Sylvia borin
11 Goldcrest Regulus regulus Amber
12 (European) Goldfinch Carduelis carduelis
13 Great Black-backed Gull Larus marinus Amber
14 Great tit Parus major
15 (European) Greenfinch Carduelis chloris
16 Homing pigeon Columba livia domestica
17 Lesser Black-backed Gull Larus fuscus Amber
18 Linnet Carduelis cannabina Red
19 Magpie Pica pica
20 Mallard Anas platyrhynchos
21 Meadow pipit Anthus pratensis Amber
147

22 Nuthatch Sitta europaea
23 Redwing Turdus iliacus Amber
24 (Common) Reedbunting Emberiza schoeniclus Red
25 Robin Erithacus rubecula
26 Rook Corvus frugilegus
27 Siberian Chiffchaff Phylloscopus collybita tristis
28 Skylark Alauda arvensis Red
29 (Common) Snipe Gallinago gallinago Amber
30 Song thrush Turdus philomelos Amber
31 (Eurasian) Sparrowhawk Accipiter nisus
32 Starling Sturnus vulgaris Red
33 (Common) Stonechat Saxicola torquata Amber
34 Tree pipit Anthus trivialis Amber
35 Whimbrel Numenius phaeopus Amber
36 Whitethroat Sylvia communis
37 Willow tit Parus montanus Red
38 Willow warbler Phylloscopus trochilus Amber
39 (Common) Woodpigeon Columba palumbus
40 Wren Troglodytes troglodytes
Small mammal species recorded at this site
Common Name Scientific name
1 Common Shrew Sorex araneus
2 Pygmy Shrew Sorex minutus
3 Field vole Microtus agrestis
4 Wood mouse Apodemus sylvaticus Other mammals from casual sightings and sand traps
1 Fox Vulpes vulpes
2 Badger Meles meles
3 Mole Talpa europaea
148
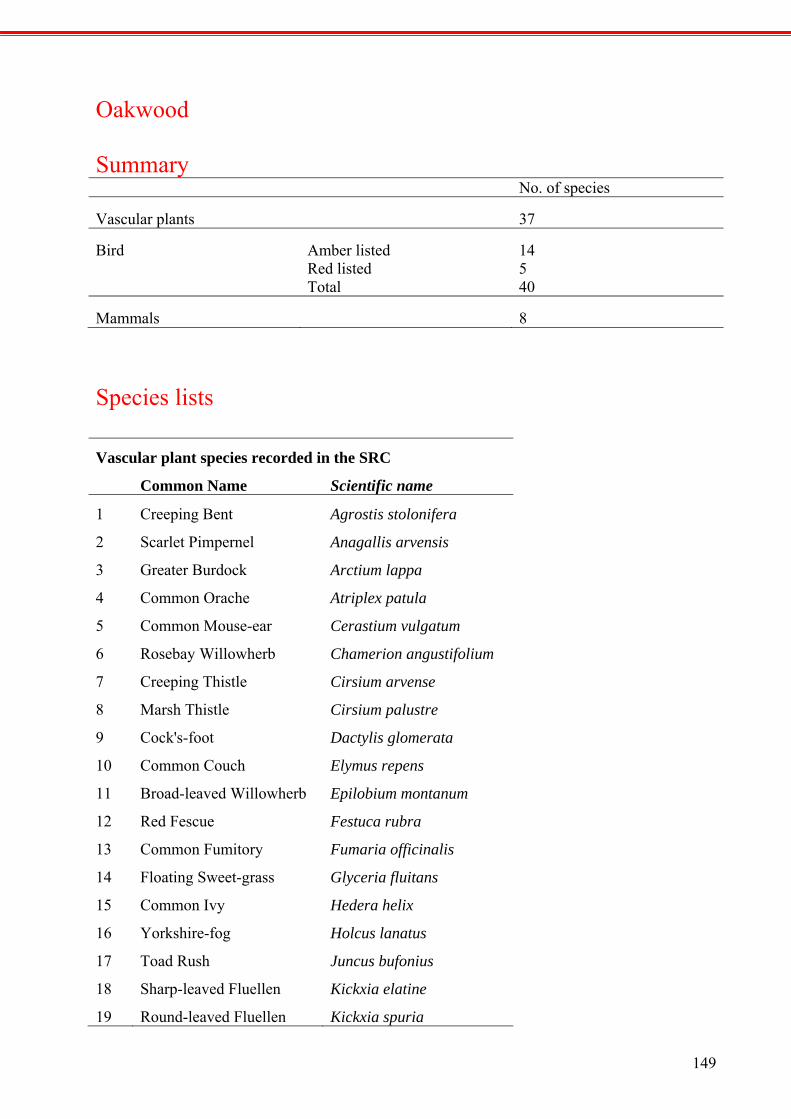
Oakwood Summary No. of species Vascular plants 37
Bird Amber listed 14 Red listed 5 Total 40
Mammals 8
Species lists Vascular plant species recorded in the SRC
Common Name Scientific name
1 Creeping Bent Agrostis stolonifera
2 Scarlet Pimpernel Anagallis arvensis
3 Greater Burdock Arctium lappa
4 Common Orache Atriplex patula
5 Common Mouse-ear Cerastium vulgatum
6 Rosebay Willowherb Chamerion angustifolium
7 Creeping Thistle Cirsium arvense
8 Marsh Thistle Cirsium palustre
9 Cock's-foot Dactylis glomerata
10 Common Couch Elymus repens
11 Broad-leaved Willowherb Epilobium montanum
12 Red Fescue Festuca rubra
13 Common Fumitory Fumaria officinalis
14 Floating Sweet-grass Glyceria fluitans
15 Common Ivy Hedera helix
16 Yorkshire-fog Holcus lanatus
17 Toad Rush Juncus bufonius
18 Sharp-leaved Fluellen Kickxia elatine
19 Round-leaved Fluellen Kickxia spuria
149

20 Perennial Rye-grass Lolium perenne
21 Redshank Persicaria maculosa
22 Greater Plantain Plantago major
23 Annual Meadow-grass Poa annua
24 Knotgrass Polygonum aviculare
25 Creeping Buttercup Ranunculus repens
26 Wild Radish Raphanus raphanistrum
27 Bramble Rubus fruticosus
28 Broad-leaved Dock Rumex obtusifolius
29 Common Ragwort Senecio jacobaea
30 Black Nightshade Solanum nigrum
31 Perennial Sowthistle Sonchus arvensis
32 Common Chickweed Stellaria media
33 Dandelions Taraxecum (agg)
34 Red Clover Trifolium pratense
35 White Clover Trifolium repens
36 Common Nettle Urtica dioica
37 Field Pansy Viola arvensis
Bird species recorded at this site
Common name Scientific name UK Conservation Status
1 Barn swallow Hirundo rustica Amber
2 Blackbird Turdus merula
3 Blackcap Sylvia atricapilla
4 Blue tit Parus caeruleus
5 Buzzard Buteo buteo
6 Carrion Crow Corvus corone corone
7 Chaffinch Fringilla coelebs
8 Dunnock Prunella modularis Amber
9 Fieldfare Turdus pilaris Amber
10 Garden warbler Sylvia borin
150

11 Goldcrest Regulus regulus Amber
12 (European) Goldfinch Carduelis carduelis
13 Great Black-backed Gull Larus marinus Amber
14 Great tit Parus major
15 (European) Greenfinch Carduelis chloris
16 Homing pigeon Columba livia domestica
17 Lesser Black-backed Gull Larus fuscus Amber
18 Linnet Carduelis cannabina Red
19 Magpie Pica pica
20 Mallard Anas platyrhynchos
21 Meadow pipit Anthus pratensis Amber
22 Nuthatch Sitta europaea
23 Redwing Turdus iliacus Amber
24 (Common) Reedbunting Emberiza schoeniclus Red
25 Robin Erithacus rubecula
26 Rook Corvus frugilegus
27 Siberian Chiffchaff Phylloscopus collybita tristis
28 Skylark Alauda arvensis Red
29 (Common) Snipe Gallinago gallinago Amber
30 Song thrush Turdus philomelos Amber
31 (Eurasian) Sparrowhawk Accipiter nisus
32 Starling Sturnus vulgaris Red
33 (Common) Stonechat Saxicola torquata Amber
34 Tree pipit Anthus trivialis Amber
35 Whimbrel Numenius phaeopus Amber
36 Whitethroat Sylvia communis
37 Willow tit Parus montanus Red
38 Willow warbler Phylloscopus trochilus Amber
39 (Common) Woodpigeon Columba palumbus
40 Wren Troglodytes troglodytes
151

Small mammal species recorded at this site
Common Name Scientific name
1 Bank vole Clethrionomys glareolus
2 Common Shrew Sorex araneus
3 Pygmy Shrew Sorex minutus
4 Field vole Microtus agrestis
5 Wood mouse Apodemus sylvaticus
6 Yellow-necked mouse Apodemus flavicollis Other mammals from casual sightings and sand traps
1 Fox Vulpes vulpes
2 Badger Meles meles
152

Brigam Farm Summary No. of species Vascular plants 14 Bird Amber listed 5 Red listed 1 Total 14 Mammals 2
Species lists Vascular plant species recorded in the SRC
Common Name Scientific name
1 Creeping Bent Agrostis stolonifera
2 Rosebay Willowherb Chamerion angustifolium
3 Fat-hen Chenopodium album
4 Creeping Thistle Cirsium arvense
5 Spear Thistle Cirsium vulgare
6 Perennial Rye-grass Lolium perenne
7 Redshank Persicaria maculosa
8 Greater Plantain Plantago major
9 Annual Meadow-grass Poa annua
10 Knotgrass Polygonum aviculare
11 Broad-leaved Dock Rumex obtusifolius
12 Common Ragwort Senecio jacobaea
13 Black Nightshade Solanum nigrum
14 Perennial Sowthistle Sonchus arvensis
Bird species recorded at this site
Common name Scientific name UK Conservation Status
1 Blackbird Turdus merula
2 Blue tit Parus caeruleus
153

154
3 Dunnock Prunella modularis Amber
4 (European) Goldfinch Carduelis carduelis
5 Great tit Parus major
6 (European) Greenfinch Carduelis chloris
7 Herring gull Larus argentatus Amber
8 Lesser Black-backed Gull Larus fuscus Amber
9 Magpie Pica pica
10 Mistle thrush Turdus viscivorus Amber
11 Robin Erithacus rubecula
12 Starling Sturnus vulgaris Red
13 Barn swallow Hirundo rustica Amber
14 Wren Troglodytes troglodytes
Small mammal species recorded at this site
Common Name Scientific name
1 Yellow-necked mouse
Other mammals from casual sightings
1 Rabbit